Article

Multi-Task Classification of Physical Activity and Acute Psychological Stress for Advanced Diabetes Treatment

1
Department of Chemical and Biological Engineering, Illinois Institute of Technology, 10 W 33rd St., Chicago, IL 60616, USA
2
College of Nursing, University of Illinois at Chicago, Chicago, IL 60607, USA
3
Department of Biomedical Engineering, Illinois Institute of Technology, 3255 S Dearborn St., Chicago, IL 60616, USA
*
Author to whom correspondence should be addressed.
Signals 2023, 4(1), 167-192; https://doi.org/10.3390/signals4010009
Submission received: 26 November 2022 / Revised: 12 January 2023 / Accepted: 13 February 2023 / Published: 17 February 2023

Abstract

:
Wearable sensor data can be integrated and interpreted to improve the treatment of chronic conditions, such as diabetes, by enabling adjustments in treatment decisions based on physical activity and psychological stress assessments. The challenges in using biological analytes to frequently detect physical activity (PA) and acute psychological stress (APS) in daily life necessitate the use of data from noninvasive sensors in wearable devices, such as wristbands. We developed a recurrent multi-task deep neural network (NN) with long-short-term-memory architecture to integrate data from multiple sensors (blood volume pulse, skin temperature, galvanic skin response, three-axis accelerometers) and simultaneously detect and classify the type of PA, namely, sedentary state, treadmill run, stationary bike, and APS, such as non-stress, emotional anxiety stress, mental stress, and estimate the energy expenditure (EE). The objective was to assess the feasibility of using the multi-task recurrent NN (RNN) rather than independent RNNs for detection and classification of AP and APS. The multi-task RNN achieves comparable performance to independent RNNs, with the multi-task RNN having F1 scores of 98.00% for PA and 98.97% for APS, and a root mean square error (RMSE) of 0.728  cal hr . kg for EE estimation for testing data. The independent RNNs have F1 scores of 99.64% for PA and 98.83% for APS, and an RMSE of 0.666  cal hr . kg for EE estimation. The results indicate that a multi-task RNN can effectively interpret the signals from wearable sensors. Additionally, we developed individual and multi-task extreme gradient boosting (XGBoost) for separate and simultaneous classification of PA types and APS types. Multi-task XGBoost achieved F1 scores of 99.89% and 98.31% for the classification of PA types and APS types, respectively, while the independent XGBoost achieved F1 scores of 99.68% and 96.77%, respectively. The results indicate that both multi-task RNN and XGBoost can be used for the detection and classification of PA and APS without loss of performance with respect to individual separate classification systems. People with diabetes can achieve better outcomes and quality of life by including physical activity and psychological stress assessments in treatment decision-making.

1. Introduction

Chronic diseases, such as diabetes, require frequent adjustments to treatment decisions to tailor and personalize the treatment to individual patients for improved outcomes. More frequent assessment of the instantaneous state and conditions of the subject can further enable and enhance precision diabetes treatment. People with Type 1 diabetes (T1D) can keep their blood glucose values in a desired range by incorporating their physical activity (PA) and acute psychological stress (APS) information in their insulin dosing decisions. The type and intensity of PA and the nature of APS experienced by an individual affect a range of endocrine and metabolic pathways. Frequently measuring the variations in biological analytes in free-living conditions and throughout daily life is not practical, which necessitates different modalities for noninvasive sensing to infer information on PA and APS required to adjust the diabetes therapy [1].
The need to assess PA and APS information from noninvasive sensors has spurred the development of novel wearable devices with advanced sensors and new algorithms to interpret the raw data. Sensors such as three-axis accelerometers (ACC) and heart rate (HR) monitors based on photoplethysmography that measures blood volume pulse (BVP) enabled noninvasive detection of PA. Detection of APS requires additional biosignals such as electrodermal activity (EDA) measured by galvanic skin response (GSR) sensor, and skin temperature (ST) [2]. The data generated by these sensors need to be cleaned of the noise and artifacts corrupting the signal to enhance the information extracted from the signals.
After cleaning the raw data, the signals must be mapped to features that can inform the algorithms on the type and intensity of PA and nature of the APS. Various machine learning algorithms have been developed and trained in the literature to detect PA and APS, including naïve Bayes classification, nearest neighbor methods, logistic regression, decision trees, support vector machines, and neural networks (NN) [3,4,5].
Novel NN architectures and training algorithms can identify intricate and hidden patterns in the signals to gain information on PA and APS. The use of recurrent neural networks (RNN) with long short-term memory (LSTM) has shown promising results in predicting the type and intensity of PA and the type of APS episode [6,7]. An issue with the data collected to train the models is the class imbalances, which can bias the performance of the algorithms to favor the majority class at the expense of lower accuracy for the minority class. Although the sizes of the classes may be balanced by either downsampling the majority class or upsampling the minority class, it risks discarding useful information if samples are removed or biasing the algorithms towards the samples that are repeated multiple times when upsampled [8]. Addressing the class imbalances requires more sophisticated upsampling algorithms that generate new data samples or incorporating weighted learning when training the model.
Training independent models to predict the type of PA and APS without connecting the shared information between the two tasks can require more training data and longer training time. Exploiting the shared representations in the data by training one model to predict the related tasks jointly can potentially improve data efficiency and reduce the training time. However, learning multiple tasks simultaneously can be challenging [9,10,11,12]. The combination of the tasks must be considered when handling the class imbalances. The tasks also must be partially related with overlapping feature maps to reinforce the join learning of multiple tasks. We showed in previous works that a unified common feature map can encompass the features required to predict the types of PA and APS [6].
The detection of PA and APS, whether they occur alone or simultaneously, can affect the treatment decision for T1D [13]. People with T1D must continuously monitor their blood glucose levels using continuous glucose monitors (CGM) and evaluate their insulin requirements based on their glucose levels, meal, PA, and APS information. Incorporating all these diverse sources of information to continuously adjust insulin administration is an arduous process. Artificial pancreas (AP) systems connect a CGM sensor to an insulin pump via an algorithm to calculate and administer insulin accordingly in people with Type 1 diabetes [14]. AP systems developed by our research group have extended the traditional AP structure (based exclusively on CGM and insulin information collected automatically and manual entries of meal and exercise information) by incorporating additional signals from wearable devices, such as wristbands, to provide information on PA and adjust insulin dosing accordingly [15,16]. Although PA and APS are both similar in their effects on some signals, such as increasing HR, they must be accurately classified to avoid adverse outcomes. Moderate intensity PA usually lowers blood glucose levels, which requires a decrease in the insulin dose to maintain stable blood glucose levels within the safe target range. APS increases blood glucose levels, which may necessitate an increase in the insulin dose to maintain the glucose levels in the target range. Despite their opposing effects on blood glucose levels, the presence of PA and APS can be easily misinterpreted if the classification decision relies on only a limited set of measurements, such as relying solely on HR.
Motivated by the above considerations, the main contributions of this work are:
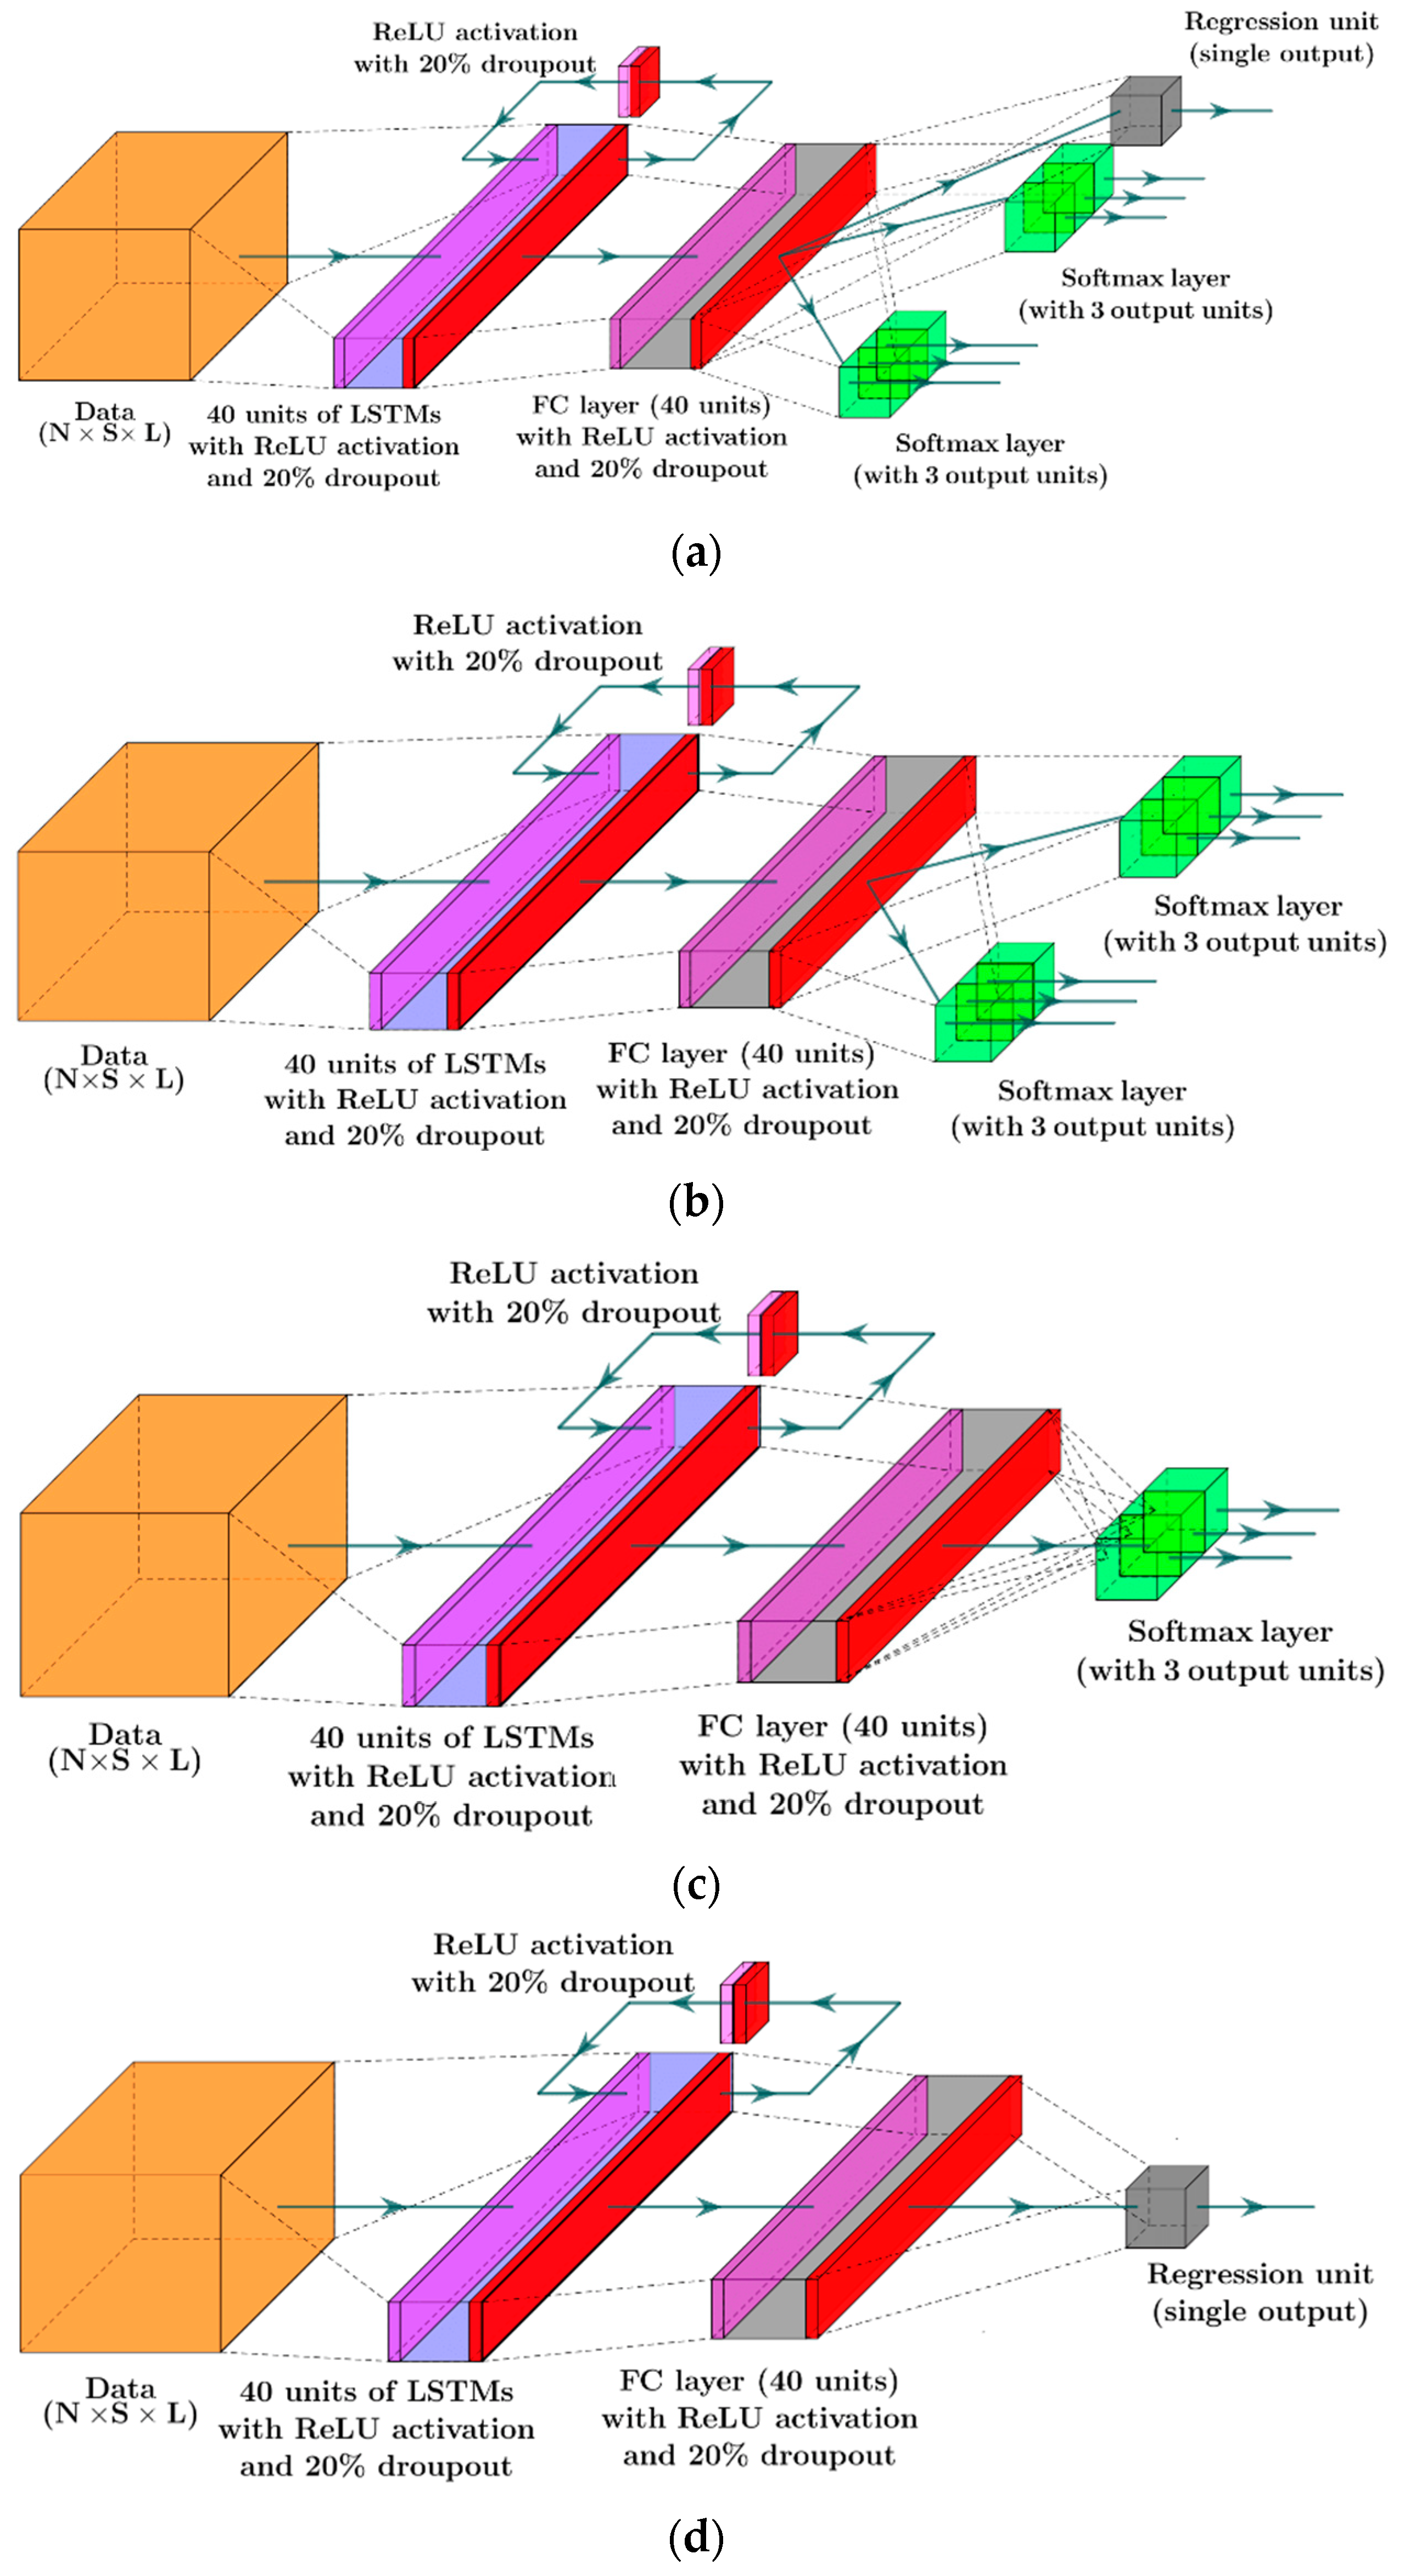
  • Multi-task learning of RNN with LSTM architecture for simultaneously classifying the type and intensity (i.e., energy expenditure) of physical activity events (sedentary state, stationary bike, or treadmill run) and type of acute psychological stress events (non-stress, emotional anxiety stress, or mental stress) using a common feature map and comparing the performance of the multi-task model with the independent models for each task.
  • Multi-task learning of extreme gradient boosting (XGBoost) for simultaneously classifying the type of PA (sedentary state, stationary bike, or treadmill run) and the type of APS (non-stress, emotional anxiety stress, or mental stress) using a common feature map and comparing the performance of the multi-task XGBoost to the independent XGBoost models for each task.
  • Simultaneously classifying the type of PA (sedentary state, stationary bike, or treadmill run) and the type of APS (non-stress, emotional anxiety stress, or mental stress) using data collected during daily life activities relying only on the physiological signals measured noninvasively by the Empatica E4 wristband.
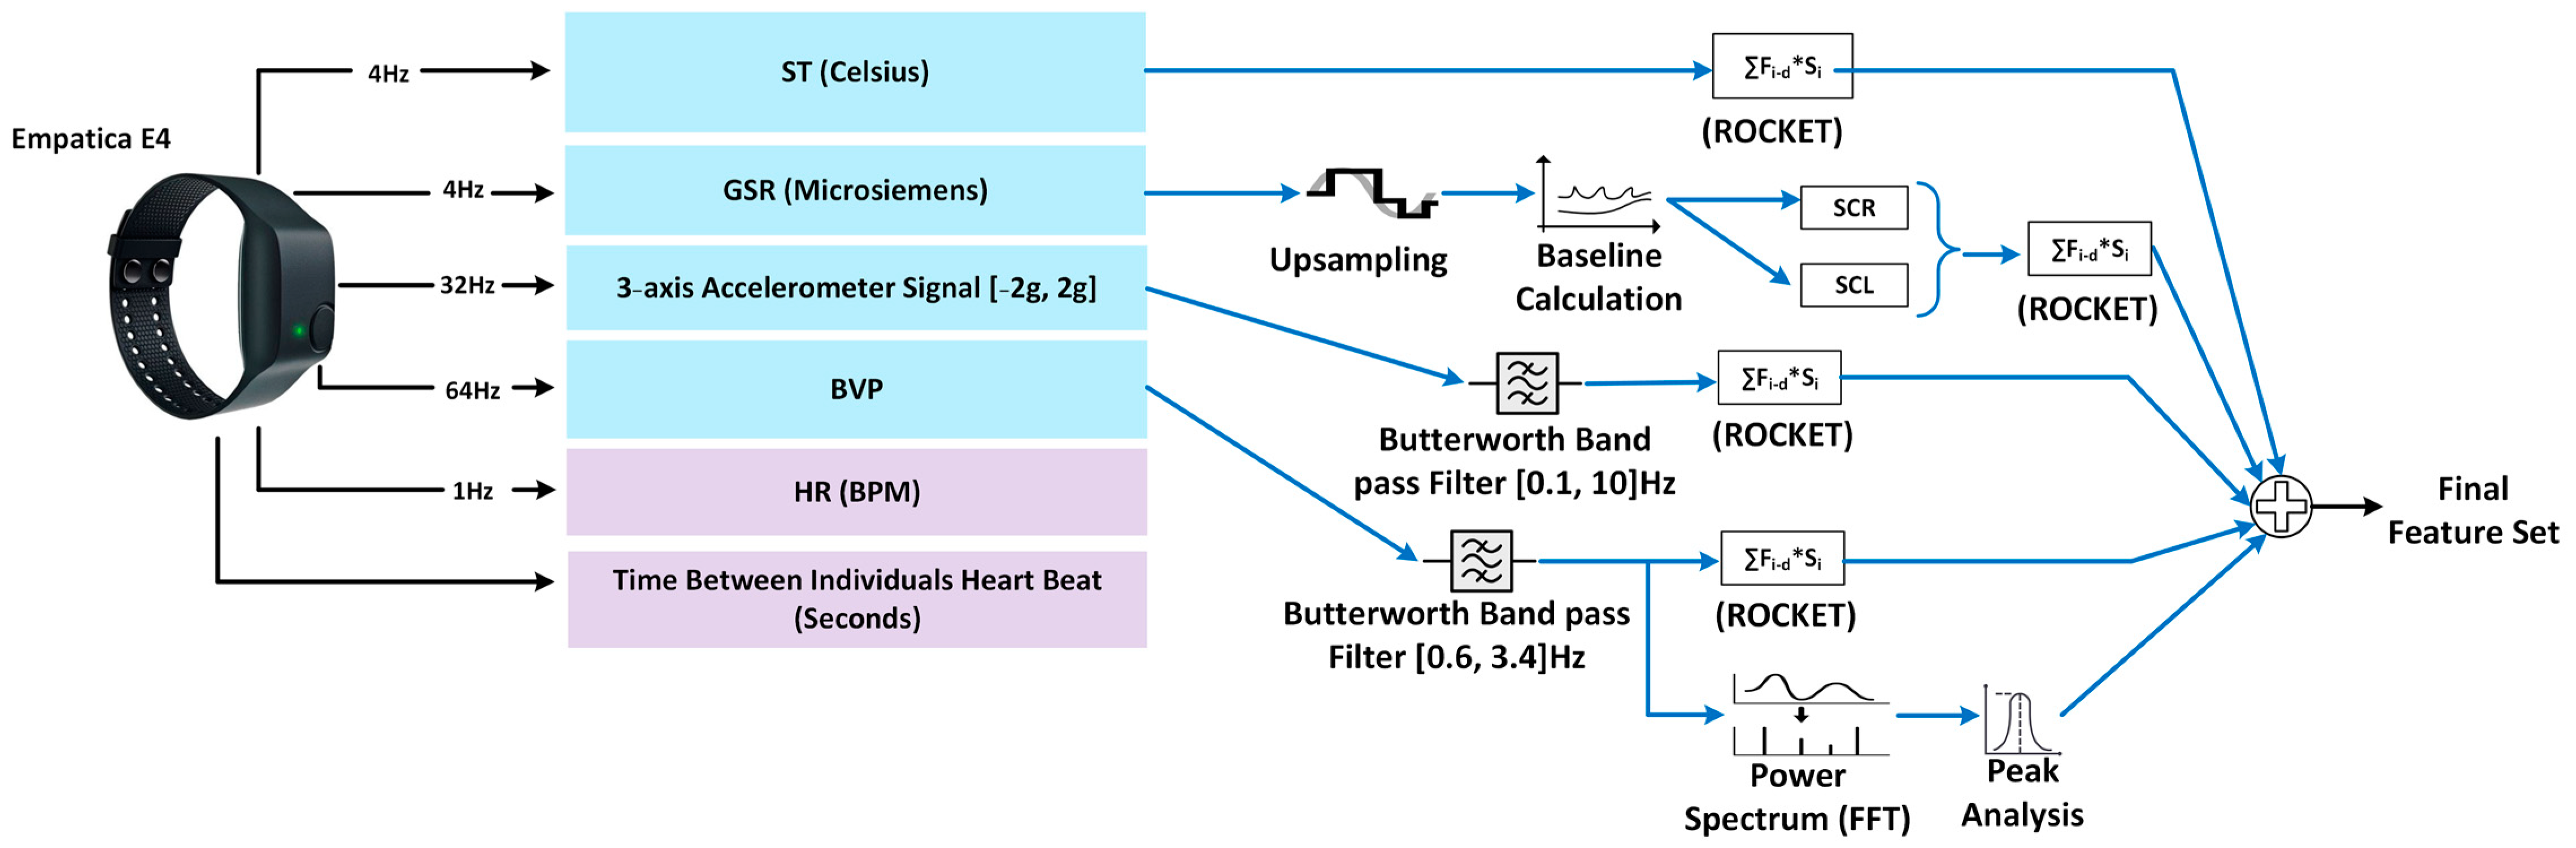
  • Employing random convolutional kernel transformation to extract a large number of features from the time series signals.
  • Comparatively evaluating two different feature selection techniques to determine the most informative set of features: PLS-DA for the classification tasks and PLS for the regression task.
  • Evaluating the performance of two different approaches to handle the imbalanced classes: weighted training and adaptive synthetic (ADASYN) sampling approach.
Section 2 details the methods for collecting the data, preprocessing the signals, extracting feature maps, selecting the informative features useful for the multi-task learning, handling class imbalances, and the architecture of the trained recurrent NN models and the XGBoost model. Section 3 presents the results of the multitask RNN with LSTM and XGBoost algorithms, and comparatively evaluates their performance against their respective independent models. Section 4 provides a discussion on the advantages of the approach and possible improvements in future works. Finally, Section 5 provides the concluding remarks.

2. Materials and Methods

Many physiological variables can be valuable to classify the occurrence of PA from APS [17,18,19,20,21,22,23], such as hormonal changes of lactate and cortisol levels, eye-tracking [24], and speech wave analysis. However, currently, these variables cannot be measured noninvasively and frequently in free living. In this work, we used data collected noninvasively by the Empatica E4 wristband. Empatica E4 has a 3-axis ACC that captures motion-based activity, a photoplethysmography (PPG) sensor that measures BVP from which HR and HR variability is derived by an internal algorithm of E4, an infrared thermopile to read peripheral ST, and EDA, also known as GSR, to measure the electrical activity conducted through sweat glands in the skin. A Cosmed K5 wearable metabolic system is used to measure energy expenditure (EE) to determine the intensity of the PA (the ground-truth) [25] to compare with the EE estimated from E4 signals. A limited number of experiments are conducted using the Bioplux finger-tip PPG sensor device that provides a higher accuracy PPG and electrocardiogram (ECG) signal as the ground-truth measurement [26]. The characteristics of physiological variables recorded by Empatica E4, Cosmed K5, and Bioplux are summarized in Table 1.
The signals collected from the Empatica E4 wristband are preprocessed to remove noise and artifacts. Random convolutional kernel transformation (ROCKET) is utilized to extract a large number of feature maps. Features with the most predictive power are selected using partial least squares discriminant analysis (PLS-DA) and partial least squares (PLS) for classification and regression tasks, respectively. The selected features are used to train the machine learning (ML) algorithms including multi-task RNN with an LSTM layer for simultaneously classifying the type and intensity of PA and the type of APS. To deal with imbalanced class sizes and avoid bias in model training, we used adaptive synthetic sampling (ADASYN) [27,28] and weighted training.

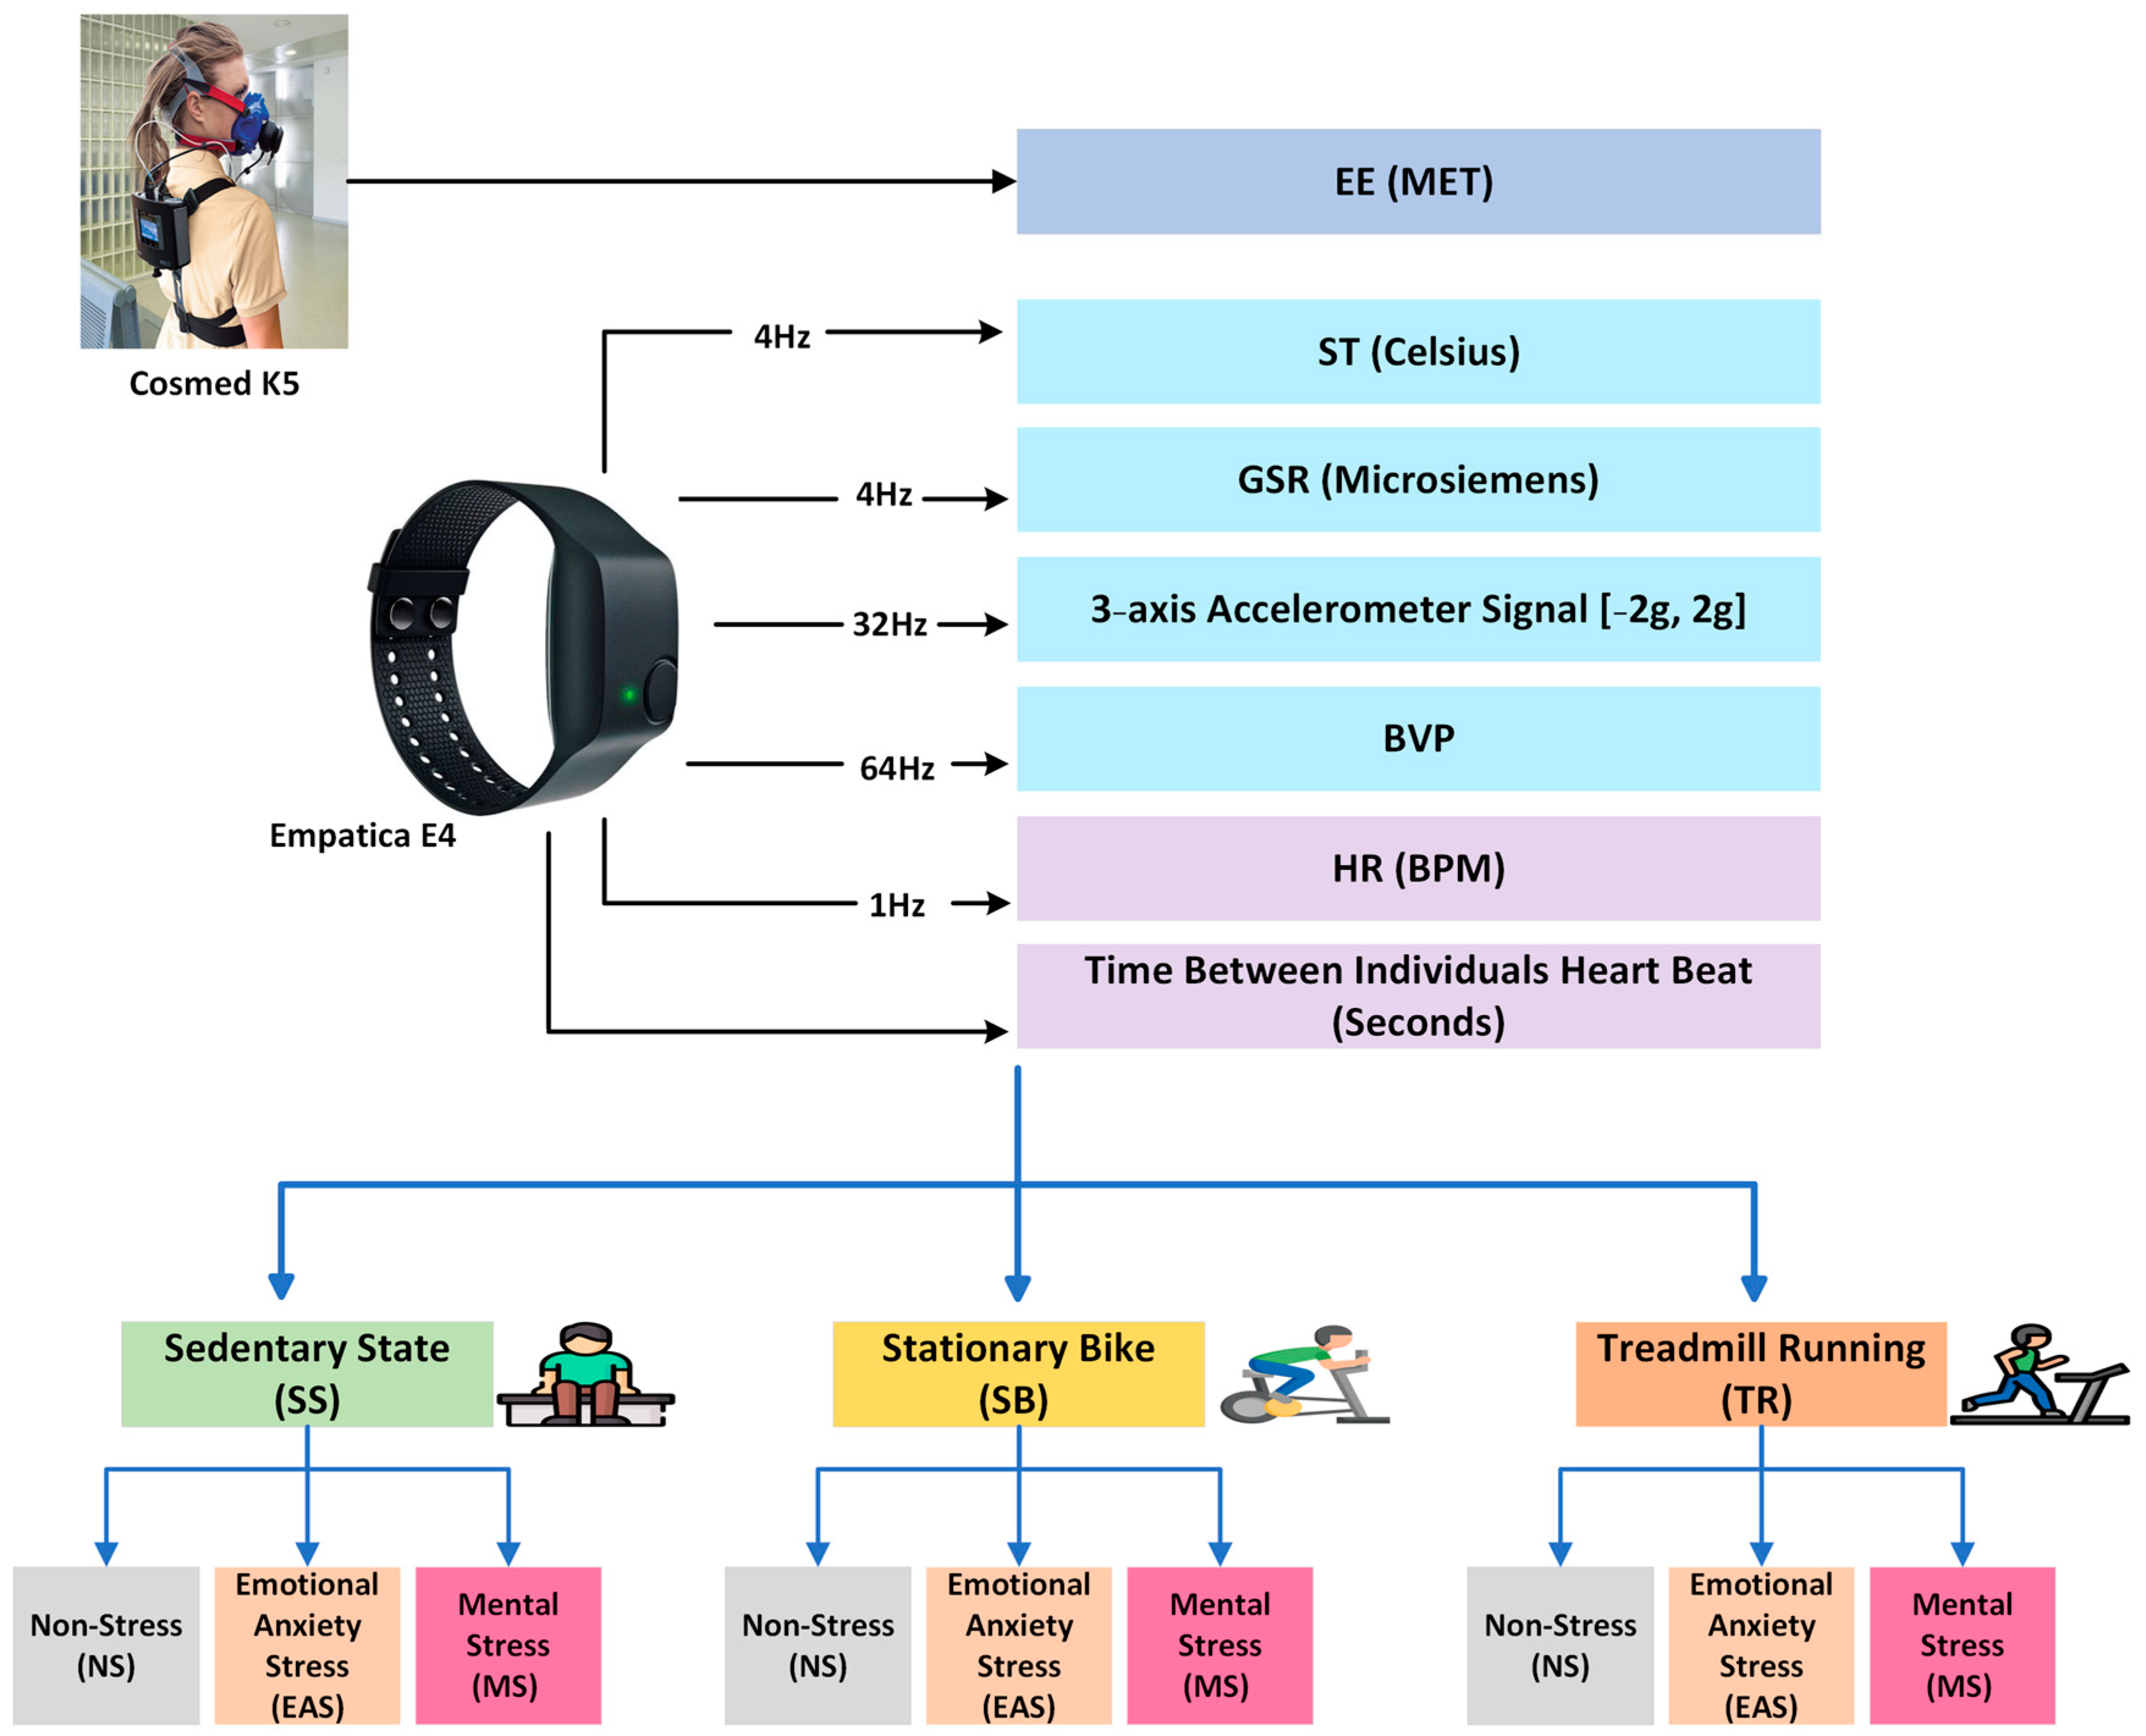
2.1. Data Collection

A total of 34 subjects participated in 166 clinical experiments approved by the Institutional Review Boards (IRB) at the universities conducting the experiments. Table 2 shows a general overview of the participants’ demographics.
The experiments involve being in a sedentary state (SS) or performing two types of PA, either treadmill running (TR) or stationary bike (SB). Subjects perform PA under no psychological stressor non-stress (NS), or under the influence of stressors that induces APS, either mental stress (MS) or emotional anxiety stress (EAS). The APS inducement methods are standard reliable techniques that have been reported in the literature in previous studies [1,19,22,23,29,30,31,32,33].
The SS experiments are divided into three subcategories: NS events, EAS inducement, and MS inducement. In NS, subjects perform free living activities such as reading books, watching neutral videos or surfing the internet. In EAS inducement, subjects meet with their supervisors to report progress of their work, drive a car, and solve test problems in a specific time frame. In MS inducement, subjects solve mental or mathematics exam or IQ test, or puzzle games or perform the Stroop test. Similarly, APS inducement during PA (TR and SB experiments) are split into three subcategories. An NS experiment involves watching natural videos or listening to music. During EAS inducement sessions, subjects watch surgery videos or car crash videos, while in MS inducement experiments, they solve mental math problems. Figure 1 describes the data acquisition system for the data collection.
The Cosmed K5 portable indirect calorimetry system is used to measure the EE (the ground truth). To ensure the PA is consistent across all experiments, the EE was compared across NS, EAS, and MS. In addition, the State-Trait Anxiety Inventory Trait STAI-T and the State-Trait Anxiety Inventory State STAI-S scores are calculated for each participant to assess the anxiety response [34,35,36]. Before and after each nonstress and emotional anxiety stress inducement experiment, the State-Trait Anxiety Inventory (STAI) self-reported questionnaire is collected. The STAI-T scale consists of 20 statements that ask people to describe how they generally feel. On a daily basis, it describes how one feels stressed, anxious, or uncomfortable. The STAI-S scale also consists of 20 statements, but the instructions require subjects to indicate how they feel at a particular moment in time. It is used to determine the actual levels of anxiety intensity induced by the stressful experiment. Table 3 lists the experiments conducted for data collection.

2.2. Signal Processing

Determining of the label of each event, namely, PA or APS and its type, requires a specific duration of biosignals recorded by the wristband sensor. Signal segmentation enables the trained model to be evaluated frequently. The signal segmentation includes splitting a long duration of biosignals into consecutive and overlapping segments. Recursively estimating the labels of different PA and APS requires information from the current time-window of biosignals as well as several past segments of the signal. Hence, all biosignals are split into segments with a duration of 10 s and each observation of the biosignal is made of 5 overlapped segments of these biosignals. Each two-consecutive time-window of biosignals has a 50% overlap, which accounts for 5 s of mutual samples in biosignals for consecutive time segments. The label of each segment was determined from the label of the last second of the segment. This formation of the data is suited to train NN models that are capable of capturing the time-dependency in the data. Therefore, RNN with LSTM architectures are an ideal choice for this purpose. Figure 2 illustrates this notation for labeling each segment of the signal and demonstrates the process of stacking samples with their chronological order for training a RNN model with LSTM architecture [6].
Due to the sensitivity of the PPG sensor to position on the wrist and movement, Empatica E4 signals are corrupted by noise and motion artifacts. A number of factors, such as sensor detachment or communication loss, may result in missing information in raw signals. Signal processing is used to remove noise and artifacts and to impute missing data.
The 3-axis ACC provides the main signal used to capture and discriminate between different types of PA. Since almost all of the human activity frequencies lie between 0 and 10 Hz [37], a low-pass filter or a band-pass filter with a lower frequency close to zero can be used to reject frequencies that are not associated with body movement. We used a 4th order Butterworth bandpass filter with cutoff frequencies 0.1–10 Hz.
The variables that are most informative for determining which PA or APS a patient has are the estimation of HR, the variability in HR, and the breath rate. Since HR values can range from 40 to 200 BPM, the values outside of this range are likely to be either high-frequency noise or motion artifacts. Therefore, we passed the BVP signal through a 4th order Butterworth bandpass filter with cutoff frequencies 0.2–3.3 Hz to remove all oscillation and noises outside of this range.
There are two types of information in the EDA signals, tonic skin conductance level (SCL) and phasic skin conductance response (SCR). It is possible to consider SCL as the baseline for evaluating EDA changes. In contrast, SCR occurs as a result of rapid changes in short-term environmental stimuli, such as sight and noise, as well as other factors that precede participation, such as fear, anticipation, and decision-making. Upsampling the signal and estimating the baseline are the primary steps in the preprocessing of EDA, after which the SCL and SCR are extracted after differentiating them from the signal. Figure 3 summarizes the pipeline of signal preprocessing of each physiological variable [6].

2.3. Feature Extraction

Following the cleaning of the raw data, the signals must be mapped to features that are processed by the algorithms in determining the type and intensity of PA and the type of APS. Calculating features and different fingerprints from biosignals is crucial for two main reasons: First, different biosignals are calculated and streamed at different sampling rates and they need to be fed to the NN model with a similar frequency. Second, raw signals need to be transformed into a new feature space to better represent the target variables (i.e., the class labels). The new feature space introduces nonlinearity to the data and hence, more complex patterns between input and the class labels are used to develop and train the model. We utilized random convolutional kernel transformation (ROCKET) [38] to extract 1800 features from the time-series signals [39]. By generating random convolutional kernels of random length, weight, bias, dilation, and padding, ROCKET extracts feature vectors. In addition, deep convolutional LSTM NN models can also be used for this step [40]. Convolution layers incorporated into 1D convolutional LSTM RNN models require a large number of data samples, and GPUs are not yet optimized to run LSTM layers efficiently. ROCKET runs faster, is resistant to dilation, and is more flexible by applying convolutional kernels with different sizes, padding, etc.
Using Equation (1), we extracted dilated convolutional-based feature map from each segment of signals by calculating the maximum and the proportion of positive values of the filtered signal [38,39,40,41].
F = = i = 0 m 1 f ( i ) . x D ( s d . i ) ,   D { B V P ,   A c c x ,   A c c y ,   A c c z , S C R ,   S C L ,   S T }
where 1D signal X    R 10 × f   s I   and the kernel filter f: 0, …, m − 1 → R. The length m of each kernel filter is selected as 2  ×   f   s I where  f   s I is the sampling rate of biosignal I. Variable d is the dilation factor.
In addition, we transformed the BVP signal into the frequency domain using the fast Fourier transform in order to extract the modified power spectrum peaks orthogonal to the 3-axis ACC signals (Equation (2) [42,43]).
N B V P A c c t   = N B V P t x , y , z ( I n h f n l f + 1 N A c c t N A c c t T N A c c t T N A c c t )
where  N   B V P   and  N A c c t   , t  x, y, z represents the normalized power spectrum of the BVP and 3-axis ACC signal, respectively.  I ( n h f n I f ) represents the identity matrix, and  n h f   n I f > 0 are indexes of spectral bins, expressed in BPM, corresponding to the highest and the lowest frequency of heart beats. In addition, the frequency, height, width, and the prominence of the highest, peak, artifact-free power spectrum  N B V P     A c c t is also integrated with the set of all feature maps.

2.4. Sample Imputation

The raw data collected by Empatica E4 wristband may have missing samples due to factors such as sensor detachment and loss of communication. Data imputation is essential to replace the missing samples with meaningful values before training the ML models. The sample imputation is performed after extracting the feature variables by ROCKET to leverage the calculated feature maps and the relations among the features in estimating the missing samples. Imputation could be performed by simple methods such as replacing the missing values with the mean or the median values or by more advanced approaches such as splines or probabilistic principal component analysis (PPCA) [44,45]. In this work, we used PPCA with 5 principal components to estimate the missing samples.

2.5. Feature Selection

A feature selection method is needed to select the most informative features that correlate with the output targets from the 1800 features extracted by ROCKET.
Uninformative feature variables are determined and excluded from the model. The truncated number of feature variables not only enhances the prediction power of the model, but also reduce computational complexity of the pipeline model. Firstly, we excluded 551 features with the highest co-linearity index (Pearson correlation coefficient), followed by PLS-DA and PLS feature selections methods to extract the most informative features of the remaining 1249 features for the classification tasks and the regression task respectively, where the topmost 200 informative features were selected for each output target. Therefore, we selected the 200 features corresponding to the largest variable important for projection (VIP) scores of the PLS-DA (the largest 200 absolute coefficient of the PLS-DA).
PLS is a cross-decomposition technique. It derives the latent variables (LV) by maximizing the covariance between the features and the output variable; as a result, PLS will ensure that the first LV has the highest degree of correlation with the response variable(s). PLS-DA is an extension of PLS to deal with datasets with categorical target variables (i.e., class labels). PLS-DA is used to determine class separation and to identify the variables containing class-defining information [46].
A total of 244 features are selected by combining features from APS and the pair-wise mutual features from PA and EE to train the multi-task LSTM RNN model that makes simultaneous classification of APS types (NS, EAS) and PA types (SS, SB, TR) and EE estimation. A total of 296 features are selected by combining features from APS and PA for use in the multi-task LSTM RNN model and multi-task XGBoost for the simultaneous classification of APS types (NS, EAS, MS) and PA types (SS, SB, TR).

2.6. Multi-Task RNN Models with LSTM

We used three different model architectures: a multi-task LSTM RNN model that can make simultaneous classification of APS types (NS, EAS) types and PA types (SS, SB, TR) and estimation EE (Figure 4a), a multi-task LSTM RNN model that can make simultaneous classification of APS types (NS, EAS, MS) types and PA types (SS, SB, TR) (Figure 4b). Three separate models of the independent LSTM RNN model are developed for classification of APS types (NS, EAS, MS) and PA types (SS, SB, TR) as in Figure 4c and estimation of EE (Figure 4d) [6]. The nodes in RNN networks are connected in a cycle, so that output from one node affects the input to another, causing RNNs to demonstrate dynamic behavior over time [47,48]. Ordinary RNN suffer from the vanishing gradients and exploding gradients problems. LSTM is a class of RNN that is capable of learning long-term dependencies. Unlike RNN, the LSTM unit is able to handle the problem of vanishing gradients and exploding gradients problems [49,50]. The RNN models with LSTM used in this study have several layers (Figure 4): an input layer, an LSTM with 40 units, a dropout layer 20%, a fully connected layer with 40 units, a dropout layer 20%, and output layers. For classification tasks, the output layer has softmax as an activation function to predict the probability distribution of target classes [50,51]. The model parameters are summarized in Table 4.

2.7. Class Imbalances

Training NN models without accounting for the relative weight of each class distribution will result in poor performance for samples from minority classes, since during training, the model weights are updated relatively more according to the majority class. To address the issue of the imbalanced classes, two different approaches are employed: weighted training and ADASYN. Weighted training/cost-sensitive optimization involves updating the model parameters and loss function so that samples are weighted inversely proportional to the number of samples in each class [52,53]. ADASYN generates synthetic samples based on density distributions, where additional samples for the minority class are generated that are harder to learn than those that are easier to learn. Table 5 shows the size of training splits before and after applying ADASYN for balancing the training split of the data for classification tasks. When balancing the training splits using ADASYN, we considered all 9 combinations of PA and APS types.

2.8. Extreme Gradient Boosting (XGBoost)

As an alternative, we developed multi-task XGBoost classification of APS and PA and compared its performance against the independent XGBoost models and RNNs. XGBoost is a scalable and efficient tree boosting supervised ML algorithm [54]. XGBoost is a branch of gradient boosted decision trees (GBM). Boosting is an ensemble learning method that works by constructing a strong classifier from various weak classifiers. Ensembles are constructed from Decision Tree (DT) models as the weak learner model, where DT is added sequentially to the ensemble and fit to reduce the prediction errors made by the preceding models. Models are fit by gradient boosting using a gradient descent optimization algorithm. XGBoost is designed to enhance the accuracy and to reduce the computational time over the alternative boosting ML algorithms.

3. Results

We used a stratified shuffle split approach for each dataset with the proportion of 75:15:10 corresponding to training, validation, and testing, respectively. Then, we used the two alternative approaches ADASYN and weighted training/cost-sensitive optimization to address imbalanced classes in the training set, as discussed in the previous section. In order to better evaluate the performance of the ML models for predicting class labels of PA and APS classification, we have used the precision, recall, and F1-score (Equations (3)–(5)) where TP is true positive, FN is false negative, and FP is false positive. Table 6 summarizes F1 score for PA and APS classification using LSTM models. Table A1 summarizes precision, recall, and F1 score for PA classification using LSTM models. Table A2 summarizes precision, recall, and F1 score for APS classification using LSTM models.
P r e c i s i o n = T P T P + F P
R e c a l l = T P T P + F N
F 1   S c o r e = 2 ( R e c a l l P r e c i s i o n ) ( R e c a l l + P r e c i s i o n )
Root Mean Squared Error equation (RMSE) is used to assess the performance of EE regression, Equation (6):
R M S E =   Σ ( a c t u a l   v a l u e p r e d i c t e d   v a l u e ) 2 n
where n is the number of testing samples. All numerical studies are performed using TensorFlow 2.0 environment. In addition, several other Python libraries were used for data preprocessing [39,55,56].
Additionally, we compared the performance of the multi-task XGBoost classification of APS types (NS, EAS, MS) and PA types (SS, SB, TR) to the independent XGBoost classification of APS types (NS, EAS, MS) and the independent XGBoost classification PA types (SS, SB, TR). We used ADASYN to address imbalanced classes in the training set. Table 7 summarizes the F1-score for PA and APS classification using XGBoost models. Table A3 summarizes precision, recall, and F1 score for PA classification using XGBoost models. Table A4 summarizes precision, recall, and F1 score for APS classification using XGBoost models.

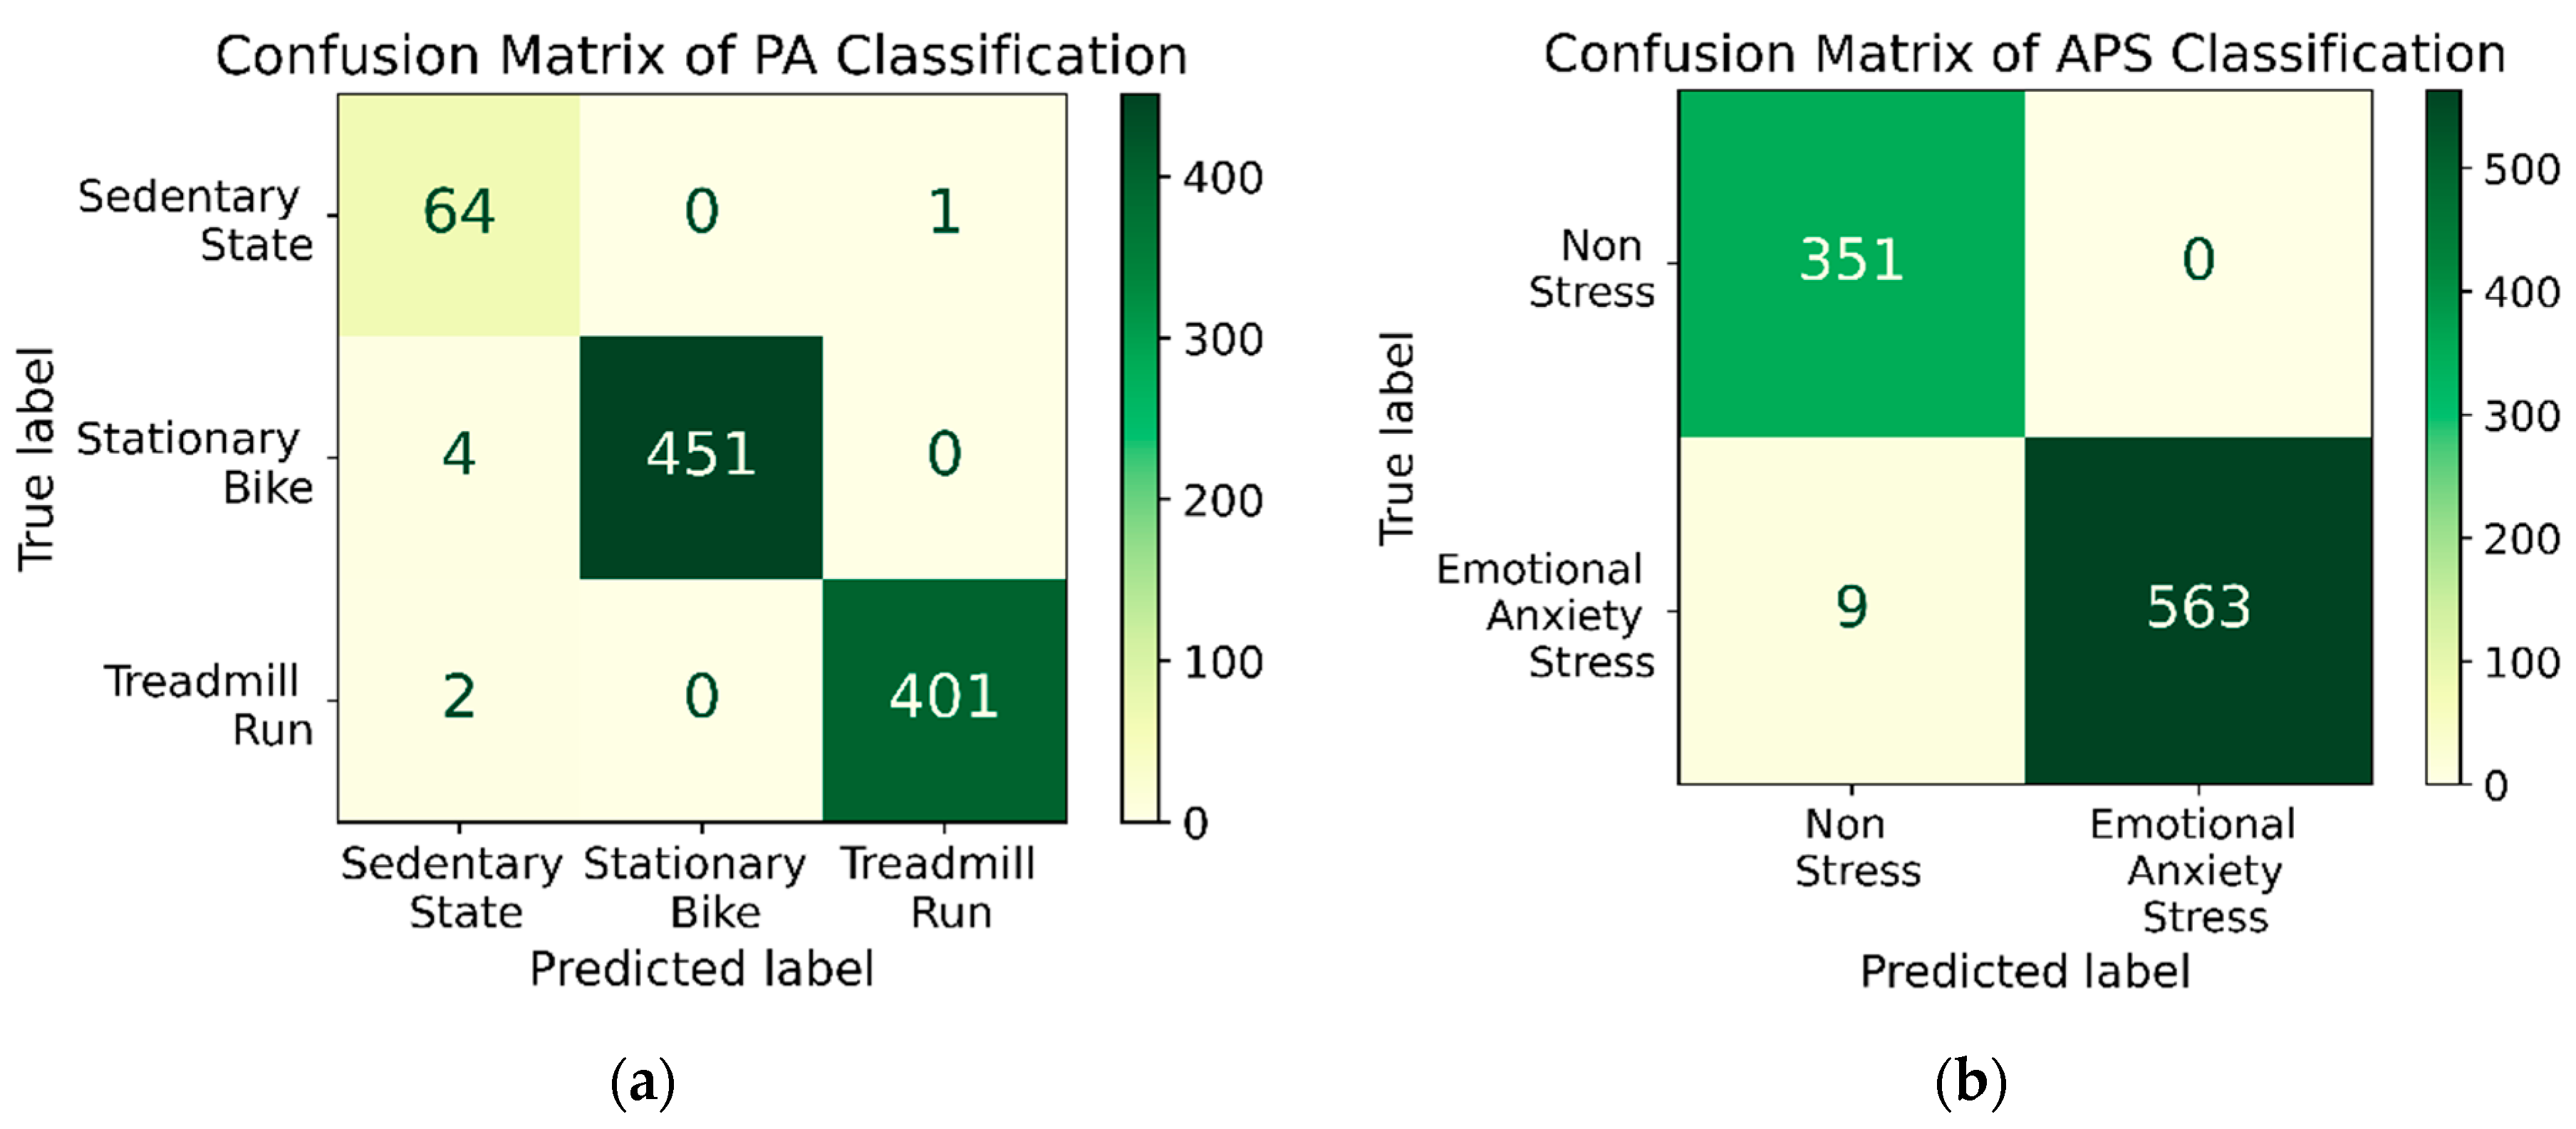
3.1. Multi-Task Classification of PA Types, APS Types and EE Estimation

Figure 5a shows the confusion matrix of PA types classification by using multi-task LSTM RNN model designed to simultaneously perform classification of APS types, classification of PA types and estimation of EE. Figure 5b depicts the confusion matrix of the corresponding APS classes estimated form multi-task LSTM RNN model. The results for mental stress are excluded because not enough EE data were collected during mental stress sessions. PLS-DA is used for feature selection for the classification task. A total of 244 features were selected by combining features from APS and the pair-wise mutual features from PA and EE. Weighted training is used to handle the imbalanced classes. The model achieved a RMSE of 0.728  cal hr . kg for EE estimation. The architecture of multi-task LSTM RNN classification of APS types and PA types and estimation of EE is shown in Figure 4a.

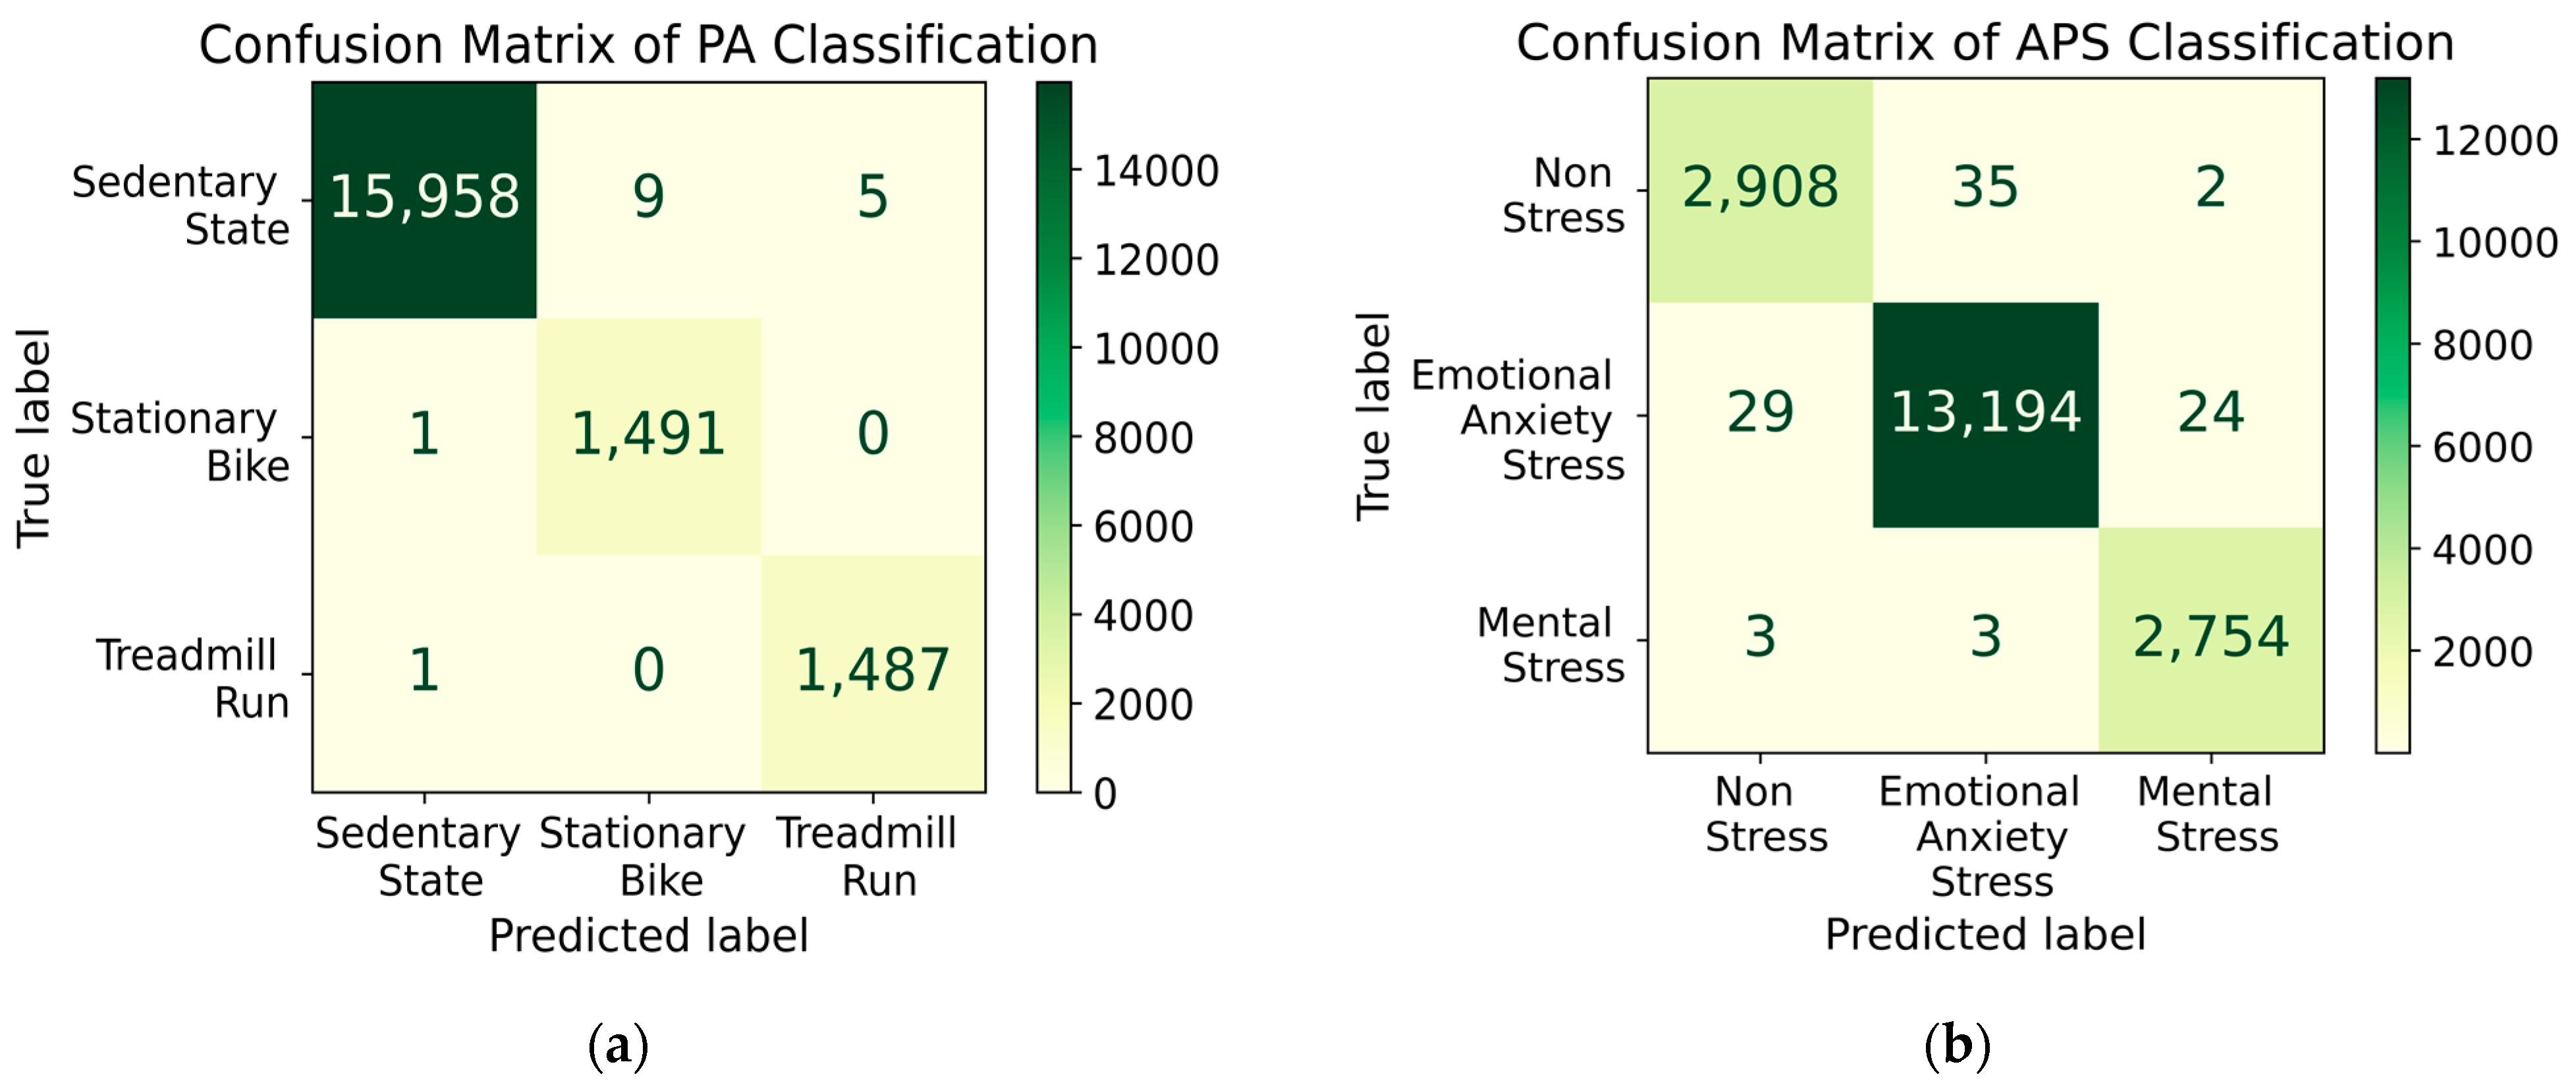
3.2. Multi-Task Classification of APS Types (NS, EAS, MS) and PA Types (SS, SB, TR)

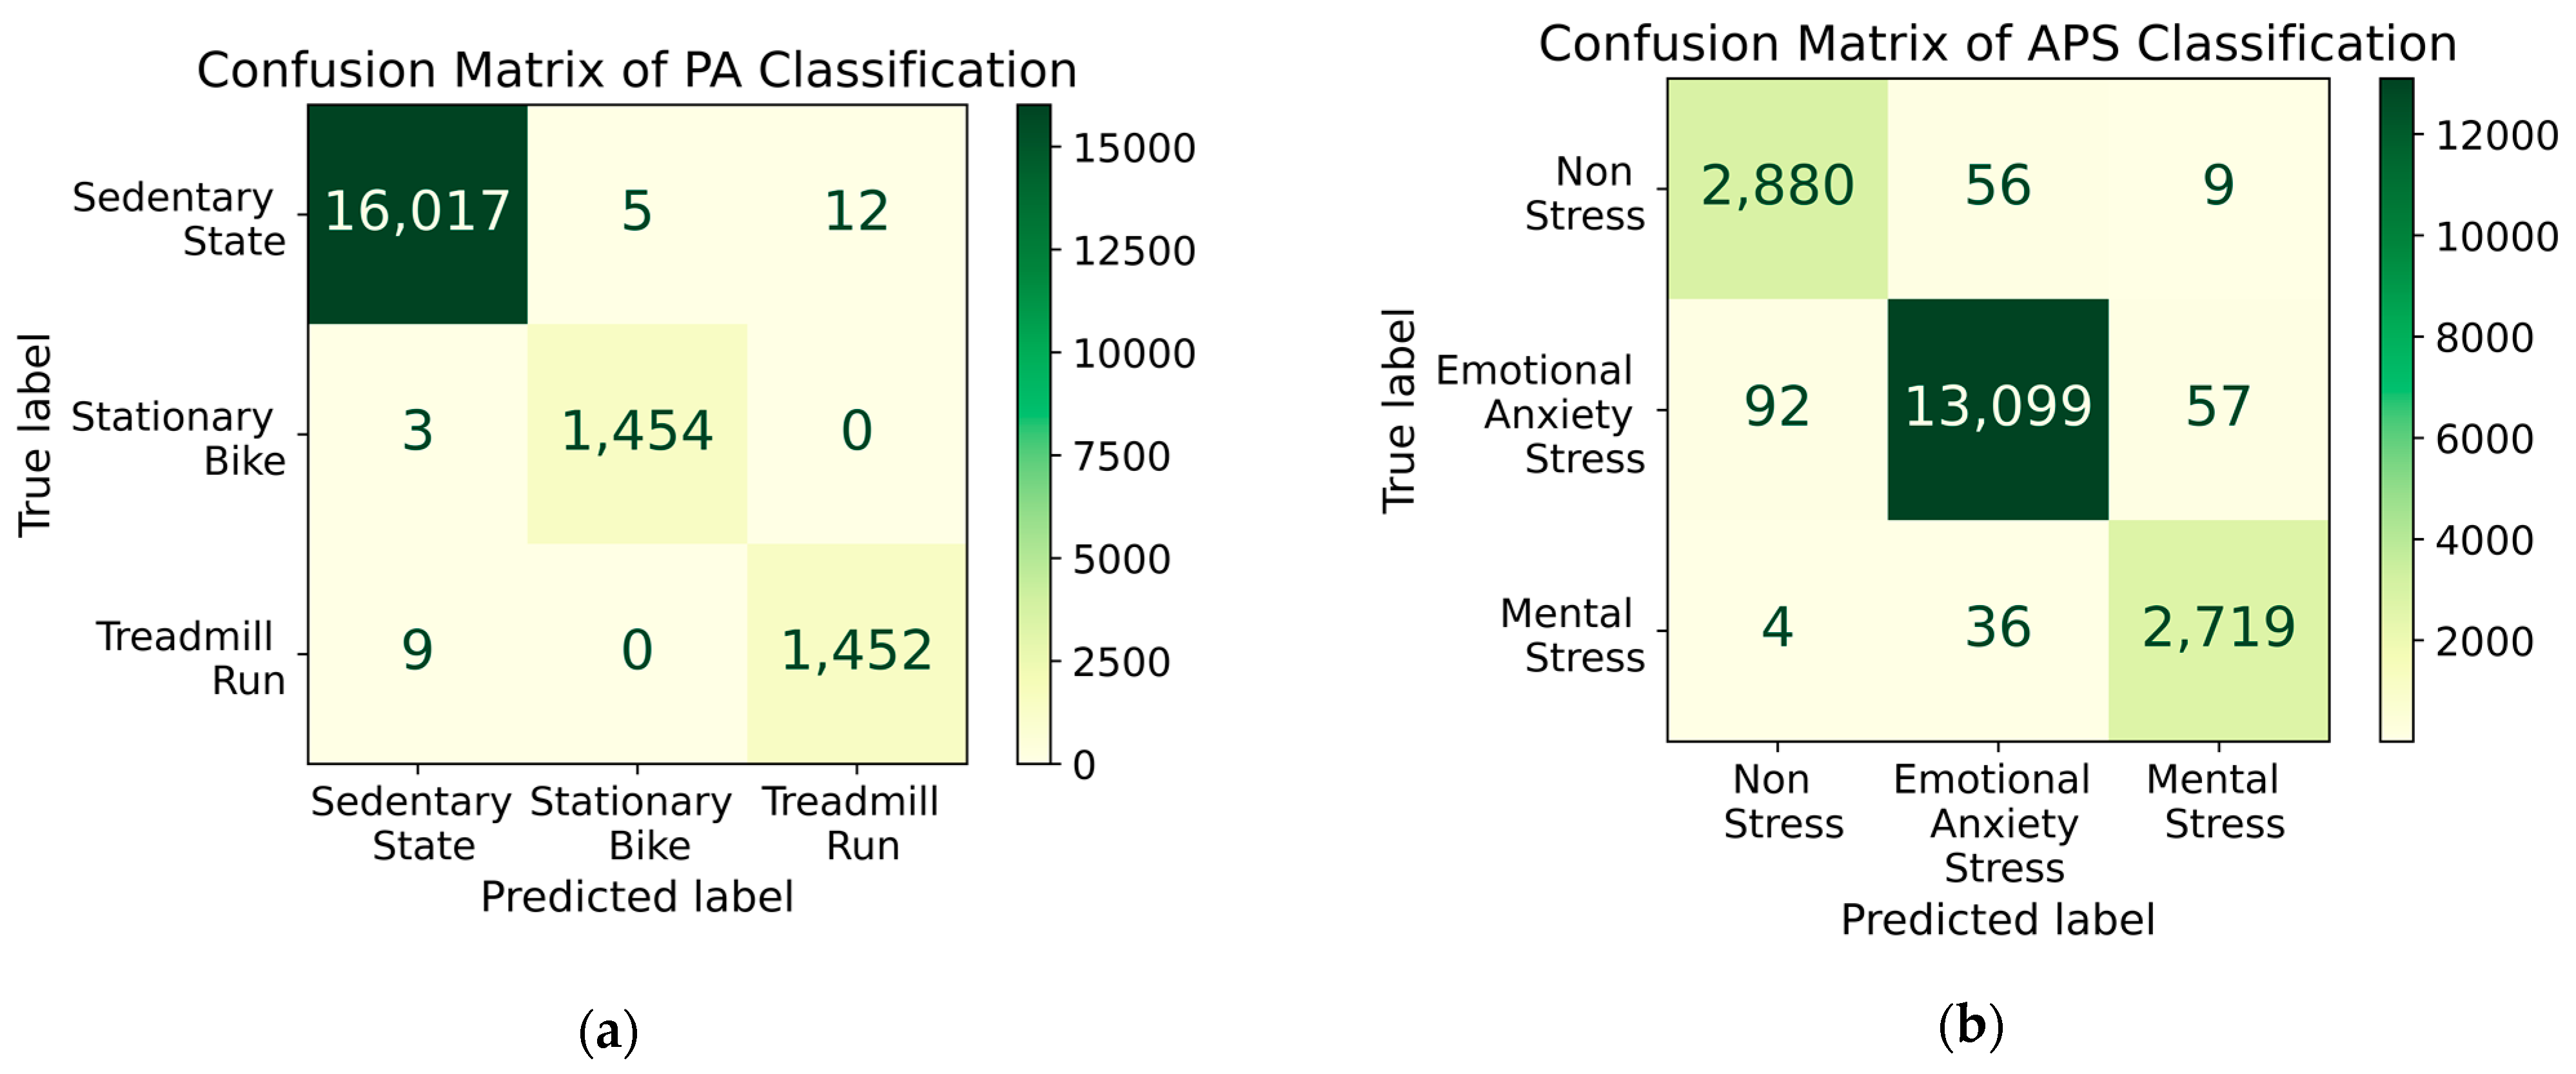
3.2.1. Multi-Task Classification of APS Types and PA Types with Weighted Training

Figure 6a shows the confusion matrix of PA types classification (SS, SB, TR) using multi-task classification of APS types (NS, EAS, MS) and PA types (SS, SB, TR) obtained from multi-task RNN model tuned with weighted training, Figure 6b also shows the confusion matrix APS types classification (NS, EAS, MS) using multi-task classification of APS types (NS, EAS, MS) and PA types (SS, SB, TR) with weighted training. PLS-DA is used for feature selection for the classification tasks. A total of 296 features were selected by combining features from APS and PA. Weighted training is used to handle the issue of imbalanced classes. The architecture of the multi-task classification of APS types and PA types is shown in Figure 4b.

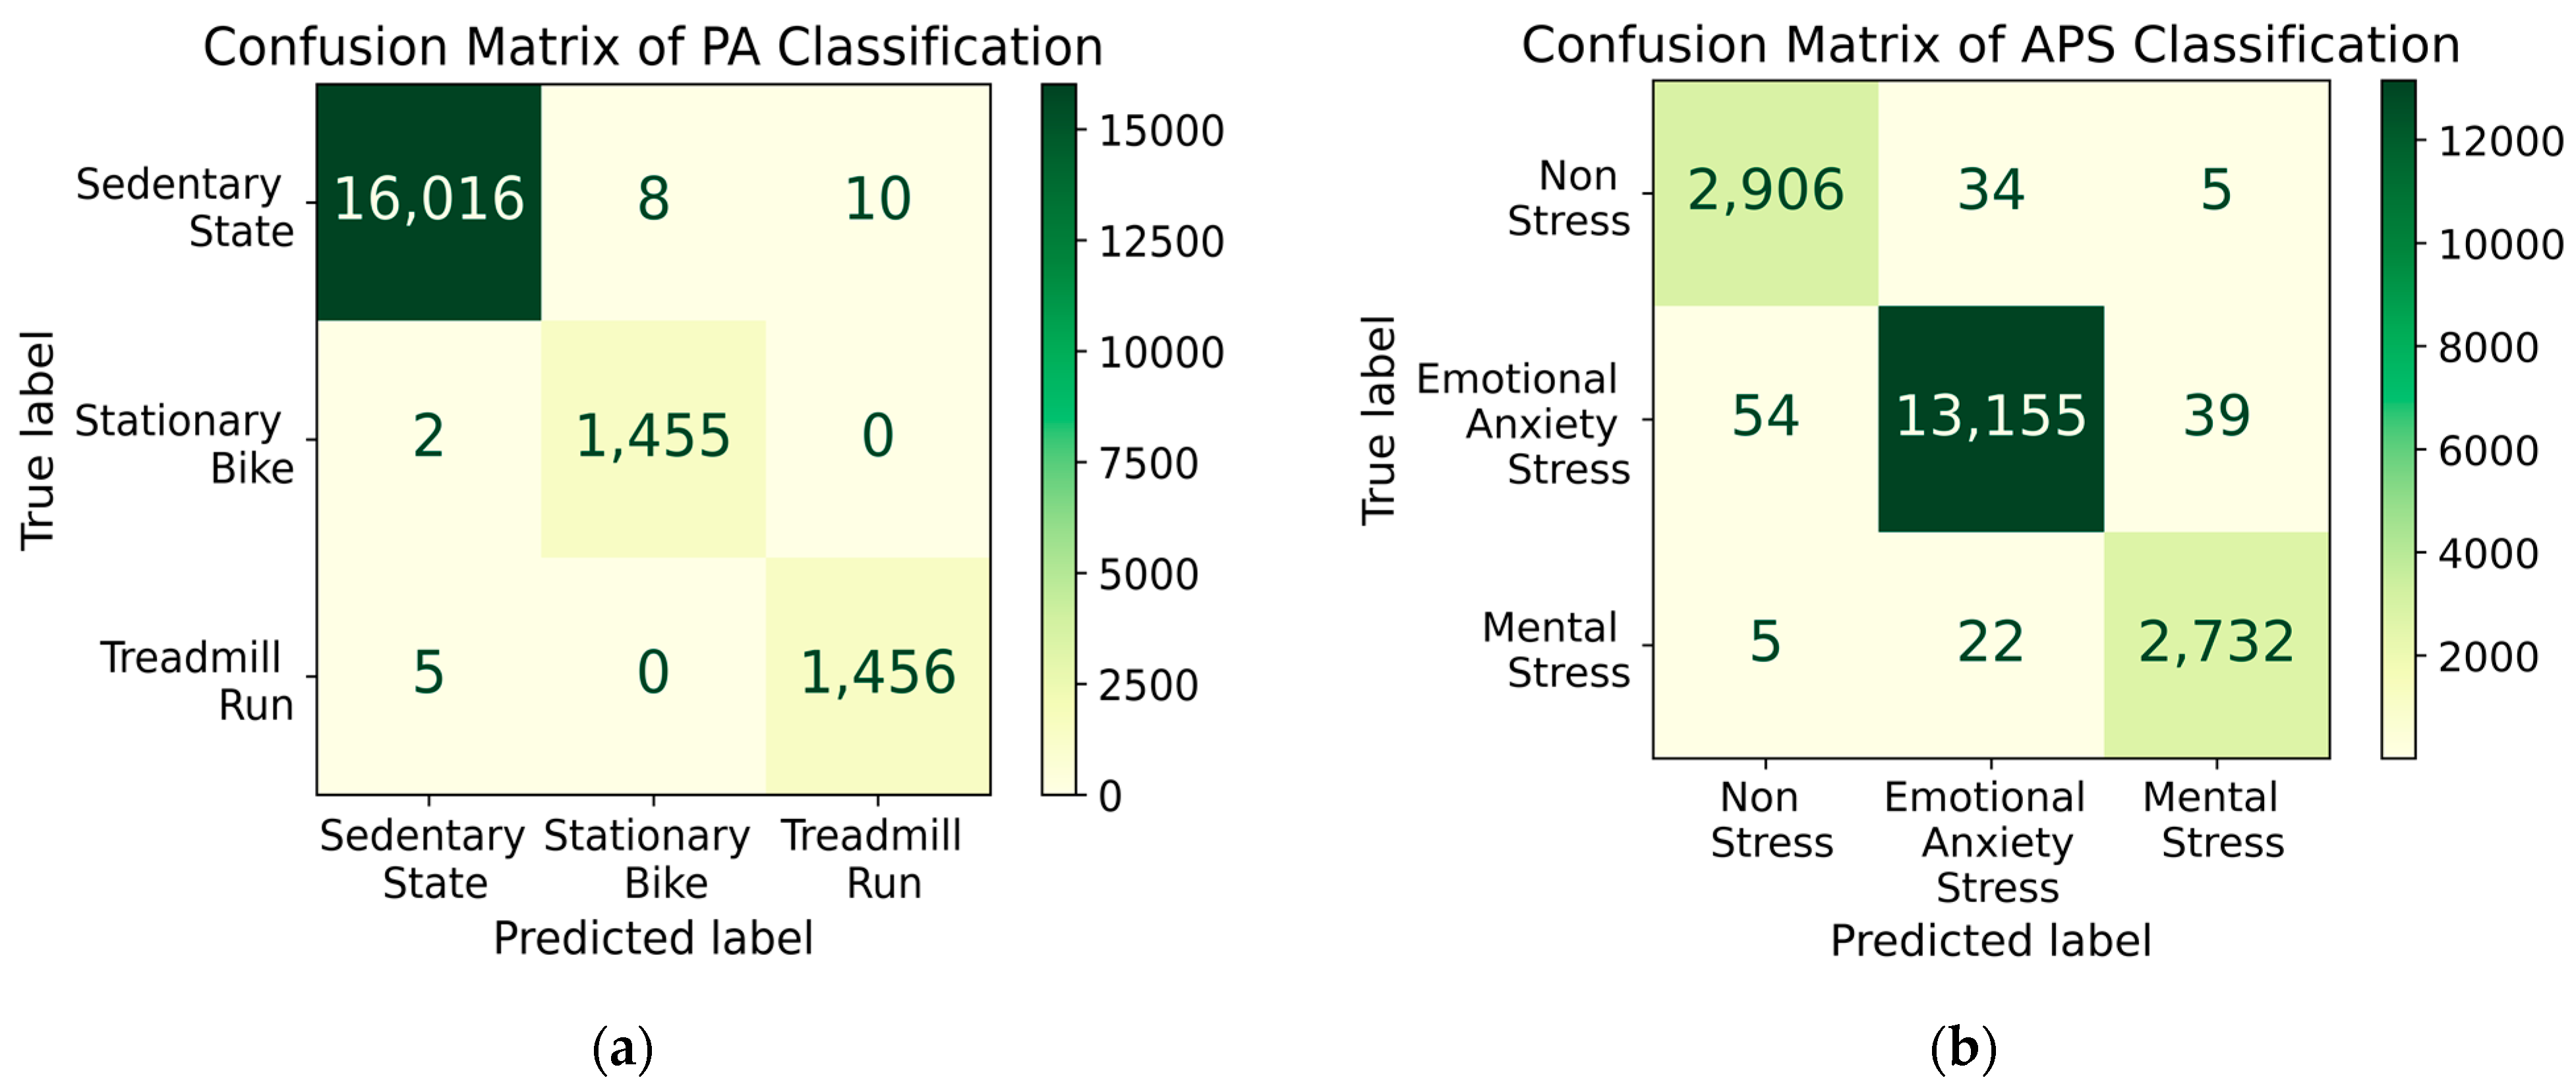
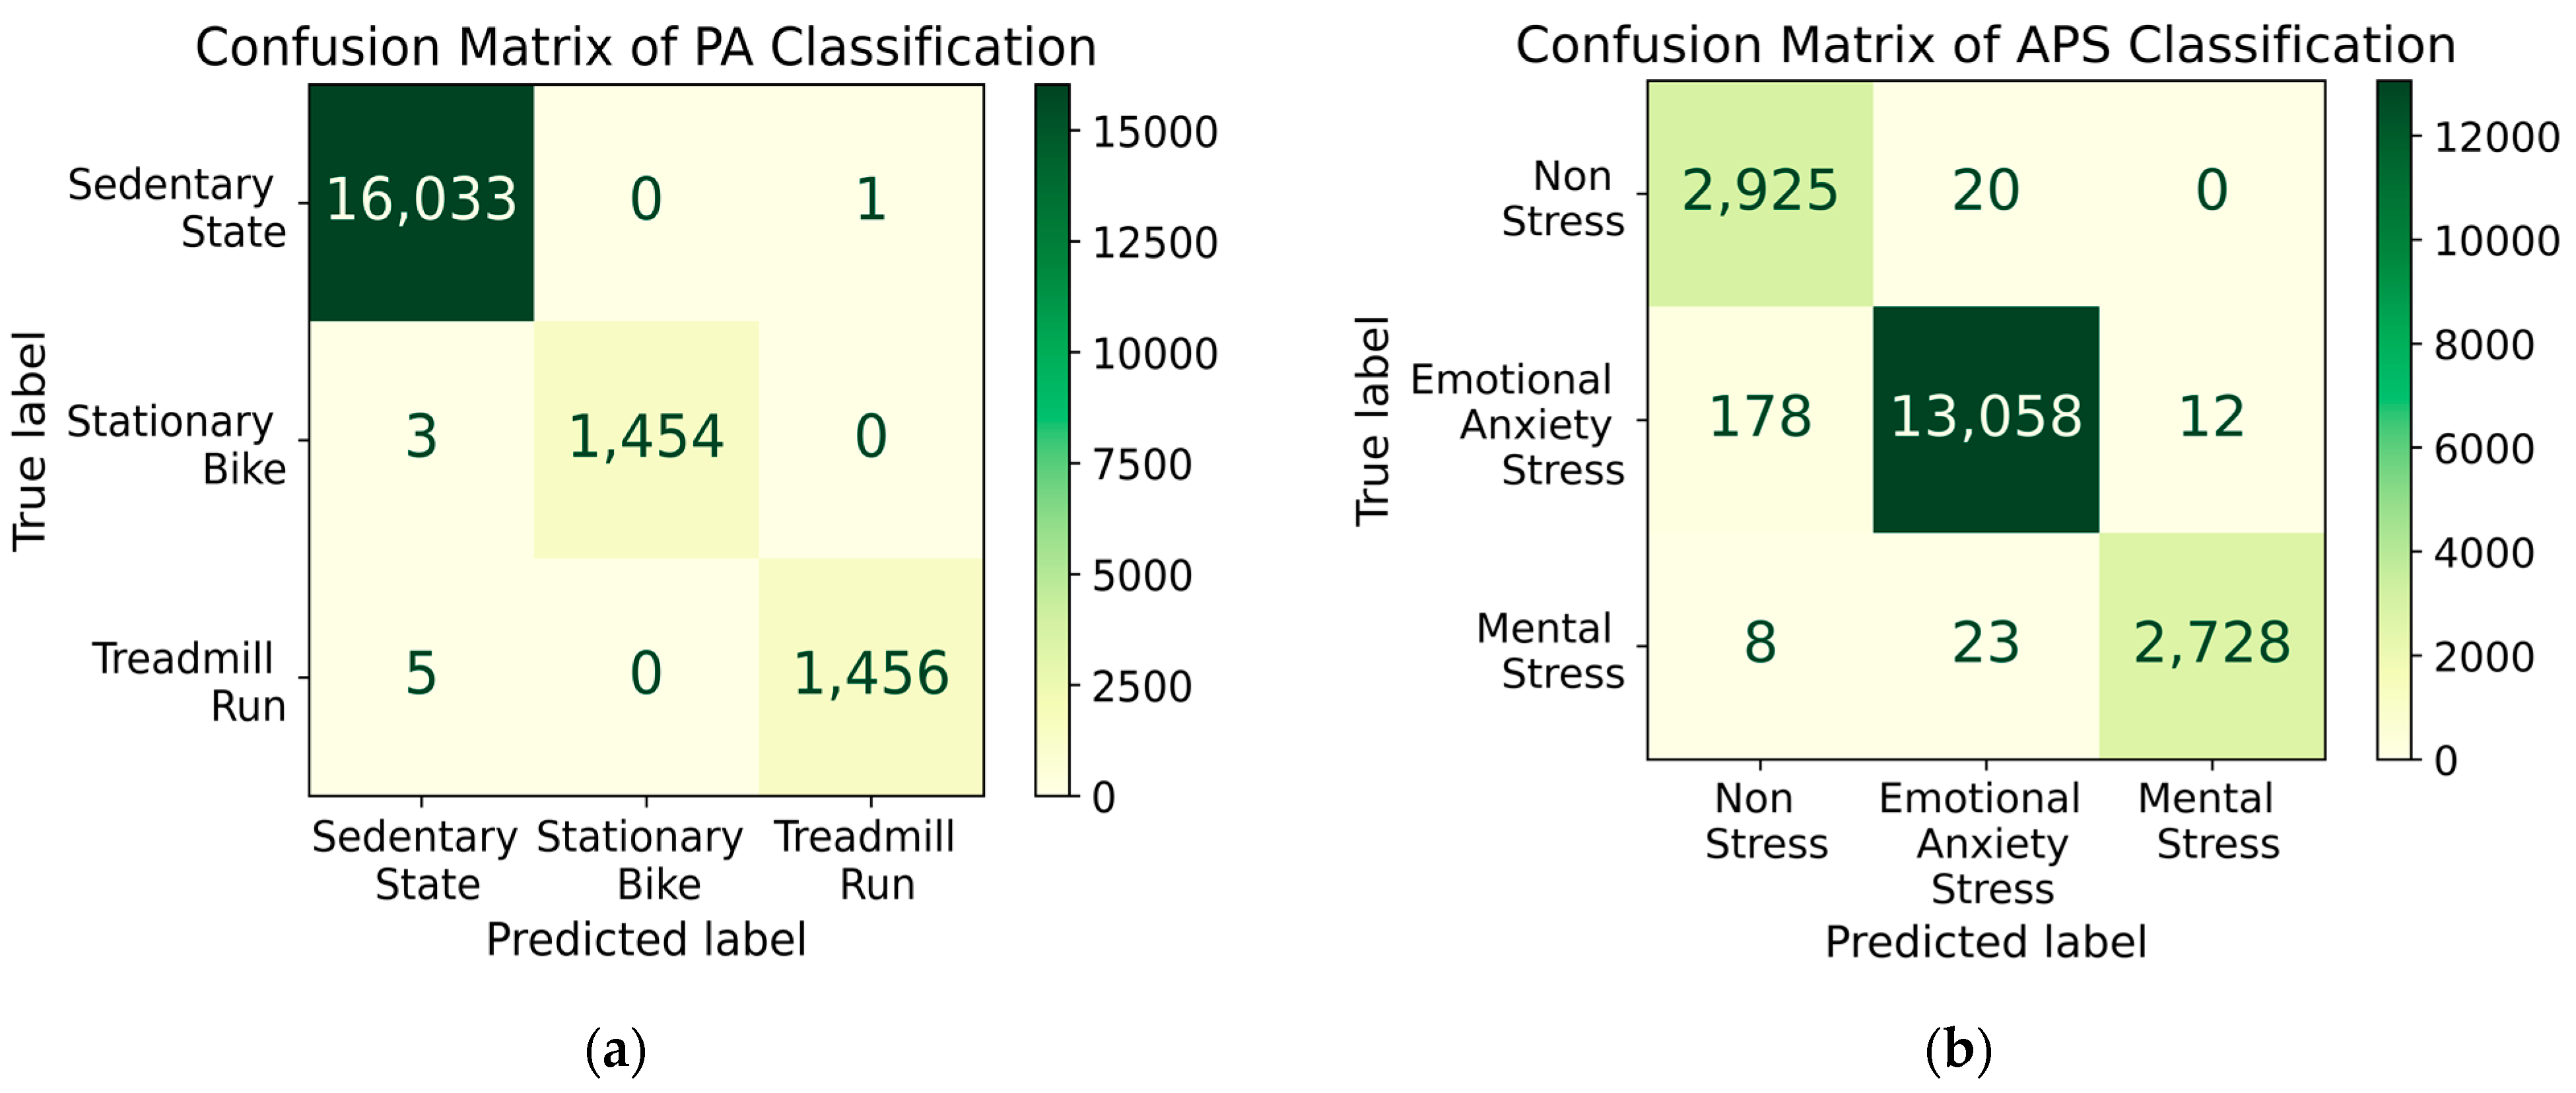
3.2.2. Multi-Task Classification of APS Types and PA Types with ADYSN

Figure 7a shows the confusion matrix of PA types classification using dual task RNN classifier ADYSN. Figure 7b shows the confusion matrix APS types classification using the dual task classification of APS types and PA types with ADYSN technique for addressing the problem of imbalanced classes. PLS-DA is also used for feature selection for the classification tasks.

3.3. Independent Classification of PA Types and APS Types (Weighted Training and ADYSN), and EE Regression

3.3.1. Independent Classification of PA Types and APS Types with Weighted Training

Figure 8a shows the confusion matrix of PA types classification using the independent LSTM RNN. Figure 8b shows the confusion matrix of APS types classification using the independent LSTM RNN Model. PLS-DA is used as a feature selection method to select the topmost informative 200 features for the classification tasks. Weighted training is used to handle the class imbalance. The architecture of the independent LSTM RNN is shown in Figure 4c.

3.3.2. Independent LSTM RNN Classification of PA Types and APS Types with ADYSN

Figure 9a,b display confusion matrices of PA and APS classification tasks. Both confusion matrices were calculated based on predictions made by two independent RNN classifiers to discriminate different types of PA and APS. Synthetic samples of minority classes were generated for unbiased model training. The architecture of the independent LSTM RNN is shown in Figure 4c.

3.3.3. Independent LSTM RNN for EE Estimation

In the independent EE regression task, PLS is used to narrow down the most informative features. The regression model achieved an RMSE of 0.666  cal hr . kg . Figure 4d shows the architecture of the independent LSTM RNN model for regression. Figure 10a compares the EE estimation using the independent LSTM RNN model and the measured EE by the indirect calorimeter (Cosmed K5) for an independent testing data for an individual subject running on the treadmill and experiencing EAS. Figure 10b compares the EE estimation using the multi-task LSTM RNN model and the measured EE by the indirect calorimeter for the same subject.

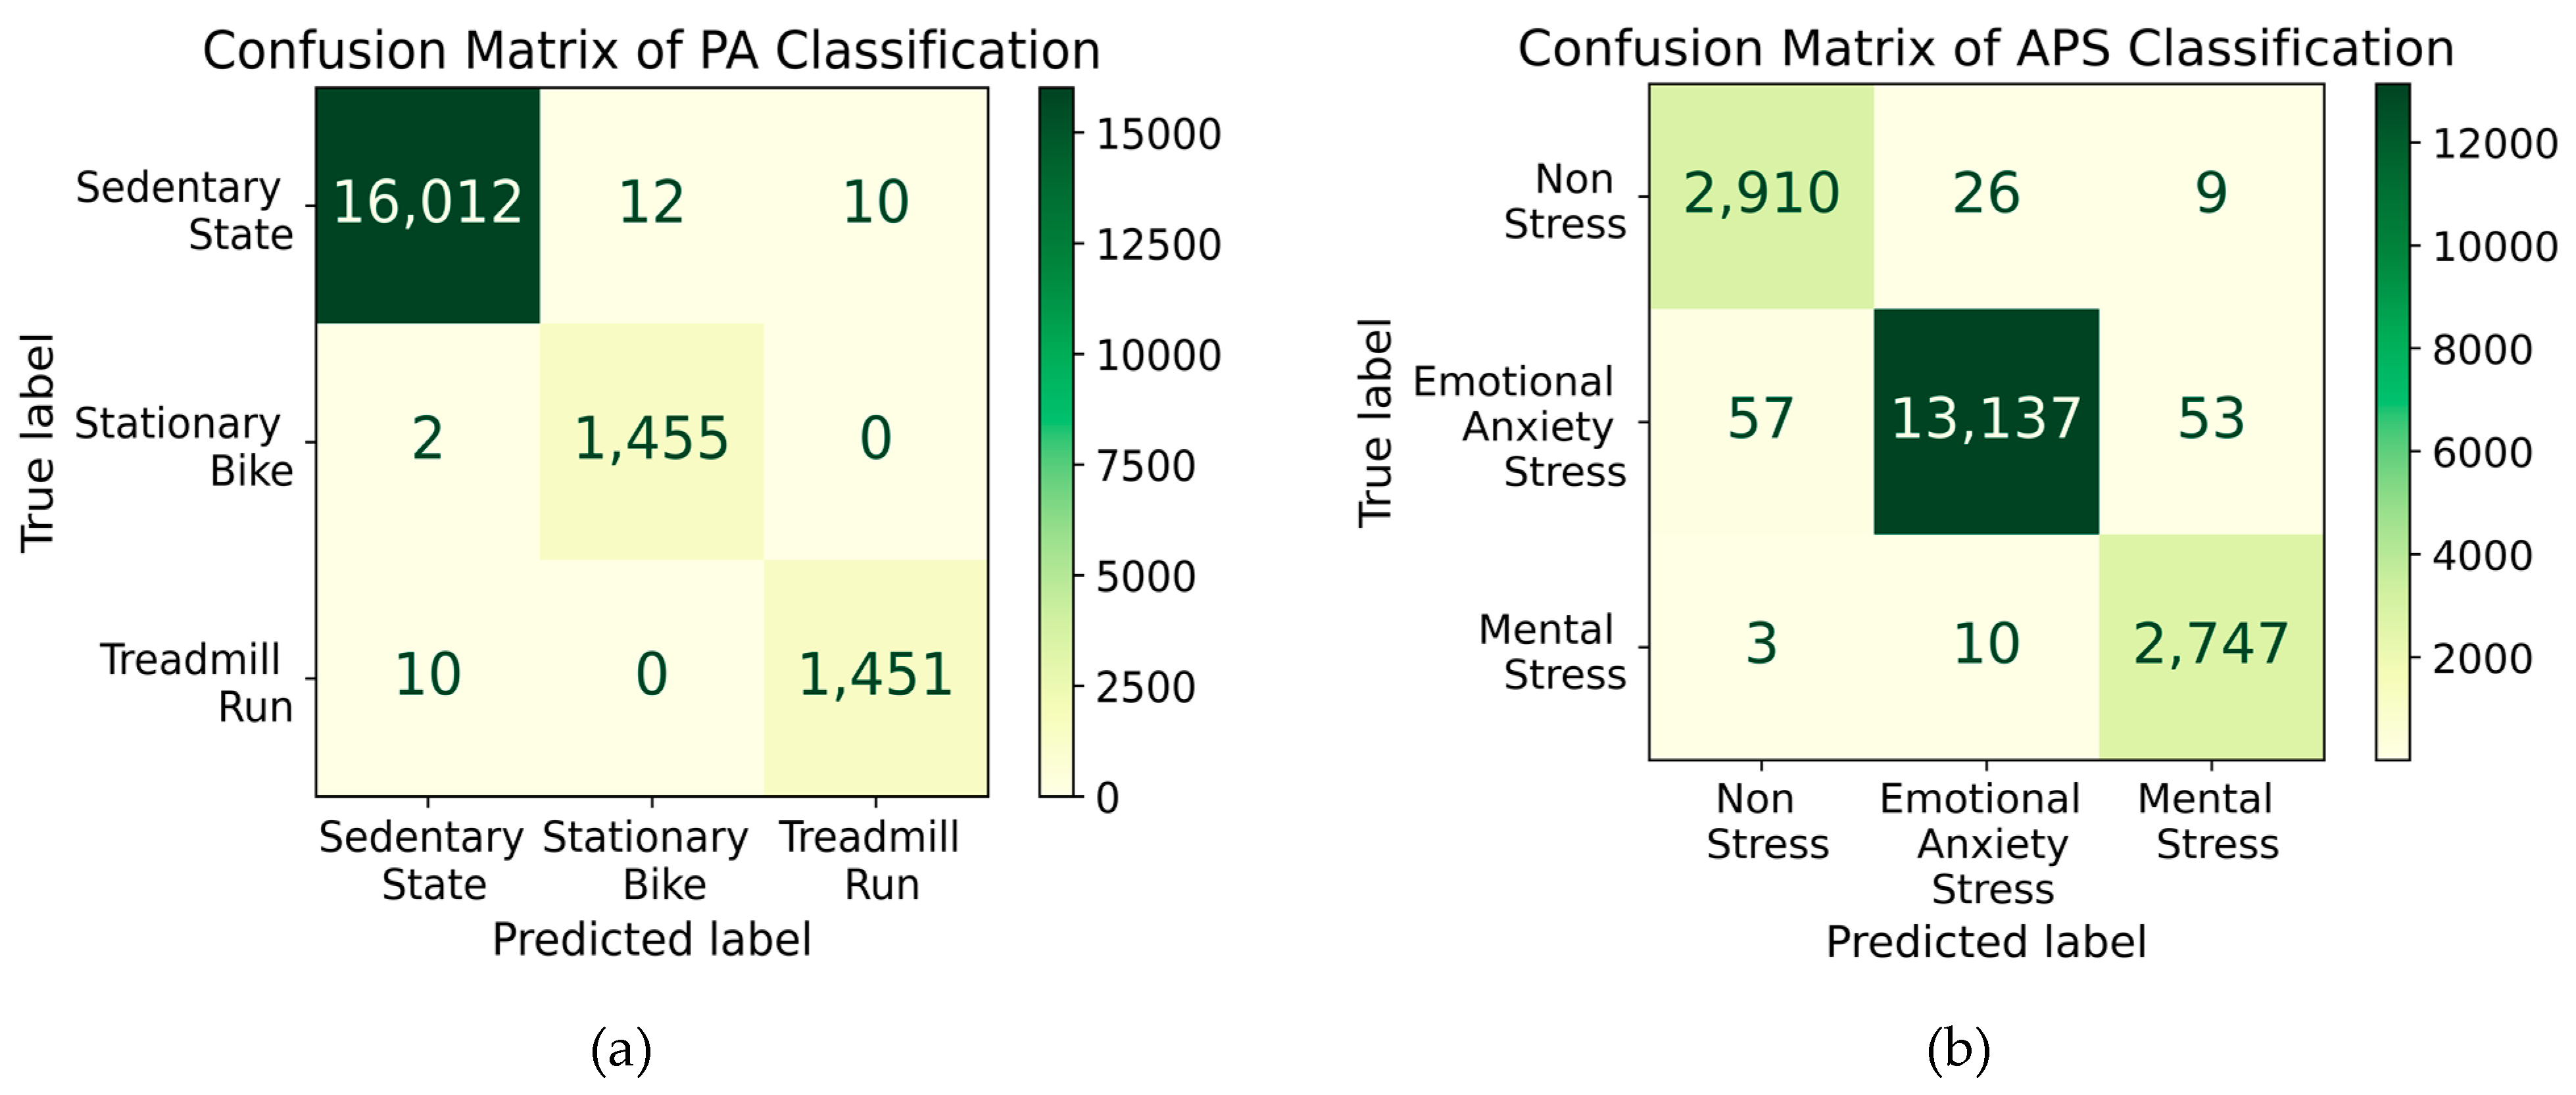
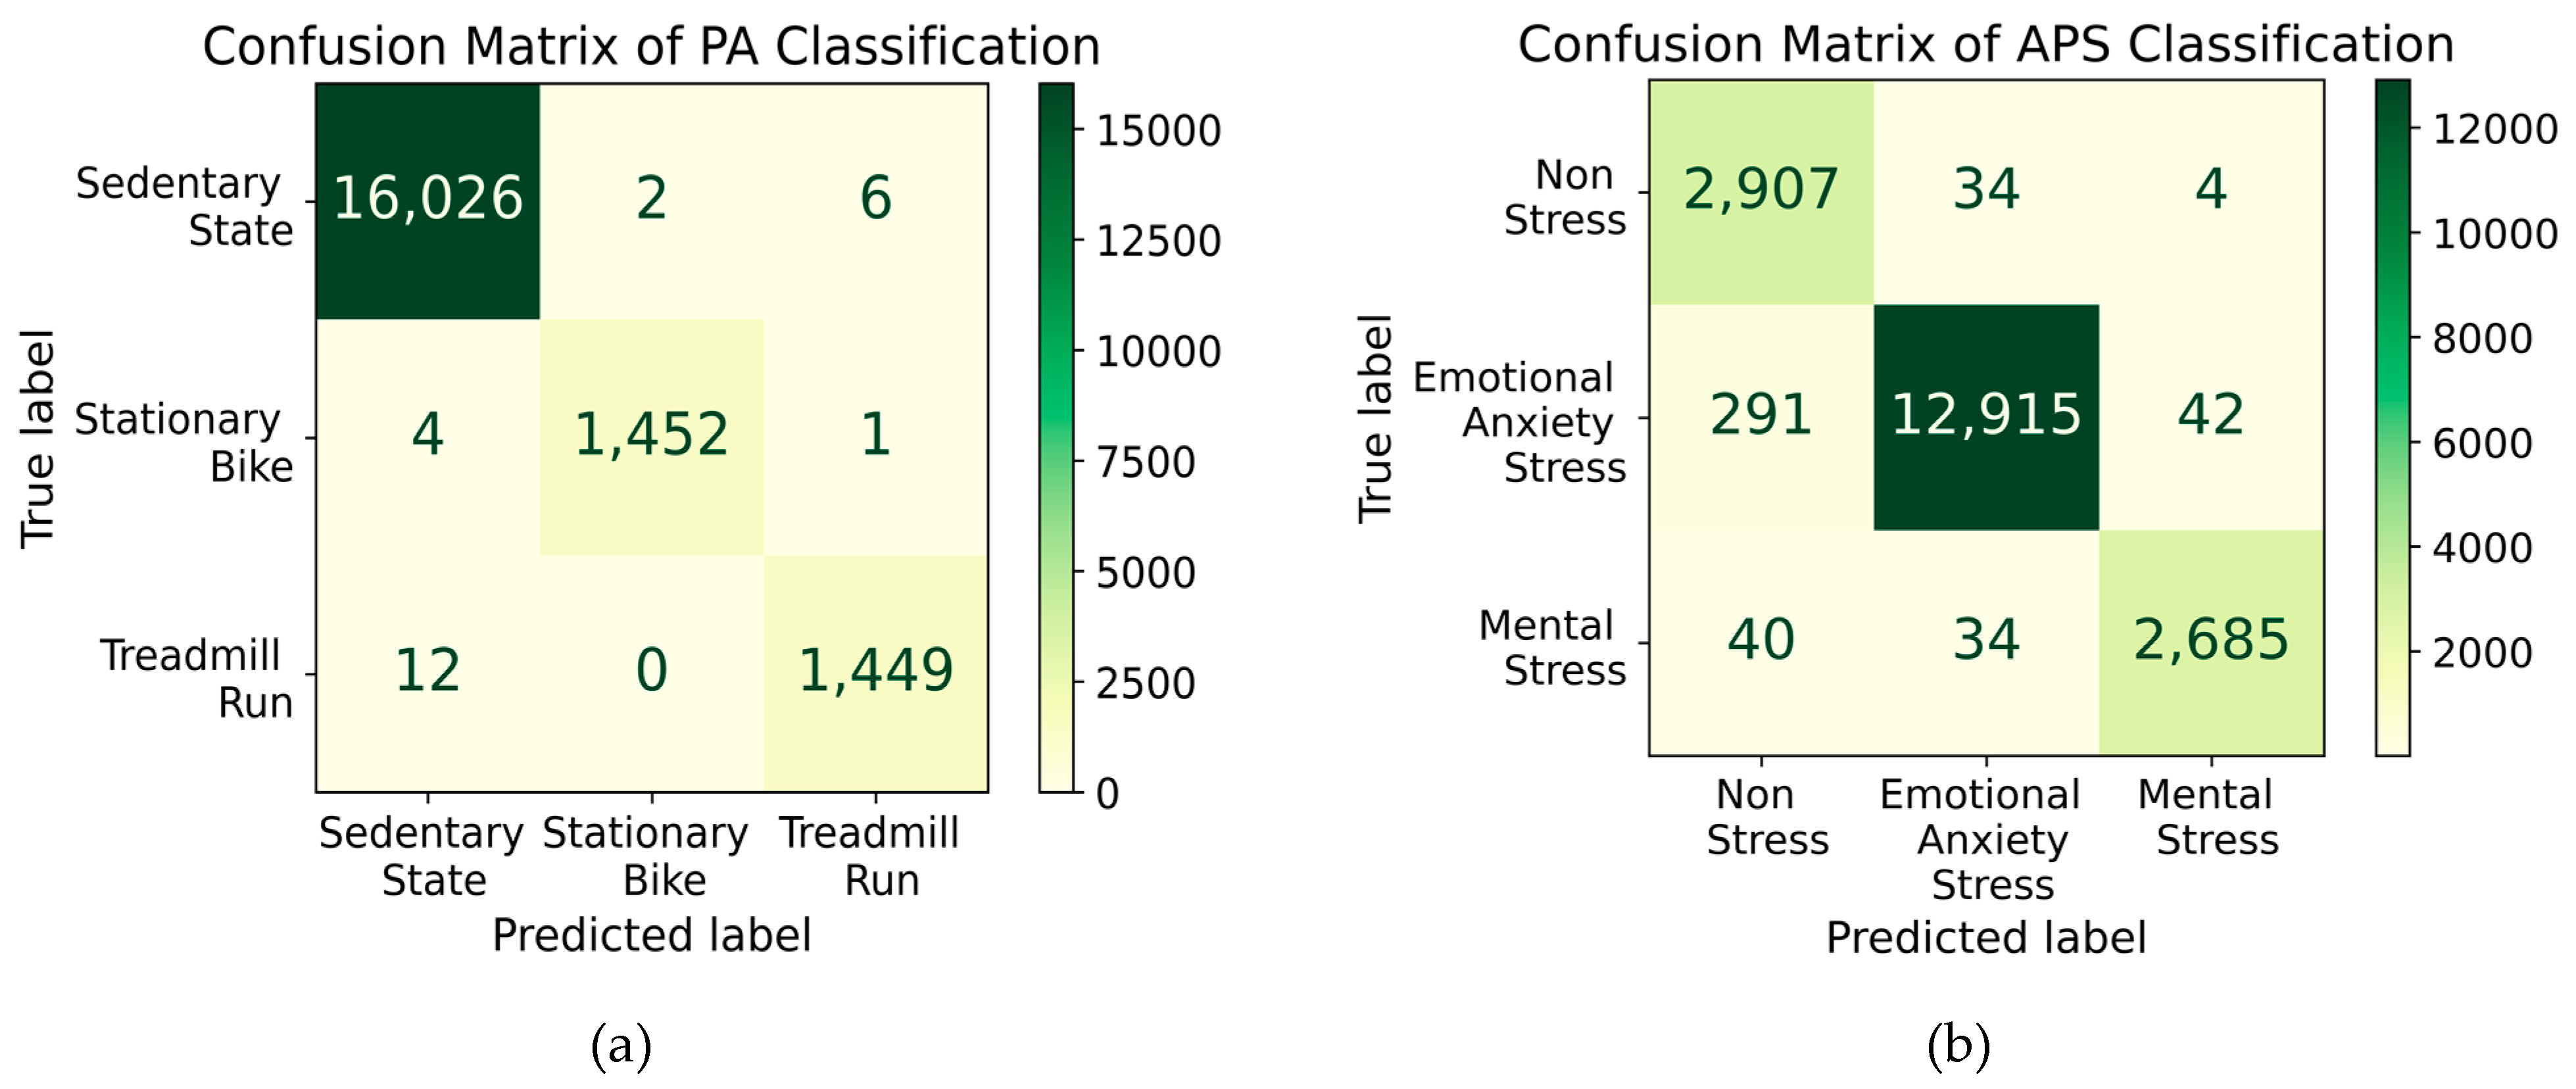
3.4. XGBoost Classification of PA Types and APS Types with ADYSN

Multi-Task XGBoost Classification of PA Types and APS Types (ADYSN)

In order to better compare the performance of the multi-task RNN classifiers, a multi-task XGBoost was trained by same training splits and confusion matrices for each classification tasks were calculated.
Figure 11a shows the confusion matrix of PA types classification using the multi-task XGBoost classification of APS types and PA types. Figure 11b shows the confusion matrix APS types classification using the multi-task XGBoost classification of APS types and PA types. PLS-DA is used for feature selection for the classification tasks and ADYSN is used to handle the class imbalance.

4. Independent XGBoost Classification of PA Types and APS Types with (ADYSN)

Independent estimation of the PA and APS was also studied for a comparison with independent RNN classifiers.
Figure 12a shows the confusion matrix of PA types classification using the independent XGBoost classification of PA types with ADYSN. Figure 12b shows the confusion matrix APS types classification using the independent XGBoost classification of APS types with ADYSN. PLS-DA is used for feature selection for the classification tasks and ADYSN is used to handle the class imbalance.

5. Discussion

In this work, we used a multi-task learning approach to train both an RNN with LSTM architecture and XGBoost for simultaneously classifying the type and intensity of PA and the type of APS using a common feature map. We used data collected during activities of daily living and exercise sessions, relying only on the physiological signals measured noninvasively by the Empatica E4 wristband. The measured biosignals used for discrimination between different APS and PA include a 3-axis accelerometer, BVP, ST, and GSR (HR is reported by E4 based on BVP). The data obtained from the wristband are processed to impute the missing values and to reduce the noise and the artifacts that compromise the data quality. We employed random convolutional kernel transformation to extract a large number of features from the time series signals. We used two different feature selection techniques to select the most informative features, PLS-DA for the classification tasks and PLS for the regression tasks. In order to address the issue of the imbalanced classes, two different approaches are employed: weighted training and ADASYN.
The advantage of the multi-task RNN model is that only a single model is developed and maintained rather than many independent classification and regression models. Moreover, in cases where there is similarity between the tasks, multi-task learning can provide consistency in the predictions. Additionally, mutual features were used for multi-classification regression tasks, therefore enhancing the prediction power of the model, and reducing the computational complexity, which makes it a great candidate for real-time implementation on platforms with low computational power.
The multi-task LSTM RNN model designed to simultaneously perform classification of APS types (NS, EAS), classification of PA types (SS, SB, TR), and estimation of EE achieves comparable performance to the independent RNNs, with the multi-task RNN having F1 scores of 98.00% for PA and 98.97% for APS, and an RMSE of 0.728  cal hr . kg for EE estimation using independent testing data. In contrast, the independent RNNs have F1 scores of 99.64% for PA and 98.83% for APS, and an RMSE of 0.666  cal hr . kg for EE estimation. Multi-task XGBoost achieved F1 scores of 99.89% and 98.31% for the classification of PA types and APS types, respectively, while the independent XGBoost achieved F1 scores of 99.68% and 96.77%, respectively. The results illustrate that multi-task NN and multi-task XGBoost can effectively assess the signals from wearable sensors and effectively enhance the detection of PA and APS. This can be explained by the potential for improved data efficiency in exploiting the shared representations in the data by training one model to predict the related tasks PA and APS jointly. Training independent models to predict the type of PA and APS without connecting the shared information between the two tasks may require more training data and longer training time to achieve a high level of accuracy.
It is crucial to consider the relative risk of misclassification of the different types of PA and APS to the patients with diabetes. For instance, in the case of misclassification of APS events, whether MS or EAS as an NS event, the AP system will not take the proper action on regulation of blood glucose concentration, and consequently, hyperglycemia may occur. Alternately, misclassification of NS as an MS or EAS is harmful since the AP will incorrectly inject additional insulin in an attempt to mitigate APS, leading to hypoglycemia. Similarly, misclassification of SS as SB or TR will lead to hyperglycemia due to reduction of insulin injection by the AP, while misclassification of SB or TR as SS is dangerous since AP will not reduce insulin infusion during PA leading to hypoglycemia or potentially severe hypoglycemia.
A few of the EAS inducement samples were misclassified as NS, as shown in the confusion matrix of APS classification Figure 5b (i.e., EAS recall = 98.43% as indicated in Table A2). The main reason that some APS samples are predicted as non-stressful episodes can be caused by over-smoothing the biosignals, especially BVP, since the variation of IBI is the main biosignal conveying the information on psychological stress. Additionally, the experiments were conducted under the review and monitoring of the IRB to ensure the safety and welfare of the subjects. As a result, the APS experiments are limited to mild APS inducement; consequently, some of the physiological variables during EAS resemble NS events.
Classification of different APS is a challenging task: for one reason, different classes, in particular, milder MS and EAS, can be misclassified interchangeably. Another factor in our data is the difference in data sizes, the number of samples in EAS dominates other class labels (NS and MS). Usually, handling imbalance labels in the training split improves the performance of the model with unseen data. Yet, intervention between NS and EAS indicates a low signal-to-noise ratio in some collected samples. The noise in the data causes estimation of the probability of each class close to the threshold value. Hence, the trained model results in estimating samples with low confidence. Similarly, during SB sessions, the variation of the 3D accelerometer signals can be similar to the SS condition and therefore, other biosignals such as BVP become rather important to distinguish between SS and SB.
SB and TR samples are readily distinguishable from each other. Figure 5a, Figure 6a, Figure 7a, Figure 8a, Figure 9a and Figure 11a show no misclassification between SB and TR, because the TR experiments do not contain high magnitude measurements from the three-axis ACC which distinguishes the SB experiments.
Overall F1 scores for classification of PA types (SS, SB, TR) are higher than classification of APS types (NS, EAS, MS) for all models considered. The 3-axis accelerometer signal is the main signal contributing only to discrimination of PA types while the 3-axis accelerometer signal is not correlated with APS types. Sympathetic activation stimulates the sweat glands. Hence, EDA is an indicator of sweating rate, and is strongly correlated with PA intensity as well as APS level. The magnitude of the physiological variables such as HR in response to PA is more pronounced compared to APS.
The multi-task LSTM RNN model for classification of APS types (NS, EAS, MS) and PA types (SS, SB, TR) with weighted training had F1 scores of 99.8% for PA and 99.3% for APS. On the other hand, the multi-task LSTM RNN model for classification of APS types (NS, EAS, MS) types and PA types (SS, SB, TR) with ADYSN had F1 scores of 99.69% for PA and 98.83% for APS. A comparison between Figure 6 and Figure 7 reveals that adding synthetic samples based on the density and similarity between samples does not efficiently address the issue of imbalanced samples. Adding synthetic samples using ADYSN assumes the observations with high similarity will have similar labels. Although this assumption in many applications is valid, different types of APS often show similar behavior and these three classes are not simply separable. Therefore, some synthetic samples with their labels are considered as the main reason for the increased number of misclassified samples in comparison to the weighted training technique for handling the imbalanced classes.
Similarly, comparison of the performance of models trained by ADYSN-balanced samples and weighted classes were performed for the independent model architectures. As expected, the ADYSN technique is not the optimal solution for addressing the problem of imbalanced samples in the data. The high similarity between different types of APS and NS classes causes biased interpretation of the trained model from the synthetic samples.
A comparison between Figure 6 and Figure 8 illustrate the difference in architecture of the two models. In the multi-task architecture, mutual features contributing to both classes were used for the classification task. It should be noted that the number of model layers, trainable units, and other hyper parameters remain invariant. Hence, overfitting of “data-hungry” LSTM layers drops the performance of classification. However, this issue can be solved by introducing a regularization feature in trainable layers. The independent models also require performing of repeating feature engineering for each model; hence, the issue can be troublesome in model deployment in real time.
The estimated EE values for an individual subject running on the treadmill under the influence of EAS are illustrated in Figure 10. The EE estimation algorithms for both the independent LSTM RNN model and the multi-task LSTM RNN model are able to track the EE measured by the Cosmed K5 Calorimeter with high accuracy.
A significant drop in the performance of XGboost models can be observed as compared with both independent and multi-task NN architectures. Training XGboosted trees is a challenging task and requires constant monitoring of models to avoid the problem of overfitting as well as biased model training. For both XGboost models, off-diagonal predictions in the confusion matrices Figure 11b and Figure 12b increased drastically. Apart from biased predictions that stemmed from synthetic samples, a range number of samples were misclassified as NS events. A major difference between the two models is the time series structures in RNN models while XGboost models only trained on a single slice of the data and no past time windows were used in the model. Since different episodes of APS and PA take place in piece-wise patterns, the recurrent model is a better choice for modeling from these types of measurements, as RNN models capture the dynamic behavior in estimating the probability of the classes. In contrast, the trained XGboost only predicts probabilities based on the current snapshot of biosignals and as a consequence, non-smooth predictions and more oscillations between the predicted classes are anticipated.
A limitation of the current work is that the EE data collected during MS experiments are not sufficient to include MS type in the case of multi-task LSTM RNN classification of APS types and PA types and estimation of EE. The presented approach can cover the common PA in daily life. Future work will extend the presented approach to include other classification scenarios to obtain an accurate classification during all kinds of daily activities.
Incorporating information on the type and intensity of PA in diabetes therapies improves time in range (TIR) and prevents hypoglycemia in people with T1D by modulating the insulin requirements to counteract the effects of PA on the blood glucose dynamics [15,57]. Additionally, incorporating information on the APS can improve treatment outcomes. Researchers have documented that athletic competition stress increases blood glucose levels and reduces insulin sensitivity in individuals with type 1 diabetes preceding and during an athletic competition in comparison to the same physical activity performed in training at the same intensity [58]. In addition to incorporation of PA information, future work will incorporate APS information in AP systems to adjust the insulin dosage in people with diabetes to account for the glycemic disturbance effects of both PA and APS.

6. Conclusions

The advantage of the multi-task learning approach is that a single model is developed and maintained instead of many independent classification and regression models. Exploiting the shared representations in the data by training one model to predict the related tasks of PA and APS jointly can improve data efficiency. We used data collected during exercise sessions and daily life activities relying only on the physiological signals measured noninvasively by Empatica E4 wristband. Random convolutional kernel transformation is employed to extract a large number of features from the time series signals. Two different feature selection techniques are used to select the most informative features, PLS-DA for the classification tasks and PLS for the regression task. In order to address the issue of the imbalanced classes, two different approaches are employed: weighted training and ADASYN. The multi-task RNN model with LSTM is developed to simultaneously classify the type of PA and estimate its intensity and classify the type of APS. Multi-task LSTM RNN classification of APS types (NS, EAS, MS) and PA types (SS, SB, TR) with weighted training achieved the highest F1 score for both APS and PA types. A multi-task XGBoost model is developed to simultaneously classify the type of PA and the type of APS where the multitask XGBoost achieved higher F1 scores in comparison to the independent XGBoost. The results illustrate that multi-task NN and multi-task XGBoost can effectively assess the signals from wearable sensors and effectively enhance the detection of PA and APS.

Author Contributions

Conceptualization, M.M.R., M.R.A. and A.C.; methodology, M.A.-L. and M.R.A.; software, M.A.-L. and M.R.A.; validation, M.A.-L., M.M.R. and M.R.A.; formal analysis, M.A.-L., M.M.R., M.R.A. and A.C.; investigation, M.R.A., M.A.-L., M.M.R. and A.C.; resources, L.Q. and A.C.; data curation, M.P., L.S., L.Q. and M.R.A.; writing—original draft preparation, M.A.-L., M.M.R. and A.C.; writing—review and editing, M.A.-L., M.M.R., A.C., M.P., L.S. and L.Q.; visualization, M.R.A.; supervision, A.C., L.S. and L.Q.; project administration, M.P. and M.R.A.; funding acquisition, A.C. and L.Q. All authors have read and agreed to the published version of the manuscript.

Funding

Financial support from the NIH under the grants 1DP3DK101075 and 1R01DK130049, and JDRF under grant 2-SRA−2017–506-M-B made possible through collaboration between the JDRF and the Leona M. and Harry B. Helmsley Charitable Trust is gratefully acknowledged.

Institutional Review Board Statement

The studies were conducted in accordance with the Declaration of Helsinki, and approved by the Institutional Review Board of Illinois Institute of Technology (Protocol code IRB 2019–018, 16 October 2019) and the Institutional Review Board of University of Illinois Chicago (Protocol # 2018–0989, 23 December 2019).

Informed Consent Statement

Informed consent was obtained from all subjects involved in the study.

Data Availability Statement

The models were developed in open-source Python libraries and the trained models are available at the GitHub public repository https://github.com/rezaaskary/MDPIAlgorithms.git.

Acknowledgments

Ali Cinar is grateful for funds provided by the Hyosung S. R. Cho Endowed Chair at Illinois Institute of Technology. Research reported in this publication was partially supported by the National Institute of Diabetes and Digestive and Kidney Diseases of the National Institutes of Health under Award Numbers 1DP3DK101075 and 1R01DK130049. The content is solely the responsibility of the authors.

Conflicts of Interest

The authors declare no conflict of interest. The funders had no role in the design of the study; in the collection, analyses, or interpretation of data; in the writing of the manuscript; or in the decision to publish the results.

Appendix A

Table A1. Precision, Recall, and F1 score for PA Classification using (LSTM models).
Precision (%)
ModelSSSBTRMean
Multi-task LSTM RNN model designed to simultaneously perform
classification of APS types (NS, EAS), classification of PA types (SS, SB, TR) and estimation of EE.
91.4310099.7597.06
Multi-task LSTM RNN model for classification of APS types (NS, EAS, MS) and PA types (SS, SB, TR) with Weighted Training.99.9999.499.6699.68
Multi-task LSTM RNN model for classification of APS types (NS, EAS, MS) and PA types (SS, SB, TR) with ADYSN99.9699.4599.3299.58
Independent LSTM RNN model for classification of PA types (SS, SB, TR) with Weighted Training.99.9399.1899.3299.47
Independent LSTM RNN model for classification of PA types (SS, SB, TR) with ADYSN.99.9399.6699.1899.59
Recall (%)
ModelSSSBTRMean
Multi-task LSTM RNN model designed to simultaneously perform
classification of APS types (NS, EAS), classification of PA types (SS, SB, TR) and estimation of EE.
98.4699.1299.599.03
Multi-task LSTM RNN model for classification of APS types (NS, EAS, MS) and PA types (SS, SB, TR) with Weighted Training.99.9199.9399.9399.93
Multi-task LSTM RNN model for classification of APS types (NS, EAS, MS) and PA types (SS, SB, TR) with ADYSN99.8999.8699.6699.8
Independent LSTM RNN model for classification of PA types (SS, SB, TR) with Weighted Training.99.8699.8699.3299.68
Independent LSTM RNN model for classification of PA types (SS, SB, TR) with ADYSN.99.8999.7999.3899.69
F1 Score (%)
ModelSSSBTRMean
Multi-task LSTM RNN model designed to simultaneously perform
classification of APS types (NS, EAS), classification of PA types (SS, SB, TR) and estimation of EE.
94.8199.5699.6398.00
Multi-task LSTM RNN model for classification of APS types (NS, EAS, MS) and PA types (SS, SB, TR) with Weighted Training.99.9599.6799.899.8
Multi-task task LSTM RNN model for classification of APS types (NS, EAS, MS) and PA types (SS, SB, TR) with ADYSN.99.9299.6699.4999.69
Independent LSTM RNN model for classification of PA types (SS, SB, TR) with Weighted Training.99.8999.5299.3299.58
Independent LSTM RNN model for classification of PA types (SS, SB, TR) with ADYSN.99.9199.7399.2899.64
Table A2. Precision, Recall, and F1 score for APS Classification (LSTM models).
Precision (%)
ModelNSEASMSMean
Multi-task LSTM RNN model designed to simultaneously perform
classification of APS types (NS, EAS), classification of PA types (SS, SB, TR) and estimation of EE.
97.5100-98.75
Multi-task LSTM RNN model for classification of APS types (NS, EAS, MS) and PA types (SS, SB, TR) with Weighted Training.98.9199.7199.0699.23
Multi-task LSTM RNN model for classification of APS types (NS, EAS, MS) and PA types (SS, SB, TR) with ADYSN.98.0199.5898.4198.67
Independent LSTM RNN model for classification of APS types (NS, EAS, MS) with Weighted Training.97.9899.7397.7998.5
Independent LSTM RNN model for classification of APS types (NS, EAS, MS) with ADYSN.96.7799.397.6397.9
Recall (%)
ModelNSEASMSMean
Multi-task LSTM RNN model designed to simultaneously perform
classification of APS types (NS, EAS), classification of PA types (SS, SB, TR) and estimation of EE.
10098.43-99.21
Multi-task LSTM RNN model for classification of APS types (NS, EAS, MS) and PA types (SS, SB, TR) with Weighted Training.98.7499.699.7899.38
Multi-task LSTM RNN model for classification of APS types (NS, EAS, MS) and PA types (SS, SB, TR) with ADYSN.98.6899.399.0299.0
Independent LSTM RNN model for classification of APS types (NS, EAS, MS) with Weighted Training.98.8199.1799.5399.17
Independent LSTM RNN model for classification of APS types (NS, EAS, MS) with ADYSN.97.7998.8898.5598.41
F1 Score (%)
ModelNSEASMSMean
Multi-task LSTM RNN model designed to simultaneously perform
classification of APS types (NS, EAS), classification of PA types (SS, SB, TR) and estimation of EE.
98.7399.21-98.97
Multi-task LSTM RNN model for classification of APS types (NS, EAS, MS) and PA types (SS, SB, TR) with Weighted Training.98.8399.6699.4299.3
Multi-task LSTM RNN model for classification of APS types (NS, EAS, MS) and PA types (SS, SB, TR) with ADYSN.98.3499.4498.7298.83
Independent LSTM RNN model for classification of APS types (NS, EAS, MS) with Weighted Training.98.3999.4598.6598.83
Independent LSTM RNN model for classification of APS types (NS, EAS, MS) with ADYSN.97.2899.0998.0998.15
Table A3. Precision, Recall, and F1 score for PA Classification (XGBoost models).
Precision (%)
ModelSSSBTRMean
Multi-task XGBoost model for classification of APS types (NS, EAS, MS) and PA types (SS, SB, TR) with ADYSN.99.9510099.9399.96
Independent XGBoost model for classification of PA types (SS, SB, TR) with ADYSN.99.9099.8699.5299.76
Recall (%)
ModelSSSBTRMean
Multi-task XGBoost model for classification of APS types (NS, EAS, MS) and PA types (SS, SB, TR) with ADYSN.99.9999.7999.6699.82
Independent XGBoost model for classification of PA types (SS, SB, TR) with ADYSN.99.9599.6699.1899.60
F1 Score (%)
ModelSSSBTRMean
Multi-task XGBoost model for classification of APS types (NS, EAS, MS) and PA types (SS, SB, TR) with ADYSN.99.9799.9099.7999.89
Independent XGBoost model for classification of PA types (SS, SB, TR) with ADYSN.99.9399.7699.3599.68
Table A4. Precision, Recall, and F1score for APS Classification (XGBoost models).
Precision (%)
ModelNSEASMSMean
Multi-task XGBoost model for classification of APS types (NS, EAS, MS) and PA types (SS, SB, TR) with ADYSN.94.0299.6799.5697.75
Independent XGBoost model for classification of APS types (NS, EAS, MS) with ADYSN.89.7899.4898.3295.86
Recall (%)
ModelNSEASMSMean
Multi-task XGBoost model for classification of APS types (NS, EAS, MS) and PA types (SS, SB, TR) with ADYSN.99.3298.5798.8898.92
Independent XGBoost model for classification of APS types (NS, EAS, MS) with ADYSN.98.7197.4997.3297.84
F1 score (%)
ModelNSEASMSMean
Multi-task XGBoost model for classification of APS types (NS, EAS, MS) and PA types (SS, SB, TR) with ADYSN.96.6099.1299.2298.31
Independent XGBoost model for classification of APS types (NS, EAS, MS) with ADYSN.94.0398.4797.8196.77

References

  1. Zhai, J.; Barreto, A. Stress Detection in Computer Users Based on Digital Signal Processing of Noninvasive Physiological Variables. In Proceedings of the Annual International Conference of the IEEE Engineering in Medicine and Biology, New York, NY, USA, 30 August–3 September 2006. [Google Scholar]
  2. McCarthy, C.; Pradhan, N.; Redpath, C.; Adler, A. Validation of the Empatica E4 Wristband. In Proceedings of the 2016 IEEE EMBS International Student Conference: Expanding the Boundaries of Biomedical Engineering and Healthcare, ISC 2016—Proceedings, Ottawa, ON, Canada, 29–31 May 2016. [Google Scholar]
  3. Sevil, M.; Rashid, M.; Askari, M.R.; Maloney, Z.; Hajizadeh, I.; Cinar, A. Detection and Characterization of Physical Activity and Psychological Stress from Wristband Data. Signals 2020, 1, 188–208. [Google Scholar] [CrossRef]
  4. Sevil, M.; Rashid, M.; Maloney, Z.; Hajizadeh, I.; Samadi, S.; Askari, M.R.; Hobbs, N.; Brandt, R.; Park, M.; Quinn, L.; et al. Determining Physical Activity Characteristics from Wristband Data for Use in Automated Insulin Delivery Systems. IEEE Sens. J. 2020, 20, 12859–12870. [Google Scholar] [CrossRef] [PubMed]
  5. Sevil, M.; Rashid, M.; Hajizadeh, I.; Askari, M.R.; Hobbs, N.; Brandt, R.; Park, M.; Quinn, L.; Cinar, A. Discrimination of Simultaneous Psychological and Physical Stressors Using Wristband Biosignals. Comput. Methods Programs Biomed. 2021, 199, 105898. [Google Scholar] [CrossRef]
  6. Askari, M.R.; Abdel-Latif, M.; Rashid, M.; Sevil, M.; Cinar, A. Detection and Classification of Unannounced Physical Activities and Acute Psychological Stress Events for Interventions in Diabetes Treatment. Algorithms 2022, 15, 352. [Google Scholar] [CrossRef]
  7. Van Houdt, G.; Mosquera, C.; Nápoles, G. A Review on the Long Short-Term Memory Model. Artif. Intell. Rev. 2020, 53, 5929–5955. [Google Scholar] [CrossRef]
  8. Batista, G.E.A.P.A.; Prati, R.C.; Monard, M.C. A Study of the Behavior of Several Methods for Balancing Machine Learning Training Data. ACM SIGKDD Explor. Newsl. 2004, 6, 20–29. [Google Scholar] [CrossRef]
  9. Zhang, Y.; Yang, Q. A Survey on Multi-Task Learning. IEEE Trans. Knowl. Data Eng. 2021, 34, 5586–5609. [Google Scholar] [CrossRef]
  10. Jeong, D.U.; Lim, K.M. Combined Deep CNN-LSTM Network-Based Multitasking Learning Architecture for Noninvasive Continuous Blood Pressure Estimation Using Difference in ECG-PPG Features. Sci. Rep. 2021, 11, 13539. [Google Scholar] [CrossRef]
  11. Vandenhende, S.; Georgoulis, S.; Van Gansbeke, W.; Proesmans, M.; Dai, D.; Van Gool, L. Multi-Task Learning for Dense Prediction Tasks: A Survey. IEEE Trans. Pattern Anal. Mach. Intell. 2022, 44, 3614–3633. [Google Scholar] [CrossRef]
  12. Varghese, N.V.; Mahmoud, Q.H. A Survey of Multi-Task Deep Reinforcement Learning. Electronics 2020, 9, 1363. [Google Scholar] [CrossRef]
  13. Sevil, M.; Rashid, M.; Hajizadeh, I.; Park, M.; Quinn, L.; Cinar, A. Physical Activity and Psychological Stress Detection and Assessment of Their Effects on Glucose Concentration Predictions in Diabetes Management. IEEE Trans. Biomed. Eng. 2021, 68, 2251–2260. [Google Scholar] [CrossRef]
  14. Dassau, E.; Cameron, F.; Lee, H.; Bequette, B.W.; Zisser, H.; Jovanovič, L.; Chase, H.P.; Wilson, D.M.; Buckingham, B.A.; Doyle, F.J. Real-Time Hypoglycemia Prediction Suite Using Continuous Glucose Monitoring: A Safety Net for the Artificial Pancreas. Diabetes Care 2010, 33, 1249–1254. [Google Scholar] [CrossRef] [PubMed] [Green Version]
  15. Turksoy, K.; Hajizadeh, I.; Hobbs, N.; Kilkus, J.; Littlejohn, E.; Samadi, S.; Feng, J.; Sevil, M.; Lazaro, C.; Ritthaler, J.; et al. Multivariable Artificial Pancreas for Various Exercise Types and Intensities. Diabetes Technol. Ther. 2018, 20, 662–671. [Google Scholar] [CrossRef] [PubMed]
  16. Hajizadeh, I.; Rashid, M.; Samadi, S.; Sevil, M.; Hobbs, N.; Brandt, R.; Cinar, A. Adaptive Personalized Multivariable Artificial Pancreas Using Plasma Insulin Estimates. J. Process. Control 2019, 80, 26–40. [Google Scholar] [CrossRef]
  17. Ollander, S.; Godin, C.; Campagne, A.; Charbonnier, S. A Comparison of Wearable and Stationary Sensors for Stress Detection. In Proceedings of the 2016 IEEE International Conference on Systems, Man, and Cybernetics, SMC 2016—Conference Proceedings, Budapest, Hungary, 9–12 October 2016. [Google Scholar]
  18. Mozos, O.M.; Sandulescu, V.; Andrews, S.; Ellis, D.; Bellotto, N.; Dobrescu, R.; Ferrandez, J.M. Stress Detection Using Wearable Physiological and Sociometric Sensors. Int. J. Neural Syst. 2017, 27, 1650041. [Google Scholar] [CrossRef] [Green Version]
  19. Cvetković, B.; Gjoreski, M.; Šorn, J.; Maslov, P.; Kosiedowski, M.; Bogdański, M.; Stroiński, A.; Luštrek, M. Real-Time Physical Activity and Mental Stress Management with a Wristband and a Smartphone. In Proceedings of the UbiComp/ISWC 2017—Adjunct Proceedings of the 2017 ACM International Joint Conference on Pervasive and Ubiquitous Computing and Proceedings of the 2017 ACM International Symposium on Wearable Computers, Maui, HI, USA, 11–15 September 2017. [Google Scholar]
  20. Can, Y.S.; Arnrich, B.; Ersoy, C. Stress Detection in Daily Life Scenarios Using Smart Phones and Wearable Sensors: A Survey. J. Biomed. Inform. 2019, 92, 103139. [Google Scholar] [CrossRef]
  21. Minguillon, J.; Perez, E.; Lopez-Gordo, M.A.; Pelayo, F.; Sanchez-Carrion, M.J. Portable System for Real-Time Detection of Stress Level. Sensors 2018, 18, 2504. [Google Scholar] [CrossRef] [Green Version]
  22. Haak, M.; Bos, S.; Panic, S.; Rothkrantz, L.J.M. Detecting Stress Using Eye Blinks and Brain Activity from EEG Signals. In Proceedings of the Game-On 2009, Düsseldorf, Germany, 26–28 November 2009. [Google Scholar]
  23. Kurniawan, H.; Maslov, A.V.; Pechenizkiy, M. Stress Detection from Speech and Galvanic Skin Response Signals. In Proceedings of the Proceedings of CBMS 2013—26th IEEE International Symposium on Computer-Based Medical Systems, Porto, Portugal, 20–22 June 2013. [Google Scholar]
  24. Sanchez, A.; Vazquez, C.; Marker, C.; LeMoult, J.; Joormann, J. Attentional Disengagement Predicts Stress Recovery in Depression: An Eye-Tracking Study. J. Abnorm. Psychol. 2013, 122, 303–313. [Google Scholar] [CrossRef] [Green Version]
  25. Perez-Suarez, I.; Martin-Rincon, M.; Gonzalez-Henriquez, J.J.; Fezzardi, C.; Perez-Regalado, S.; Galvan-Alvarez, V.; Juan-Habib, J.W.; Morales-Alamo, D.; Calbet, J.A.L. Accuracy and Precision of the COSMED K5 Portable Analyser. Front. Physiol. 2018, 9, 1764. [Google Scholar] [CrossRef]
  26. PLUX Biosignals. Available online: https://www.pluxbiosignals.com/ (accessed on 20 December 2022).
  27. He, H.; Bai, Y.; Garcia, E.A.; Li, S. ADASYN: Adaptive Synthetic Sampling Approach for Imbalanced Learning. In Proceedings of the 2008 International Joint Conference on Neural Networks, Hong Kong, China, 1–8 June 2008. [Google Scholar]
  28. Kurniawati, Y.E.; Permanasari, A.E.; Fauziati, S. Adaptive Synthetic-Nominal (ADASYN-N) and Adaptive Synthetic-KNN (ADASYN-KNN) for Multiclass Imbalance Learning on Laboratory Test Data. In Proceedings of the Proceedings—2018 4th International Conference on Science and Technology, ICST 2018, Yogyakarta, Indonesia, 7–8 August 2018. [Google Scholar]
  29. Sevil, M.; Rashid, M.; Hajizadeh, I.; Maloney, Z.; Samadi, S.; Askari, M.R.; Brandt, R.; Hobbs, N.; Park, M.; Quinn, L.; et al. Assessing the Effects of Stress Response on Glucose Variations. In Proceedings of the 2019 IEEE 16th International Conference on Wearable and Implantable Body Sensor Networks, BSN 2019—Proceedings, Chicago, IL, USA, 19–22 May 2019. [Google Scholar]
  30. Sierra, A.D.S.; Ávila, C.S.; Casanova, J.G.; Pozo, G.B. Del A Stress-Detection System Based on Physiological Signals and Fuzzy Logic. IEEE Trans. Ind. Electron. 2011, 58, 4857–4865. [Google Scholar] [CrossRef] [Green Version]
  31. Rincon, J.A.; Julian, V.; Carrascosa, C.; Costa, A.; Novais, P. Detecting Emotions through Non-Invasive Wearables. Log. J. IGPL 2018, 26, 605–617. [Google Scholar] [CrossRef]
  32. Zheng, B.S.; Murugappan, M.; Yaacob, S. Human Emotional Stress Assessment through Heart Rate Detection in a Customized Protocol Experiment. In Proceedings of the ISIEA 2012–2012 IEEE Symposium on Industrial Electronics and Applications, Bandung, Indonesia, 23–26 September 2012. [Google Scholar]
  33. Shi, Y.; Nguyen, M.H.; Blitz, P.; French, B.; Fisk, S.; De la Torre, F.; Smailagic, A.; Siewiorek, D.P. Personalized Stress Detection from Physiological Measurements. In Proceedings of the Second International Symposium on Quality of Life Technology, Las Vegas, NV, USA, 26–30 June 2010. [Google Scholar]
  34. Spielberger, C.D.; Reheiser, E.C. Measuring Anxiety, Anger, Depression, and Curiosity as Emotional States and Personality Traits with the STAI, STAXI and STPI. Compr. Handb. Psychol. Assess. Personal. Assess. 2004, 2, 70–86. [Google Scholar]
  35. Spielberger, C.D.; Sydeman, S.J.; Owen, A.E.; Marsh, B.J. Measuring Anxiety and Anger with the State-Trait Anxiety Inventory (STAI) and the State-Trait Anger Expression Inventory (STAXI). In The Use of Psychological Testing for Treatment Planning and Outcomes Assessment, 2nd ed.; Lawrence Erlbaum Associates Publishers: Mahwah, NJ, USA, 1999. [Google Scholar]
  36. Marteau, T.M.; Bekker, H. The Development of a Six-item Short-form of the State Scale of the Spielberger State—Trait Anxiety Inventory (STAI). Br. J. Clin. Psychol. 1992, 31, 301–306. [Google Scholar] [CrossRef] [PubMed]
  37. Antonsson, E.K.; Mann, R.W. The Frequency Content of Gait. J. Biomech. 1985, 18, 39–47. [Google Scholar] [CrossRef] [PubMed]
  38. Dempster, A.; Petitjean, F.; Webb, G.I. ROCKET: Exceptionally Fast and Accurate Time Series Classification Using Random Convolutional Kernels. Data Min. Knowl. Discov. 2020, 34, 1454–1495. [Google Scholar] [CrossRef]
  39. Faouzi, J.; Janati, H. Pyts: A Python Package for Time Series Classification. J. Mach. Learn. Res. 2020, 21, 1720–1725. [Google Scholar]
  40. Sainath, T.N.; Vinyals, O.; Senior, A.; Sak, H. Convolutional, Long Short-Term Memory, Fully Connected Deep Neural Networks. In Proceedings of the ICASSP, IEEE International Conference on Acoustics, Speech and Signal Processing, South Brisbane, Australia, 19–24 April 2015; Volume 2015. [Google Scholar]
  41. Bai, S.; Kolter, J.Z.; Koltun, V. An Empirical Evaluation of Generic Convolutional and Recurrent Networks for Sequence Modeling. arXiv 2018, arXiv:1803.01271. [Google Scholar]
  42. Askari, M.R.; Rashid, M.; Sevil, M.; Hajizadeh, I.; Brandt, R.; Samadi, S.; Cinar, A. Artifact Removal from Data Generated by Nonlinear Systems: Heart Rate Estimation from Blood Volume Pulse Signal. Ind. Eng. Chem. Res. 2020, 59, 2318–2327. [Google Scholar] [CrossRef]
  43. Askari, M.R.; Hajizadeh, I.; Sevil, M.; Rashid, M.; Hobbs, N.; Brandt, R.; Sun, X.; Cinar, A. Application of Neural Networks for Heart Rate Monitoring. IFAC-PapersOnLine 2020, 53, 16161–16166. [Google Scholar] [CrossRef]
  44. Tipping, M.E.; Bishop, C.M. Mixtures of Probabilistic Principal Component Analyzers. Neural Comput. 1999, 11, 443–482. [Google Scholar] [CrossRef]
  45. Tipping, M.E.; Bishop, C.M. Probabilistic Principal Component Analysis. J. R. Stat. Soc. Ser. B Stat. Methodol. 1999, 61, 611–622. [Google Scholar] [CrossRef] [Green Version]
  46. Balakrishnama, S.; Ganapathiraju, A.; Picone, J. Linear Discriminant Analysis for Signal Processing Problems. In Proceedings of the Conference Proceedings—IEEE Southeastcon, Lexington, KY, USA, 25–28 March 1999; Volume 1999. [Google Scholar]
  47. Abiodun, O.I.; Jantan, A.; Omolara, A.E.; Dada, K.V.; Mohamed, N.A.E.; Arshad, H. State-of-the-Art in Artificial Neural Network Applications: A Survey. Heliyon 2018, 4, e00938. [Google Scholar] [CrossRef] [Green Version]
  48. Tealab, A. Time Series Forecasting Using Artificial Neural Networks Methodologies: A Systematic Review. Future Comput. Inform. J. 2018, 3, 334–340. [Google Scholar] [CrossRef]
  49. Shewalkar, A.; Nyavanandi, D.; Ludwig, S.A. Performance Evaluation of Deep Neural Networks Applied to Speech Recognition: Rnn, LSTM and GRU. J. Artif. Intell. Soft Comput. Res. 2019, 9, 235–245. [Google Scholar] [CrossRef] [Green Version]
  50. Gers, F.A.; Schmidhuber, J.; Cummins, F. Learning to Forget: Continual Prediction with LSTM. Neural Comput. 2000, 12, 2451–2471. [Google Scholar] [CrossRef] [PubMed]
  51. Dahl, G.E.; Sainath, T.N.; Hinton, G.E. Improving Deep Neural Networks for LVCSR Using Rectified Linear Units and Dropout. In Proceedings of the ICASSP, IEEE International Conference on Acoustics, Speech and Signal Processing, Vancouver, BC, Canada, 26–31 May 2013. [Google Scholar]
  52. Kukar, M.; Kononenko, I. Cost-Sensitive Learning with Neural Networks. In Proceedings of the 13th European Conference on Artificail Intelligence, Brighton, UK, 23–28 August 1998. [Google Scholar]
  53. Zhou, Z.H.; Liu, X.Y. Training Cost-Sensitive Neural Networks with Methods Addressing the Class Imbalance Problem. IEEE Trans. Knowl. Data Eng. 2006, 18, 63–77. [Google Scholar] [CrossRef]
  54. Chen, T.; Guestrin, C. XGBoost: A Scalable Tree Boosting System. In Proceedings of the 22nd ACM SIGKDD International Conference on Knowledge Discovery and Data Mining, San Francisco, CA, USA, 13–17 August 2016; pp. 785–794. [Google Scholar] [CrossRef] [Green Version]
  55. Pedregosa, F.; Varoquaux, G.; Gramfort, A.; Michel, V.; Thirion, B.; Grisel, O.; Blondel, M.; Prettenhofer, P.; Weiss, R.; Dubourg, V.; et al. Scikit-Learn: Machine Learning in Python. J. Mach. Learn. Res. 2011, 12, 2825–2830. [Google Scholar]
  56. Raschka, S. MLxtend: Providing Machine Learning and Data Science Utilities and Extensions to Python’s Scientific Computing Stack. J. Open Source Softw. 2018, 3, 638. [Google Scholar] [CrossRef]
  57. Hajizadeh, I.; Rashid, M.; Turksoy, K.; Samadi, S.; Feng, J.; Sevil, M.; Hobbs, N.; Lazaro, C.; Maloney, Z.; Littlejohn, E.; et al. Incorporating Unannounced Meals and Exercise in Adaptive Learning of Personalized Models for Multivariable Artificial Pancreas Systems. J. Diabetes Sci. Technol. 2018, 12, 953–966. [Google Scholar] [CrossRef] [Green Version]
  58. Hobbs, N.; Brandt, R.; Maghsoudipour, S.; Sevil, M.; Rashid, M.; Quinn, L.; Cinar, A. Obs5ervational Study of Glycemic Impact of Anticipatory and Early-Race Athletic Competition Stress in Type 1 Diabetes. Front. Clin. Diabetes Healthc. 2022, 3, 816316. [Google Scholar] [CrossRef]
Figure 1. A schematic representation of the data acquisition system for the data collection.
Signals 04 00009 g001
Figure 2. The schematic representation of windowing of different physiological variables.
Signals 04 00009 g002
Figure 3. The pipeline of the signal processing for ROCKET feature extraction.
Signals 04 00009 g003
Figure 4. (a) Multi-Task LSTM RNN model architecture for simultaneous classification of APS types (NS, EAS) or (NS, EAS, MS) and PA types (SS, SB, TR) and estimation of EE; (b) Multi-task LSTM RNN model architecture for simultaneous classification of APS types (NS, EAS, MS) and PA types (SS, SB, TR); (c) Independent LSTM RNN model architecture for classification of APS types (NS, EAS, MS) or PA types (SS, SB, TR); (d) Independent LSTM RNN model architecture for EE estimation.
Signals 04 00009 g004
Figure 5. (a) Confusion matrix of PA classification using the multi-task LSTM RNN model designed to simultaneously perform classification of APS types, classification of PA types and estimation of EE; (b) Confusion matrix of APS types using the multi-task LSTM RNN model designed to simultaneously perform classification of APS types, classification of PA types, and estimation of EE which excludes the results for MS because not enough EE data were collected during MS sessions to do the multitask classification for this case.
Signals 04 00009 g005
Figure 6. (a) Confusion matrix of PA types classification using the multi-task LSTM RNN classification of APS types and PA types (class imbalance mitigated by weighted training); (b) Confusion matrix of APS types classification using the multi-task LSTM RNN classification of APS types and PA types (weighted training).
Signals 04 00009 g006
Figure 7. (a) Confusion matrix of PA types classification using the multi-task LSTM RNN classification of APS types and PA types; (b) Confusion matrix of APS types classification using the multi-task LSTM RNN classification of APS types and PA types. Imbalanced sample classes in the training splits of both APS and PA are mitigated by ADYSN sample generation technique.
Signals 04 00009 g007
Figure 8. (a) Confusion matrix of PA types classification using the independent LSTM RNN (Weighted Training); (b) Confusion matrix of APS types classification using the independent LSTM RNN (Weighted Training). Imbalanced classes issue was mitigated by weighted learning approach.
Signals 04 00009 g008
Figure 9. (a) Confusion matrix of PA types classification using the independent LSTM RNN (class imbalance mitigated by ADYSN); (b) Confusion matrix of APS types classification using the independent LSTM RNN. Synthetic samples from training split were regenerated by using ADYSN to avoid biased model training.
Signals 04 00009 g009
Figure 10. EE estimation using an independent testing data. (a) EE estimated using the independent LSTM RNN model versus the measured EE by the indirect calorimeter. (b) EE estimated using the multi-task LSTM RNN model versus the measured EE by the indirect calorimeter.
Signals 04 00009 g010
Figure 11. (a) Confusion matrix of PA types classification using the multi-task XGBoost classification of APS types and PA types (class imbalance mitigated by ADYSN); (b) Confusion matrix of APS types classification using the multi-task XGBoost classification of APS types and PA types (ADYSN).
Signals 04 00009 g011
Figure 12. (a) Confusion matrix of PA types classification using the independent XGBoost classification (class imbalance mitigated by ADYSN); (b) Confusion matrix of APS types classification using the independent XGBoost (ADYSN).
Signals 04 00009 g012
Table 1. The characteristics of measurement devices Empatica E4, Cosmed K5, Bioplux.
DeviceSensorFrequency of Measurement
Empatica E4
Wristband
GyroscopeContinuous triple axis acceleration within ±2 g with frequency of 32 Hz
Empatica E4
Wristband
PPGContinuous BVP signal with sampling rate of 64 Hz
Empatica E4
Wristband
Infrared ThermopileContinuous ST with the sampling rate of 4 Hz
Empatica E4
Wristband
Electrodermal Continuous GSR with the frequency of 4 Hz activity sensorContinuous GSR with the sampling rate of 4 Hz
Empatica E4
Wristband
-Inter beat interval (IBI) calculated from BVP signal
(only available in the offline mode)
Empatica E4
Wristband
-Heart rate (HR) values with the sampling rate of 1 Hz
Cosmed K5
Calorimeter
VO2 measurementB-B measurement of metabolic equivalent of task (MET) values each (variant frequency)
BiopluxPPGBVP signal with the sampling rate of 1000 Hz
BiopluxECGECG signal with the sampling rate of 1000 Hz
Table 2. Detailed demographic information on participants [6].
Demographic VariableAverageMin–MaxVariance
Age25.020–3111.7
Height (cm)171.2154–18497.1
Weight (kg)61.949–82.9123.7
BMI (kg/m2)21.116.58.2
Max HR (bpm)195.0189.0–200.011.7
Table 3. Experiments Conducted for Data Collection [3].
PA with APS Inducements
PANumber of ExperimentsNumber of SubjectMinutes
SS89103172
TR57202164
SB61191713
SS with APS Inducement
APSNumber of ExperimentsNumber of SubjectMinutes
NS286846
EAS2991129
MS3261197
TR Experiments with APS Inducement
APSNumber of ExperimentsNumber of SubjectMinutes
NS28201162
EAS1212676
MS178326
SB Experiments with APS Inducement
APSNumber of ExperimentsNumber of SubjectMinutes
NS2919891
EAS2412585
MS87237
Table 4. The value of adjustable parameters used in the LSTM RNN models [6].
VariableValue/Technique
Number of units in the LSTM layer40
Dropout in the LSTM layer20%
Number of units in the dense layer40
Dropout in the dense layer20%
Number of units in the softmax layer2 or 3
Learning rate   10 5
Optimization algorithmAdam
  β 1 0.9
  β 2 0.999
ε   10 7
Batch size1000 or 10,000 approximately equal to
9% of the number of training samples
Activation functionReLU
Number of epochsVariable, depending on the target variable and the size of samples
Table 5. The size of training splits before and after applying ADASYN for balancing the training split of the data for classification tasks.
NS-SSNS-SBNS-TREAS-SSEAS-SBEAS-TRMS-SSMS-SBMS-TR
Before ADASYN10,8605641602596,7042950168415,08825593465
After ADASYN96,98596,42696,80696,70496,66796,69197,11296,59096,753
Table 6. F1-score for PA and APS Classification (LSTM RNN models).
ModelF1 Score (%) for
PA Classification
F1 Score (%) for
APS Classification
Multi-task LSTM RNN model designed to simultaneously perform classification of APS types (NS, EAS), classification of PA types (SS, SB, TR) and estimation of EE.98.0098.97
Multi-task LSTM RNN model for classification of APS types (NS, EAS, MS) and PA types (SS, SB, TR) with Weighted Training.99.899.3
Multi-task LSTM RNN model for classification of APS types (NS, EAS, MS) types and PA types (SS, SB, TR) with ADYSN.99.6998.83
Independent LSTM RNN model with Weighted Training.99.5898.83
Independent LSTM RNN model with ADYSN.99.6498.15
Table 7. F1 score for PA and APS Classification (XGBoost models).
ModelF1 Score (%) for
PA Classification
F1 Score (%) for
APS Classification
Multi-task XGBoost model for classification of APS types (NS, EAS, MS) and PA types (SS, SB, TR) with ADYSN.99.8998.31
Independent XGBoost model for classification of APS types (NS, EAS, MS) and PA types (SS, SB, TR) with ADYSN.99.6896.77
Disclaimer/Publisher’s Note: The statements, opinions and data contained in all publications are solely those of the individual author(s) and contributor(s) and not of MDPI and/or the editor(s). MDPI and/or the editor(s) disclaim responsibility for any injury to people or property resulting from any ideas, methods, instructions or products referred to in the content.

