

Performance of Phenolic-Epoxy Coatings after Exposure to High Temperatures †
 , and
, and
Abstract
:1. Introduction
2. Experimental
2.1. Materials
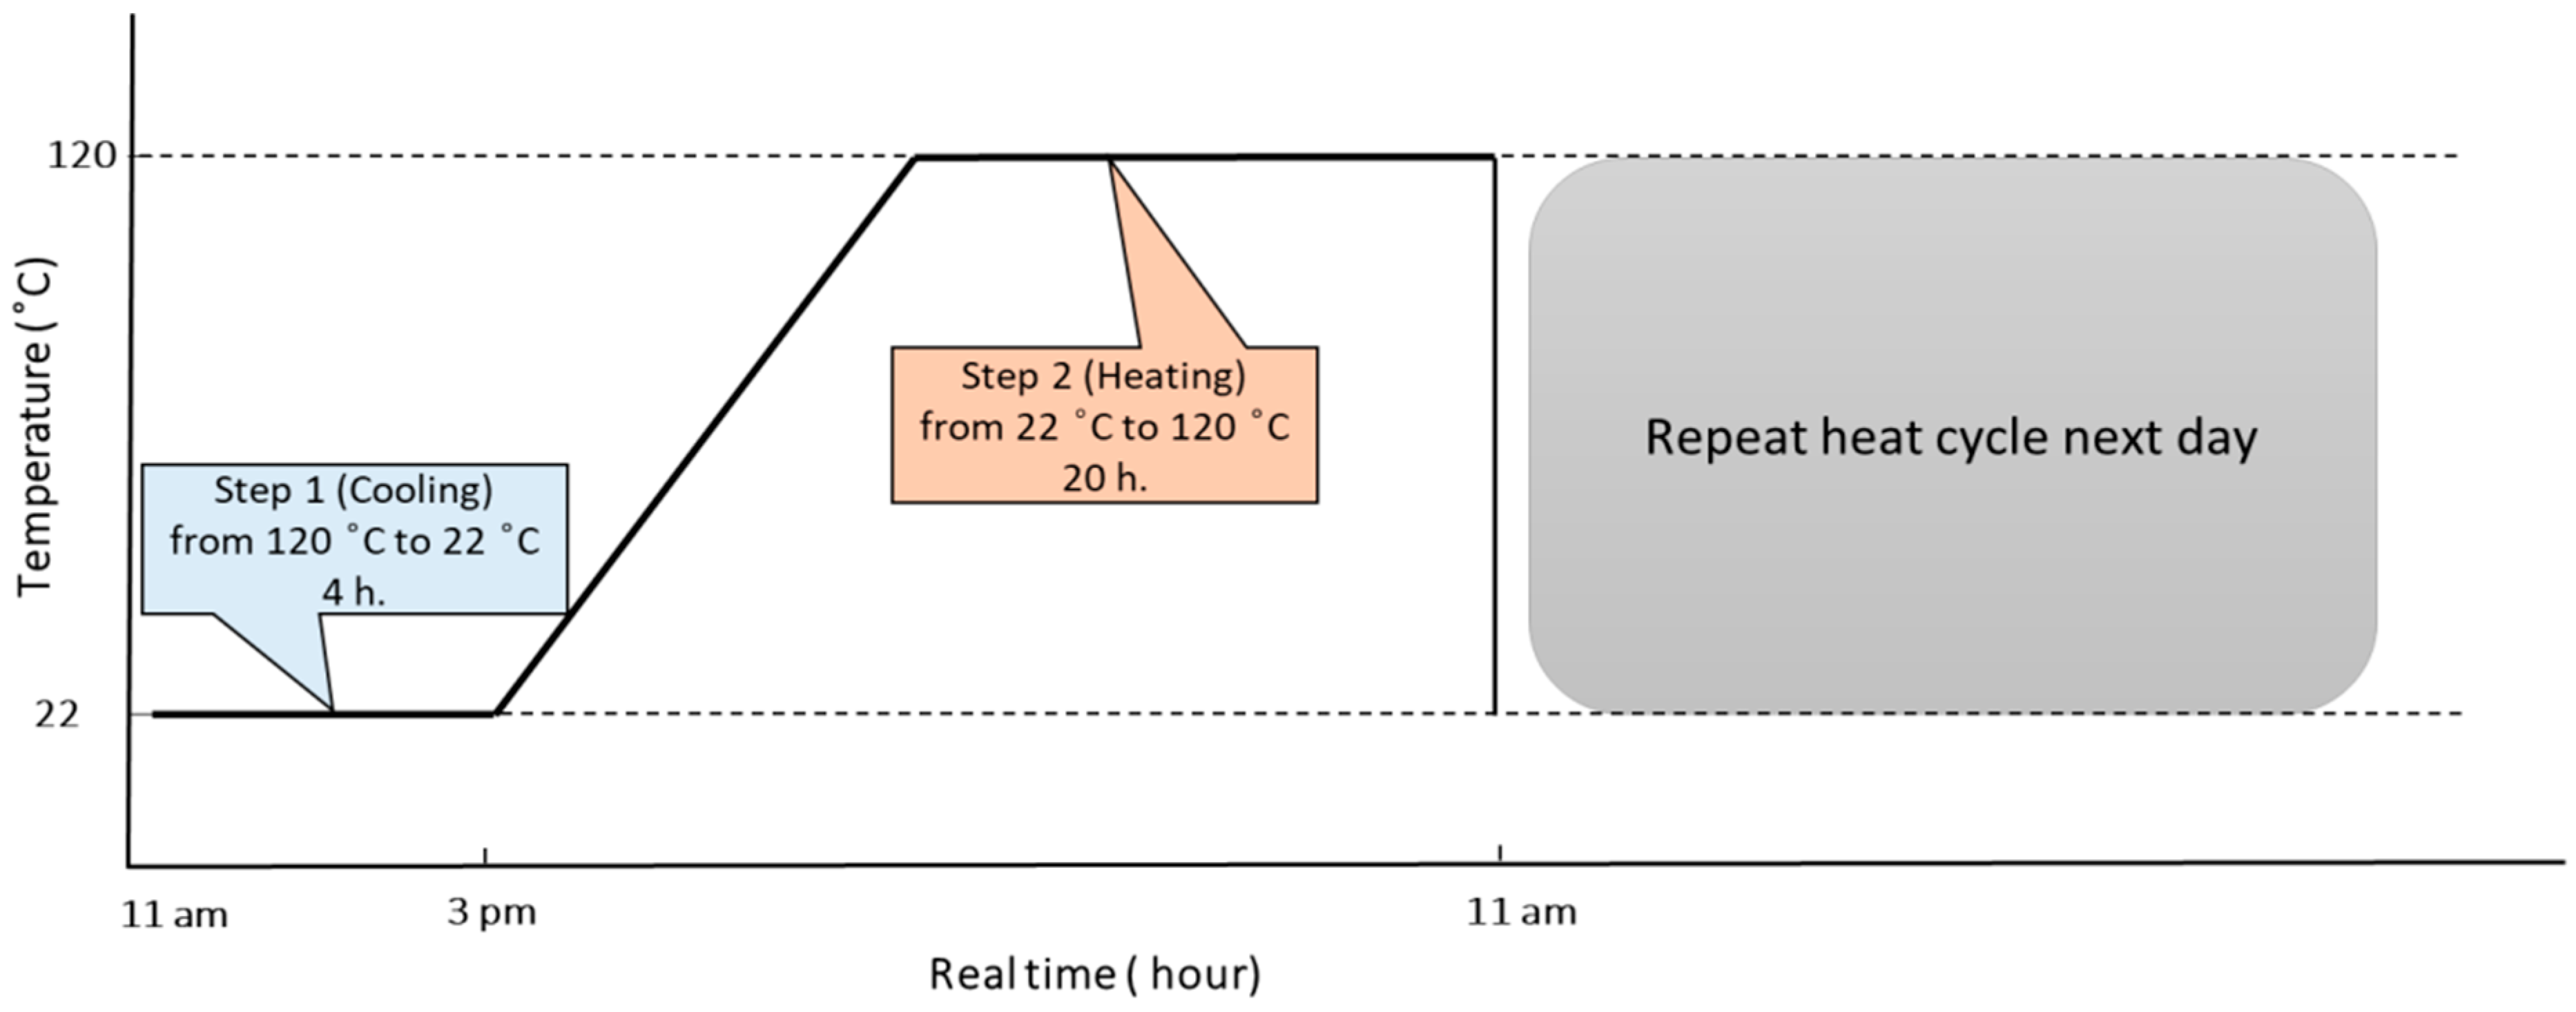
2.2. Exposure Conditions
2.3. Characterisation Techniques
2.3.1. Pull-Off Adhesion Strength
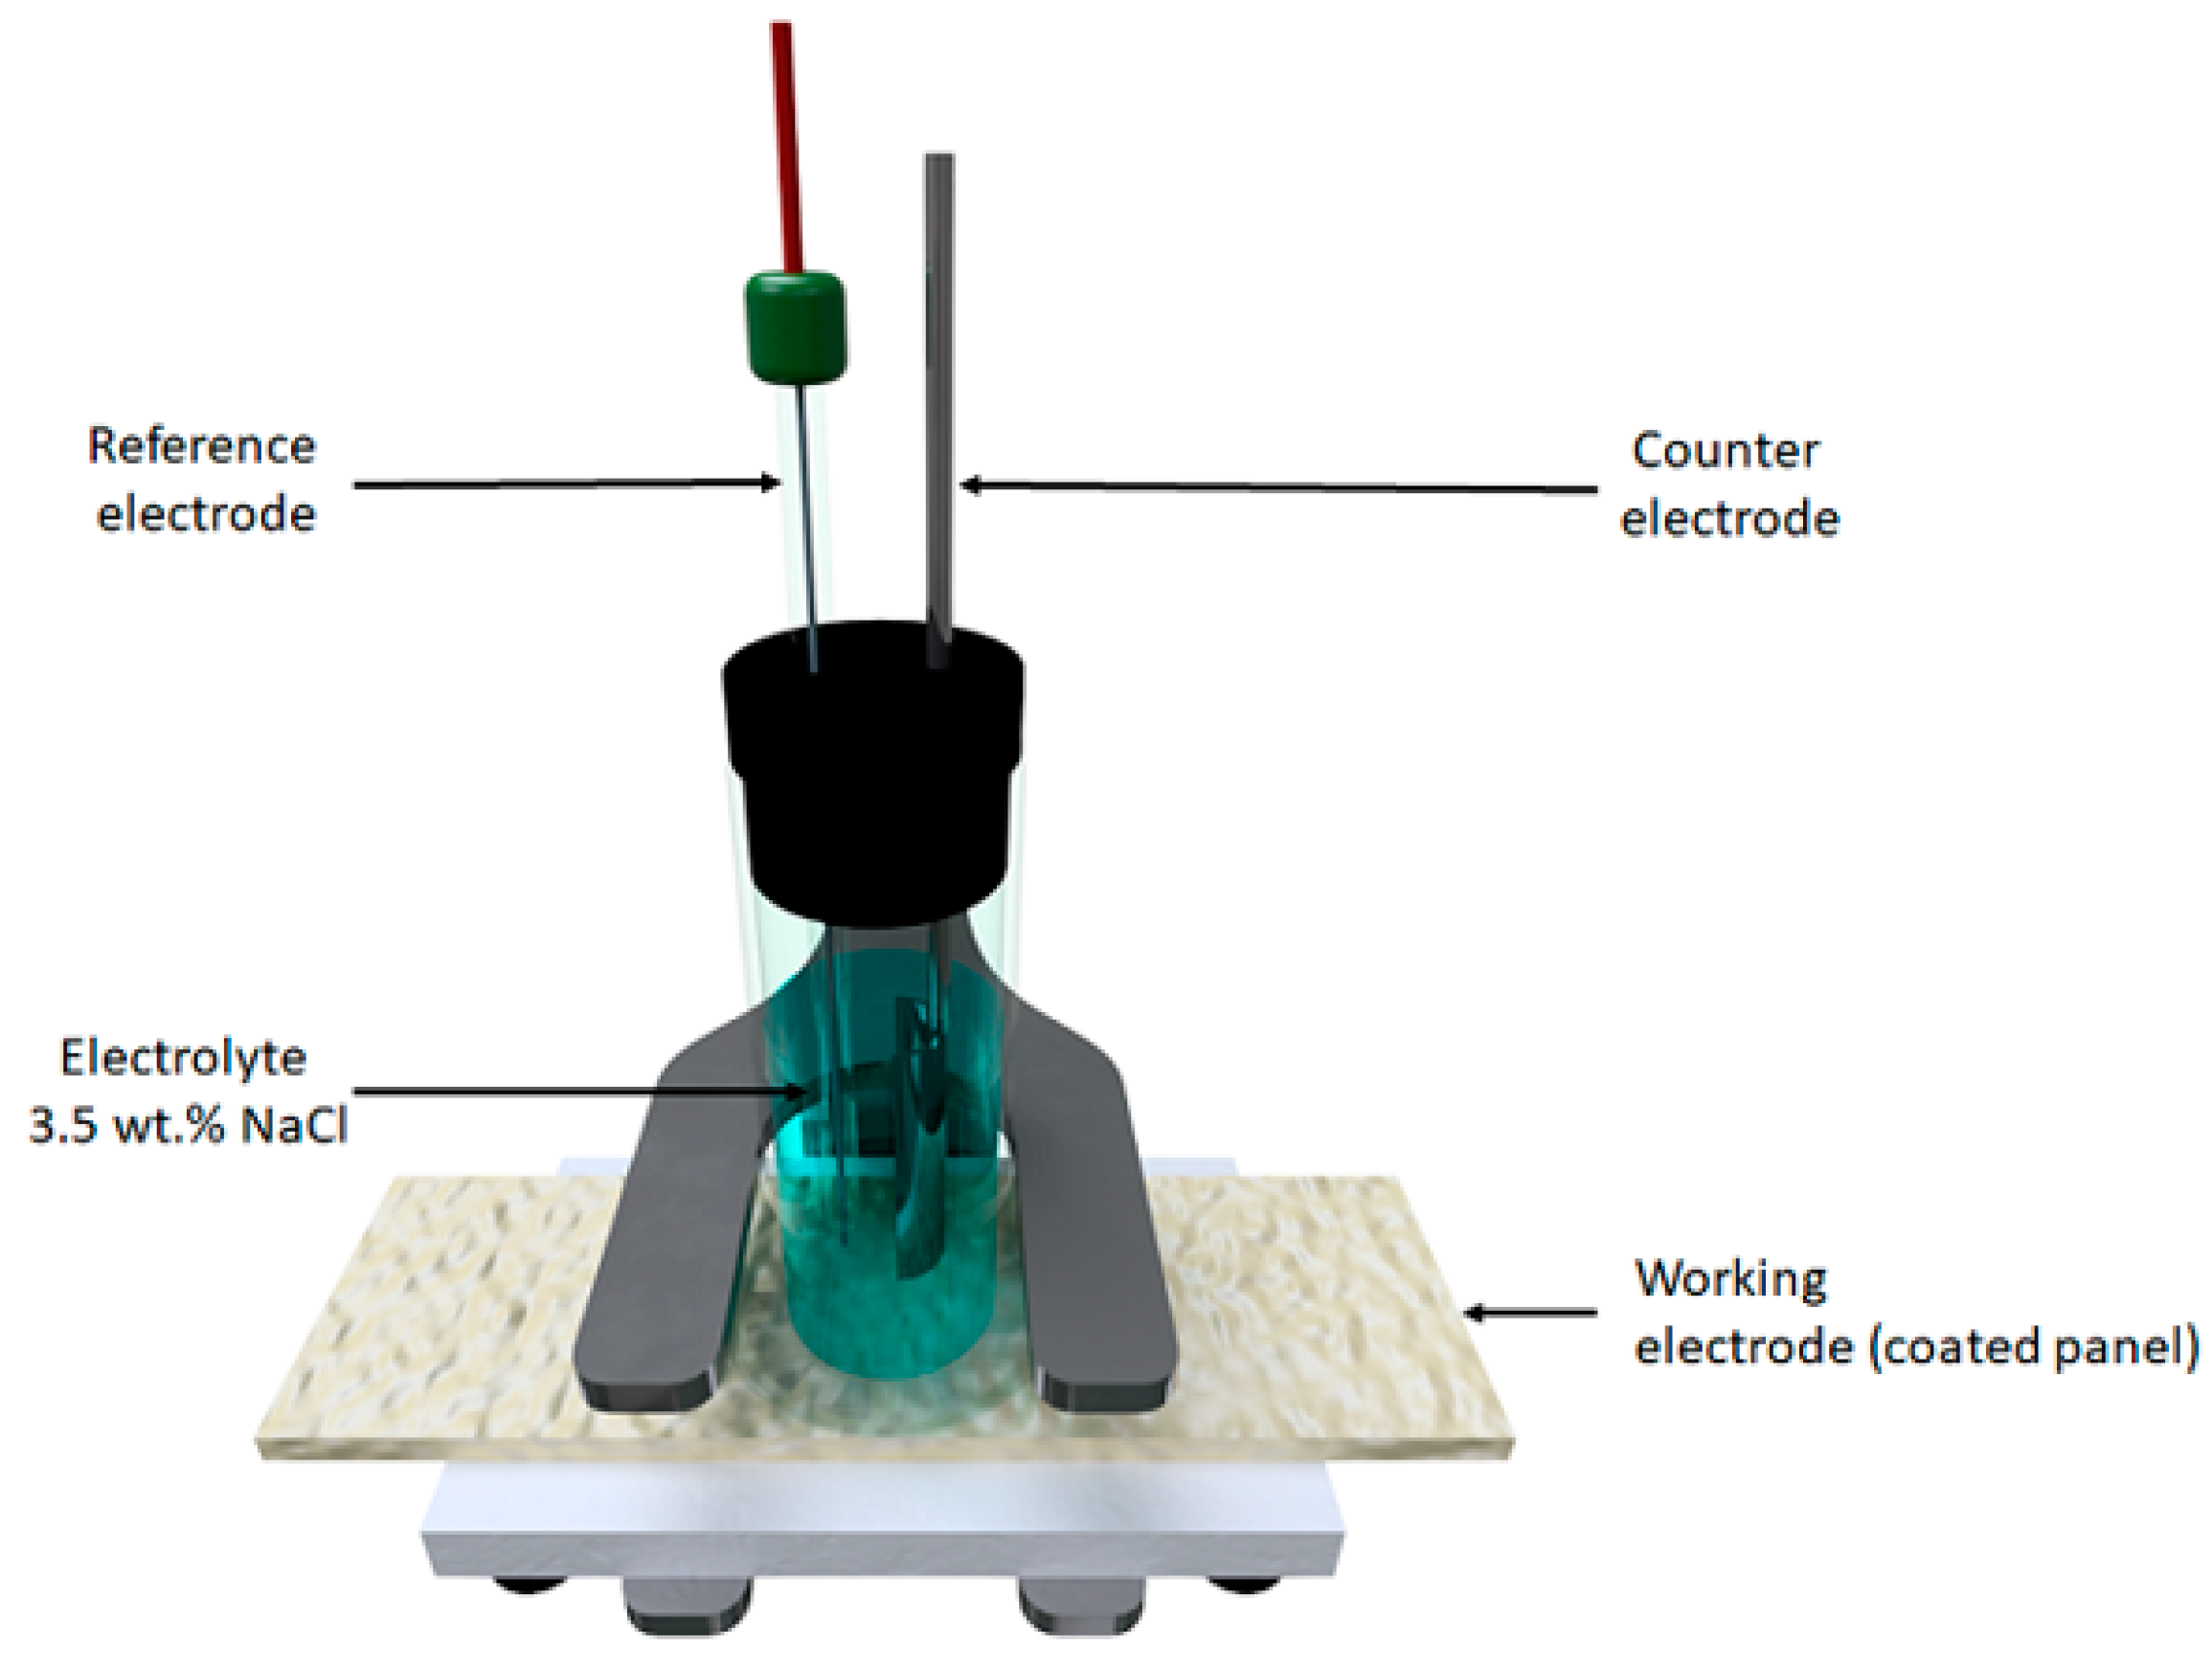
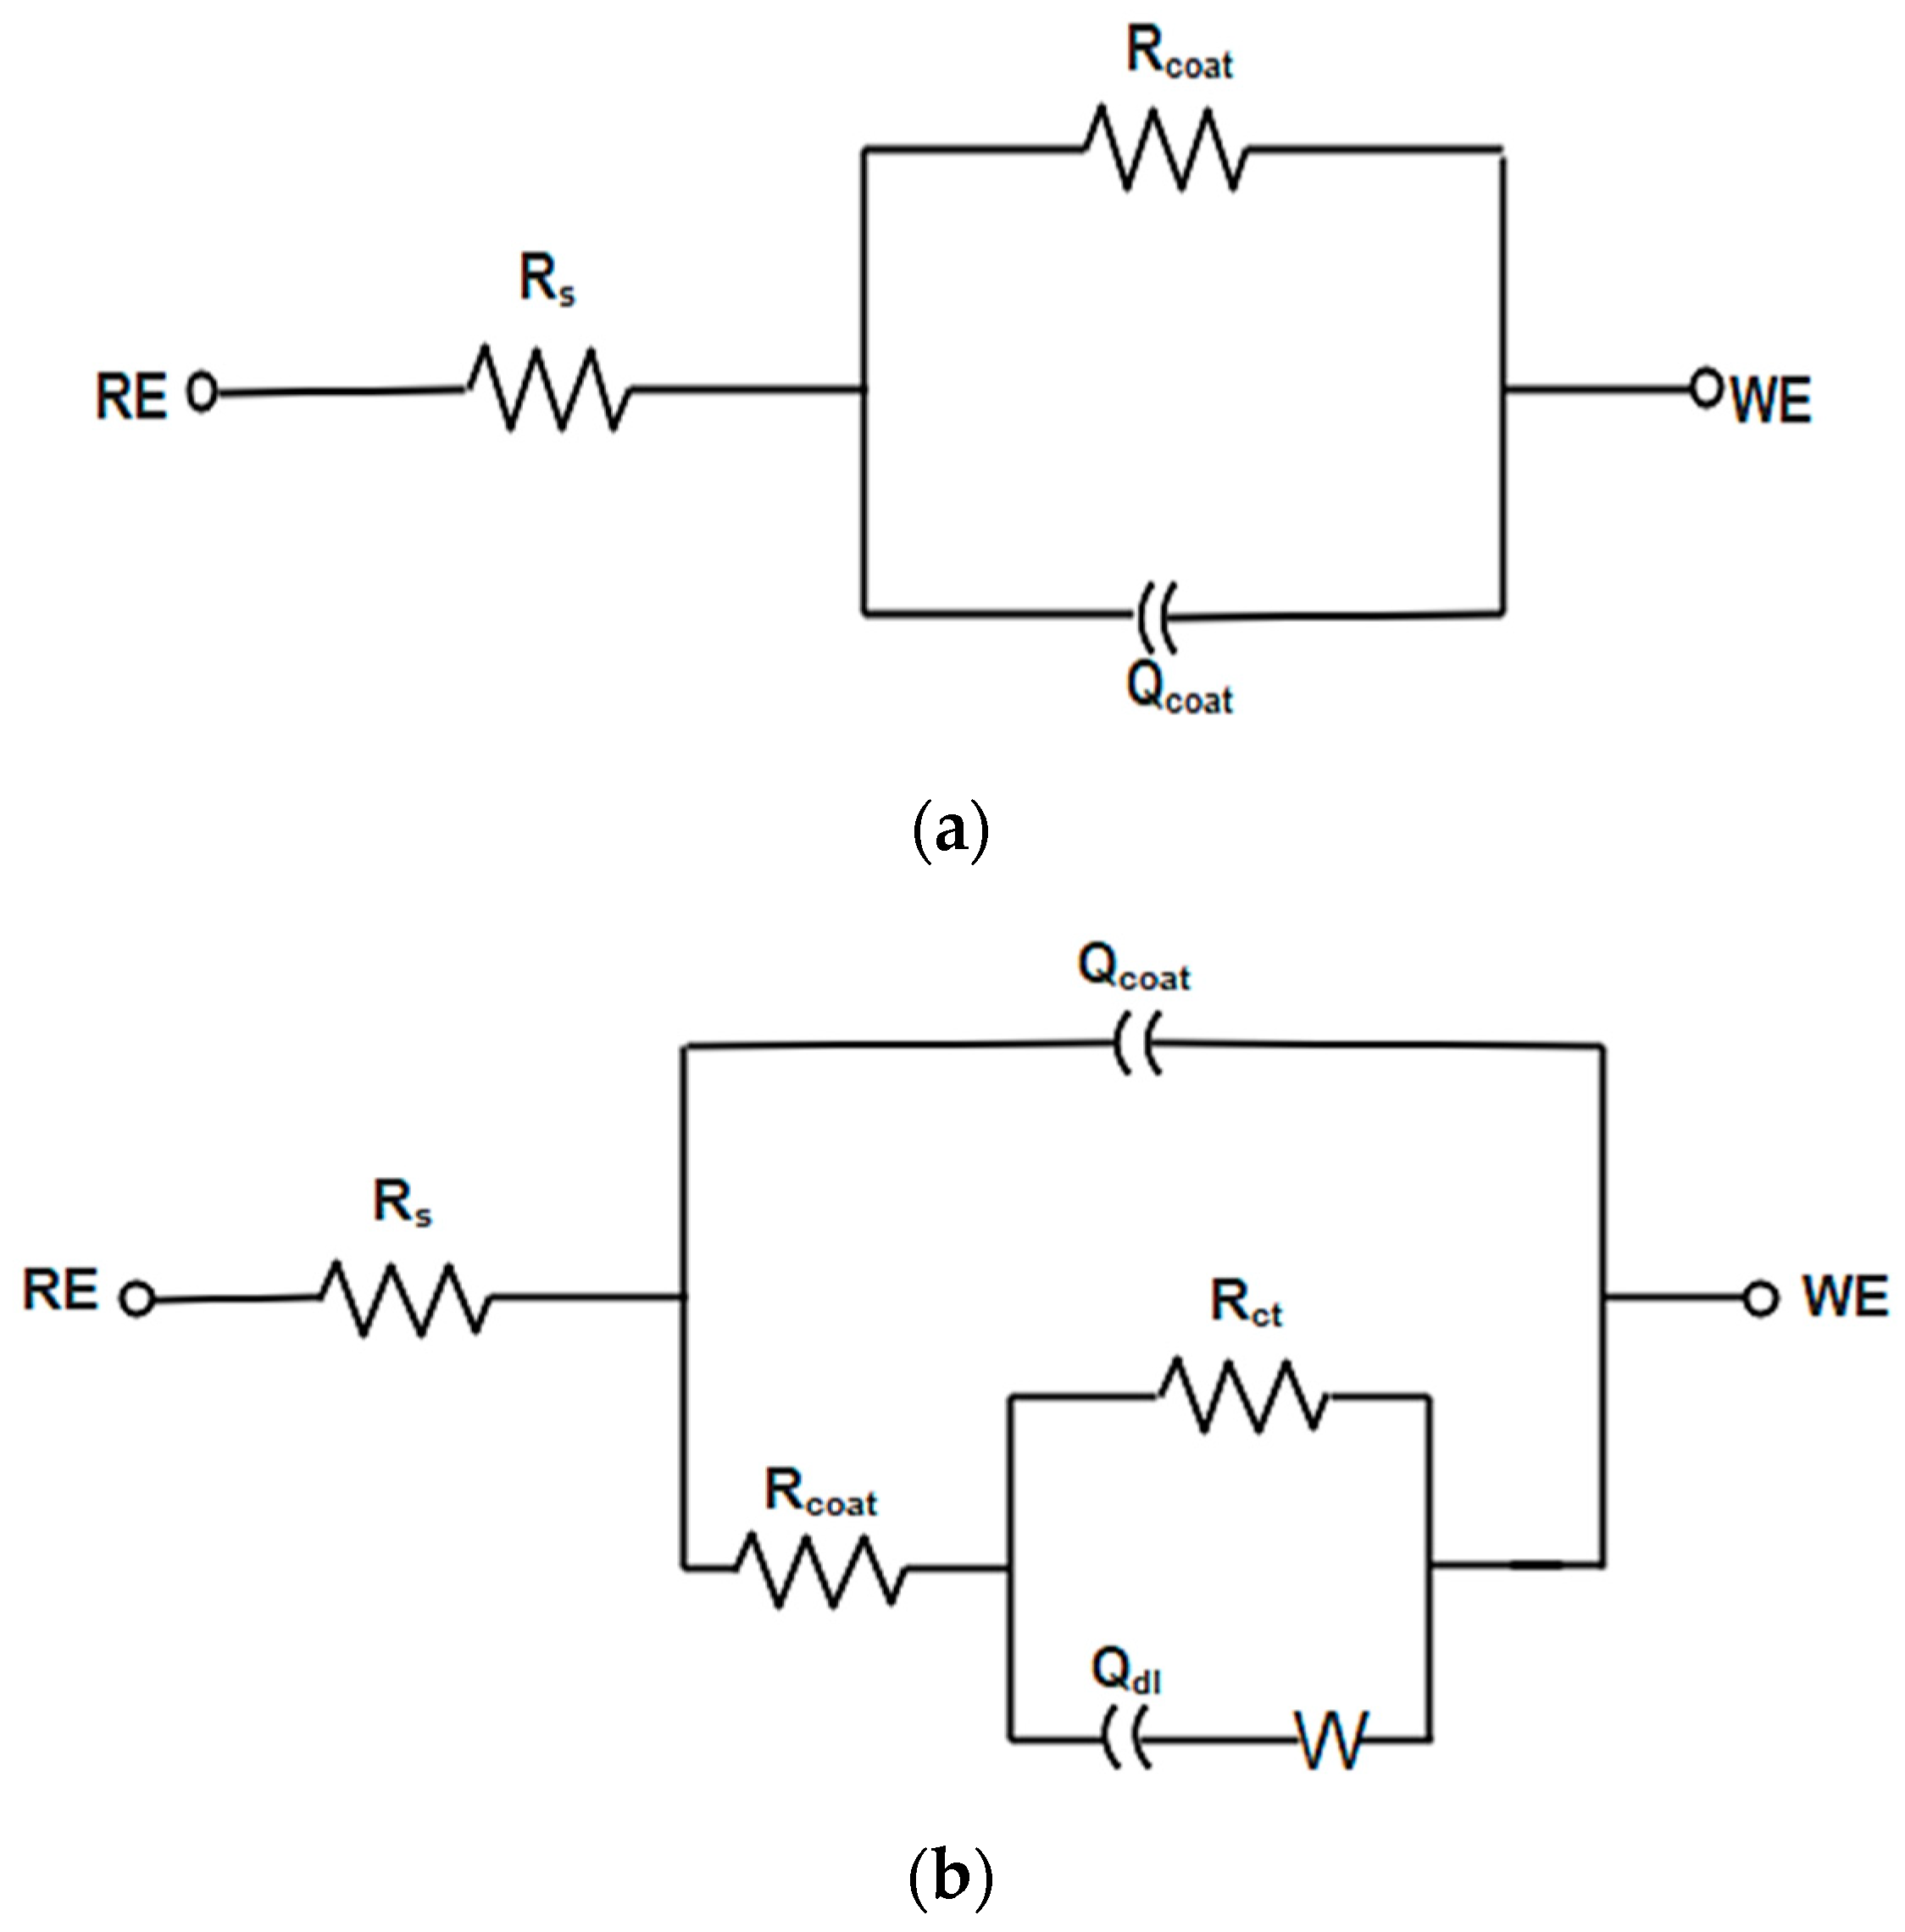
2.3.2. Electrochemical Impedance Spectroscopy (EIS)
2.3.3. Thermal Analysis
2.3.4. FTIR
2.3.5. ToF-SIMS
3. Results and Discussion
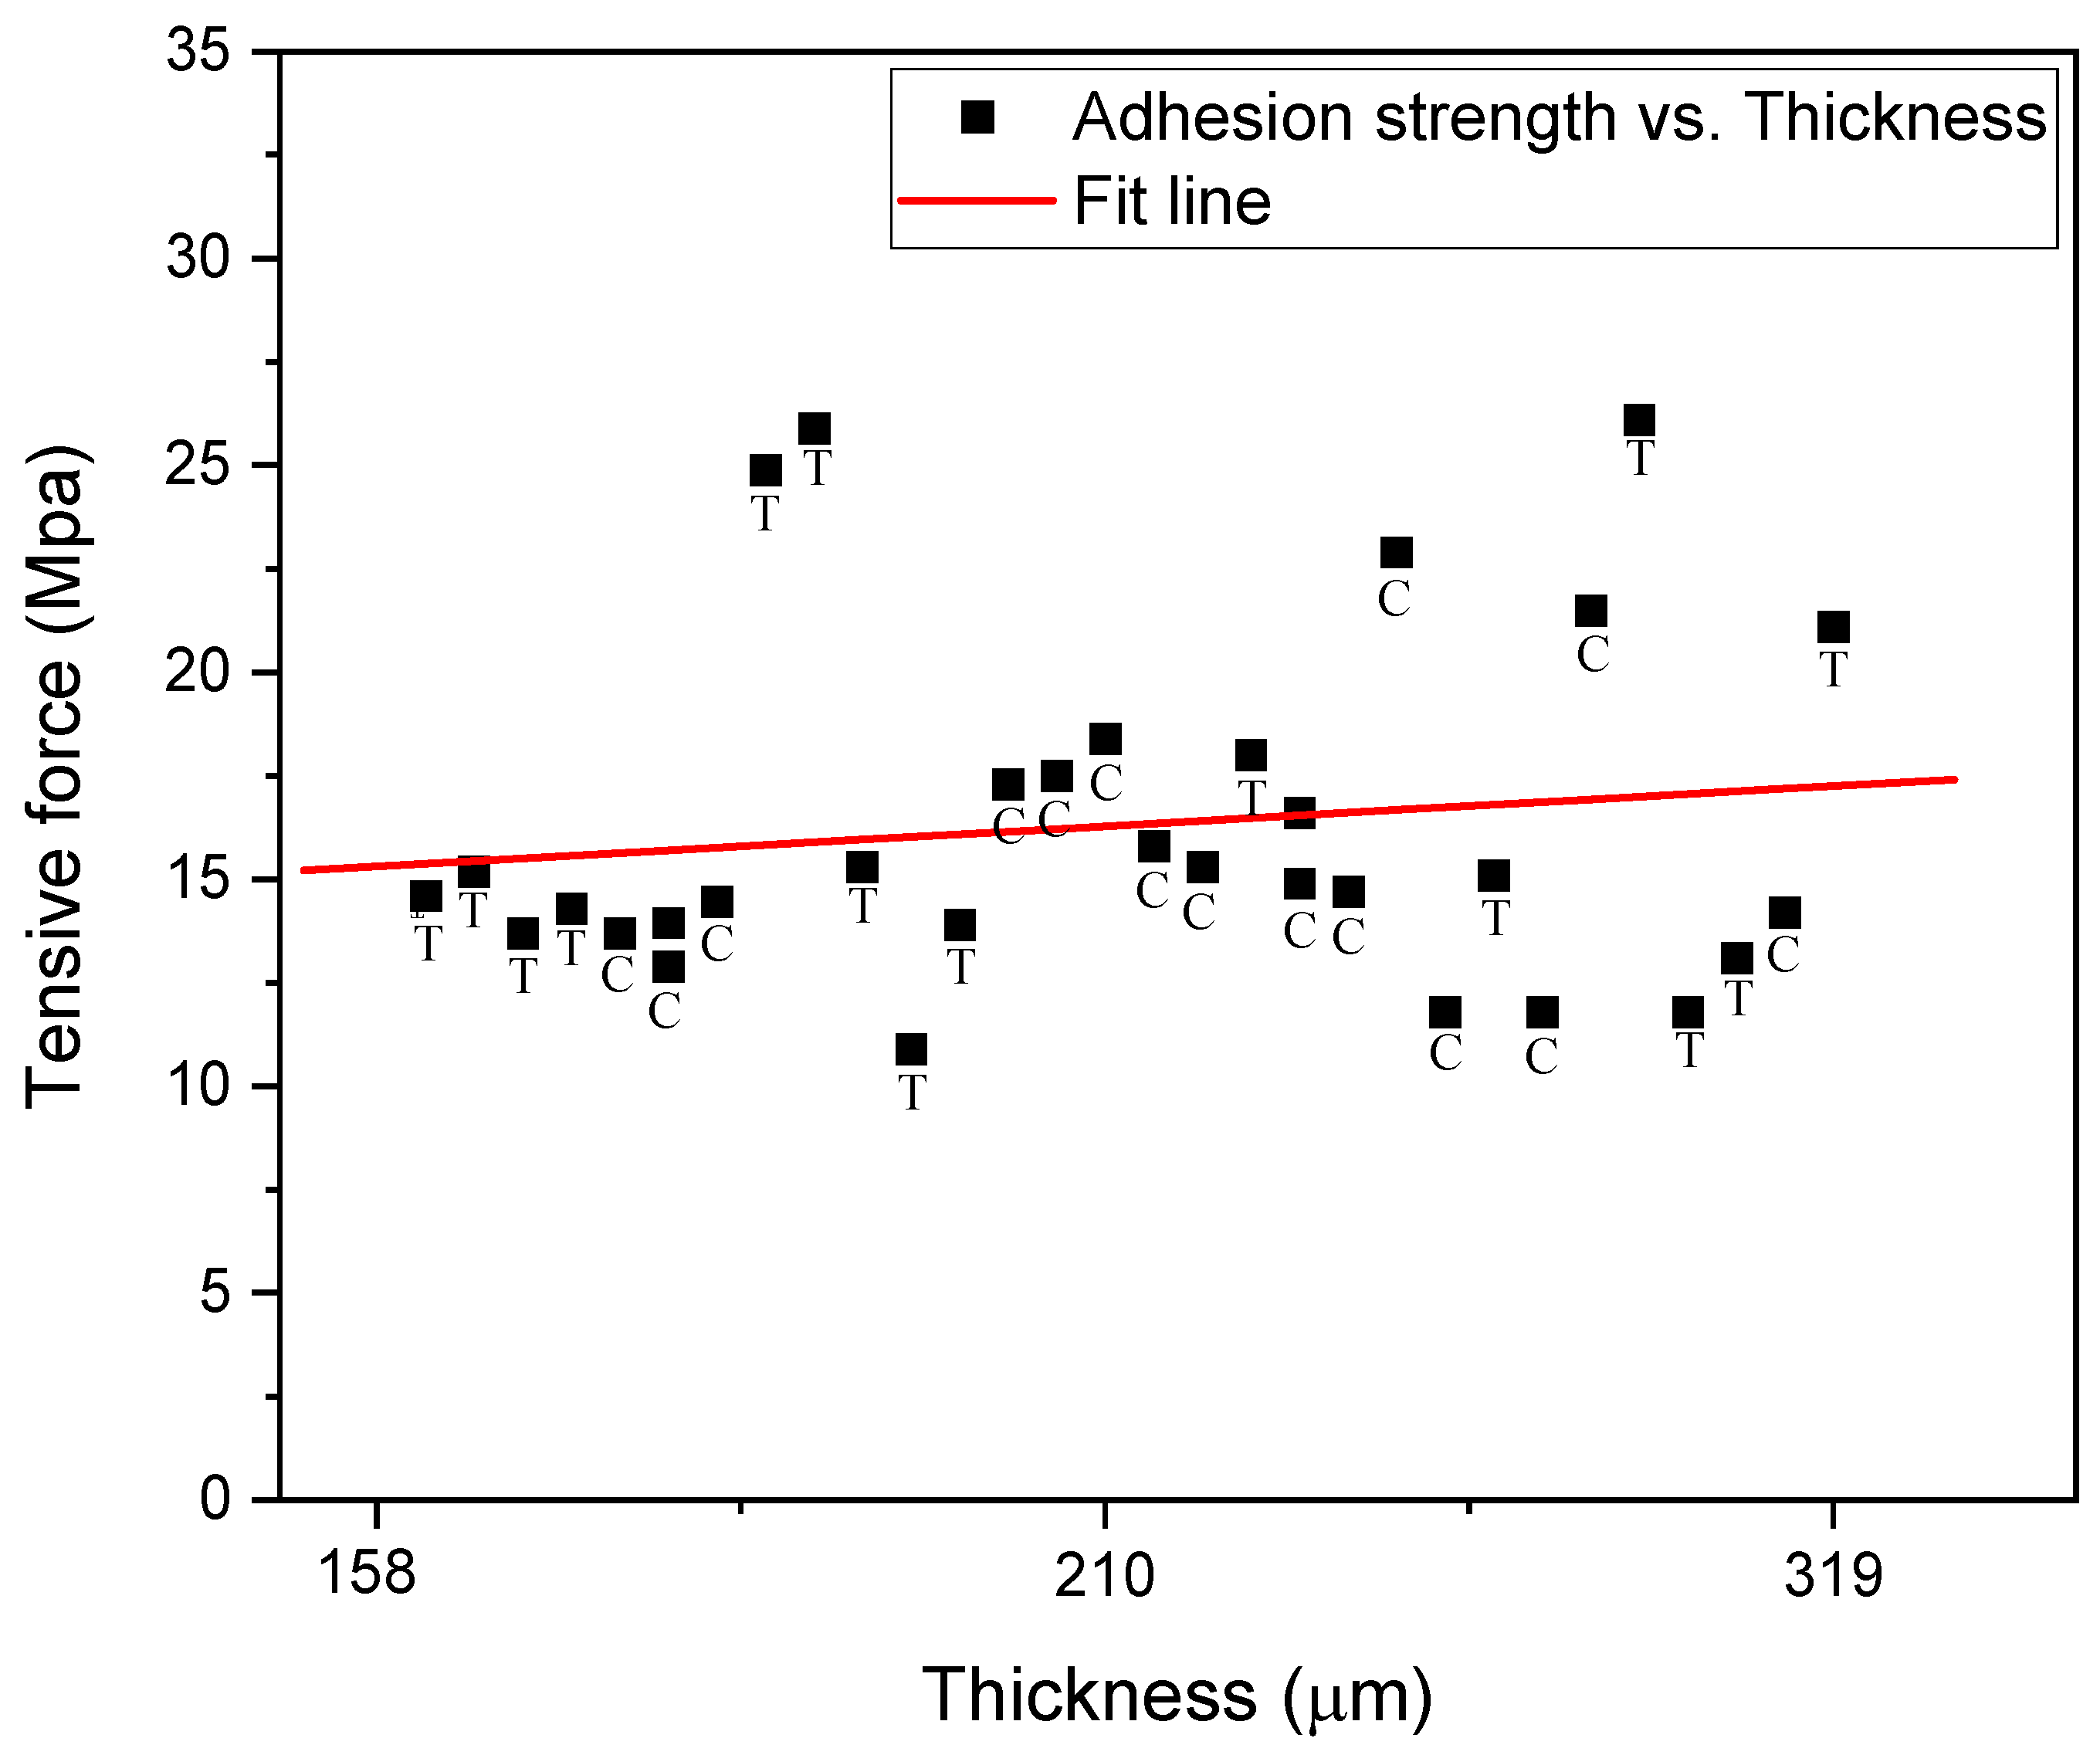
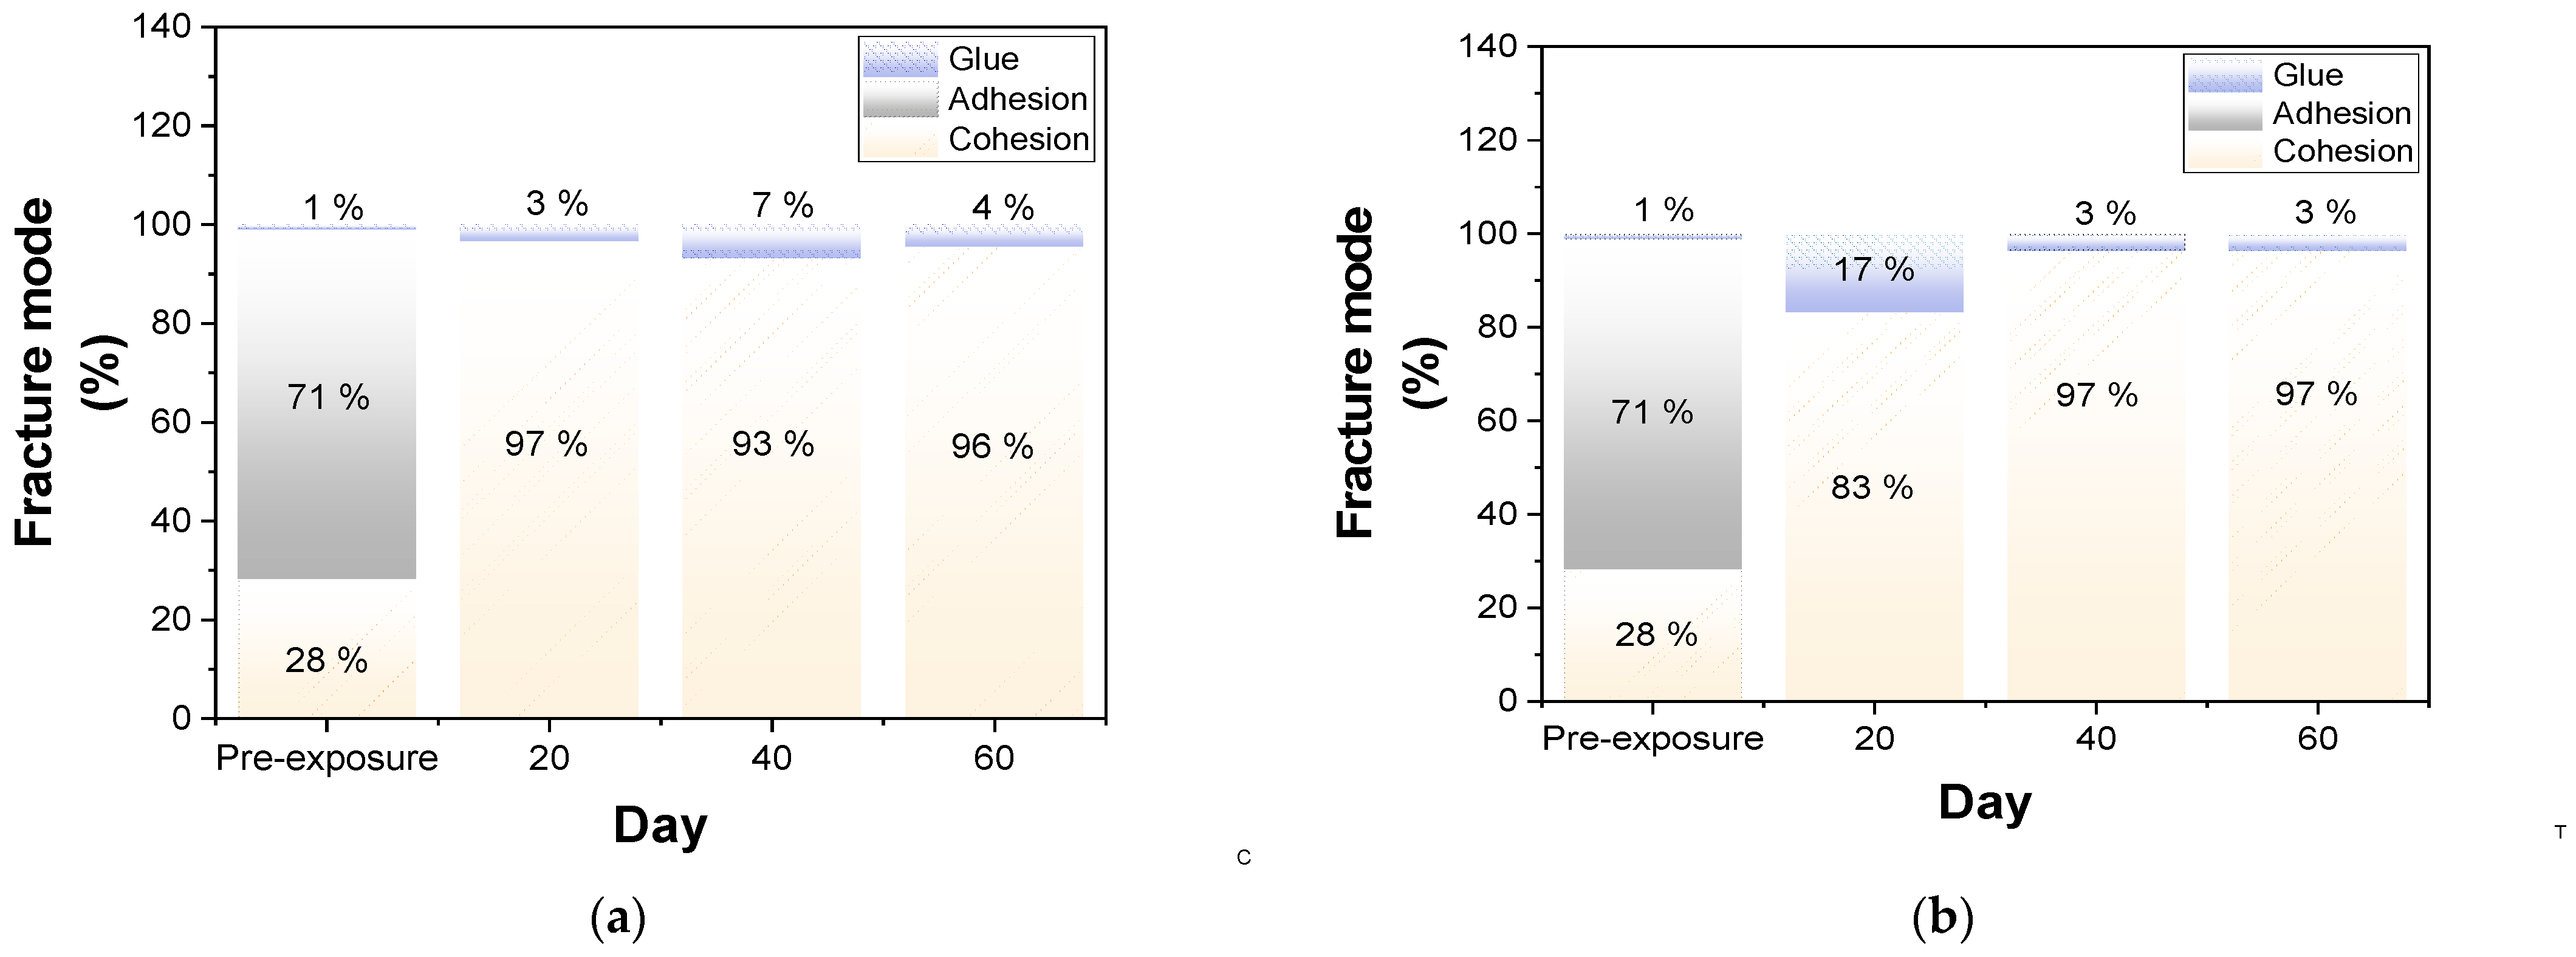
3.1. Pull-Off Adhesion Strength
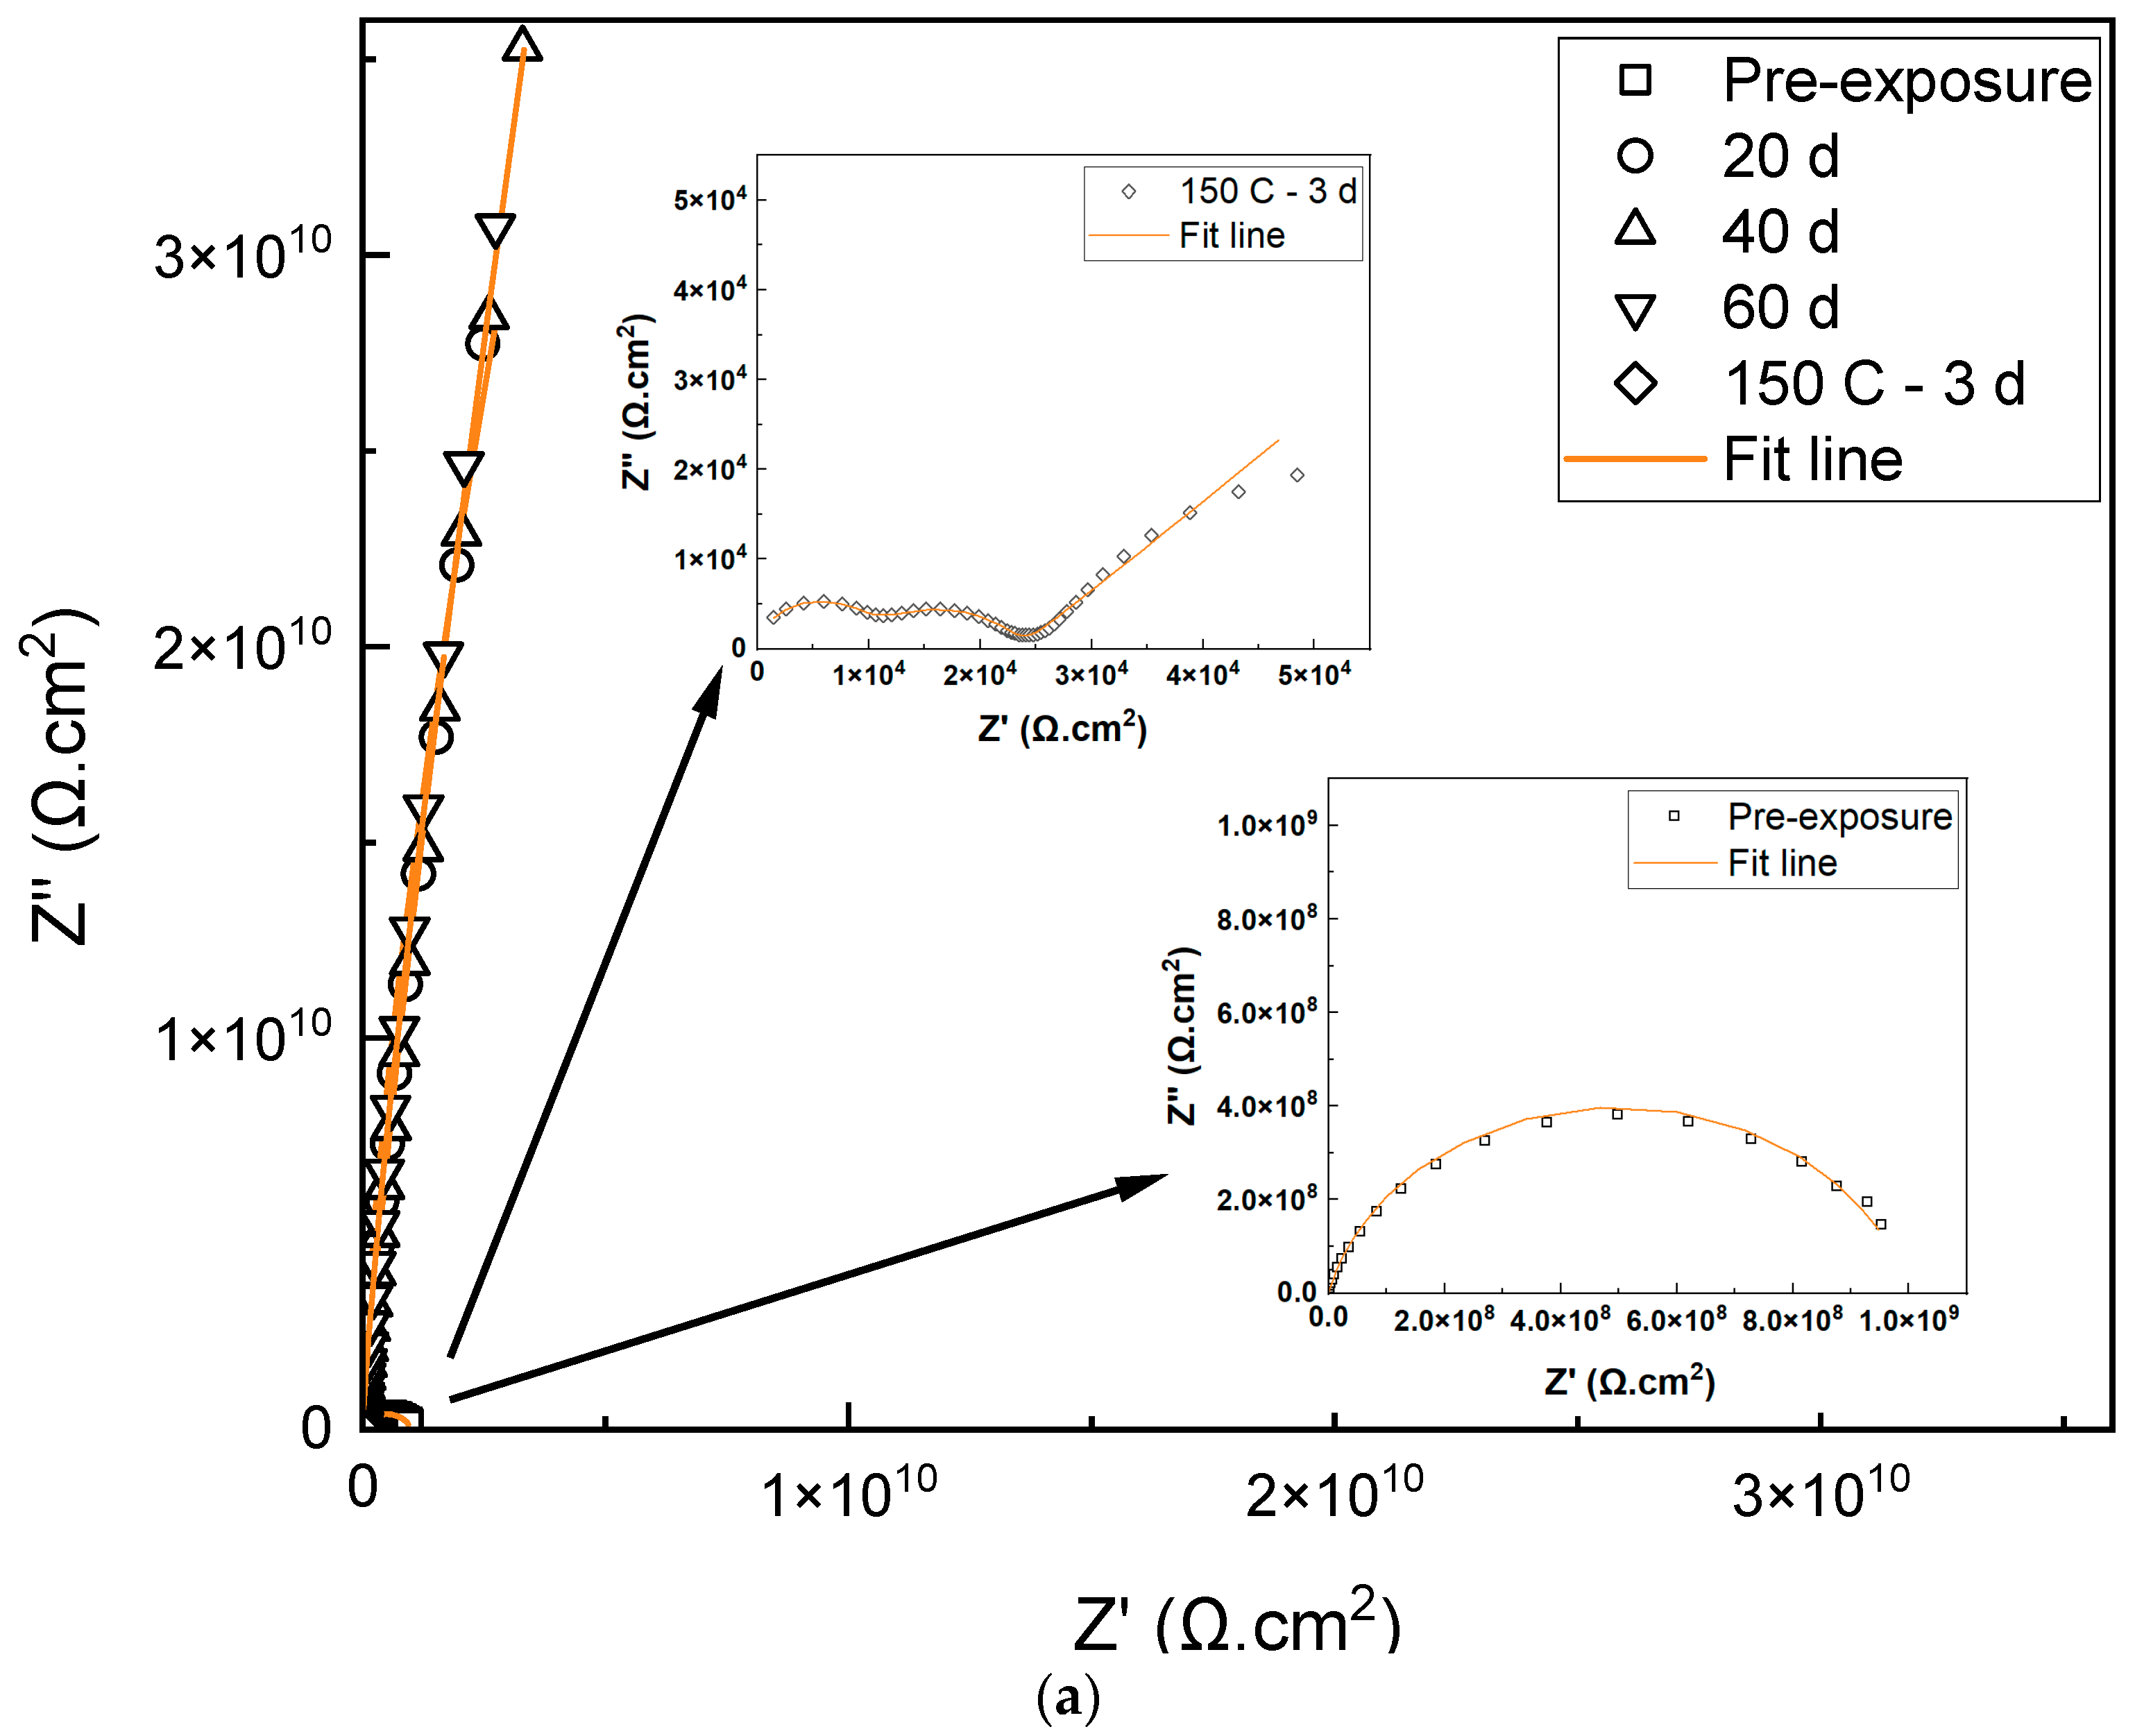
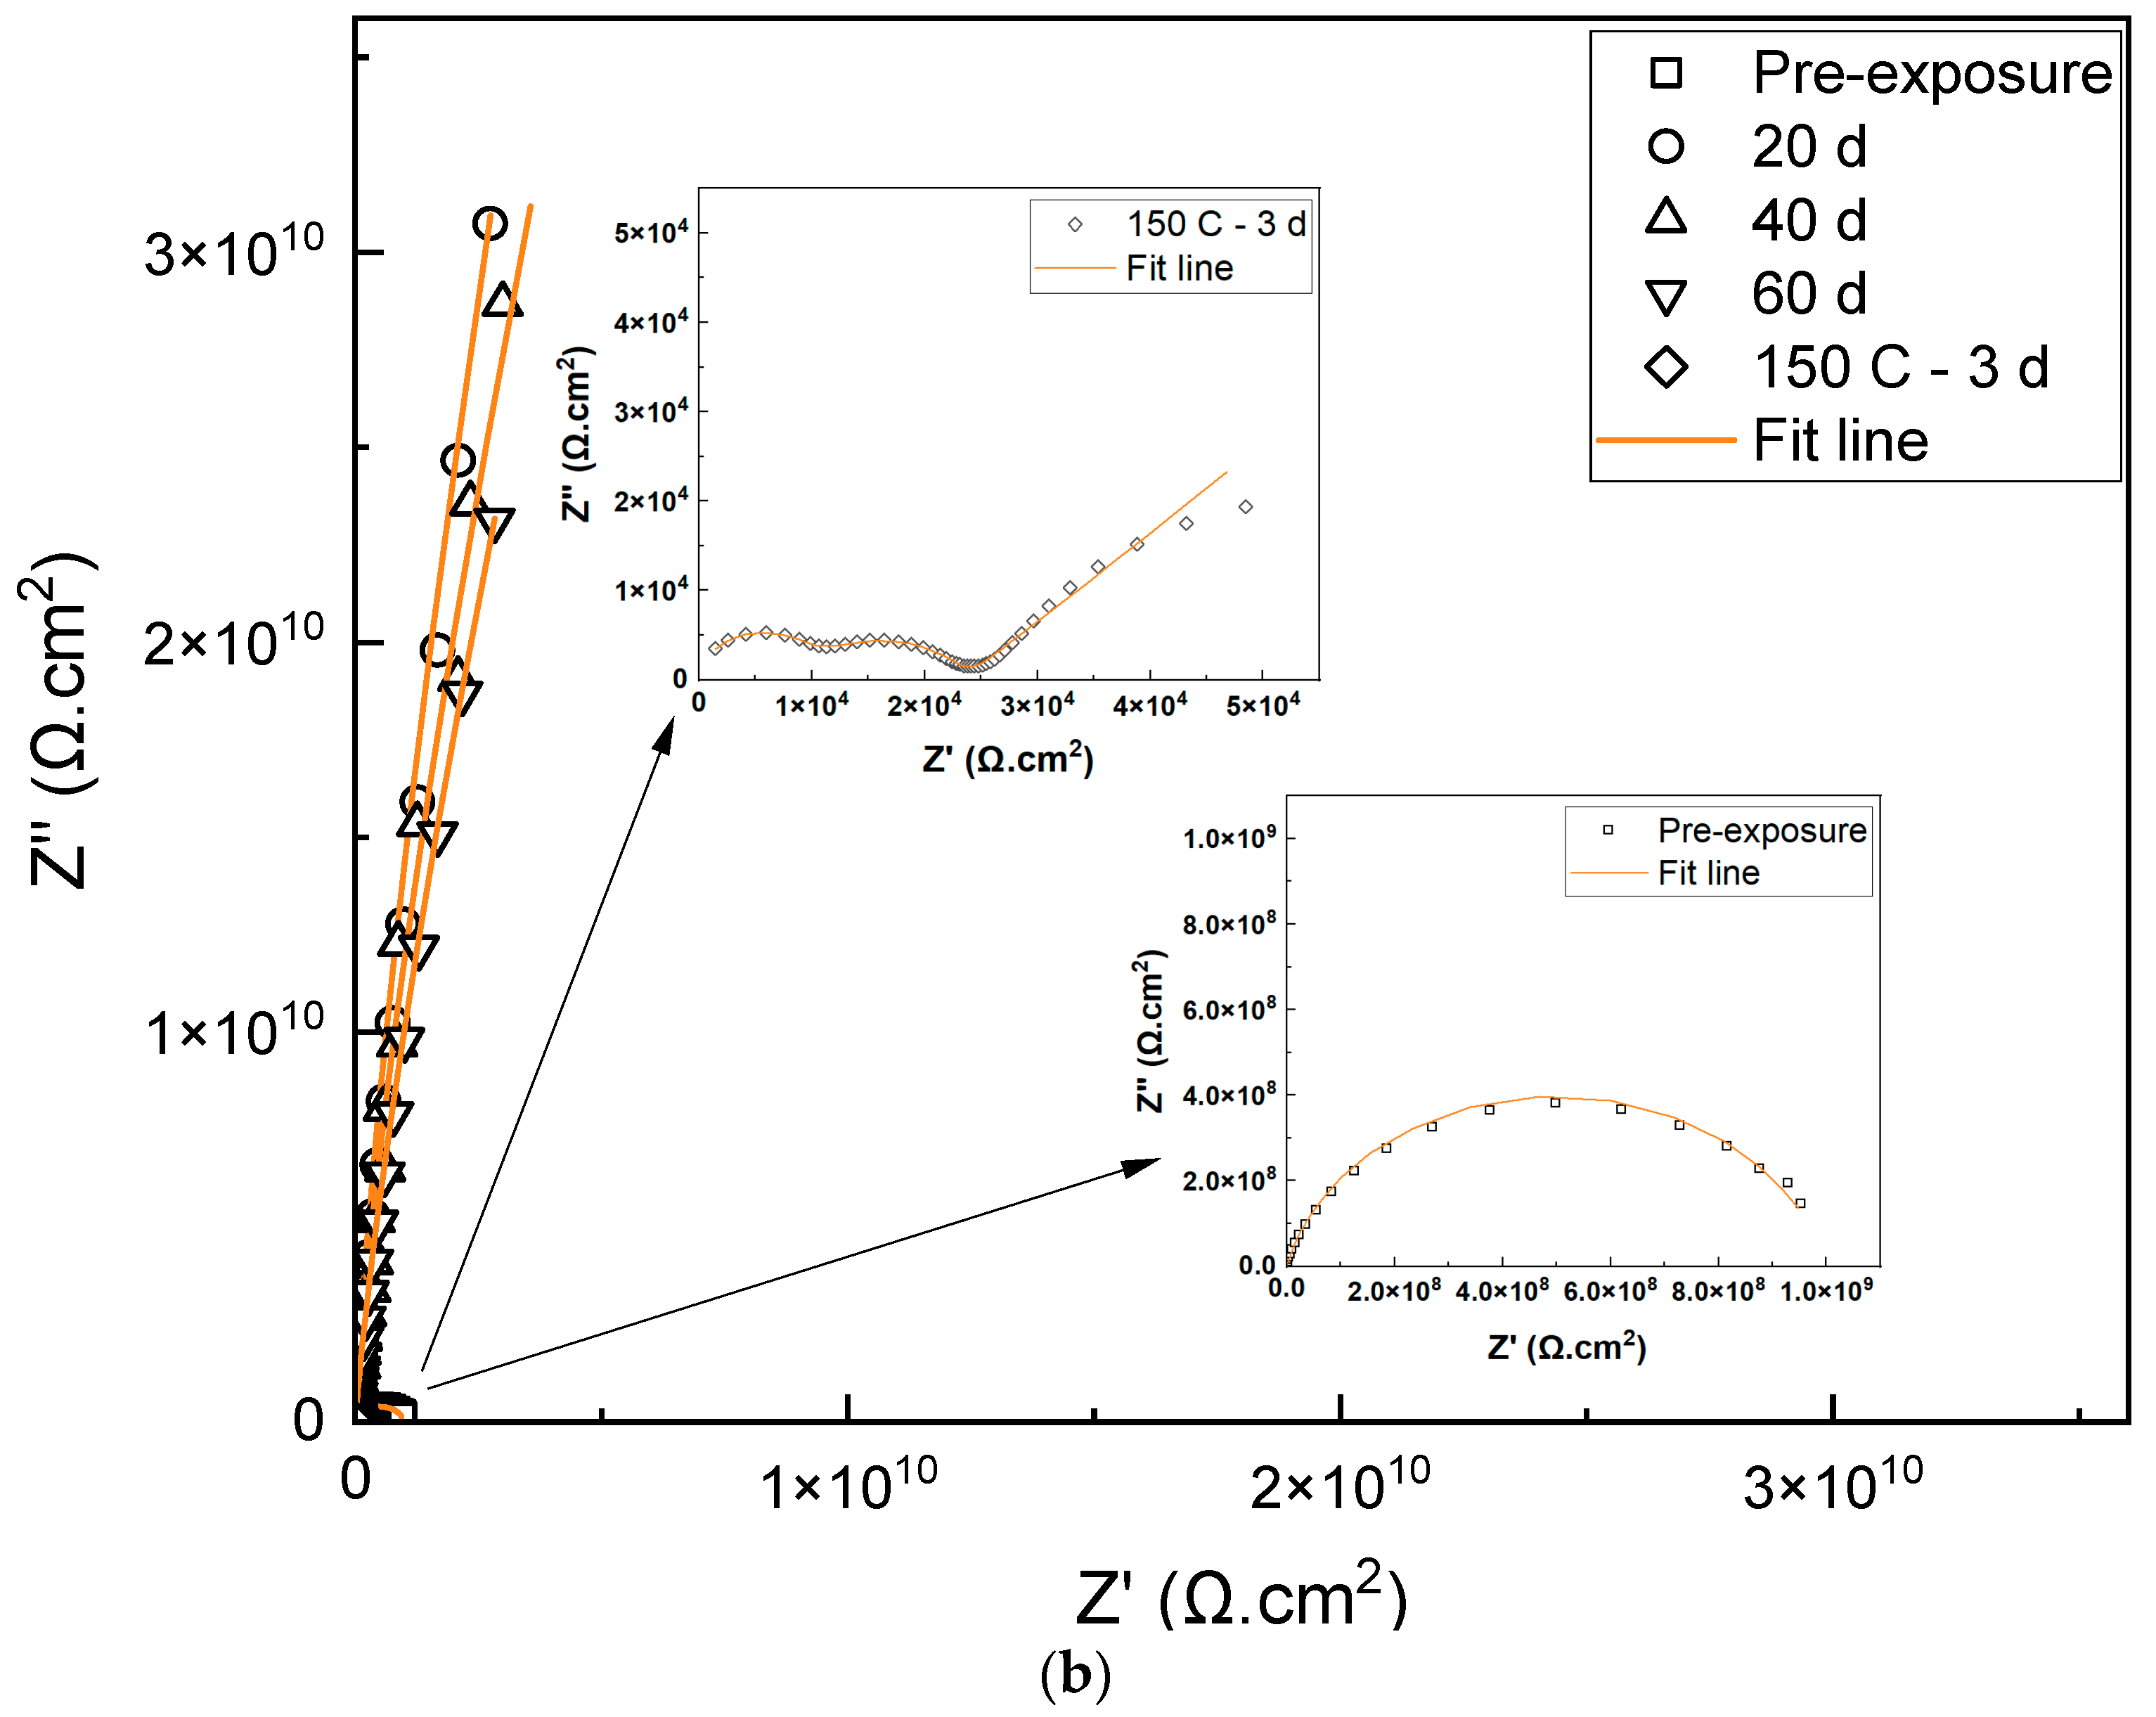
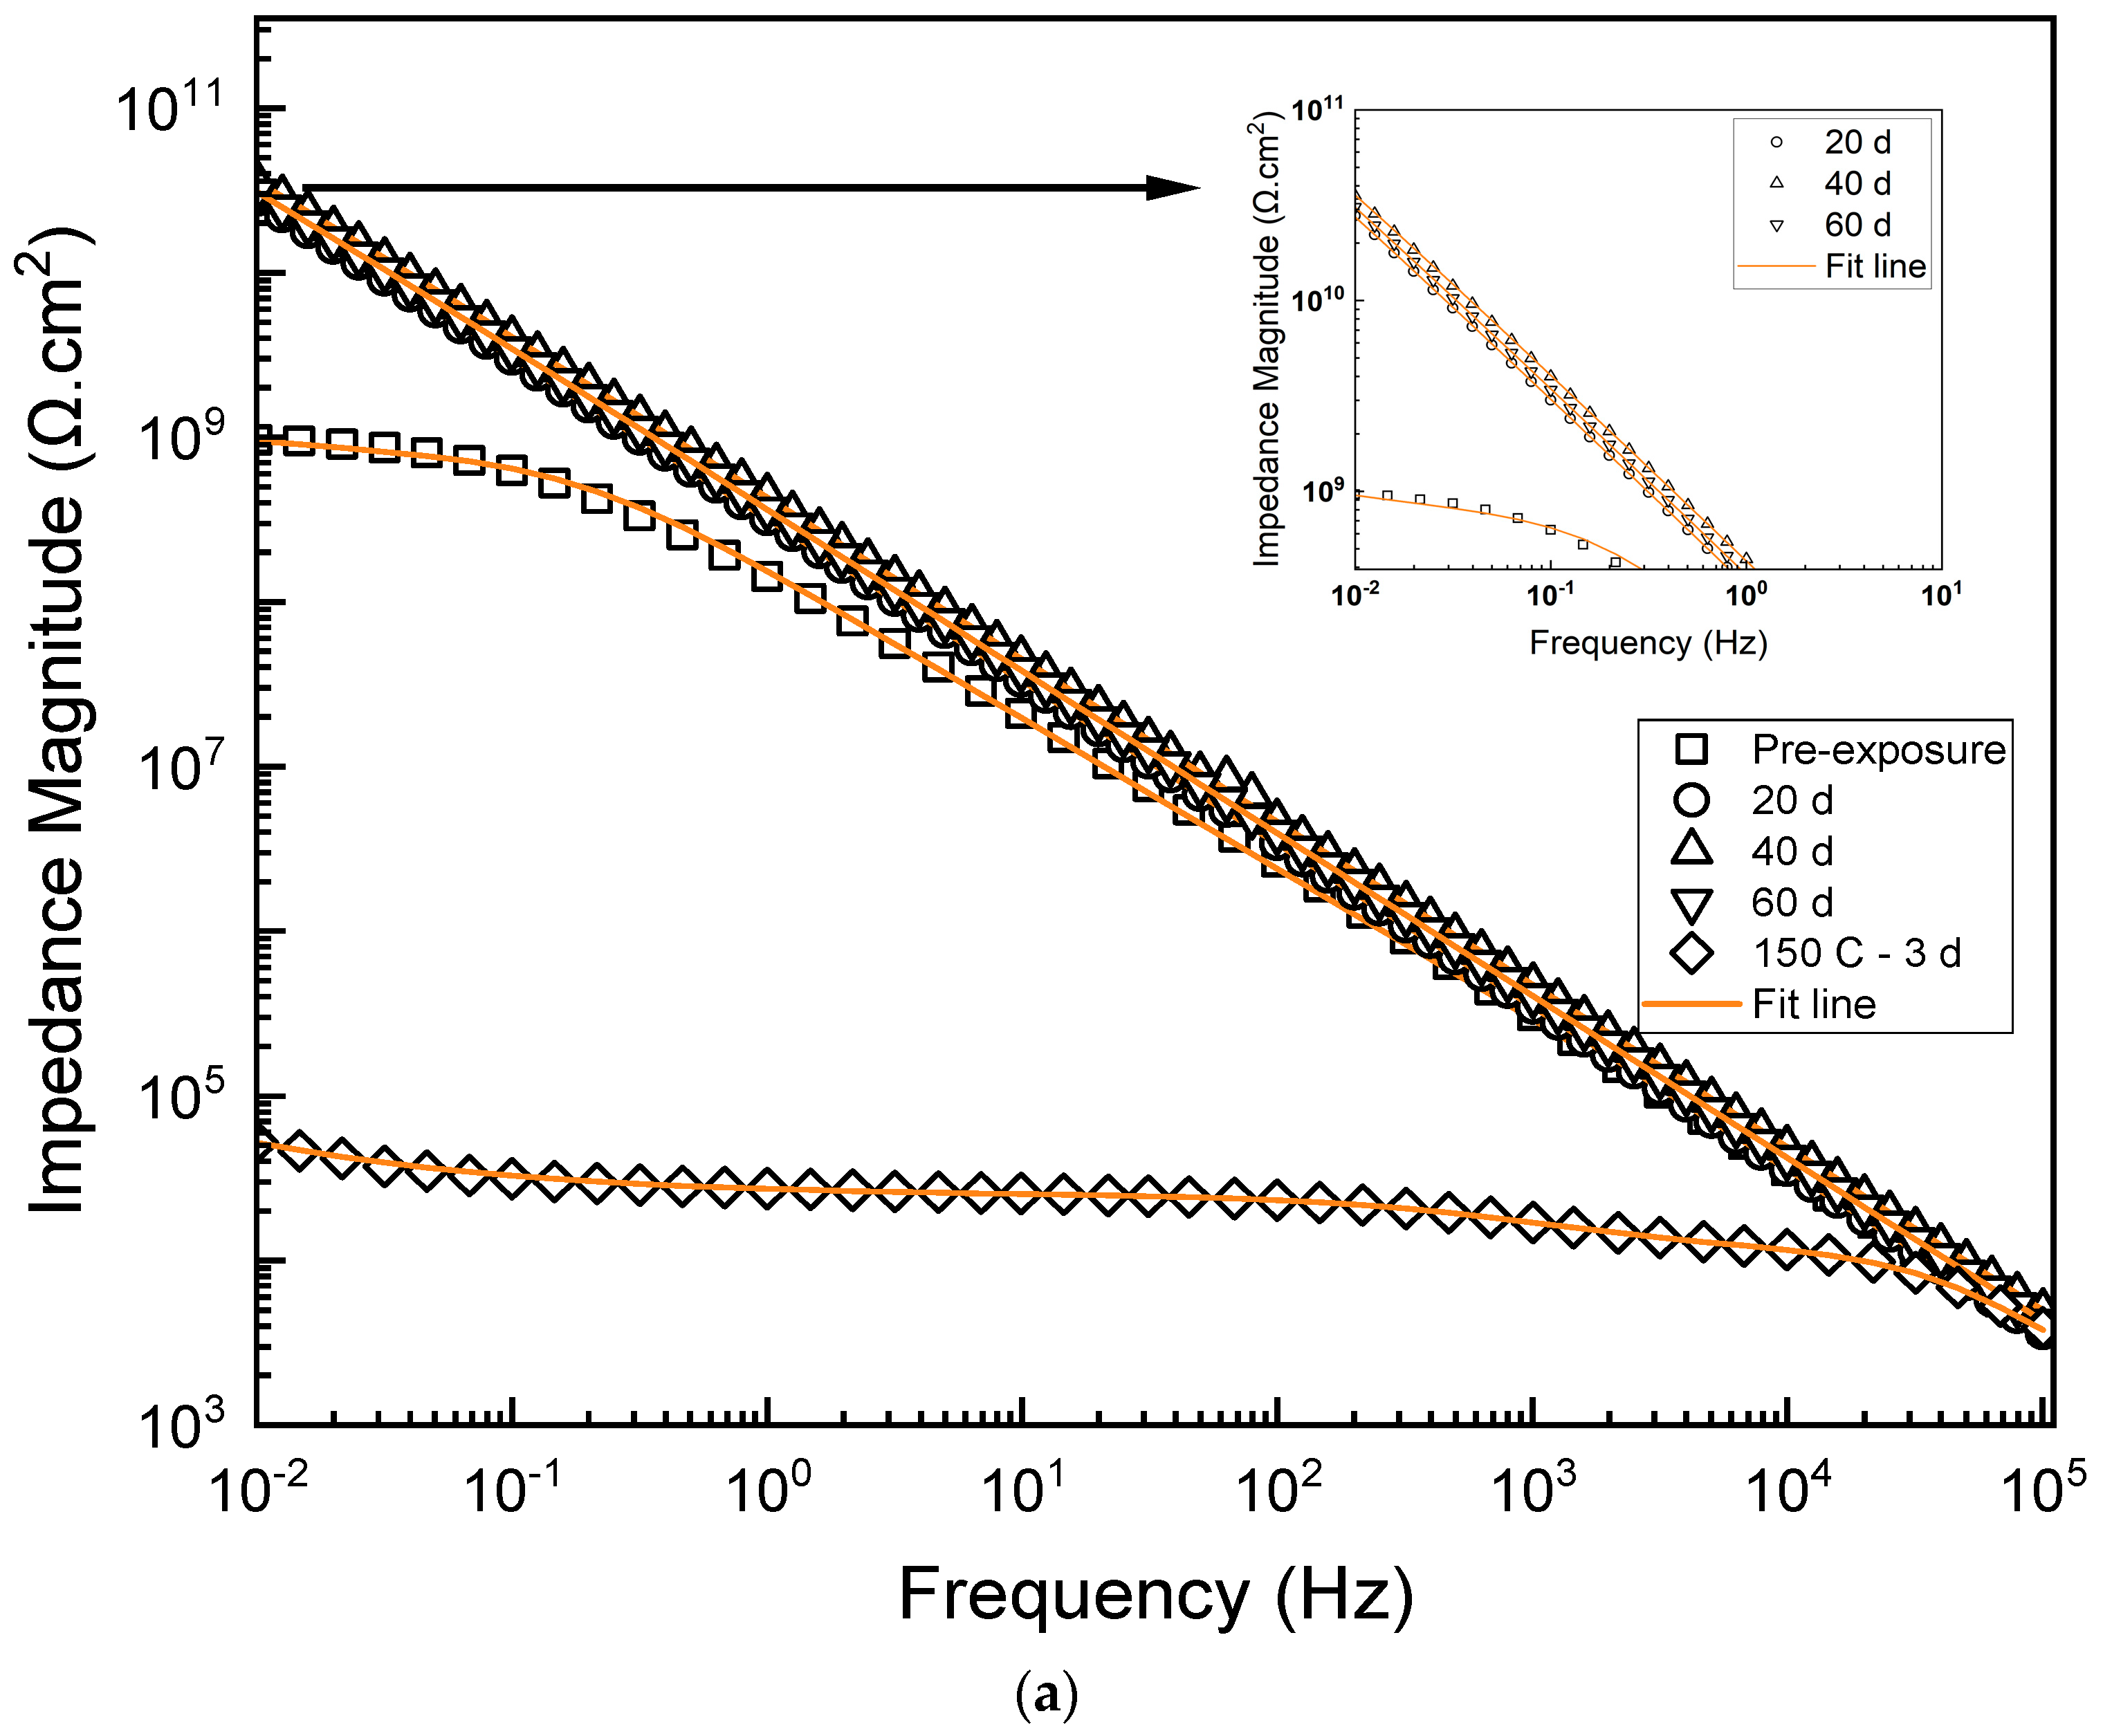
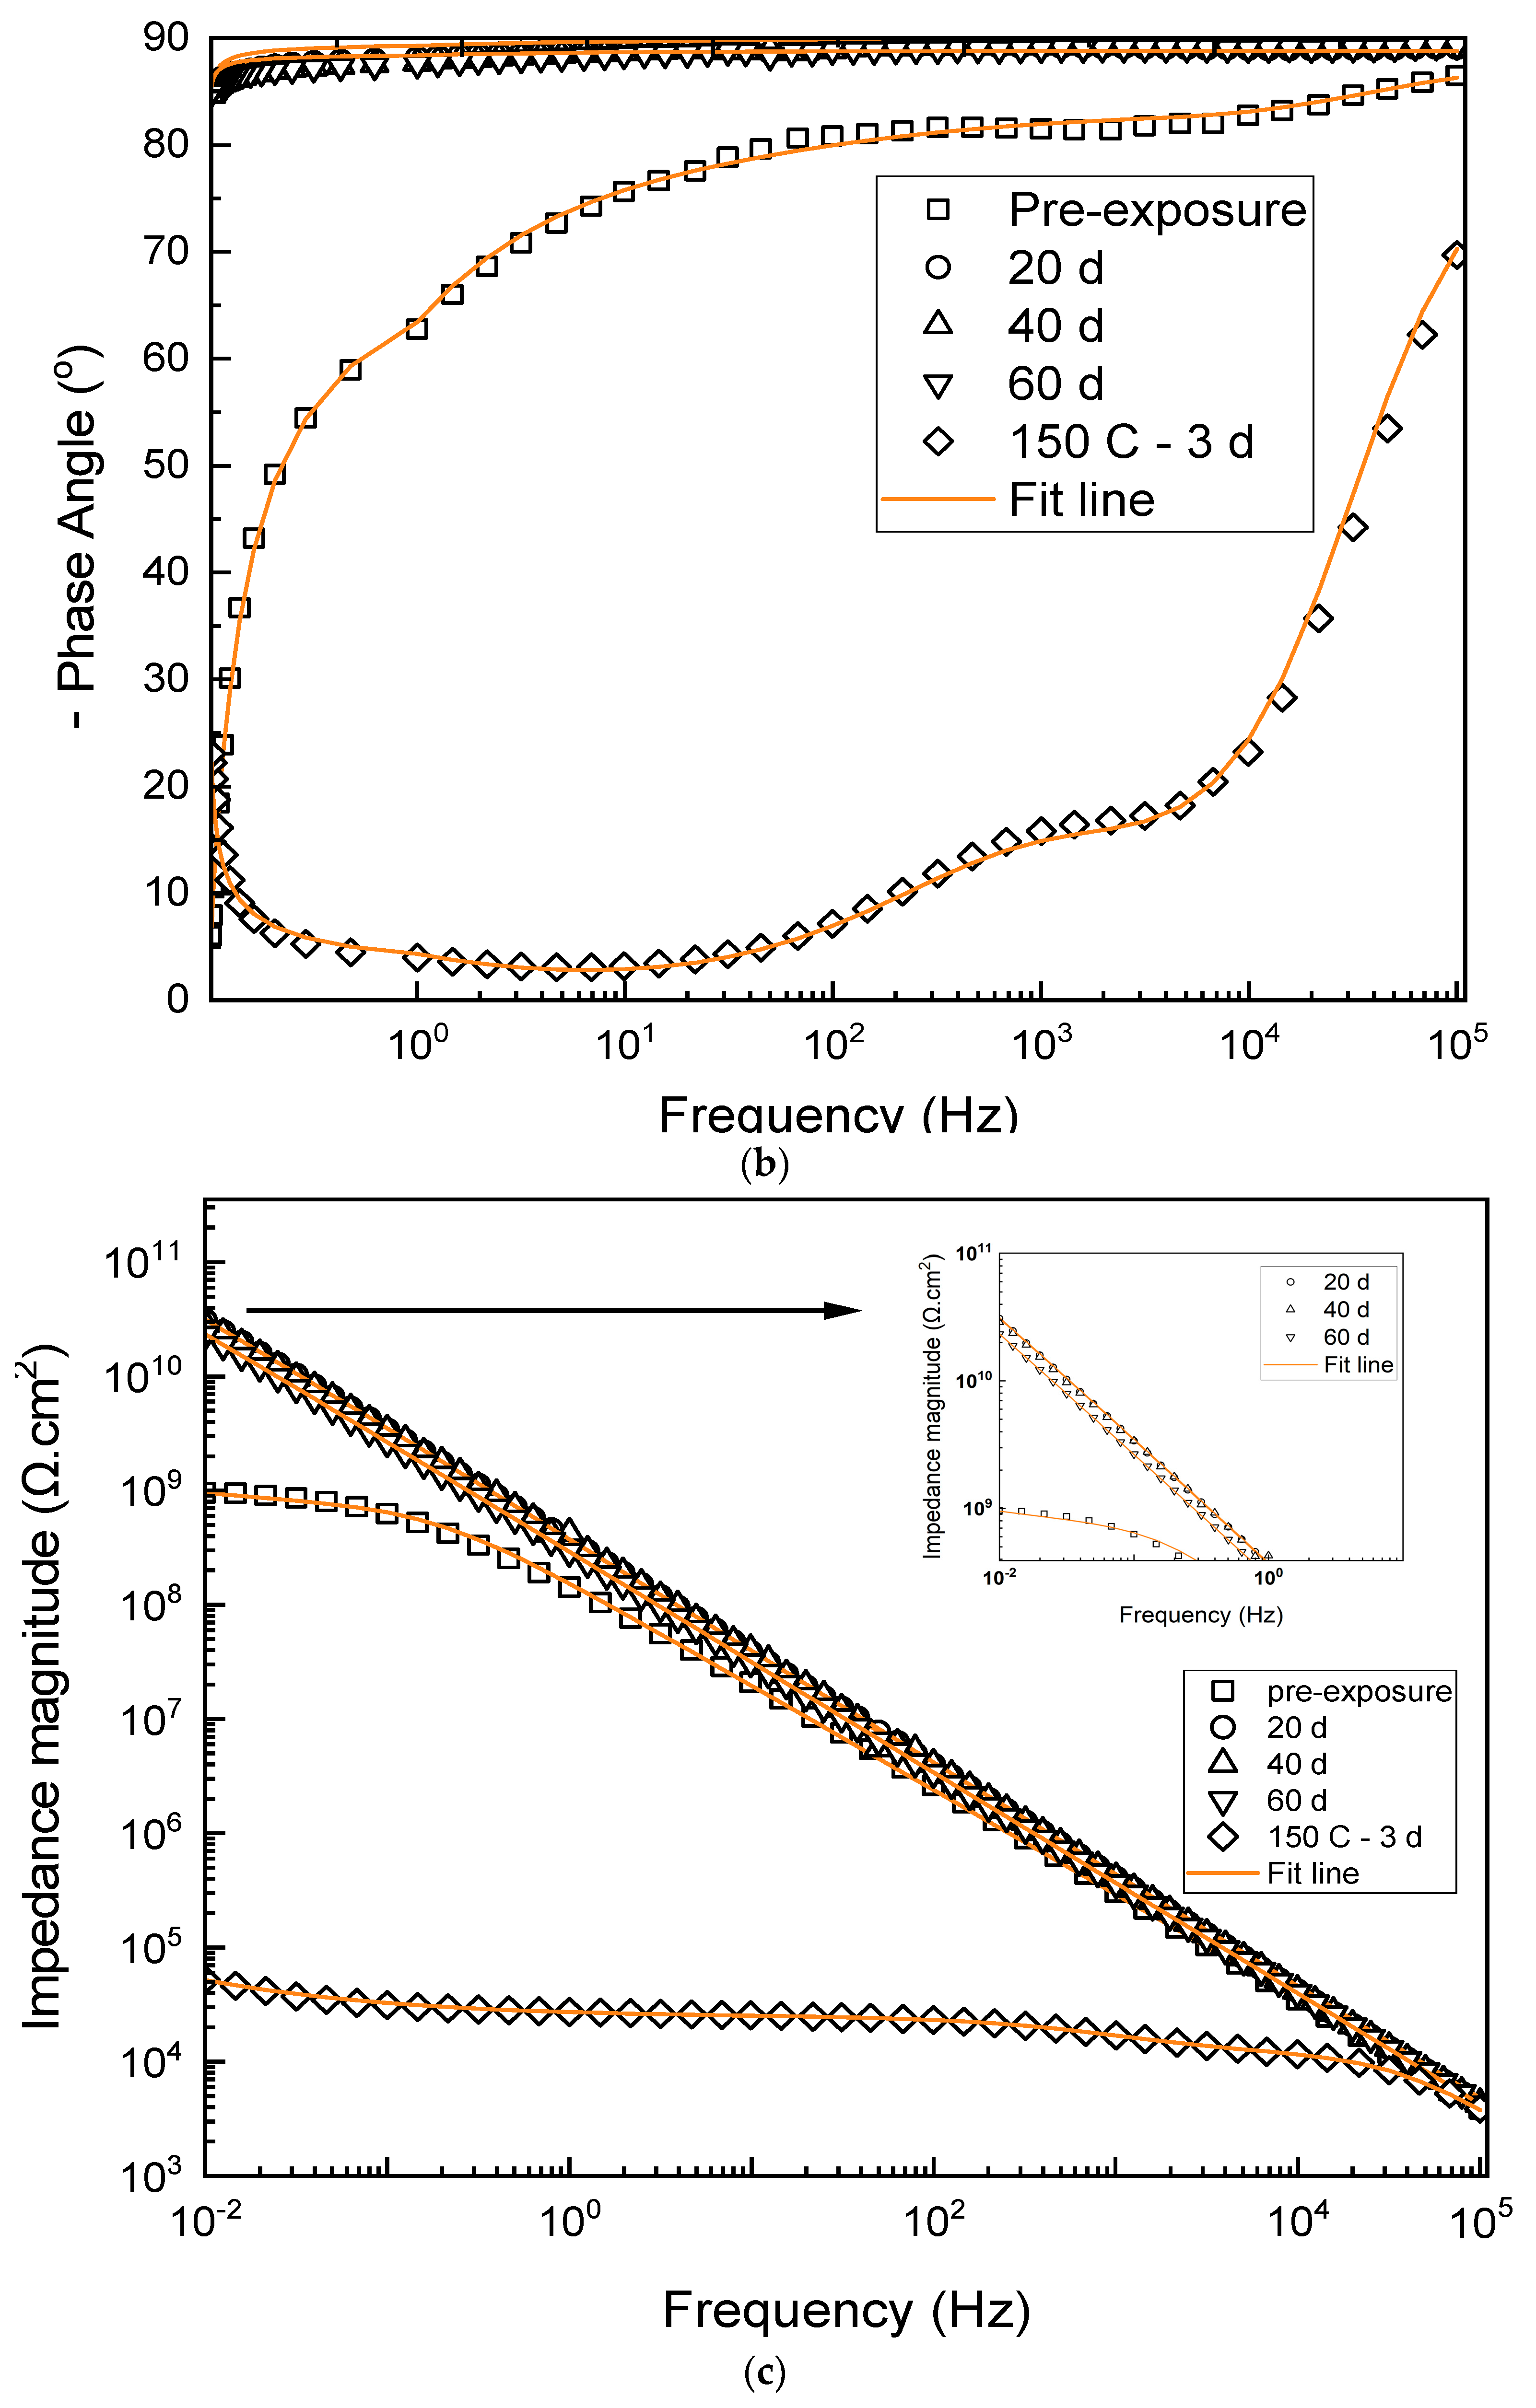
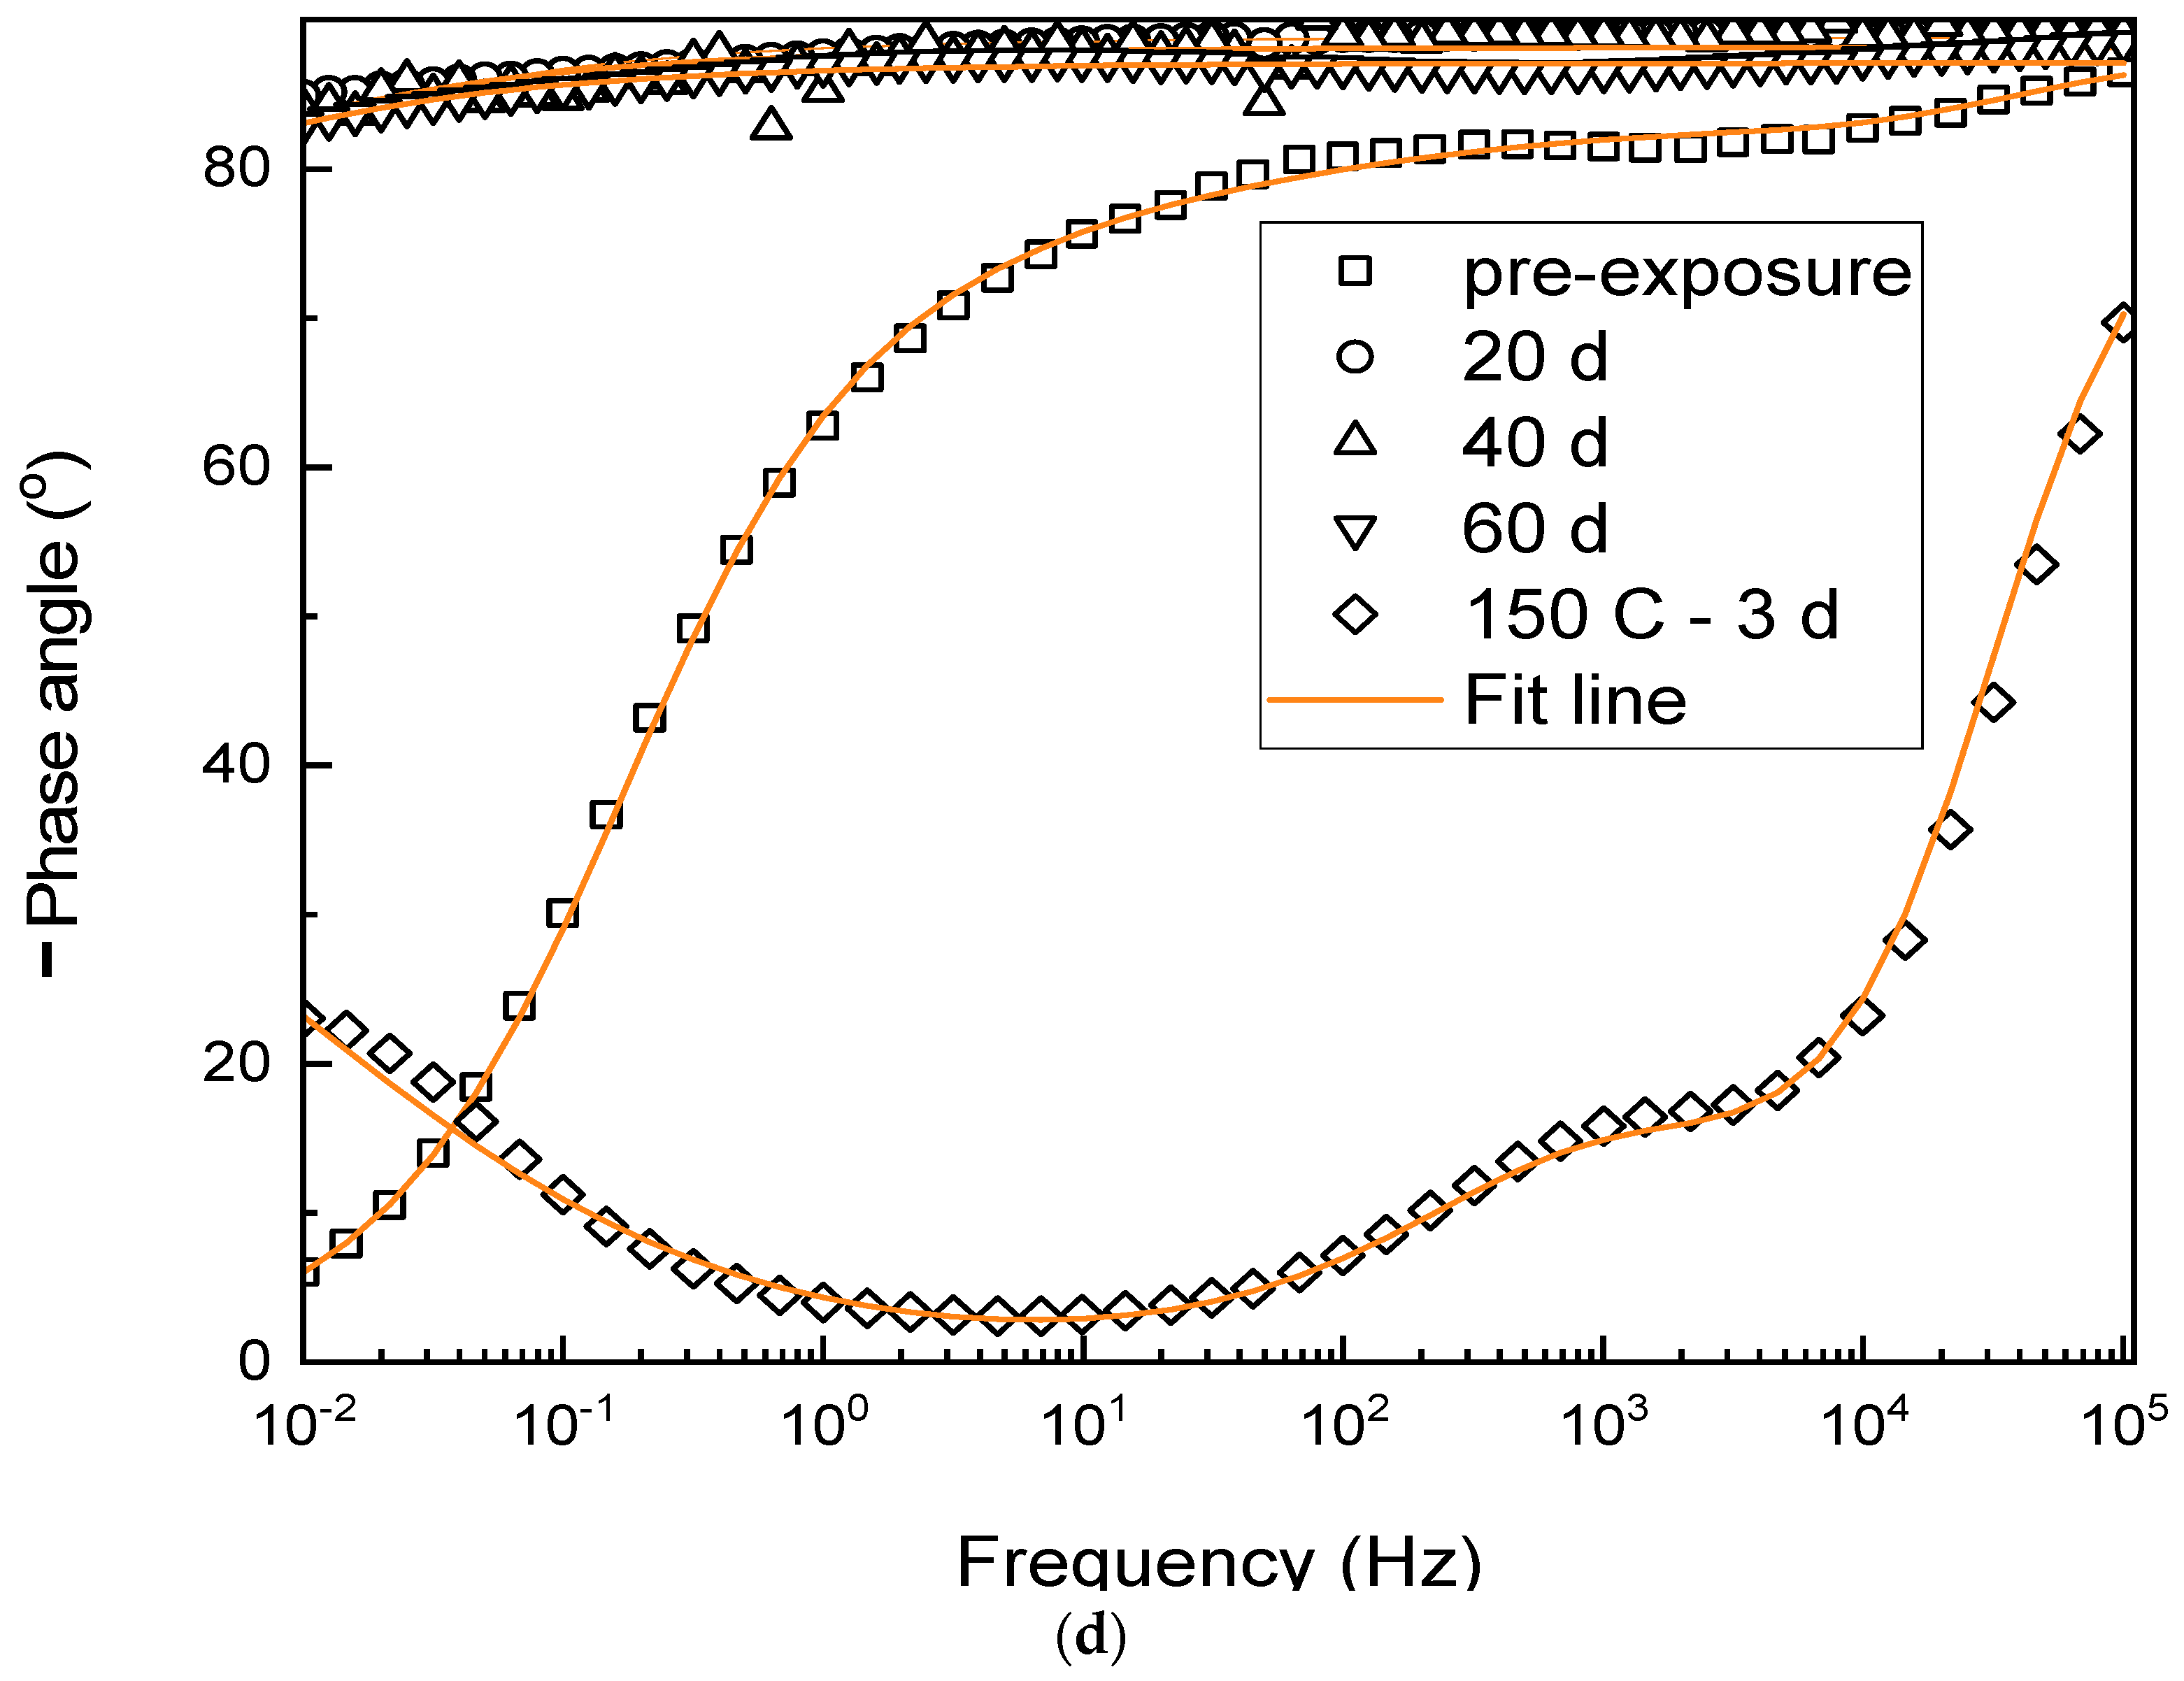
3.2. Electrochemical Properties
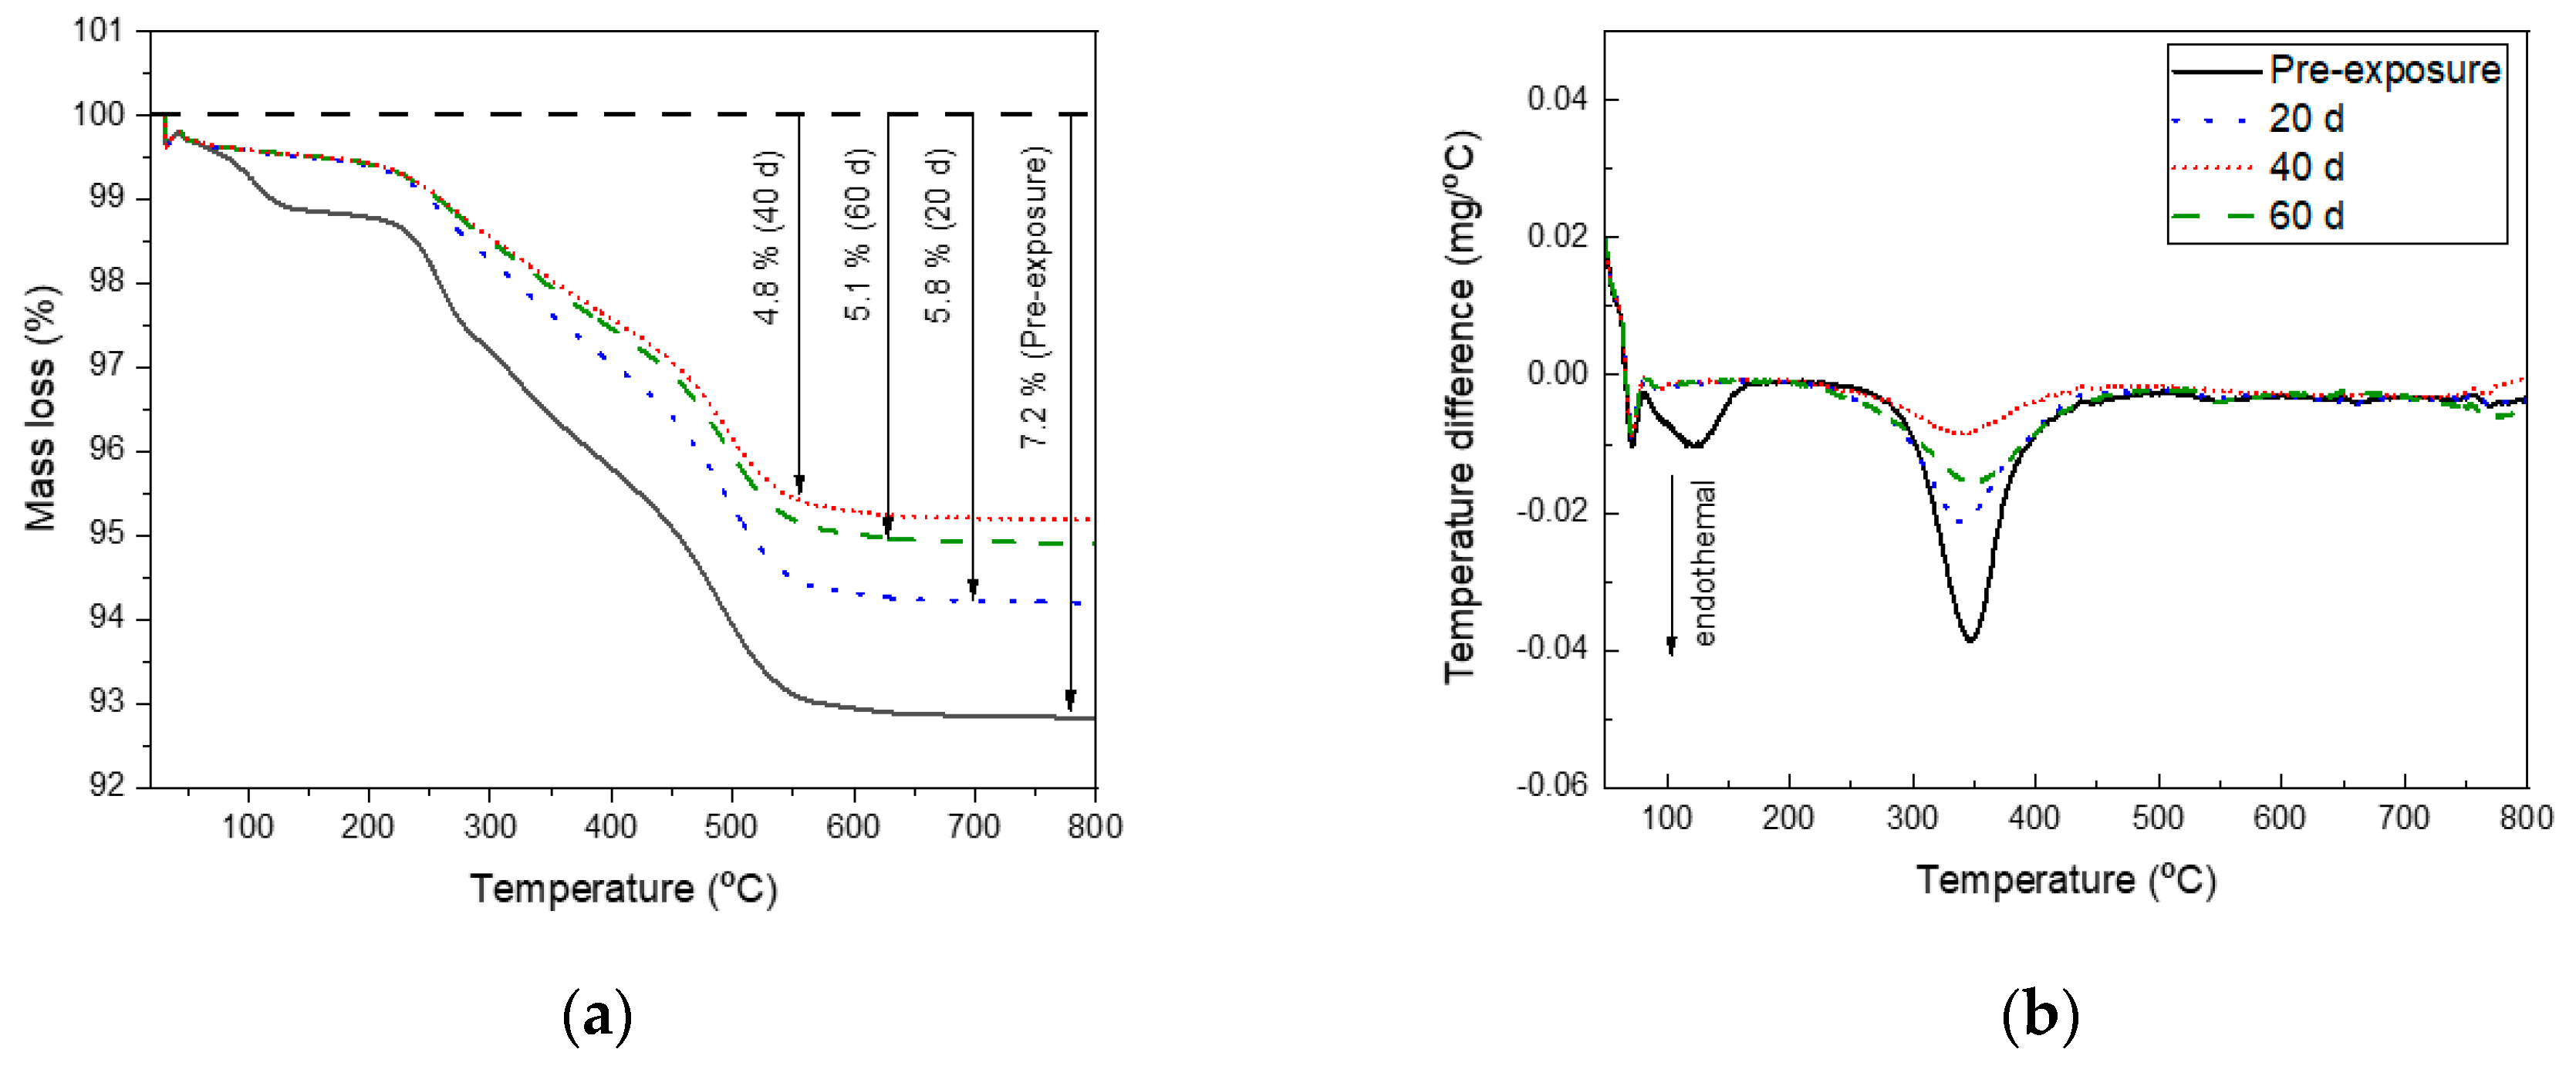
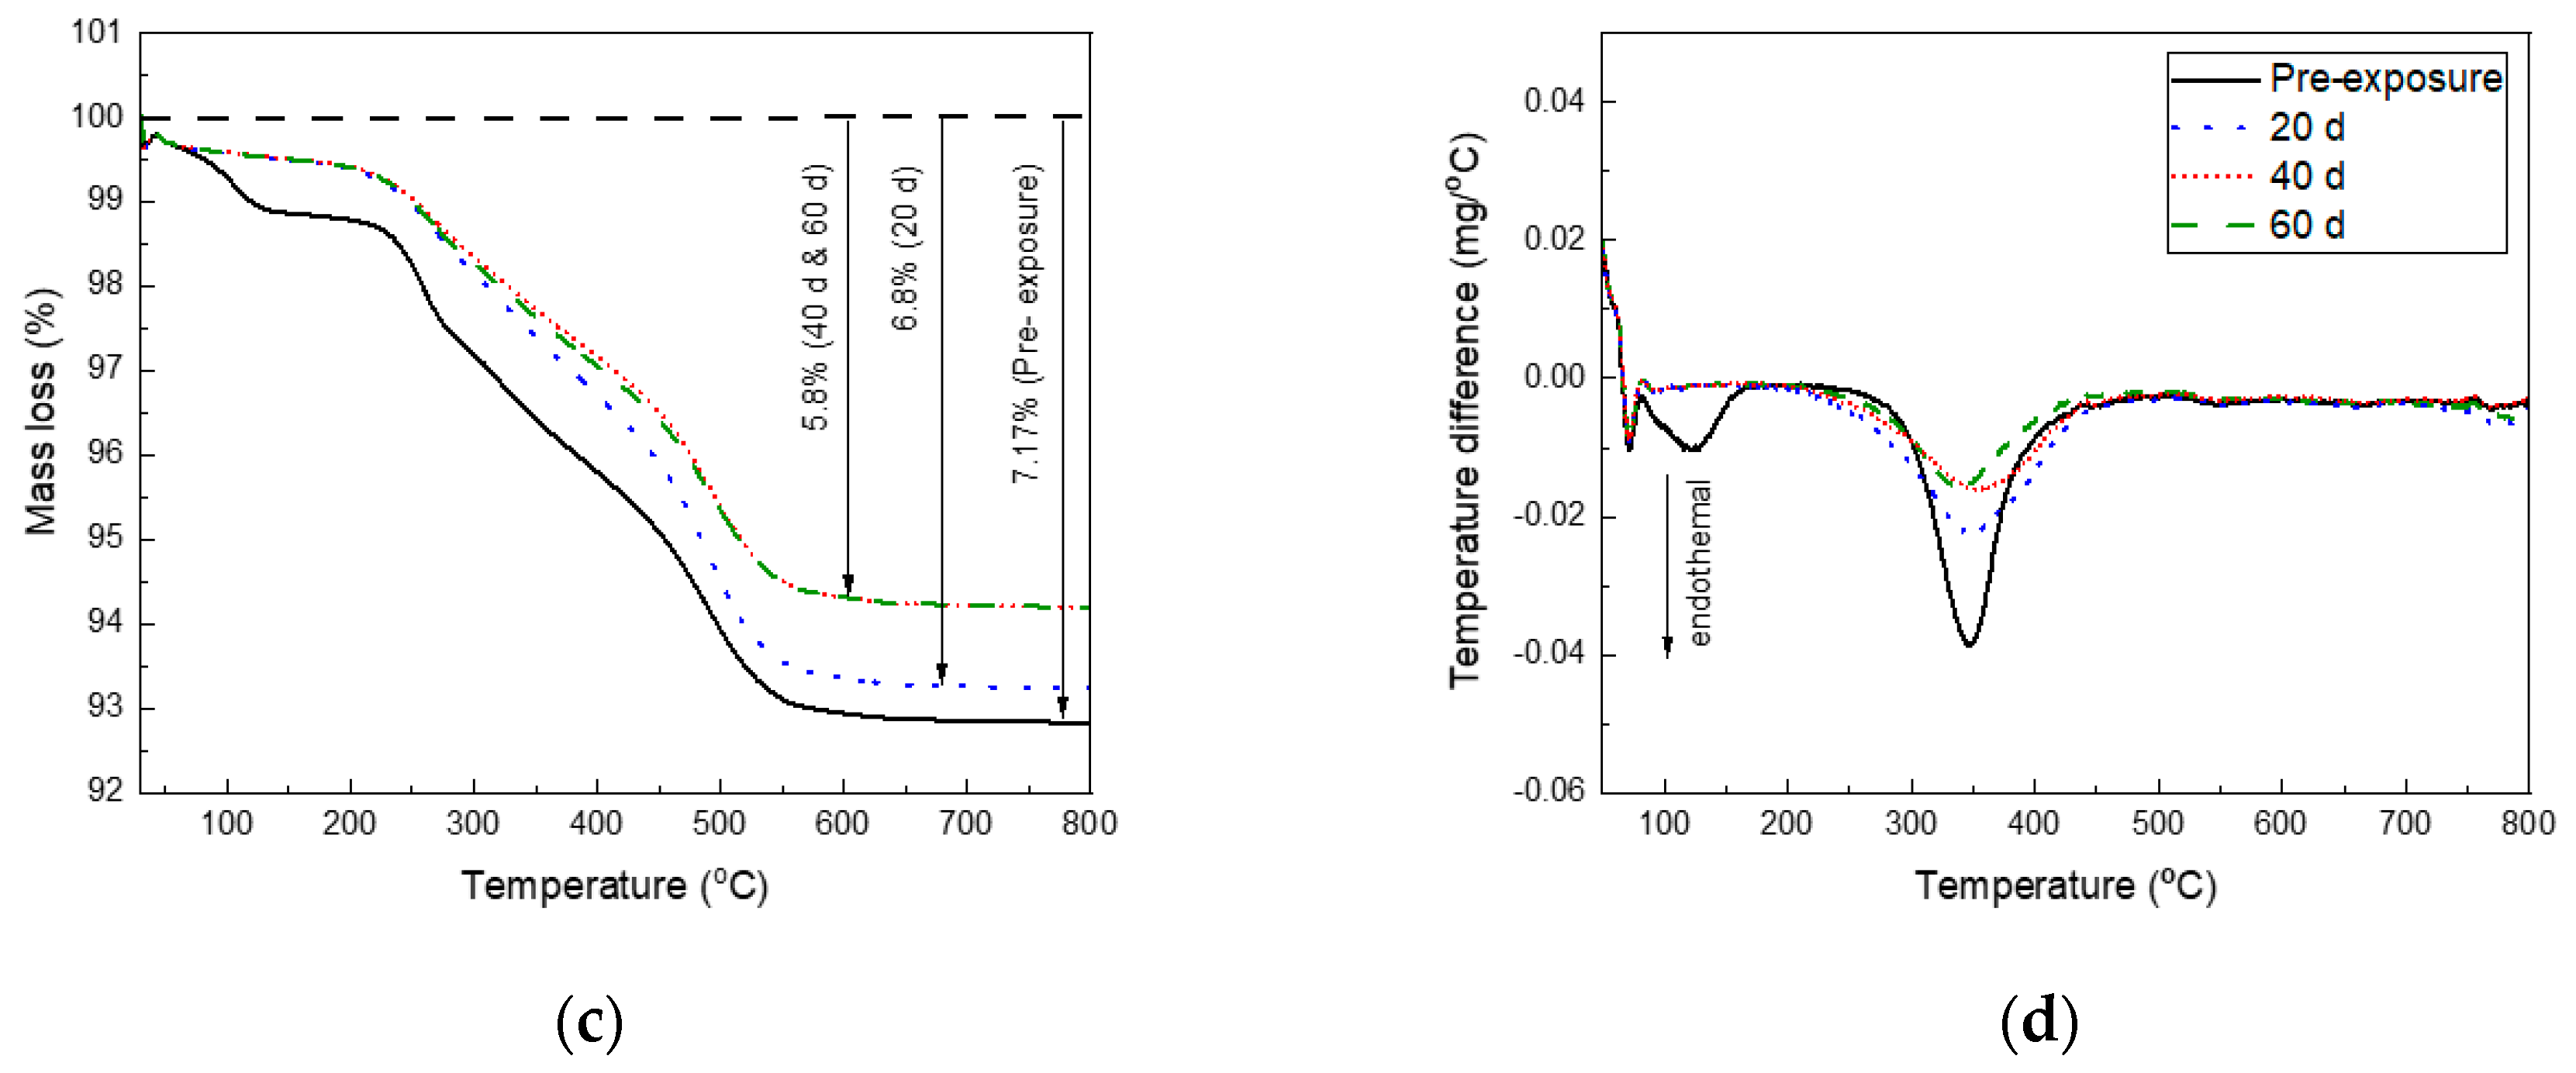
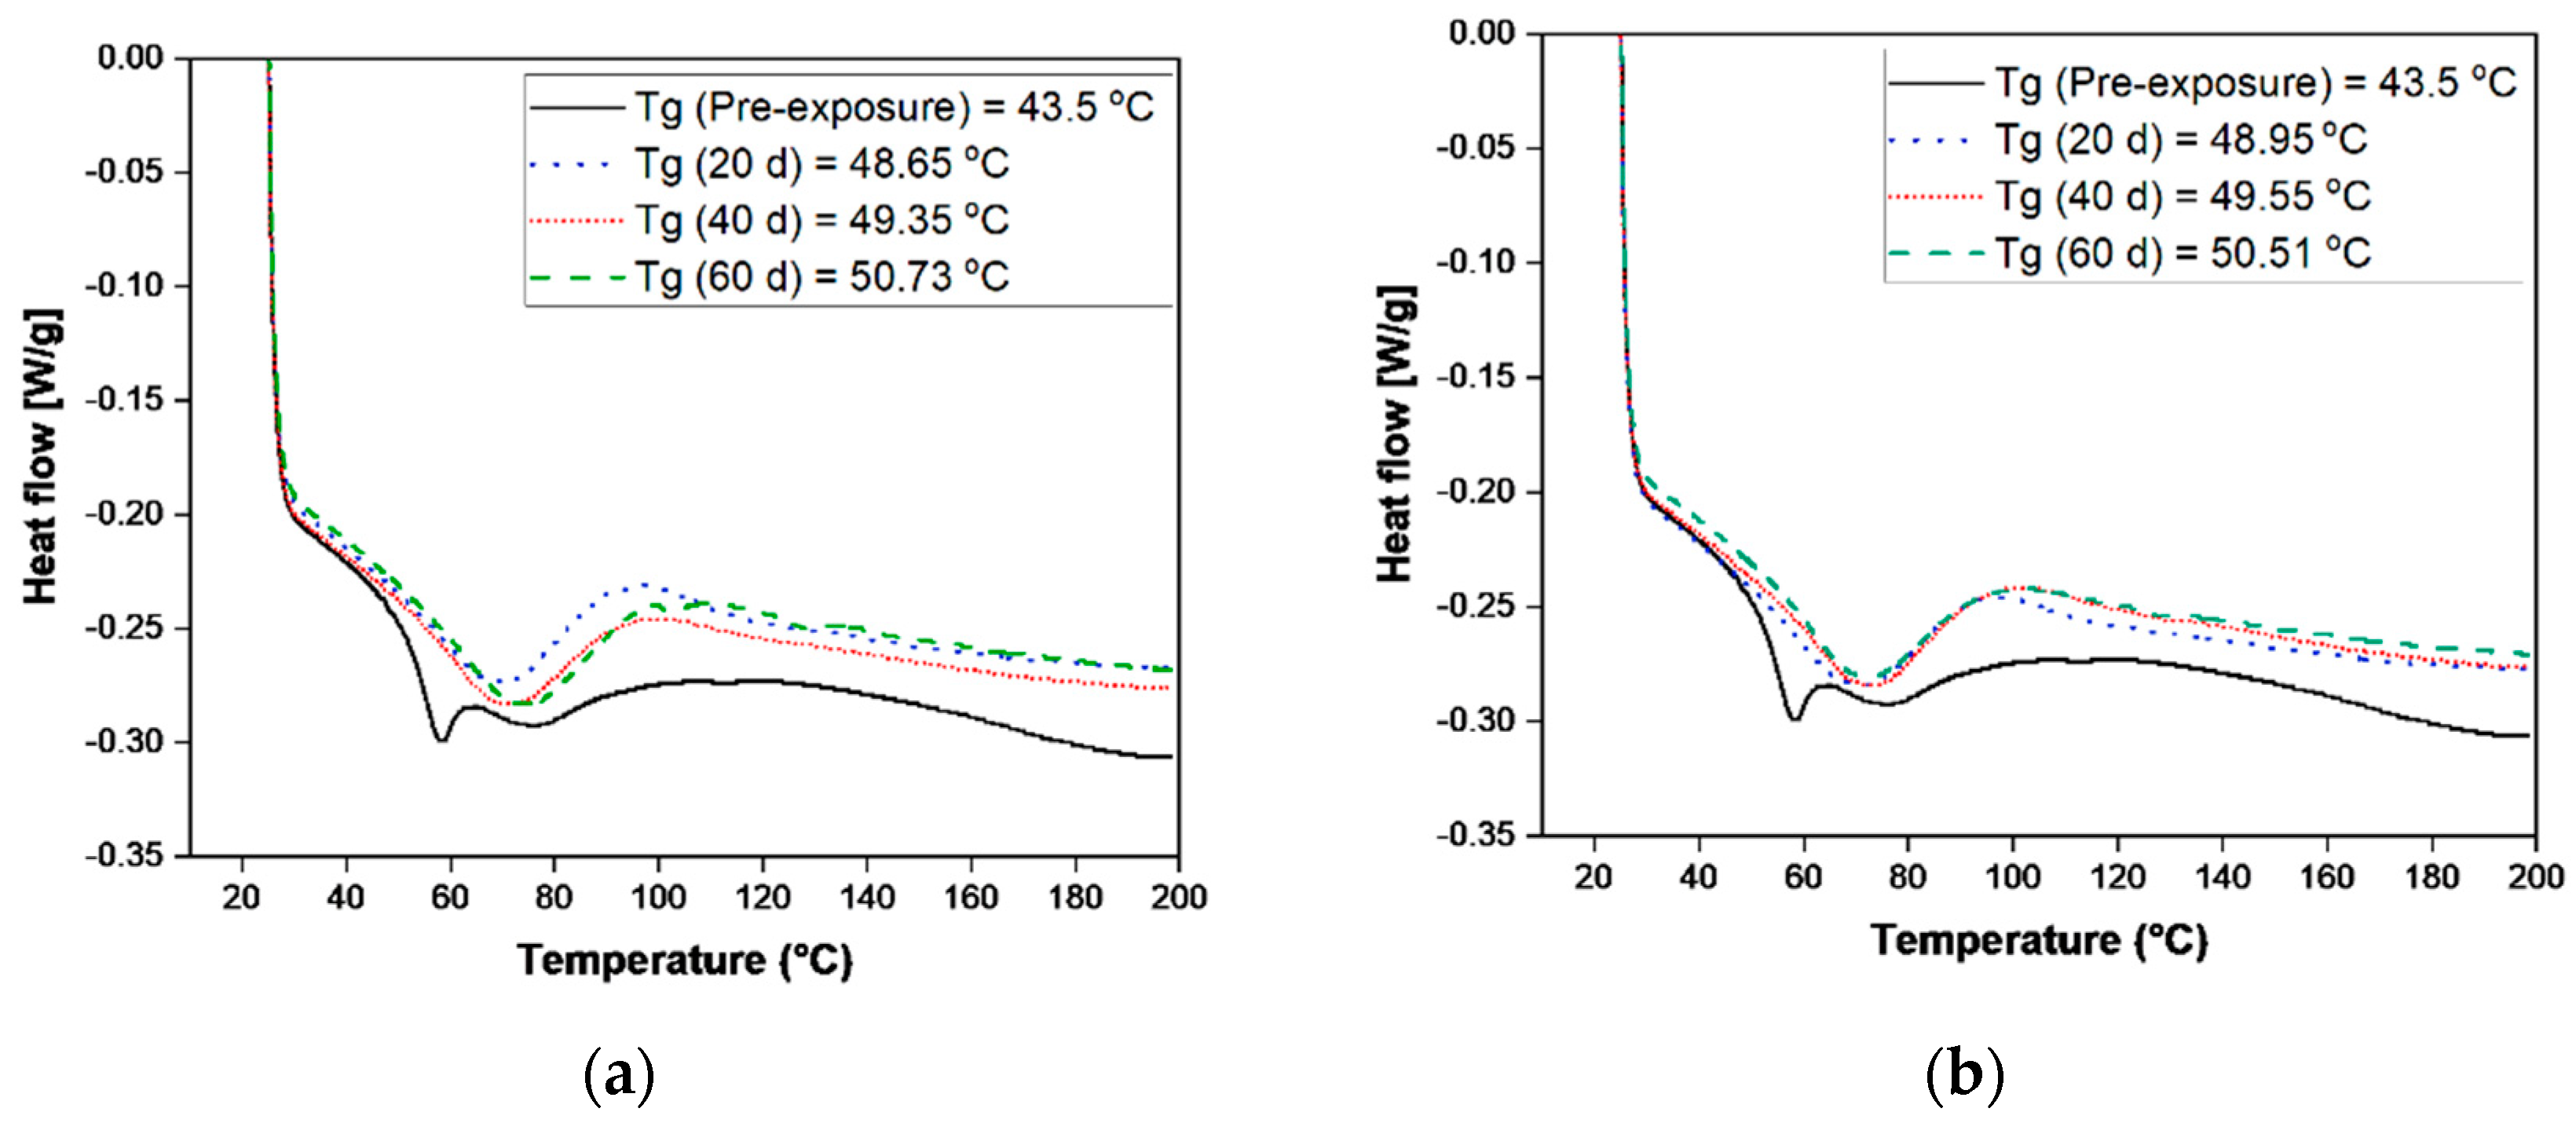
3.3. Thermal Behaviour
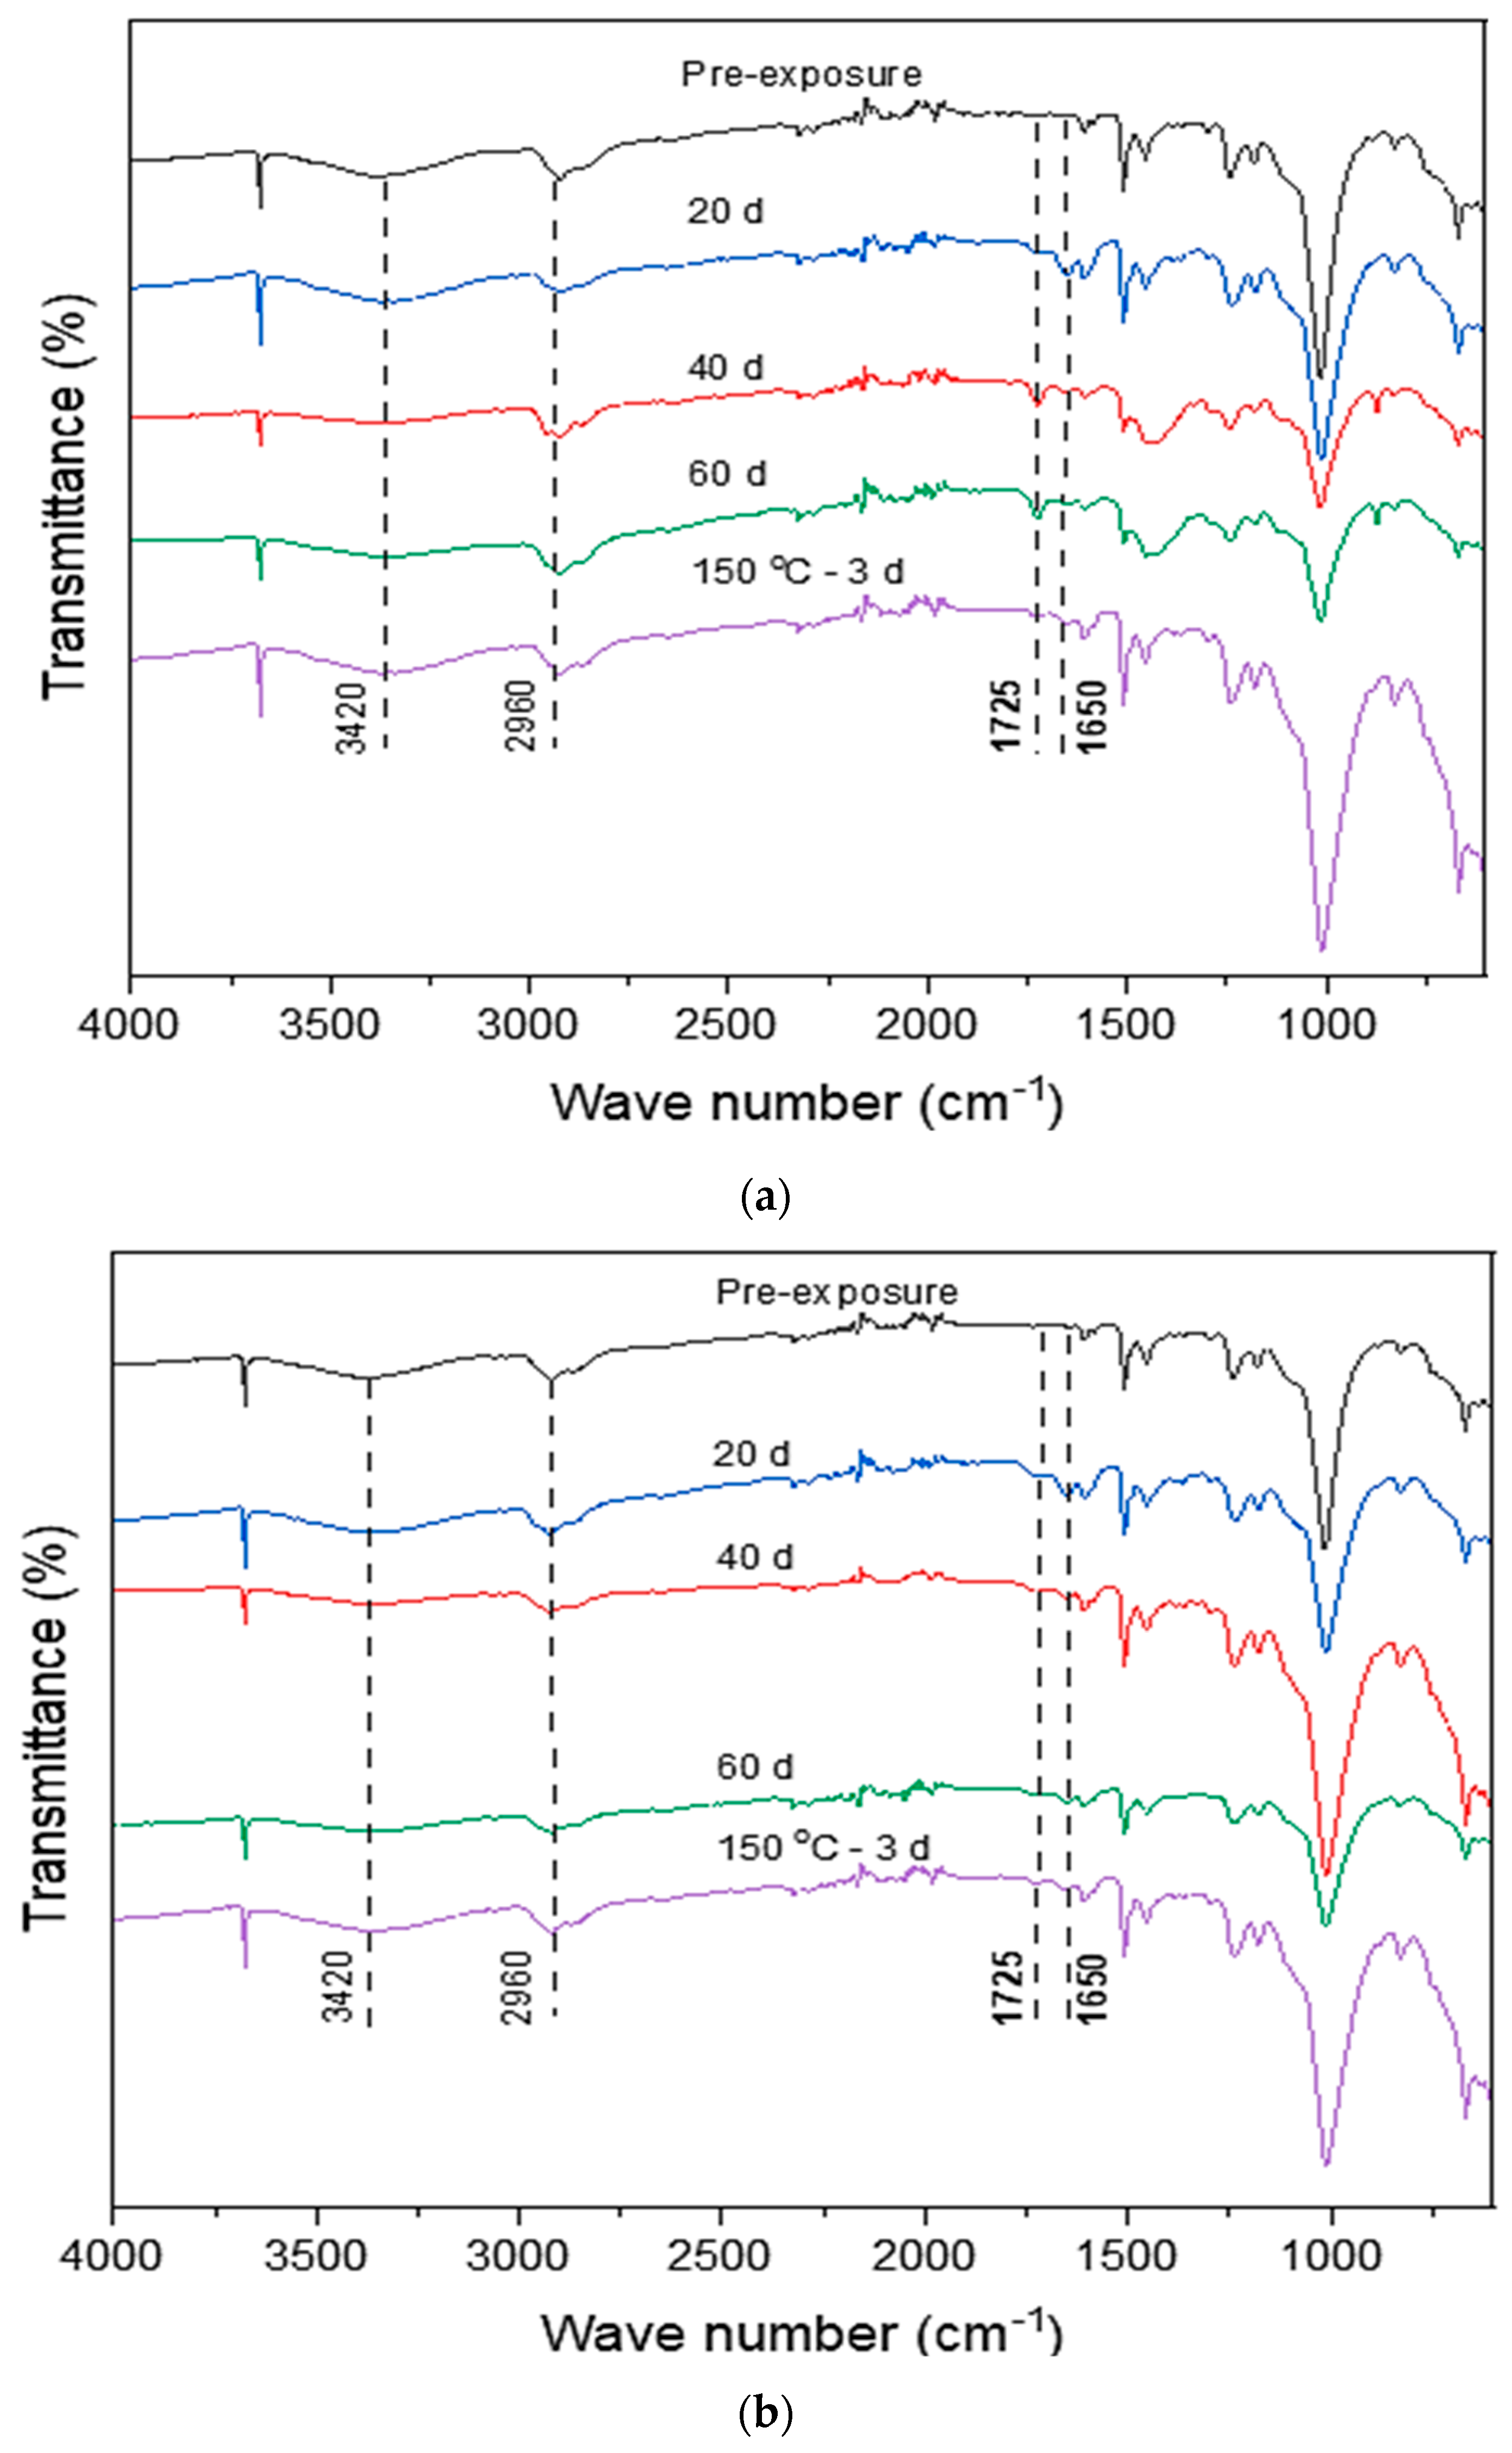
3.4. Chemical Properties
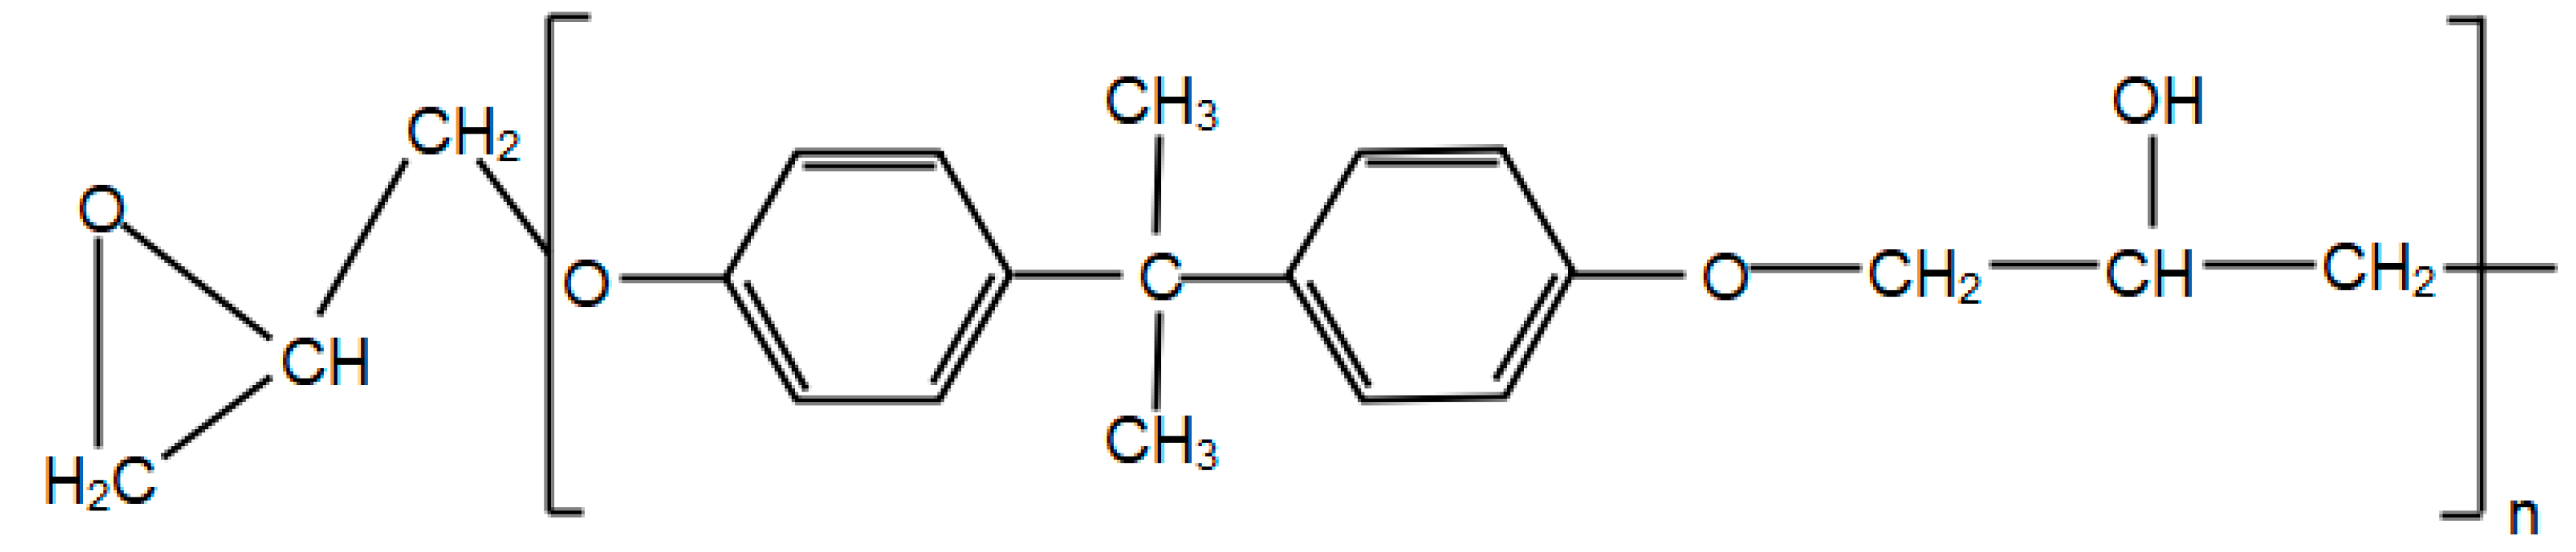
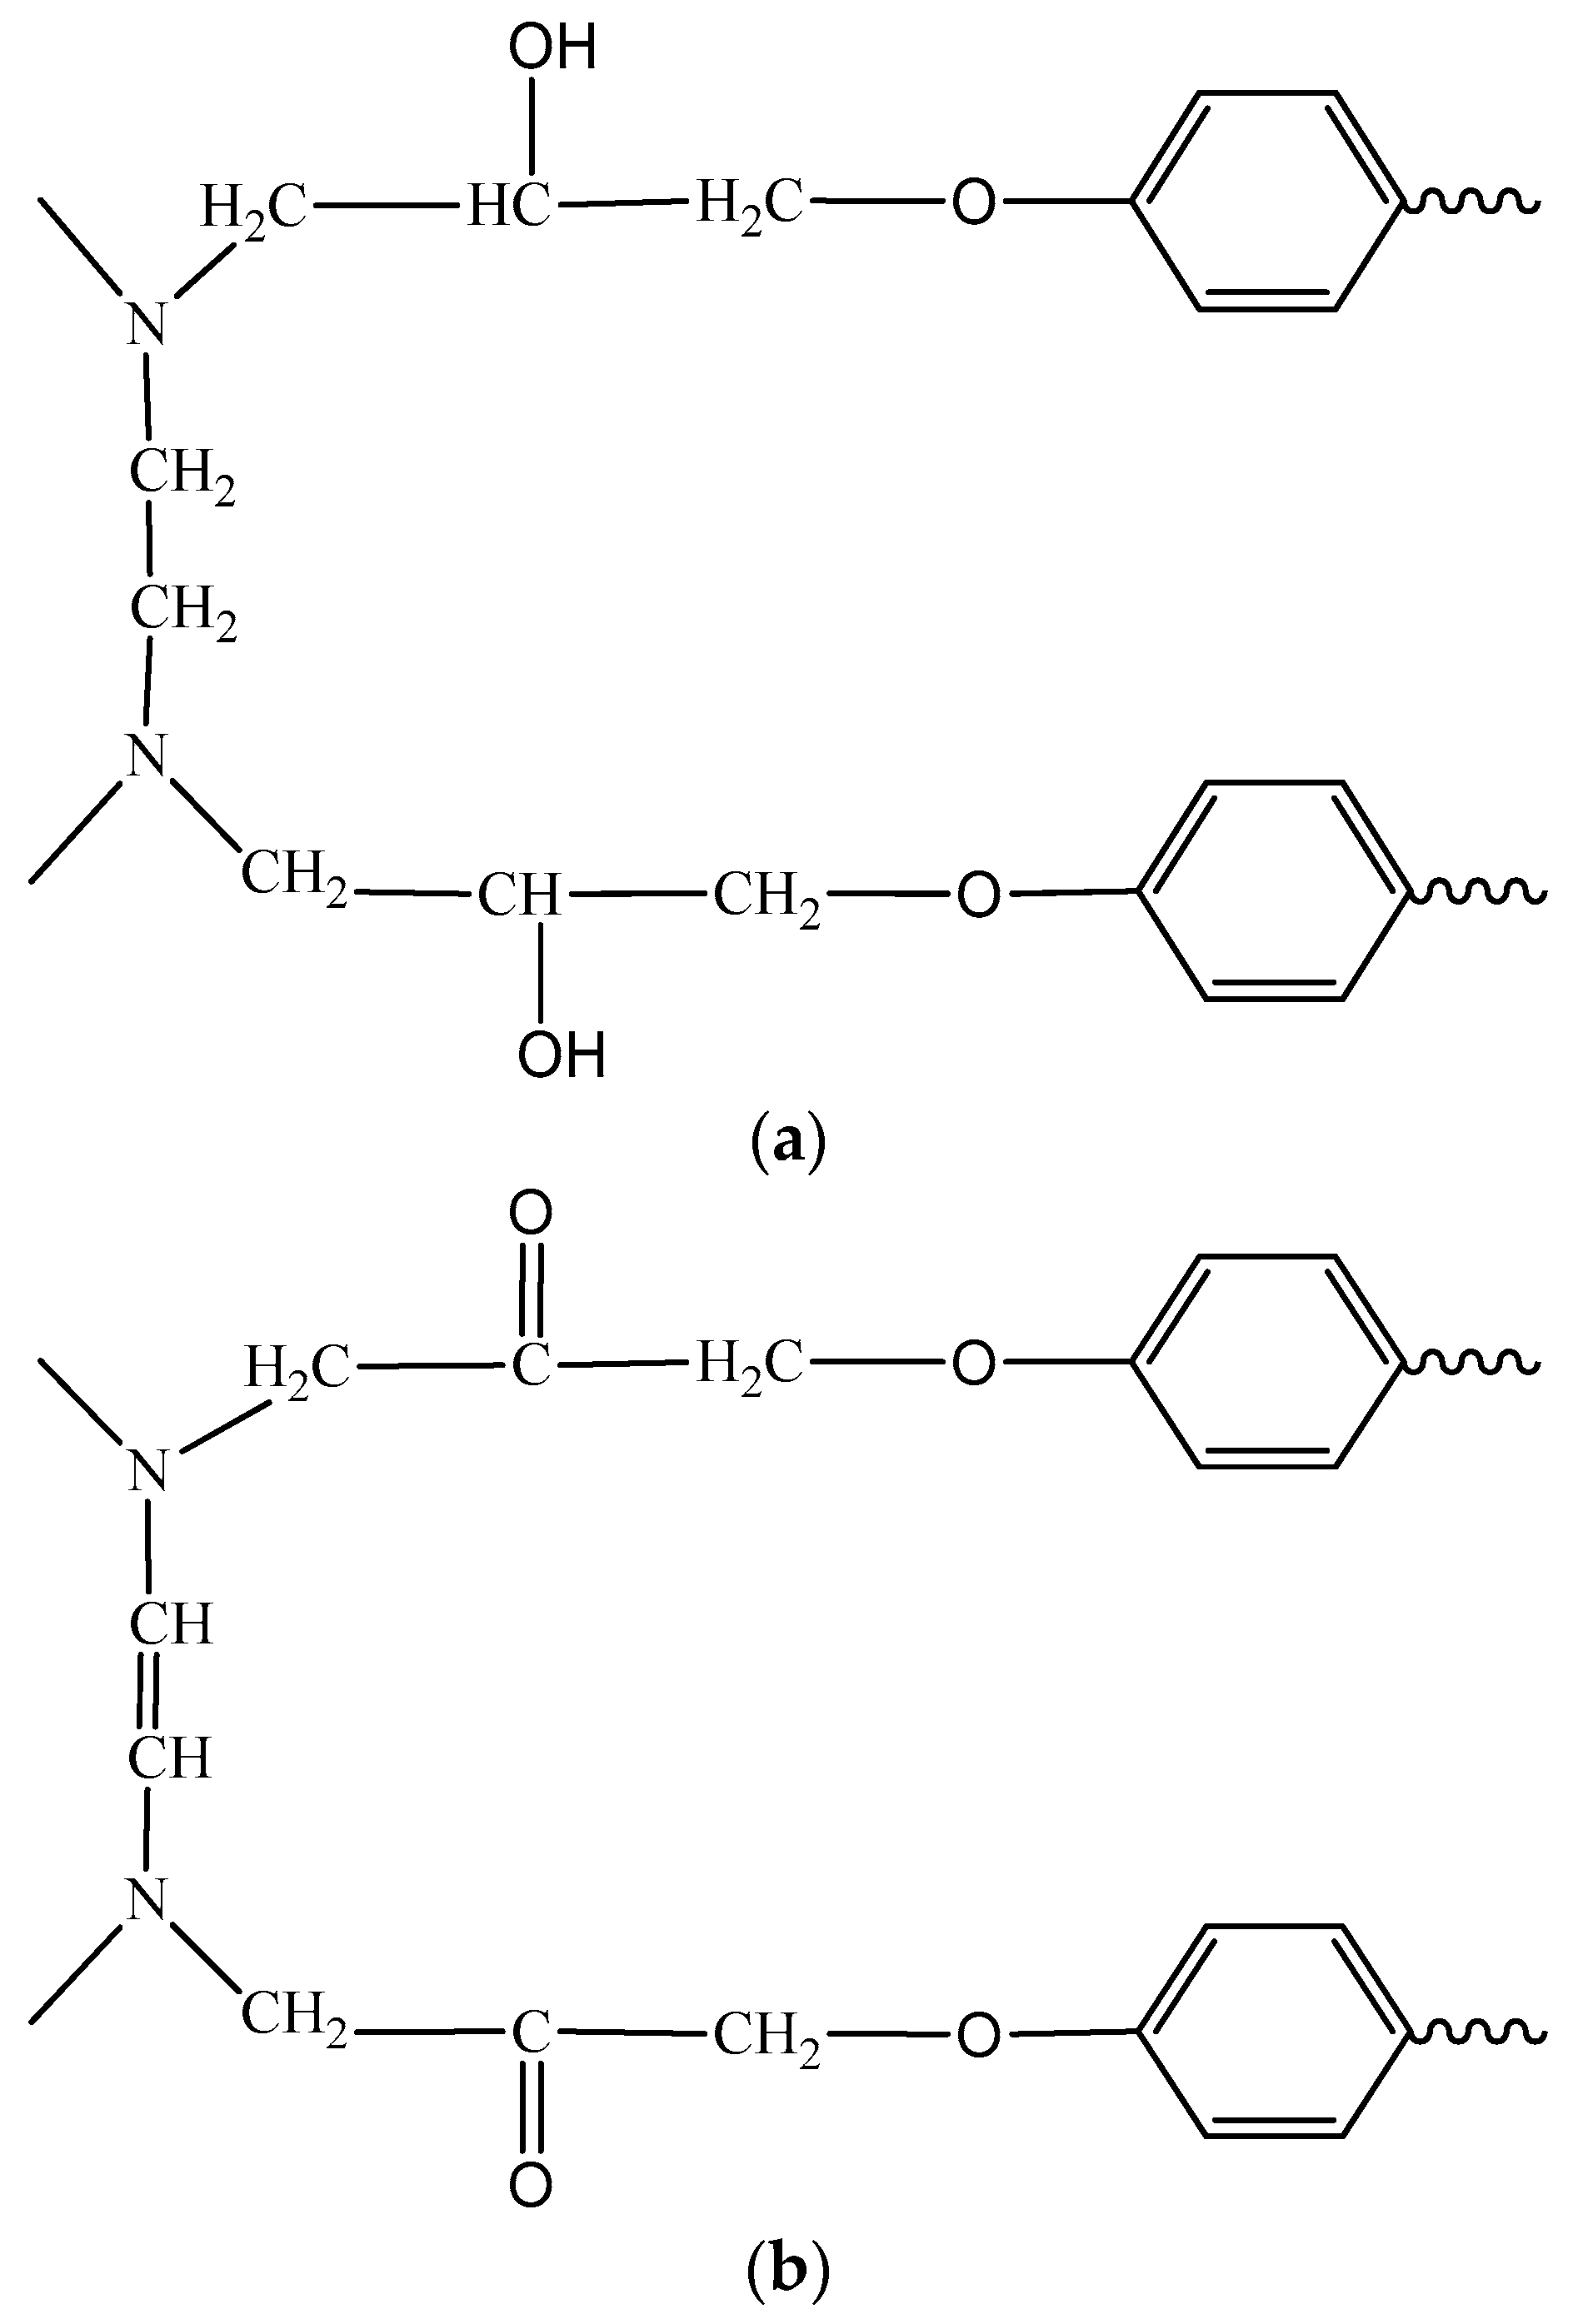
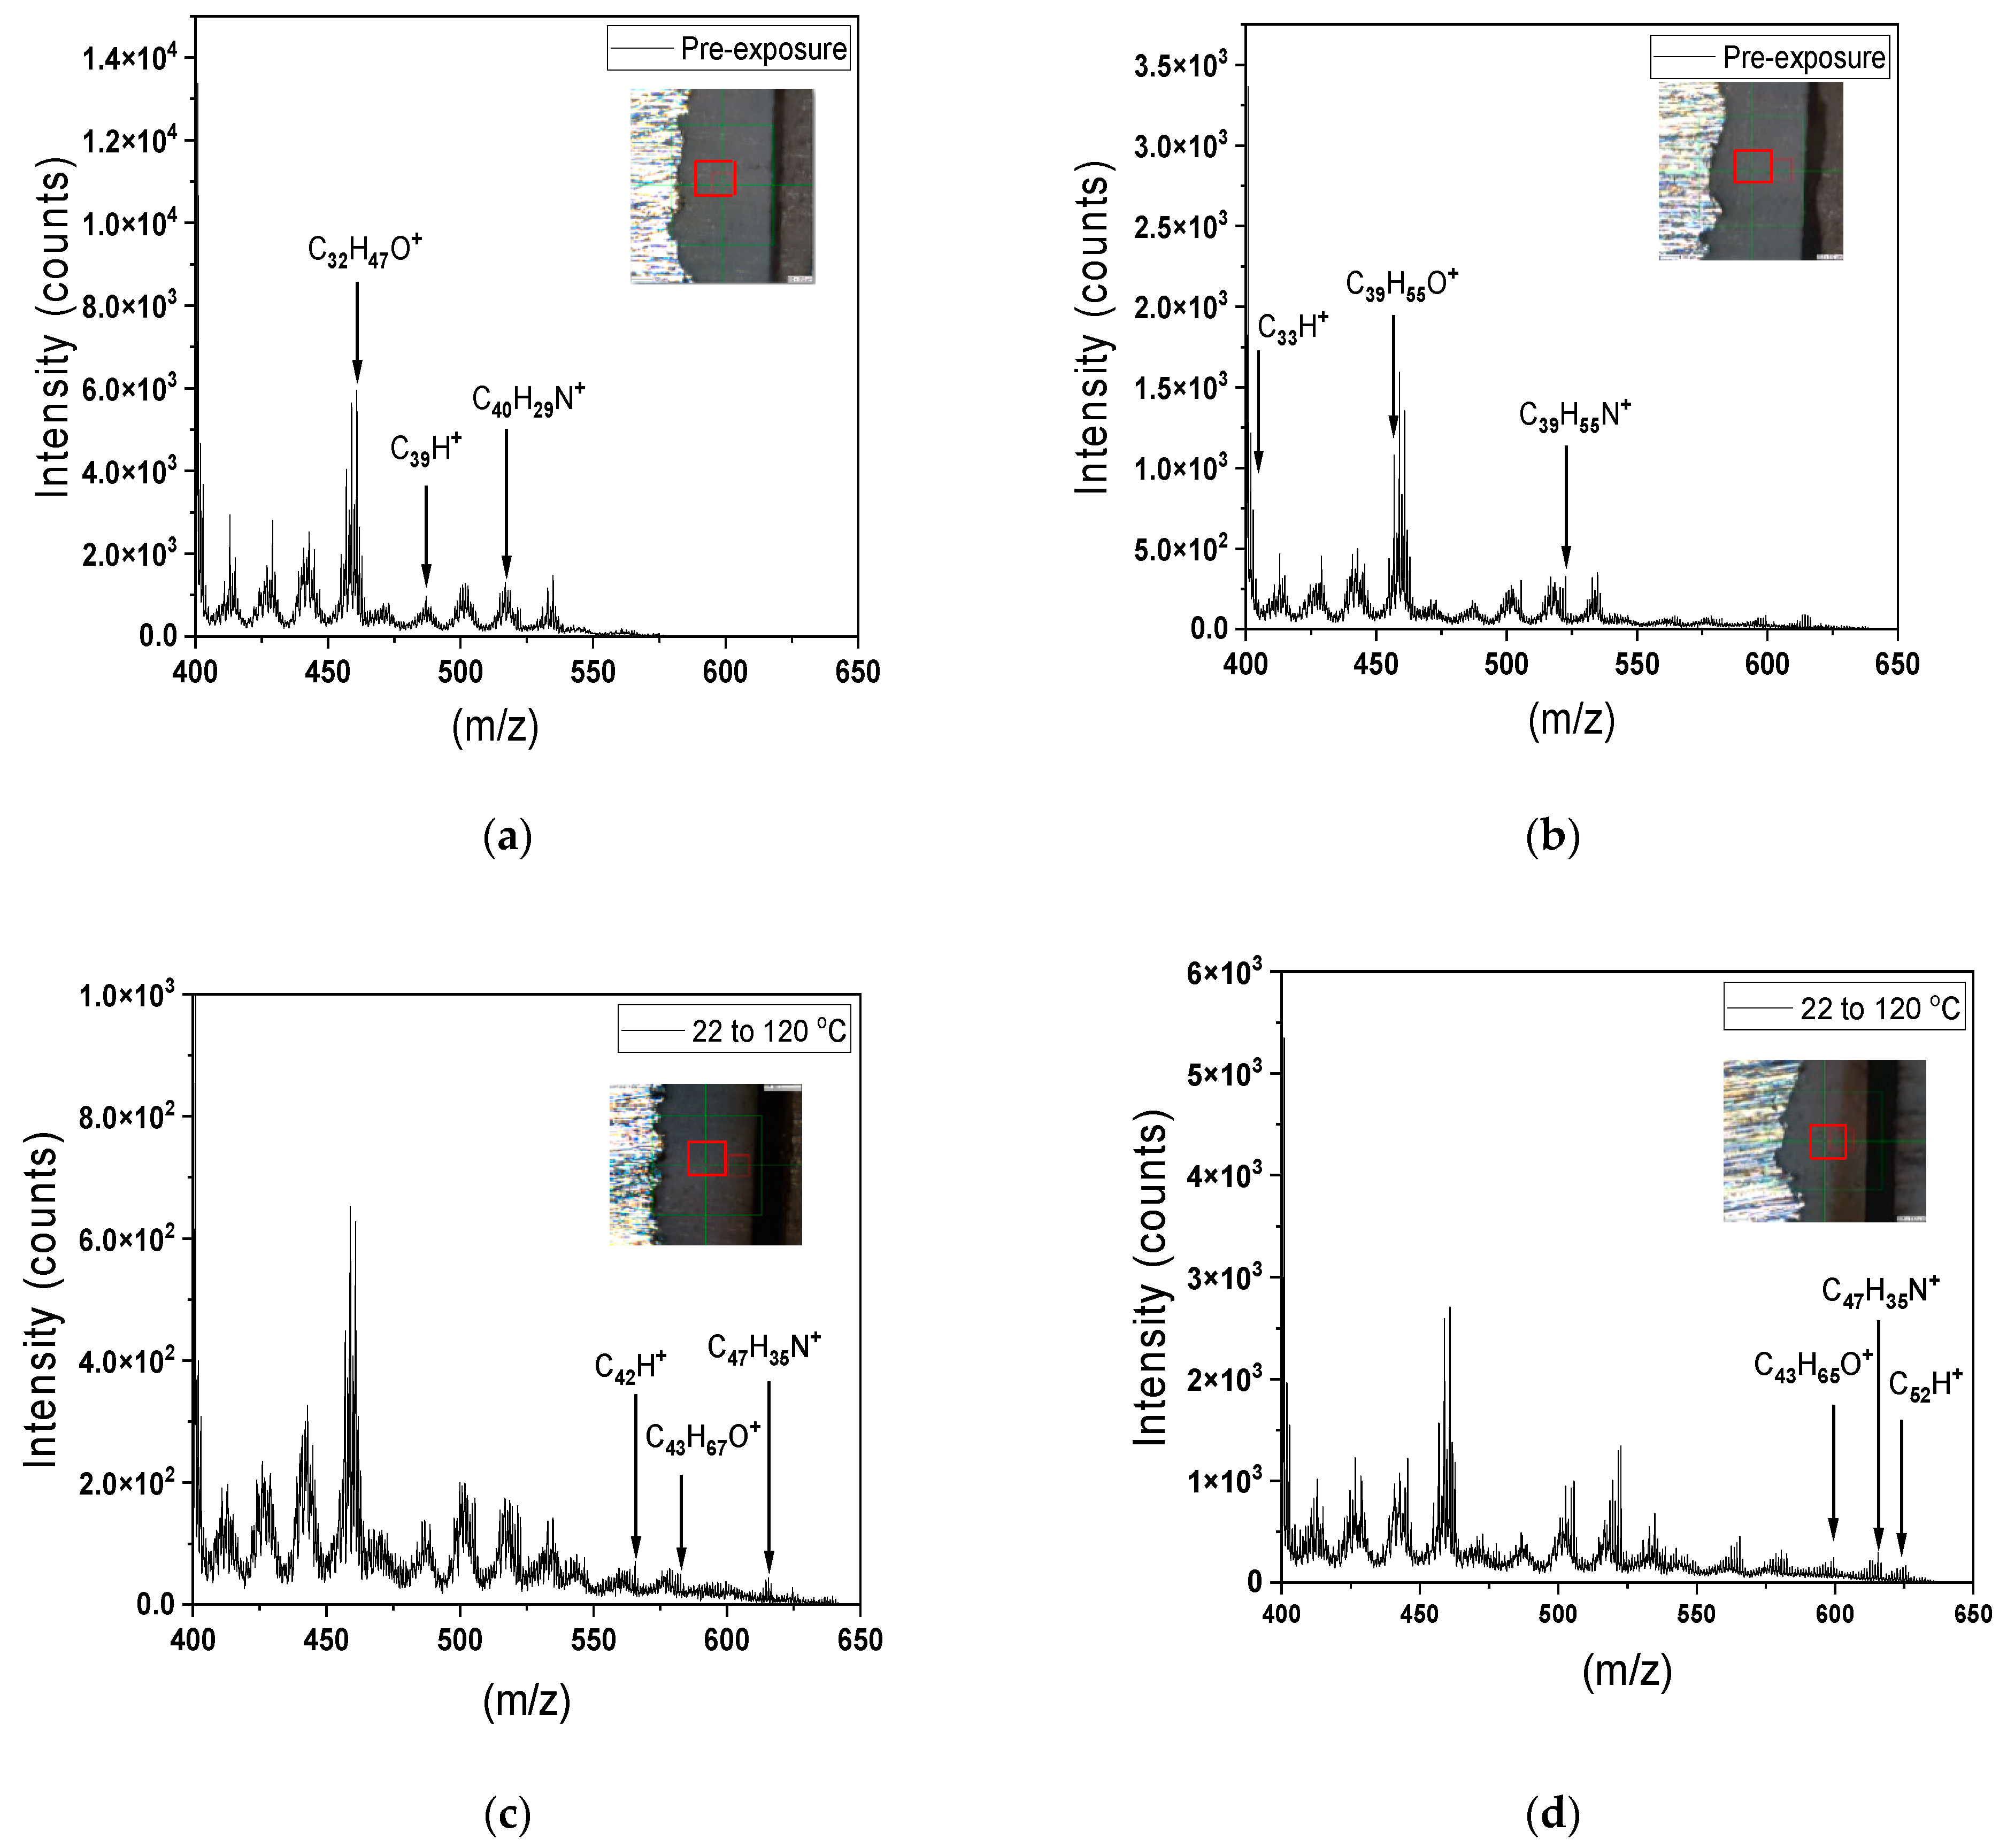
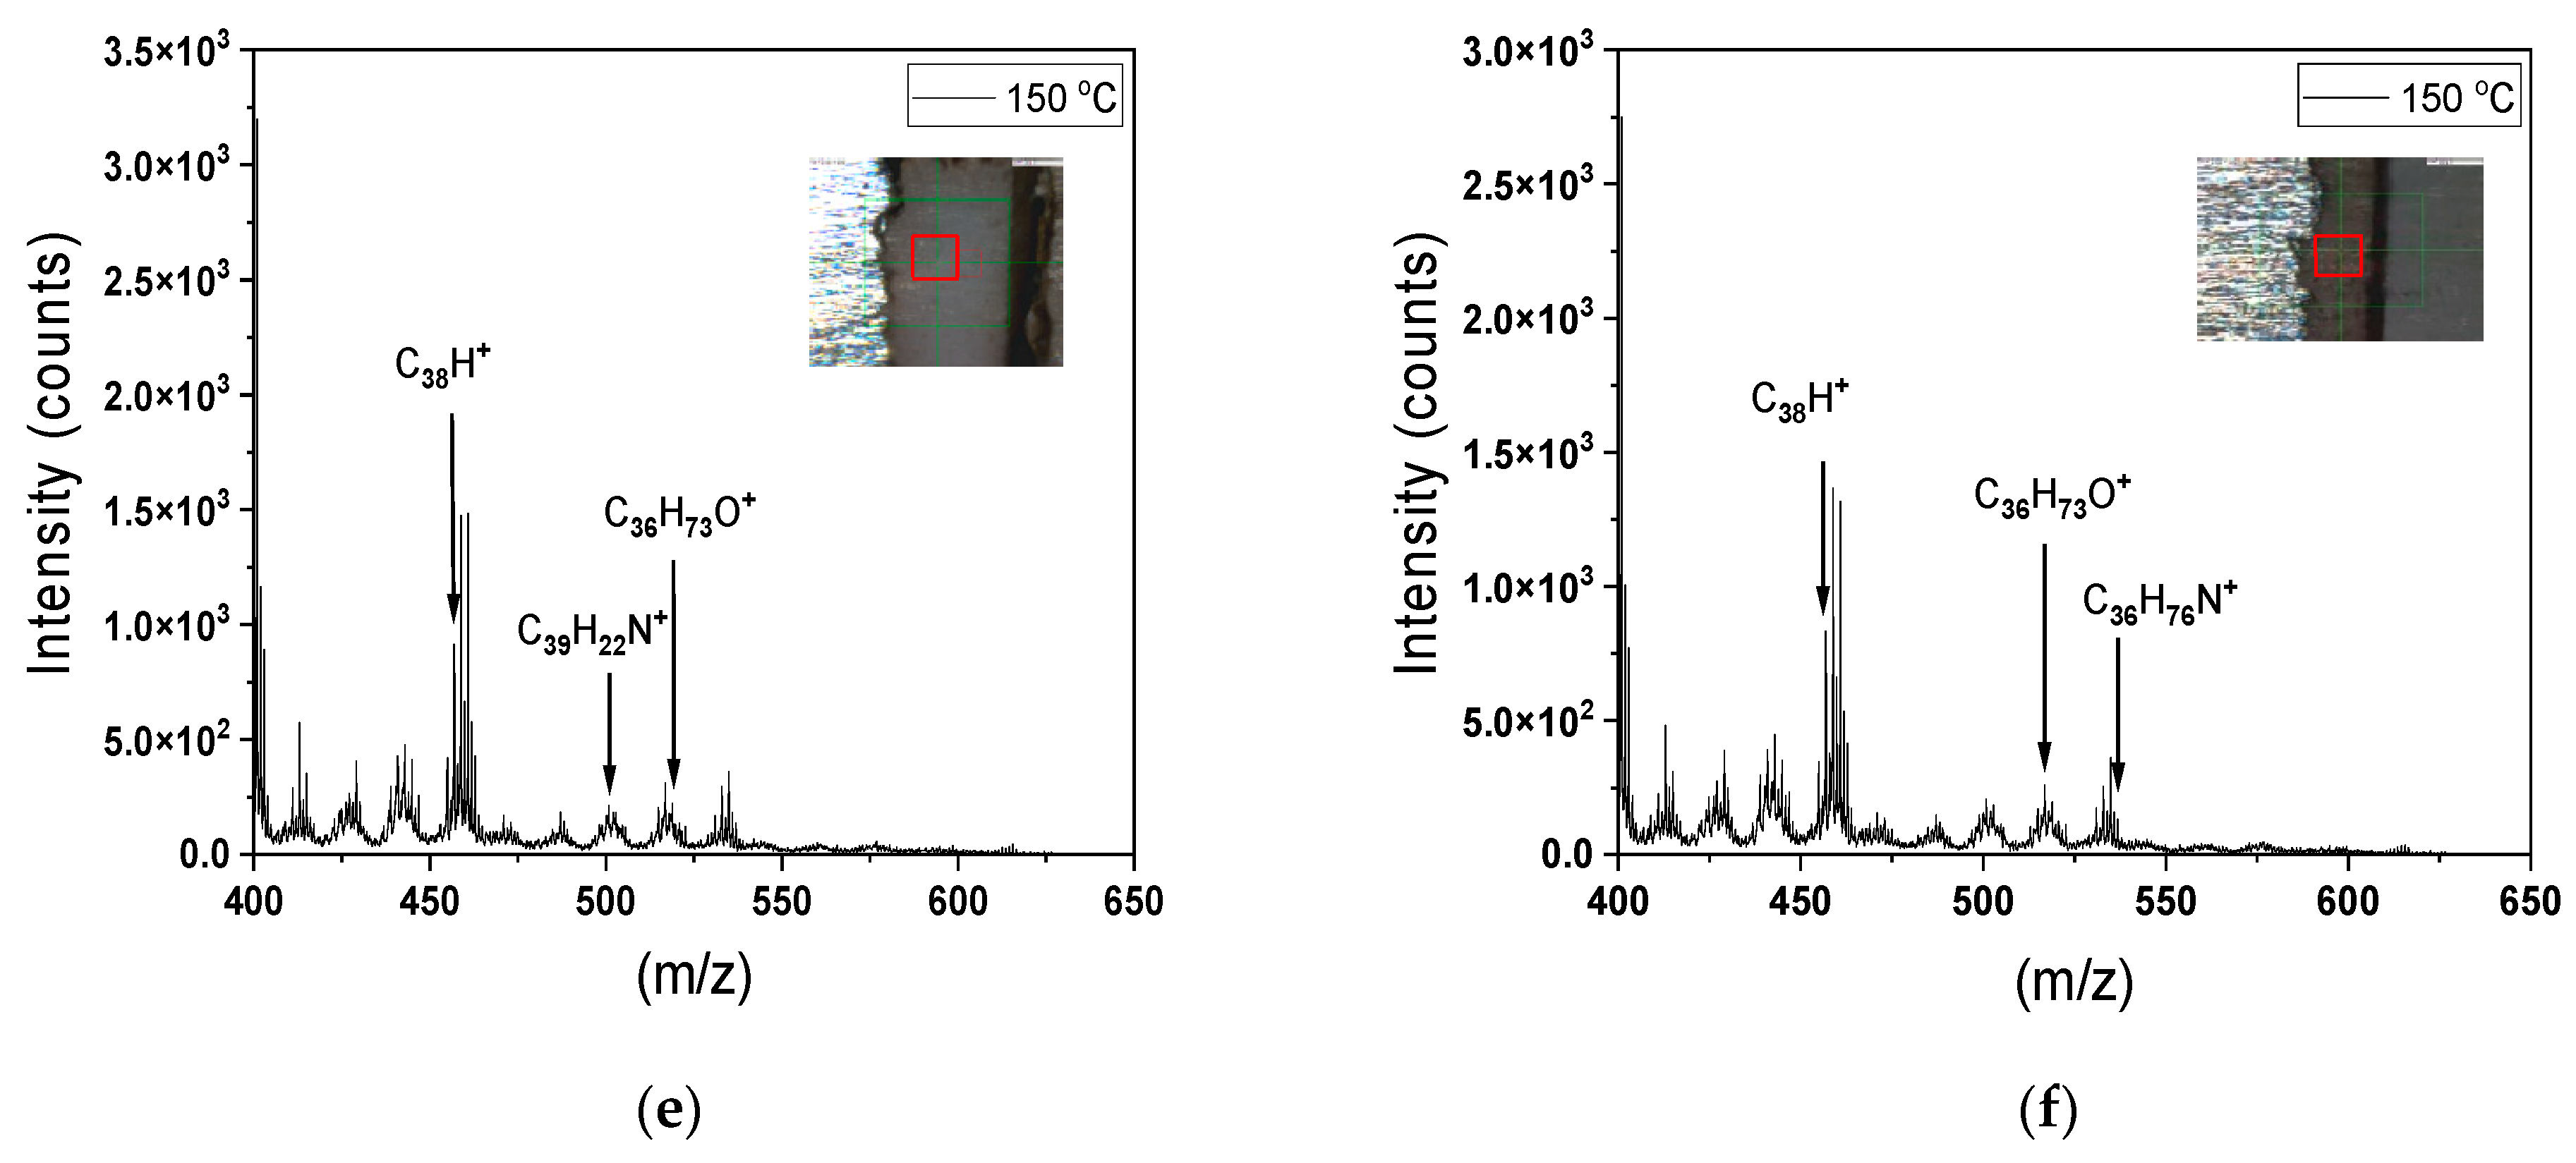
3.5. Molecular Structure of the Coatings
4. Conclusions
- Phenolic-epoxy coatings underwent post-curing when exposed to 120 °C for up to 40 d, resulting in enhanced coating performance, as demonstrated by the increased adhesion strengths and high impedance of the coatings.
- After further exposure for 60 d, the opposite results were obtained; i.e., coating degradation was evidenced by lower adhesion strengths.
- The ToF-SIMS results demonstrated enhanced cross-linking after thermal exposure due to the generation of larger hydrocarbon fragments.
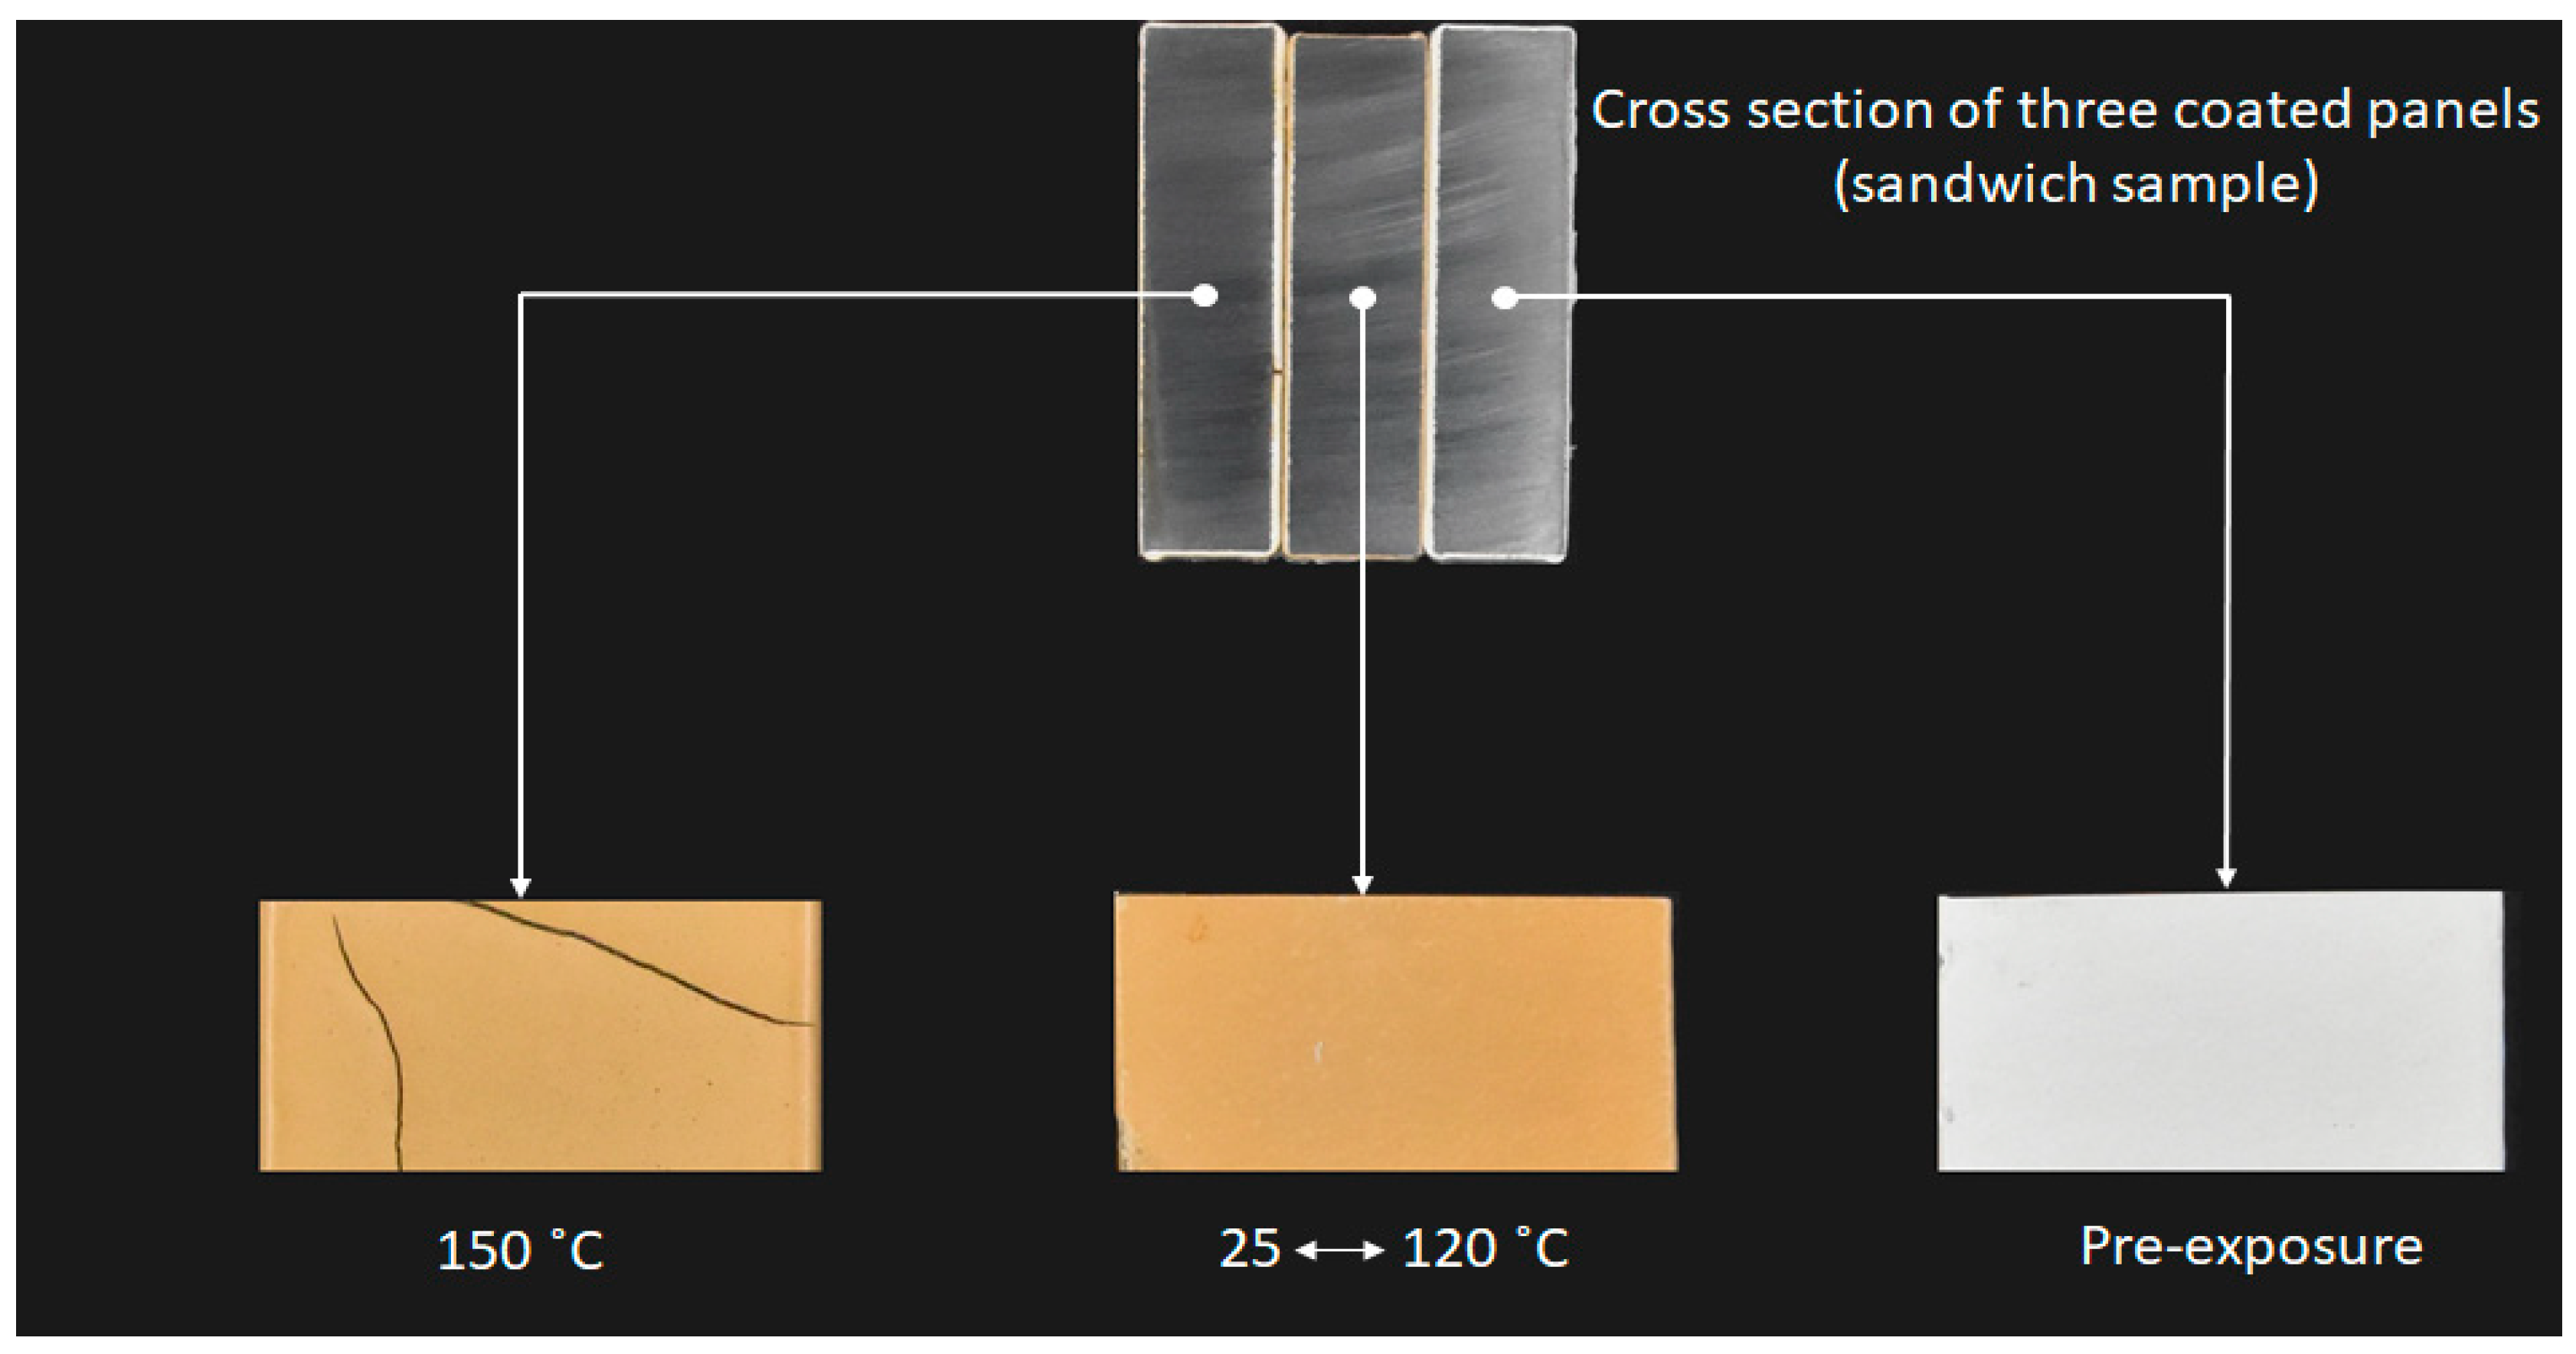
- In contrast, increasing the dry temperature from 120 to 150 °C led to a loss of hydrocarbon weight, resulting in cracking of the coating surface.
- Optimised dry-film thickness of phenolic-epoxy coating after heat treatment to provide maximum substrate protection.
Author Contributions
Funding
Data Availability Statement
Acknowledgments
Conflicts of Interest
References
- Bierwagen, G.P. Reflections on corrosion control by organic coatings. Prog. Org. Coat. 1996, 28, 43–48. [Google Scholar] [CrossRef]
- Croll, S.G. Stress and embrittlement in organic coatings during general weathering exposure: A review. Prog. Org. Coat. 2022, 172, 107085. [Google Scholar] [CrossRef]
- Tennent, N.H. Clear and pigmented epoxy resins for stained glass conservation: Light ageing studies. Stud. Conserv. 1979, 24, 153–164. [Google Scholar] [CrossRef]
- Fast, D.; A two step solution to the high cost of corrosion under insulation. Corrosionpedia 2020, p. 7. Available online: https://www.corrosionpedia.com/2/6495/corrosion-under-insulation-cui/a-two-step-solution-to-the-high-cost-of-corrosion-under-insulation (accessed on 25 February 2024).
- Dagdag, O.; Hsissou, R.; Berisha, A.; Erramli, H.; Hamed, O.; Jodeh, S.; El Harfi, A. Polymeric-Based Epoxy Cured with a Polyaminoamide as an Anticorrosive Coating for Aluminum 2024-T3 Surface: Experimental Studies Supported by Computational Modeling. J. Bio-Tribo-Corros. 2019, 5, 58. [Google Scholar] [CrossRef]
- Bahlakeh, G.; Ghaffari, M.; Saeb, M.R.; Ramezanzadeh, B.; De Proft, F.; Terryn, H. A Close-up of the Effect of Iron Oxide Type on the Interfacial Interaction between Epoxy and Carbon Steel: Combined Molecular Dynamics Simulations and Quantum Mechanics. J. Phys. Chem. C 2016, 120, 11014–11026. [Google Scholar] [CrossRef]
- Hsissou, R.; El Harfi, A. Application of pentaglycidyl ether penta-ethoxy phosphorus composites polymers formulated by two additives, trisodium phosphate (TSP) and natural phosphate(NP) and their combination in the behavior of the coating on E24 carbon steel in NaCl 3.5%. Anal. Bioanal. Electrochem. 2018, 10, 728–738. [Google Scholar]
- Hsissou, R.; Dagdag, O.; Berradi, M.; El Bouchti, M.; Assouag, M.; Elharfi, A. Development rheological and anti-corrosion property of epoxy polymer and its composite. Heliyon 2019, 5, e02789. [Google Scholar] [CrossRef]
- Hsissou, R.; Dagdag, O.; Abbout, S.; Benhiba, F.; Berradi, M.; El Bouchti, M.; Berisha, A.; Hajjaji, N.; Elharfi, A. Novel derivative epoxy resin TGETET as a corrosion inhibition of E24 carbon steel in 1.0 M HCl solution. Experimental and computational (DFT and MD simulations) methods. J. Mol. Liq. 2019, 284, 182–192. [Google Scholar] [CrossRef]
- Es-Sahbany, H.; Berradi, M.; Nkhili, S.; Hsissou, R.; Allaoui, M.; Loutfi, M.; Bassir, D.; Belfaquir, M.; El Youbi, M.S. Removal of heavy metals (nickel) contained in wastewater-models by the adsorption technique on natural clay. Mater. Today Proc. 2019, 13, 866–875. [Google Scholar] [CrossRef]
- Ogata, M.; Kinjo, N.; Kawata, T. Effects of crosslinking on physical properties of phenol–formaldehyde novolac cured epoxy resins. J. Appl. Polym. Sci. 1993, 48, 583–601. [Google Scholar] [CrossRef]
- Charlesworth, J.M. Effect of crosslink density on the molecular relaxations in diepoxide-diamine network polymers. Part 1. The glassy region. Polym. Eng. Sci. 1988, 28, 221–229. [Google Scholar] [CrossRef]
- ISO 19277:2018; Petroleum, Petrochemical and Natural Gas. International Organization for Standardization: Geneva, Switzerland, 2018; Volume 2012, p. 12.
- ASTM D4541-09; Standard Test Method for Pull-Off Strength of Coatings Using Portable Adhesion. ASTM International: West Conshohocken, PA, USA, 2014. [CrossRef]
- Prime, R.B.; Bair, H.E.; Vyazovkin, S.; Gallagher, P.K.; Riga, A. Thermogravimetric Analysis (TGA). In Thermal Analysis of Polymers: Fundamentals and Applications; Wiley and Sons Inc.: Hoboken, NJ, USA, 2008; ISBN 9780471769170. [Google Scholar]
- Singh, R.; Schruefer, S.; Wilson, S.; Gibmeier, J.; Vassen, R. Influence of coating thickness on residual stress and adhesion-strength of cold-sprayed Inconel 718 coatings. Surf. Coat. Technol. 2018, 350, 64–73. [Google Scholar] [CrossRef]
- Kambhampati, S.; Pojtanabuntoeng, T. A systemic study on the effects of key influencing factors on pull-off adhesion test of organic coatings. Corros. Sci. Eng. 2023, 1, 11. [Google Scholar]
- Li, X.; Deng, S.; Fu, H. Blue tetrazolium as a novel corrosion inhibitor for cold rolled steel in hydrochloric acid solution. Corros. Sci. 2010, 52, 2786–2792. [Google Scholar] [CrossRef]
- Mahdavian, M.; Ashhari, S. Mercapto functional azole compounds as organic corrosion inhibitors in a polyester-melamine coating. Prog. Org. Coat. 2010, 68, 259–264. [Google Scholar] [CrossRef]
- Granata, R.D. Polymer Coating Degradation Mechanisms Related to Hot Production; Defense Technical Information Center: Houston, TX, USA, 1993. [Google Scholar]
- Morancho, J.M.; Salla, J.M.; Ramis, X.; Cadenato, A. Comparative study of the degradation kinetics of three powder thermoset coatings. Thermochim. Acta 2004, 419, 181–187. [Google Scholar] [CrossRef]
- Puglia, D.; Manfredi, L.B.; Vazquez, A.; Kenny, J.M. Thermal degradation and fire resistance of epoxy-amine-phenolic blends. Polym. Degrad. Stab. 2001, 73, 521–527. [Google Scholar] [CrossRef]
- Kandola, B.K.; Biswas, B.; Price, D.; Horrocks, A.R. Studies on the effect of different levels of toughener and flame retardants on thermal stability of epoxy resin. Polym. Degrad. Stab. 2010, 95, 144–152. [Google Scholar] [CrossRef]
- Sarathi, R.; Sahu, R.K.; Rajeshkumar, P. Understanding the thermal, mechanical and electrical properties of epoxy nanocomposites. Mater. Sci. Eng. A 2007, 445, 567–578. [Google Scholar] [CrossRef]
- Zaccone, A.; Terentjev, E.M. Disorder-assisted melting and the glass transition in amorphous solids. Phys. Rev. Lett. 2013, 110, 178002. [Google Scholar] [CrossRef]
- van Dooren, A.A.; Müller, B.W. Purity determinations of drugs with differential scanning calorimetry (DSC)-a critical review. Int. J. Pharm. 1984, 20, 217–233. [Google Scholar] [CrossRef]
- Alpert, N.L.; Keiser, W.E.; Szymanski, H.A. IR—Theory and practice of infrared spectroscopy. J. Mol. Struct. 1974, 23, 320. [Google Scholar] [CrossRef]
- Treverton, J.A.; Paul, A.J.; Vickerman, J.C. Characterization of adhesive and coating constituents by time-of-flight secondary ion mass spectrometry (ToF-SIMS). Part 1: Epoxy-terminated diglycidyl polyethers of bisphenol-A and propal-2-ol. Surf. Interface Anal. 1993, 20, 449–456. [Google Scholar] [CrossRef]
- Decelle, J.; Huet, N.; Bellenger, V. Oxidation induced shrinkage for thermally aged epoxy networks. Polym. Degrad. Stab. 2003, 81, 239–248. [Google Scholar] [CrossRef]
- Awaja, F.; Van Riessen, G.; Kelly, G.; Fox, B.; Pigram, P.J. Tof-sims investigation of epoxy resin curing reaction at different resin to hardener ratios. J. Appl. Polym. Sci. 2008, 110, 2711–2717. [Google Scholar] [CrossRef]
- Awaja, F.; Pigram, P.J. Surface molecular characterisation of different epoxy resin composites subjected to UV accelerated degradation using XPS and ToF-SIMS. Polym. Degrad. Stab. 2009, 94, 651–658. [Google Scholar] [CrossRef]


| Phenolic Epoxy | Proportion |
|---|---|
| Bisphenol-A epoxy resin | 10–30% |
| Benzyl alcohol | 1–10% |
| Bisphenol-F epoxy resin | 1–10% |
| Methylisobutyl ketone | 1–10% |
| Xylene | 1–10% |
| Amine hardener | Proportion |
| Isophorone diamine | >60% |
| Duration (Days) | Adhesion Force (MPa) at Constant Temperature | Adhesion Increase (%) | Average Thickness (μm) | Adhesion Force (MPa) at Cycling Temperature | Adhesion Increase (%) | Average Thickness (μm) |
|---|---|---|---|---|---|---|
| 20 | 13.7 ± 0.75 | 15.3 | 265 ± 73 | 14.3 ± 1.61 | 18.9 | 215 ± 40.87 |
| 40 | 20.2 ± 2.9 | 42.6 | 210 ± 54 | 24.9 ± 3.6 | 53.4 | 195 ± 73.08 |
| 60 | 14.2 ± 2.4 | 18.3 | 220 ± 20.82 | 13.1 ± 2.2 | 11.5 | 168 ± 13.65 |
| Duration (Days) | Rcoat (Ω·cm2) | Ycoat S·secn·cm−2 | ncoat | Χ2 |
|---|---|---|---|---|
| Pre-exposure | 8.12 × 10⁸ | 1.8 × 10⁻⁹ | 0.84 | 5.55 × 10⁻³ |
| 20 d | 1.03 × 10¹⁰ | 3.90 × 10⁻¹⁰ | 0.965 | 8.05 × 10⁻⁴ |
| 40 d | 3.18 × 10¹⁰ | 5.23 × 10⁻¹⁰ | 0.994 | 3.63 × 10⁻³ |
| 60 d | 1.48 × 10¹⁰ | 4.66 × 10⁻¹⁰ | 0.977 | 1.46 × 10⁻⁴ |
| Duration (Days) | Rcoat (Ω·cm2) | Ycoat S·secn·cm−2 | ncoat | Χ2 |
|---|---|---|---|---|
| Pre-exposure | 8.12 × 10⁸ | 1.8 × 10⁻⁹ | 0.84 | 5.55 × 10⁻³ |
| 20 d | 2.36 × 10¹⁰ | 4.36 × 10⁻¹⁰ | 0.991 | 1.46 × 10⁻⁴ |
| 40 d | 3.38 × 10¹⁰ | 5.73 × 10⁻¹⁰ | 0.998 | 9.48 × 10⁻⁴ |
| 60 d | 3.29 × 10¹⁰ | 5.03 × 10⁻¹⁰ | 0.968 | 1.51 × 10⁻⁴ |
| Rcoat (Ω·cm2) | Rct (Ω·cm2) | Ycoat S·secn·cm−2 | ncoat | Ydl S·secn·cm−2 | ndl | Χ2 |
|---|---|---|---|---|---|---|
| 1.1 × 10⁴ | 1.35 × 10⁴ | 4.62 × 10⁻⁴ | 0.98 | 2.14 × 10⁻⁷ | 0.71 | 2.37 × 10⁻⁴ |
Disclaimer/Publisher’s Note: The statements, opinions and data contained in all publications are solely those of the individual author(s) and contributor(s) and not of MDPI and/or the editor(s). MDPI and/or the editor(s) disclaim responsibility for any injury to people or property resulting from any ideas, methods, instructions or products referred to in the content. |
© 2024 by the authors. Licensee MDPI, Basel, Switzerland. This article is an open access article distributed under the terms and conditions of the Creative Commons Attribution (CC BY) license (https://creativecommons.org/licenses/by/4.0/).
Share and Cite
Ahmed, S.; Lepkova, K.; Sun, X.; Rickard, W.D.A.; Pojtanabuntoeng, T. Performance of Phenolic-Epoxy Coatings after Exposure to High Temperatures. Corros. Mater. Degrad. 2024, 5, 73-91. https://doi.org/10.3390/cmd5010004
Ahmed S, Lepkova K, Sun X, Rickard WDA, Pojtanabuntoeng T. Performance of Phenolic-Epoxy Coatings after Exposure to High Temperatures. Corrosion and Materials Degradation. 2024; 5(1):73-91. https://doi.org/10.3390/cmd5010004
Chicago/Turabian StyleAhmed, Saleh, Katerina Lepkova, Xiao Sun, William D. A. Rickard, and Thunyaluk Pojtanabuntoeng. 2024. "Performance of Phenolic-Epoxy Coatings after Exposure to High Temperatures" Corrosion and Materials Degradation 5, no. 1: 73-91. https://doi.org/10.3390/cmd5010004