Article

Effect of Microstructure on Corrosion Behavior of Cold Sprayed Aluminum Alloy 5083

Department of Metallurgical and Materials Engineering, The University of Alabama, Tuscaloosa, AL 35487, USA
*
Author to whom correspondence should be addressed.
Corros. Mater. Degrad. 2024, 5(1), 27-51; https://doi.org/10.3390/cmd5010002
Submission received: 4 December 2023 / Revised: 6 January 2024 / Accepted: 11 January 2024 / Published: 16 January 2024
(This article belongs to the Special Issue Advances in Corrosion Protection by Coatings)

Abstract

:
This paper investigates the effect of the microstructure on the corrosion behavior of cold sprayed (CS) AA5083 compared to its wrought counterpart. It has been shown that the microstructure of CS aluminum alloys, such as AA2024, AA6061, and AA7075, affects their corrosion behavior; however, investigations of the corrosion behavior of CS AA5083 with a direct comparison to wrought AA5083 have been limited. The microstructure and corrosion behavior of CS AA5083 were examined by scanning electron microscopy (SEM), transmission electron microscopy (TEM), energy dispersive X-ray spectroscopy (EDS), electron backscattered diffraction (EBSD), electrochemical and immersion tests, and ASTM G67. The CS process resulted in microstructural changes, such as the size and spatial distribution of intermetallic particles, grain size, and misorientation. The refined grain size and intermetallic particles along prior particle boundaries stimulated the initiation and propagation of localized corrosion. Electrochemical tests presented enhanced anodic kinetics with high pitting susceptibility, giving rise to extensive localized corrosion in CS AA5083. The ASTM G67 test demonstrated significantly higher mass loss for CS AA5083 compared to its wrought counterpart due to preferential attack within prior particle boundary regions in the CS microstructure. Possible mechanisms of intergranular corrosion (IGC) propagation at prior particle boundary regions have been discussed.

1. Introduction

5xxx-series aluminum–magnesium alloys, such as AA5083 and AA5456, are widely utilized for marine applications, such as shipbuilding and offshore platforms, by virtue of their strength-to-weight ratio, weldability, formability, and excellent corrosion resistance. The mechanical performance of these alloys relies on solid solution strengthening in the Al matrix via Mg alloying [1,2]. However, Al-Mg alloys with more than 3 wt.% Mg have exhibited high susceptibility to intergranular corrosion (IGC) when exposed to an elevated temperature ranging from 50 °C to 200 °C in a corrosion environment for an extended length of time [3]. IGC is fundamentally caused by the formation of a continuous or semi-continuous network of Al3Mg2 (β-phase) along grain boundaries, referred to as sensitization [4]. Since the β-phase is anodic to the Al matrix, the anodic dissolution of the β-phase is promoted along grain boundaries, thereby leading to IGC. The severity of IGC for Al-Mg alloys is shown to be proportional to increased length of time and temperature up to 200 °C due to coarsening and forming β-phase networks along grain boundaries [5,6,7]. Sensitization and subsequent IGC are also found to contribute to the loss of the mechanical strength of Al-Mg alloys: the increased sensitization time gives rise to decreased tensile strength and hardness and an increased stress corrosion cracking (SCC) growth rate [8,9,10]. The degradation of mechanical strength is associated with the reduction in the concentration of Mg solid solution that acts as the source for solid solution strengthening. As such, sensitization impacts not only corrosion resistance but also mechanical strength. Even though these alloys seem to be prone to IGC and SCC, the demand for these alloys has been increasing as the primary structural materials for marine applications [11]. Hence, there is an ongoing need to develop advanced repair technologies capable of repairing structural components, such as cold spray deposition.
Cold gas dynamic spray, also known as cold spray (CS), is one of the additive manufacturing processes that produces deposits at a high rate in the ambient atmosphere. During the CS process, compressed carrier gases, such as helium or nitrogen, accelerate feedstock powders to a supersonic velocity, allowing the powders to undergo severe plastic deformation after impact into a substrate. Severe plastic deformation then promotes adiabatic shear instability (ASI) due to local thermal softening, which cleans the contact surface by sweeping the oxide layer out and contributes to metallurgical bonding and mechanical interlocking at the interface [12,13]. The CS process preserves the inherent properties of the feedstock powder and substrate without detrimental thermal input by virtue of its relatively low gas temperature over traditional thermal spray techniques. In addition, the CS process can create three-dimensional shapes of different geometries and repair structural components without disassembling complex structures [14,15,16]. To date, the CS process has been successfully applied to the repair of damaged metallic components such as transmission gearboxes, aircraft skins, and fan blades, as well as protective coating systems [17,18,19,20]. Recent studies on the corrosion properties of CS aluminum alloys, such as AA2024 [21,22,23], AA7075 [21,22,24], and AA6061 [25], have suggested that CS aluminum alloys exhibit variable corrosion properties depending upon CS parameters and the microstructure of CS materials in comparison to their wrought counterparts.
There is a limited number of studies on the CS of 5xxx-series Al-Mg alloys [26,27,28]. Deforce et al. [26] investigated a CS Al-5.0 wt.% Mg deposit as a protective coating for Mg alloys. They found that the CS Al-5.0 wt.% Mg exhibited the best overall performance, as evident from the hardness, bonding strength, and low galvanic current density when coupled to the Mg alloy as compared to other Al-based coatings, such as high-purity Al (99.95 wt.% Al), AA5356 (5.05 wt.% Mg), and AA4047. More recently, Zhang et al. [27] studied CS Al-based (commercially pure, AA2024, and AA5083) coatings on an AA2024-T3 substrate with the assistance of in situ shot peening by Al3O2 particles. High bonding strength and microhardness and low corrosion rate for CS AA5083 were observed compared to the CS commercially pure Al and AA2024 deposits. Hence, it was concluded that the CS AA5083 coating with the Al3O2 particle has an excellent combination of mechanical strength and corrosion resistance. Rokni et al. [28] investigated the effect of pre-processing for AA5056 powder on the mechanical properties of the CS AA5056 deposit. The CS AA5056 deposit with pre-processed AA5056 powder showed comparable ultimate tensile strength (UTS) and ductility to its wrought counterparts, but the corrosion properties of CS AA5056 were unexplored.
Compared to the limited studies on CS Al-Mg alloys, a large body of literature exists pertaining to the investigation of the corrosion properties of AA5083 processed by various manufacturing processes [29,30,31,32,33]. A couple of processing methods have shown the improved corrosion resistance of AA5083: the corrosion behavior of AA5083 produced by high-energy ball milling (HEBM) showed improved pitting resistance compared to its wrought counterpart due to the homogeneous microstructure that supported the formation of protective passive films [29]. AA5083 modified by accumulative roll bonding (ARB) and conventional cold rolling (CR) were found to be resistant to IGC in an as-deformed condition based on ASTM G67, which was attributed to a favorable distribution of the β-phase [30]. AA5083 fabricated by additive friction stir deposition (AFSD) presented less pitting and IGC susceptibility in as-built conditions due to the refinement and re-dissolution of the Mn-rich secondary phase [31]. In contrast, other works maintained that Al-Mg alloys processed by other methods have presented reduced corrosion resistance: the application of dynamic deformation to AA5083 led to an increase in corrosion current density with active corrosion potential, primarily due to the severe fragmentation of Fe-rich particles [32], which led to an increase in interfacial area between the Al matrix and Fe-rich particles where galvanic corrosion preferentially occurs. The change in grain size and orientation altered by equal channel angular pressing (ECAP), high-pressure torsion (HPT), cryo- and cold rolling significantly influenced IGC behavior after sensitization [33]. It was consequently proposed that the interplay between the influence of grain size and grain boundary misorientation affects the variation of the degree of sensitization (DoS). One consistent result from these studies is improved mechanical strength, primarily due to grain refinement; however, there is still less consensus when it comes to corrosion resistance.
To our knowledge, a direct comparison of the corrosion properties of wrought AA5083-H116 and CS AA5083 is not available in the open literature. A direct comparison between compositionally similar CS and wrought materials has important implications for predicting the performance of repairs to structural components and informing material selection decisions. For repair applications, CS material replaces damaged substrate material and may be required to carry structural loads under environmental exposure. Therefore, it is essential to have a fundamental understanding of how the CS-specific microstructure affects the corrosion behavior of CS Al-Mg alloys in comparison to a wrought counterpart. This knowledge will advance the use of CS technology for the repair of 5XXX-series Al components. To date, the limited number of investigations that have tested the mechanical and corrosion properties of CS Al-Mg alloys have only made comparisons to other CS Al-alloys, which limits our ability to directly assess the influence of the CS processing and the unique CS microstructure on properties in the same alloying system. Hence, a knowledge gap exists in how the microstructure evolution due to CS processing of solid-solution-strengthened Al-Mg alloys affects corrosion performance. Therefore, the aim of this research is to elucidate the effect of the as-deposited microstructure on the corrosion behavior of CS AA5083 in comparison to its wrought counterpart. The process–structure–property knowledge developed in this study using a combination of microstructure characterization, electrochemical methods, and corrosion experiments is relevant to the integrity of in situ repaired structural components. The work presented herein focuses on characterizing and testing CS AA5083 in the as-deposited condition.

2. Material and Methods

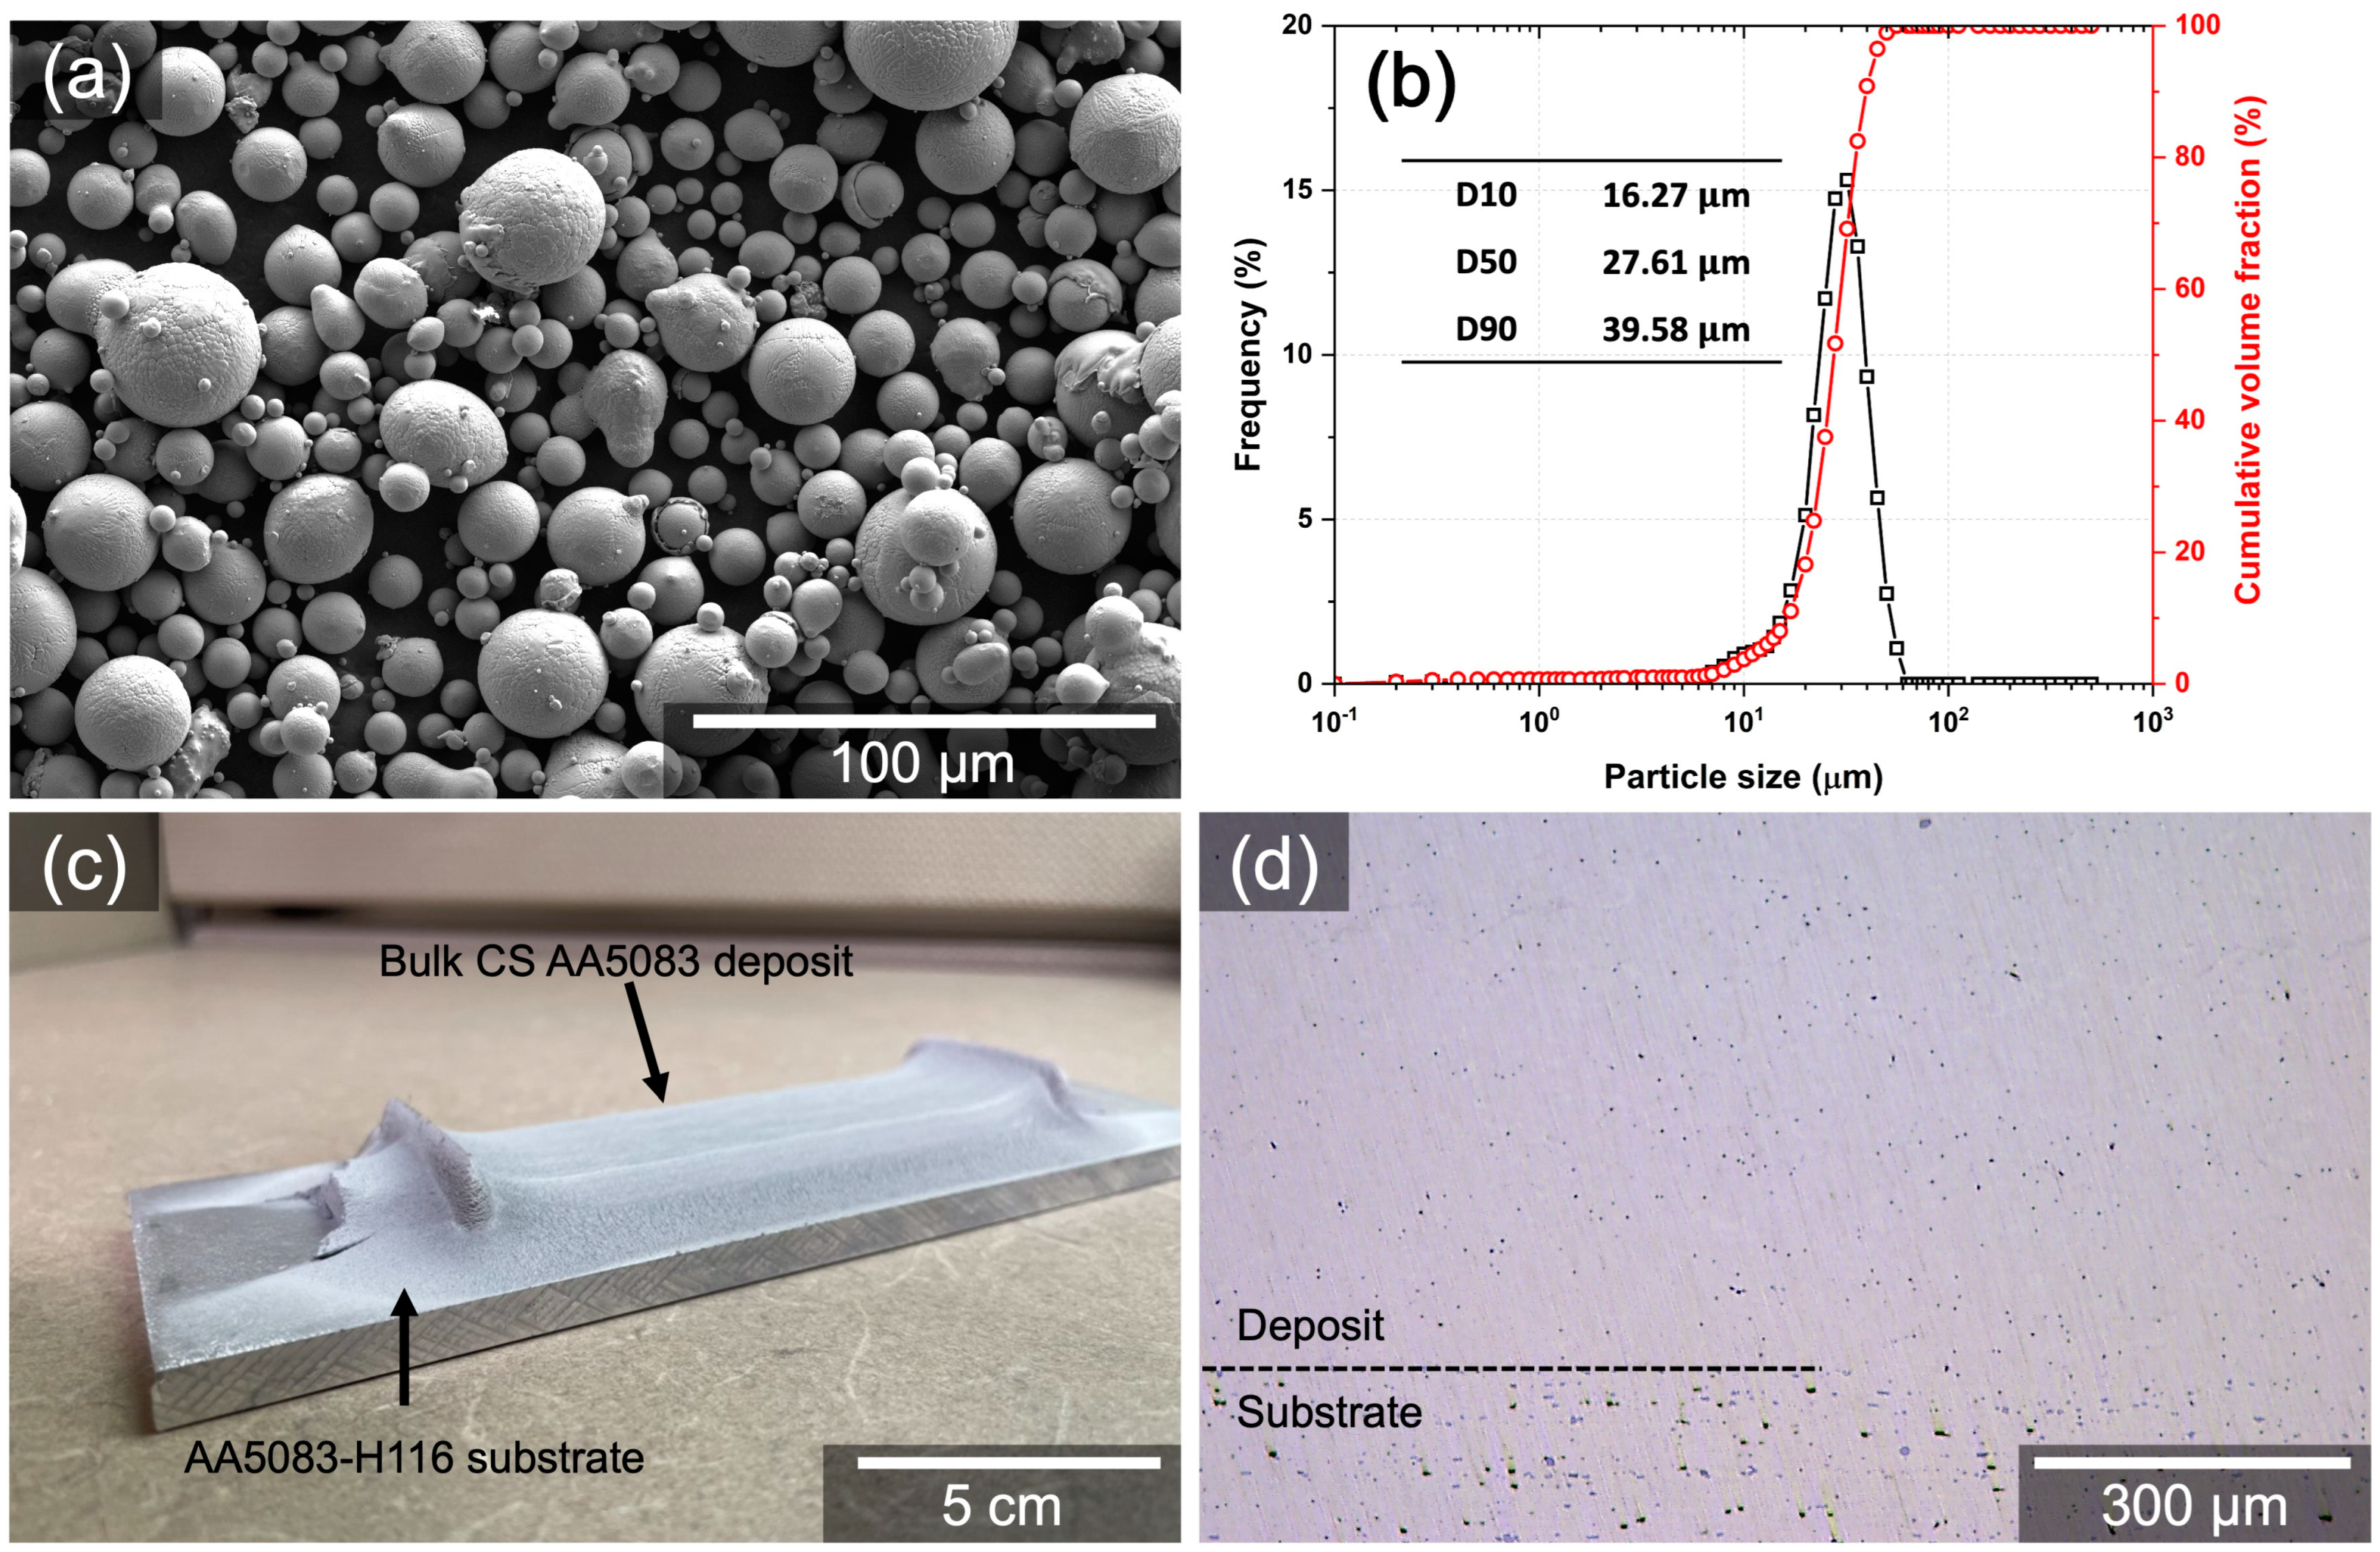
2.1. Sample Preparation

The samples used in this work were wrought AA5083-H116 and CS AA5083 deposits. Wrought AA5083-H116 was supplied from McMaster-Carr (Elmhurst, IL, USA). CS AA5083 deposit was produced with gas-atomized AA5083 powder produced at the Alabama Atomization Facility (AAF) at The University of Alabama, USA. This powder was produced using a close-couple inert gas (argon) atomizer (HERMIGA 75/5 VI, Phoenix Scientific Industries Ltd., Hailsham, UK). The powder morphology and size distribution are presented in Figure 1a,b. The chemical composition of wrought AA5083-H116 and as-atomized AA5083 powder used to fabricate CS AA5083 deposit was analyzed by inductively coupled plasma-atomic emission spectroscopy (ICP-AES) and summarized in Table 1.
CS AA5083 deposits were fabricated using a VRC Metal Systems Gen III high-pressure CS system (Box Elder, SD, USA). The dimensions of the de Laval converging–diverging nozzle for spraying were 2 mm throat diameter, 100 mm diverging barrel, and 4 mm exit diameter. Prior to the deposition, wrought AA5083-H116 substrate was ground with 150 silicon carbide (SiC) paper, followed by cleaning with isopropyl alcohol. As-atomized AA5083 powder was heated in an oven at a temperature of 100 °C for less than 1 h to eliminate moisture in the powder prior to deposition. Although heating AA5083 powders could result in the precipitation of the β-phase at grain boundaries, it has been observed by Goswami et al. [8] that the β-phase appears at grain boundaries as discrete islands after 1 h at 175 °C. It is therefore assumed that there would be no further β-phase formation within the powder due to the drying process at 100 °C, which is needed to obtain great flowability for the CS process. CS parameters used in this work are listed in Table 2. The thickness of CS deposit was approximately 3 mm, and the bulk CS AA5083 deposit and its cross-section were shown in Figure 1c,d. Hereafter, wrought AA5083-H116 and CS AA5083 deposits will be referred to as W5083 and CS5083, respectively. Also, W5083 and CS5083 are in the as-received and as-deposited conditions, respectively, unless otherwise noted (e.g., heat-treated or sensitized).

2.2. Microstructure Characterization

The microstructure of W5083 and CS5083 was analyzed by scanning electron microscopy (SEM) in conjunction with energy dispersive X-ray spectroscopy (EDS) using a Thermo-fisher Apreo SEM (Waltham, MA, USA). The samples for microscopy were ground with SiC papers and polished down to 1 μm. Backscattered electron (BSE) micrographs and EDS analyses, such as point analysis and elemental map, were collected at an accelerating voltage of 10 kV with the EDAX (Mahwah, NJ, USA) octane elite silicon drift detector.
For electron backscattered diffraction (EBSD) acquisition, samples were polished down to 1 μm, followed by polishing with a vibratory polisher under 0.02 μm colloidal silica suspension for 4 h. The EBSD orientation map of each sample was collected using Oxford AZtecHKL (High Wycombe, UK) EBSD system on a JEOL 7000 SEM (Tokyo, Japan) instrument with a step size of 1.5 μm and 0.5 μm at 20 kV for W5083 and CS5083, respectively. HKL Channel 5-Tango software v.5.12.63.0 was employed for post-processing: a noise reduction was performed on the EBSD maps by extrapolation of zero resolutions utilizing 8-neighbors. Grain size analysis was conducted with a critical misorientation of 10° for grain detection and a minimum area of 10 pixels.
A detailed investigation of the CS microstructure was performed via transmission electron microscopy (TEM). Bright-field (BF) and scanning electron transmission microscopy (STEM) micrographs and diffraction patterns were captured using FEI Tecnai F20 (Hillsboro, OR, USA) with a 200 kV accelerating voltage, equipped with a charge-coupled device (CCD) camera, a high-angle annular dark field (HAADF) detector, and EDS system. Point analysis and EDS elemental map were acquired in STEM mode with HAADF micrographs. For the preparation of the TEM sample, a gallium (Ga) ion beam at 30 kV on TESCAN Lyra 3 focused ion beam (FIB) instrument (Brno, Czech Republic) was utilized. Prior to milling and lifting out, 1 μm thickness of platinum (Pt) layer was deposited on the surface of the sample. The milling process was performed at 30 kV with a current of 5 nA, and the thinning was conducted for electron transparency. The final cleaning process was made at 5 kV with a current of 40 pA.

2.3. Electrochemical Tests

Electrochemical tests were performed to evaluate the corrosion performance of W5083 and CS5083. A Gamry potentiostat 1010E (Warminster, PA, USA) was employed for electrochemical tests. A three-electrode flat cell with an exposure area of 1 cm2 was used with a silver-silver/chloride electrode (Ag/AgCl) and a Pt mesh for reference and counter electrodes, respectively. As such, all potentials were reported with regard to Ag/AgCl. Before electrochemical tests, all samples were successively ground with 320, 600, and 1200 grit SiC papers, followed by cleaning with ethanol and deionized (DI) water. All tests were performed in quiescent, naturally aerated 0.6 M NaCl solution. The pH of the solution was 8.3 at room temperature, adjusted by adding NaOH. Open circuit potential (OCP) measurement was conducted for 2 h to allow the materials to be stable in OCP condition, followed by electrochemical impedance spectroscopy (EIS) and cyclic potentiodynamic polarization (CPP) tests. EIS test was performed with frequency ranges from 10 mHz to 100 kHz with a sinusoidal voltage amplitude of 10 mV RMS using 10 points per decade. The fitting of EIS spectra was conducted via ZSimp 3.2.1. The CPP tests started with −0.05 V below OCP, scanning in the forward direction at a rate of 1 mV/s until reaching a pre-defined value of 10 mA/cm2 or 1 V anodic to OCP for scan reversal. At this point, the potential scanning began in a reverse direction to −0.5 V cathodic to OCP. Separate cathodic polarization tests were also performed after 2 h of OCP measurement, starting from OCP to −1 V cathodic to OCP. The purpose of running cathodic polarization starting from OCP is to minimize anodic dissolution on the surface by anodic polarization when the scan starts above OCP. After the polarization tests, electrochemical parameters were drawn from the cathodic polarization and CPP tests. The definitions of each parameter are as follows: corrosion potential (Ecorr) was taken to be the potential where the cathodic current density changed to anodic current density. Corrosion current density (icorr) was determined at the intersection between Ecorr and the cathodic Tafel slope obtained from Tafel extrapolation within a linear region (−0.1 to −0.2 V vs. OCP) in cathodic polarization curves. Only cathodic Tafel slope was used for icorr measurement because the materials did not show well-defined Tafel behavior on anodic branches. Pit-transition potential (Eptp) was taken to be the inflection point (i.e., potential gradient) on the reverse scan, and the corresponding current density at Eptp was considered as pit-transition current density (iptp). The steepness was determined using linear fit with a range from Eptp to −50 mV below Eptp. All electrochemical tests were replicated three times to confirm reproducibility, and all electrochemical parameters were reported with average values with a standard deviation.

2.4. Immersion Test

An immersion test in quiescent, naturally aerated 0.6 M NaCl solution (pH = 8.3) at room temperature was carried out to investigate corrosion morphologies of W5083 and CS5083 from a naturally corroding environment. The samples used for the immersion test were prepared in the same manner as the samples for microscopy. A surface area of 1 cm2 was exposed to the solution of 300 mL, and the rest of the surface was masked by acrylic tape. Note that the exposed surface of CS5083 was the surface perpendicular to the CS deposition direction. Following the immersion test, all samples were cleaned with 7% HNO3 in the ultrasonic bath for 30 s, following the example by Ngai et al. [24] to gently remove the corrosion byproduct, while minimizing the loss of material.

2.5. ASTM G67

ASTM G67 test [34], also known as nitric acid mass loss test (NAMLT), was employed to evaluate the sensitization and IGC behavior of W5083 and CS5083. Note that CS deposits were cut off from the substrate prior to sensitization. The miniature samples (25 mm × 3 mm × 3 mm) were utilized due to the limitation of available materials and sensitized at 100 °C for various times up to 504 h. Prior to the test, all surfaces were ground with 320 grit SiC paper, and the samples were soaked in 5% NaOH solution at 80 °C for 1 min and in concentrated (67–70%) HNO3 for 30 s, followed by rinsing with DI water. The ratio between test solution and exposed surface area was 49 L/m2. The test was performed in the concentrated HNO3 solution for 24 h at 30 °C in a temperature-controlled bath. After the test, all samples were cleaned with DI water in the ultrasonic bath for 1 min. The cleaning process was repeated at least five times until constant weight was acquired, and the samples were weighed to the accuracy of 0.001 g for calculating mass loss per area. For reproducibility, three samples for all conditions were tested, and the mass loss per unit area was reported in the average value of three samples with standard deviation.

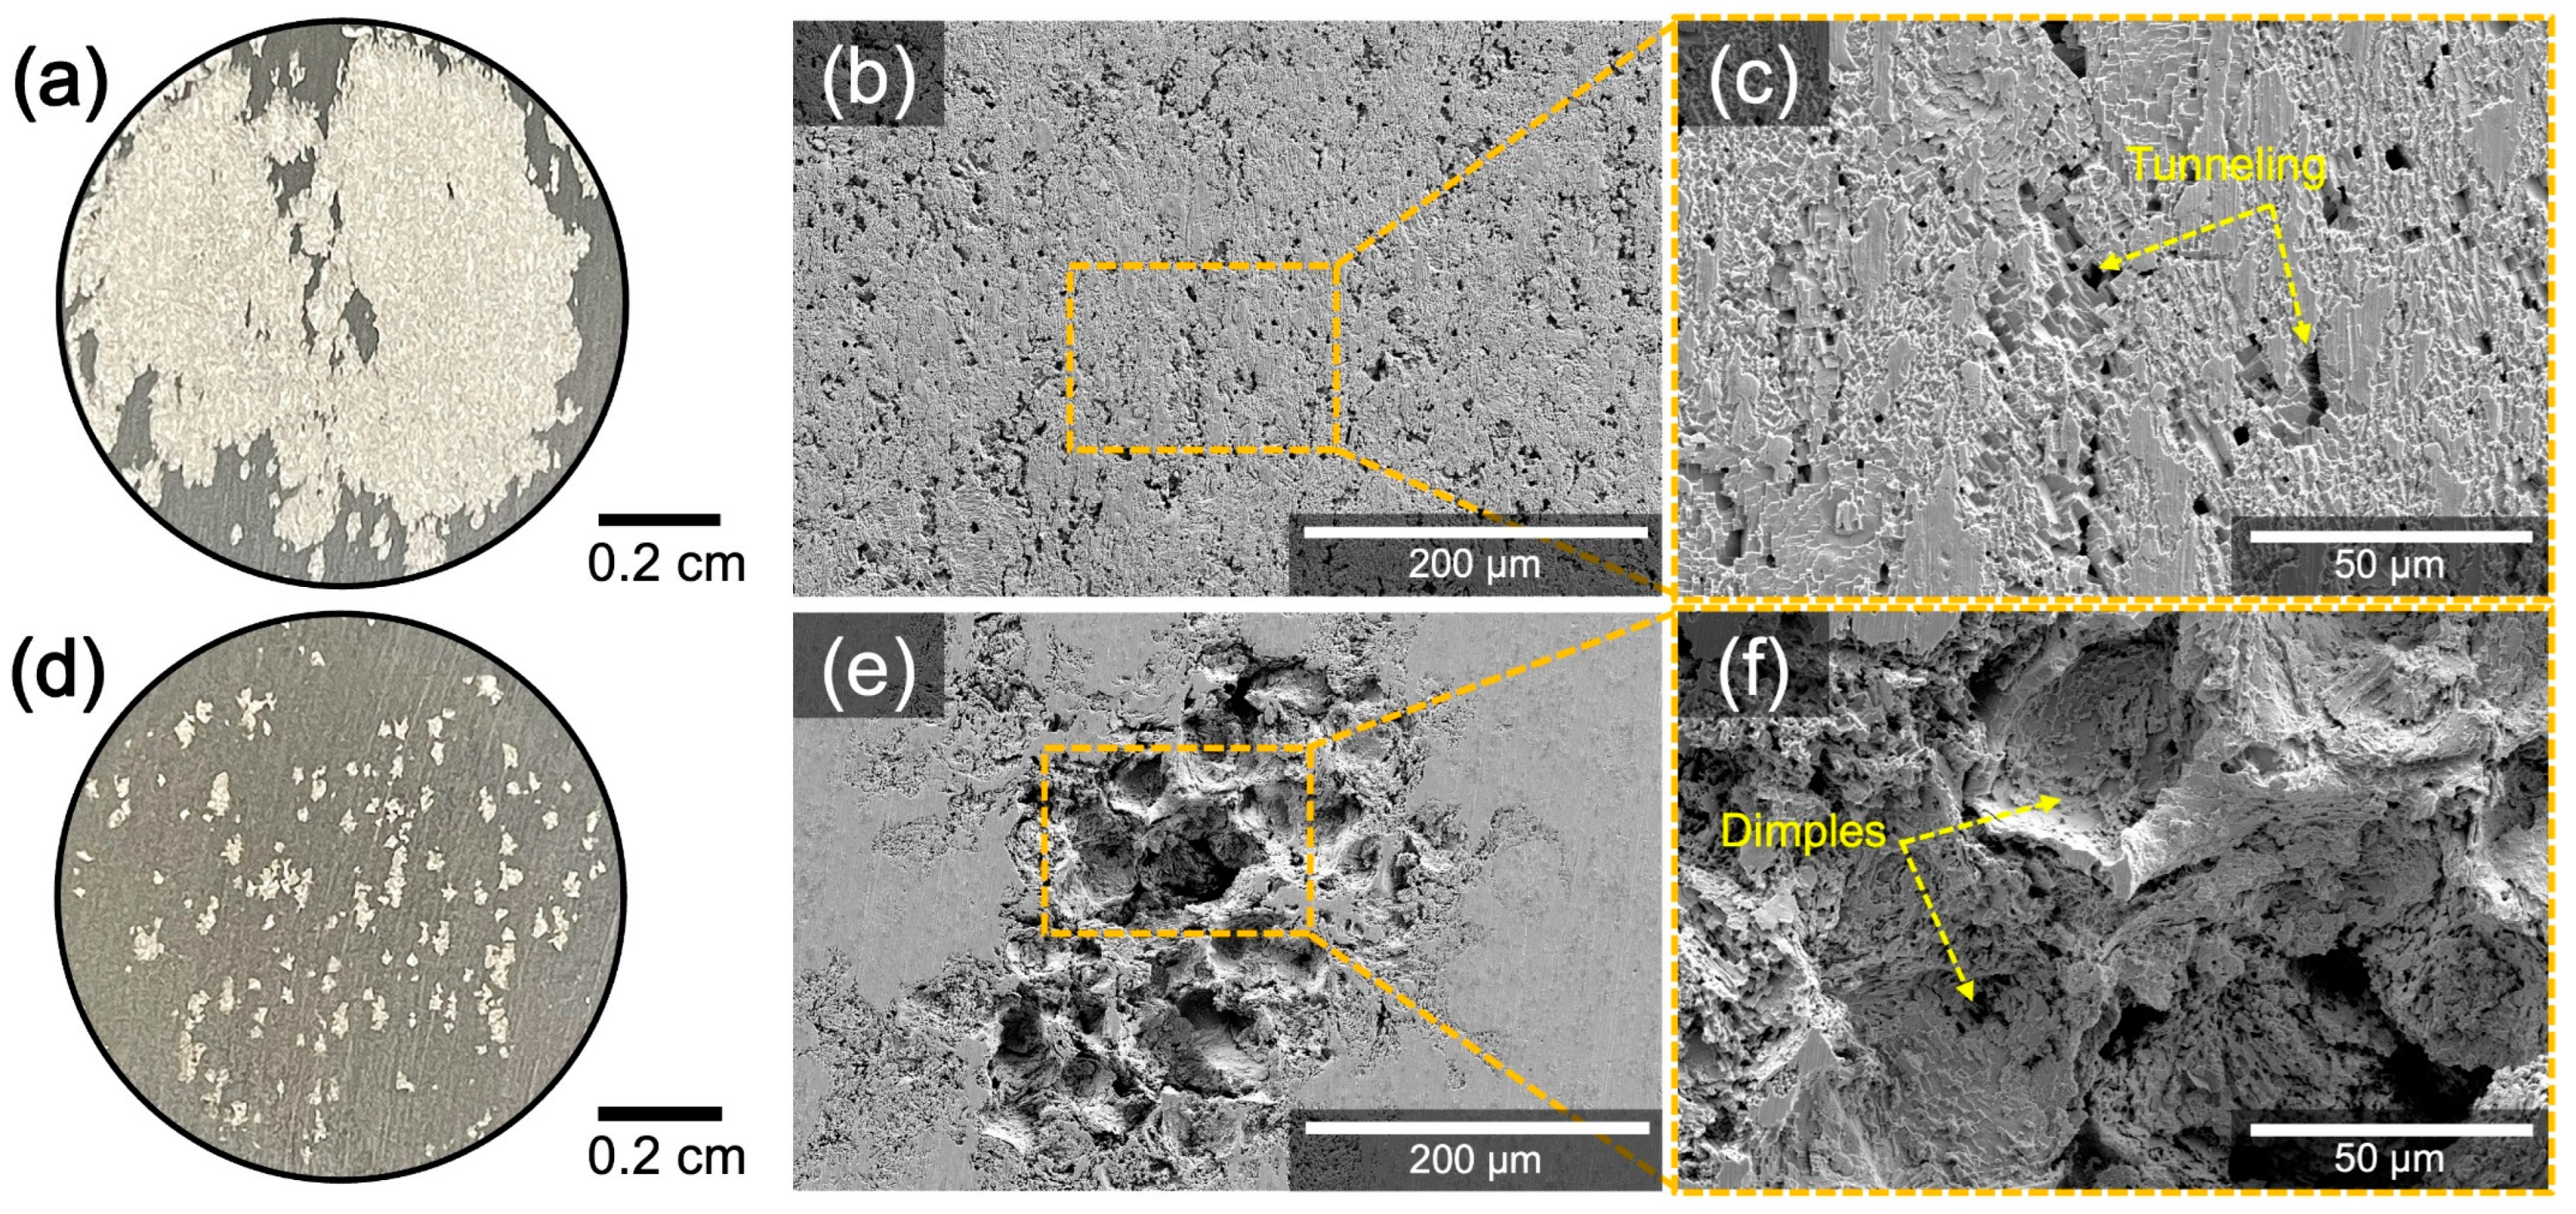
2.6. Post-Corrosion Analysis

Secondary electron (SE) micrographs were taken at 5 kV of accelerating voltage under the Apreo SEM for the investigation of corrosion morphologies after electrochemical, immersion, and ASTM G67 tests. Cross-sectioned samples after the CPP tests and ASTM G67 were prepared to analyze corrosion depth and morphologies using an optical microscope. The micrographs of the cross-sectioned sample after CPP tests were used for determining corrosion depth and complexity. For the corrosion depth, a uniform grid was overlaid on the images to divide each image into 50 μm long sections, and the deepest penetration site was selected within one section. A total of 54 optical micrographs of the cross-section were employed, and a total of 191 penetration sites were collected to observe the distribution of penetration depth. The complexity of localized corrosion morphology was analyzed based on fractal dimension (D) that quantitatively describes the complexity of the shape. As IGC represents more complex morphologies than general hemispherical pits, the D of IGC is expected to be higher than that of the elliptical pits. It was reported by Holten et al. [35] that the value of D is approximately 1.2 for a pit in pure Al. A total of 54 optical micrographs were binarized and analyzed using the fractal box count function in ImageJ 1.54b. A detailed process for fractal dimension analysis can be found in the work of Zhang et al. [36].

3. Results

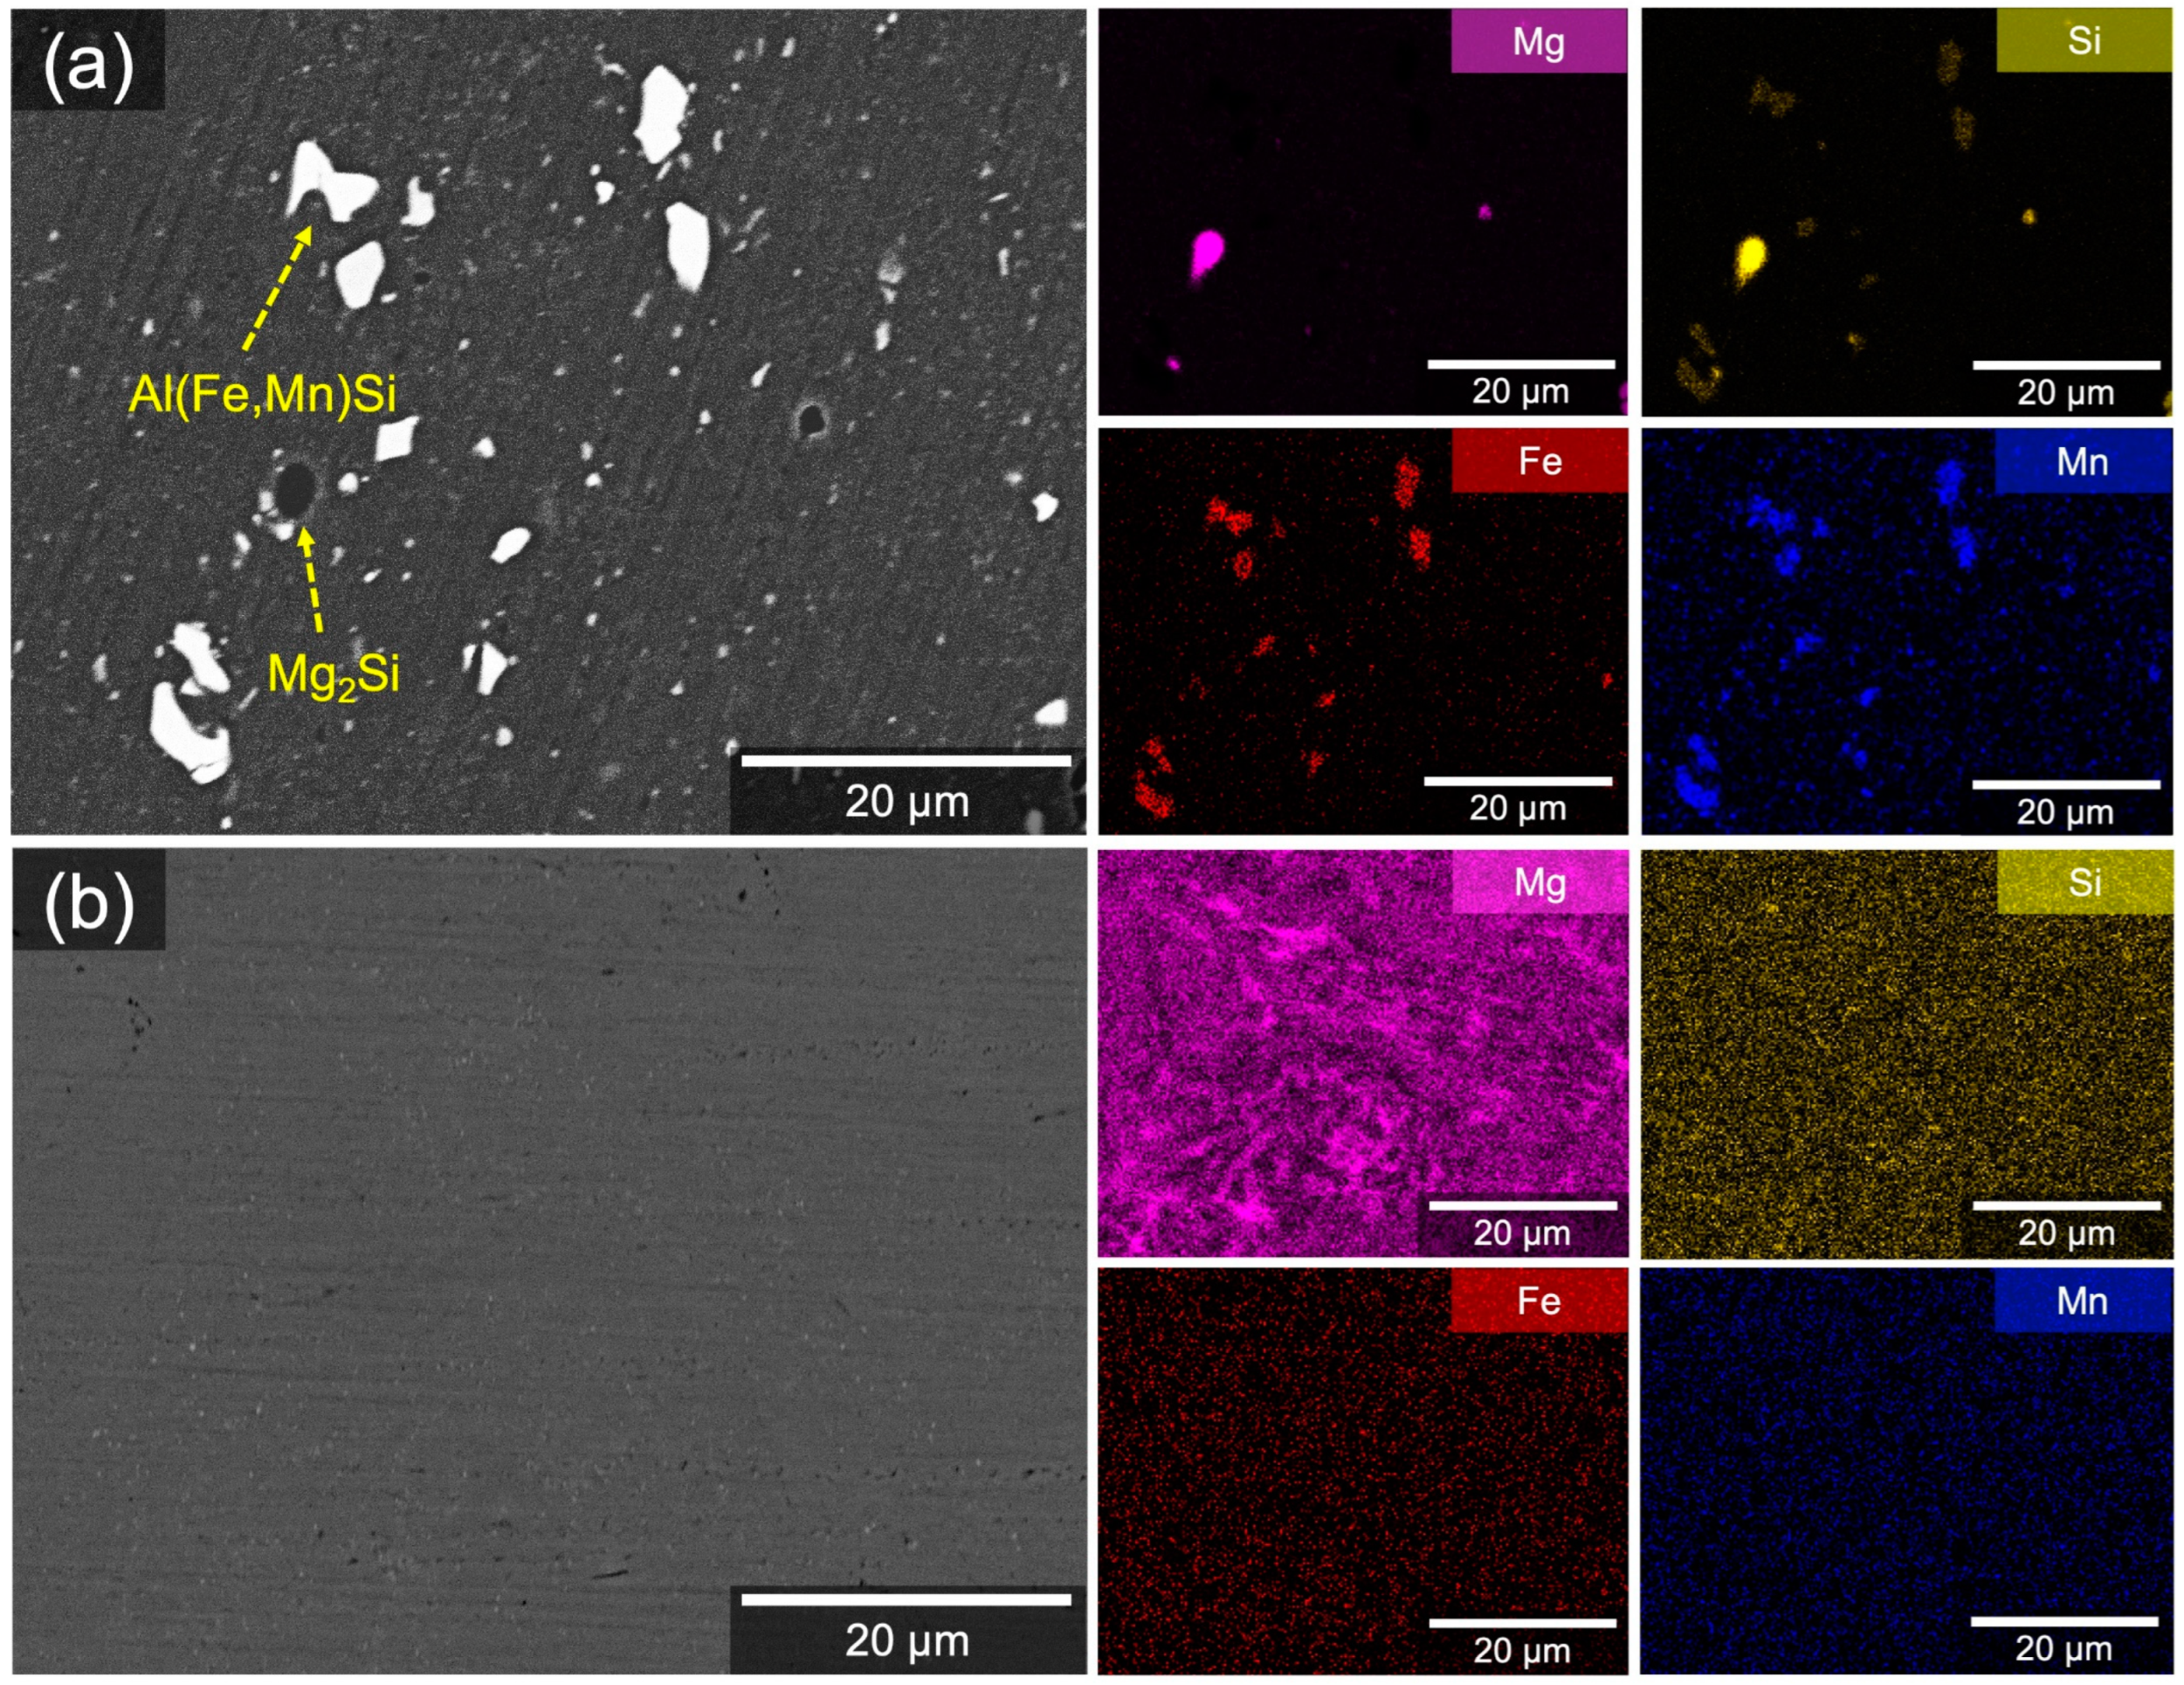
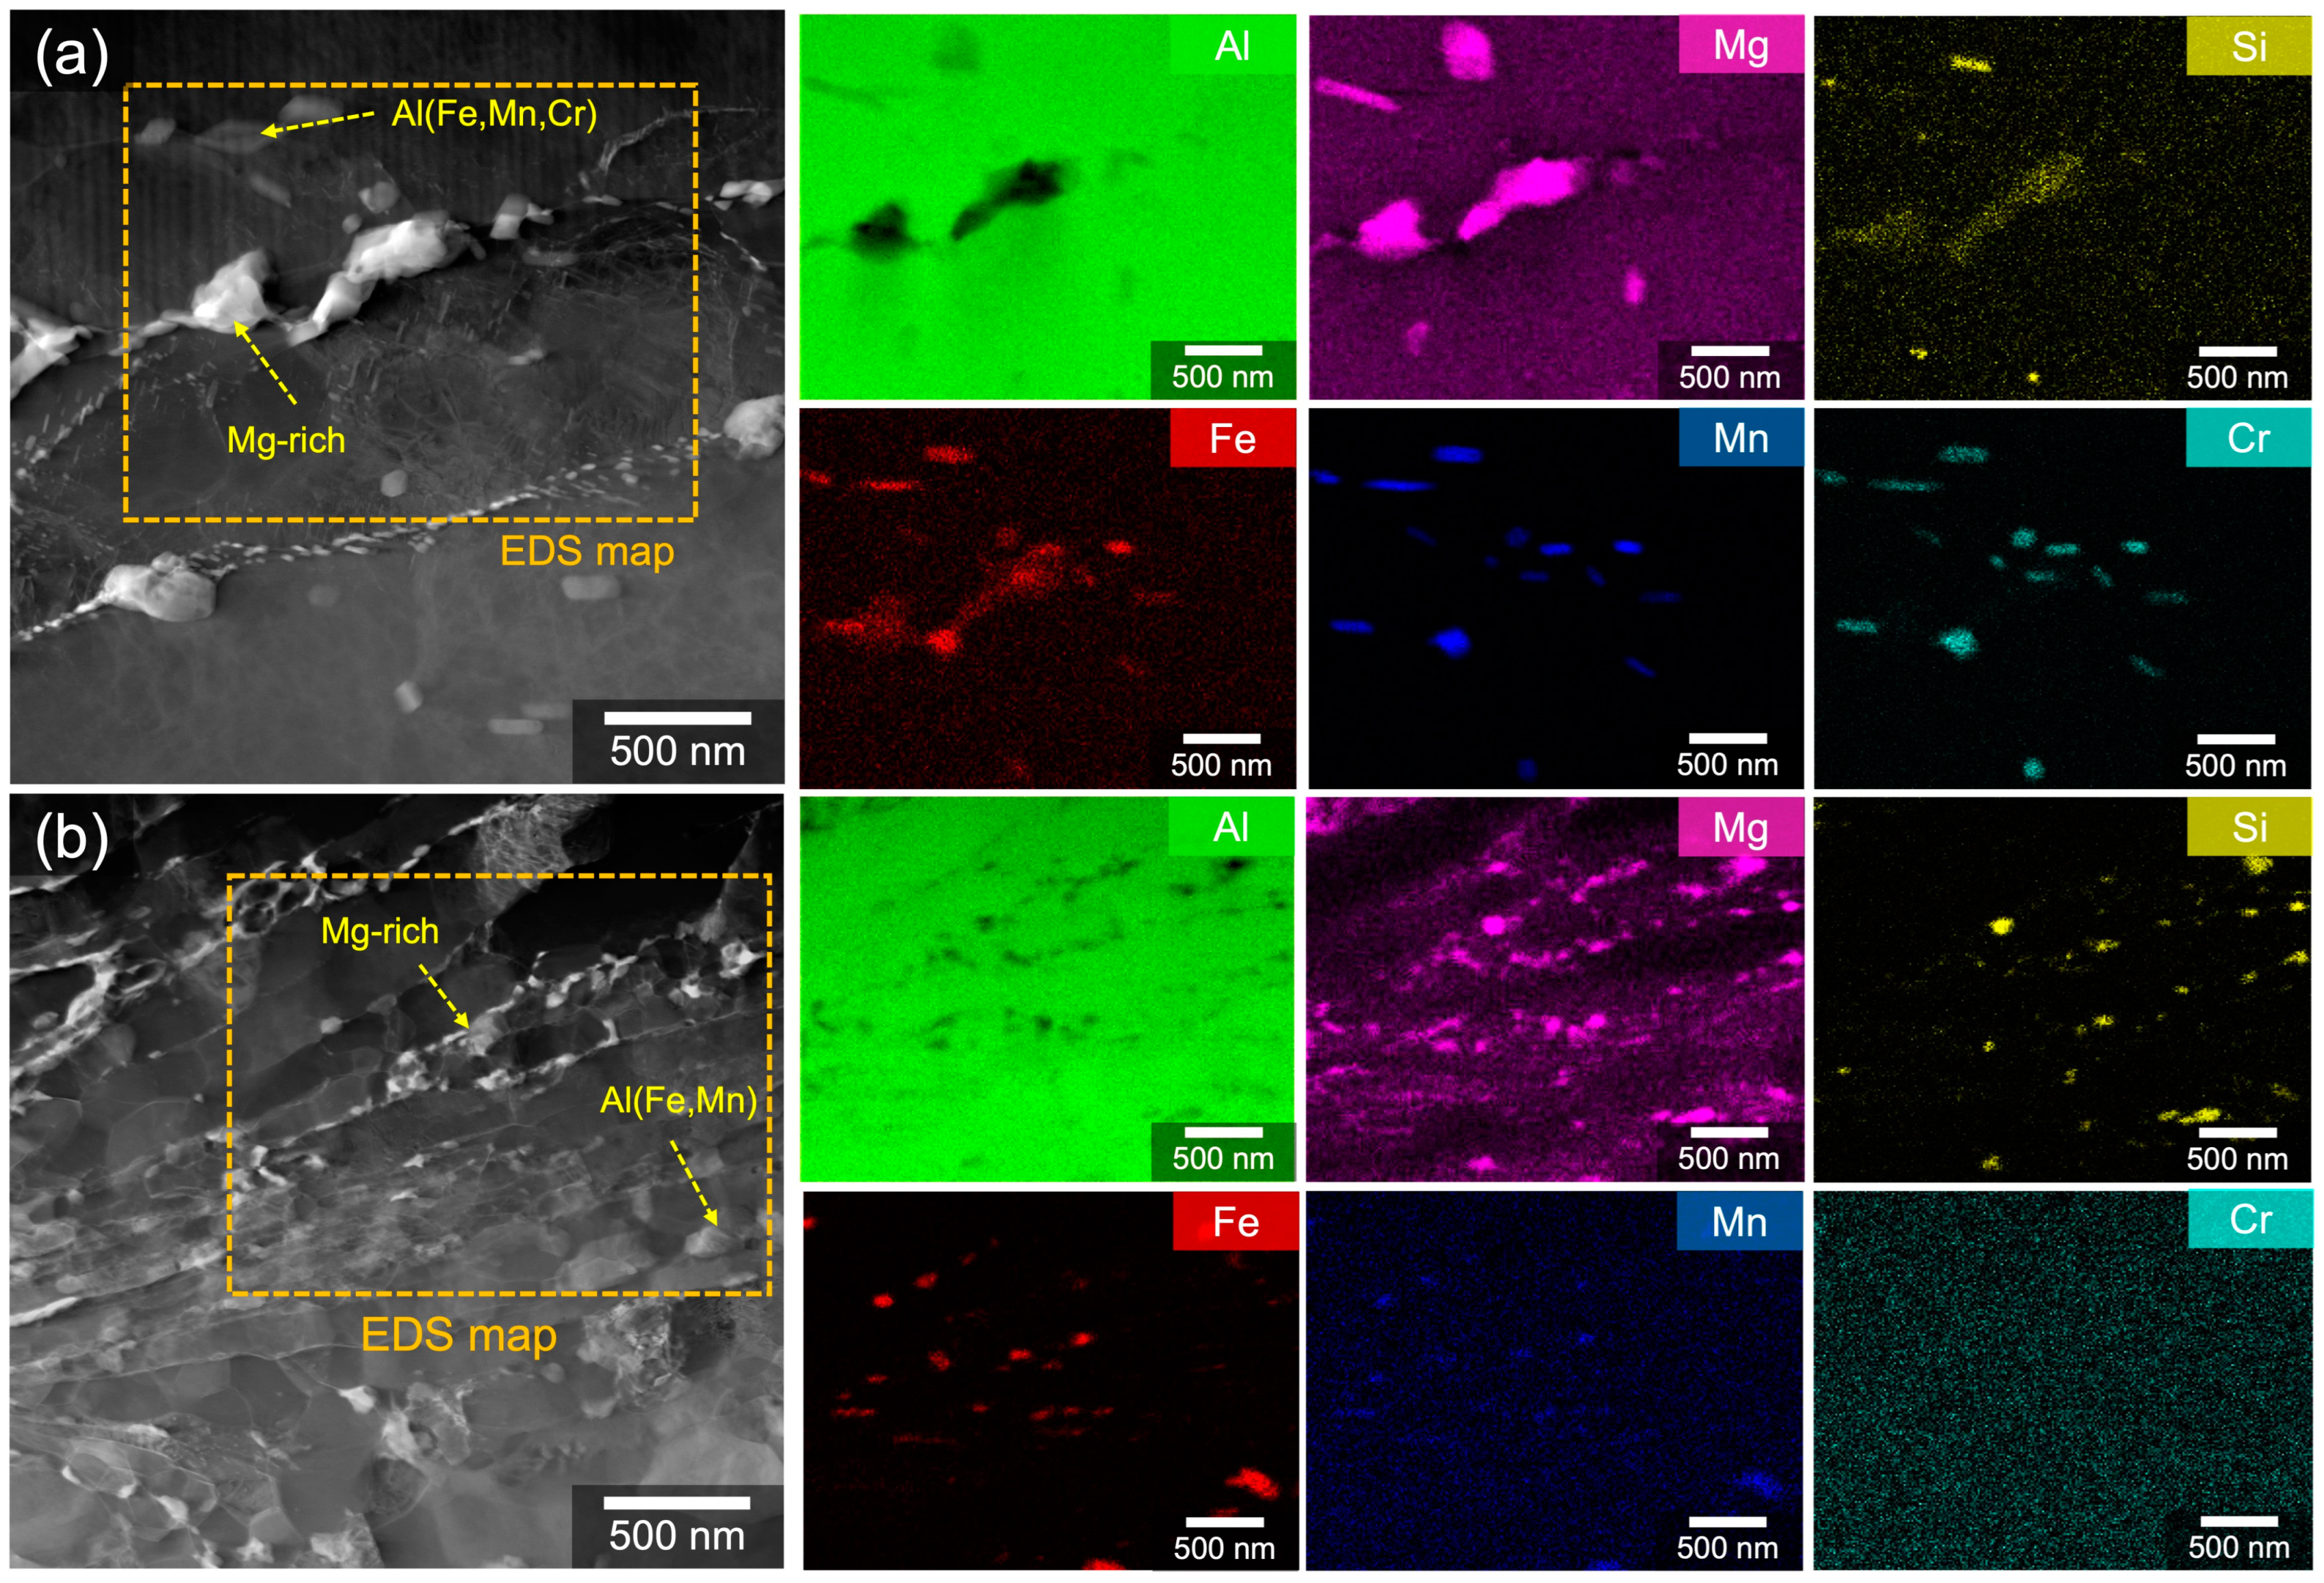
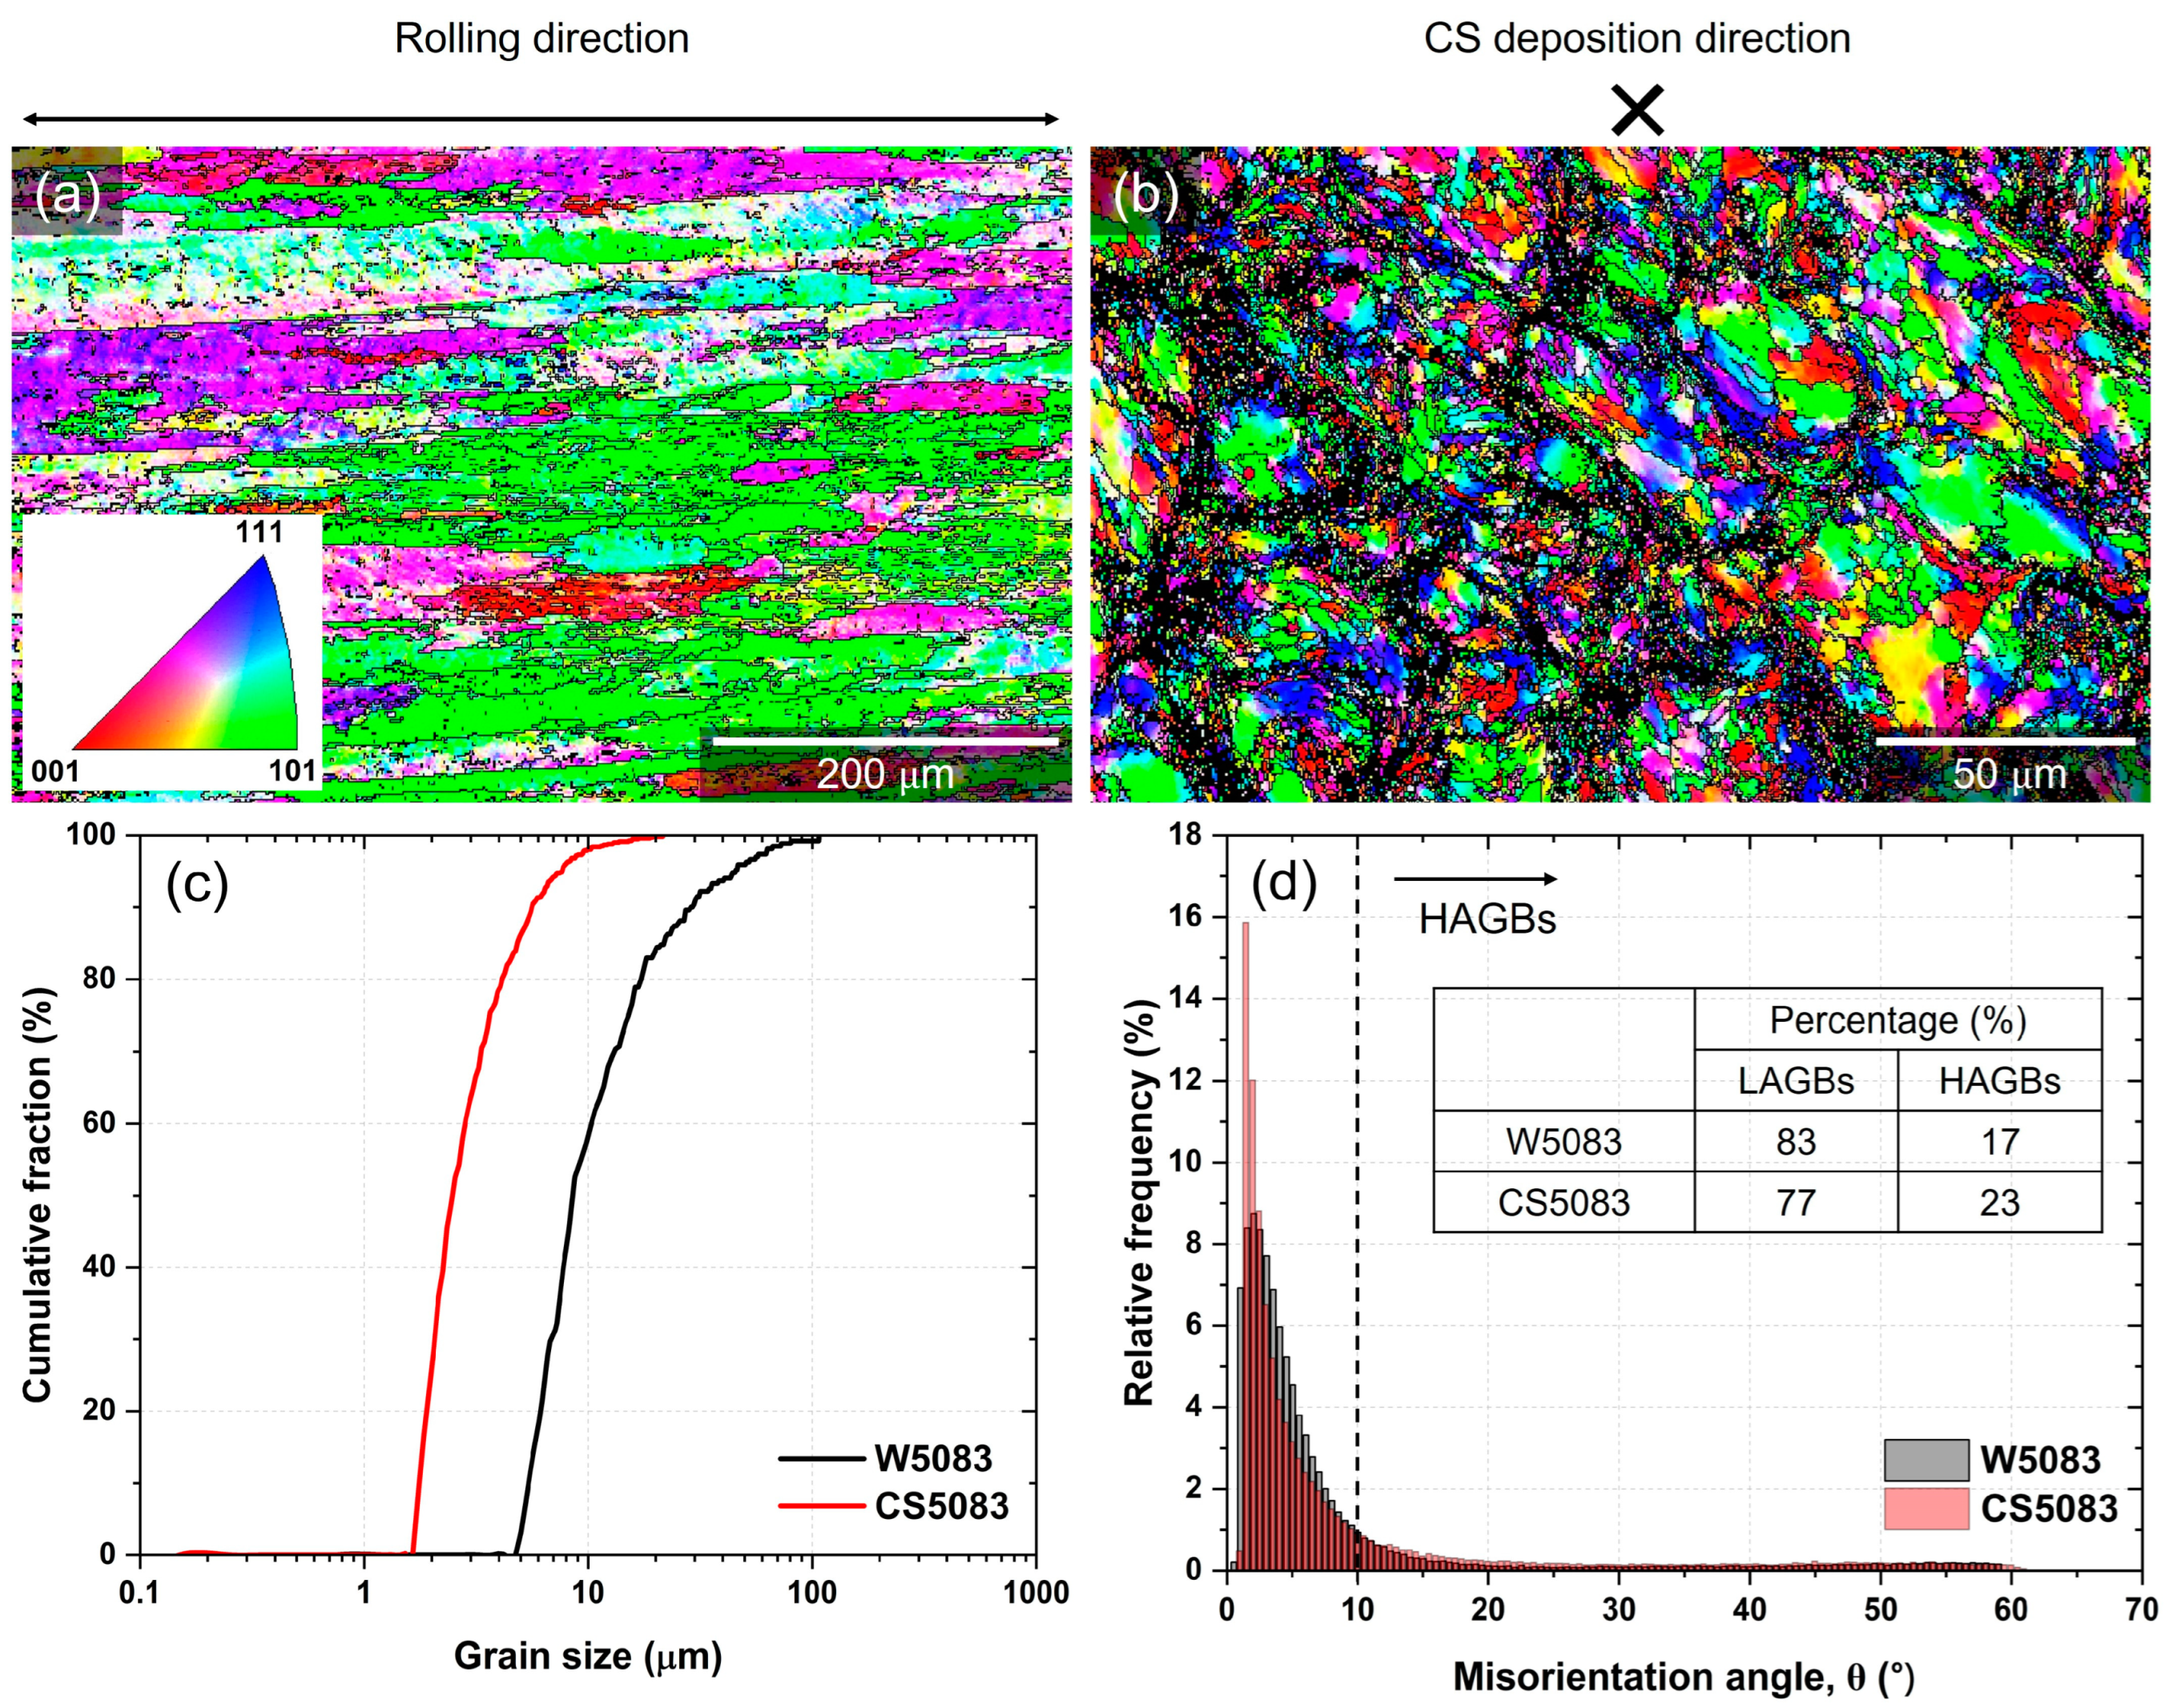
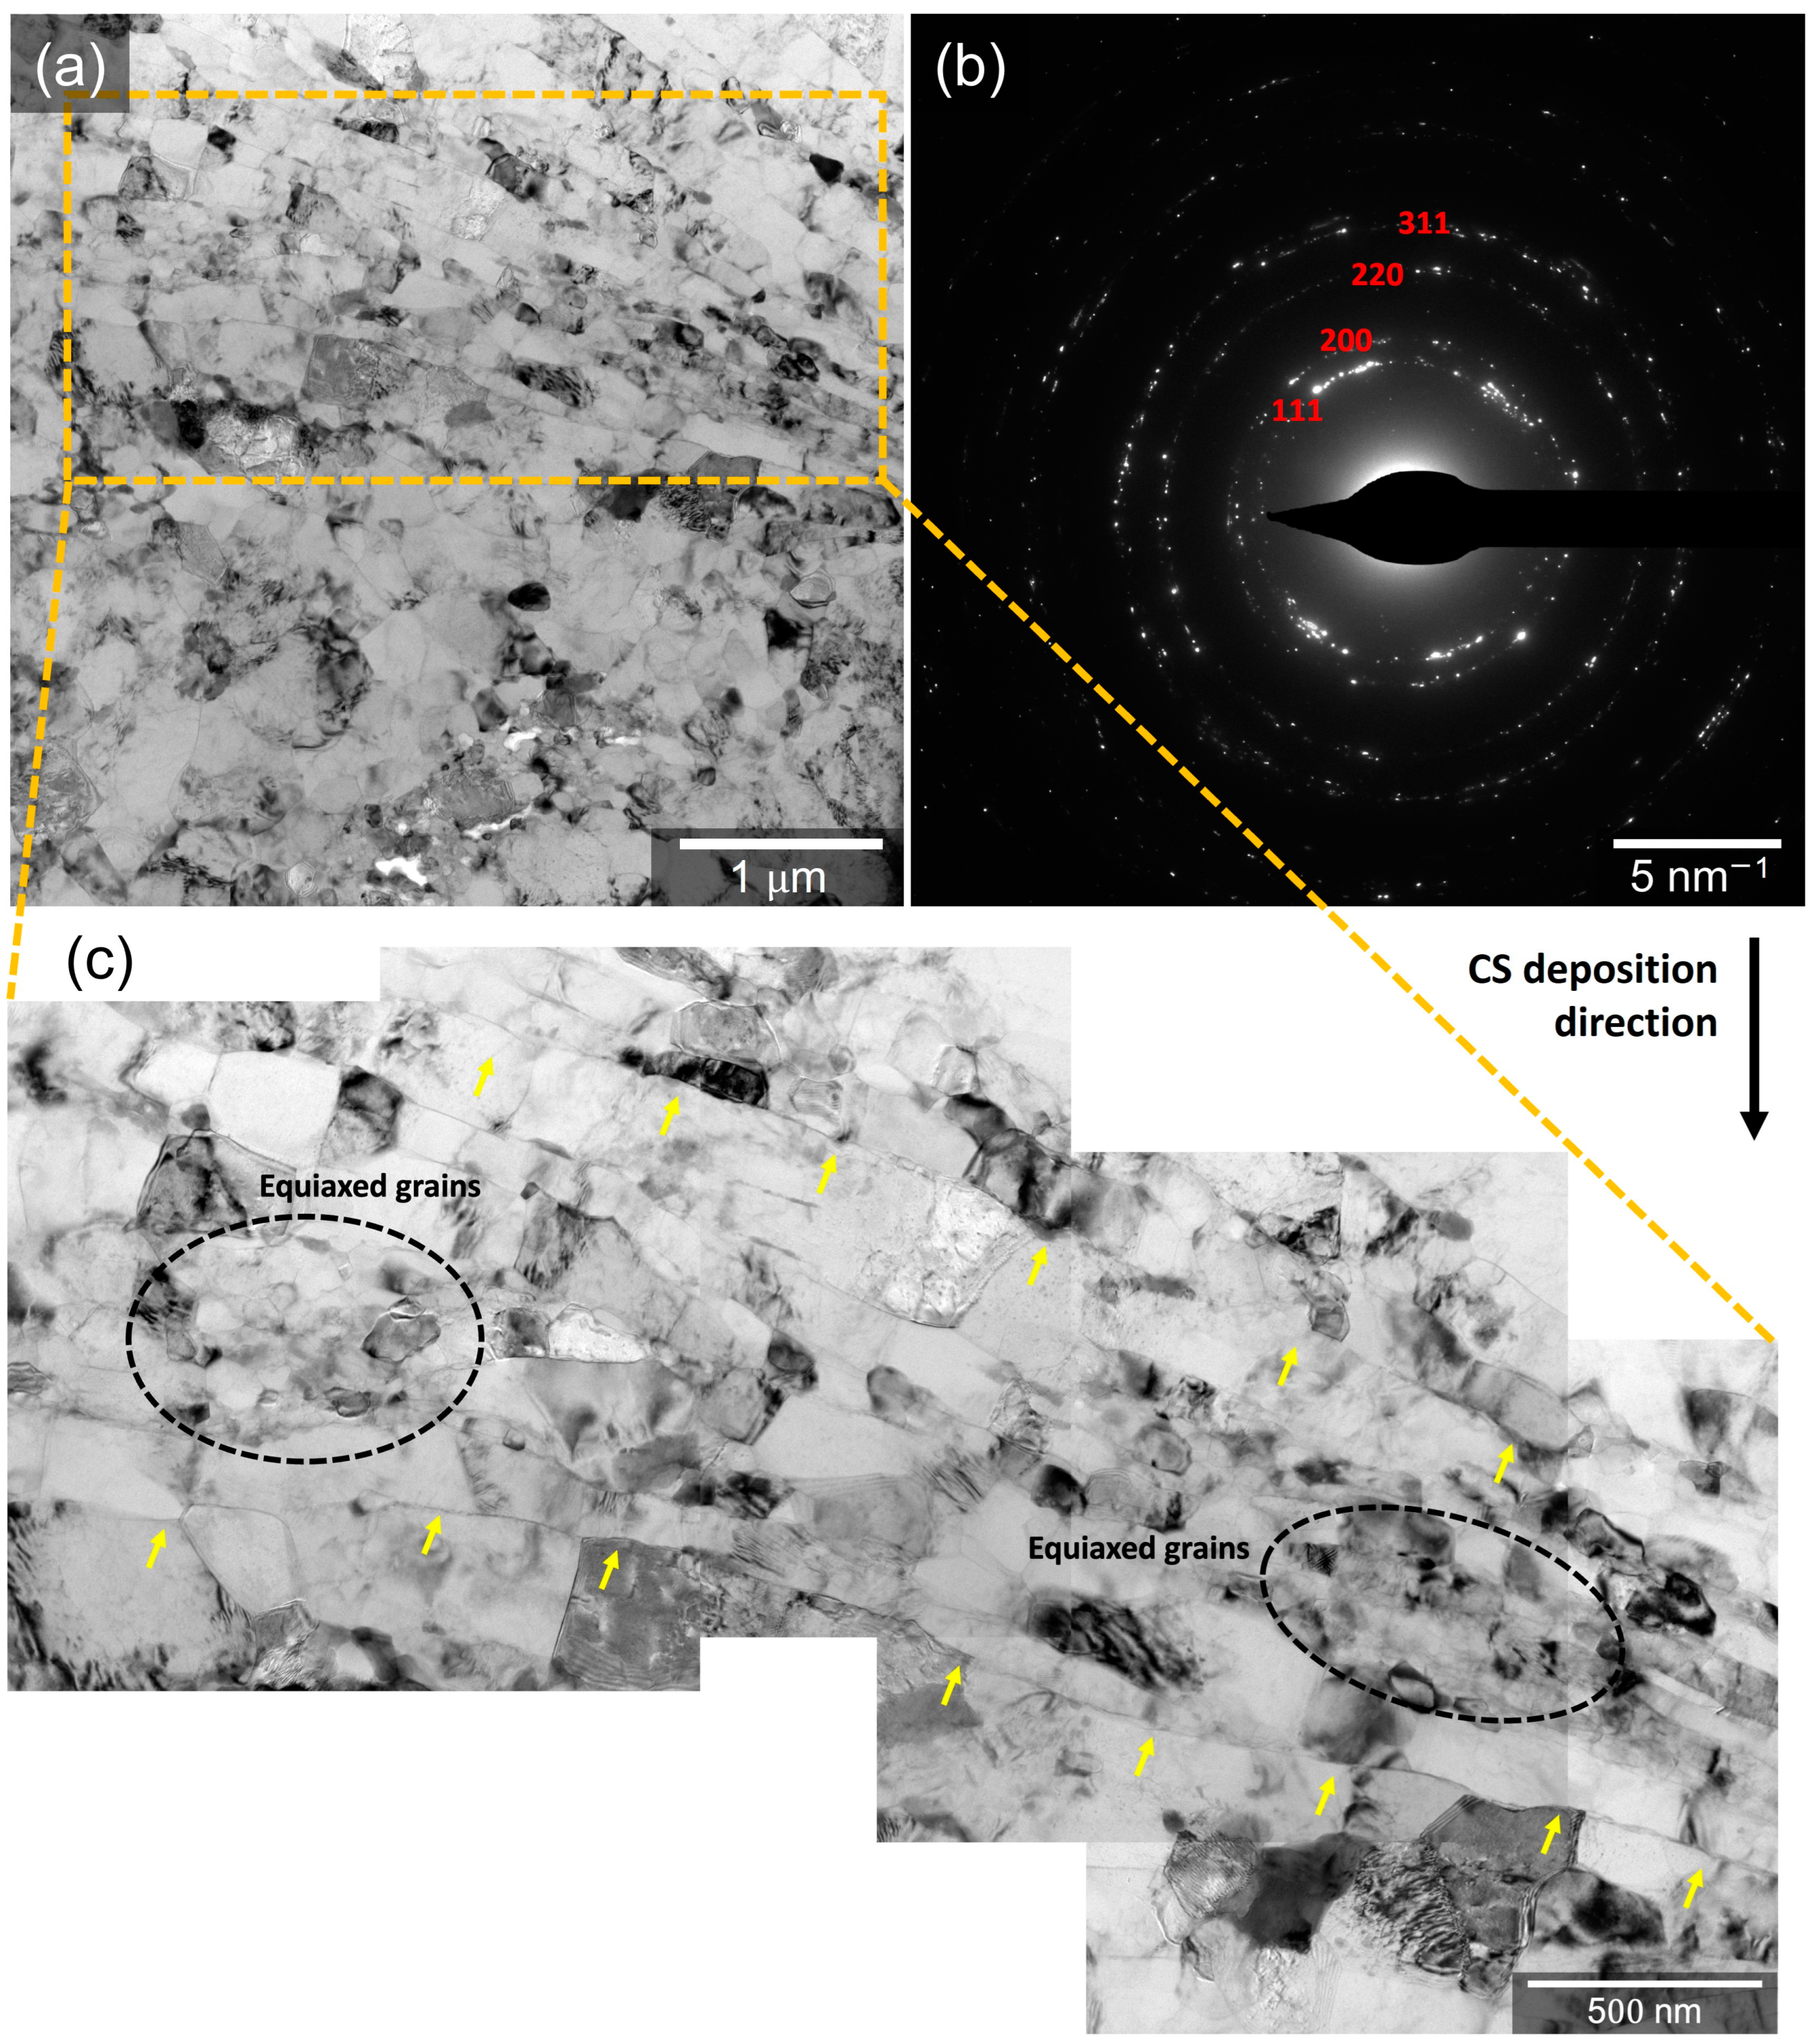
3.1. Microstructural Evaluation

A difference in the size and distribution of intermetallic particles (IMPs) between W5083 and CS5083 was noted in the BSE micrographs and corresponding EDS elemental maps (Figure 2). W5083 demonstrated the distribution of isolated, coarse IMPs that were several microns in diameter (Figure 2a). Bright and dark particles embedded in the Al matrix were believed to be Al(Fe,Mn) and Mg2Si, respectively, which was also supported by point analysis (Figure S1 in Supplementary materials). The intermetallic phases by phase identification and thermodynamic prediction in AA5083 were provided in previous literature [37,38,39,40]. In contrast, no distinctive IMPs were observed in the BSE micrograph of CS5083 (Figure 2b) at this length scale, although the EDS elemental map showed intense Mg signal regions associated with intermetallic networks. Similarly, the minor elements, such as Si, Fe, and Mn, seemed to be homogeneously distributed in the EDS maps, but the line profiles (Figure S1) provided evidence of element segregation by showing intermittent spikes.
STEM-HAADF micrographs and corresponding EDS analysis highlighted a heterogeneous microstructure with nanoscale particles in CS5083 (Figure 3). Irregularly shaped and rod-like particles in W5083 occupied the grain interior and grain boundaries, whereas the nanoscale particles in CS5083 were primarily located at grain boundaries. In both materials, Mg-rich precipitates (in Figure 3a,b) were observed with negligible co-location of X-ray signals from other alloying elements. Additionally, Al(Fe,Mn,Cr) (in Figure 3a) and Al(Fe,Mn) (in Figure 3b) were identified in W5083 and CS5083, respectively, and these are also confirmed by point analysis (Figure S2 in Supplementary materials). Cr-associated particles were not observed in CS5083 because of the reduction of Cr content after gas atomization (see Table 1). Based on the examination of a limited number of STEM micrographs via ImageJ, the interspacing of intermetallic particles was relatively small in CS5083, in the order of approximately 50–200 nm compared to the interspacing observed in W5083 (roughly 90–1200 nm). Note that the Ga ions appeared to preferentially associate with Mg-rich precipitates, which is confirmed by the X-ray signals of Ga from point analysis attributed to implanted Ga during FIB sample preparation. Hence, due to the embedded Ga ions, the Mg-rich precipitates appeared brighter compared to the Al matrix in the STEM-HAADF micrograph.
EBSD analysis revealed different grain structures between W5083 and CS5083 (Figure 4). Inverse pole figure (IPF) maps of W5083 (Figure 4a) illustrated elongated grains along the rolling direction whereas CS5083 (Figure 4b) possessed a combination of structures with larger grains at prior particle centers as well as ultrafine grains at prior particle boundaries (i.e., interfacial regions between particles). These ultrafine grains bounded by high-angle grain boundaries (HAGBs) were identified at prior particle boundaries. Inconsistent indexing was due to either the ultrafine grain size being smaller than the step size (0.5 μm) or plastic strain that degrades the quality of diffraction patterns and indexing for the EBSD scan. The poor quality of diffraction patterns is caused by local distortion of diffracting planes, induced by the plastic deformation [41]. As indicated by the different scalebars, the grain size of CS5083 was qualitatively much smaller than that of W5083. The quantitative analysis confirmed that the average grain size was smaller in CS5083 than in W5083 (Figure 4c). Note that quantitative analysis for grain size was performed with IPF maps after noise reduction with 8-neighbors. It has been noted that the noise reduction with 8-neighbors does not introduce significant artifacts that manipulate the quantitative analysis data [42]. It is also important to note that CS materials typically display bimodal grain size distributions [43]. The fraction of HAGBs in CS5083 was larger in comparison to W5083 (Figure 4d).
A very fine microstructure of CS5083 was further presented by BF micrographs and diffraction patterns (Figure 5). Elongated/flattened grains with a length ranging from 100 to 600 nm and a width of roughly 70 to 200 nm were aligned with prior particle boundary regions (indicated by yellow solid arrows in Figure 5c) perpendicular to the CS deposition direction, which are attributed to the deformation of grains and the nucleation of subgrains during the CS process. In addition to the elongated grains, equiaxed grains (indicated by black dotted circles in Figure 5c) were noticed with a diameter of 30 to 100 nm, which results from dynamic recrystallization based upon severe plastic deformation induced by the CS process. It is reasoned in the literature that the particle deformation generates sufficient dislocations to allow the nucleation and rotation of the subgrains in order to release accumulated strain energies, resulting in grain refinement [44,45]. Thus, the region of the equiaxed grains was free of tangled dislocations. Additionally, the diffraction pattern (Figure 5b) presented a ring diffraction pattern mainly reflecting from the Al phase, indicating that there is no discernable texture.

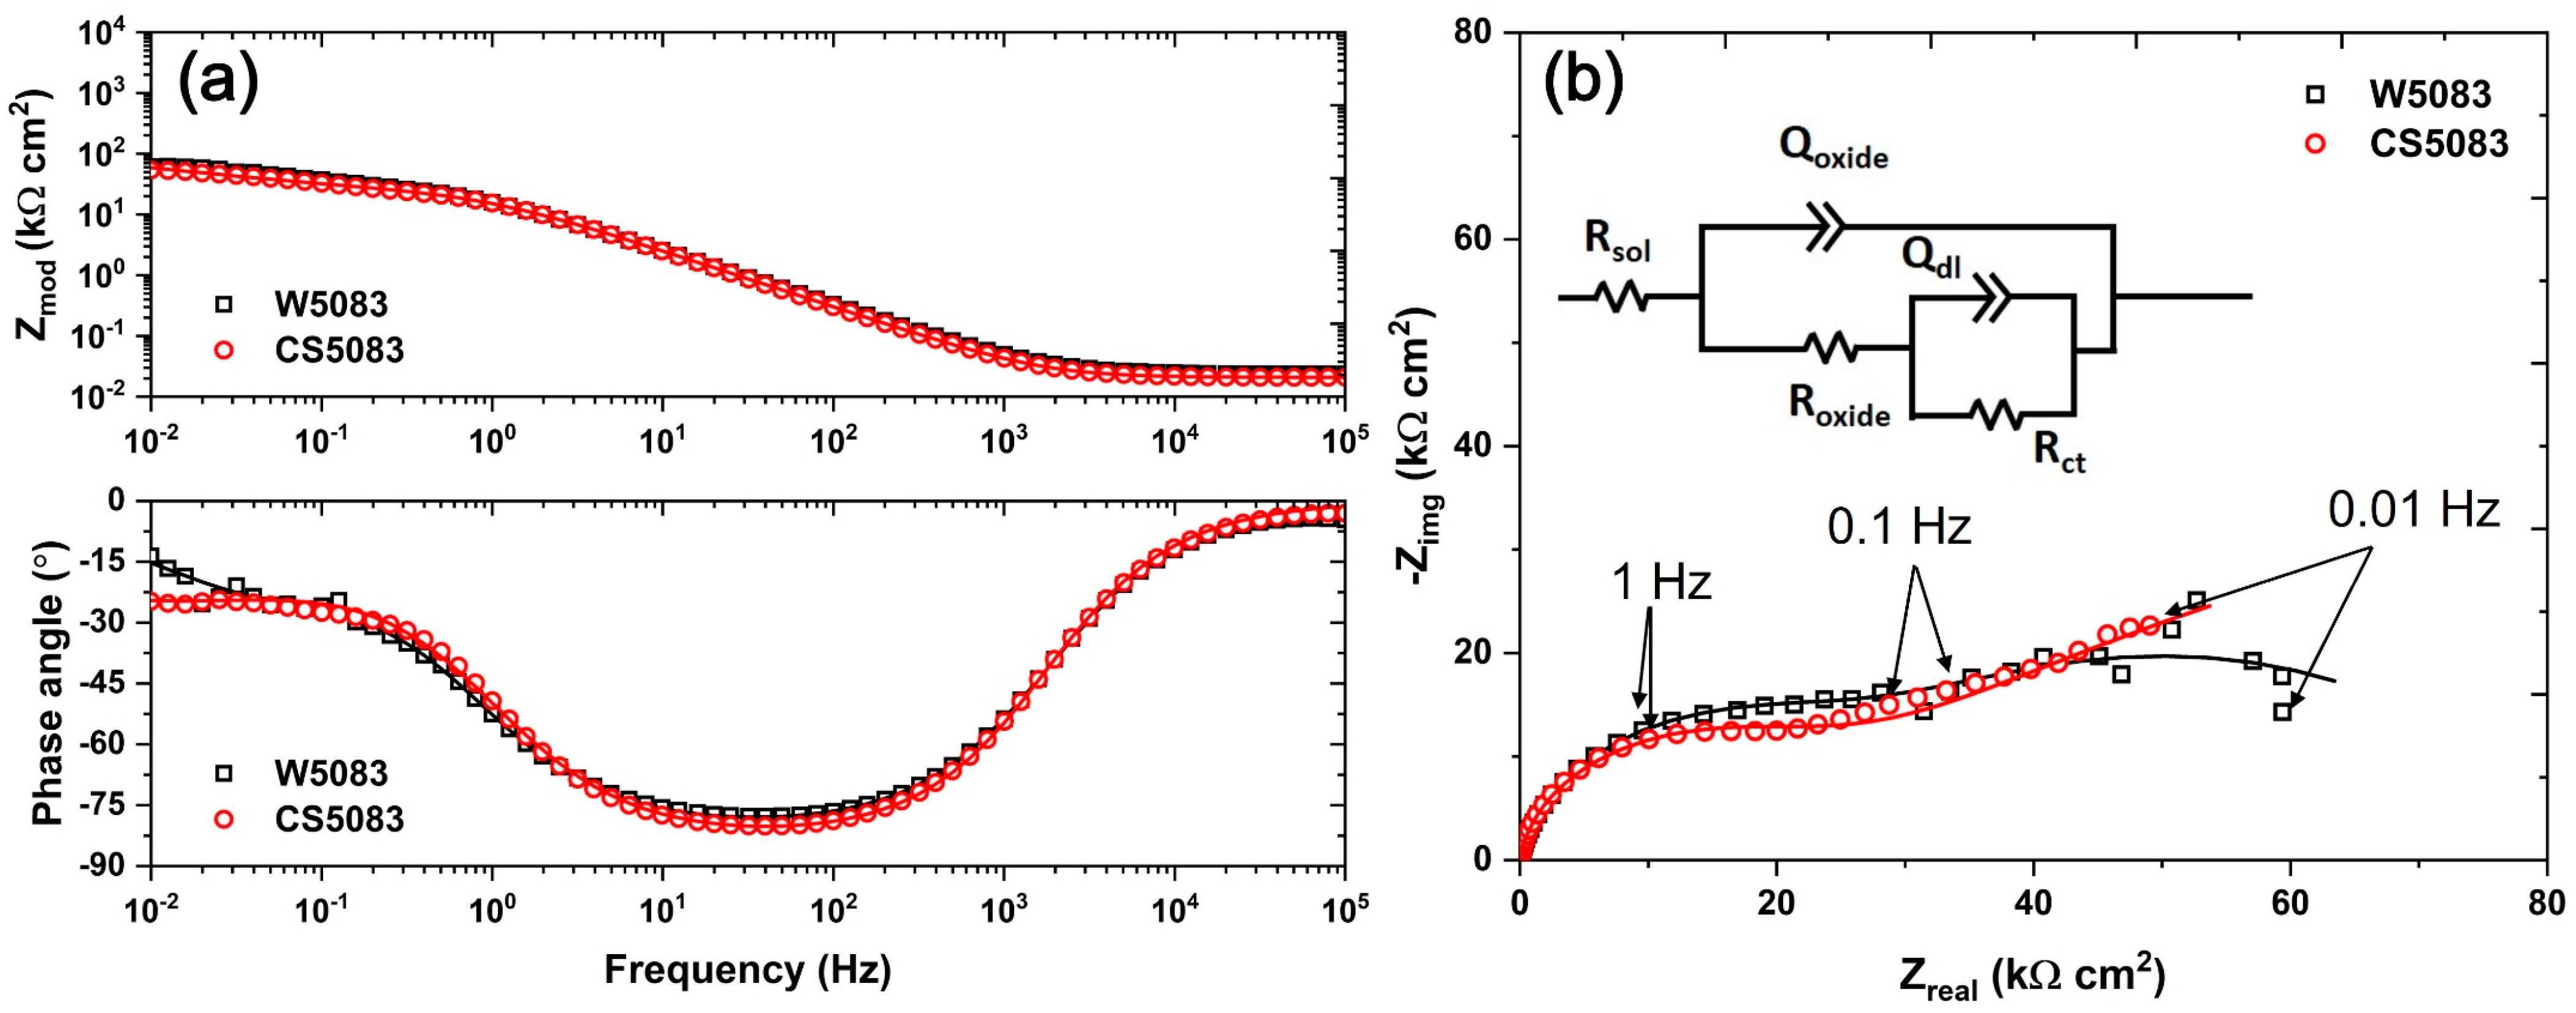
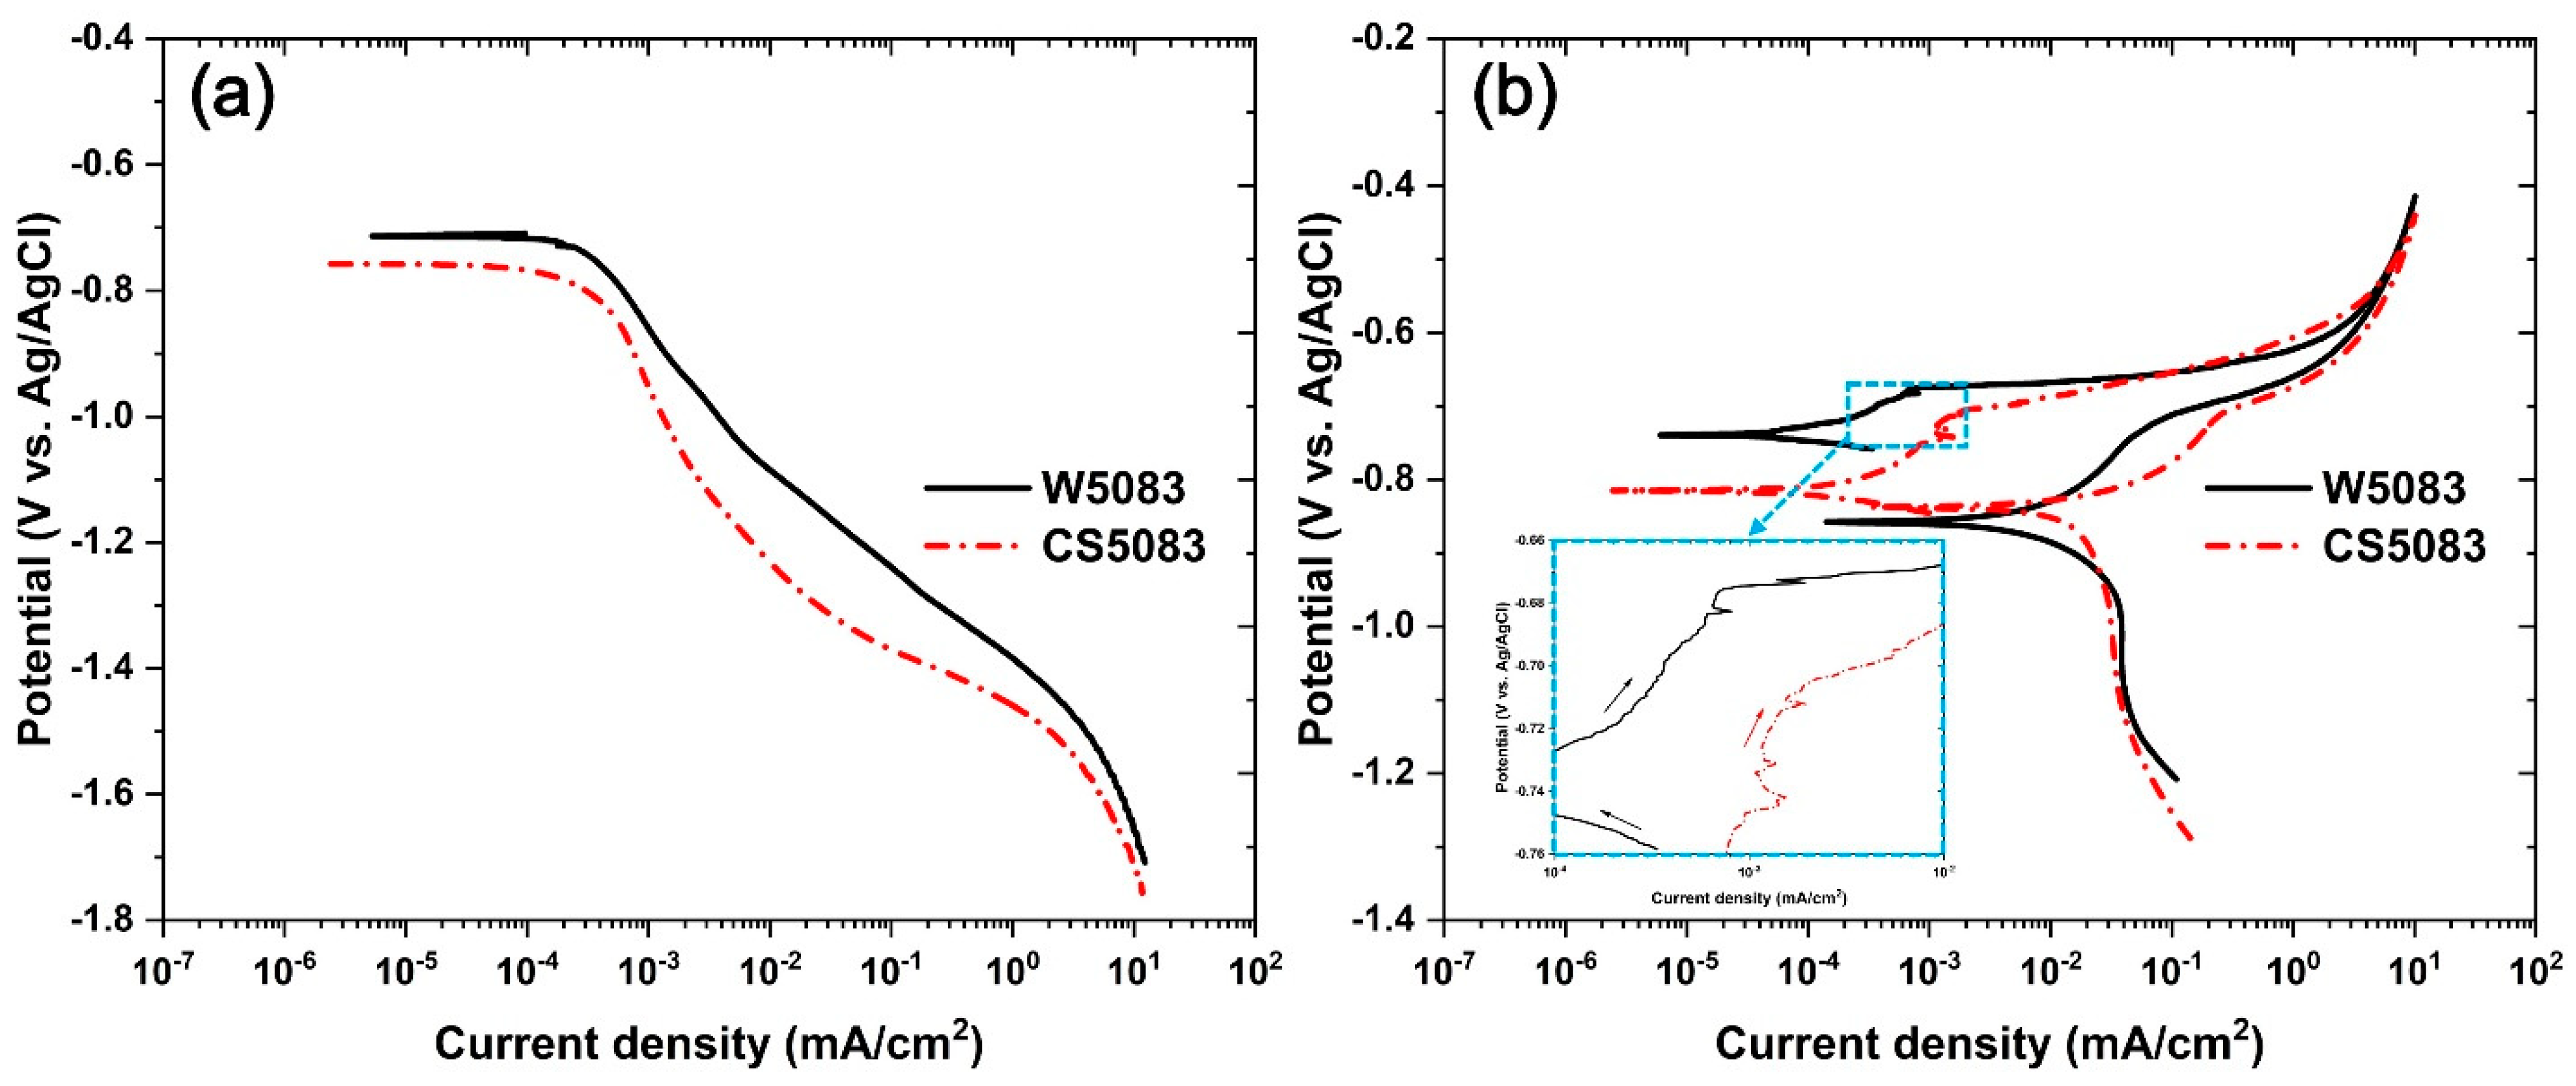
3.2. Corrosion Behavior

Slightly reduced corrosion resistance was presented in CS5083 by EIS spectra, demonstrating higher impedance as compared to W5083 at low-frequency regions (Figure 6). The equivalent circuit typical of a porous or defective oxide layer used for the fitting is composed of the resistance of the solution (Rsol); the resistance of the oxide film (Roxide) that indicates the ohmic resistance of solution within oxide defects or pores; a constant phase element (CPE, Qoxide) in parallel with Roxide, representing non-ideal capacitive behavior of the layer; a charge transfer resistance (Rct); and a CPE of double layer (Qdl). The equivalent circuit inserted in Figure 6b can be expressed as a combination of equations as shown below.
Z = R sol + Q oxide ( j ω ) α + 1 R oxide + R ct 1 + Q dl R ct ( j ω ) α 1
where j, ω, and α are the imaginary number, frequency, and exponent of the CPE, respectively. At zero frequency, the impedance is equivalent to Rsol + Roxide + Rct, and the impedance corresponds to Rsol at infinite frequency [46]. Hence, it could be assumed that the impedance is approximately equal to the summation of all resistances at a low frequency (i.e., 0.01 Hz). In this sense, the absolute impedance of CS5083 was 56.57 ± 4.10 kΩ cm2, which was marginally lower than that of W5083, 68.00 ± 3.21 kΩ cm2, indicating a possible lower corrosion resistance. The diameter of the semi-circle created by the region between 100 kHz and about 0.1 Hz in the Nyquist plot (Figure 6b) was shorter in CS5083, which also supports the reduced corrosion resistance in CS5083.
Polarization tests also differentiated corrosion behavior between W5083 and CS5083 (Figure 7). A cathodic polarization test (Figure 7a) demonstrated a retarded cathodic reaction during potential scanning in CS5083 and a more active Ecorr compared to W5083; however, icorr obtained from Tafel extrapolation revealed higher icorr in CS5083 than in W5083, indicating an increase in the passive current density of CS5083 compared to W5083. The CPP tests (Figure 7b) revealed a very short window of passivation with sporadic spikes, which indicate metastable pitting (highlighted by the inset plot in Figure 7b) and a subsequent increase in current density at pitting potential (Epit). CS5083 seemed to have less resistance to pitting than W5083; increasing anodic current density representing active pitting appeared above the potential of −670.7 ± 4.2 mV and −700.4 ± 5.9 mV vs. Ag/AgCl for W5083 and CS5083, respectively. On the reverse scan, both materials presented an inflection point that indicates an abrupt change in reaction rates at Eptp, and iptp was 3.5 times higher in CS5083 in comparison to W5083. The region of the scan just below Eptp for CS5083 showed an increased steepness of 0.183 ± 0.004 V/decade compared to W5083 that had a steepness of 0.132 ± 0.007 V/decade. All electrochemical parameters obtained from cathodic polarization and CPP tests are tabulated in Table 3.
Optical and SEM imaging after CPP tests revealed distinctive localized corrosion morphologies between W5083 and CS5083 (Figure 8). In plan-view optical images, W5083 showed corrosion damage across most of the exposed surface, whereas CS5083 presented discrete islands of localized corrosion (Figure 8a,d). It can be seen from low-magnification SE micrographs (Figure 8b,e) that the corrosion damage on W5083 was made up of widespread but shallow, interconnected pit sites. The size of the observable pits on CS5083 was larger in diameter than those found in W5083. The diameter of the pit on CS5083 was greater than 100 μm while W5083 showed numerous pits around 10 μm in diameter with many linked cavities. High-magnification SE micrographs of W5083 (Figure 8c,f) revealed crystallographic pits with a faceted appearance following a certain direction. The narrow tunnels of square cross-sections (pointed by yellow arrows in Figure 8c) were also found, and this feature was defined as tunneling by Newman [47]. Similar observations of a faceted pit morphology were reported by Orłowska et al. [48]. In contrast to W5083, the localized corrosion morphology in CS5083 showed less directionality for the Al dissolution. Additionally, a dimpled (pointed by yellow arrows in Figure 8f) appearance was noted, which may be evidence of the fallout of individual feedstock powder particles.
Cross-sectioned samples after the CPP test provided corrosion penetration characteristics (Figure 9). The localized corrosion penetration depth of CS5083 appeared deeper than that of W5083, and the corrosion morphology underneath the surface was found to be more complex in CS5083 than in W5083 (Figure 9a,b). The qualitative observation for localized corrosion penetration depth was further enlightened by a quantitative assessment from image analysis. Most isolated pits in W5083 had a maximum depth of 17.4 μm, and 81% of pit depth was measured to be shallower than 10 μm. CS5083 showed that approximately 50% of depths were deeper than 20 μm, with a maximum depth of 71.6 μm (Figure 9c). Moreover, the fractal dimension of W5083 mostly ranged from 1.2 to 1.5, whereas that of CS5083 was in the range of 1.4 to 1.7 (Figure 9d), implying a more complex morphology in CS5083. Note that the higher value of D denotes the higher complexity of the corrosion morphology due to the dominance of IGC [36].
A 2 h immersion test for W5083 in a 0.6 M NaCl solution highlights the preferential initiation sites for localized corrosion and relative damage in a naturally corroding environment (Figure 10). It was difficult to recognize corrosion damage at a low magnification due to its small size (Figure 10a). At high magnification (Figure 10b), W5083 demonstrated evidence for anodic dissolution induced by Mg2Si as well as cathodic trenching driven by Al(Fe,Mn) particles, in accordance with EDS elemental maps due to micro-galvanic coupling, as presented by Yin et al. [49]. Corroded areas were also correlated with oxygen signals: these regions are likely to be the remnant of an oxide layer that was not completely eliminated during cleaning.
By comparison, CS5083 exhibited noticeable pits, which generally consisted of a central pit with a diameter of approximately 70 μm and several surrounding pits of a much smaller scale (Figure 11a). The rest of the surface of CS5083 away from the central pit areas appeared as an undamaged surface. In addition, localized corrosion in CS5083 seemed not to be driven by isolated constituent particles, evident from corresponding EDS maps at this length scale. The spreading of corrosion (pointed out by yellow arrows in Figure 11b) radiating from the pit followed the deficiency of Al signals that coincided with the trace of the oxygen signal. Note that the absence of signal, especially with Al, Mg, and Si at a deep pit, may be attributed to not only the loss of material but also the absorption of low-energy X-rays during the transit toward the EDS detector, because low-energy X-rays are easily influenced by the roughness of the surface.
The result of the NAMLT revealed significant mass loss for CS5083 regardless of heat treatment time at 100 °C (Figure 12). The mass loss per unit area of W5083 was found to be 2.13 ± 0.09 mg/cm2 in the as-received condition, and it remained below 15 mg/cm2 until 168 h of heat treatment time, indicating that the W5083 samples were IGC-resistant. After 336 h, the mass loss dramatically increased to over 30 mg/cm2, meaning that the samples became IGC-susceptible. The trend of mass loss for W5083 was consistent with a previous work by Oguocha et al. [9]. Interestingly, CS5083 exhibited considerable mass loss even for as-deposited conditions, with an almost consistent mass loss around 38 mg/cm2 measured with insignificant statistical variations for all heat treatment conditions. Furthermore, the CS pure Al (>99.5% purity), which cannot be sensitized due to negligible Mg content, also provided an increased mass loss of 7.74 ± 0.92 mg/cm2 compared to the wrought pure Al showing 0.29 ± 0.02 mg/cm2 due to preferential IGC attack at the prior particle boundary region (see an inset image in Figure 12).
The cross-section and surface morphology for W5083 and CS5083 after the NAMLT manifested IGC penetration (Figure 13). The penetration depth of the IGC damage for W5083 was proportional to the heat treatment time (Figure 13a–c). W5083 also showed preferential IGC damage along grain boundaries, leaving the elongated grain structures, accompanied by grain fallout with increasing heat treatment time (Figure 13d–f). By comparison, there was no significant change in the penetration depth in CS5083 (Figure 13g–i). Additionally, no modification of surface morphology was noted (Figure 13j–l): a wafery surface and flattened individual powder particles along the CS deposition direction were identified for all conditions with a couple of grooves at prior particle boundaries. Comparing IGC penetration depth with cross-section images showed that W5083 seemed to be more vulnerable to IGC than CS5083, which is a contradictory result with the consideration of mass loss shown in Figure 12.

4. Discussion

The microstructure of CS5083, particularly with respect to prior particle boundaries, is responsible for significant mass loss accompanied by Al matrix attack after NAMLT. The NAMLT for CS5083 resulted in a considerable mass loss for all heat treatment conditions up to 504 h in comparison to its wrought counterpart (Figure 12). However, the high mass loss alone may not necessarily explain that CS5083, even in the as-deposited condition, has a very high susceptibility to IGC. Although NAMLT is widely utilized and accepted as a standard to assess DoS, the potential inaccuracy of NAMLT was claimed by McMahon et al. [50]. The underlying premise of NAMLT is that the dissolution of the β-phase accelerates grain fallout, resulting in a higher extent of mass loss. However, in case a substantial Al matrix attack is present, the increased mass loss would result from the Al matrix attack, rather than the dissolution of the β-phase. As such, mass loss associated with the Al matrix gives rise to the overestimated mass loss, making it difficult to directly correlate with IGC susceptibility for CS aluminum alloys. To validate this statement, we tested CS pure Al (>99.5% purity) containing a negligible amount of Mg that gives no possibility for CS pure Al to be sensitized. Nonetheless, CS pure Al exhibited higher mass loss from the NAMLT than wrought pure Al because of the Al matrix attack along prior particle boundary regions, as shown in an inset image in Figure 12. This observation proposes that Al matrix attack is associated with higher mass loss for CS deposits due to the fine grain structure in CS material. As the length of IGC propagation needed to cause grain fallout is much shorter than its wrought counterpart, for a given IGC propagation rate, CS5083 will have a higher grain fallout rate than W5083, resulting in a significant mass loss as well as minimal IGC depth for measurement during post hoc metallography (Figure 13).
The IGC attack even in CS pure Al raises the question of why prior particle boundaries in CS deposits are susceptible to IGC by HNO3. As opposed to as-deposited CS5083 described herein, AA5083 alloys created by additive friction stir deposition [31], selective laser melting (SLM) [51], and friction stir welding (FSW) [52] were found to be IGC-resistant with a mass loss below 5.0 mg/cm2 in all as-produced materials. These previous findings propose that interfacial boundaries/layers generated from manufacturing processes may not be due to a single factor in aggravating preferential IGC attack. The exact reason for IGC preferentially following prior particle boundaries in CS deposits is currently unknown but is likely due to the ultrafine grain structure in the interfacial region. Similar mass loss results were found by Sikora et al. [53] when comparing nanocrystalline Al-Mg alloys (7.5–8.6% Mg) to AA5083-H111, where the nanocrystalline alloys showed significantly higher mass loss than the wrought counterpart in a NAMLT solution despite performing better in less aggressive immersion and electrochemical tests. Fine-grained materials have higher volume fractions of high energy features, such as grain boundaries, than larger-grained counterparts. An order-of-magnitude increase in grain boundary volume from roughly 0.3% to 3% was calculated for a reduction in grain size from 1 μm to 100 nm [54]. These regions of reduced atom coordination or lower atomic density reduce the local work function, increasing the rate of electron transfer [55,56]. Since dissolved Al cations are the stable species in low pH solutions [57], it may be reasonable to suggest that the smaller grain size in the prior particle boundary region (highlighted in Figure 5) should have a higher corrosion rate than the prior particle interior in conditions where passivation is not favorable, such as concentrated HNO3.
The distribution of fine Mg-rich precipitates in the prior particle boundary region further increases the susceptibility and propagation of IGC. This is supported by excessive mass loss from as-deposited CS5083 compared to as-deposited CS pure Al exposed to NAMLT (Figure 12). The increased mass loss in CS pure Al compared to rolled pure Al highlights the influence of the complex, bimodal CS grain structure on NAMLT results, while the excessive mass loss of CS5083 in NAMLT is influenced by both the CS grain structure and precipitate chemistry and distribution. During the CS process, grain refinement induced by dynamic recrystallization is more dominant at peripheral regions than at the center of the impact zone, resulting in much finer grains [28], which would trigger IGC. On top of that, nanoscale Mg-rich precipitates in prior particle boundary regions also contribute to more defective passive film formation and enhanced anodic dissolution [58], leaving the area susceptible to IGC propagation. Li et al. [31] elucidated that the improved IGC resistance of the as-produced AFSD Al-Mg alloy compared to its wrought counterpart was mainly because of the refinement and re-dissolution of the Mn-rich phase, which eliminates defects in the oxide layer during the AFSD process. We show a high density of Mg-rich precipitates (not necessarily β-phase) in the prior particle boundary regions that will have enhanced anodic dissolution rates, driving localized attack. The continuity of an anodic phase has been shown to be critical to the continued propagation of IGC in AA5083 by Zhang et al. [59]. Considering the observation that a difference in mass loss between CS5083 and CS pure Al, it is therefore speculated that the substantial mass loss of CS5083 results from a combination of an Al attack driven by ultrafine grains and enhanced anodic dissolution accelerated by the Mg-rich precipitates along prior particle boundaries, as illustrated in Figure 14.
The fairly consistent mass loss for CS5083 regardless of sensitization time brings up another question of whether CS5083 is essentially being sensitized or not. Even though the mass loss for CS5083 was over the limit generally accepted as an IGC-resistant level (below 15 mg/cm2), meaningful changes in mass loss, IGC penetration depth, and surface morphology were not noticed as sensitization time increases (Figure 12 and Figure 13). In other words, the IGC susceptibility of CS5083 was not affected by 100 °C exposure up to 504 h. Potential explanations include either of the following: the CS5083 was already sensitized during the atomization or deposition process, or β-phase precipitation during thermal treatment is occurring at locations other than the grain boundaries. TEM analysis did not show strong evidence of a continuous or semi-continuous β-phase network along grain boundaries in as-deposited CS5083 even though closely spaced Mg-rich precipitates decorated the grain boundaries (Figure 3). Instead, Mg2Si appeared to be the predominant phase, which is supported by the thermodynamic calculations of phase composition during the solidification of gas-atomized AA5083 using the Scheil-Gulliver model presented in an accompanying paper [39]. In contrast to the CS5083 behavior, the mass loss in NAMLT for Al-Mg alloys produced by AFSD and FSW increased rapidly after sensitization heat treatments [31,52]. This is to be expected in AFSD and FSW due to extensive dynamic recrystallization during processing, and recrystallized microstructures have been shown to accelerate sensitization rates and subsequent IGC susceptibility [11]. The independence of NAMLT mass loss with thermal treatment time in CS5083 may be caused by preferential β-phase precipitation at dislocations within grain interiors. In comparison to AFSD and FSW, plastic deformation during CS deposition results in high dislocation densities throughout the deposit. Hence, the deformed CS microstructure may be analogous to H116 or H128 tempers typically used in marine wrought AA5083, where intragranular β-phase precipitation at dislocations mitigates sensitization. Future work is necessary to elaborate on the size, density, and location of β-phase in the CS microstructure using either STEM or in situ TEM to fundamentally understand the interplay between the microstructure and sensitization behavior in CS Al-Mg alloys.
Refined nanoscale IMPs with a very small interspacing (50–200 nm) in CS5083 increased the susceptibility of localized corrosion in comparison to W5083 during the immersion test. The modification of size and spatial distribution of IMPs influences localized corrosion susceptibility in Al alloys. Previous simulation [60] and experimental studies [53,61] showed that refined and homogenous distribution of IMPs tends to suppress the onset of localized corrosion. In contrast, the opposing view from another work [32] argued that smaller IMPs with an increase in the total interfacial length between the Al matrix and IMPs and a short separation exacerbated the extent of localized corrosion. This result is further explained by the finding that a long separation between the particles mitigates the propagation of localized corrosion by suppressing inter-particle interactions [62]. In CS5083, the increased susceptibility to localized corrosion may be attributed to the small interspacing of particles along grain boundaries that facilitate the growth and spreading of localized corrosion, as shown in Figure 11b.
The differences in grain size and fraction of HAGBs between W5083 and CS5083 also influenced corrosion resistance. The effect of grain size on corrosion behavior in Al alloys has been investigated by several works [53,63,64,65]. Some studies maintained that corrosion resistance is enhanced with reduced grain size since fine-grained Al alloys are more capable of being passivated due to an increased fraction of HAGBs than coarser-grained alloys. The contradictory view was that fine-grained Al offers more corrosion initiation sites, making the material susceptible to IGC [64]. In this work, an aggressive corrosion attack in CS5083 may be ascribed to the combination of increased HAGBs and intermetallic phases, which could be supported by the work of Ingel et al. [63]. In commercially pure aluminum, an increase in HAGBs provided a decrease in icorr due to a rapid formation of the passive film on HAGBs. However, the subsequent propagation of localized corrosion was preferentially promoted along HAGBs once localized corrosion is initiated. Besides, the presence of IMPs along grain boundaries, as observed in Figure 3, could weaken and break down the passive film [66]. Accordingly, the nanoscale particles present along prior particle boundaries, mostly characterized by HAGBs, trigger the rupture of the passive film even though HAGBs promote the thicker and denser passive film when exposed to the electrolyte, and prior particle boundaries subsequently serve as an active path for the propagation of localized corrosion.
CS5083 showed similar but measurable differences in electrochemical behavior compared to W5083, evident from electrochemical tests with increased icorr corresponding to the low impedance at low frequency (Figure 6 and Figure 7). Even though increased cathodic kinetics appeared in W5083 during the overall potential range in cathodic polarization (Figure 7a), high icorr in CS5083 was measured (Table 3), indicating that anodic kinetics becomes more dominant to determine icorr than cathodic kinetics. In other words, the elevated passive current density in CS5083 may be resulting in a lower applied current during the cathodic polarization experiment. Enhanced anodic kinetics may be attributed to the increased fraction of HAGBs being more active sites than the Al matrix. Similarly, the CPP tests demonstrated increased anodic kinetics and more active metastable pitting regions in CS5083 compared to W5083 (Figure 7b). The slightly active metastable pitting region of CS5083 observed in Figure 7b is also assumed to result from the active spreading of corrosion in CS5083. Scully et al. [67] elucidated that Epit is dependent upon not only the number of metastable pits but also the clustering of pits, and both contributions are controlled by the nearest neighbor distance (NND) for IMPs and surface heterogeneity. The reverse scan further shed light on the effect of microstructure on electrochemical behaviors, which could be correlated with corrosion morphology after the CPP test. Eptp and iptp are electrochemical parameters associated with the repassivation of small and shallow pits. The steepness of the reverse scan below Eptp is indicative of the complexity of the corrosion morphology [32,68,69]. iptp and the steepness below Eptp were larger in CS5083 than in W5083, indicating that a narrow and occluded corrosion path (Figure 9b), induced by deformed microstructures of CS5083, impedes repassivation behavior [32]. Kus et al. [70] also observed more pronounced steepness below Eptp in nanocrystalline AA5083 compared to the coarse-grained one. IGC fissures in CS5083 tend to be propagated in random directions, thus leading to acidification in a tortuous corrosion path where mass transport becomes limited. As a result, the stable growth of IGC fissures by autocatalytic reactions in acid environments eventually gives rise to the agglomeration of IGC fissures, bringing about a large extent of localized corrosion on the surface (seen in Figure 9 and Figure 11), as stated by Kim et al. [22] and Lim et al. [71].
Overall, the corrosion resistance of the as-deposited CS5083 was worse in comparison to the wrought AA5083-H116 due to ultrafine grains, HAGBs, closely spaced intermetallic phases (networks), and heterogeneous microstructure, all of which feature the unique microstructure of CS material. Heat treatment on CS materials improves corrosion resistance by eliminating pores [72,73], which is where localized corrosion is preferentially activated; however, the heat treatment could completely change the microstructure of as-deposited materials concerning grain growth, the migration/clustering of solutes, and the relaxation of compressive stress, thereby negating the advantages of the CS process that provide extensive mechanical strength. Furthermore, CS is a low heat input process, and heat treatment may not be desired or practical during the in situ repair of components. Instead, tailoring alloy compositions is proposed as an alternative way to enhance corrosion resistance in CS Al-Mg alloys while obtaining comparable mechanical strength. Previous work showed that CS Al-Mg alloys with lowering Mg concentration achieve comparable mechanical strength to their wrought counterparts [39] via grain refinement and work-hardening in the CS microstructure. This promising result suggests that it is feasible to lower Mg concentration, potentially offering corrosion resistance and comparable mechanical strength simultaneously. The following works will be pursuing alloy design in feedstock powder and CS Al-Mg deposits (i.e., removing non-essential alloying elements and/or controlling Mg concentration) via gas atomization and CS deposition for improving corrosion resistance in as-deposited conditions.

5. Conclusions

Cold sprayed AA5083 deposits showed different corrosion behavior compared to their wrought counterparts as a result of microstructural changes in the size and spatial distribution of intermetallic particles, grain size/shape, and misorientation after cold spray deposition. The effect of microstructure on the corrosion behavior of cold sprayed AA5083 deposits was evaluated by material characterization and corrosion tests, and the following conclusions have been drawn out from the data presented herein.
Refined and closely spaced intermetallic particles in the microstructure of cold sprayed AA5083 stimulated the initiation of localized corrosion and accelerated the spreading of corrosion.
Reduced grain size after cold spray deposition rendered cold sprayed AA5083 more susceptible to localized corrosion than its wrought counterparts in a pH-neutral NaCl solution. This enhanced localized corrosion was caused by increased high-angle grain boundaries in prior particle boundary regions of cold sprayed AA5083.
Electrochemical tests revealed decreased corrosion resistance in cold sprayed AA5083 with enhanced anodic kinetics, high pitting susceptibility, and limited repassivation behavior, giving rise to extensive localized corrosion, evident from corrosion morphologies after polarization tests.
The ASTM G67 test presented significant mass loss for cold sprayed AA5083 compared to its wrought counterpart, regardless of sensitization time. By comparison with cold sprayed pure Al, it was suggested that Mg-, Fe-, and Si-rich precipitates within the prior particle boundary regions in the microstructure of cold sprayed AA5083 play a significant role in driving the extensive mass loss in ASTM G67.
Nonetheless, the utilization of ASTM G67 for cold sprayed Al-Mg alloys is not an effective means for evaluating sensitization and intergranular corrosion susceptibility in cold sprayed AA5083, given the observation that cold sprayed pure Al also demonstrated IGC attacks along prior particle boundaries during the test despite the lack of Mg and β-phase formation.

Supplementary Materials

The following supporting information can be downloaded at: https://www.mdpi.com/article/10.3390/cmd5010002/s1, Figure S1: BSE micrographs and corresponding point and line profile analyses; Figure S2: STEM micrographs and corresponding point analyses.

Author Contributions

Conceptualization, G.W.K.; Methodology, M.K. and G.W.K.; Validation, M.K.; Formal Analysis, M.K.; Investigation, M.K. and L.P.-A.; Resources, L.N.B. and G.W.K.; Data Curation, M.K.; Writing—Original Draft Preparation, M.K.; Writing—Review & Editing, L.P.-A., L.N.B. and G.W.K.; Visualization, M.K., L.P.-A., L.N.B. and G.W.K.; Supervision, G.W.K.; Project Administration, G.W.K.; Funding Acquisition, G.W.K. All authors have read and agreed to the published version of the manuscript.

Funding

This work is financially supported by the Office of Naval Research under Grant No. N00014-21-1-2459.

Data Availability Statement

The data presented in this study are available on reasonable request from the corresponding author.

Acknowledgments

We appreciate Wade Compton and Lee Townsend for laboratory assistance in gas atomization and cold spray process.

Conflicts of Interest

The authors declare no conflict of interest.

References

  1. Sielski, R.A. Research needs in aluminum structure. Ships Offshore Struct. 2008, 3, 57–65. [Google Scholar] [CrossRef]
  2. Lim, M.L.; Kelly, R.; Scully, J. Overview of Intergranular Corrosion Mechanisms, Phenomenological Observations, and Modeling of AA5083. Corrosion 2015, 72, 198–220. [Google Scholar] [CrossRef]
  3. Searles, J.; Gouma, P.; Buchheit, R. Stress corrosion cracking of sensitized AA5083 (Al-4.5 Mg-1.0 Mn). Metall. Mater. Trans. A 2001, 32, 2859–2867. [Google Scholar] [CrossRef]
  4. Davis, J.R. Corrosion of Aluminum and Aluminum Alloys; ASM International: West Conshohocken, PA, USA, 1999. [Google Scholar]
  5. Jain, S.; Hudson, J.L.; Scully, J.R. Effects of constituent particles and sensitization on surface spreading of intergranular corrosion on a sensitized AA5083 alloy. Electrochim. Acta 2013, 108, 253–264. [Google Scholar] [CrossRef]
  6. Buczynski, J.; Kelly, R. Electrochemical Characterization of the beta-phase (Al3Mg2) in 5XXX Aluminum Alloys. ECS Meet. Abstr. 2011, 21, 163. [Google Scholar] [CrossRef]
  7. Li, Y.; Cai, J.M.; Guan, L.; Wang, G. pH-dependent electrochemical behaviour of Al3Mg2 in NaCl solution. Appl. Surf. Sci. 2019, 467–468, 619–633. [Google Scholar] [CrossRef]
  8. Goswami, R.; Spanos, G.; Pao, P.S.; Holtz, R.L. Microstructural Evolution and Stress Corrosion Cracking Behavior of Al-5083. Metall. Mater. Trans. A 2010, 42, 348–355. [Google Scholar] [CrossRef]
  9. Oguocha, I.N.A.; Adigun, O.J.; Yannacopoulos, S. Effect of sensitization heat treatment on properties of Al–Mg alloy AA5083-H116. J. Mater. Sci. 2008, 43, 4208–4214. [Google Scholar] [CrossRef]
  10. Kasen, S.D.; Tubbs, D. Strength Degradation in AA5083 Armor Plate After Exposure to Elevated Temperatures. J. Eng. Mater. Technol. 2023, 145, 011001–011008. [Google Scholar] [CrossRef]
  11. Golumbfskie, W.J.; Tran, K.T.; Noland, J.M.; Park, R.; Stiles, D.J.; Grogan, G.; Wong, C. Survey of Detection, Mitigation, and Repair Technologies to Address Problems Caused by Sensitization of Al-Mg Alloys on Navy Ships. Corrosion 2016, 72, 314–328. [Google Scholar] [CrossRef]
  12. Assadi, H.; Gärtner, F.; Stoltenhoff, T.; Kreye, H. Bonding mechanism in cold gas spraying. Acta Mater. 2003, 51, 4379–4394. [Google Scholar] [CrossRef]
  13. Grujicic, M.; Zhao, C.L.; DeRosset, W.S.; Helfritch, D. Adiabatic shear instability based mechanism for particles/substrate bonding in the cold-gas dynamic-spray process. Mater. Des. 2004, 25, 681–688. [Google Scholar] [CrossRef]
  14. Li, W.; Yang, K.; Yin, S.; Yang, X.; Xu, Y.; Lupoi, R. Solid-state additive manufacturing and repairing by cold spraying: A review. J. Mater. Sci. Technol. 2018, 34, 440–457. [Google Scholar] [CrossRef]
  15. Yin, S.; Cavaliere, P.; Aldwell, B.; Jenkins, R.; Liao, H.; Li, W.; Lupoi, R. Cold spray additive manufacturing and repair: Fundamentals and applications. Addit. Manuf. 2018, 21, 628–650. [Google Scholar] [CrossRef]
  16. Yin, S.; Fan, N.; Huang, C.; Xie, Y.; Zhang, C.; Lupoi, R.; Li, W. Towards high-strength cold spray additive manufactured metals: Methods, mechanisms, and properties. J. Mater. Sci. Technol. 2024, 170, 47–64. [Google Scholar] [CrossRef]
  17. Tao, Y.; Xiong, T.; Sun, C.; Kong, L.; Cui, X.; Li, T.; Song, G.-L. Microstructure and corrosion performance of a cold sprayed aluminium coating on AZ91D magnesium alloy. Corros. Sci. 2010, 52, 3191–3197. [Google Scholar] [CrossRef]
  18. Spencer, K.; Fabijanic, D.M.; Zhang, M.X. The use of Al–Al2O3 cold spray coatings to improve the surface properties of magnesium alloys. Surf. Coat. Technol. 2009, 204, 336–344. [Google Scholar] [CrossRef]
  19. Yin, S.; Aldwell, B.; Lupoi, R. Cold Spray Additive Manufacture and Component Restoration. In Cold-Spray Coatings: Recent Trends and Future Perspectives; Cavaliere, P., Ed.; Springer International Publishing: Cham, Switzerland, 2018; pp. 195–224. [Google Scholar] [CrossRef]
  20. Champagne, V.K. The Repair of Magnesium Rotorcraft Components by Cold Spray. J. Fail. Anal. Prev. 2008, 8, 164–175. [Google Scholar] [CrossRef]
  21. Agar, O.; Alex, A.; Kubacki, G.; Zhu, N.; Brewer, L. Corrosion Behavior of Cold Sprayed Aluminum Alloys 2024 and 7075 in an Immersed Seawater Environment. Corrosion 2021, 77, 1354–1364. [Google Scholar] [CrossRef]
  22. Kim, M.; Brewer, L.N.; Kubacki, G.W. Initiation and Propagation of Localized Corrosion on Cold-Sprayed Aluminum Alloy 2024 and 7075. Corrosion 2023, 79, 554–569. [Google Scholar] [CrossRef]
  23. Kim, M.; Brewer, L.N.; Kubacki, G.W. Microstructure and corrosion resistance of chromate conversion coating on cold sprayed aluminum alloy 2024. Surf. Coat. Technol. 2023, 460, 129423. [Google Scholar] [CrossRef]
  24. Ngai, S.; Ngai, T.; Vogel, F.; Story, W.; Thompson, G.B.; Brewer, L.N. Saltwater corrosion behavior of cold sprayed AA7075 aluminum alloy coatings. Corros. Sci. 2018, 130, 231–240. [Google Scholar] [CrossRef]
  25. Hutasoit, N.; Javed, M.A.; Rashid, R.A.R.; Wade, S.; Palanisamy, S. Effects of build orientation and heat treatment on microstructure, mechanical and corrosion properties of Al6061 aluminium parts built by cold spray additive manufacturing process. Int. J. Mech. Sci. 2021, 204, 106526. [Google Scholar] [CrossRef]
  26. DeForce, B.S.; Eden, T.J.; Potter, J.K. Cold Spray Al-5% Mg Coatings for the Corrosion Protection of Magnesium Alloys. J. Therm. Spray Technol. 2011, 20, 1352–1358. [Google Scholar] [CrossRef]
  27. Zhang, Z.; Liu, F.; Han, E.-H.; Xu, L. Mechanical and corrosion properties in 3.5% NaCl solution of cold sprayed Al-based coatings. Surf. Coat. Technol. 2020, 385, 125372. [Google Scholar] [CrossRef]
  28. Rokni, M.; Nardi, A.; Champagne, V.; Nutt, S. Effects of preprocessing on multi-direction properties of aluminum alloy cold-spray deposits. J. Therm. Spray Technol. 2018, 27, 818–826. [Google Scholar] [CrossRef]
  29. Esteves, L.; Witharamage, C.S.; Christudasjustus, J.; Walunj, G.; O'Brien, S.P.; Ryu, S.; Borkar, T.; Akans, R.E.; Gupta, R.K. Corrosion behavior of AA5083 produced by high-energy ball milling. J. Alloys Compd. 2021, 857, 158268. [Google Scholar] [CrossRef]
  30. Alil, A.; Popović, M.; Bajat, J.; Romhanji, E. Mechanical and corrosion properties of AA5083 alloy sheets produced by accumulative roll bonding (ARB) and conventional cold rolling (CR). Mater. Corros. 2018, 69, 858–869. [Google Scholar] [CrossRef]
  31. Li, Y.; Yang, B.; Zhang, M.; Wang, H.; Gong, W.; Lai, R.; Li, Y.; Teng, J. The corrosion behavior and mechanical properties of 5083 Al-Mg alloy manufactured by additive friction stir deposition. Corros. Sci. 2023, 213, 110972. [Google Scholar] [CrossRef]
  32. Beura, V.K.; Kale, C.; Srinivasan, S.; Williams, C.L.; Solanki, K.N. Corrosion behavior of a dynamically deformed Al–Mg alloy. Electrochim. Acta 2020, 354, 136695. [Google Scholar] [CrossRef]
  33. Zhang, R.; Gupta, R.K.; Davies, C.H.J.; Hodge, A.M.; Tort, M.; Xia, K.; Birbilis, N. The influence of grain size and grain orientation on sensitisation in AA5083. Corrosion 2016, 72, 160–168. [Google Scholar] [CrossRef]
  34. ASTM G67-18; Standard Test Method for Determining the Susceptibility to Intergranular Corrosion of 5XXX Series Aluminum Alloys by Mass Loss After Exposure to Nitric Acid (NAMLT Test). ASTM: West Conshohocken, PA, USA, 2019.
  35. Holten, T.; Jøssang, T.; Meakin, P.; Feder, J. Fractal characterization of two-dimensional aluminum corrosion fronts. Phys. Rev. E 1994, 50, 754. [Google Scholar] [CrossRef] [PubMed]
  36. Zhang, D.; Srinivasan, J.; Locke, J. Quantitative Evaluation of the Ability of Accelerated Tests to Simulate On-Road Corrosion Morphology of Automotive Aluminum Alloys. Corrosion 2022, 78, 1229–1249. [Google Scholar] [CrossRef]
  37. Yi, G.; Sun, B.; Poplawsky, J.D.; Zhu, Y.; Free, M.L. Investigation of pre-existing particles in Al 5083 alloys. J. Alloys Compd. 2018, 740, 461–469. [Google Scholar] [CrossRef]
  38. Engler, O.; Miller-Jupp, S. Control of second-phase particles in the Al-Mg-Mn alloy AA 5083. J. Alloys Compd. 2016, 689, 998–1010. [Google Scholar] [CrossRef]
  39. Kim, M.; Perez-Andrade, L.; Brewer, L.N.; Kubacki, G.W. Structure and Deposition Characteristics of Cold-Sprayed AA5083 and Al-Mg Binary Alloys Using Gas-Atomized Al-Mg Powders. J. Therm. Spray Technol. 2023, 32, 2729–2746. [Google Scholar] [CrossRef]
  40. Birbilis, N.; Buchheit, R.G. Electrochemical characteristics of intermetallic phases in aluminum alloys: An experimental survey and discussion. J. Electrochem. Soc. 2005, 152, B140. [Google Scholar] [CrossRef]
  41. Wright, S.I.; Nowell, M.M.; Field, D.P. A review of strain analysis using electron backscatter diffraction. Microsc. Microanal. 2011, 17, 316–329. [Google Scholar]
  42. Brewer, L.N.; Michael, J.R. Risks of “Cleaning” Electron Backscatter Diffraction Data. Microsc. Today 2010, 18, 10–15. [Google Scholar] [CrossRef]
  43. Liu, T.; Leazer, J.D.; Bannister, H.; Story, W.A.; Bouffard, B.D.; Brewer, L.N. Influence of Alloy Additions on the Microstructure, Texture, and Hardness of Low-Pressure Cold-Sprayed Al-Cu Alloys. J. Therm. Spray Technol. 2019, 28, 904–916. [Google Scholar] [CrossRef]
  44. Hall, A.C.; Brewer, L.N.; Roemer, T.J. Preparation of Aluminum Coatings Containing Homogenous Nanocrystalline Microstructures Using the Cold Spray Process. J. Therm. Spray Technol. 2008, 17, 352–359. [Google Scholar] [CrossRef]
  45. Borchers, C.; Gärtner, F.; Stoltenhoff, T.; Kreye, H. Microstructural bonding features of cold sprayed face centered cubic metals. J. Appl. Phys. 2004, 96, 4288–4292. [Google Scholar] [CrossRef]
  46. Orazem, M.E.; Tribollet, B. Electrochemical Impedance Spectroscopy, 2nd ed.; John Wiley & Sons, Inc.: Hoboken, NJ, USA, 2008; pp. 383–389. [Google Scholar]
  47. Newman, R. Local chemistry considerations in the tunnelling corrosion of aluminium. Corros. Sci. 1995, 37, 527–533. [Google Scholar] [CrossRef]
  48. Orłowska, M.; Ura-Bińczyk, E.; Olejnik, L.; Lewandowska, M. The effect of grain size and grain boundary misorientation on the corrosion resistance of commercially pure aluminium. Corros. Sci. 2019, 148, 57–70. [Google Scholar] [CrossRef]
  49. Yin, L.; Jin, Y.; Leygraf, C.; Pan, J. Numerical simulation of micro-galvanic corrosion of Al alloys: Effect of chemical factors. J. Electrochem. Soc. 2017, 164, C768. [Google Scholar] [CrossRef]
  50. McMahon, M.E.; Haines, R.L.; Steiner, P.J.; Schulte, J.M.; Fakler, S.E.; Burns, J.T. Beta phase distribution in Al-Mg alloys of varying composition and temper. Corros. Sci. 2020, 169, 108618. [Google Scholar] [CrossRef]
  51. Cabrera-Correa, L.; González-Rovira, L.; de Dios López-Castro, J.; Botana, F.J. Pitting and intergranular corrosion of Scalmalloy® aluminium alloy additively manufactured by Selective Laser Melting (SLM). Corros. Sci. 2022, 201, 110273. [Google Scholar] [CrossRef]
  52. Ning, J.; Gao, W.; Gu, X.; Zhang, H.; Guan, W.; Li, W.; Liang, H.; Wang, D.; Lewandowski, J.J. Precipitation behavior and corrosion properties of friction stir welded AA5083 Al Mg alloy after sensitization. Mater. Charact. 2023, 199, 112782. [Google Scholar] [CrossRef]
  53. Sikora, E.; Wei, X.; Shaw, B. Corrosion behavior of nanocrystalline bulk Al-Mg-based alloys. Corrosion 2004, 60, 387–398. [Google Scholar] [CrossRef]
  54. Palumbo, G.; Thorpe, S.; Aust, K. On the contribution of triple junctions to the structure and properties of nanocrystalline materials. Scr. Metall. Et Mater. 1990, 24, 1347–1350. [Google Scholar] [CrossRef]
  55. Smoluchowski, R. Anisotropy of the electronic work function of metals. Phys. Rev. 1941, 60, 661. [Google Scholar] [CrossRef]
  56. Splinter, S.; Rofagha, R.; McIntyre, N.; Erb, U. XPS characterization of the corrosion films formed on nanocrystalline Ni–P alloys in sulphuric acid. Surf. Interface Anal. 1996, 24, 181–186. [Google Scholar] [CrossRef]
  57. Pourbaix, M. Atlas of Electrochemical Equilibria in Aqueous Solutions; NACE: Houston, TX, USA, 1974; p. 331. [Google Scholar]
  58. Brillas, E.; Cabot, P.; Centellas, F.; Garrido, J.; Perez, E.; Rodríguez, R. Electrochemical oxidation of high-purity and homogeneous Al–Mg alloys with low Mg contents. Electrochim. Acta 1998, 43, 799–812. [Google Scholar] [CrossRef]
  59. Zhang, R.; Qiu, Y.; Qi, Y.; Birbilis, N. A closer inspection of a grain boundary immune to intergranular corrosion in a sensitised Al-Mg alloy. Corros. Sci. 2018, 133, 1–5. [Google Scholar] [CrossRef]
  60. Yin, L.; Jin, Y.; Leygraf, C.; Birbilis, N.; Pan, J. Numerical simulation of micro-galvanic corrosion in Al alloys: Effect of geometric factors. J. Electrochem. Soc. 2017, 164, C75. [Google Scholar] [CrossRef]
  61. Son, I.-J.; Nakano, H.; Oue, S.; Kobayashi, S.; Fukushima, H.; Horita, Z. Pitting corrosion resistance of anodized aluminum-copper alloy processed by severe plastic deformation. Mater. Trans. 2008, 49, 2648–2655. [Google Scholar] [CrossRef]
  62. Beura, V.; Garg, P.; Joshi, V.V.; Solanki, K. Numerical investigation of micro-galvanic corrosion in Mg Alloys: Role of the cathodic intermetallic phase size and spatial distributions. In Magnesium Technology 2020; Springer: Cham, Switzerland, 2020; pp. 217–223. [Google Scholar] [CrossRef]
  63. Ingle, A.; Heurtault, S.; Hafid, F.; Said, J.; Proietti, A.; Odemer, G.; Dehmas, M.; Blanc, C. Identification of the critical microstructural parameters on the corrosion behaviour of commercially pure aluminium alloy. Corros. Sci. 2022, 208, 110654. [Google Scholar] [CrossRef]
  64. Mahmoud, T. Effect of friction stir processing on electrical conductivity and corrosion resistance of AA6063-T6 Al alloy. J. Mech. Eng. Sci. 2008, 222, 1117–1123. [Google Scholar] [CrossRef]
  65. Ralston, K.; Birbilis, N. Effect of grain size on corrosion: A review. Corrosion 2010, 66, 075001–075013. [Google Scholar] [CrossRef]
  66. Ralston, K.D.; Birbilis, N.; Cavanaugh, M.K.; Weyland, M.; Muddle, B.C.; Marceau, R.K.W. Role of nanostructure in pitting of Al–Cu–Mg alloys. Electrochim. Acta 2010, 55, 7834–7842. [Google Scholar] [CrossRef]
  67. Scully, J.R.; Budiansky, N.D.; Tiwary, Y.; Mikhailov, A.S.; Hudson, J.L. An alternate explanation for the abrupt current increase at the pitting potential. Corros. Sci. 2008, 50, 316–324. [Google Scholar] [CrossRef]
  68. Yasuda, M.; Weinberg, F.; Tromans, D. Pitting corrosion of Al and Al-Cu single crystals. J. Electrochem. Soc. 1990, 137, 3708. [Google Scholar] [CrossRef]
  69. Comotti, I.M.; Trueba, M.; Trasatti, S.P. The pit transition potential in the repassivation of aluminium alloys. Surf. Interface Anal. 2013, 45, 1575–1584. [Google Scholar] [CrossRef]
  70. Kus, E.; Lee, Z.; Nutt, S.; Mansfeld, F. A comparison of the corrosion behavior of nanocrystalline and conventional Al 5083 samples. Corrosion 2006, 62, 152–161. [Google Scholar] [CrossRef]
  71. Lim, M.L.C.; Matthews, R.; Oja, M.; Tryon, R.; Kelly, R.G.; Scully, J.R. Model to predict intergranular corrosion propagation in three dimensions in AA5083-H131. Mater. Des. 2016, 96, 131–142. [Google Scholar] [CrossRef]
  72. Siddique, S.; Bernussi, A.A.; Husain, S.W.; Yasir, M. Enhancing structural integrity, corrosion resistance and wear properties of Mg alloy by heat treated cold sprayed Al coating. Surf. Coat. Technol. 2020, 394, 125882. [Google Scholar] [CrossRef]
  73. Sundararajan, G.; Sudharshan Phani, P.; Jyothirmayi, A.; Gundakaram, R.C. The influence of heat treatment on the microstructural, mechanical and corrosion behaviour of cold sprayed SS 316L coatings. J. Mater. Sci. 2009, 44, 2320–2326. [Google Scholar] [CrossRef]
Figure 1. As-atomized AA5083 powder used in this work and CS AA5083 deposit: (a) secondary electron (SE) micrograph showing powder morphology, (b) particle size distribution after sizing, (c) an image of bulk CS AA5083 deposit, and (d) an optical micrograph showing the cross-section of deposited CS AA5083.
Cmd 05 00002 g001
Figure 2. BSE micrographs and corresponding EDS elemental maps for the plan-view surface of (a) W5083 and (b) CS5083.
Cmd 05 00002 g002
Figure 3. STEM-HAADF micrographs and corresponding EDS elemental maps for (a) W5083 and (b) CS5083. Yellow dotted arrows indicate the point where point analysis was conducted, and the orange boxes highlight the area where EDS elemental maps were recorded. The deposition direction of the CS deposit is from top to bottom.
Cmd 05 00002 g003
Figure 4. Inverse pole figure (IPF) maps for the plan-view surface of (a) W5083 and (b) CS5083, (c) the cumulative fraction of grains size, and (d) misorientation distribution. The legend for the IFP map is inserted in (a). The Z-direction for (b) is parallel with the spray nozzle direction (marked as × ). HAGBs (misorientation angle θ > 10°) were delineated with black lines in (a,b). Note that different scalebars have been used for each sample.
Cmd 05 00002 g004
Figure 5. BF micrographs showing higher magnification detail of the microstructures of CS5083: (a) low magnification, (b) diffraction pattern showing no discernable texture of Al phase, and (c) high magnification highlighting prior particle boundary regions. Yellow solid arrows in (c) point out prior particle boundary regions with aligned and elongated grains, and black dotted circles in (c) encompass equiaxed grains. Note that CS deposition direction is from top to bottom, as indicated by a black arrow.
Cmd 05 00002 g005
Figure 6. EIS spectra in quiescent, naturally aerated 0.6 M NaCl (pH = 8.3) at room temperature for W5083 and CS5083: (a) Bode and (b) Nyquist plot. Note that the scatter plot (open symbols) indicates experimental data, and the solid line represents fitting results. The equivalent circuit used for fitting is inserted in (b).
Cmd 05 00002 g006
Figure 7. (a) Cathodic polarization and (b) CPP test in quiescent, naturally aerated 0.6 M NaCl (pH = 8.3) at room temperature for W5083 and CS5083. An inset in (b) highlights metastable pitting region below pitting potential. Note that black and red arrows in the inset figure indicates scan direction.
Cmd 05 00002 g007
Figure 8. Macrographs and SE micrographs for the surface of the sample following the CPP test in quiescent, naturally aerated 0.6 M NaCl (pH = 8.3) at room temperature for W5083 (ac) and CS5083 (df). The scan reversal was initiated at 10 mA/cm2.
Cmd 05 00002 g008
Figure 9. Optical micrographs of the cross-section after the CPP tests and quantitative analysis for corrosion depth and morphology: (a) W5083, (b): CS5083, (c) the distribution of localized corrosion penetration depth, and (d) fractal dimension analysis.
Cmd 05 00002 g009
Figure 10. (a) SE micrographs and corresponding EDS elemental maps for W5083 after immersion test in quiescent, naturally aerated 0.6 M NaCl solution (pH = 8.3) at room temperature for 2 h. (b) observes the same area where EDS elemental maps were collected.
Cmd 05 00002 g010
Figure 11. (a) SE micrographs and corresponding EDS elemental maps for CS5083 after immersion test in quiescent, naturally aerated 0.6 M NaCl solution (pH = 8.3) at room temperature for 2 h. (b) observes the same area where EDS elemental maps were collected.
Cmd 05 00002 g011
Figure 12. Mass loss result of W5083 and CS5083 after NAMLT as a function of heat treatment time at 100 °C. The first point of each sample denotes either as-received or as-deposited conditions. An inset image shows the cross-section of CS pure Al after the NAMLT.
Cmd 05 00002 g012
Figure 13. Optical micrographs of the ST plane cross-section and SE micrographs of the LS plane surface morphology for (af) W5083 and (gl) CS5083 after the NAMLT as a function of heat treatment time at 100 °C. The inset diagram in (g) indicates the direction of CS deposition direction with respect to sample orientations.
Cmd 05 00002 g013
Figure 14. A schematic diagram displaying the continued propagation of IGC penetration in CS5083 deposit preferentially along prior particle boundary regions during NAMLT.
Cmd 05 00002 g014
Table 1. Chemical composition of wrought AA5083-H116 and gas-atomized AA5083 powder (wt.%) analyzed by ICP-AES.
ElementAlMgMnFeSiCuTiCrZn
Wrought AA5083-H116Balance4.810.470.320.160.060.020.080.08
AA5083 powderBalance4.700.450.400.150.060.02<0.010.07
Table 2. CS parameters for fabricating CS AA5083 deposit.
PowderGas-Atomized AA5083
Carrier gasHelium
Gas temperature (°C)450
Gas pressure (MPa)3.45
Traverse speed (mm/s)200
Stand-off distance (mm)15
Table 3. Electrochemical parameters from cathodic polarization and CPP tests. Note that Ecorr was drawn from both CPP and cathodic polarization tests. icorr and, βc. were calculated based on Tafel extrapolation using cathodic polarization. Eptp, iptp, and steepness were calculated from the CPP test.
ParameterW5083CS5083
Ecorr (V vs. Ag/AgCl)−0.724 ± 0.018−0.787 ± 0.028
icorr (μA/cm2)0.284 ± 0.0220.476 ± 0.089
βc (V/decade)−0.272 ± 0.019−0.480 ± 0.033
Eptp (V vs. Ag/AgCl)−0.723 ± 0.001−0.709 ± 0.001
iptp (μA/cm2)76.5 ± 7.4265.0 ± 4.5
Steepness (V/decade)0.132 ± 0.0070.183 ± 0.004
Disclaimer/Publisher’s Note: The statements, opinions and data contained in all publications are solely those of the individual author(s) and contributor(s) and not of MDPI and/or the editor(s). MDPI and/or the editor(s) disclaim responsibility for any injury to people or property resulting from any ideas, methods, instructions or products referred to in the content.

