
The Virtual Corrosion Engineer

Abstract
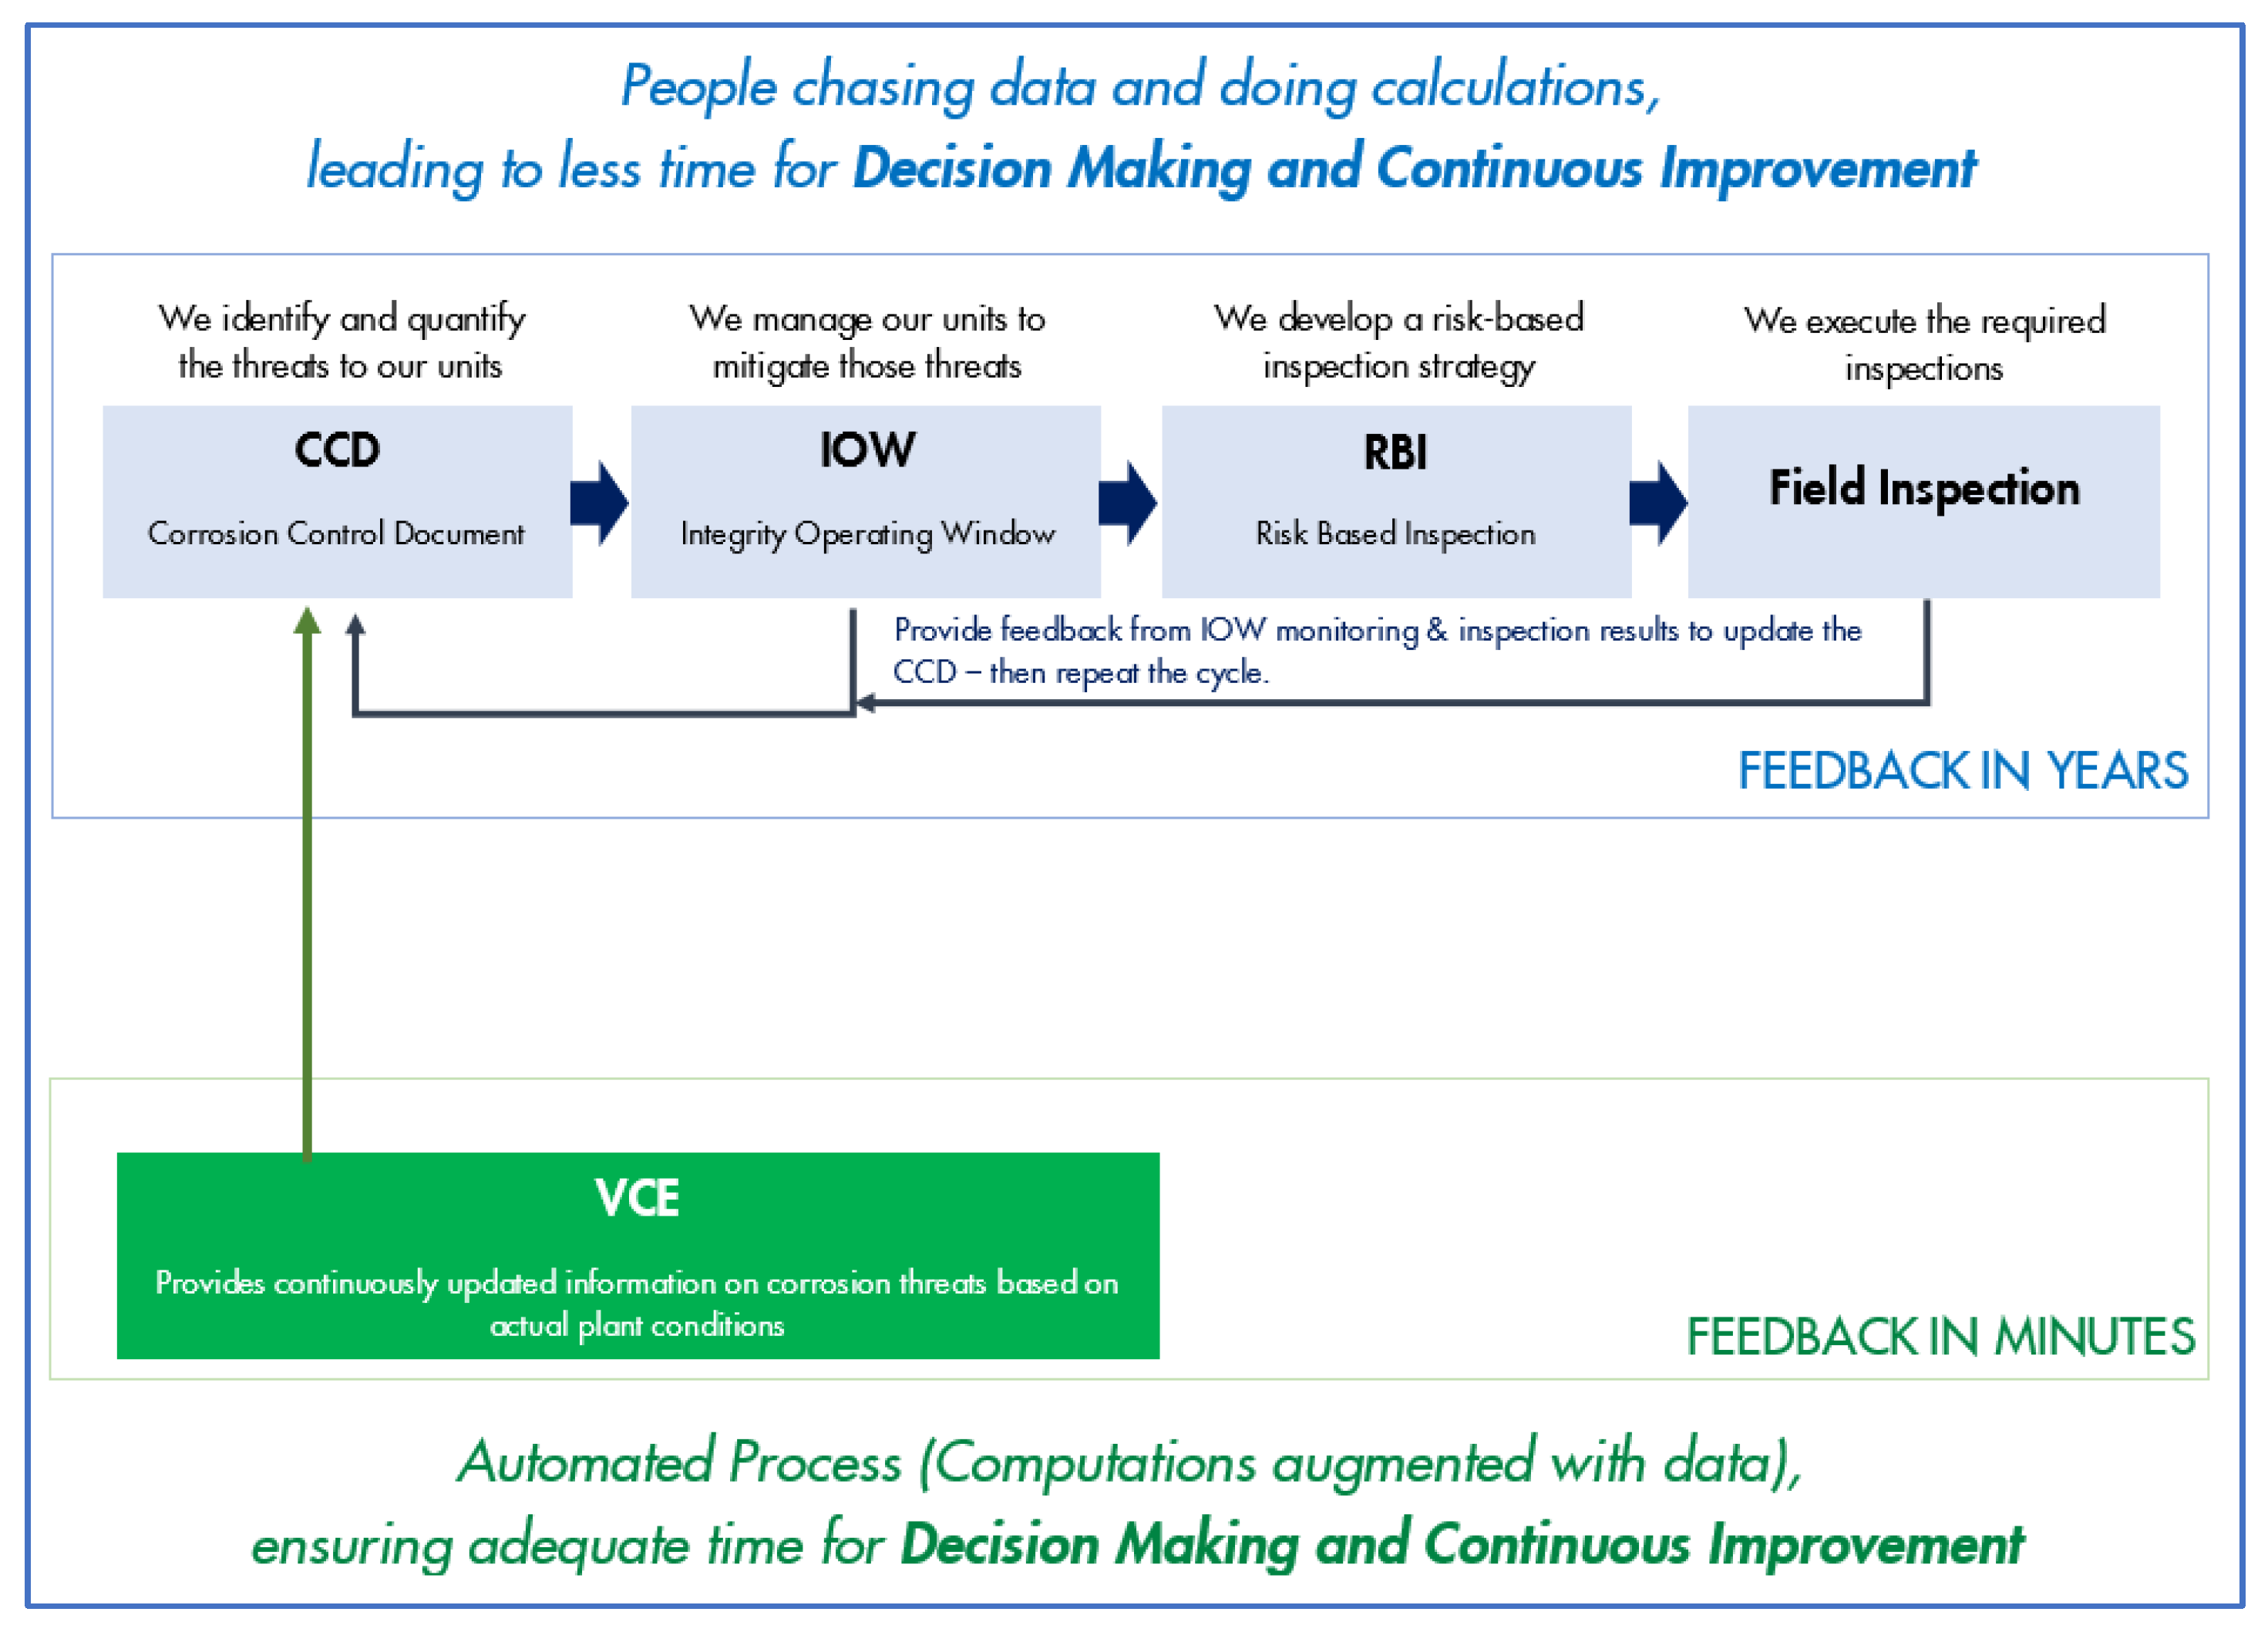
:1. Introduction
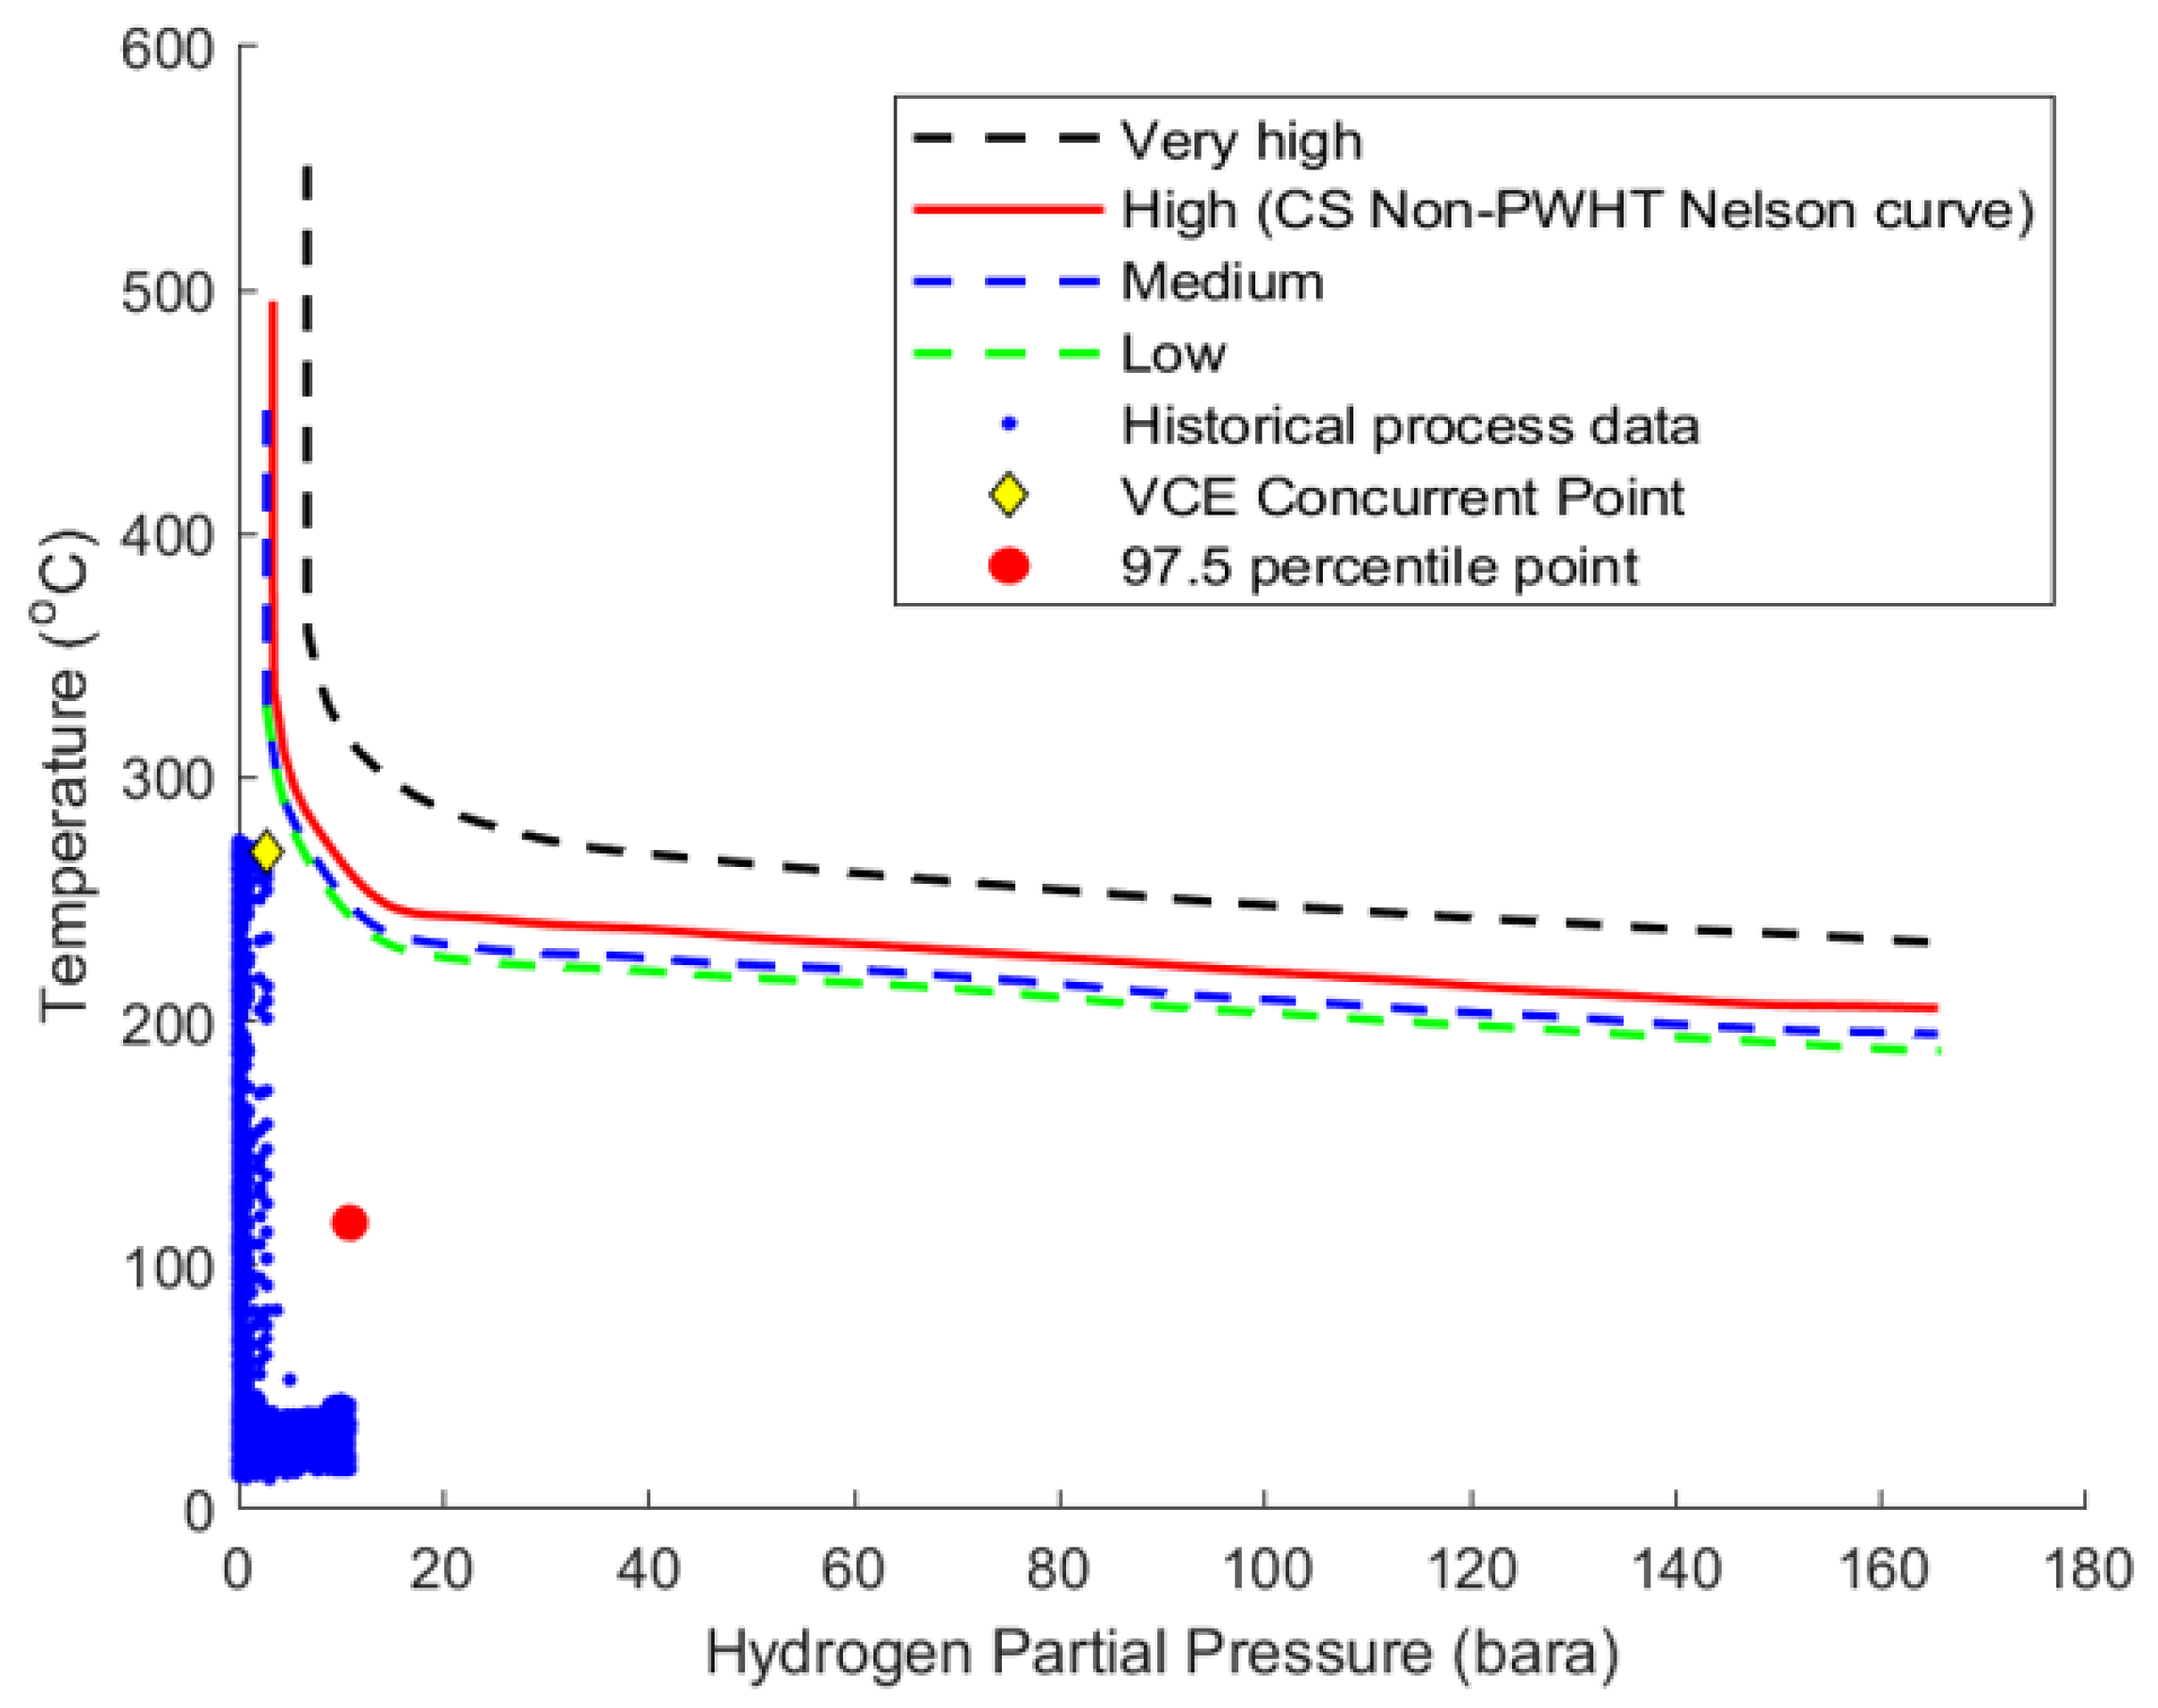
2. High-Temperature Hydrogen Attack
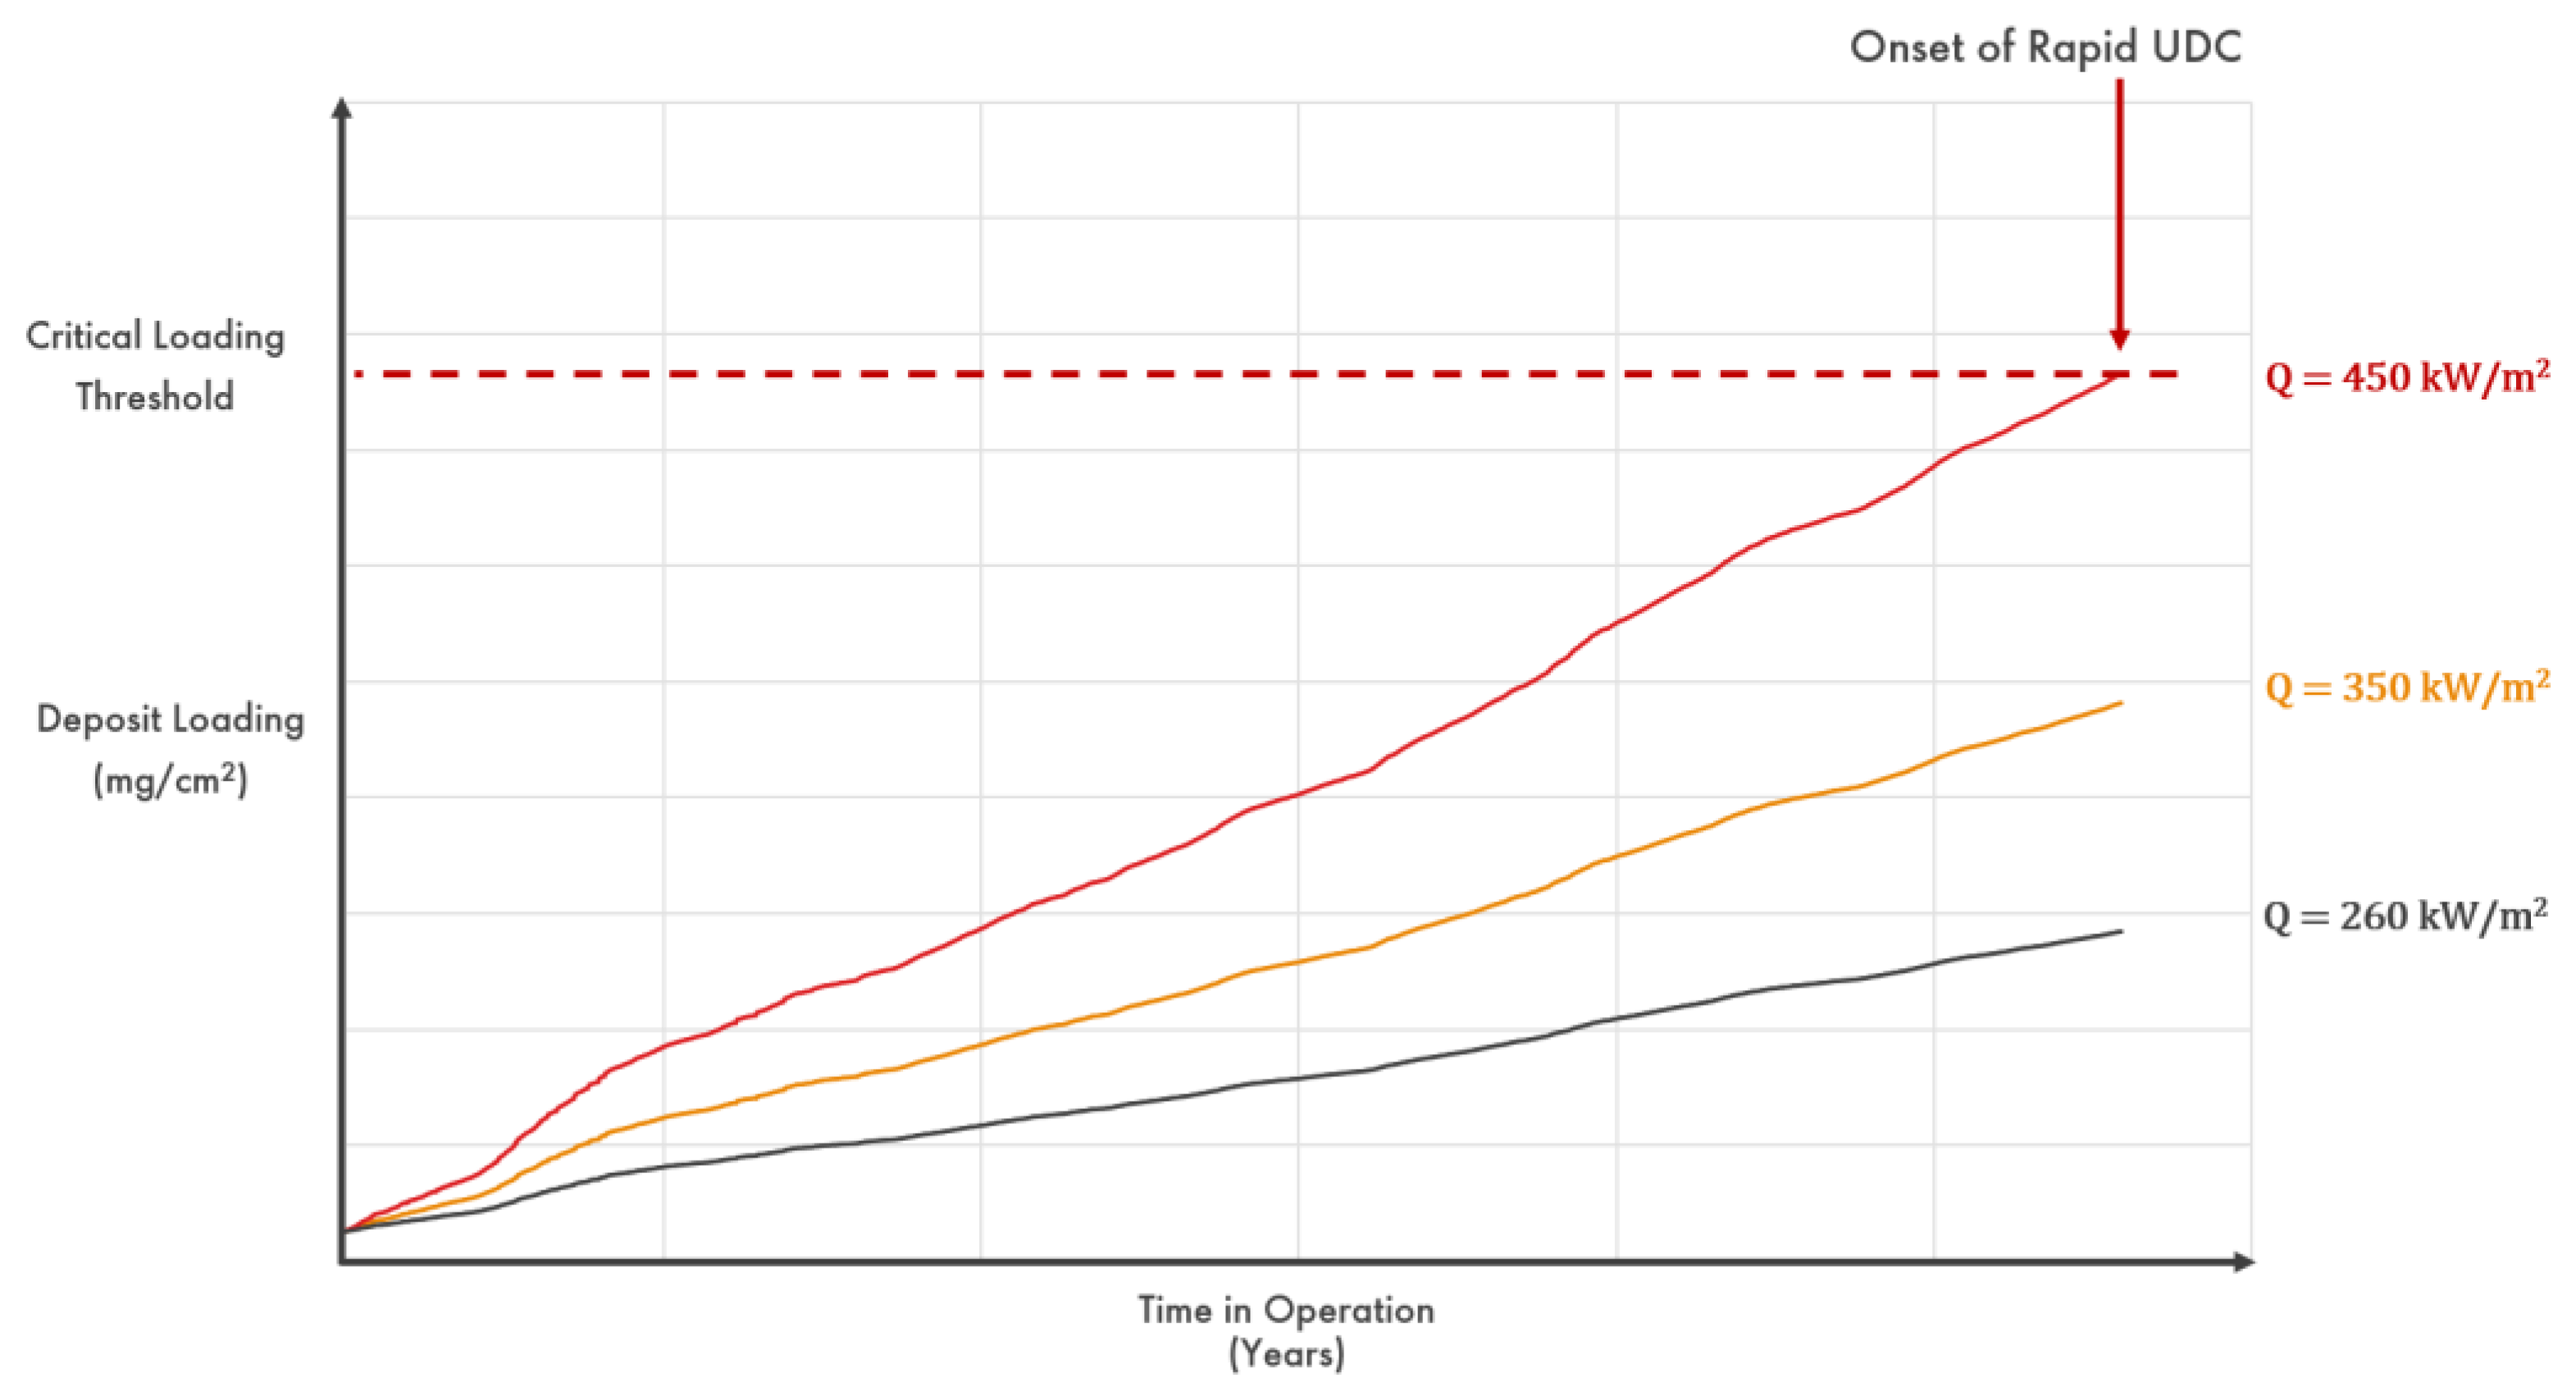
3. Under Deposit Corrosion in Steam Generators
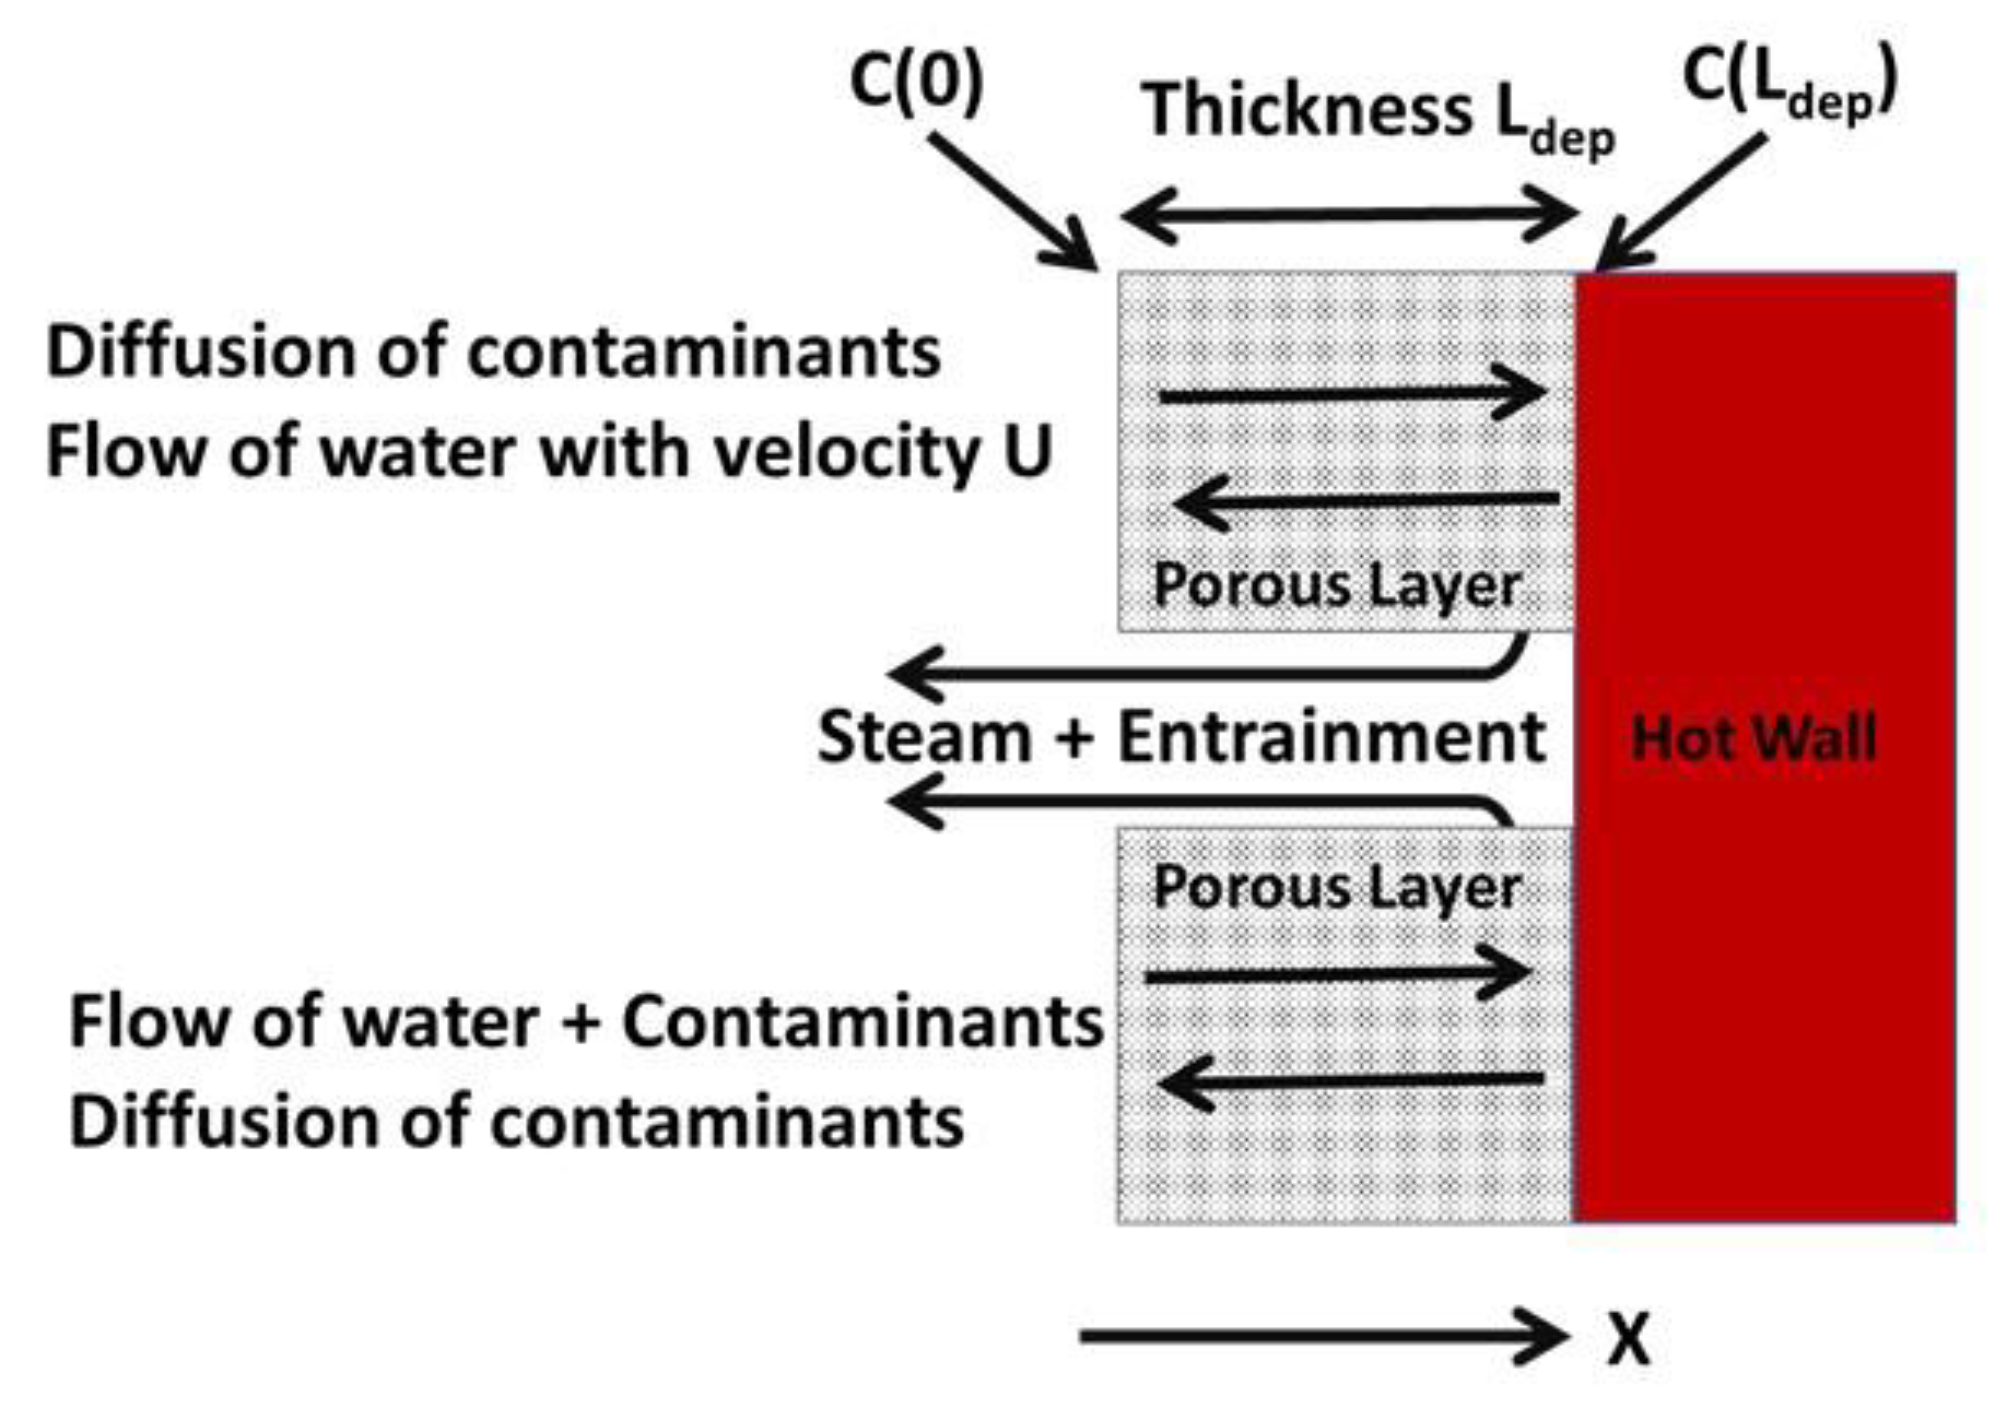
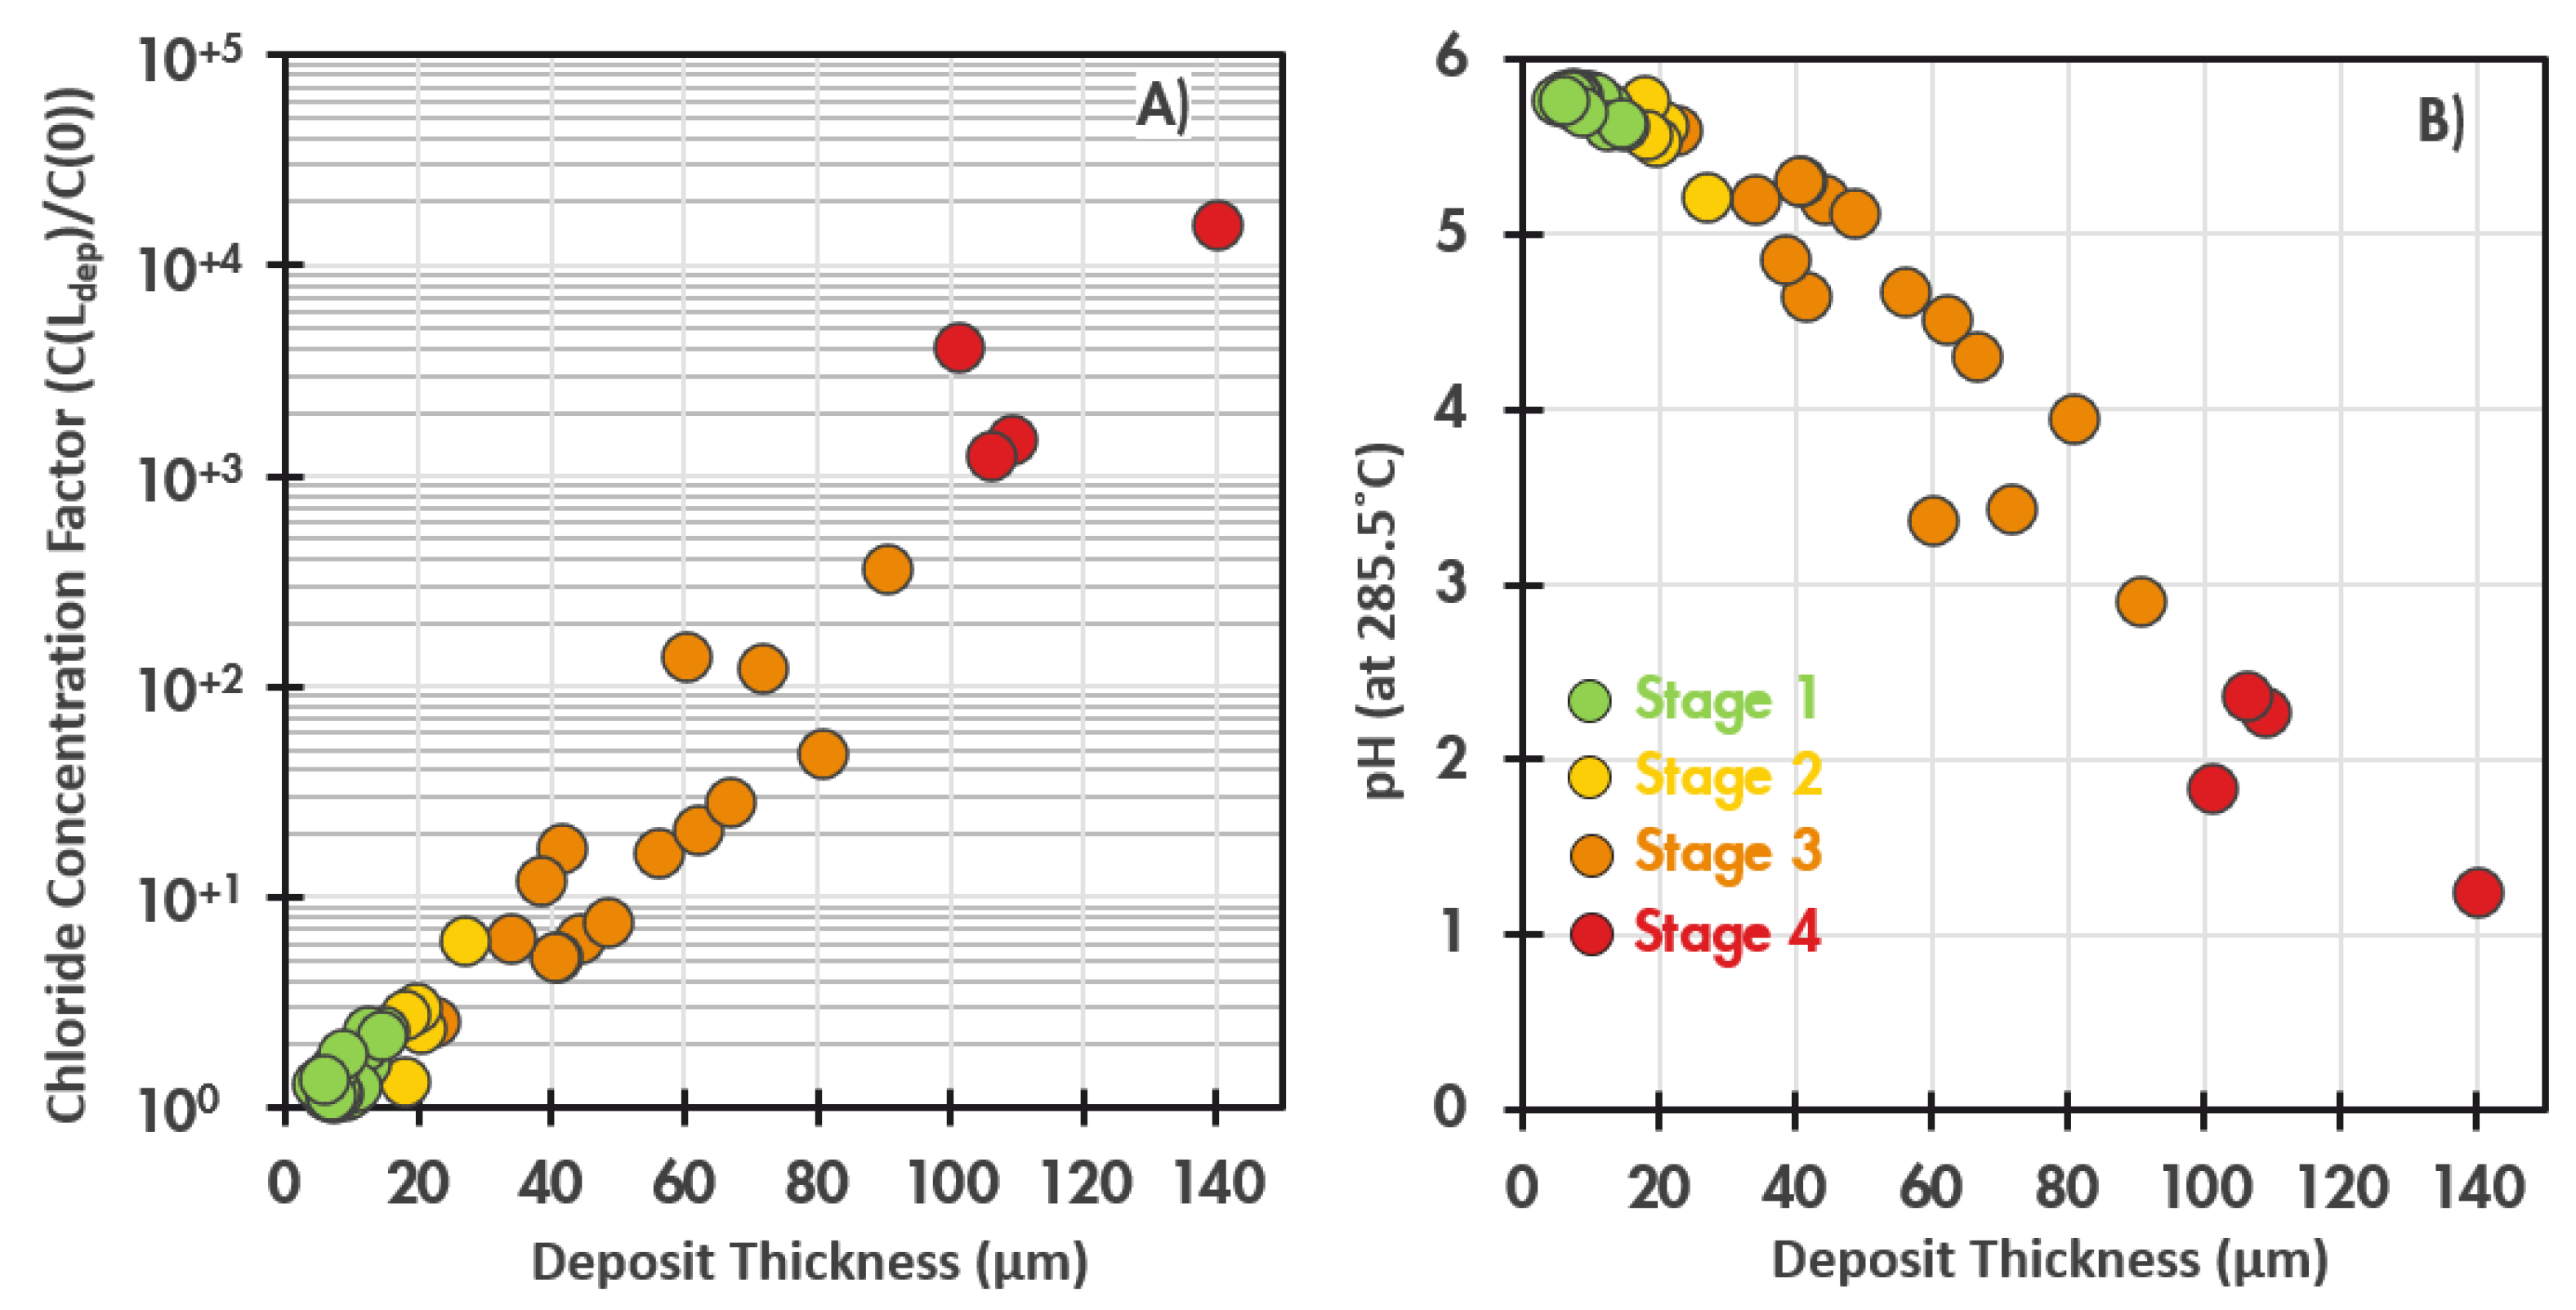
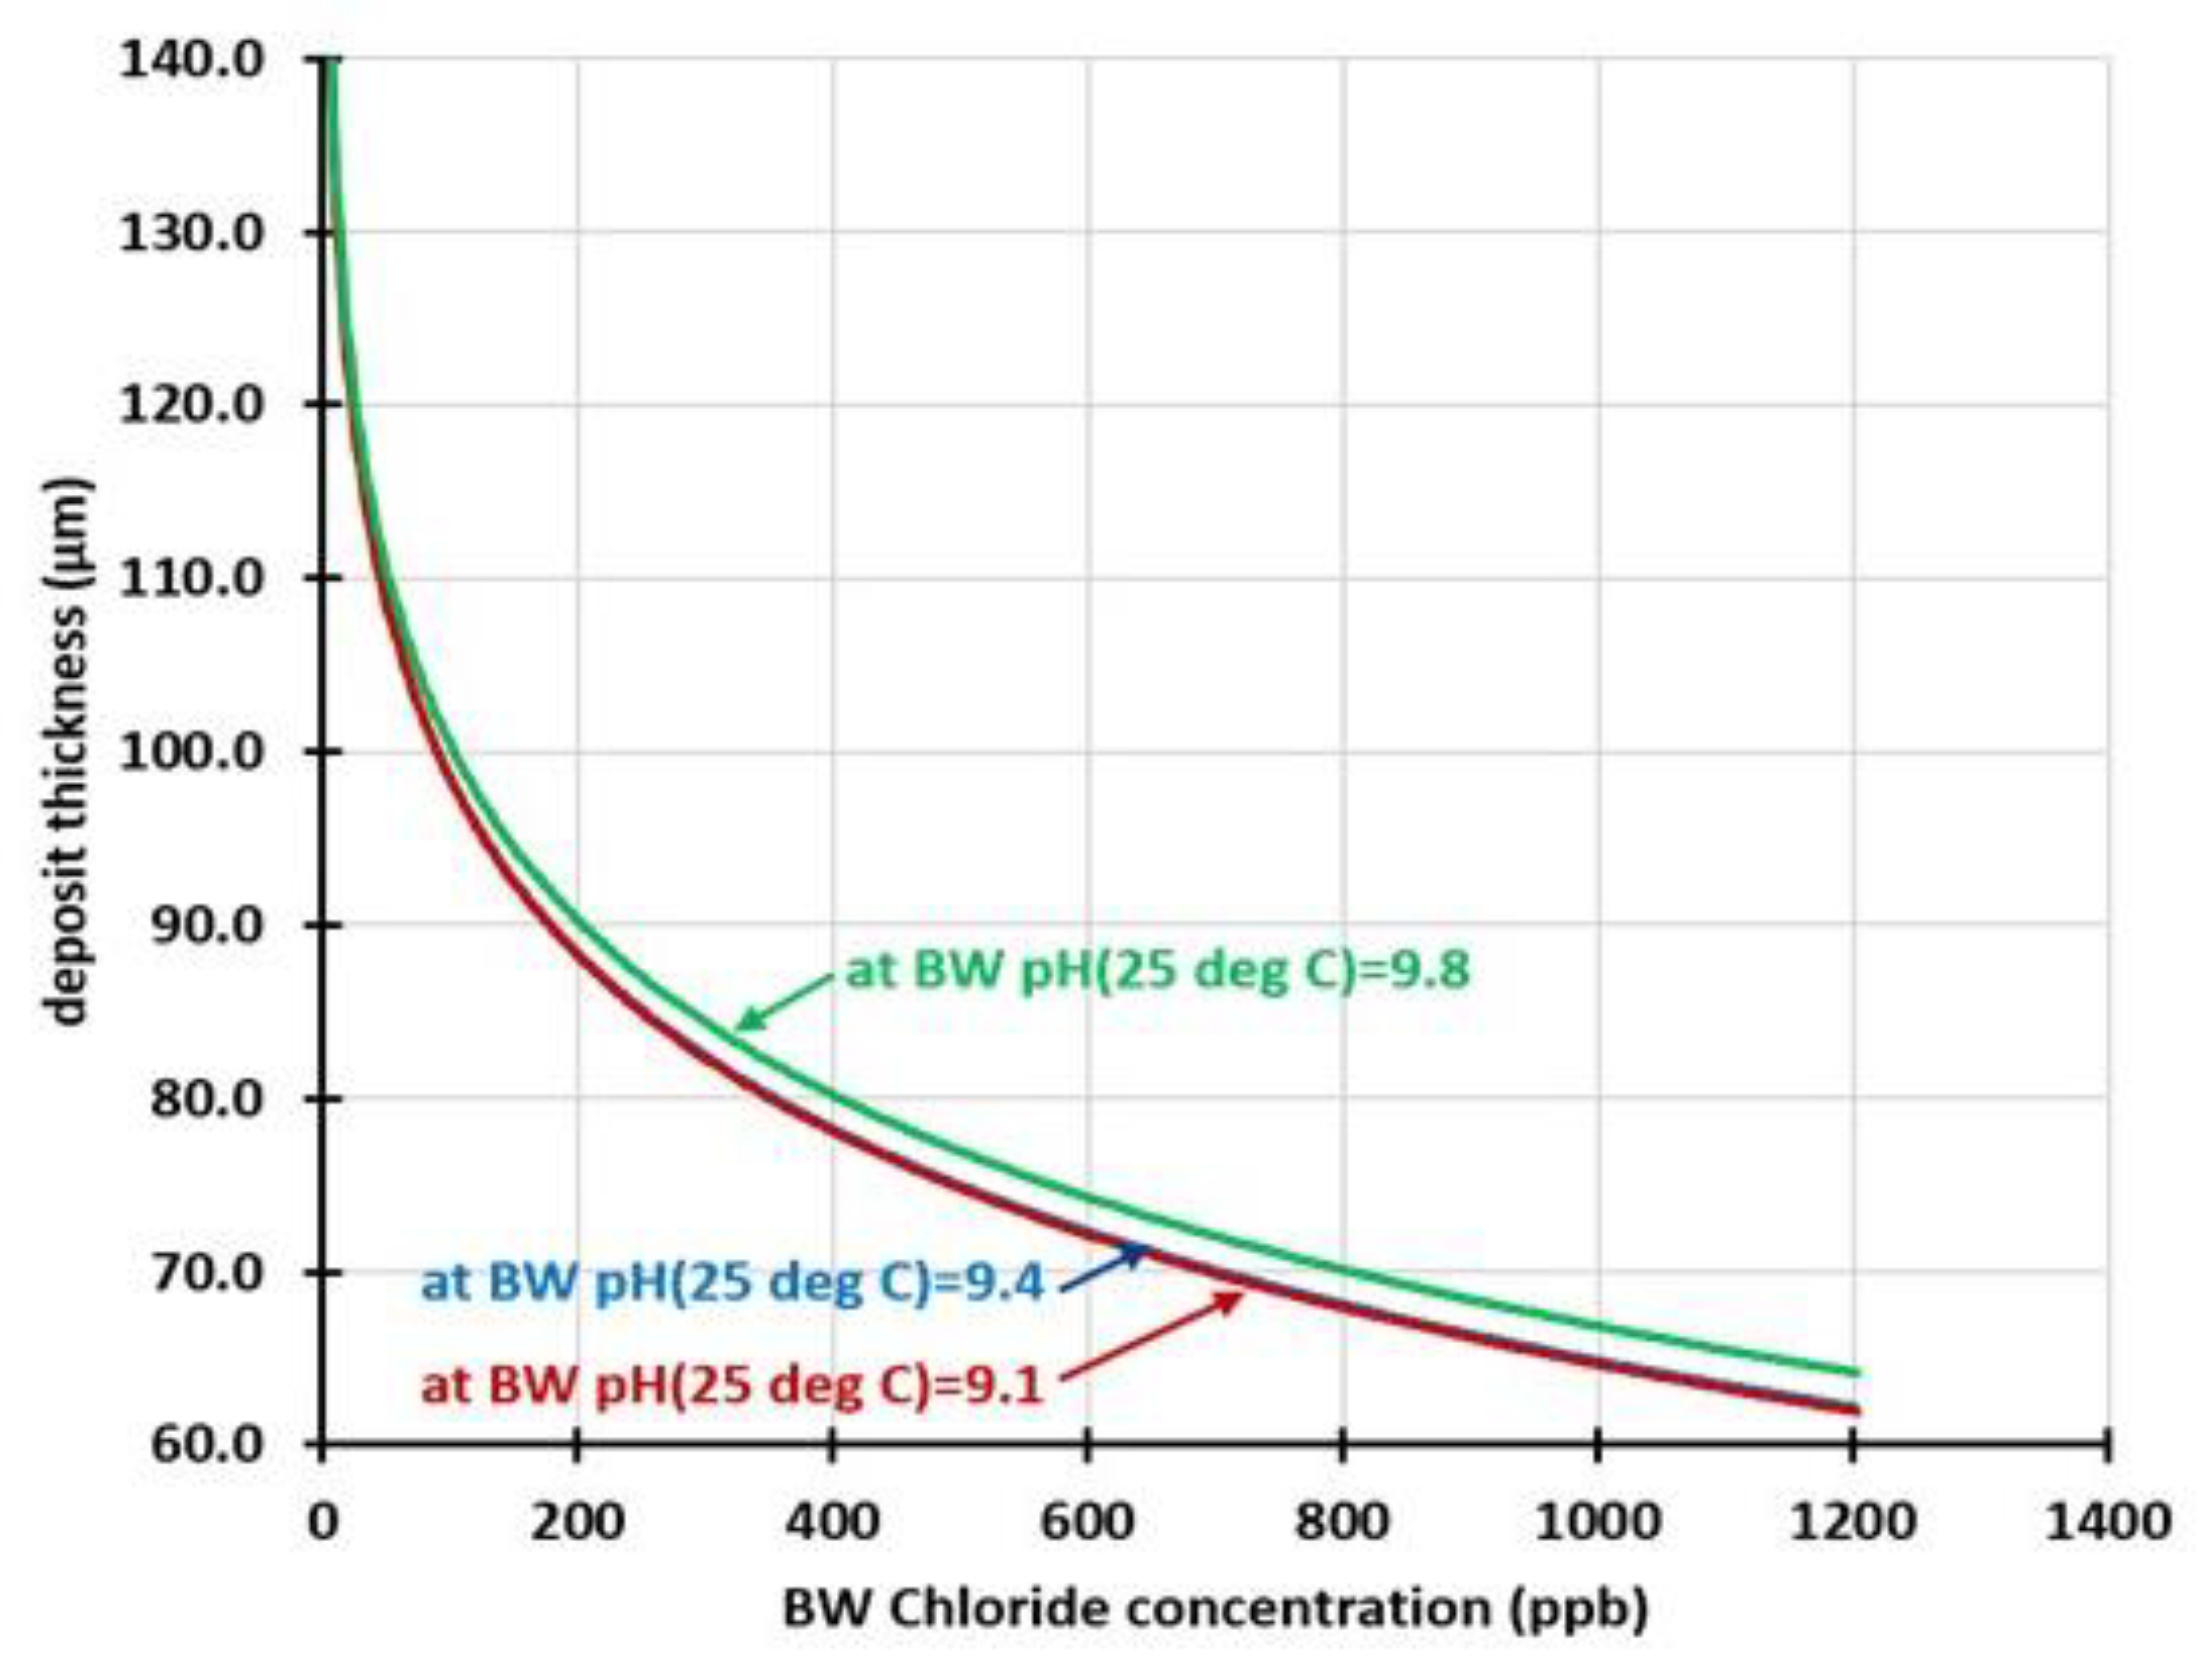
Wick-Boiling and the Critical Deposit Threshold for UDC
- Φ is dimensionless porosity
- τ is dimensionless tortuosity
- D is molecular diffusion constant in m2 s−1
- C(x) is the concentration at depth x in the layer in mol m−3
- Ccov is a dimensionless coverage factor indicating the fraction of the surface that is covered by the porous layer (i.e., the area that is not occupied by the ‘chimneys’ that allow steam to escape from the metal surface);
- Q is heat flux in W m−2
- ρw,l is liquid water density in kg m−3
- ∆Hv is vaporization enthalpy in J kg−1
- H is Henry’s constant
- εE is the entrainment coefficient
- Ldep is the porous layer thickness in m.
4. Summary and Conclusions
Author Contributions
Funding
Conflicts of Interest
References
- API Recommended Practice 580, Risk Based Inspection, 3rd ed.; American Petroleum Institute: Washington, DC, USA, 2016.
- AS/NZ Standard 3788, Pressure Equipment—In Service Inspection, 4th ed.; Standards New Zealand: Wellington, New Zealand, 2006.
- Britton, C.F. Corrosion Monitoring and Inspection. In Shreir’s Corrosion, 4th ed.; Elsevier: Amsterdam, The Netherlands, 2010; pp. 3117–3166. [Google Scholar]
- Macdonald, D.D.; Engelhardt, G.R. Predictive Modeling of Corrosion. In Shreir’s Corrosion, 4th ed.; Elsevier: Amsterdam, The Netherlands, 2010; pp. 1630–1679. [Google Scholar]
- Kane, R.D.; Eden, D.C.; Amidi, S.; Delve, D. Implementation of Real-Time Corrosion Monitoring with Industrial Process Control & Automation; Paper NACE-07268; CORROSION: Nashville, TN, USA, 2007. [Google Scholar]
- Quiroga, P.; Kane, R.D.; Castillo, M.; Lagad, V. Improving Amine Unit Reliability with On-Line Corrosion Monitoring & Modeling; Paper NACE-08421; CORROSION: New Orleans, LA, USA, 2008. [Google Scholar]
- API Recommended Practice 941, Steels for Hydrogen Service at Elevated Temperatures and Pressures in Petroleum Refineries and Petrochemical Plants, 8th ed.; American Petroleum Institute: Washington, DC, USA, 2016.
- Dooley, R.B.; Bursik, A. Caustic Gouging. Powerpl. Chem. 2010, 12, 188–192. [Google Scholar]
- Dooley, R.B.; Bursik, A. Acid Phosphate Corrosion. Powerpl. Chem. 2010, 12, 368–372. [Google Scholar]
- Dooley, R.B.; Bursik, A. Underdeposit Corrosion. Powerpl. Chem. 2009, 11, 760–763. [Google Scholar]
- Dooley, R.B.; Bursik, A. Hydrogen Damage. Powerpl. Chem. 2010, 12, 122–127. [Google Scholar]
- Turner, C.W. AECL. Nucl. Rev. 2013, 2, 61–88. [Google Scholar] [CrossRef] [Green Version]
- Deposition in Boilers: Review of Soviet and Russian Literature; EPRI TR-1004193; Electric Power Research Institute: Palo Alto, CA, USA, 2003.
- Deposition on Drum Boiler Tube Surfaces; EPRI TR-1010186; Electric Power Research Institute: Palo Alto, CA, USA, 2005.
- Deposition on Drum Boiler Tube Surfaces; EPRI TR-1008083; Electric Power Research Institute: Palo Alto, CA, USA, 2004.
- Raman, B.; Hall, D.M.; Shulder, S.J.; Caravaggio, M.F.; Lvov, S.N. An experimental study of deposition of suspended magnetite in high temperature–high pressure boiler type environments. Colloids Surf. A Physicochem. Eng. Asp. 2016, 508, 48–56. [Google Scholar] [CrossRef]
- Comprehensive Cycle Chemistry Guidelines for Fossil Plants; EPRI TR-1021767; Electric Power Research Institute: Palo Alto, CA, USA, 2011.
- International Association for the Properties of Water and Steam. IAPWS TGD7-16, Technical Guidance Document: HRSG High Pressure Evaporator Sampling for Internal Deposit Identification and Determining the Need to Chemical Clean. Available online: http://www.iapws.org/index.html (accessed on 1 September 2021).
- Ramesh, A.; Laycock, N.; Shenai, P.; Barnes, A.; van Santen, H.; Thyagarajan, A.; Abdullah, A.M.; Ryan, M.P. Critical Deposit Loading Thresholds for Under Deposit Corrosion in Steam Generators. 2021, unpublished. [Google Scholar]
- Gonzalez, F.; Spekkens, P. Concentration processes under tubesheet sludge piles in nuclear steam generators. Nucl. J. Can. 1986, 1, 129–140. [Google Scholar]


Publisher’s Note: MDPI stays neutral with regard to jurisdictional claims in published maps and institutional affiliations. |
© 2021 by the authors. Licensee MDPI, Basel, Switzerland. This article is an open access article distributed under the terms and conditions of the Creative Commons Attribution (CC BY) license (https://creativecommons.org/licenses/by/4.0/).
Share and Cite
Thyagarajan, A.; Hamer, W.; Phophichitra, J.; Valliappan, V.; Ramesh, A.; Shenai, P.; Laycock, N. The Virtual Corrosion Engineer. Corros. Mater. Degrad. 2021, 2, 762-769. https://doi.org/10.3390/cmd2040041
Thyagarajan A, Hamer W, Phophichitra J, Valliappan V, Ramesh A, Shenai P, Laycock N. The Virtual Corrosion Engineer. Corrosion and Materials Degradation. 2021; 2(4):762-769. https://doi.org/10.3390/cmd2040041
Chicago/Turabian StyleThyagarajan, Aarthi, Wouter Hamer, Joy Phophichitra, Valliappan Valliappan, Abitha Ramesh, Prathamesh Shenai, and Nicholas Laycock. 2021. "The Virtual Corrosion Engineer" Corrosion and Materials Degradation 2, no. 4: 762-769. https://doi.org/10.3390/cmd2040041