

Spectral Light Fading of Inkjet Prints

1
Psinex Ventures GmbH, 8248 Uhwiesen, Switzerland
2
Institute Materiality in Art and Culture, Berne University of the Arts, 3027 Bern, Switzerland
*
Author to whom correspondence should be addressed.
Heritage 2022, 5(4), 4061-4073; https://doi.org/10.3390/heritage5040209
Submission received: 5 November 2022
/
Revised: 5 December 2022
/
Accepted: 7 December 2022
/
Published: 9 December 2022
(This article belongs to the Special Issue Colour Photography and Film: Analysis, Preservation, and Conservation of Analogue and Digital Materials)
Abstract
:(1) Background: The use of light-emitting diode (LED) lighting is increasingly replacing traditional light sources in museums. There is a need to anticipate the damage caused by LED lighting to photographic prints. The aim of this study is to quantitatively predict fading on three inkjet color patches exposed to different white light LED; (2) Method: The novel approach of this work is to measure the wavelength-dependent photochemical efficiency on color patches using a narrow band LED. First, the color patches are exposed to narrow band LED lamps in a proprietary light chamber. Sensitivity curves are obtained by plotting the density changes caused by narrow band exposure as a function of the exposure. In the second step, action spectra are derived from the slopes of the sensitivity curves. The action spectra correspond to the rates of change of a color patch to exposure with different wavelengths of light. In the third step, the narrow band light emissions are fitted to the emission spectra of the white LED of interest. The fitting factors are used to calculate the weighted sum of the density changes; (3) The method predicts the absolute density change of color patches for several white light LED exposures.
1. Introduction
In the museum environment, a difficult balance needs to be found between displaying art objects with good color brilliance while keeping light-induced damage to a minimum [1,2]. In the past, tungsten halogen lamps were the main source of museum indoor lighting. A wealth of light stability data has been collected for traditional silver halide prints and digital prints [3] exposed to tungsten, indoor day light and fluorescent light. Conservators could estimate the expected damage primarily based on illuminance measurements. Today, professionals in lighting design are proposing specific lighting solutions for certain types of materials [4]; however, there is a lack of data and knowledge to dictate which form of lighting is best for photographic print materials. Particularly in digital photography, many new print materials and material combinations are in use [5], for which stability data are often not readily available. A study by Druzik and Michalski [6] discusses the aspects of LED lighting in a museum environment. Besides economic criteria such as energy efficiency, cost, availability, and life span, they consider lighting criteria such as glare, color rendition and consistency. The study underlines how difficult it is to specify the typical relative spectral irradiance (RSI) of white LED lighting used for display in museums. New types of white LED lighting, with very different RSI, replace existing lamps on a regular basis [7].
It has long been known that shorter wavelengths of light contribute more to image degradation than longer wavelengths [8,9]. Unfortunately, there is no general mathematical relationship that predicts degradation directly based on the photon energy of absorbed light, as is postulated in the European Technical Specification CEN/TS 16163–2014.
Reactions in the visible range imply electronic transitions of the materials involved with subsequent complicated reaction kinetics from the excited states into the various degradation products [10]. The detailed reaction kinetics need to be known to make display lifetime predictions. To obtain rough estimations, data bases of materials tested with specific light sources can predict the average damage potential of light sources for a specific class of materials [11,12]; however, such predictions often fail for specific materials or for light sources that are very different from those in the data set.
Thermochemically, the exposure of stable organic molecules to visible light cannot result in direct photolysis [13]. The bond energy required to break a Carbon–Carbon, Carbon–Hydrogen, Hydrogen–Nitrogen, or Carbon–Oxygen bond of a stable organic compound is between 346 and 459 kJmol−1. This corresponds to the energy of UV light between 260 nm and 342 nm. As direct bond breaks are possible with UV light, exposure to UV light often leads to a different reaction mechanism than the exposures to visible light. Under visible light, degradation reactions are generally caused by the chemical reaction of an activated molecule with some environmental reactants, often gases. Feller discusses, on page 51 [13], the case of a light-induced reaction of a dye with oxygen. Inkjet dyes on porous paper show fast reactions with air pollutants, particularly with ozone, even in the absence of light [14,15].
One approach to circumvent the lack of a standard white light LED for light fading studies is to expose art materials and dyes with a range of white light LED and other light sources [16,17,18]. Spectral fading factors can be determined for the light sources tested and damage models can be derived. However, the results are only valid for RSI similar to the set of lights used in the model. It is not possible to derive action spectra when exposing with white light. Quantitative predictions and predictions for LED light with very different RSI cannot easily be made.
Fiber Optic Reflectance Spectroscopy (FORS) [19] is used to monitor artwork on display and show the first signs of degradation. This method has the advantage of being able to look at real artwork in the real display environment and observe fading kinetics. While monitoring is important for real artwork, conservators would like to know in advance if there is a risk of damage and which display light to select.
In micro-fading [20,21], a very small spot is exposed on an artwork by very intensive light until a small change is detected. The advantage of this method is that it works on actual art material. One difficulty is the selection of a representative spot on the artwork. In addition, the very high intensity exposure may lead to diffusion-controlled kinetics, which is a different reaction kinetics path than that which occurs with fading at much lower irradiance. As conservators are reluctant to accept damage to artwork, the test is often conducted to very small changes in color, thus larger experimental errors may result. The method is also sensitive to surface textures. Different light sources were used [22] for micro-fading. One group [23] applied it for spectral fading and determined action spectra, but only to characterize the colorants and not to make fading predictions for other light sources.
Several research groups [12,24,25] have investigated the damage potential under narrow band LED exposure comparable to this study. However, the studies do not proceed to determine sensitivity curves and action spectra and do not make a quantitative prediction for white LED exposures. The authors of [12] investigated the relative damage for oil, acrylic and gouache and develop a spectral damage model, which aims to predict color shifts on the painting over time. The model does not predict color changes for light exposures with very different RSI.
An action spectrum is the measure of photochemical efficiency at different excitation wavelengths [26] and it is used in chemical and biological photolysis to calculate rates of photo-initiated reactions. Several authors have used action spectra to describe the wavelength dependence of fading of art objects. Saunders and Kirby [9] have measured action spectra of traditional artist dyes, blue wool and artist’s pigments with color filtered white light but have not attempted to predict fading for other light sources. The wavelength sensitivity of blue wool scale (BWS) L2 and L4 was investigated in [27] with narrow band filtered Xe-light. The authors compare the fading under UV light with the fading under visible light and explain why it is difficult to obtain identical degrees of fading for two different lamps. The authors of [28] studied the wavelength dependence of silk decolorization under different humidity conditions and different oxygen partial pressures. The intention of this study was to investigate the kinetic mechanism of those gas reactions with silk and not to predict light fading under ambient conditions. Spectral screening has recently been used in chemical engineering for photolysis reactions [29].
Van Ackere et al. used cut-off filters and white light to predict absolute color change on photographic images and inkjet prints [30]. The authors measured the action spectra of five different inkjet materials by filtering a Xe-lamp with cut-off filters. The action spectra were used to predict the display life for indirect daylight through window glass and glass filtered cool white fluorescent light.
The current study uses an approach very similar to [30], but uses narrow band LED exposure to induce light reactions on inkjet prints, to determine the photochemical efficiency of the exposures and to derive the rates of fading of three color patches for narrow band LED light. By fitting the narrow band light emission to a white light LED emission, one can quantitatively predict the color fading exposed to that white light LED. This is conducted for different LED lights with different correlated color temperatures (CCT). The method based on action spectra can predict the effect of many white light RSI and reduces the need to conduct fading tests for all the light sources. An overview of the method was recently presented [31].
2. Materials and Methods
The experiments were conducted in a proprietary light chamber, in which a sheet of printed inkjet paper was exposed to LED lamps. The exposure unit consisted of 24 tightly controlled high power LEDs, each individually supplied with an adjustable constant current source. Their output was guided onto the paper surface with a hollow light guide, creating a round exposure spot with a diameter of 20 mm. The homogeneity from the middle to the edge of an exposed spot was 5–10% in density variation on a faded middle grey color.
The center wavelengths and the irradiance are shown in Table 1. The typical full width at half maximum of the LED was approximately 30 nm. With the exception of the LED at 6500 K and 2700 K, two LED of each kind were mounted in the chamber to verify reproducibility.
The RSI of the LEDs was measured at the sample plane by an Ocean Optics 2000® spectrometer with UV-VIS light guide fibers. No additional external wavelength calibration was conducted. Inkjet colorants have wide absorption bands, and the exact position of the LED peak wavelength is not expected to be crucial to the fading. The total irradiance of each LED was measured at the sample plane with a Genetec XLP12–3S–H2–INT-D0® power meter. The temperature of the sample was maintained at 24 °C ± 2 °C by liquid cooling of the sample plate. The relative humidity during the experiments was 45% RH ± 7% RH. A thin polyester foil prevented pollutants being absorbed into the nano-porous surface of the sample paper. The foil is transparent to the wavelength used in the experiment. The irradiance calibrations were conducted at the sample plane with the foil in place.
The sample inkjet print was made with the commercial T664 Ecotank® dye-based ink of the Epson ET2650® printer on HP Everyday Photo Paper®, which is a nanoporous paper on RC base. A yellow, a mangenta, a cyan and two grey patches, composed of color ink, as well as the paper white, were exposed. With the available printer firmware and driver, it was not possible to print pure colors. The yellow patch contained a significant number of magenta dots, and the magenta patch contained some yellow and some cyan dots. The cyan patch was nearly pure cyan and only showed a very small number of yellow dots. The aim of study was not to evaluate print materials or pure dyes but to validate fading predictions from exposures made with narrow band LED to displays under white LED.
After the exposure of 1380, 2790, 4290, 6270 and 8340 min, the sample was removed from the chamber. The CIELAB L*, a*, b* values, as well as the reflectance spectra, were measured for every patch by an iPro® spectral densitomer with a 4 mm aperture, 0°/45° geometry, and against a white background. No additional filter was used. The CIELAB values were calculated for D50 and 2° observer. ΔE76 was used as the color difference formula. There are concerns in regard to using CIEDE2000 for measuring colorant changes [32]. A recent study, made on twelve different imaging media [33], stipulates that for the color difference range of permanence investigations, ΔE76 produces slightly better results than other color difference formulae. Many ISO standards of ISO TC42–Photography recommend the use of ΔE76.
3. Results
3.1. Color Change of Paper White
A frequent failure mode in print permanence tests is the color change of the unprinted paper. Most modern color papers contain optical brighteners, which are prone to degrading quickly. Not only will the brightening effect be lost, but additional yellowing of the paper may occur, the causes of which are often not well understood [34]. All four stress factors—heat, light, ozone, and humidity—may cause paper white changes [35]. As the change primarily occurs in the CIELAB b* coordinate, Figure 1a shows the change in CIELAB b* for the different wavelength after 7 kJcm−2 of exposure. The changes at the different exposure wavelengths are represented by the points of different color. The two horizontal lines show the mean dispersion of the experiment. The paper white changes occur at very low exposure levels, of below 2 kJcm−2, and quickly reach a plateau at <1.5 ΔE76. Exposure wavelengths up to 405 nm generate a yellower tint, while exposure wavelengths of 450 nm and higher result in a more bluish tint. There is no significant color change when exposing with orange or red light at 590 nm or 620 nm.
The different reaction paths at different exposure wavelengths are confirmed by recording the reflection density spectrum of the white patches after 6 kJcm−2 of exposure. Figure 1b shows the reflection density before and after exposing paper white with short wavelength LED (385 nm, 395 nm, 405 nm) and Figure 1c shows before and after exposure with longer wavelength light (450 nm, 485 nm, 505 nm, and 523 nm). The paper white exposed with a shorter wavelength of light has a different reflectance spectrum in the blue green region than when exposed to a longer wavelength of light.
3.2. Sensitivity Curves of Three Inkjet Color Patches
Two steps are required to obtain the action spectra from the data measured in the light chamber. In the first step, the sensitivity curves need to be measured, from which, in the second step, the action spectra can be derived, as shown in Section 3.3.
Figure 2 shows the measurements of the reflection density of the magenta patch before exposure to the narrow band LED light and after the exposure. The vertical line indicates the absorption maximum at 560 nm, for which the density changes were calculated.
The density difference, Dx−D0, is the density change produced by an exposure of ‘x’ kJcm−2 minus the density of the unexposed sample. In the case of Figure 2, the exposure was 12 kJcm−2 for all wavelengths. The density differences for the other exposure levels were calculated accordingly.
The curve in Figure 3 is often referred to as the sensitivity curve. It is a plot of the Dx−D0 density differences as a function of exposure. The stronger the slope of the curve, the higher the sensitivity of the material to that wavelength of exposure light. As the tests were run to only small changes, linear curve fits could be used for the slope. The curve fit must exclude data of very short exposures that are not significantly outside experimental noise. The mean dispersion of each experiment was determined. On average, it was found to be ΔE76 ≤ 4.5.
3.3. Action Spectra of Three Inkjet Color Patches
In the second step, the slopes of the sensitivity curves were plotted against the wavelength of the fading light. The resulting curve is the action spectrum of the colorant.
The action spectra for all three color patches are shown in Figure 4a–c. The results of both LEDs of one wavelength are shown separately to indicate experimental variation. Frequently, the action spectra resemble the absorption spectra of a colorant, as shown in Figure 4e,f. However, in certain cases, for example in the cyan shown in Figure 4a,b, photons absorbed in the main absorption band do not cause fast degradation. Absorbed photons do not necessarily cause chemical reactions, the energy can also be dissipated as heat. Up to the maximum exposure of the experiment, no significant fading for wavelengths longer than 430 nm could be observed for cyan. The degradation of the cyan dye is caused by blue light up to 430 nm only and not by its principal absorption wavelength of around 600 nm. This characteristic of phthalocyanine dyes, which are often used in inkjet printing, has been reported before [9,23].
The magenta color spot fades over the range of 385 nm and 523 nm. It most sensitive to UV light and to very short wavelength blue light. The yellow color patch fades most in its main absorption wavelength range around 400 nm and in the UV. There is some fading at longer wavelengths, which is due to magenta dots in the yellow patch.
Excitation with longer wavelengths of visual light and infrared light does not lead to electronically-activated molecules and fast light-induced reactions. Heat will degrade prints slowly. This thermal ageing, also called dark fading, takes place in addition to light fading, but over a much longer time scale [36]. In tests at ambient temperature that only extend over several months, the thermal ageing can be neglected. For silver halide and inkjet dye images, light fading lifetimes are 10–20 years, compared to more than 100–200 years in dark or heat fading [37]. To avoid any interaction between dark and light fading during our test, the sample temperature was held constant at close to ambient.
3.4. Prediction of Fading of White Light LED
For the prediction of fading under white light, based on the color fading test with a narrow band light, one additional step is necessary. The emission of the target white light LED needs to be fitted to the emissions of the narrow band LED. This is conducted by a simple factor analysis of the white light LED, with the narrow band LED as factors.
Often, principal component analysis of spectral data in art is used as a non-destructive technique to analyze the materiality in works of art [19]. Such an analysis is conducted on the reflection spectra of mixed colorants and other compounds that may be present at a particular spot. The pure pigment spectra are not always available; binder composition, surface texture and base material can play a role.
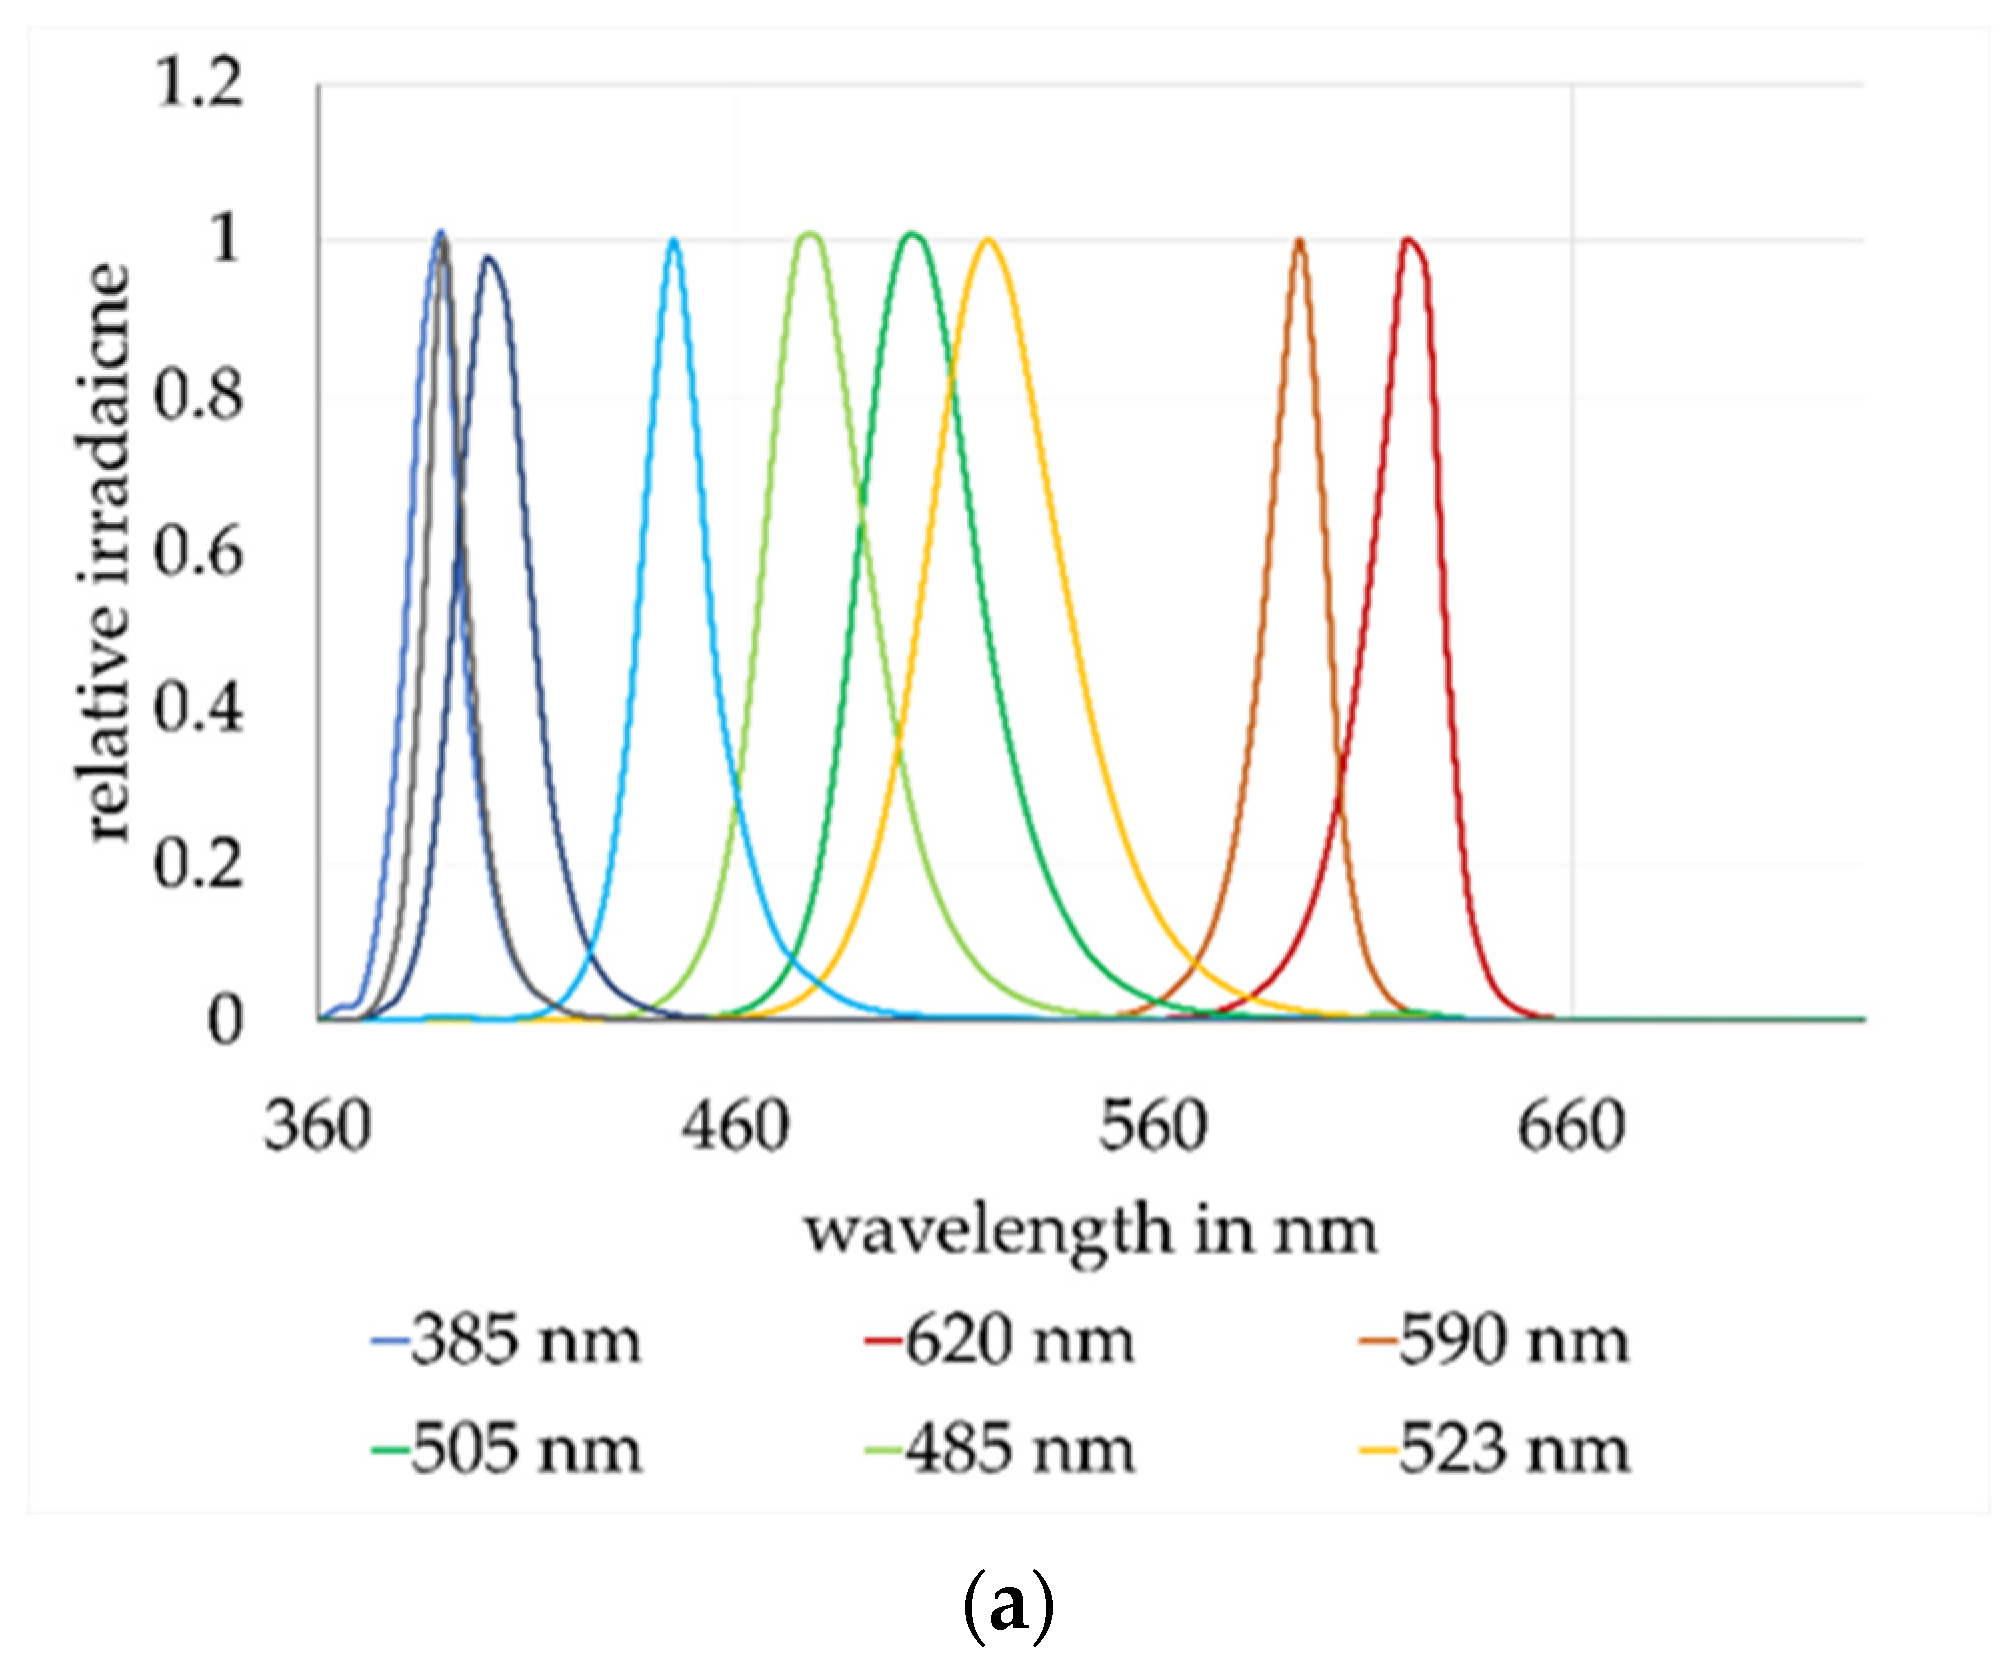
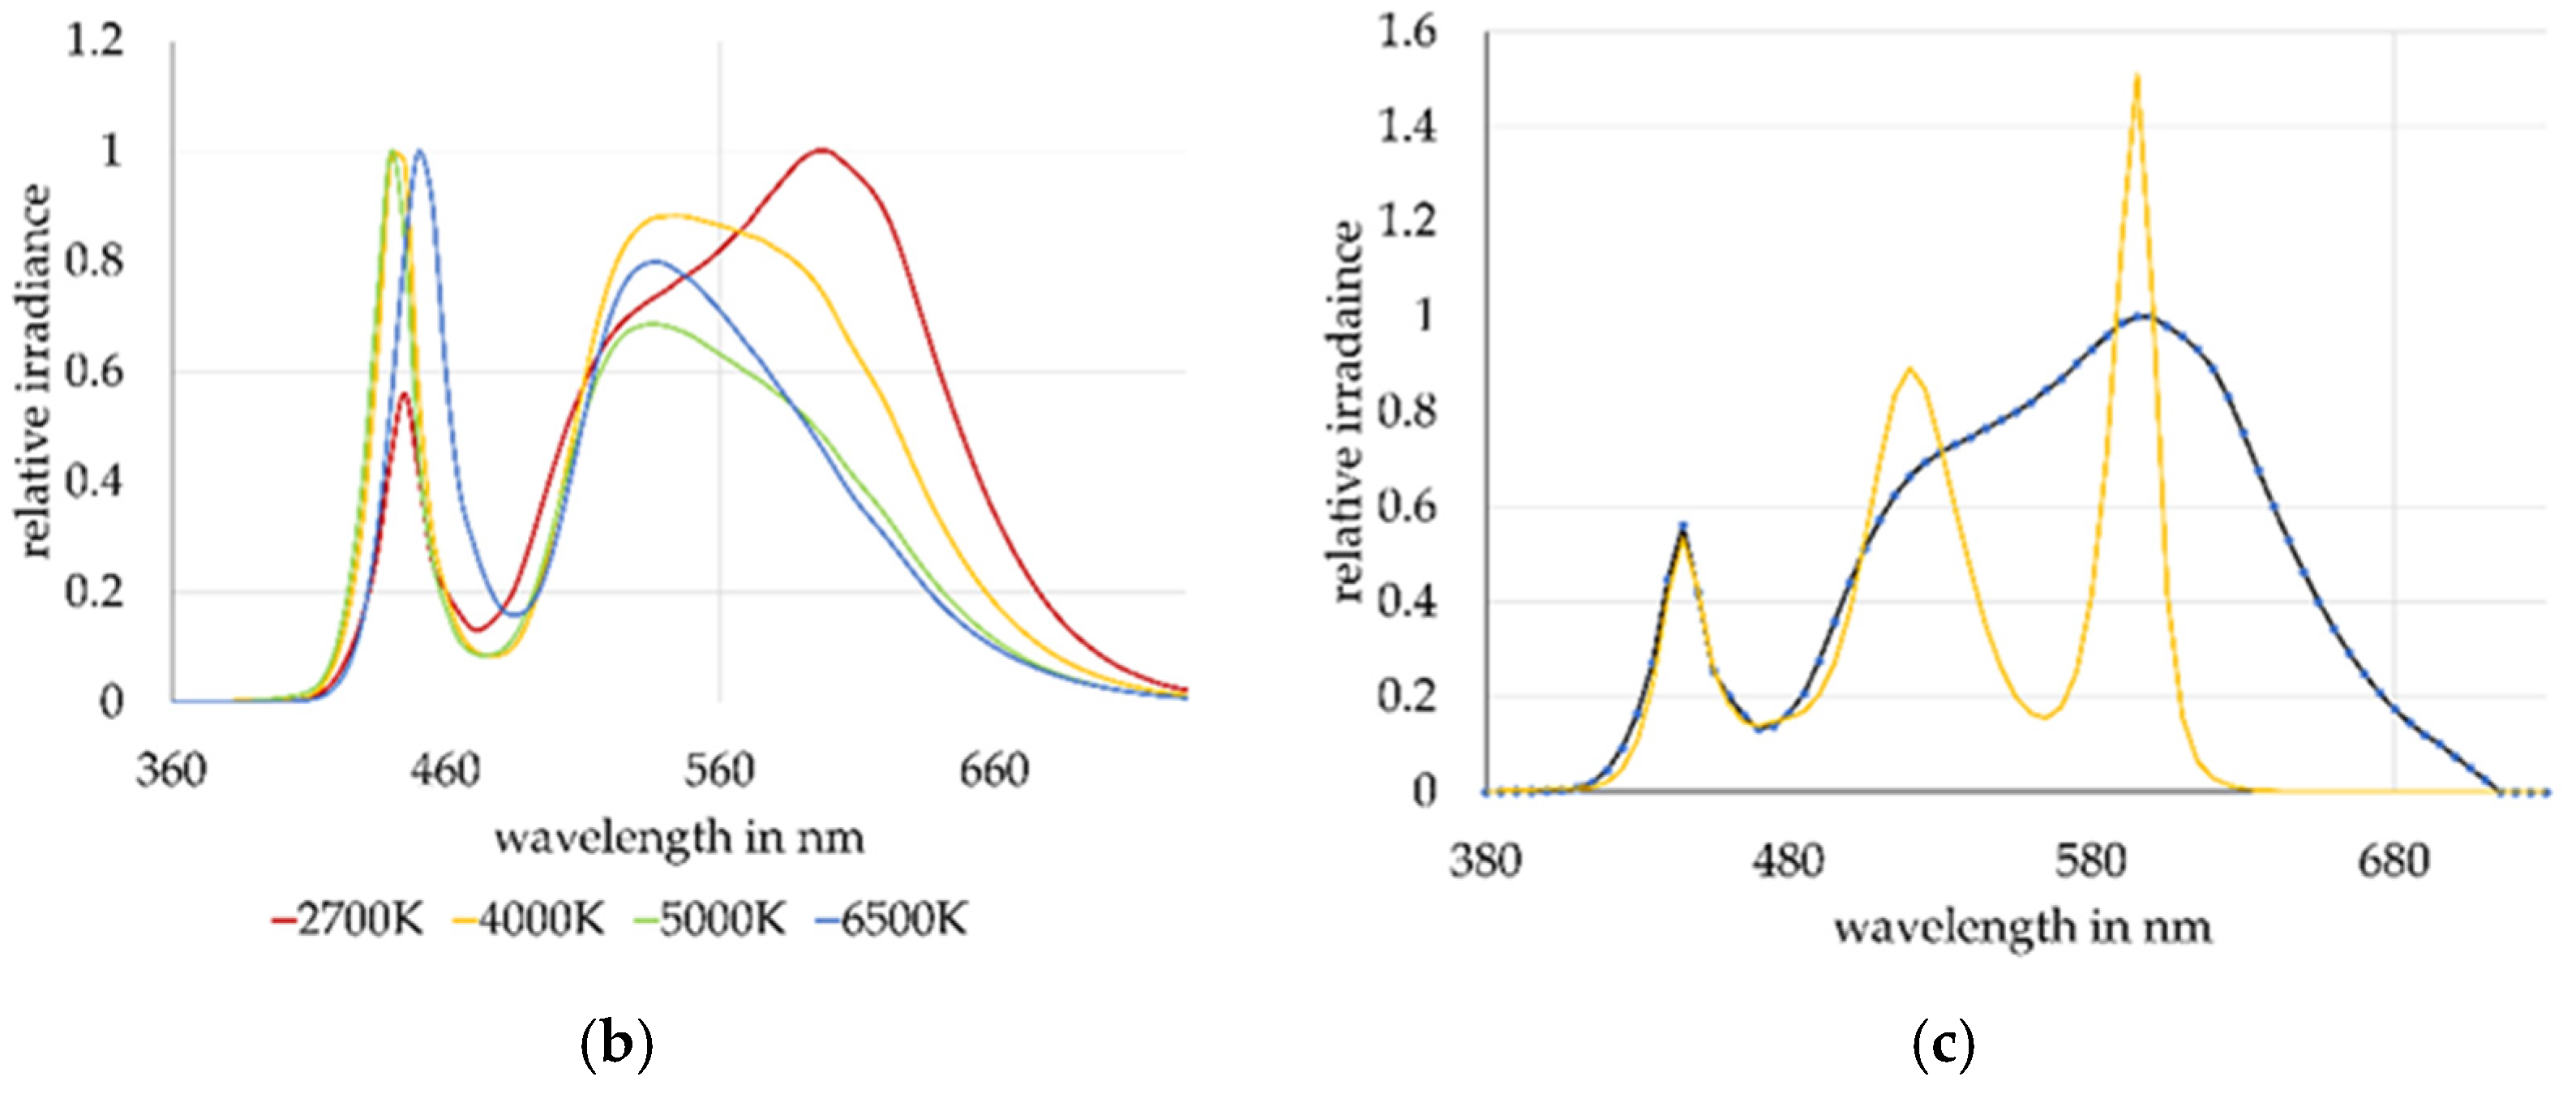
The factor analysis of this study is much less complex. The narrow band emission spectra (Figure 5a) and the white light emission spectra (Figure 5b) have been measured separately. The narrow band emission spectra have very little overlap. Furthermore, the match is not intended for faithful color reproduction [2,38], the analysis of colorants [39], digital color reconstruction [40] or to estimate spectral sensitivities of a capture device [41]. The aim of the factor analysis is only to match light in a way that it causes the same chemical degradation. This is why the long wave spectral range above 680 nm was omitted for the fit. Light in this range rarely contributes to fast degradation. The authors in [42] have determined the average optimum sampling interval for fitting various light sources and number of factors. For six factors, a sampling bandwidth of 6 nm gave satisfactory results for color spectra. This study used a sampling rate of 5 nm and proprietary software.
Figure 5c shows the target emission spectrum of the white LED 2700 K and the fit which is conducted with the emission of the narrow band LED.
Table 2 lists the factors required to match the four different white LEDs. Not all the narrow band LED spectra are needed to match the white light LED. There is no UV light in the four LED and very little irradiance around 500 nm.
The third step of the study is the quantitative prediction of fading for the color patches exposed to the white light LED. To predict fading for a particular white LED at a certain exposure level, the individual density losses determined in the narrow band sensitivity curves for that exposure were multiplied by their respective weighting factor, shown in Table 2, and added to give a predicted overall density loss.
Table 3 compares the predicted with the actual density changes after exposure of 20 kJcm−2 for the four white light LED exposures for the magenta patch. The match is satisfactory. Finer exposure steps would reduce the considerable experimental error.
It is often assumed that LEDs with a higher CCT cause more fading. However, the CCT is a metric to describe the visual aspects of light. This does not necessarily track with chemical degradation. The four LEDs of the test have widely different CCT; however, with the exception of the 2700K white LED, cause very similar color changes in our experiment. Figure 4b shows that the shortest, most destructive wavelengths, have similar relative irradiance for the 6500 K, 4000 K and 5000 K LED. This agrees with Ishizuka et al. [43], who found that the height of the blue peak and excitation wavelength, rather than the CCT of LEDs, correlated with the fading of the prints. The International Standardization Organization Technical Specification ISO/TS 18950:2021 Imaging materials —Photographic prints—Effect of light sources on degradation under museum conditions, requires the measurement of RSI and total irradiance for testing of the light stability of photographic prints under museum conditions.
4. Discussion
The research aim of this study was to predict the absolute color change of printed color patches under white light LED exposure, using only physicochemical measurable parameters and no mathematical model. The three-step approach, determine sensitivity curves, action spectra and factors for white light exposure seem suitable to conduct such a prediction for pure color patches on photographic samples. Another aim of the study was to estimate which types of white LED may be least damaging to photographic materials. Special short wavelength filtering for LED lighting can be proposed.
Previous studies of LED lighting for photographic artwork have often used white light LED as exposure sources or only analyzed the sensitivity of colorants to different wavelength of light. Few studies have proceeded to derive action spectra and very few predict the absolute density changes for specific exposure levels based on physicochemical and measurable material characteristics, such as absorption spectra, action spectra and matching lighting emissions. Many studies have used mathematical color models to predict the relative damage potential of light sources. These models are limited to the materials and light sources used to derive the data base.
A similar approach to our study was used by van Ackere et al. in their experiments with filtered Xe-light for predicting fading under different daylight conditions. The current study confirms the conclusions of van Ackere et al. [30] for filtered Xe-Light, concluding that fading occurred mainly up to an exposure wavelength of 550 nm. Only the narrow band exposure at 405 nm, 450 nm, 485 and 523 nm have significant contributions to the white light fading.
The narrow band LED of the test chamber do not cover the visual spectral range completely. For color reproduction and matching, this would be unacceptable. In the case of chemical degradation, it is the total irradiance that excites a particular absorption band of a colorant, and an exact spectral match is not required, as typical imaging dyes have very broad absorption bands (see Figure 2).
The exposure chamber needs to be carefully designed for the tests to run over a rather long time, reproducibly. While the wavelengths with a high damage potential faded the color patches in a matter of days, the fading with wavelengths with low damage potential could take months. Constant irradiance need to be kept constant for the entire duration of the test.
There are several limitations to the described method. The current exposure chamber does not allow for the monitoring of the density changes in-line, as is conducted in FORS or micro-fading, which follow the fading continuously. The sample needs to be removed for multiple off-line spectral density measurements and needs to be repositioned precisely. Combining the spectral fading with in-line monitoring would allow to follow light degradation kinetics, but is experimentally demanding.
Predictions of fading under light sources with different RSI can only be made in the range of wavelength that was investigated, namely indoor light of 385 nm–620 nm, and for the material tested. Other types of materials and colorants will have different action spectra and require another light chamber test.
While the method presented in this paper predicts the fading of color patches composed of one or two colorants quantitatively, it will be difficult to apply it to artwork with many different colors overlayed. The authors in [24] have investigated wavelength-dependent fading of many artists’ pigments and have derived action spectra for them. Their approach is to match an average pigment spectrum to an average damage spectrum. To make quantitative predictions for such a complex case will be difficult with the method of this study, which is particularly adapted to investigate photographic and inkjet prints that are generally composed of few primary colors, the absorption spectra of which are often known. Furthermore, the current method is limited by the small number of color patches that can be investigated per exposure test. The exposure spot has a diameter of 20 mm and only five-to-six color patches and white can be exposed in one experiment. The small exposure spot has the advantage of good homogeneity and rather high irradiance. On the other hand, only three color patches are not representative for the full print color gamut, as described in [33]. The aim of the study was to validate the method. Print life predictions would require testing more color patches.
Optical density was chosen in this study as the measure of the change of a color patch. One reason for this was that the color patches were printed with a mixture of colorants and that working on peak densities can suppress some interferences from other colorants. Particularly for monochrome patches and white, color difference metrics such as CIELAB ∆E can be used as a metric of change [44] and were used by other authors in [16,25,27].
The extrapolation of the experimental results to estimate the actual display life for inkjet prints requires some caution. The narrow band, as well as the white LED, exposures were conducted at similar irradiance. This irradiance was considerably higher than would be present in museum lighting. In the current test chamber, one day of exposures corresponded to roughly to 5–10 years of museum display. While the acceleration factor is less than that used for micro-fading imaging [45], for which 10 min of exposure correspond approximately to 5–10 years, it is still a concern.
Narrow band exposure can reveal mechanistic information regarding the degradation of print materials under visible light. This information may help to better protect such materials on display. To predict the fading under white light, it is most important to consider the short wavelength range between 400 nm and 530 nm. Tests with only a few narrow band LEDs in that wavelength range may help to select the least damaging lighting for specific types of materials.
All of the color patches were very sensitive to the wavelength range between 385 nm–420 nm. UV light is normally not present in LED lighting, but short wavelength blue light is. Long wavelength cut-off filters, as are used today in museum displays for daylight, fluorescent, and tungsten illumination, should also be considered for LED lighting.
Author Contributions
Conceptualization, M.H. and R.H.-S.; Data curation, M.H. and R.H.-S.; Formal analysis, R.H.-S.; Investigation, M.H. and R.H.-S.; Methodology, M.H. and R.H.-S.; Project administration, R.H.-S.; Resources, M.H. and R.H.-S.; Validation, R.H.-S.; Visualization, R.H.-S.; Writing—original draft, R.H.-S.; Writing—review & editing, M.H. and R.H.-S. All authors have read and agreed to the published version of the manuscript.
Funding
This research was funded by the Federal Department of Economic Affairs, Swiss Innovation Agency, Innosuisse, under the grant Inno-Eng 47431.1.
Data Availability Statement
The data presented in this study are available on request from the corresponding author.
Acknowledgments
We gratefully acknowledge the engineering team at the Ostschweizer Fachhochschule under the lead of René Grabher and Samuel Bawidaman for the construction of the equipment and Eduard Baumann for the factor analysis module. I am thankful to my supervisor Sebastian Dobrusskin at the Applied University of Bern for his support and to Jürgen Jung of Agfa-Gevaert NV and convenor of ISO TC42, WG 5 as well as the whole WG 5 international team for many fruitful discussions.
Conflicts of Interest
The authors declare no conflict of interest.
References
- Delgado, M.F.; Dirk, C.W.; Druzik, J.; WestFall, N. Lighting the world’s treasures: Approaches to safer museum lighting. Color Res. Appl. 2010, 36, 238–254. [Google Scholar] [CrossRef]
- Berns, R.S. Designing white-light LED lighting for the display of art: A feasibility study. Color Res. Appl. 2011, 36, 324–334. [Google Scholar] [CrossRef]
- Wilhelm, H.G.; Brower, C. The Permanence and Care of Color Photographs: Traditional and Digital Color Prints, Color Negatives, Slides, and Motion Pictures, 1st ed.; Preservation Pub. Co.: Grinnell, IA, USA, 1993. [Google Scholar]
- Farke, M.; Binetti, M.; Hahn, O. Light damage to selected organic materials in display cases: A study of different light sources. Stud. Conserv. 2016, 61 (Suppl. 1), 83–93. [Google Scholar] [CrossRef] [Green Version]
- Jürgens, M.C. The Digital Print: Identification and Preservation, 1st ed.; Getty Conservation Institute: Los Angeles, CA, USA, 2009. [Google Scholar]
- Druzik, J.; Michalski, S. Guidelines for Selecting Solid-State Lighting for Museums; Getty Conservation Institute: Los Angeles, CA, USA, 2012. [Google Scholar] [CrossRef]
- Aurélien, D.; Whitehead, L.A. LED-based white light. C. R. Phys. 2018, 19, 169–181. [Google Scholar]
- Lavédrine, B.; Gandolfo, J.-P.; Monod, S. A Guide to the Preventive Conservation of Photographic Collections; Getty Conservation Institute: Los Angeles, CA, USA, 2003; pp. 159–161. [Google Scholar]
- Saunders, D.; Kirby, J. Wavelength-dependent fading of artists’ pigments. Stud. Conserv. 1994, 39 (Suppl. 2), 190–194. [Google Scholar] [CrossRef]
- Schaeffer, T.T. Effects of Light on Materials in Collections: Data on Photoflash and Related Sources; Getty Conservation Institute: Los Angeles, CA, USA, 2001; pp. 10–13. [Google Scholar]
- Baumann, E.; Hofmann, R. The Equivalence of Light Sources in Light Stability Testing. In Proceedings of the IS&T’s International Conference on Digital Printing Technologies, Salt Lake City, UT, USA, 31 October–5 November 2004; 2004; pp. 699–704. [Google Scholar]
- Pinilla, S.M.; Vázqueza, D.; Fernández-Balbuenaa, A.A.; Murob, C.; Muñoza, J. Spectral damage model for lighted museum paintings: Oil, acrylic and gouache. J. Cult. Herit. 2016, 22, 931–939. [Google Scholar] [CrossRef] [Green Version]
- Feller, R.L. Accelerated aging: Photochemical and Thermal Aspects; del Rey, M., Ed.; Research in conservation, 4; Getty Conservation Institute: Los Angeles, CA, USA, 1994; pp. 23–54. [Google Scholar]
- Saitmacher, K.; Geisenberger, J.; Macholdt, H.-T.; Menzel, H. Stability of inkjet prints to gas fading—New developments. In Proceedings of the IS&T’s International Conference on Digital Printing Technologies, New Orleans, LA, USA, 28 September–3 October 2003; pp. 334–395. [Google Scholar]
- Kopperl, D.F.; Mizen, M.B. The effect of ozone on the quality and stability of inkjet, chromogenic and silver digital images. In Proceedings of the IS&T’s International Conference on Digital Printing Technologies, New Orleans, LA, USA, 28 September–3 October 2003; pp. 458–459. [Google Scholar]
- Dang, R.; Yuan, Y.; Liu, G.; Liu, J. Chromaticity changes of inorganic pigments in Chinese traditional paintings due to the illumination of frequently-used light sources in museum. Color Res. Appl. 2018, 43, 596–605. [Google Scholar] [CrossRef]
- Luo, H.W.; Chou, C.J.; Chen, H.S.; Luo, M.R. Museum lighting with LEDs: Evaluation of lighting damage to contemporary photographic materials. Light. Res. Technol. 2018, 0, 1–15. [Google Scholar] [CrossRef]
- Piccablotto, G.; Aghemo, C.; Pellegrino, A.; Iacomussi, P.; Radis, M. Study on Conservation Aspects Using LED Technology for Museum Lighting. Energy Procedia 2015, 78, 1347–1352. [Google Scholar] [CrossRef] [Green Version]
- Angelin, E.M.; Cucci, C.; Picollo, M. What about discoloration in plastic artifacts? The use of Fiber Optic Reflectance Spectroscopy in the scope of conservation. Color Cult. Sci. J. 2021, 14, 87–93. [Google Scholar] [CrossRef]
- Whitmore, P.; Pan, X.; Bailie, C. Predicting the fading of objects: Identification of fugitive colorants through direct non-destructive lightfastness measurements. J. Am. Inst. Conserv. 1999, 38, 395–409. [Google Scholar] [CrossRef]
- Whitmore, P.M.; Bailie, C.; Connors, S.A. Micro-fading tests to predict the result of exhibition: Progress and prospects. Stud. Conserv. 2000, 38, 200–205. [Google Scholar] [CrossRef]
- Pesme, C.; Lerwill, A.; Beltran, V.; Druzik, J. Development of Contact Portable Microfade Tester to Assess Light Sensitivity of Collection Items. J. Am. Inst. Conserv. 2016, 55, 117–137. [Google Scholar] [CrossRef]
- Lerwill, A.; Brookes, A.; Townsend, J.H.; Hackney, S.; Liang, H. Micro-fading spectrometry: Investigating the wavelength specificity of fading. Appl. Phys. A 2015, 118, 457–463. [Google Scholar] [CrossRef] [Green Version]
- Li, Z.; Song, X.; Zhang, F.; Dang, R. Method to Obtain LED Spectrum Optimizing Protection Effect and Color Quality for Lighting Dyed Cultural Relics Painted With Inorganic Pigments. IEEE Photon- J. 2021, 13, 1–8. [Google Scholar] [CrossRef]
- Dang, R.; Zhang, F.; Yang, D.; Guo, W.; Liu, G. Spectral damage model for lighting paper and silk in museum. J. Cult. Heritage 2020, 45, 249–253. [Google Scholar] [CrossRef]
- Lee, S.-K.; Mills, A.; O’Rourke, C. Action spectra in semiconductor photocatalysis. Chem. Soc. Rev. 2017, 46, 4877–4894. [Google Scholar] [CrossRef] [Green Version]
- Hattori, H.; Yoshizumi, K.; Crews, P.C. Wavelength sensitivity of AATCC Blue wool lightfastness standards under light radiation. Dye. Pigment. 2012, 92, 936–941. [Google Scholar] [CrossRef]
- Liu, Y.; Fearn, T.; Strlič, M. Spectral sensitivity of the discoloration of Historical rag paper. Talanta Open 2021, 4, 100058. [Google Scholar] [CrossRef]
- Haas, C.P.; Roider, T.; Hoffmann, R.W.; Tallarek, U. Light as a reaction parameter—Systematic wavelength screening in photochemical synthesis. React. Chem. Eng. 2019, 4, 1912–1916. [Google Scholar] [CrossRef]
- Van Ackere, G.; Kanora, H.; Graindourze, M.; Friedel, H.; Lingier, S. Interpretation of Life-of-Display Prediction Calculated from Accelerated Light Fading Tests. In Proceedings of the IS&T’s International Conference on Digital Printing Technologies, Fort Lauderdale, FL, USA, 30 September–5 October 2001; pp. 213–217. [Google Scholar]
- Hofmann-Sievert, R. A Method to Predict the Light Stability of Colour Prints displayed under LED Light with different Spectral Irradiance. In Proceedings of the 2nd Edition of Colour Photography and Film, Florence, Italy, 15–16 September 2022. [Google Scholar]
- Sharma, G.; Wu, W.; Dalal, E. The CIEDE2000 color-difference formula: Implementation notes, supplementary test data, and mathematical observations. Color Res. Appl. 2005, 30, 21–30. [Google Scholar] [CrossRef]
- Ishizuka, H.; Groen, E.; Uchino, N.; Shibahara, Y.; Soejima, S.; der Kinderen, W. Endpoint criteria for evaluation of image permanence of photographic prints. In Proceedings of the NIP & Digital Fabrication Conference, San Francisco, CA, USA, 29 September–2 October September 2019; pp. 197–202. [Google Scholar]
- Wilhelm, H. Yellowish Stain Formation in Inkjet Prints and Traditional Silver-Halide Color Photographs. In Proceedings of the IS&T’s International Conference on Digital Printing Technologies, New Orleans, LA, USA, 28 September–3 October 2003; pp. 444–449. [Google Scholar]
- Reber, J.; Hofmann, R.; Fuerholz, U.; Pauchard, M. Spectroscopic Investigation of IJ Layer Yellowing. In Proceedings of the IS&T’s International Conference on Digital Printing Technologies and Digital Fabrication, Anchorage, AK, USA, 16–21 September 2007; pp. 711–715. [Google Scholar]
- Meyer, A.; Bermane, D. Stability and Permanence of Cibachrome Images. J. Appl. Photogr. Eng. 1983, 9, 121–125. [Google Scholar]
- Wilhelm, H. A Review of Accelerated Test Methods for Predicting the Image Life of Digitally-Printed Photographs—Part II. In Proceedings of the IS&T’s International Conference on Digital Printing Technologies, Salt Lake City, UT, USA, 31 October 31–5 November 2004; pp. 664–669. [Google Scholar] [CrossRef]
- Zhao, Y.; Berns, R.S. Image based spectral reflectance reconstruction using the matrix R. method. Color Res. Appl. 2007, 32, 343–351. [Google Scholar] [CrossRef]
- Berns, R. Artist Acrylic Paint Spectral, Colorimetric, and Image Dataset. In Proceedings of the Archiving Conference 19, Lisbon, Portugal, 14–17 May 2019; pp. 45–49. [Google Scholar] [CrossRef]
- Berns, R.S. Digital color reconstructions of cultural heritage using color-managed imaging and small-aperture spectrophotometry. Color Res. Appl. 2019, 44, 531–546. [Google Scholar] [CrossRef]
- Walowit, E.; Buhr, H.; Wüller, D. Multidimensional Estimation of Spectral Sensitivities, Environmental Science. Proceedins of the 25th Color and Imaging Conference, Lillehammer, Norway, 11–15 September 2017. [Google Scholar] [CrossRef]
- Lehtonen, J.; Parkkinen, J.; Jaaskelainen, T.; Kamshilin, A. Principal component and sampling analysis of color spectra. Opt. Rev. 2009, 16, 81–90. [Google Scholar] [CrossRef]
- Ishizuka, H.; Groen, E.; Uchino, N.; Shibahara, Y.; Soejima, S. Image Permanence of Photographic Prints under LED lighting. In Proceedings of the NIP & Digital. Fabrication Conference, San Francisco, CA, USA, 29 September–2 October 2019; pp. 192–196. [Google Scholar]
- Hofmann, R.; Baumann, E.; Hagen, R. Densitometry versus Colorimetry for Permanence Investigations. In Proceedings of the IS&T’s International Conference on Digital Printing Technologies, Fort Lauderdale, FL, USA, 30 September–5 October 2001; pp. 209–212. [Google Scholar]
- Del Hoyo-Meĺendez, J.M.; Mecklenburg, M.F. An Investigation of the Reciprocity Principle of Light Exposures Using Microfading Spectrometry. Spectrosc. Lett. 2011, 44, 52–62. [Google Scholar] [CrossRef]
Figure 1.
Change of paper white color by narrow band exposure: (a) Delta b*; (b) reflection density after short wavelength exposure; (c) reflection density after long wavelength exposure.
Figure 1.
Change of paper white color by narrow band exposure: (a) Delta b*; (b) reflection density after short wavelength exposure; (c) reflection density after long wavelength exposure.

Figure 2.
Magenta patch reflection density spectrum before and after 12 kJcm−2 exposure.

Figure 3.
Magenta sensitivity curve for narrow band LED between 405 and 620 nm.

Figure 4.
Action Spectra (a) cyan patch at peak of 600 nm; (b) absorption spectrum of cyan patch; (c) action spectrum magenta patch at peak of 560 nm; (d) absorption spectrum of magenta patch; (e) action spectrum of yellow patch at peak of 400 nm; (f) absorption spectrum of yellow patch.
Figure 4.
Action Spectra (a) cyan patch at peak of 600 nm; (b) absorption spectrum of cyan patch; (c) action spectrum magenta patch at peak of 560 nm; (d) absorption spectrum of magenta patch; (e) action spectrum of yellow patch at peak of 400 nm; (f) absorption spectrum of yellow patch.

Figure 5.
Factor analysis; (a) relative emission spectra of narrow band LED used in the light chamber; (b) relative emission spectra of the white light LED used in the chamber; (c) target spectrum of LED at 2700 K (blue curve) and fitted curve (yellow).
Figure 5.
Factor analysis; (a) relative emission spectra of narrow band LED used in the light chamber; (b) relative emission spectra of the white light LED used in the chamber; (c) target spectrum of LED at 2700 K (blue curve) and fitted curve (yellow).


Table 1.
Center wavelength and Irradiance of the LED in the exposure chamber.
| Center Wavelength of LED | Irradiance in mWcm−2 |
|---|---|
| 385 nm | 27 |
| 395 nm | 42 |
| 405 nm | 31 |
| 450 nm | 24 |
| 485 nm | 19 |
| 505 nm | 12 |
| 523 nm | 38 |
| 590 nm | 23 |
| 620 nm | 14 |
| 6500 K | 18 |
| 5000 K | 100 |
| 4000 K | 24 |
| 2700 K | 22 |
Table 2.
Factors from the factor analysis, normalized to the sum of the factors.
| Narrow Band LED Wavelength in nm | White LED 6500 K | White LED 5000 K | White LED 4000 K | White LED 2700 K |
|---|---|---|---|---|
| 385 | 0.00 | 0.00 | 0.00 | 0.00 |
| 395 | 0.00 | 0.00 | 0.00 | 0.00 |
| 405 | 0.00 | 0.00 | 0.00 | 0.00 |
| 450 | 0.31 | 0.38 | 0.32 | 0.18 |
| 485 | 0.08 | 0.00 | 0.00 | 0.03 |
| 505 | 0.00 | 0.00 | 0.00 | 0.00 |
| 523 | 0.31 | 0.31 | 0.30 | 0.29 |
| 590 | 0.30 | 0.31 | 0.38 | 0.50 |
| 620 | 0.00 | 0.00 | 0.00 | 0.00 |
Table 3.
Predicted and actual changes of the magenta patch at 560 nm for a 20 kJcm−2 exposure.
| Narrow Band Exposure | White Light Exposure | |
|---|---|---|
| For LED | Predicted Density Changes D20−D0 | Actual Density Changes D20−D0 |
| 2700 K | −0.135 ± 0.015 | −0.14 ± 0.04 |
| 4000 K | −0.21 ± 0.02 | −0.195 ± 0.025 |
| 5000 K | −0.205 ± 0.025 | −0.205 ± 0.055 |
| 6500 K | −0.21 ± 0.025 | −0.195 ± 0.055 |
Publisher’s Note: MDPI stays neutral with regard to jurisdictional claims in published maps and institutional affiliations. |
© 2022 by the authors. Licensee MDPI, Basel, Switzerland. This article is an open access article distributed under the terms and conditions of the Creative Commons Attribution (CC BY) license (https://creativecommons.org/licenses/by/4.0/).
Share and Cite
MDPI and ACS Style
Hofmann, M.; Hofmann-Sievert, R. Spectral Light Fading of Inkjet Prints. Heritage 2022, 5, 4061-4073. https://doi.org/10.3390/heritage5040209
AMA Style
Hofmann M, Hofmann-Sievert R. Spectral Light Fading of Inkjet Prints. Heritage. 2022; 5(4):4061-4073. https://doi.org/10.3390/heritage5040209
Chicago/Turabian StyleHofmann, Manfred, and Rita Hofmann-Sievert. 2022. "Spectral Light Fading of Inkjet Prints" Heritage 5, no. 4: 4061-4073. https://doi.org/10.3390/heritage5040209