Article

Contributions to the Characterization of Chromogenic Dyes in Color Slides

by
Joana Silva
1,*,
António Jorge Parola
2,
Maria Conceição Oliveira
3,
Bertrand Lavédrine
4 and
Ana Maria Ramos
1
1
LAQV-REQUIMTE, Departamento de Conservação e Restauro, NOVA School of Science and Technology, FCT-NOVA, NOVA University of Lisbon, 2829-516 Caparica, Portugal
2
LAQV-REQUIMTE, Departamento de Química, NOVA School of Science and Technology, FCT-NOVA, NOVA University of Lisbon, 2829-516 Caparica, Portugal
3
Centro de Química Estrutural, Institute of Molecular Sciences, Instituto Superior Técnico, Universidade de Lisboa, 1049-001 Lisboa, Portugal
4
Centre National de la Recherche Scientifique, 75005 Paris, France
*
Author to whom correspondence should be addressed.
Heritage 2022, 5(4), 3946-3969; https://doi.org/10.3390/heritage5040203
Submission received: 10 November 2022 / Revised: 28 November 2022 / Accepted: 2 December 2022 / Published: 4 December 2022

Abstract

:
Chromogenic reversal films (or color slides) are first-generation positive transparencies. These were used for various purposes, namely as an artistic medium, especially from the 1960s onwards. However, these materials are intrinsically vulnerable to chemical degradation and have poor long-term stability. Although over time significant improvements have been achieved in the stability of chromogenic products, chromogenic dyes are highly susceptible to oxidation and hydrolysis, both induced by light and/or relative humidity and temperature, leading to the fading and shift in the original color balance of the images. During the present investigation, a gap of knowledge regarding chromogenic materials in general, and chromogenic reversal films specifically, was detected. Today, there is still no methodology to identify the dyes present in a specific work and, therefore, to study their chemical mechanism of degradation. From this premise and focused on case studies from the Portuguese artist Ângelo de Sousa (1938–2011), a research study was carried out seeking the characterization of chromogenic dyes. Based on the isolation of the different dyes composing a chromogenic material, several procedures were tested to describe the dyes found in chromogenic reversal films, such as Raman spectroscopy, thin-layer chromatography (TLC), infrared spectroscopy, high-performance liquid chromatography with diode array detector (HPLC-DAD) and coupled with mass spectrometry (HPLC-HRMS). Promising results were achieved with this approach, opening new paths for the understanding of these materials.

1. Introduction

In 1935, Kodak launched the first chromogenic product with application in the photography and film industry. A few years later, the chromogenic process was available in a wide range of materials (negatives, prints, and positive transparencies) and formats (professional and amateur) [1]. Its great success led to the color photography era, starting in the 1960s, when the use of color photographs surpassed that of black-and-white [2]. Ever since, inestimable amounts of color photographs have been produced, and chromogenic photography now represents a significant part of the cultural heritage worldwide.
The chromogenic process is grounded on the color separation principle to reproduce a real scene, using superimposed emulsion layers coated on the base [2]. Each emulsion layer is composed of color couplers, silver halides and sensitizing dyes within a gelatin binder. During processing, the color couplers, initially colorless, react with the developer, which has previously been oxidized by silver development to become dyes (Figure 1). After processing, the blue-sensitive layer reproduces the yellow (Y) elements of the reproduced scene, the green-sensitive layer reproduces the magenta (M), and the red-sensitive layer reproduces the cyan (C). At the end of the processing, all silver is removed by a fixer [3].
Although each manufacturer employed its own color couplers, all the industry worked with materials with similar structures [1]. The most important classes of Y couplers are pivaloylacetanilide and benzoylacetanilide, introduced by Kodak in the 1960s. Later, other classes of Y couplers have been employed with higher stability and tinctorial strength [4]. M couplers are normally heteroaromatic compounds. Until 1980, pyrazolones were the M couplers of choice [5]. In the 2000s, the use of pyrazolotriazoles was widespread due to the high quality of hues produced by the correspondent dye. Most C couplers are substituted phenols or naphthols. The use of 2,5-diacylaminophenols in reversal films, disclosed by Kodak, was generalized for more than 20 years [6]. Nevertheless, heterocyclic compounds have also been used [6,7].
Different functional groups can be attached to the color coupler nucleus to improve their features. Ballasting groups are usually employed to prevent dyes from wandering from one layer to another. Leaving groups are molecular fragments added to optimize the coupling rate and promote the direct formation of the chromophore [7].
In general, the dyes resulting from the reaction of M and Y couplers with the developing agent are from the azomethine family, while those resulting from C couplers are from the indoaniline family [8]. Schiff base is one of the most important functional groups present in the three dyes, constituting an essential link in the conjugated system responsible for the dye color [9]. The most significant classes of couplers and the corresponding dye are summarized in Table 1.
The precise structure of the final dyes present in a chromogenic material depends on the type of color coupler and its functional groups and on the developing agent used to process the film [5]. Over time, the composition of developing agents and especially of color couplers has undergone many changes [1]. According to the type of material (negative, print, reversal film), different couplers have been shaped. Moreover, due to the constant evolution of coupler technology, manufacturers often change the couplers at use [1], and so different couplers have been applied in different stocks as well [5]. Unfortunately, as far as it could be concluded from the conducted research, there is no way of knowing which color couplers have been employed in which products based on the available literature.
The first generation of chromogenic materials was chemically very unstable. From the late 1970s, Kodak, Fuji, and Agfa, among other industries, started to test the stability of their products on a regular basis. This has contributed to a deeper knowledge of the deterioration mechanisms associated with chromogenic dyes and led to great improvements in the stability of these materials from the 1980s onwards [1]. Even so, chromogenic dyes are highly susceptible to oxidation and hydrolysis, both induced by light (light fading) and/or relative humidity and temperature (dark fading) [10]. Continuous contact with environmental agents gradually disrupts the chromophore molecules, leading to the formation of colorless degradation products responsible for the fading of the image [1]. Since the three dyes present in a film have different molecular structures, they also have different degradation rates. Therefore, these materials are prone to shift the original color balance. Residual color couplers are also vulnerable to oxidation, producing yellowish species (yellow stain) [11]. This is especially visible in the highlight areas of the image [10], where residual color couplers are present in higher quantities [12]. Furthermore, the interaction between residual color couplers (nucleophiles) and dyes (electrophiles) can accelerate dye fading [12]. Improper processing can also decrease dye stability and/or enhance staining levels [10]. Over the years, it has been demonstrated that degradation products generated by dark and light fading can be different since the two degradation courses might lead to different disruptions of the chromophores [11]. The same film can be very unstable when exposed to light and quite stable in the dark [10].
During the present investigation, a gap of knowledge regarding the chromogenic materials was detected. Up to now, there are several references describing molecule structures, degradation pathways and preservation guidelines. However, at present, it is not possible to know which dyes are present in a specific artwork and how long will they last. When the stability of a specific chromogenic photograph is to be known, the material or an equivalent (same brand and model) can be induced to artificial aging to estimate its lifespan [13]. As previously mentioned, chromogenic materials are industrial products that have been progressively upgraded. For that reason, it is nowadays difficult to find a product equivalent to the one used in the past. Thus, unless the initial condition of the artwork was documented (which is not common), there is no way to know how the colors of a specific chromogenic artwork have changed.
To investigate the degradation mechanism of a dye, it is necessary to identify its chemical structure. Despite the pioneering studies dedicated to the characterization of chromogenic dyes, conducted by Giovanna Di Pietro [5] and Ann Fenech [14] and more recently by researchers from the University of Milan [15], a sustainable methodology to identify dyes present in a specific chromogenic product is still not available today. Therefore, a research study was carried out focusing on the characterization of chromogenic dyes, taking as case studies slide-based artworks by the artist Ângelo de Sousa (1938–2011). Color slides, or chromogenic reversal films, are first-generation positive transparencies. These were widely used in photojournalism, fine arts, for commercial applications, such as advertising, fashion, industry, and academia [16], and from the 1960s onwards, as new media of expression for artists [16]. The pursued methodology sought to test the efficiency of some of the most common analytical techniques used in the study of cultural heritage. Both non- and micro-invasive techniques were explored. Based on the straight analysis of emulsion layers and on the isolation of the different dyes composing the chromogenic material, several procedures were proposed to molecularly describe the dyes found in chromogenic reversal films. Different techniques, such as Raman spectroscopy, thin-layer chromatography (TLC), infrared spectroscopy, high-performance liquid chromatography with a diode array detector (HPLC-DAD), and coupled with mass spectrometry (HPLC-MS), were compiled. Promising results were achieved with this approach, opening new paths for understanding these materials. Yet, this was only a preliminary study and needs further development.

2. Materials and Techniques

2.1. Case Studies

A strategy to characterize chromogenic dyes was developed based on two case studies of slide-based artworks produced by the artist Ângelo de Sousa. Both are 35 mm chromogenic reversal films from the integrated dye couplers type.
(i) Kodak Ektachrome 160T Professional (EPT)
Slides de Cavalete (1978–1979), a slide-based artwork by Ângelo de Sousa, is one of the most original photographic works produced by the artist [17]. Knowing that chromogenic reversal films are highly susceptible to dark and light fading, that the work has been gathered in inadequate environmental conditions for more than forty years, and that the original slides have been projected in two exhibitions at least [17], visible color change would be expected. However, due to the abstract nature of the images composing Slides de Cavalete, the color change was not straightforwardly observed. Accordingly, this artwork was selected as a case study.
The work is composed of one hundred Kodak Ektachrome 160T. EPT was produced between 1976 and 2007, with the emulsion number 5037 [2]. A film tip and an unprocessed film of EPT were found at the artists’ archive, probably dating from the same time of the work [18], allowing us to conduct a series of analyses to this type of film without having to rely on the original slides. From 1976 onwards, all Ektachrome films were processed using E-6 chemistry [2].
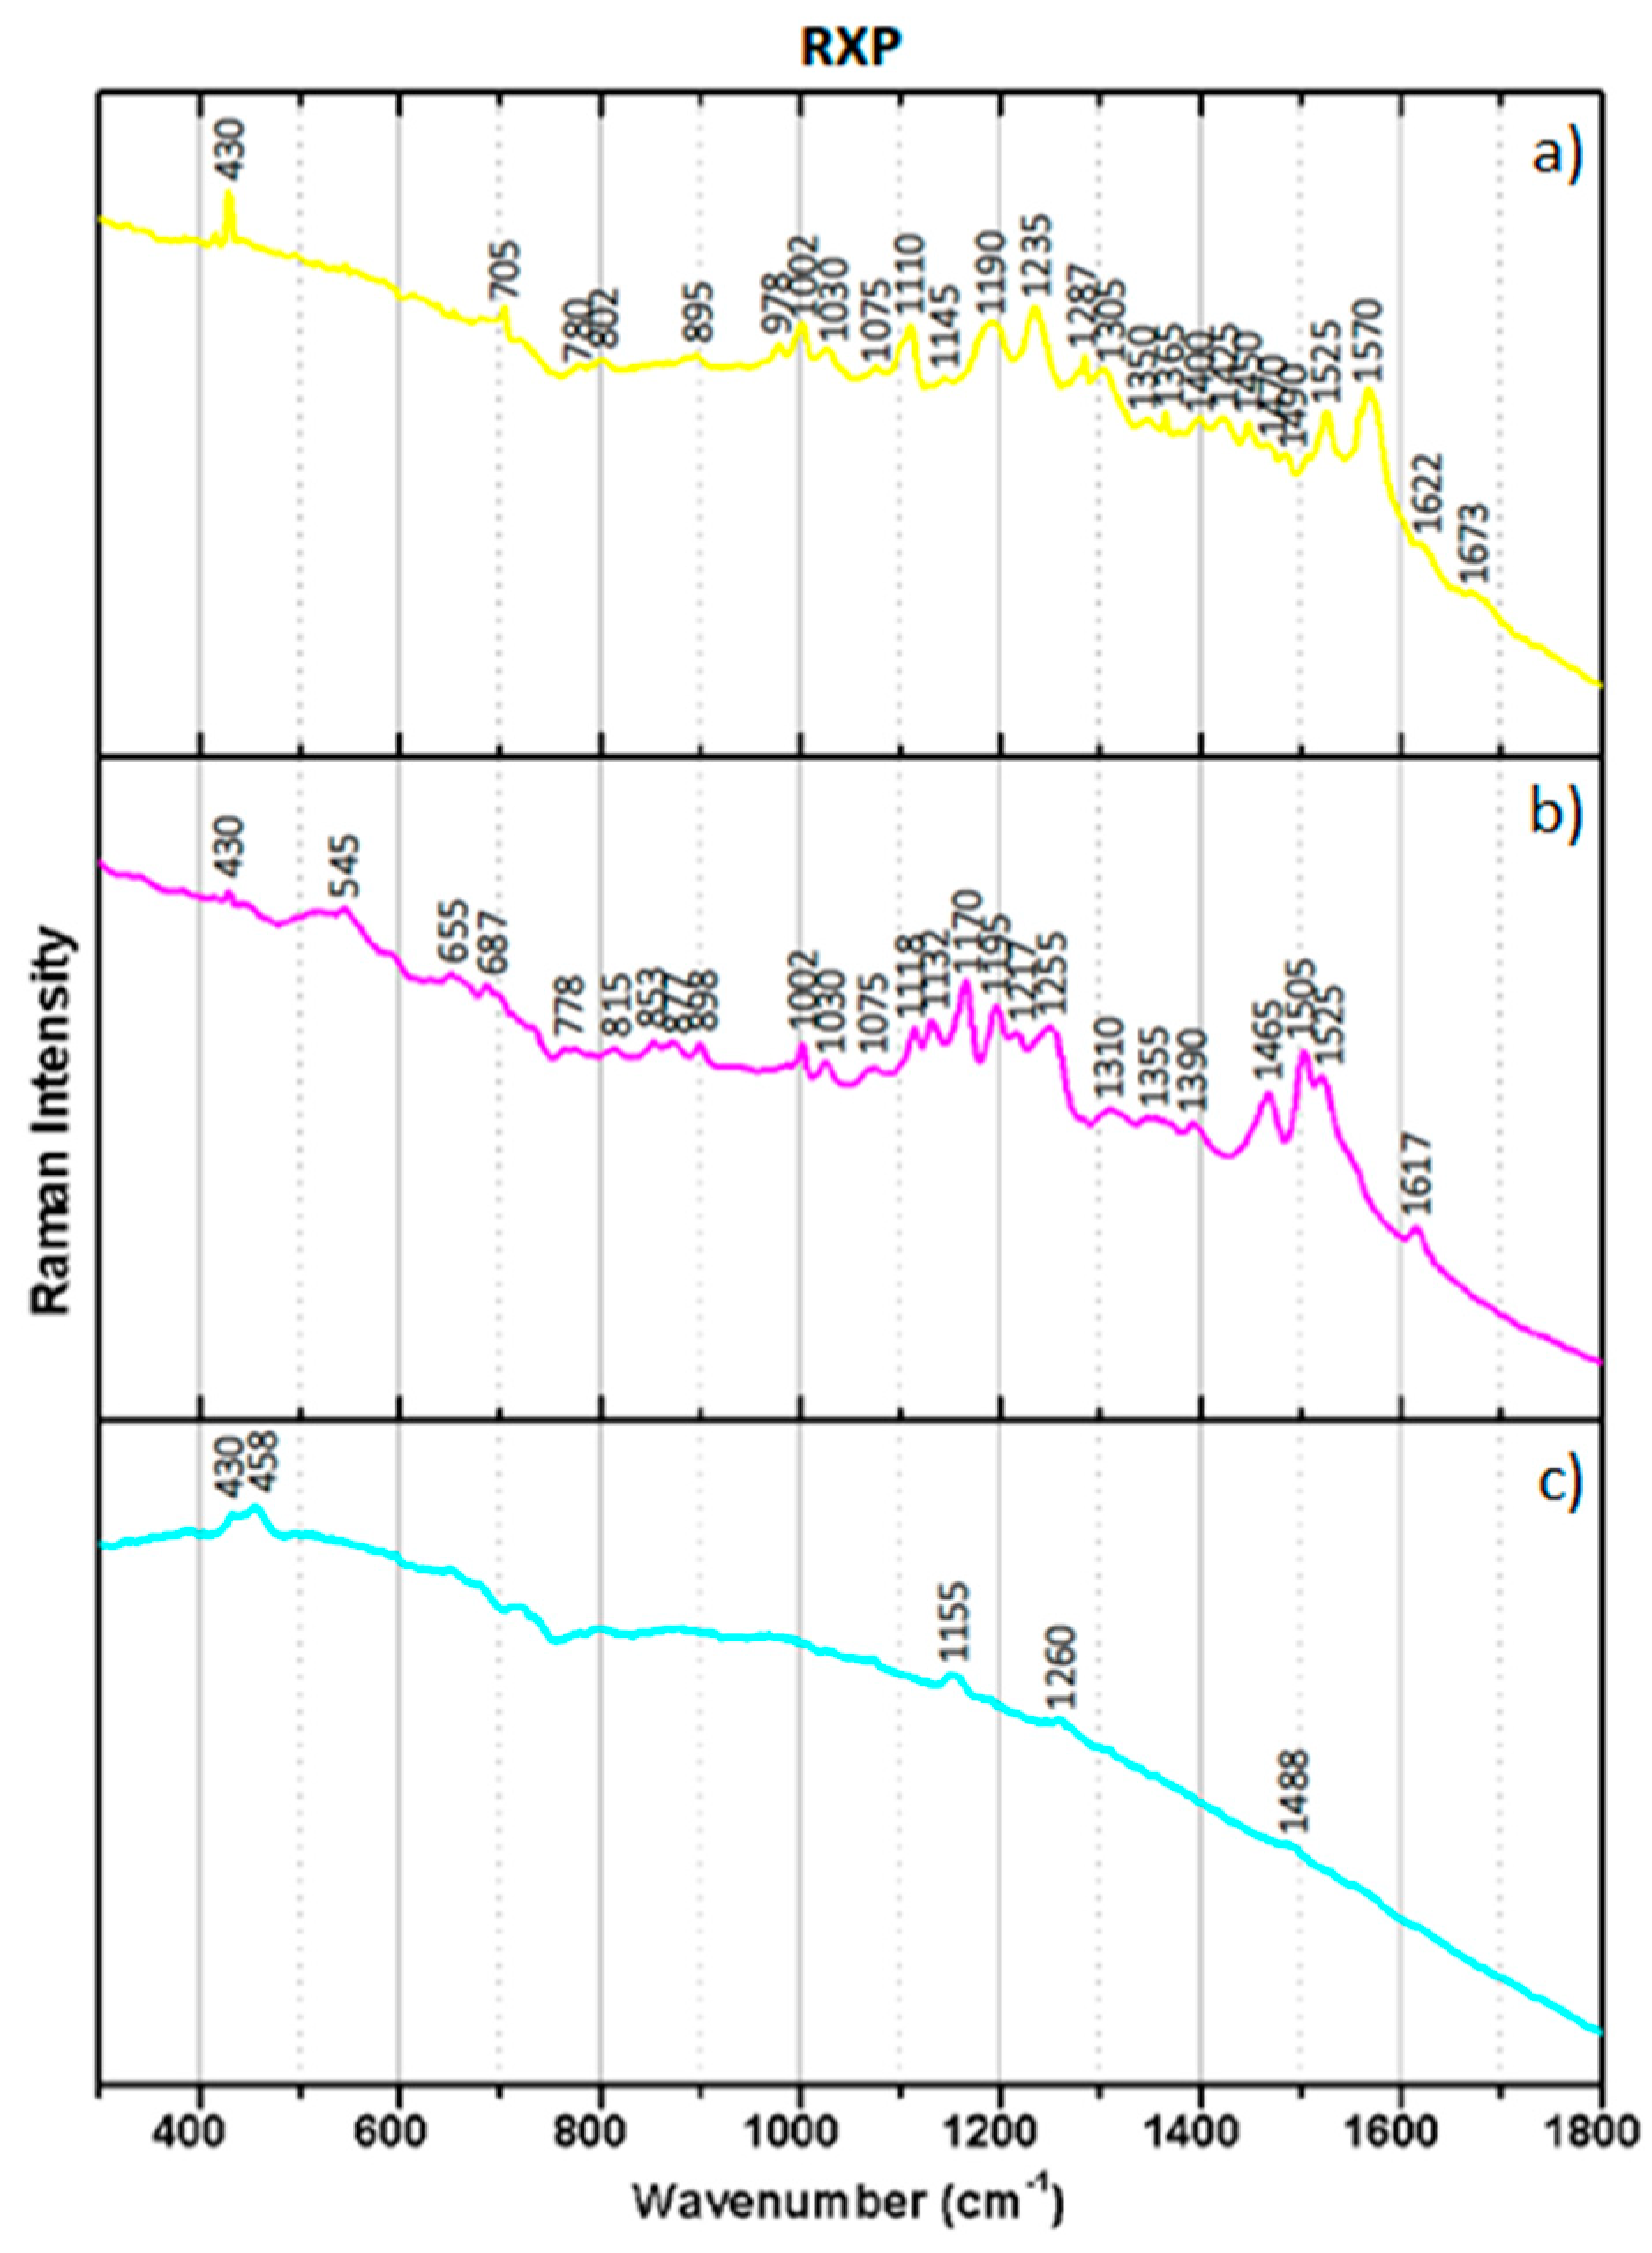
(ii) Fuji Fujichrome Provia 400X Professional (RXP)
A set of thirteen unexposed Fujichrome Provia 400X Professional (RXP) films was found at Ângelo de Sousa’s house. Based on the survey conducted on the artist’s photographic collection, this type of film was found to be the third most abundant model of chromogenic reversal films used by him [18]. Although the shelf-life of the RXP films expired in 2009, considering their representativeness and availability, those films were used to conduct the present study. Fujichrome Provia 400X Professional is currently discontinued, and no references were found to understand the timeframe during which it was produced. The films used for the present study have the emulsion number 104. RXP is an E-6 processing film. In the technical datasheet of the film, a schematic cross-section is represented (Supplementary Materials).

2.2. Cross-Sections

Cross-sections were prepared from both EPT and RXP samples, processed and unprocessed films, to help us to characterize the films under study. To do so, a small sample was removed from the border of the films (about 2 × 2 mm). In chromogenic reversal films, due to the inversion of the image during processing, the borders of the films are black, i.e., the emulsion layer has a high concentration of Y, M, and C dyes. These areas can be used for analysis without compromising the image. This fragment was taped over a small piece of a compact disc (CD) to hold it steady. The CD coating was previously removed mechanically, and the fragment was fixed to the piece of CD plastic with tape. Cross-sections were prepared by using a Leica RM 2155 rotary microtome equipped with low-profile blades Leica DB 80 LX. The assembly previously set was fixed in the specimen clamping system. Slices of 15 μm were cut by using a clean portion of the blade for each cut and making a quick but relatively gentle motion (to obtain a clean cut and avoid ridges and fractures). The cuts were controlled by using a stereomicroscope. The sample slices were placed over a microscope slide and covered with a cover slip. The collected samples were observed under the optical microscope.

2.3. Optical Microscopy

To observe the stratigraphic layers composing EPT and RXP films, microscopy images were acquired using a Zeiss Axioplan 2 Imaging system (HAL 100) coupled to Nikon DXM1200F digital camera and ACT-1 software. A white card was placed on the condenser under the slides to obtain a uniform background in the image. Before photographing the samples, the white spirit was carefully added between the cover glass and the slide with a Pasteur pipette. Reflected polarized light was used.

2.4. Raman Spectroscopy

Raman microscopy was carried out using a Horiba Jobin Yvon LabRAM 300 spectrometer, equipped with a He-Ne laser 17 mW operating at 632.8 nm and coupled to the confocal microscope with high stability Olympus BX41. Micro-samples were collected from both the emulsion of EPT and RXP samples (directly from the film surface) using a micro-tool under a stereomicroscope. An attempt to remove only Y, M, or C emulsion layers was pursued for individual analysis of each dye. The collected micro-samples were placed over a microscope slide. Raman spectra were recorded as extended scans, and the laser beam was focused either with a 50× or a 100× Olympus objective lens or with a 50× Olympus ultra-long working distance (ULWD) objective for depth probing. The Raman microscope allowed for the selection of precise areas of analysis, i.e., of each colored layer individually. The laser power at the surface of the samples was varied with the aid of a set of neutral density filters. Raman spectra were collected between 200 and 2000 cm−1. All spectra are presented without baseline correction.

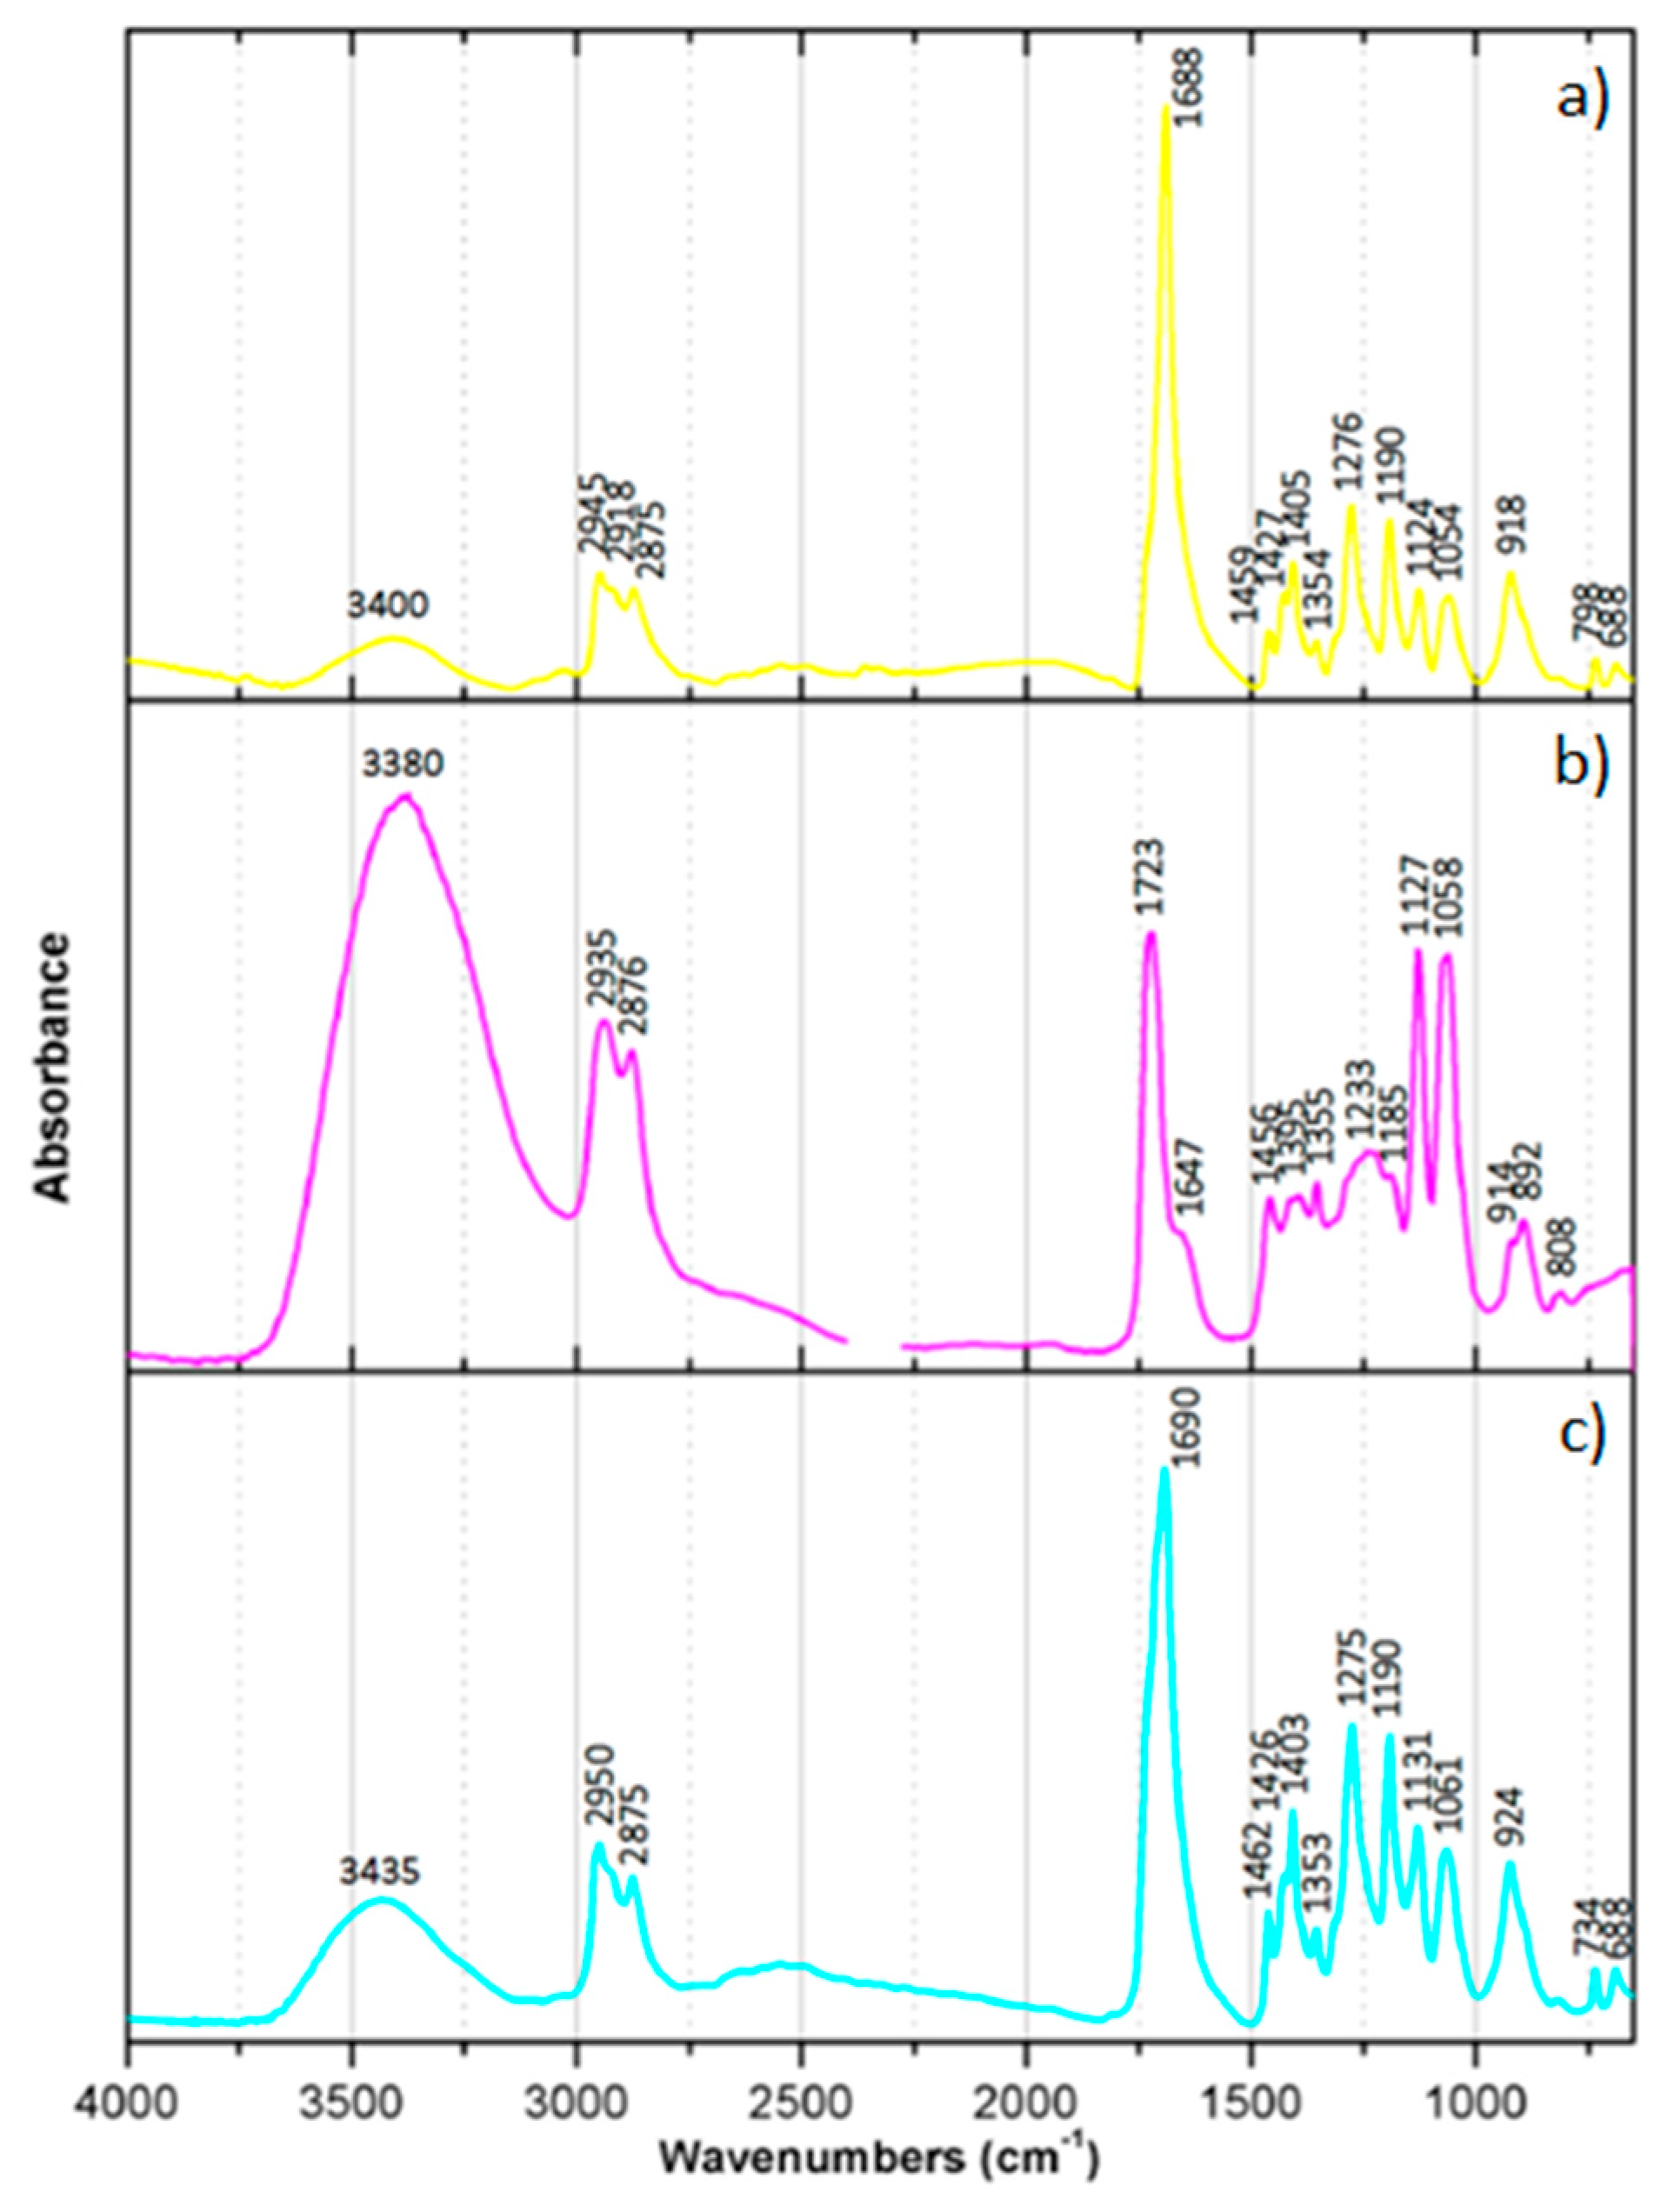
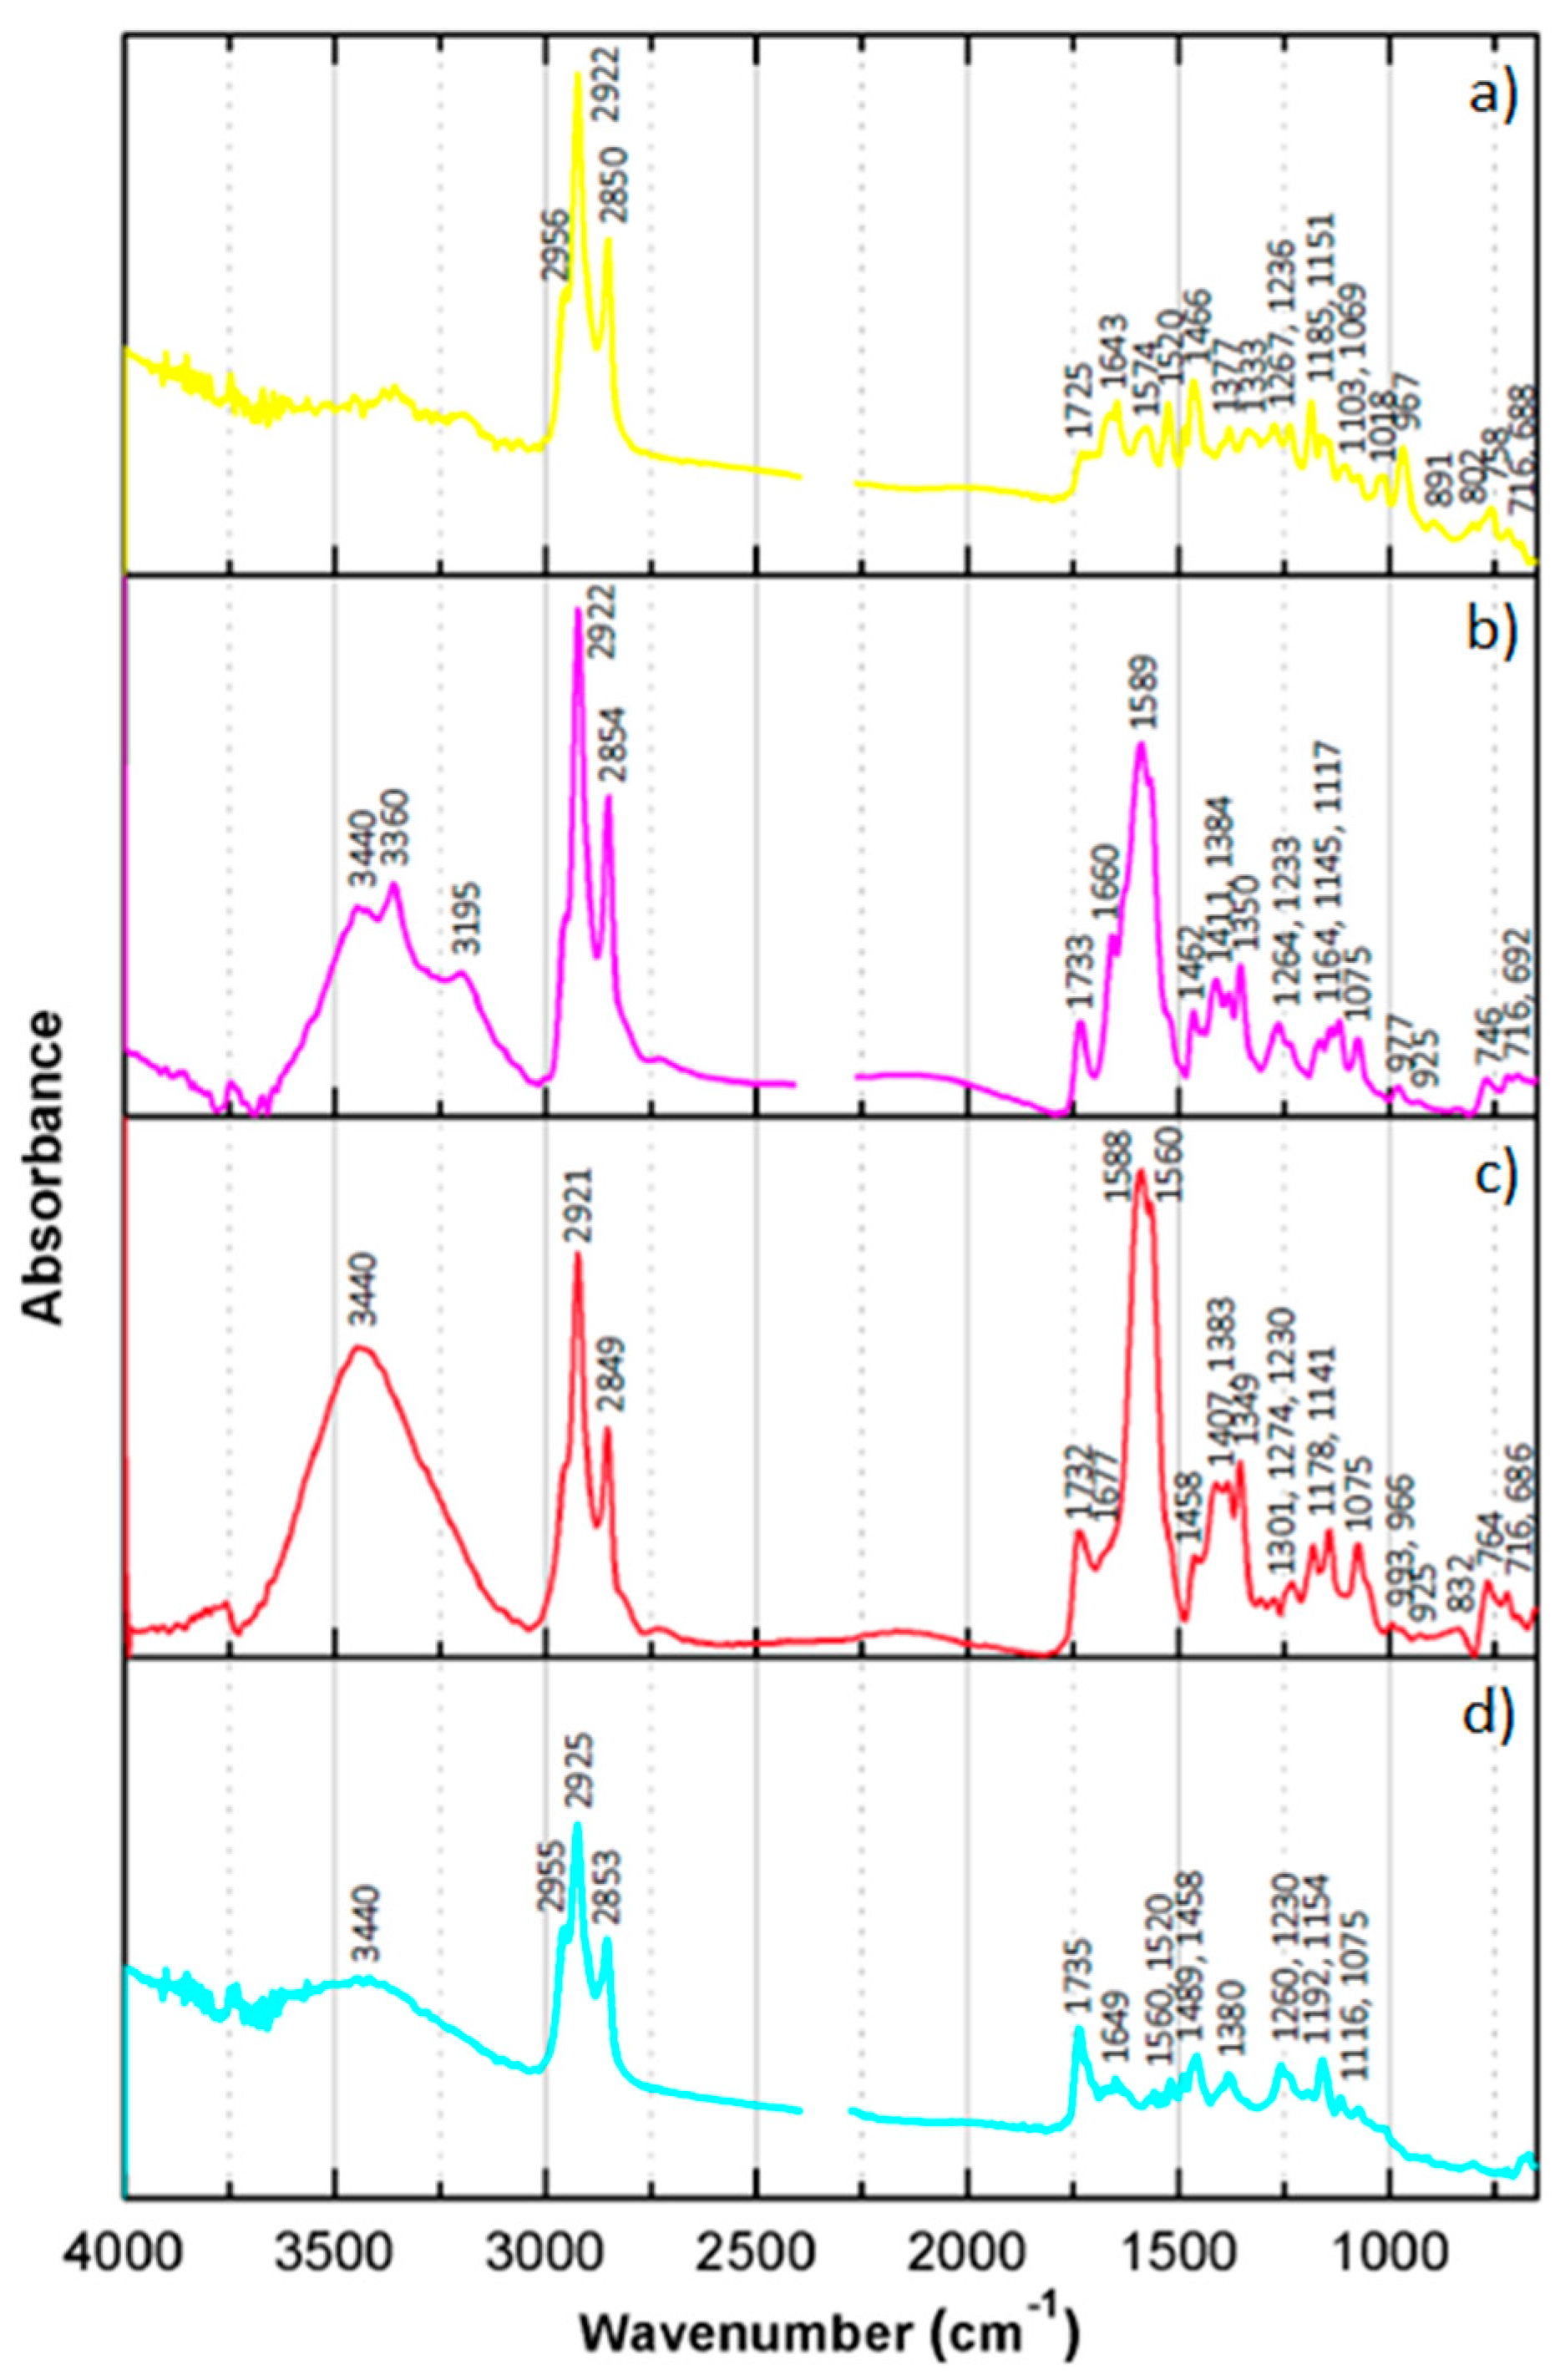
2.5. Extraction of the Dyes

In order to characterize the different dyes present in the films under study, a sample of each emulsion layer was collected by scratching a portion of the black borders from the film (ca. 0.002 g). The collected sample was then added to a volumetric flask containing 2 mL of ethanol and distilled water (3:1, v:v) and left for about 48 h. The extraction process was aided by heating (circa 35 °C) and stirring. After extraction, the solution was filtered through a 0.45 μm Teflon membrane filter and then dried in a round-bottom flask under a stream of nitrogen until completely dry. The extract was then re-dissolved in the desired solvent according to the analysis to be performed.

2.6. Thin-Layer Chromatography (TLC)

Pre-coated silica TLC sheets (ALUGRAM® Xtra SIL G/UV254, Machery-Nagel, Düren, Germany), cut in ca. 2 × 9 cm, were used for the separation of the dyes extracted from both EPT and RXP films. The extracts were dissolved in ethyl acetate (just enough to acquire a concentrated solution) for the elution. Both mixtures from the EPT and RXP were applied on the TLC plate, by putting several drops (ca. 5) on the same spot at the bottom of the TLC plate, using a glass capillary. The TLC plate was then immersed in a beaker containing the mobile phase, covered with a watch glass, to be developed. Based on previous tests, diethyl ether:ethyl acetate (90:10) mobile phase was selected to develop the EPT sample, and ethyl acetate to develop the RXP sample. A filter paper was used to cover the inside walls of the beaker and homogeneously spread the solvent onto the overall volume. The retardation value (Rf) was calculated for the different dyes of both types of samples.
The dyes were also separated with a preparative TLC, to enable their collection and further analysis with other techniques. Silica sheets measuring 20 × 20 cm (DC-Alufolien Kieselgel 60, Merck, New York, NY, USA) were used. EPT and RXP solutions were applied in a line using a piece of cotton placed inside a Pasteur pipette, to which the tip has been removed. The same mobile phases previously described were utilized for the development of the preparative TLC sheets. A glass tray was used for the elution of the TLC sheets. The areas of the silica where the different dyes adsorbed were then scraped with a scalpel, transferred to flasks with ethyl acetate and stirred to allow extraction of the dyes (ca. 30 min). Only the C dye from the RXP sample could not be extracted in ethyl acetate, which was substituted by ethanol. After complete extraction, the mixture was filtered through a paper filter. Each dye from both EPT and RXP samples was gathered separately. The obtained solutions were then dried in a round-bottom flask under a stream of nitrogen.

2.7. Fourier-Transform Infrared Spectroscopy (FTIR)

Infrared analyses were performed with a Nicolet Nexus spectrophotometer. The isolated dyes were examined by placing small droplets of each dye in acetyl acetate solution over a KBr disc (Spectra-Tech Inc., Oak Ridge, TN, USA, 25 × 4 mm), separately. Between each drop placed in the disc the solvent was left to evaporate. Infrared spectra were acquired in transmission mode, from 4000 to 650 cm−1, with 64 scans and 4 cm−1 spectral resolution. Spectral analysis was performed using Omnic E.S.P. 5.2 and OriginPro 8 software. All spectra of the dyes presented were not baseline corrected.

2.8. High-Performance Liquid Chromatography Coupled with Diode Array Detector (HPLC-DAD)

EPT and RXP extracts were also separated with HPLC, and the isolated dyes were characterized with DAD. The tests were carried out in an analytical Thermo Electron, FinniganTM Surveyor® HPLC-DAD system with a Thermo Electron, FinniganTM Surveyor® LC pump, autosampler, and PDA detector, and using a reversed-phase RP18 analytic column (Chromolith, 100 × 4.6 mm). The wavelength range of the detector was 200–800 nm, with a 0.8 s sampling interval and 4 nm resolution. Samples were injected into the column via a Rheodyne injector with a 25 μL loop. The elution gradient used at a flow rate of 1.0 mL min−1 consisted of HPLC-grade methanol (A) and Millipore water containing 0.3% perchloric acid (B). The elution gradient was set as follows (A:B, v:v): 7:93 from 0 to 2 min; 15:85 from 8 to 25 min; 75:25 from 25 to 27 min; 80:20 from 27 to 29 min; and 100:0 from 29 to 40 min.

2.9. High-Performance Liquid Chromatography Coupled to Diode Array Detection and Mass Spectrometry (HPLC-DAD-MS) and Liquid Chromatography–High-Resolution Mass Spectrometry (LC-HRMS)

In order to gather information about the chemical structure of the dyes present in the films, experiments were carried out with mass spectrometry. Due to budget and time constraints, only one of the samples, EPT, was analyzed. The EPT sample was previously analyzed in a low-resolution mass spectrometer coupled to an HPLC-DAD to identify the dyes in the DAD chromatogram through the absorption bands and to correlate their retention time with the corresponding signals observed in the total ion chromatograms. Thereafter, the sample was analyzed in a high-resolution mass spectrometer to identify the m/z values on the high-resolution total ion chromatograms.
HPLC-DAD-MS analysis was performed on a Dionex Ultimate 3000SD system with a diode array detector coupled online to an LCQ Fleet ion trap mass spectrometer (Thermo Scientific, Waltham, MA, USA), equipped with an ESI source. The mass spectrometer was operated in the ESI-positive and negative ion modes, with the following optimized parameters: ion spray voltage, ±4.5 kV; capillary voltage, 16/−18 V; tube lens offset, −70/58 V, sheath gas (N2), 80 arbitrary units; auxiliary gas (N2), 5 arbitrary units; capillary temperature, 270 °C. Spectra typically correspond to the average of 20–35 scans, and were recorded in the range between 100 and 1000 Da. Data acquisition and processing were performed using the software Xcalibur 2.2.
High-resolution mass spectra were acquired on a quadrupole-time-of-flight (QqToF) mass spectrometer (Impact II, Bruker Daltonics, Bremen, Germany) equipped with an ESI source. The spectrometric parameters were set as follows: end plate offset, 500 V; capillary voltage, +4.5/−2,7 kV; nebulizer, 4 bars; dry gas, 8 L.min−1; dry temperature, 200 °C. Internal calibration was achieved with an ammonium formate solution introduced to the ion source via a 20 μL loop at the beginning of each analysis, using a six-port valve. Acquisition was performed in a full scan mode in the m/z 100–1000 range and in a data-dependent MS/MS mode with an acquisition rate of 3 Hz using a dynamic method with a fixed cycle time of 3 s and an m/z-dependent isolation window of 0.03 Da. Data acquisition and processing were performed using Data Analysis 4.2 software.
In both equipments, the separation was achieved on a Cortes C18 column (150 × 2.1 mm, 2.7 μm particle size, Waters) at 35 °C, using a flow rate of 0.3 mL min−1. The mobile phase was 0.1% of acid formic in water (v/v, eluent A) and acetonitrile (eluent B), and the elution gradient (A:B, v:v) was as follows: 70:30 from 0 to 2 min; 0:100 at 20 min to 33 min; 70:30 at 35 min and 10 min of re-equilibration time. The wavelength was monitored between 250 and 700 nm.

3. Results and Discussion

3.1. Optical Microscopy

Based on the microscopy images, EPT and RXP films present a typical structure.
The microscopy images collected from the cross-sections of EPT films, before and after processing, are presented in Figure 2. Before processing, the EPT is composed of: (i) a protective layer on the top of the emulsion layer, (ii) three sensitive colored layers (RGB), (iii) a yellow filter—used to absorb the B light and avoid its transmission to the layers below [7], and (iv) an anti-halation layer upon the film base—made of silver or a mordanted dye within a gelatin binder, prevents light scattering produced by reflection from the transparent support [19]. After processing, the film contains: (ii) a protective layer, (i) three colored layers, Y (top), M (middle), and C (near the base), and (iii) interlayers separating the colored layers—applied to prevent dye dispersion [20]. The film thickness is about 130 μm.
The microscopy images collected from the cross-sections of RXP films, before and after processing, are presented in Figure 3, respectively. By comparing the technical data from the manufacturer and the images obtained with the OM, there are some discrepancies. The film is composed of i) three sensitive layers, B (top), G (middle), and R (near the base), ii) a protective layer on the top of the emulsion layer, and iii) an anti-halation layer upon the film base. However, although the color-correction layer described in the data sheet might be distinguishable in the microscopy images, the one between the G- and B-sensitive layers is not perceptible. Moreover, in the microscopy images, an interlayer between the G- and R-sensitive layers, which is not marked in the scheme from the manufacturer, seems to be present (also visible in the film after processing). On the contrary, the interlayers indicated by the manufacturer (resulting from color correction and yellow filter layers after processing) are not visible in the microscopy images. The thickness of the base seems to correspond to 127 μm.

3.2. Raman Spectroscopy

Individual colored layers of both EPT and RXP samples were analyzed using confocal Raman spectroscopy (Supplementary Material). Since the analysis of the protective layer (gelatin) did not present any signal, and each colored layer presented a different spectrum, the obtained Raman spectra can be assigned to the dyes and/or color couplers present in the emulsion. The main limitation observed during the analysis carried out with this technique, was the presence of some fluorescence in all the collected spectra, probably arising from the gelatin binder and/or impurities present in the emulsion layers [21]. The fluorescence partially overwhelmed the Raman vibrational bands from the compounds of interest. Nevertheless, with some persistence and experience, it was possible to maximize the Raman signal.
Each dye of EPT and RXP samples presented a characteristic Raman spectrum (Figure 4 and Figure 5). Although it was not possible to assign the obtained spectra to classes of color couplers due to the similarity of the dyes molecules and, especially, to the absence of databases, possible assignments of the obtained bands to fragments of molecules present in azomethine and indoaniline dyes in general are presented in Table 2. Both color developer and coupler moieties, conjugated system, and ballasting groups (for instance, long aliphatic chains) were considered. However, it should be stressed that the bands can shift in wavenumber and intensity according to the functional groups surrounding the bonds [22]. In general, at higher wavenumbers (1000–1800 cm−1), C-H deformation, aromatic C-C and C=C, and C-N stretching vibrations can be observed. C-C stretching and C-H deformation modes can be seen between 1500 and 900 cm−1 [22]. Since all chromogenic dyes are from the azomethine or indoaniline family, the C=N vibration characteristic of Schiff bases would be expected near 1640 and 1625 cm−1 [23]. According to Lin-Vien et al. [24], C=N in conjugation with the C=C bond can be shifted toward ca. 1600–1650 cm−1. This characteristic vibration was indeed observed in all spectra from both samples, with the exception of the C dye from the RXP sample. Nevertheless, this spectrum is the one showing higher fluorescence, which might have overcome this peak. On the basis of the literature, the lower wavenumber region (200–1000 cm−1), mainly corresponding to skeletal vibration and ring deformation of the molecules [21], is the most relevant range for the identification of organic pigments [25].

3.3. Thin-Layer Chromatography (TLC)

The dyes from both EPT and RXP chromogenic reversal films were successfully separated with silica TLC sheets. The fact that two different solutions had to be used to elute each sample to achieve a proper separation of the dyes immediately points to films composed of different dyes. The results of the separation are presented in Table 3.
The EPT sample presents three spots in the TLC sheet, which can clearly be associated with M, Y, and C dyes, being Rf (M) < Rf (Y) < Rf (C). In a TLC sheet, the different compounds of the mixture travel at different rates based on their interactions with the stationary phase and solubility in the mobile phase [26]. In a normal phase silica plate (polar), the most polar compound has a stronger interaction with silica leading to a stronger binding to the stationary silica phase in the TLC sheet. On the contrary, the less polar compound moves along with the mobile phase up to the sheet [26]. Thus, it can be concluded that M is the most polar dye from the EPT sample, followed by Y and, finally, C dyes. Apart from M, Y, and C dyes, a faint bluish-gray spot just below the yellow one is discernible under visible light. As suggested by Di Pietro [5], faint spots can be related to the aging of the films that caused the breakdown of some dye molecules. Since the film under study should be dated from the end of the 1970s, this hypothesis can be applied to the EPT sample. Considering the color of the faint spot, it could be associated with the degradation of the C dye. The TLC sheets used in this study have a fluorescent indicator, making it possible to detect colorless compounds not noticeable under visible light. By observing the obtained TLC sheet under UV light, it can be concluded that the EPT film also contains colorless compounds, which were separated by the TLC plate. Those compounds can be associated with residual color couplers and/or other components added to the photographic emulsion, such as white couplers, scavengers, antioxidants, and/or UV absorbers [14].
Regarding the results from the separation of the RXP chromogenic reversal film, the TLC sheet also shows the separation of colored components. In this case, one C, two M, and one Y were separated, being Rf (C) < Rf (M1) < Rf (M2) < Rf (Y). Therefore, in this film, C is the most polar dye, followed by M and finally Y dyes. Since only one of each sensitive layer was detected in the cross-section observed under the OM, these results might indicate the presence of two different M dyes in the same G sensitive layer. According to several authors, more than one layer of the same sensitive color has been used to improve color accuracy. However, no references were found describing different dyes applied in the same sensitive layer. Alternatively, one of the M compounds might be associated with a degradation product of the M dye, leading to a sub-product with a different Rf (similarly with EPT sample). However, based on Di Pietro’s study [5], aged films give rise to a second, much fainter color with the same hue, and in this case, two different Ms with similar intensity but different hues were obtained. The TLC sheet was also observed under UV light. As with the EPT sample, several colorless spots were detected.

3.4. Fourier-Transform Infrared Spectroscopy (FTIR)

The dyes isolated from the preparative TLC were individually analyzed with IR spectroscopy in order to gather more information about the molecules. The obtained spectra are presented in Figure 6 and Figure 7. As with Raman spectroscopy, it was not possible to identify color coupler classes, mainly due to the absence of databases. Nevertheless, the bands obtained in the FTIR spectra, from the EPT and RXP samples were assigned to characteristic functional groups from azomethine and indoaniline dyes.
IR spectroscopy is a highly effective technique to detect OH and NH stretching. Both these groups can be assigned to the obtained bands at ca. 3400 cm−1. All dyes also present double or triple bands at ca. 2900–2800 cm−1. Methyl and methylene groups result in doublets with slightly different frequencies due to C-H stretching at ca. 2900–2800 cm−1. Triple bands in this same region can be derived from C-H stretching vibrations. Infrared spectroscopy is very sensitive to carbonyl species, producing sharp peaks in a broad range between 1900 and 1550 cm−1. The imide bond (C=N), characteristic of azomethine and indoaniline dyes, is normally visible between 1690 and 1630 cm−1. All dyes from both samples seem to present this band, although sometimes overlapping with the C=O peak. Additionally, C=C stretching bands can normally be found between 1680 and 1600 cm−1. The conjugation with other double bonds can decrease the frequency of these bands. Aromatic compounds normally present bands between 1620 and 1420 cm−1 and methyl and methylene groups between 1500 and 1250 cm−1. Therefore, the bands found in those ranges could be assigned to these groups. At lower wavenumbers, C-O stretching vibrations (between 1300 and 750 cm−1) and C-H wag (between 1000 and 600 cm−1) can normally be observed. The position of these bands is highly dependent on the proprieties of the substituents. The bands ranging from 900 to 500 cm−1 could also be assigned to O-H, N-H, and NH2 wag [26]. A summary of possible assignments for chromogenic dyes is presented in Table 4. In general, each dye in both samples seems to present a characteristic spectrum, with the exception of C and Y dyes from EPT that show spectra with great similarities. Slight differences in the M spectra from RXP point to the application of different dyes in the same film. Unfortunately, it was difficult to acquire suitable spectra from the Y and C dyes of the RXP sample.

3.5. High-Performance Liquid Chromatography Coupled with Diode Array Detection (HPLC-DAD)

The dyes from both EPT and RXP samples were separated and analyzed with HPLC-DAD. The retention times (Rt) and absorption maxima of the compounds are presented in (Supplementary Materials).
After many attempts to improve the elution system, it was possible to separate all peaks of interest in both samples.
However, regarding the EPT sample, the three dyes were eluted at the end of the elution program (after 31 min) when only methanol was running in the system. Moreover, the Rt of the C and Y dyes are too close to each other, and there is a superimposition of the dye peaks, as presented in the chromatogram collected at 260 nm (Figure 8). The faint bluish spot observed in the TLC sheet was not clearly identified with the HPLC analysis. Species absorbing in the UV region and non-absorbing in the visible region of the electromagnetic spectrum were detected. These components can consist of color couplers and other components added to the photographic emulsion, such as already mentioned in the results obtained with TLC. M was the first dye to be eluted. Since a reversed-phase analytic column was used, it is expected that non-polar molecules tend to be retained in the column for a longer period of time, and polar molecules eluted faster. Within this system, non-polar molecules are eluted by lowering the polarity of the mobile phase. Thus, as already concluded from the TLC experiment, M dye, presenting the lower Rt, is the most polar dye from the EPT film, followed by C and Y dyes. However, possibly due to the inefficacy of the elution program, in the HPLC-DAD analysis, the C dye was eluted before the Y dye (although almost simultaneously). Moreover, the eluents used for the two analyses (TLC and HPLC-DAD) were different, and a straight comparison cannot be established. Nevertheless, it is possible to distinguish three absorption bands associated with each dye (Figure 8). The M dye has an intense absorption in the G region (at 551 nm) and a less intense band in the B region (at circa 430 nm), as a shoulder on the shorter wavelength side of the principal absorption band. According to R. J. Berry [27], M dyes from the pyrazolone family have a characteristic double absorption band with a similar shape arising from two different electronic transitions. Thus, the M dye from the EPT film could be from that family. Pyrazolones were the M couplers of choice until the 1980s [6]; in particular, 3-acylaminopyrazolones were used in reversal films up to the end of the 1980s [5]. Considering that EPT was used to produce Slides de Cavalete in 1978–1979, this attribution is congruent. Unfortunately, azomethine dyes resulting from pyrazolone M couplers are normally unstable [5]. C and Y present a well-defined band in the R and B regions of the visible spectrum at 663 nm and 442 nm, respectively. However, due to the proximity of their Rt, a slight absorption in the R region of the Y spectrum can be observed. Since this side absorption was not observed in the analysis performed with the HPLC-DAD-MS equipment, with which a better separation was achieved (as described next), it can be asserted that it resulted from the superimposition of the C and Y peaks. No references were found concerning the characteristic absorption spectra of C and Y dyes from different families.
The same types of results were achieved for the RXP sample. As with the TLC experiment, four different dyes were isolated. Although all peaks of interest were separated with the selected elution program, as with the EPT sample, all dyes were only eluted at the end of the run. In this case, the Y and M dyes were well isolated, but other M and C dyes were eluted very closely. Therefore, there is a partial superimposition of the Y and C dye peaks, as presented in the chromatogram collected at 260 nm (Figure 9). C was the first dye to be eluted, immediately followed by one of the M dyes. Contrarily to the TLC separation, the HPLC experiment led to the separation of the Y before the second M dye. High-intensity peaks absorbing in the UV region and non-absorbing in the visible region of the electromagnetic spectrum can be distinguished in the chromatogram. As previously mentioned, these can be associated with residual color couplers and/or other components present in the photographic emulsion. The absorbance spectrum of each dye was recorded in the UV-vis region (Figure 9). The C and Y dyes have well-defined absorption bands with maxima at 651 nm and 451 nm, respectively. These dyes present different absorption maxima and Rt compared to EPT dyes with the same colors. The first M dye has an intense absorption at 546 nm and a slight absorption in the R region, possibly due to the proximity of the Rt from the C and M dyes. The second M dye has a single absorption band at 551 nm, pointing out to a different M specie. Although the second magenta has an absorption maximum with the same wavelength as the M dye from the EPT sample, the spectra of the two compounds are clearly different. Considering that both M dyes from the RXP sample have a single absorption band, it can be concluded that they are not from the pyrazolone family. M dyes from the pyrazoloazole family have no secondary B absorption as pyrazolone dyes, having a sharp cut-off on the long wavelength side resulting from a single electronic transition in the visible spectral region [27]. Since in the 2000s, the use of pyrazoloazoles was widespread [6], it is likely that both M dyes from the RXP film are from that family.

3.6. High-Performance Liquid Chromatography Coupled to Diode Array Detection and Mass Spectrometry (HPLC-DAD-MS) and Liquid Chromatography–High-Resolution Mass Spectrometry (LC-HRMS)

In order to obtain some elucidation on the chemical structure of the dyes identified by HPLC-DAD, the EPT sample was also analyzed by HPLC-DAD-MS and LC-HRMS. The results were too difficult to interpret without a database due to the complexity and variability of the chromogenic dyes. Nevertheless, the separation provided by the HPLC-DAD-MS equipment was more effective than the separation with HPLC-DAD previously described, and together with the HRMS data, some valuable information could be obtained.
The chromatographic profiles obtained by DAD and HRMS in the ESI-positive mode, together with the extracted ion chromatograms and mass spectra for the three protonated molecules identified, are illustrated in Figure 10.
In the first step, the sample was analyzed by HPLC-DAD-MS. The DAD chromatogram acquired at 260 nm displays several groups of peaks but only three of them present maximum wavelengths values at 549 nm (tR 19.40 min), 440 nm (tR 20.89 min), and 662 nm (tR 21.19 min), indicating the presence of three different families of dyes. The order of elution follows that one observed in the TLC analysis, confirming that M is the most polar dye, followed by Y and C. From the correlation between the retention time of each dye peak in the DAD chromatogram and the corresponding signal identified in the total ion chromatograms acquired in both ESI modes, a probable m/z value was obtained for the (de)protonated molecule of each dye. The isotopic distribution profiles of m/z values indicate that M and Y dyes contain chloride or bromide in their molecular structures, while C dye only contains heteroatoms oxygen and nitrogen in its molecular rearrangement. The EPT extract was further analyzed by LC-HRMS/MS in both ionization ESI modes, and accurate mass measurements for the (de)protonated molecules were determined. The tandem mass spectrum for each precursor ion was also obtained, trying to obtain some features on the ionic structure of each species. The data demonstrated that M dye displays a group of peaks at 938.3011/940.2987. The observed isotopic distribution pattern agrees well with a calculated isotopic distribution containing three chloride atoms in the ionic structure. This result support previous assumptions that M dye is associated with pyrazolone-type couplers. Moreover, the accurate mass measurement also indicates that the ionic molecular structure does not seem to contain a sulfur atom, suggesting that the dye coupler may belong to a pyrazolone four-equivalent type [6]. The next eluting peak assigned to a Y dye, with an intense absorption band at 440 nm and a lower band at 333 nm, was attributed to a group of peaks at m/z 824.4228/826.4264, with an isotopic distribution pattern indicating the presence of one chloride in the ionic structure, or one chloride plus one or two sulfur atoms. The presence of the sulfur atoms only introduces a small alteration in the intensity of the second isotopic peak of the isotopic pattern. Given that the isotopic distribution has very low signals, it is difficult to confirm the presence or absence of sulfur atoms in the isotopic profile. However, the observed isotopic pattern clearly indicates that only a chloride atom is present in the ionic structure of the (de)protonated molecule. Based on this result, it can be suggested that Y dye has a pivaloylacetanilide-type coupler [4]. Finally, C dye provided a signal at m/z 918.4082, the isotopic distribution pattern confirming that no chloride or bromide atoms are present in its molecular structure. This result can support the assumption that C dye is associated with diacylaminophenols coupler types [6]. However, LC-DAD-HRMS experiments on known couplers/dyes are fundamental to fully interpreting the class of color coupler associated with the dyes from the EPT sample.

4. Conclusions

Within the present study, different spectroscopic and chromatographic techniques have been tested with the aim of outlining suitable procedures for the characterization of chromogenic dyes and paving the way for the molecular identification of dyes present in chromogenic reversal films.
Raman spectroscopy has shown the ability to characterize chromogenic dyes. Micro-samples were collected from the borders of the chromogenic reversal films under study in order to analyze C, M, and Y emulsions separately. The confocal microscope of the equipment was used to select the desired colored areas. The dyes from EPT and RXP samples produced different Raman spectra.
Chromatographic techniques also proved to be powerful tools for isolating and characterizing chromogenic dyes. As a major disadvantage, all tested chromatographic techniques require the collection and destruction of a small sample. However, considering that the borders of chromogenic reversal films can be used to remove a sample without compromising the image and that the analysis of one sample can bring insights into several works (of the same model/batch), collecting a sample can be easily justified. TLC has the advantage of giving immediate and easy-to-interpret information by displaying colored spots in the TLC sheet. By calculating the Rf of the separated dyes, additional information about the compounds under study was gathered. Knowing that every molecule has a specific Rf value for a specific solvent and solvent concentration, TLC analysis provides evidence of the identity of the compound. Additionally, the time and cost associated with this type of analysis are substantially lower when compared with liquid chromatography. Most importantly, by using preparative TLC, the separated compounds can be isolated and used for further analysis. In the present study, the isolated dyes were characterized with IR spectroscopy. The collected IR spectra provided fingerprint spectra of C, M, and Y dyes from EPT and RXP samples. HPLC has also been traced as a useful technique for the characterization of chromogenic dyes. As in TLC, the Rt associated with each dye in a specific HPLC equipment separated with a given elution program offers additional information about the molecules. Coupled with DAD, the absorbance spectra of each dye can be observed. The shape and maximum of the absorbance spectrum of a dye in the visible region can provide a clue to differentiate and characterize the different samples. Based on the shape of the M dyes, it is proposed that M from EPT is from the pyrazolone family. The absorbance spectra collected in DAD also worked as background information for the analysis with MS. Thereby, the peaks of interest (dyes) were selected and analyzed with MS. The collected data demonstrated that M dye displays an isotopic distribution containing three chloride atoms in the ionic structure and a sulfur atom, suggesting that the dye may be derived from the pyrazolone four-equivalent-type coupler. The isotopic distribution pattern of the Y dye clearly indicates that only a chloride atom is present in the ionic structure of the (de)protonated molecule, suggesting that it might be a pivaloylacetanilide-type coupler. Finally, C dye has an isotopic distribution pattern confirming that no chloride or bromide atoms are present in its molecular structure, leading us to propose that it might be from the diacylaminophenols coupler type.
The main difficulty encountered within the investigation was the inexistence of references to support the assignment of the obtained results to specific families of chromogenic dyes. Although the tested analytical techniques have shown promising results, building databases of chromogenic dyes for Raman and IR spectroscopies, as well as MS, might be the key to the identification of these materials.

Supplementary Materials

The following supporting information can be downloaded at: https://www.mdpi.com/article/10.3390/heritage5040203/s1, Figure S1: Ektachrome 160T Professional (EPT) found in Ângelo de Sousa’s archive: unprocessed roll (left), and sample/film tip used for the investigation carried out within this study (right); Figure S2: Fujichrome Provia 400X Professional (RXP) found in Ângelo de Sousa’s archive: unprocessed roll (left), and commercial box where the expiration date is visible (right); Figure S3: Schematic cross-section of Fujichrome Provia 400X Professional (RXP) (data sheet from the manufacturer); Figure S4: Microscopy image of a micro-sample collected from Ektachrome 160T Professional (EPT) for analysis with Raman spectroscopy, where yellow, magenta and cyan layers are discernible; Table S1: Absorbance maximum (λmax) and retention times (Rt) of dyes extracted from Ektachrome 160T Professional (EPT) and Fujichrome Provia 400X Professional (RXP).

Author Contributions

J.S.: development of the research study, carrying out the experimental analysis, writing (original draft preparation); A.J.P.: supervision of the TLC analysis, writing (review and editing); M.C.O.: supervision of the HPLC-DAD MS analysis, writing (review and editing); B.L.: supervision of the research study, writing (review and editing); A.M.R.: supervision of the research study, writing (review and editing). All authors have read and agreed to the published version of the manuscript.

Funding

This research was supported by Fundação para a Ciência e Tecnologia, Ministério da Ciência, Tecnologia e Ensino Superior (FCT/MCTES), Portugal, through doctoral program CORES-PD/00253/2012, PhD grant SFRH/BD/52317/2013, and Associate Laboratory for Green Chemistry- LAQV financed by national funds (UIDB/50006/2020 and UIDP/50006/2020). This work was also funded through RNEM (Portuguese Mass Spectrometry Network) (LISBOA-01-0145-FEDER-022125–IST).

Institutional Review Board Statement

Not applicable.

Informed Consent Statement

Not applicable.

Data Availability Statement

Not applicable.

Acknowledgments

The authors would like to thank Douglas Nishimura and Stephanie Hofner, researchers from the Image Permanence Institute, for telling us how to prepare cross-sections of chromogenic reversal films; Maria João Melo, full professor at the Conservation and Restoration Department from NOVA School of Science and Technology, who shared her valuable knowledge about HPLC and FTIR analytical techniques; Paula Nabais and Tatiana Vitorino, researchers at the Conservation and Restoration Department from NOVA School of Science and Technology, for helping us with the HPLC-DAD analysis; Eva Mariasole and Artur Neves, researchers at the Conservation and Restoration Department from NOVA School of Science and Technology, who helped us with the Raman analysis.

Conflicts of Interest

The authors declare that they have no competing interest.

References

  1. Reilly, J.M. The Storage Guide for Colour Photographic Materials; Image Permanence Institute: Rochester, NY, USA, 1998. [Google Scholar]
  2. Pénichon, S. Twentieth-Century Colour Photographs: The Complete Guide to Processes, Identification and Preservation; Thames and Hudson: London, UK, 2013. [Google Scholar]
  3. Current, I. Photographic Color Printing: Theory and Technique, 1st ed.; Focal Press: Waltham, MA, USA, 1987. [Google Scholar]
  4. Bergthaller, P. Couplers in Colour photography—Chemistry and Function, Part I. Imaging Sci. J. 2002, 50, 153–186. [Google Scholar] [CrossRef]
  5. Di Pietro, G. Examples of Using Advanced Analytical Techniques to Investigate the Degradation of Photographic Materials. In Physical Techniques in the Study of Art, Arqueology and Cultural Heritage; Creagh, D.D., Bradley, D., Eds.; Elsevier: Oxford, UK, 2007; Volume 2, pp. 178–196. [Google Scholar]
  6. Bergthaller, P. Couplers in Colour photography—Chemistry and Function, Part II. Imaging Sci. J. 2002, 50, 187–230. [Google Scholar] [CrossRef]
  7. Fujita, S. Organic Chemistry of Photography; Springer: Berlin/Heidelberg, Germany, 2004. [Google Scholar]
  8. Rauch, E.B. The Chemistry of Color Development. In Color: Theory and Imaging Systems; Eynard, R., Ed.; Society of Photographic Scientists and Engineers: London, UK, 1973; pp. 209–223. [Google Scholar]
  9. Jesper, C. Degradation of Chromogenic Photoworks. Master’s Thesis, Utrecht University, Utrecht, The Netherlands, 2015. [Google Scholar]
  10. Wilhelm, H.; Brower, C. The Permanence and Care of Colour Photographs: Traditional and Digital Colour Prints, Colour Negatives, Slides, and Motion Pictures; Preservation Publishing Company: Des Moines, IA, USA, 1993. [Google Scholar]
  11. Bergthaller, P. Couplers in Colour photography—Chemistry and Function, Part III. Imaging Sci. J. 2002, 50, 233–276. [Google Scholar] [CrossRef]
  12. Tuite, R. Image Stability in Colour Photography. In Issues in the Conservation of Photographs; Norris, D.H., Gutierrez, J.J., Eds.; Getty Publications: Los Angeles, CA, USA, 1979; pp. 471–489. [Google Scholar]
  13. Lavédrine, B. A Guide to the Preventive Conservation of Photograph Collections; Getty Publications: Los Angeles, CA, USA, 2003. [Google Scholar]
  14. Fenech, A. Lifetime of Chromogenic Colour Photographs in Mixed Archival Collection. Ph.D. Thesis, UCL Bartlett School of Graduate Studies and Centre for Sustainable Heritage, London, UK, 2011. [Google Scholar]
  15. Longoni, M.; Ferretti, F.; Zucca, S.; Caielli, L.; Bruni, S. Surface-Enhanced Raman Spectroscopy for the Investigation of Chromogenic Motion Picture Films: A Preleminary Study. Chemosensors 2022, 10, 101. [Google Scholar] [CrossRef]
  16. Silva, J.; Ferreira, J.L.; Ávila, M.J.; Ramos, A.M. The Past and the Future Display of the Slide-Based Artwork Slides de Cavalete (1978–1979) by Ângelo de Sousa. In Revista de História da Arte 14—The Exhibition: Histories, Practices and Politics; Baião, J., Oliveira, L., Martins, S.S., Eds.; Instituto de História da Arte: Lisbon, Portugal, 2019; pp. 187–203. [Google Scholar]
  17. Silva, J. Ângelo de Sousa’s Photographic and Film Collection: Strategies for the Preservation of Colour Slide-Based Artworks. Ph.D. Thesis, Universidade NOVA de Lisboa, Lisboa, Portugal, 2019. [Google Scholar]
  18. Waller, D.; Hinz, Z.J.; Filosa, M. Dyes Used in Photography. In Colorants for Non-Textile Applications; Freeman, H.S., Peter, A.T., Eds.; Elsevier Science: Amsterdam, The Netherlands, 2000; pp. 61–130. [Google Scholar]
  19. Bello, H.J. Color Negative and Positive Silver Halide Systems. In Color: Theory and Imaging Systems; Eynard, R.A., Ed.; Society of Photographic Scientists and Engineers: London, UK, 1973; pp. 266–287. [Google Scholar]
  20. Bouchard, M.; Rivenc, R.; Menke, C.; Learner, T. Micro-FTIR and micro-Raman study of paints used by Sam Francis. E Preserv. Sci. 2009, 6, 27–37. [Google Scholar]
  21. Vandenabeele, P.; Moens, L.; Edwards, H.G.M.; Dams, R. Raman spectroscopy database of azo pigments and application to modern art studies. J. Raman Spectrosc. 2000, 31, 509–517. [Google Scholar] [CrossRef]
  22. Ropret, R.; Centeno, S.A.; Bukovec, P. Raman identification of yellow synthetic pigments in modern and contemporary paintings: Reference spectra and case studies. Spectrochim. Acta Part A 2008, 69, 496–497. [Google Scholar] [CrossRef] [PubMed]
  23. Lin-Vien, D.; Colthup, N.B.; Fateley, W.G.; Grasselli, J.G. The Handbook of Infrared and Raman Characteristic Frequencies of Organic Molecules; Academic Press: London, UK, 1991. [Google Scholar]
  24. Scherrer, N.C.; Stefan, Z.; Françoise, D.; Anette, F.; Renate, K. Synthetic organic pigments of the 20th and 21st century relevant to artist’s paints: Raman spectra reference collection. Spectrochim. Acta Part A 2009, 73, 505–524. [Google Scholar] [CrossRef] [PubMed]
  25. Strieger, M.F.; Hill, J. Scientific Tools for Conservation: Thin-Layer Chromatography for Binding Media Analysis; Getty Publications: Los Angeles, CA, USA, 1996. [Google Scholar]
  26. Larkin, P.J. Infrared and Raman Spectroscopy, Principles and Spectral Interpretation; Elsevier: Oxford, UK, 2011. [Google Scholar]
  27. Berry, R.J. Photophysics and Photochemistry of Indoanaline Photographic Dyes. Ph.D. Thesis, University of Wales, Wales, UK, 1998. [Google Scholar]
Figure 1. Schematic representation of yellow, magenta, and cyan dyes, resulting from the coupling reaction with a benzoylacetanilide, pyrazolone, and substituted naphthol type of color coupler, respectively.
Heritage 05 00203 g001
Figure 2. Microscopy image of a cross-section from Ektachrome 160T Professional (EPT): (a,b) before processing; (c,d) after processing.
Heritage 05 00203 g002
Figure 3. Microscopy image of a cross-section from Fujichrome Provia 400X Professional (RXP): (a,b) before processing; (c,d) after processing.
Heritage 05 00203 g003
Figure 4. Raman spectra of the dyes from Ektachrome 160T Professional (EPT): (a) yellow, (b) magenta, and (c) cyan.
Heritage 05 00203 g004
Figure 5. Raman spectra of the dyes from Fujichrome Provia 400X Professional (RXP): (a) yellow, (b) magenta, and (c) cyan.
Heritage 05 00203 g005
Figure 6. Infrared spectra of the dyes from Ektachrome 160T Professional (EPT): (a) yellow, (b) magenta, and (c) cyan.
Heritage 05 00203 g006
Figure 7. Infrared spectra of the dyes from Fujichrome Provia 400X Professional (RXP): (a) yellow, (b) first magenta, (c) second magenta, and (d) cyan.
Heritage 05 00203 g007
Figure 8. Ektachrome 160T Professional (EPT) chromogenic reversal film: (a) HPLC-DAD chromatogram acquired at 260 nm, where three different dyes can be identified (marked with a colored circle), and spectral absorbance of the isolated dyes, (b) magenta (λmax = 551 nm), (c) cyan (λmax = 663 nm), and (d) yellow (λmax = 442 nm).
Heritage 05 00203 g008
Figure 9. Fujichrome Provia 400X Professional (RXP) chromogenic reversal film: (a) HPLC-DAD chromatogram acquired at 260 nm, where four different dyes can be identified (marked with a colored circle), and spectral absorbance of the individual dyes (b) cyan (λ = 651 nm), (c) magenta (λ = 546 nm), (d) yellow (λ = 451 nm), and (e) magenta (λ = 551 nm).
Heritage 05 00203 g009
Figure 10. HPLC-DAD-HR/MS analysis of sample Ektachrome 160T Professional (EPT): (a) DAD chromatogram obtained between 400 and 650 nm; (b) total ion chromatogram obtained in the ESI-positive mode; extracted ion chromatograms, mass spectra and proposed ionic structures for the protonated molecules (c) m/z 938.3011 (Δ −1.1 ppm) attributed to [C54H51Cl3N5O4]+; (d) m/z 824.4238 (Δ+1.1 ppm) assigned to [C45H63ClN3O9]+and (e) m/z 918.4082 (Δ+0.8 ppm) attributed to [C42H60N7O16]+. In the inserts (c’e’), the black signals correspond to the calculated isotopic profiles for the proposed ionic structures.
Heritage 05 00203 g010
Table 1. Molecular structure of the main classes of color couplers employed in chromogenic photography and respective family of dye produced during development.
Color Coupler (Class)Dye (Family)
Benzoylacetanilides
Heritage 05 00203 i001
Azomethine
Heritage 05 00203 i002
Pivaloylacetanilides
Heritage 05 00203 i003
Malondiamides
Heritage 05 00203 i004
Cycloalkanoylacetanilides
Heritage 05 00203 i005
Pyrazolones
Heritage 05 00203 i006
Azomethine
Heritage 05 00203 i007
Pyrazoloazoles
Heritage 05 00203 i008
Substituted phenols
Heritage 05 00203 i009
Indoaniline
Heritage 05 00203 i010
Substituted naphthols
Heritage 05 00203 i011
Table 2. Characteristic Raman vibrations possibly assignable to azomethine and indoaniline dyes [20,23] for the spectra of yellow, magenta and cyan dyes from Ektachrome 160T Professional (EPT) (Figure 4) and from Fujichrome Provia 400X Professional (RXP) (Figure 5).
Wavenumber
(cm−1)
Type of VibrationAssignment
ca. 1700–1800C=O stretchingNot specific
ca. 1700–1600C=N and C=C stretchingNot specific
ca. 1600–1650C=N stretchingSchiff base
ca. 1600Ring vibrationAromatic compound
ca. 1630–1550Ring stretchingBenzene derivatives
ca. 1535–1560NO2 asymmetric stretchingNitro alkanes
ca. 1490Ring vibrationAzobenzene
ca. 1480–1470OCH2 and OCH3 deformationAliphatic ethers
ca. 1473–1446CH2 and CH3 deformationn-alkanes
ca. 1395–1345NO2 symmetric stretchingNitro alkanes
ca. 1385–1368CH3 symmetric deformationn-alkanes
ca. 1370–1290C-H deformationsAromatic compounds and aliphatic side-chains
ca. 1320–1360NO2 asymmetric stretchingAromatic compound
ca. 1310–1175CH2 twist and rockn-alkanes
ca. 1305–1295CH2 in-plane twistn-alkanes
ca. 1300C-C stretching and C-H bending Azo compounds
ca. 1230–1200Ring vibrationPara disubstituted benzenes
ca. 1200 and 1130 C-N stretching and bending Azo compounds
ca. 1175 and 1140 C-N stretching and bending Azo compounds
ca. 1150–950C-C stretchingn-alkanes
ca. 1160SO2 symmetric stretchingSO3 groups
ca. 1060–1020Ring vibrationOrtho disubstituted benzenes
ca. 1030–1015In-plane CH deformationMonosubstituted benzene
ca. 1000 Monosubstituted benzene
ca. 992Ring breathingBenzene
ca. 950 Benzylamide
ca. 930–830C-O-C symmetric stretchingAliphatic ethers
ca. 905–837C-C skeletal stretchingn-alkanes
ca. 830–720 Para disubstituted benzenes
ca. 825NO2 scissoringAromatic compound
ca. 630–615Ring deformationMonosubstituted benzene
ca. 620Ring deformationAromatic compound
ca. 450C=O bendingNot specific
ca. 425–150Chain expansionn-alkanes
ca. 350O-C-C in-plane rockingNot specific
Table 3. Results from the TLC analysis conducted on Ektachrome 160T Professional (EPT) and Fujichrome Provia 400X (RXP).
Ektachrome 160T Professional (EPT)Fujichrome Provia 100X (RXP)
TLC Plate
(under Vis Light)
TLC Plate
(under UV Light)
TLC Plate
(under Vis Light)
TLC Plate
(under UV Light)
Heritage 05 00203 i012 Heritage 05 00203 i013 Heritage 05 00203 i014 Heritage 05 00203 i015
Heritage 05 00203 i016Cyan dye-Rf = 0.50
Yellow dye-Rf = 0.31
Magenta dye-Rf = 0.05
Heritage 05 00203 i017Yellow dye-Rf = 0.64
Magenta dye-Rf = 0.59
Magenta dye-Rf = 0.36
Cyan dye-Rf = 0.09
Table 4. Characteristic IR vibrations possibly assignable to azomethine and indoaniline dyes [23,26] for the spectra of dyes from Ektachrome 160T Professional (EPT) (Figure 6) and from Fujichrome Provia 400X Professional (RXP) (Figure 7).
Wavenumber (cm−1)Type of VibrationAssignment
ca. 3550–3230O-H stretchingNot specific
ca. 3550–3250N-H stretchingNot specific
ca. 3200–2980C-H stretching Unsaturated hydrocarbons
ca. 2975–2950
ca. 2885–2865
C-H stretchingMethyl groups
ca. 2835C-H stretchingMethoxy groups
ca. 2940–2915
ca. 2870–2840
C-H stretchingMethylene groups
ca. 1900–1550C=O stretchingNot specific
ca. 1680–1600C=C stretchingUnsaturated hydrocarbons
ca. 1690–1630C=N stretchingSchiff base
ca. 1580–1475
ca. 1390–1320
N=O stretching Aliphatic and aromatic groups
ca. 1400–1390
ca. 1410
N=O stretching Aromatic cis nitroso groups
ca. 1300–1250N=O stretching Aromatic trans nitroso groups
ca. 1600–1580Ring quadrant stretchingAromatic compounds
ca. 1600–1500Ring stretchingHeteroaromatic compounds
ca. 1500–1460Ring semi-circle stretchingAromatic compounds
ca. 1480–1430CH2 scissors deformation and
CH3 out-of-phase deformation
Methyl and methylene groups
ca. 1378CH3 in-phase deformationAliphatic groups
ca. 1300–750C-O stretchingNot specific
ca. 1000–600C-H wagNot specific
ca. 900–700C-H wagAromatic compounds
ca. 900–500X-H wagNot specific
Publisher’s Note: MDPI stays neutral with regard to jurisdictional claims in published maps and institutional affiliations.

