Article

Exploring the Role of Online Courses in COVID-19 Crisis Management in the Supply Chain Sector—Forecasting Using Fuzzy Cognitive Map (FCM) Models

by
Dimitrios K. Nasiopoulos
1,*,
Dimitrios A. Arvanitidis
1,
Dimitrios M. Mastrakoulis
1,
Nikos Kanellos
1,
Thomas Fotiadis
2 and
Dimitrios E. Koulouriotis
2
1
BICTEVAC Business Information and Communication Technologies in Value Chains Laboratory, Department of Agribusiness and Supply Chain Management, School of Applied Economics and Social Sciences, Agricultural University of Athens, 11855 Athens, Greece
2
Department of Production and Management Engineering, Democritus University of Thrace, Vas. Sofias 12 St., 67132 Xanthi, Greece
*
Author to whom correspondence should be addressed.
Forecasting 2023, 5(4), 629-651; https://doi.org/10.3390/forecast5040035
Submission received: 2 August 2023 / Revised: 14 November 2023 / Accepted: 14 November 2023 / Published: 20 November 2023

Abstract

:
Globalization has gotten increasingly intense in recent years, necessitating accurate forecasting. Traditional supply chains have evolved into transnational networks that grow with time, becoming more vulnerable. These dangers have the potential to disrupt the flow of goods or several planned actions. For this reason, increased resilience against various types of risks that threaten the viability of an organization is of major importance. One of the ways to determine the magnitude of the risk an organization runs is to measure how popular it is with the buying public. Although risk is impossible to eliminate, effective forecasting and supply chain risk management can help businesses identify, assess, and reduce it. As a result, good supply chain risk management, including forecasting, is critical for every company. To measure the popularity of an organization, there are some discrete values (bounce rate, global ranking, organic traffic, non-branded traffic, branded traffic), known as KPIs. Below are some hypotheses that affect these values and a model for the way in which these values interact with each other. As a result of the research, it is clear how important it is for an organization to increase its popularity, to increase promotion in the shareholder community, and to be in a position to be able to predict its future requirements.

1. Introduction

Every section of human life has been impacted by technology, and education is no different. The desire to employ remote education during the Coronavirus-19 (COVID-19) pandemic has not yet been researched, despite the fact that e-learning has been investigated in a variety of situations. The subliminal desire to maintain social distance is making enrolling in cutting-edge education programs such as online courses more and more popular among trainees during the current COVID-19 pandemic.

1.1. Global e-Learning Companies’ Situation

Based on this, the paper examines the global supply chain’s current state during the pandemic period and offers managerial implications and ideas for how to strengthen the supply chain. In order to offer management implications and suggest some ways to lower the risks for the global supply chain, this research is based on an information analysis of the global supply network’s current state.
Education impacts every aspect of people’s lives. Although it has been discussed in several contexts, the use of digital learning during the COVID-19 epidemic has not yet been researched. During the current COVID-19 pandemic, the potential motivation to maintain social distancing is one of the main reasons trainees enroll in innovative educational programs such as online courses. This article examines the current state of global supply chains during the pandemic and provides management implications and solutions for improving global supply chains. This report is based on an information analysis of the current state of global supply systems. It offers management implications and suggests some ways to reduce the risks to these supply chains.
The objective of this essay is not only to analyze the concept but also to understand supply chain management, to present the risks surrounding it and how to manage and forecast them, and to describe methods and models that lead to their mitigation and elimination. As a result, managers of supply chain risk management (SCRM) will be better able to strategically allocate resources as necessary in order to reduce the risk to the organization. Another benefit of digital learning is that it is thought to provide a high level of interaction, which affects how valuable and usable it is seen to be and reinforces trainees’ positive views.
E-learning constitutes an innovative learning process that uses web technology for the design, implementation, and extension of learning. The target is not to replace traditional teaching methods but to improve and evolve these methods. E-learning will, however, overtake traditional learning methods in the twenty-first century as a result of the benefits it offers [1].
Employee training constitutes one of the main elements of the development of profit or non-profit organizations. Thus, supply chain employees, who constitute the target group for this study, are required to receive corresponding training.
Right now, in the US, there are about 10 million online courses and about 2500 e-learning platforms. The educational level of the people addressed by e-learning platforms starts from elementary school and continues until university. Other platforms are only addressed by companies with the aim of developing their employees; after all, many of these platforms offer the ability to earn a degree through distance learning [2].

1.2. Risk Management and Supply Chains

There are many advantages of e-learning. Some of these are as follows:
  • There is no specific moment;
  • From anywhere in the world;
  • Asynchronous interaction;
  • Team cooperation;
  • New educational approaches;
  • Computer integration.
The adoption of digital learning platforms has been motivated by the recent COVID-19 epidemic and widespread lockdowns, as well as the rising number of people who rely on e-learning. This transformation of education [3,4], as well as learning and development practices (L&D) [5], simultaneously developed a new field for both domestic and foreign platforms, namely, massive open online courses (MOOCs) [6].
However, the current COVID-19 pandemic and widespread lockdowns have sped up the adoption of digital learning platforms, increasing the number of individuals who rely on online education. This transformation of education [3,4], a learning and development (L&D) practice [5], has simultaneously created a new range of local and international platforms for MOOCs [6].
Due to the recent pandemic and lockdowns situations, the use of digital learning platforms has increased [7]. MOOC platforms, both domestically and internationally, now have a creative opportunity thanks to this change in education. During the pandemic, companies were forced to digitize many of their functions, such as communication between employees, support services, human resources management, and, especially, employee training.
This change in education has produced an innovative range of local and international platforms for MOOCs.
The COVID-19 epidemic, the lockdown, and the measures undertaken to induce physical separation were, according to the ILO (2021a,b) [8], the factors that finally had an impact on the invention of remote learning education, even if online education platforms had already begun to gain significant popularity [9].

Trainee Behavior

The term “trainee” is defined as a person or a company that invests in financial services or goods [1]. The way in which these individuals or companies will invest the resources is defined as “trainee behavior”. The parameters that make trainees behave differently are as follows:
  • The available resources of each course;
  • The products and services that each trainee buys;
  • Where the purchases are made;
  • How often these purchases are made;
  • How often they use the specific goods and services [10].
To be able to analyze and predict trainee behavior, the characteristics that influence it must be recognized. So far, different models have been developed that predict trainee behavior, each of them relying on different factors from which to derive their predictions. Some of these factors are given in Table 1 below [10].
The different factors which influence the behavioral models result in the development of different models. Some of these models are the economic model (a model based on obtaining the maximum benefits at the lowest cost) [11], the learning model (a model that analyzes the coverage of the trainee’s basic needs) [10], and the sociological model (a model based on the impact that a student has on society) [12].

1.3. Understanding Risk and Online Education

1.3.1. Understanding Risk

Understanding risk is the assessment of the probability that an accident will occur in relation to the assessment of the possible consequences that will be caused [13].
The two prevailing ideas that potentially explain how people perceive danger are as follows:
  • The psychological model;
  • The philosophy of culture.
In the Fischhoff et al.-developed psychometric theorem, people are split into two groups: the “experts” and to the “commons”. In this theory, the risk analysis is based on a model that analyzes the way people perceive various risks [12].
On the other hand, in cultural theory, individuals perceive risks according to their social beliefs and their social position [14].

1.3.2. Understanding Risk and Brand Name in e-Learning

In e-learning, trainees have separate ways of perceiving risks. In a study related to the perception of risk in e-learning, it was established that trainees rely on tailored information and communication with each other to make a purchase [15].
The most important factors that can affect trainee trust levels are the quality of the website and the user’s experience on that website. Another very important factor is the positive information that is transferred from trainee to trainee, and this has the effect of reducing the risk when the trainee chooses well-known companies [16].

1.4. Web Analytics

Web Analytics and Big Data

The gathering and examination of online data for the purpose of comprehending web usage is referred to as “web analytics”. Web analytics can be used not only as a tool with which companies conduct market research but also to assess ways in which to improve their cyber footprint.
Big Data is defined as data collected by online users. This information is generated by processing data obtained from websites and is referred to as key performance indicators (KPIs), which are used to evaluate the effectiveness of a website. With the help of KPIs, a company can examine the potential and weaknesses of a website. These user-generated statistics support a theoretical framework of supply chain network resilience for sustainability.
The analysis of these data has been proposed by various researchers as an approach to distance-learning trainee behavior. However, a significant barrier to using web analytics is that it has raised concerns about user privacy on the internet, and this has resulted in anti-tracking tools, which degrades the quality of the data. [17,18,19,20,21,22,23]

1.5. Hypotheses

The process of building a predictive model illustrates how to build a descriptive model that details the interactions between various components, including those in the supply chain sector. The current study’s goal is to develop an FCM-based strategy for digital marketing planning, specifically tailored for the supply chain sector.
The findings will provide managers with the required information in order to effectively allocate resources to reduce corporate risk to their firm and will enable them to make strategic decisions about issues such as the following:
  • Should I spend money on online advertisements, or will the traffic my brand name generates justify the expense?
  • Is investing resources in search engine optimization for my organization’s website a wise use of my time, or do consumers prefer more conventional methods of consuming during a crisis?
  • Should I spend money on brand empowerment and digital marketing, or does the brand become less significant to customers with a new crisis?
In an attempt to shed light on the relationship between the number of COVID-19 cases and deaths worldwide, the traffic source of the root domains of the best distance learning platforms, their ranking in web analytics platforms globally, and the level of user interaction with these websites, four research hypotheses have been selected.
The effects of the relevant KPI (customer behavior) variables (dependent variables) on the COVID-19-related metrics (cases and fatalities), which are independent variables for all of the following hypotheses, are examined in this study.
This strategy, utilizing the FCM technique, provides straightforward integration into various marketing channels and quantification of the deviation of the link between the key factors, offering a systematic study with which to compare many supply chain scenario options at the same time. Easy knowledge assimilation by stakeholders and a systematic propagation mechanism with which to monitor the consequences of changes made to a planning system are two elements of an FCM model for strategic planning. The idea that is presented here helps us grasp the model:
Hypothesis 1 (H1).
The principal domains of e-learning platforms’ branded and non-branded traffic KPIs are both impacted by the global ranking KPI.
One of the most important metrics for evaluating a website’s performance is the Global KPI rating. H1 tries to provide context for the impact of the total worldwide death toll related to COVID-19 on this KPI by examining modifications in the behavior of internet learners relating to confidence in established distance education providers. Deaths related to COVID-19 are an indicator that ordinarily follows the illness count provided but pertains to the latter’s inclusion.
This study will attempt to assess the effect of reported deaths related to COVID-19 on distance-learning trainee behavior regarding distance education services, their preference for particular educational backgrounds during the crisis, and how these behavioral changes affect the search engine ranks of pertinent websites.
By forecasting the behavior of distance-learning trainees during a fresh crisis, the results related to H1 will assist education organizations in developing efficient reputation risk management techniques.
Having this information will make it simpler for them to decide whether investing in brand development and search engine optimization (SEO) is a successful strategy with which their organization might lower corporate risk.
Hypothesis 2 (H2).
Changes in the KPI for pages viewed per user show how COVID-19 deaths affected the principal domains of branded and non-branded traffic KPIs on e-learning platforms.
Global COVID-19 fatality rates can serve as a reliable indicator of the pandemic’s development. The H2 study will make an effort to tie the changes in risk perception and behavior among distance learners to an increase in the number of fatalities worldwide. Preliminary research predicts that online education alternatives will be used more frequently. However, difficulties in the supply chain brought on by the crisis are anticipated to change how trainees behave toward service providers.
The final objective of research H2 is to determine how these factors impact user engagement with the training service provider’s website. Managers of SCRM will be able to create efficient enterprise risk management strategies with the use of the research findings for H2. When determining whether or not to devote expenditure to brand enhancement and web content improvement as a method by which to reduce corporate risk, it can be very helpful to anticipate how distance-learning trainee behavior would change during a new crisis. There will be two distinct sub-hypotheses for each of the four hypotheses, with the labeled movement and the unlabeled variable being explored individually in each.
Hypothesis 3 (H3).
The influence of the number of COVID-19 cases worldwide on the branded and unbranded traffic KPIs of the key domains of e-learning platforms will be reflected in the global ranking of KPIs.
The most common signal used to inform the public about the pandemic’s progression is the amount of COVID-19 cases that have been recorded [7]. As more cases of the virus are reported, it is anticipated that the general public’s opinion of the risk associated with COVID-19 will change. H3 tries to explain how this phenomenon influences learners’ choices with respect to distance learning and their degree of trust in certain businesses, as well as how this influence is seen in search engine rankings for websites of distance learning organizations.
The findings on H3 will assist firms In developing successful reputation risk management methods. If spending funds for branding improvement and digital marketing is a wise move in reducing the business risk of education providers, it will become clear from forecasting distance-learning trainee conduct during a new crisis.
Hypothesis 4 (H4).
There is a connection between the amount of worldwide COVID-19 cases and the pages viewed by each KPI effect from the branded and non-branded traffic KPIs of the main domains of e-learning platforms.
A helpful KPI that reflects the level of internet users’ interaction with a website is pages viewed per user (PVU). When online distance-learning learners look for more knowledge about the issues the COVID-19 situation is causing in supply chains, PVU is predicted to rise throughout the crisis.
Research H4 will examine how brand choice and user loyalty change as more COVID-19 infections are recorded globally, with a focus on remote-learning trainees of distance education businesses.
The outcomes of H4 will aid SCRM managers in creating successful business risk management plans. Forecast learner conduct during a fresh crisis may be very helpful in deciding whether investing money in brand improvement and online content optimization is the best course of action for their firm in reducing corporate risk [7].

2. Materials and Methods

2.1. Sample Selection, Data Retrieval, and KPIs Alignment

Five businesses were chosen as an exemplary sample of the distance learning services industry according to their market value as of January 1 2020. Each of the five maintained a fully operating website and was one of the top ten businesses worldwide. Udemy Business, Skillshare, LinkedIn Learning, Coursera, and edX were the five businesses chosen.
Since the majority of countries began enforcing stringent border controls and education restrictions in that month, it was decided to select March 2020 as the COVID-19 starting point. The aggregate mean value of the five companies for each KPI (dependent variable) was also analyzed as a representative measure of the business sector.
More efficient statistical analysis and data management methods were considered before this web analytics data processing method was selected.
The second phase (the COVID-19 period) was marked by globally confirmed COVID-19 cases (the independent variable), as well as globally confirmed COVID-19 fatalities (the independent variable), every month, according to reports from the World Health Organization (https://covid19.who.int/ access date 1 January 2020). Two variables representing the average weekly COVID-19 cases and deaths for each month during that time period were created from this data. Table 2 lists the key performance indicators that were utilized in this work.

2.2. Risk and Statistical Analysis—Tables

The pre-COVID-19 and COVID-19 sets of KPI-related data have been separated and descriptive statistical parameters have been extracted for each of the six dependent variables. Cronbach’s alpha testing was also used to validate each set of variables (Table 3).
All six of the KPI-related variables can now be referred to as the study’s dependent variables.
With the exception of non-branded traffic, where an unsatisfactory degree of dependability was revealed, the Cronbach’s alpha testing value suggested moderate-to-low (but acceptable) internal consistency for all variable sets. The limited sample size (N = 12) may have contributed to this result.
The hypothesis study in this work is based on FCM simulation approaches, and the descriptive statistical analysis serves primarily as a verification and routine procedure. The Cronbach’s alpha value was adjusted to 0.590, which is moderate-to-low but at an acceptable level, signifying internal consistency, after all data were reformatted as samples by day (730 samples).
For COVID-19-related variables, qualitative statistical coefficients were also computed for the COVID-19 timeframe. Since these variables became accessible for the second time frame, they have been considered as independent variables at this level of analysis, and no internal coherence control was conducted (Table 4).
An independent sample t-test has been conducted for all six KPI-related variables prior to any additional statistical analysis. The time period (pre-COVID-19 and COVID-19) has been used as the grouping variable with which to examine any statistically significant differences in the variables’ values before and after the COVID-19 outbreak (Table 5, Table 6 and Table 7).

2.3. Problem Formulation and Research Hypotheses

Numerous effects of the current COVID-19 epidemic have been seen on e-learning platforms worldwide. Due to the crisis’s dynamic nature—which was not a natural disaster with long-term effects (e.g., earthquake, flood) but rather showed a nearly linear increase—many of these changes are still unknown. This is exemplified by the rising number of COVID-19 cases and deaths from February 2020 to the time of this analysis. Because they had no control over the new risk, they were exposed to in online learning environments, learners were compelled to seek alternate avenues, as in e-commerce, rather than risking exposure to COVID-19.
Because of this, this research is concentrating on particular KPIs relating to traffic, the site’s ranking in Google, and user engagement metrics.
Four research hypotheses have been chosen to study these issues in an effort to shed light on the impact of the amount of COVID-19 cases and deaths, globally, on the root domains of the top online learning platforms, their global positioning in web analytics platforms, and the level of student engagement on these sites.
The impact of the related KPI (learner behavior) variables (dependent variables) on the COVID-19-related metrics (cases and deaths), which are variables that are unrelated for all of the following hypotheses, is examined in this research.

3. Statistical Analysis—Model Forecasting

3.1. Research Instrument

Decision-makers, experts, and analysts can all benefit from the use of fuzzy cognitive mapping (FCM), associations made from web analytics data, and simulation results based on simulation models in forecasting and problem-solving.
The relationship between the problem’s factors is being mapped using FCM, and weights are being assigned to each of the components of the factors taken into consideration based on the independent and dependent variables.

3.2. Data of Forecasting with the Use of FCM

Using passive data from web analytics platforms, the eight COVID-19- and KPI-related factors chosen for this inquiry will be examined with the goal of educating SCRM managers on how to lower the company risk brought on by crises such as the COVID-19 pandemic.
Simulation scenarios will be created according to statistically significant interactions between each of the eight COVID-19- and KPI-related variables as represented in Table 7 and Table 8 [7].
The outcomes of the FCM scenario will also assist firms in selecting efficient marketing strategies and determining resource allocation. Using five selected globally active e-learning platform root domains, the first stage of the investigation extracted passive data over a 24-month period, 12 months before and 12 months after the COVID-19 outbreak, as well as data related to COVID-19 for the second year [7].
Big Data integration was applied to eight characteristics that define the innovative distance learning sector. Independent sample t-tests were used to demonstrate a cause-and-effect relationship between KPI- and COVID-19-related variables after the data’s reliability is assessed using Cronbach’s alpha. The data were then put through Pearson correlation coefficient testing for analysis.
This resulted in the discovery of 24 statistically significant correlations, 19 of which showed strong connection traits at a statistical significance level of 0.01 [7].
These findings show how the distance-learning trainee behavior model responds dynamically to a COVID-19-like epidemic. Even in the absence of a clear cause-and-effect mechanism, or even a competitive underlying link, statistical analysis reveals a causal relationship between variables with strong Pearson correlations (r > 0.800). For instance, considering that both branded and non-branded traffic KPIs rise as a result of an increase in the value of the organic traffic KPI, it would be appropriate to suggest a there is a significant positive link between the two. Nonetheless, this suggestion is appropriate because the model mimics a crisis in which statistical analysis reveals a big growth in organic traffic.
Both Baye et al. [25] and Jansen et al. [26], who noticed a positive link between organic traffic and branded traffic, and who mentioned non-branded traffic as a component of organic traffic measures, provide credence to this association. The “Traffic Stealing” and “Adverse Selection” techniques have both been extensively used to establish a causal relationship between branded and non-branded traffic [10,27].
Based on findings from trainee behavior research [28,29,30,31,32,33,34,35], which describes how trainees behave in response to external stimuli such as a unique crisis, there are significant connections between COVID-19-related factors and variables connected to web analytics.
To display all of the cause-and-effect relationships between the COVID-19 and KPI-related variables investigated in this study, an FCM has been created (Figure 1). This “soft computing” method may mimic the results of interactions between variables with known correlations, which increases this study’s assessment and explanatory potential and enables it to produce more effective suggestions about the put-forth hypotheses [13].
Fuzzy graph representations of causal inference are known as FCMs. Hazy degrees of causation between hazy causative agents are possible as a result of their hazy nature [36]. This is a hybrid of fuzzy logic and neural networks and can be applied as a “soft computing” method for system modeling. Although adaptable, the method for creating FCMs still heavily depends on human expertise and knowledge [37,38,39,40]. Many diverse scientific domains have proved that FCMs are useful for showing decision support systems (DSS), including geographic information systems (GIS) [41], expert decision support in applications for urban planning, and medical decision support systems [42,43].
Firms are moving toward embracing online technologies that will improve their capacity for strategic decision-making while Internet apps and e-learning are proliferating in the workplace. Companies obtain useful information through passive techniques such as web mining and web analytics, which must subsequently be processed into a more understandable manner. By drawing more conclusions from web-mined row data, FCMs can offer this reasoning mechanism. [2].
Choi, Lee, and Irani [44,45] point out the drawbacks of traditional data analytic tools and offer an FCM technique as a Big Data analytics tool (BDA) that will aid in the prioritization of public-sector decision-making.
Focusing on the behavior of distance-learning trainees, Lee and Lee [46] also contend that incorrect web analytics data might quickly result in incorrect inferences about trainee conduct, which would have a detrimental effect on marketing and business growth plans. Researchers also suggest using an FCM-based interpretation of the web analytics data to circumvent this issue (Figure 2).

3.3. Statistial Methods

To assess the projected changes to the KPIs of the websites of web-based learning platforms at various stages of the crisis, six scenarios were executed once the FCM map had been constructed. The sigmoid approach was used for these instances.
The minimum and maximum component values for the total number of COVID-19 instances and fatalities worldwide were defined prior to executing the state prediction scenarios.
A “0” value of 1.189 cases and a “1” value of 780,326 cases were set for scenarios with different daily fresh COVID-19 instance counts throughout the world. The data were obtained from Google.com (Figure 3).
The seven-day average values were used in order to prevent obtaining extreme values that could affect the scenarios’ outcomes (Figure 3).
A level of 0.5 (389,523 daily cases) and a level of 0.25 (Figure 4 and Figure 5) were used for Scenarios 1 and 2, both of which were run (194,761 daily cases). Increases in organic traffic (+1%), non-branded traffic (+2%), and branded traffic (+2%) were reported, according to scenario 1′s results (Figure 4).
It was anticipated that the bounce rate (−2%) and the global ranking (−1%, 482, an improvement of 1%) would both decrease. The pages read per user KPI did not vary significantly.
Distance learning platforms can efficiently manage the business risk associated with an imminent crisis by utilizing backlinks, search engine optimization, and sponsored advertising to increase website traffic, as suggested by the outcomes of Scenario 1.
The outcomes of Scenario 1 demonstrate that investing money in the optimization of online content is not a useful strategy for controlling business risk.
The findings of Scenario 2 (Figure 6) indicated that branded traffic would rise by 6%, non-branded traffic would rise by 5%, and organic traffic would rise by 3%.
Both the bounce rate (−6%) and global ranking (−2%, suggesting an improvement of 2%) were forecast to decline.
The KPI for pages seen by each user did not change considerably. According to the findings of Scenario 2, distance learning platforms need to further increase their brand recognition in order to control the associated company risk when a crisis worsens. Since paid advertising, search engine optimization, and backlinks can be used by businesses to enhance traffic to their websites, they should allocate funds for digital marketing.
The results of Scenario 2 also demonstrate that spending money on online content optimization is a poor method of risk management for businesses.
The daily worldwide COVID-19 fatalities were set for scenarios with different amounts of 59 and 14,306 deaths at “0” and “1” values, respectively. The source of these data was Google.com (Figure 7).
To avoid having extreme numbers that would have an impact on the outcomes of the scenarios, the seven-day average readings were preferred (Figure 8).
A level of 0.15 for Scenario 3 (Figure 9) and a level of 0.4 (5722 daily deaths) for Scenario 4 were evaluated (2146 daily deaths).
Branded traffic increased by 2%, non-branded traffic also increased by 2%, and organic traffic increased by 1% in the Scenario 3 results. (Figure 6). Both the bounce rate (−2%) and the global ranking (−1%, showing an improvement of 1%) were expected decline. The KPI for pages each user viewed did not vary significantly. The outcomes of Scenario 3 are consistent with those of Scenario 1, demonstrating that distance learning platforms should increase website traffic in order to successfully manage the company risk caused by paid advertisements, search engine optimization, and backlinks during the early stages of a novel crisis.
The outcomes of Scenario 3 contradict the idea that investing in online content optimization is a sensible company risk management approach.
Results from the Scenario 4 test showed an increase in organic traffic (+3%), non-branded traffic (+5%), and traffic from brands (+6%). (Figure 8).
Both the bounce rate (−5%) and the global ranking (−2%, suggesting an improvement of 2%) were forecast to decline.
The KPI for pages seen by each user did not change considerably. The outcomes of Scenario 4 are consistent with those of Scenario 2, demonstrating the need for distant learning platforms to build their brand as a crisis intensifies in order to properly manage company risk. Businesses should allocate funds for digital marketing and be ready to use paid advertising, search engine optimization, and backlinks in order to increase website traffic.
The results of Scenario 2 further highlight the futility of spending money on online content optimization as a method for reducing business risk. The impacts of worldwide, everyday COVID-19 incidents and COVID-19 global daily fatalities were applied in two more scenarios. In these two mixed scenarios, the “0” and “1” values from the preceding circumstances were carried over.
In order to analyze the effects of both independent factors on the KPI-related variables, a random date (24 December 2020) was selected, and data on worldwide COVID-19 cases and deaths were obtained (Figure 9). Hence, after translating the data into FCM component-level indicators, we came up with a value of 0.48 for COVID-19 cases (372.658) and 0.43 for COVID-19 fatalities (6.150).
A rise in branded traffic (+11%), non-branded traffic (+8%), and organic traffic (+7%) was seen in the Scenario 5 results (Figure 10). Both the bounce rate (−1%) and global ranking (−3%, suggesting an improvement of 3%) were forecast to decline.
The pages read per user KPI did not vary significantly. These findings show a striking shift in how trainees respond to a crisis when both risk factors have an impact on their purchasing choices. These results indicate that platforms for online courses should invest in e-learning tools that will boost their brand recognition, such as search engine optimization, sponsored advertisements, paid keywords, and backlinks, in order to be ready to reduce corporate risk in the event of a crisis involving multiple risk sources. Content optimization should not be the main emphasis of company risk reduction measures.
With the help of an FCM component-level indication, Scenario 6 recommended a 0.47 level for COVID-19 fatalities (6724) for a 0.22 level of COVID-19 cases, suggesting a disproportionately high number of deaths (within the stated “0” and “1” values) for a specific number of COVID-19 cases (171,390). Organic traffic increased by 5%, non-branded traffic increased by 6%, and branded traffic increased by 8% according to the results of the Scenario 6 test (Figure 11).
Both the bounce rate (−7%) and the overall ranking (−2%, suggesting an improvement of 2%) were forecast to decline. The pages read per user KPI did not vary significantly. These results suggest that the mortality of the pandemic appears to have had a moderate impact on trainee conduct. The decision to allocate financial resources for corporate risk reduction should not be influenced by this element; thus organizations should not concentrate on it while creating their corporate risk management plans.

4. Validity

The subsequent section explains how the COVID-19 epidemic affected students enrolled in online courses during its initial phase, which ran from December 2019 to March 2020.
This period includes both the start of the pandemic and the first national regulations requiring mandatory sheltering in place. Web analytics data changes from platforms for online courses’ websites are given and examined. The conclusions from the FCM scenarios are presented and related to the ideas above.

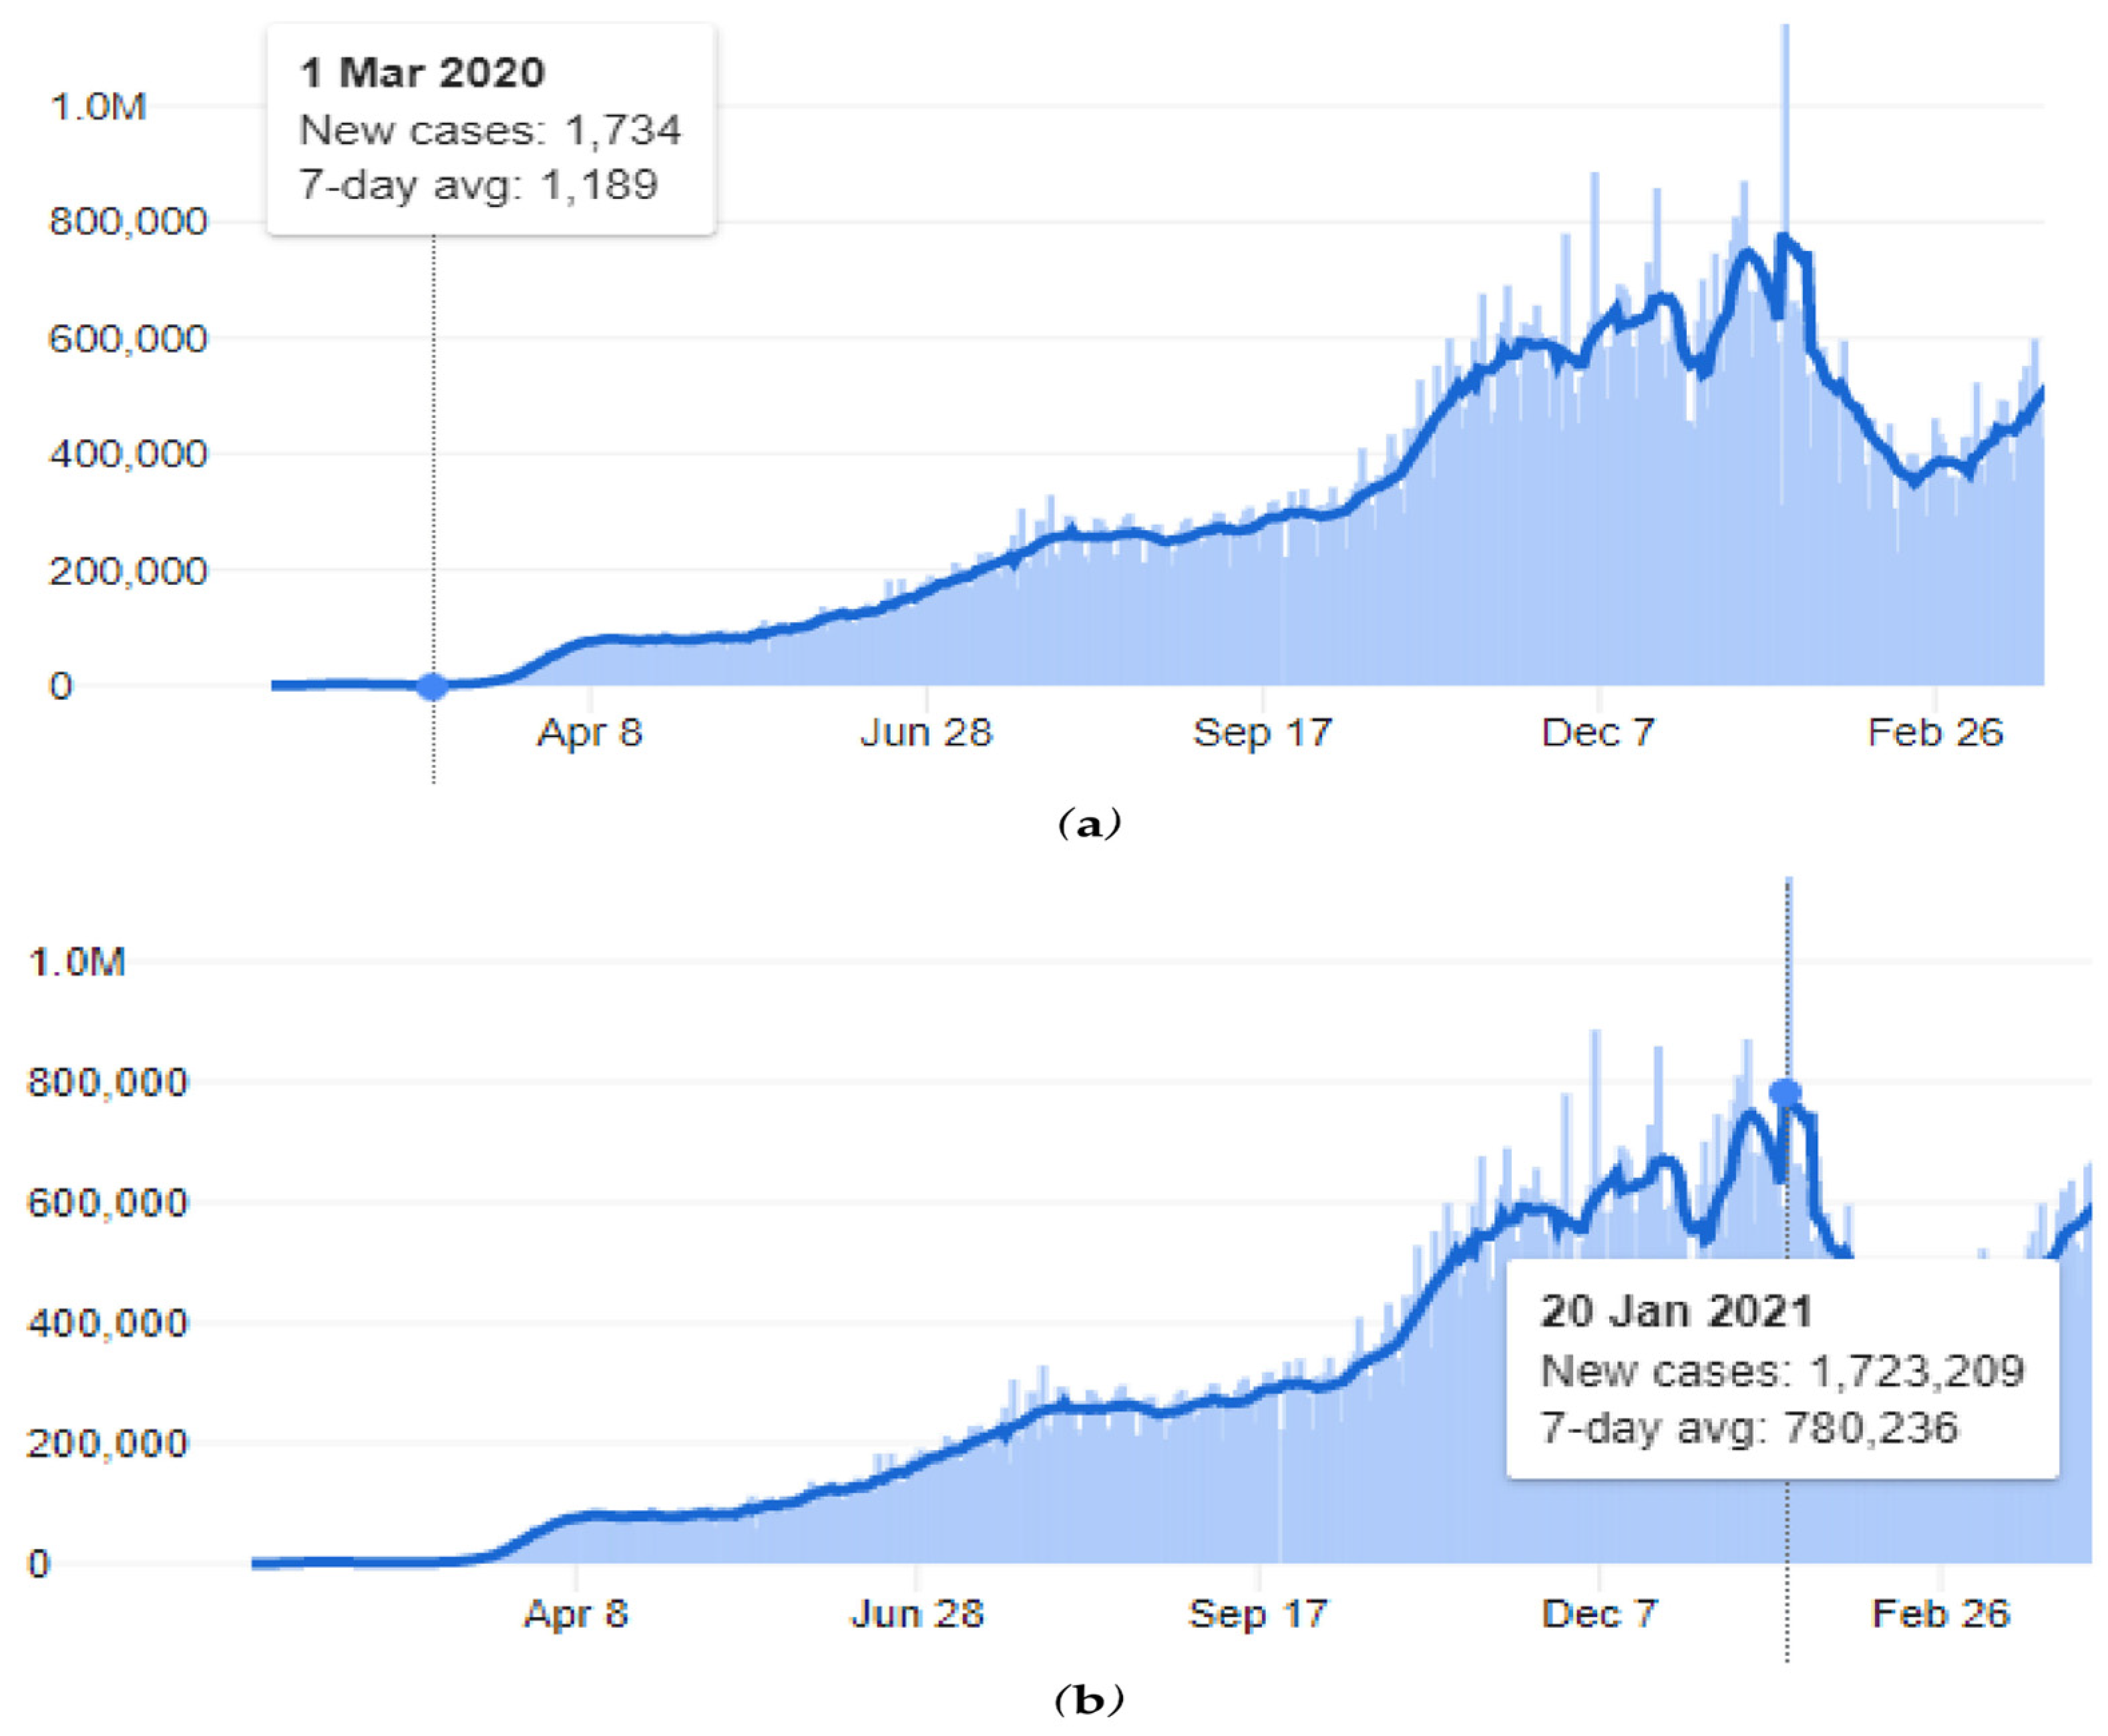
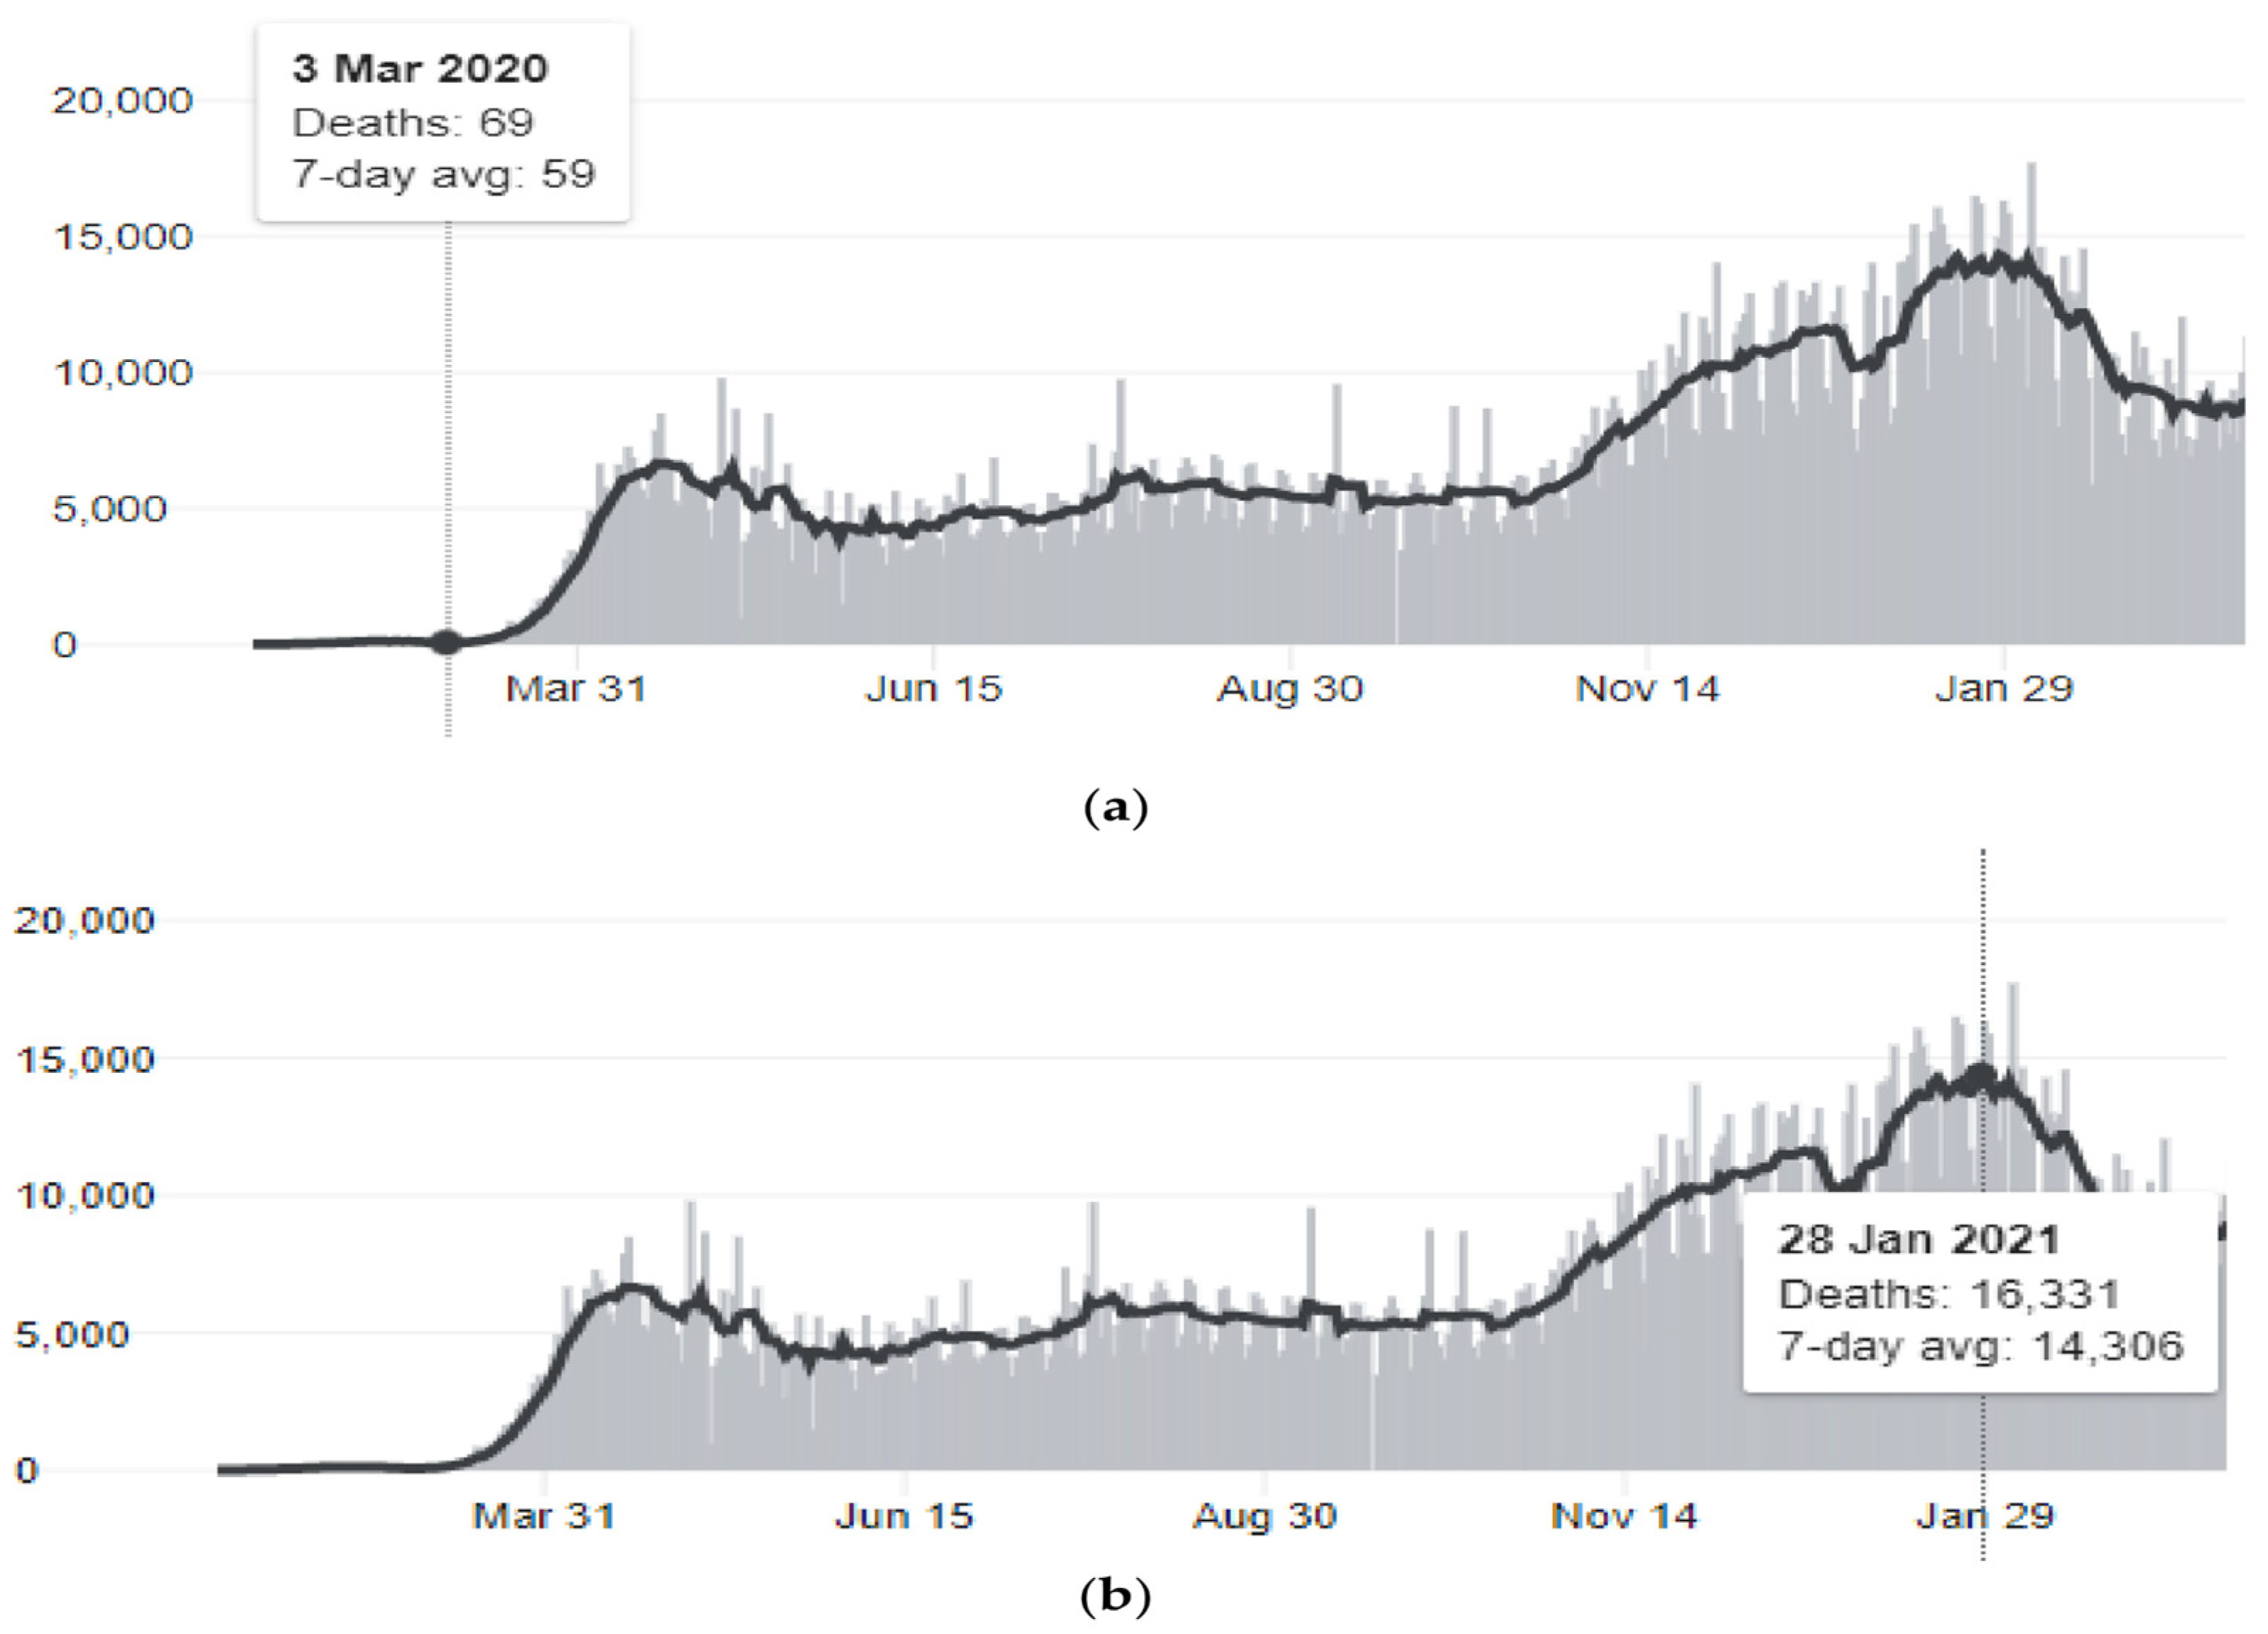
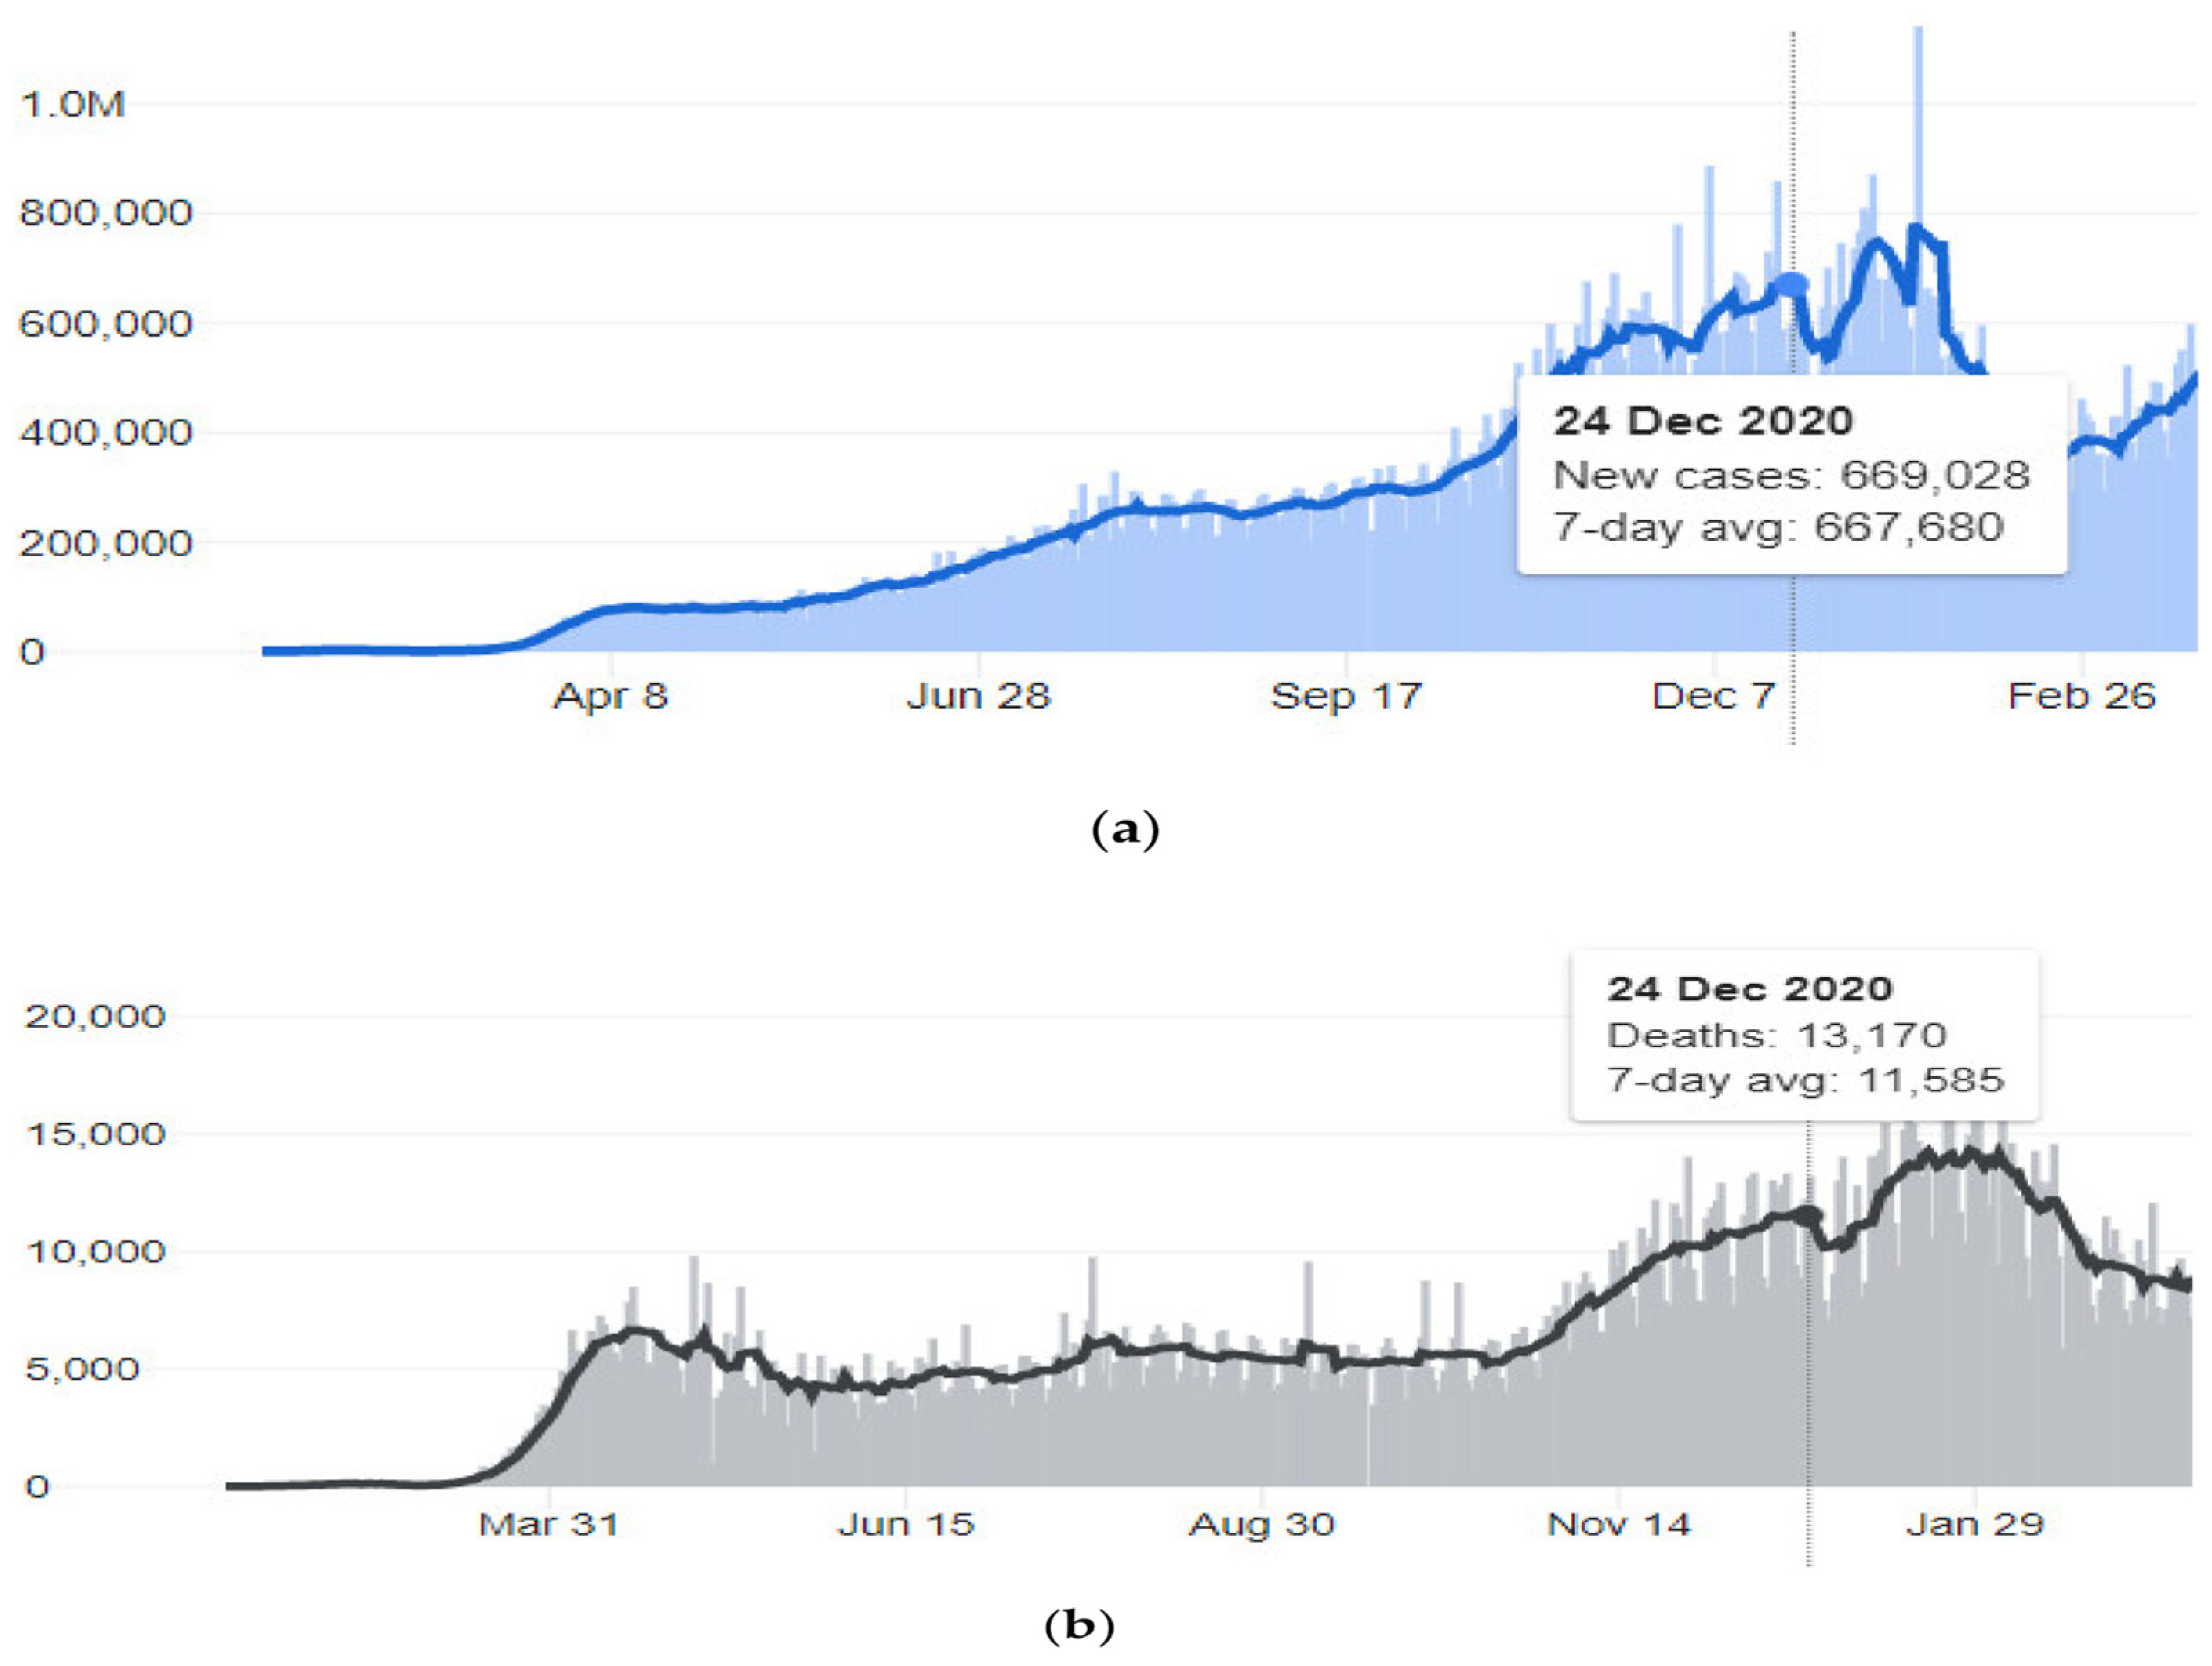
4.1. The COVID-19 Pandemic

On 31 December 2019, the Wuhan City Health Committee reported cases of “viral pneumonia,” which was the first time COVID-19 was mentioned in Chinese news outlets.
On 30 January 2020, the World Health Organization (WHO) deemed the epidemic a public health emergency of worldwide concern. A pandemic was subsequently proclaimed on March 11 of the same year.
Shelter-in-place restrictions were implemented by the majority of countries, starting in the last week of February 2020 and lasting through the end of March 2020.
The workload of online course platforms significantly increased because of these constraints.

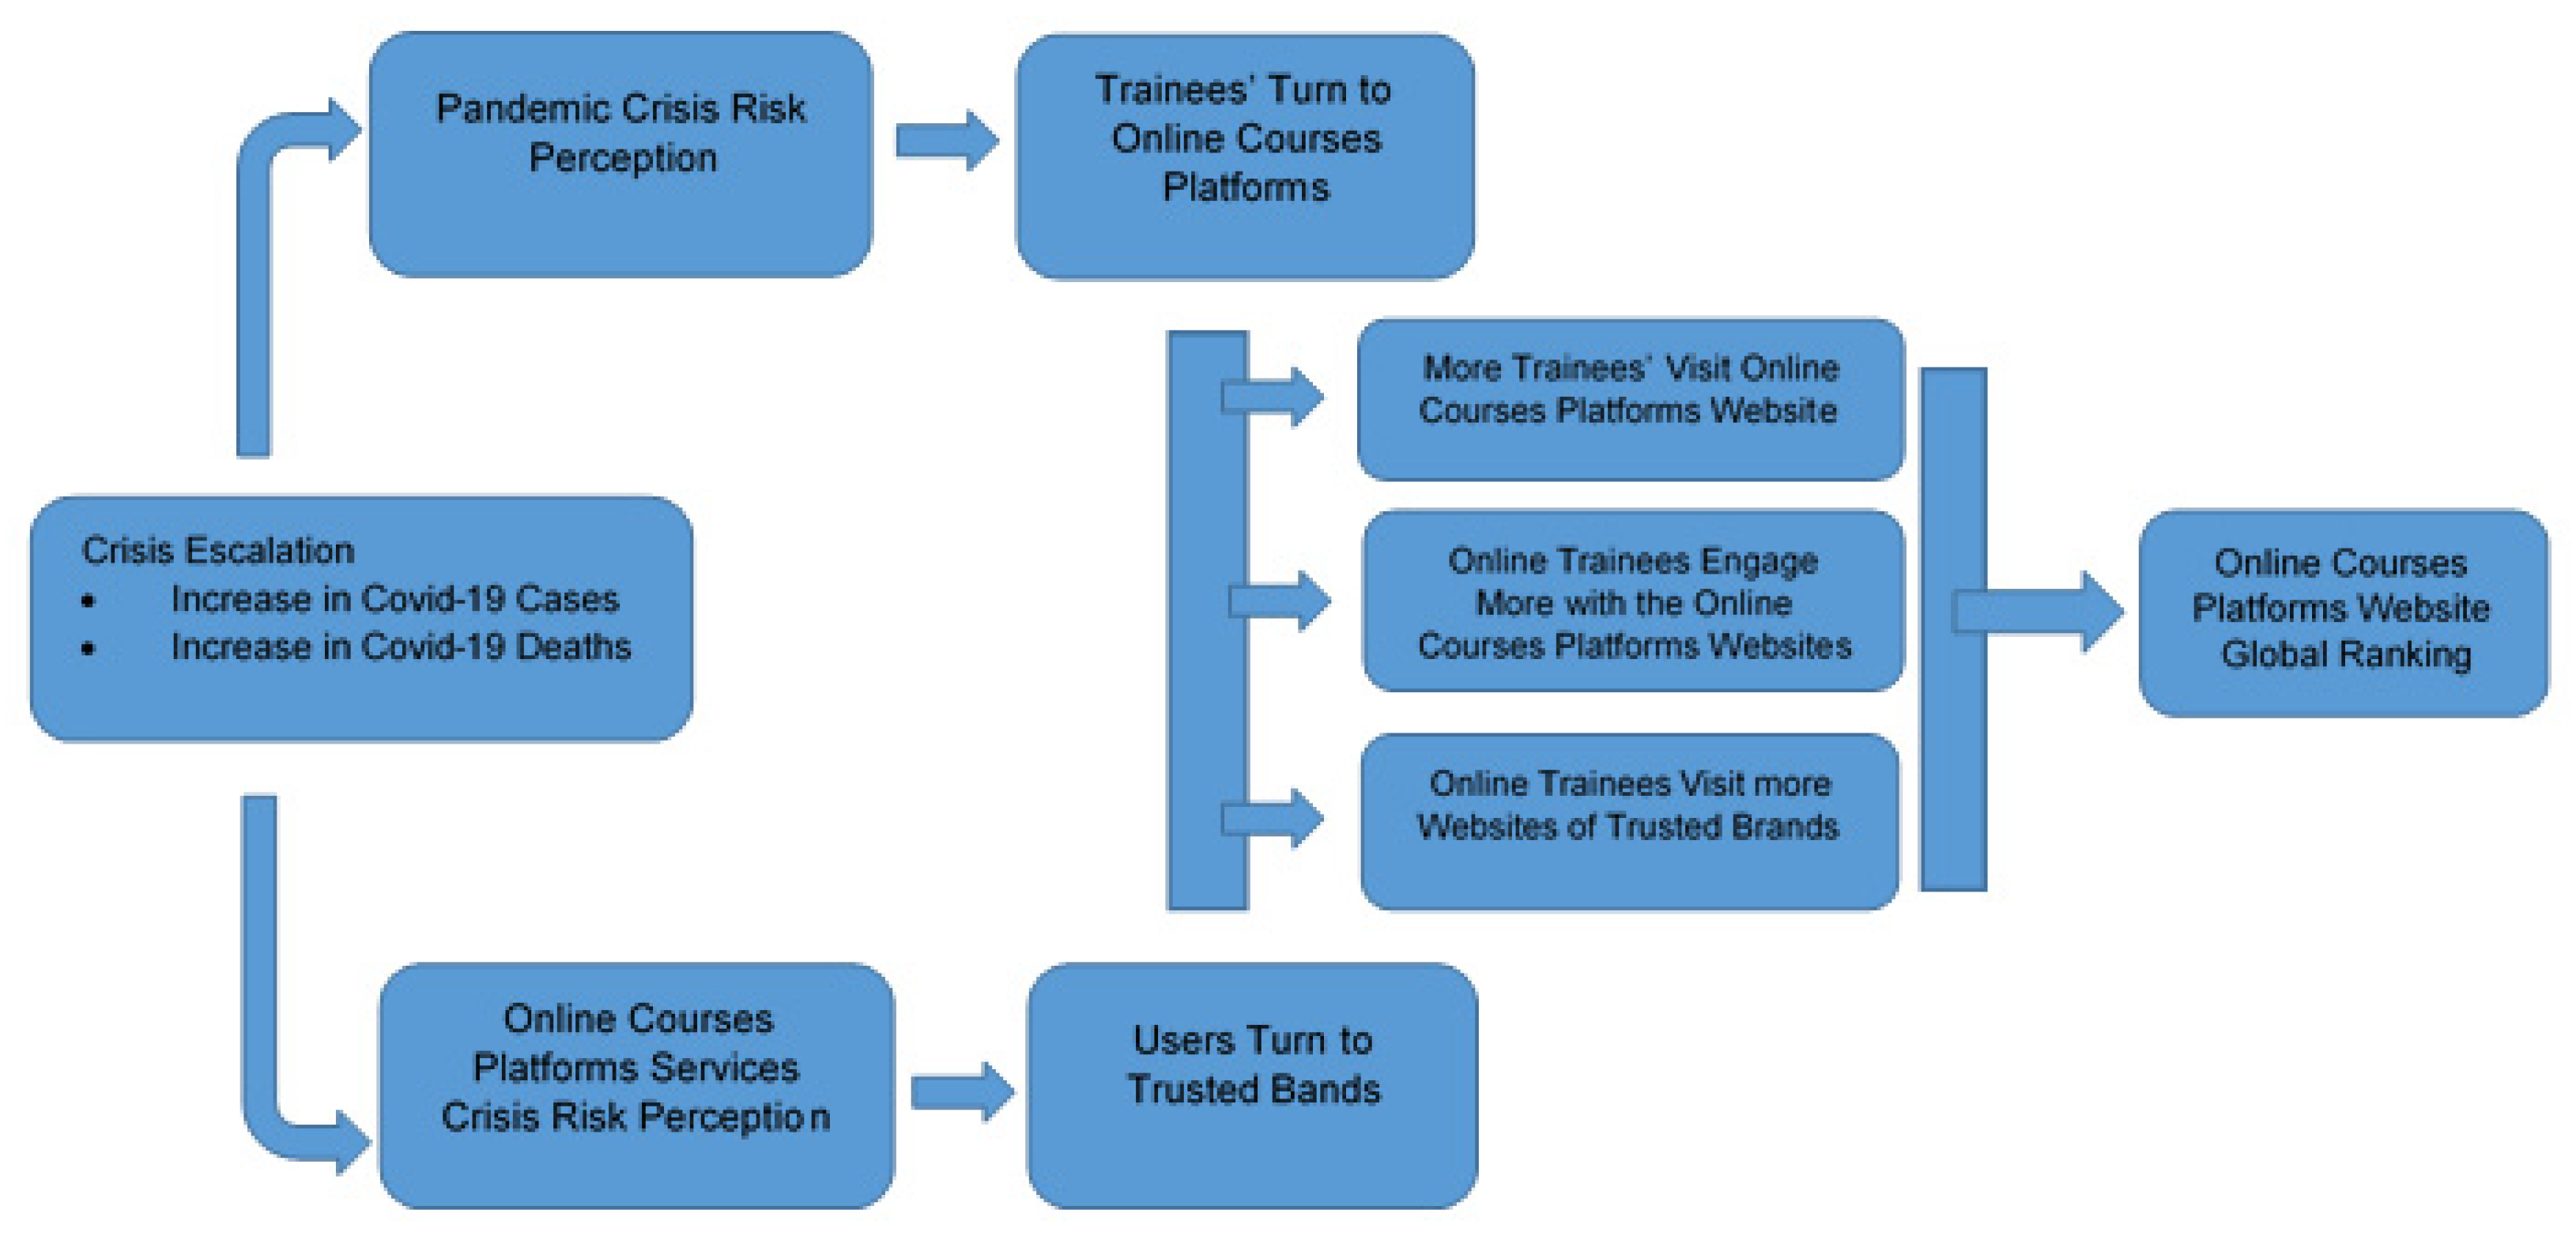
4.2. Changes in Trainees’ Online Behavior during the COVID-19 Epidemic

The statistical findings demonstrate that during the COVID-19 outbreak, trainees’ online inquiries about online course platforms and services rose. This suggests that the perceived COVID-19 hazard risk motivated people to look for safer solutions to meet their demands through e-learning platforms. Further investigation revealed that while non-branded search traffic significantly decreased, trainees utilized specific brand names as search phrases, showing that their perception of danger led them to select reliable platforms. User engagement was dramatically affected following the epidemic, indicating that trainees were interacting with the website’s material more frequently. These adjustments dramatically raised the websites’ global ranking KPI for online course platforms.

4.3. Changes in Trainees’ Online Behavior during the COVID-19 Escalation

Both branded and non-branded traffic were on the rise when the number of new illness cases increased; however, branded traffic appeared to respond more sensitively to this deterioration.
As the crisis worsened, the increase in both branded and non-branded traffic to the websites had a significant effect on the global ranking of the pertinent web domains. These observations have a close relationship to the H1a and H1b hypotheses.
It is thought that the number of COVID-19 deaths worldwide has had an impact on KPI-related variables, such as the COVID-19 cases variable, which has increased both sponsored and non-branded visits to online course platforms and raised their global ranking. The latter showed a more robust response to the crisis’s progression in terms of the global death toll. The H2a and H2b hypotheses are directly related to these findings.
Despite the fact that trainees used online course platforms websites significantly more frequently during the COVID-19 crisis, further research directly addressed H3a and H3b, showing that the pages viewed per user KPI were unrelated to the pandemic crisis’s escalation in terms of the global infection rate. The same results can be drawn for the H4a and H4b-related research subjects, showing that trainee involvement, as measured by the pages visited per user KPI, was not significantly impacted by the crisis’s intensification in terms of the number of reported deaths.
Statistical analysis did, however, show a slight association between trainees’ increased interest in both branded and non-branded online course platforms services during the crisis, as well as higher user engagement with such platforms’ websites.

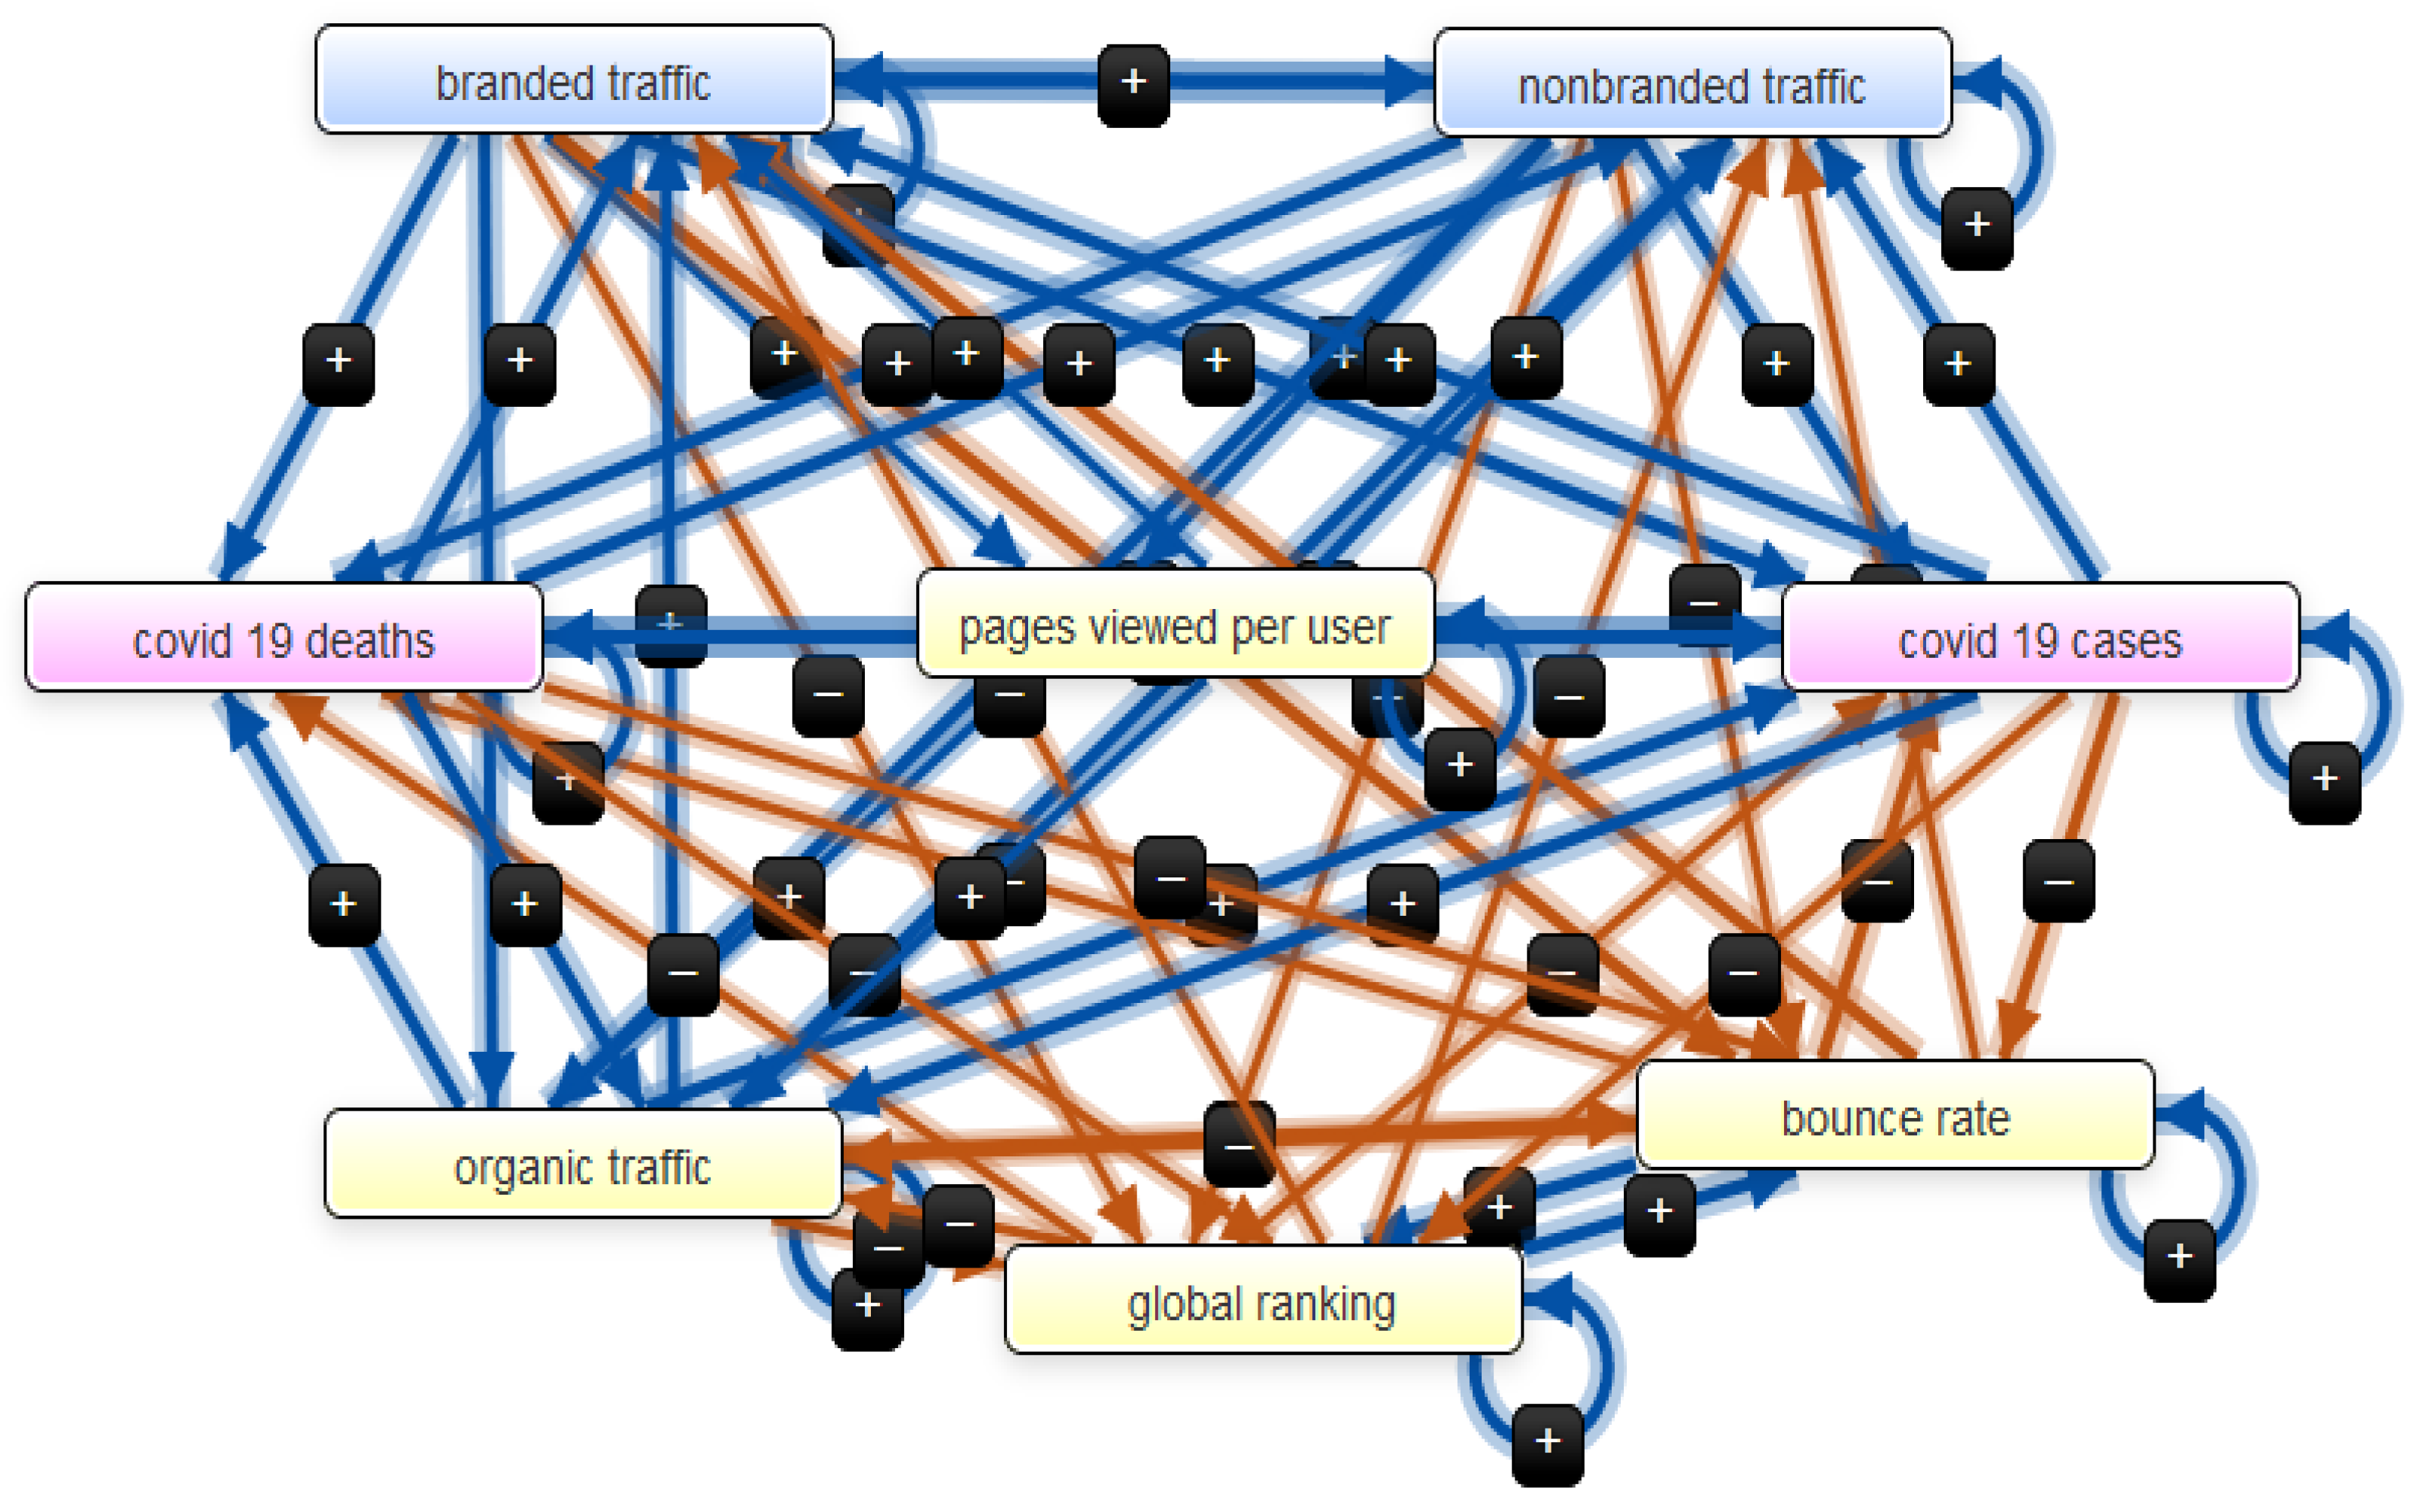
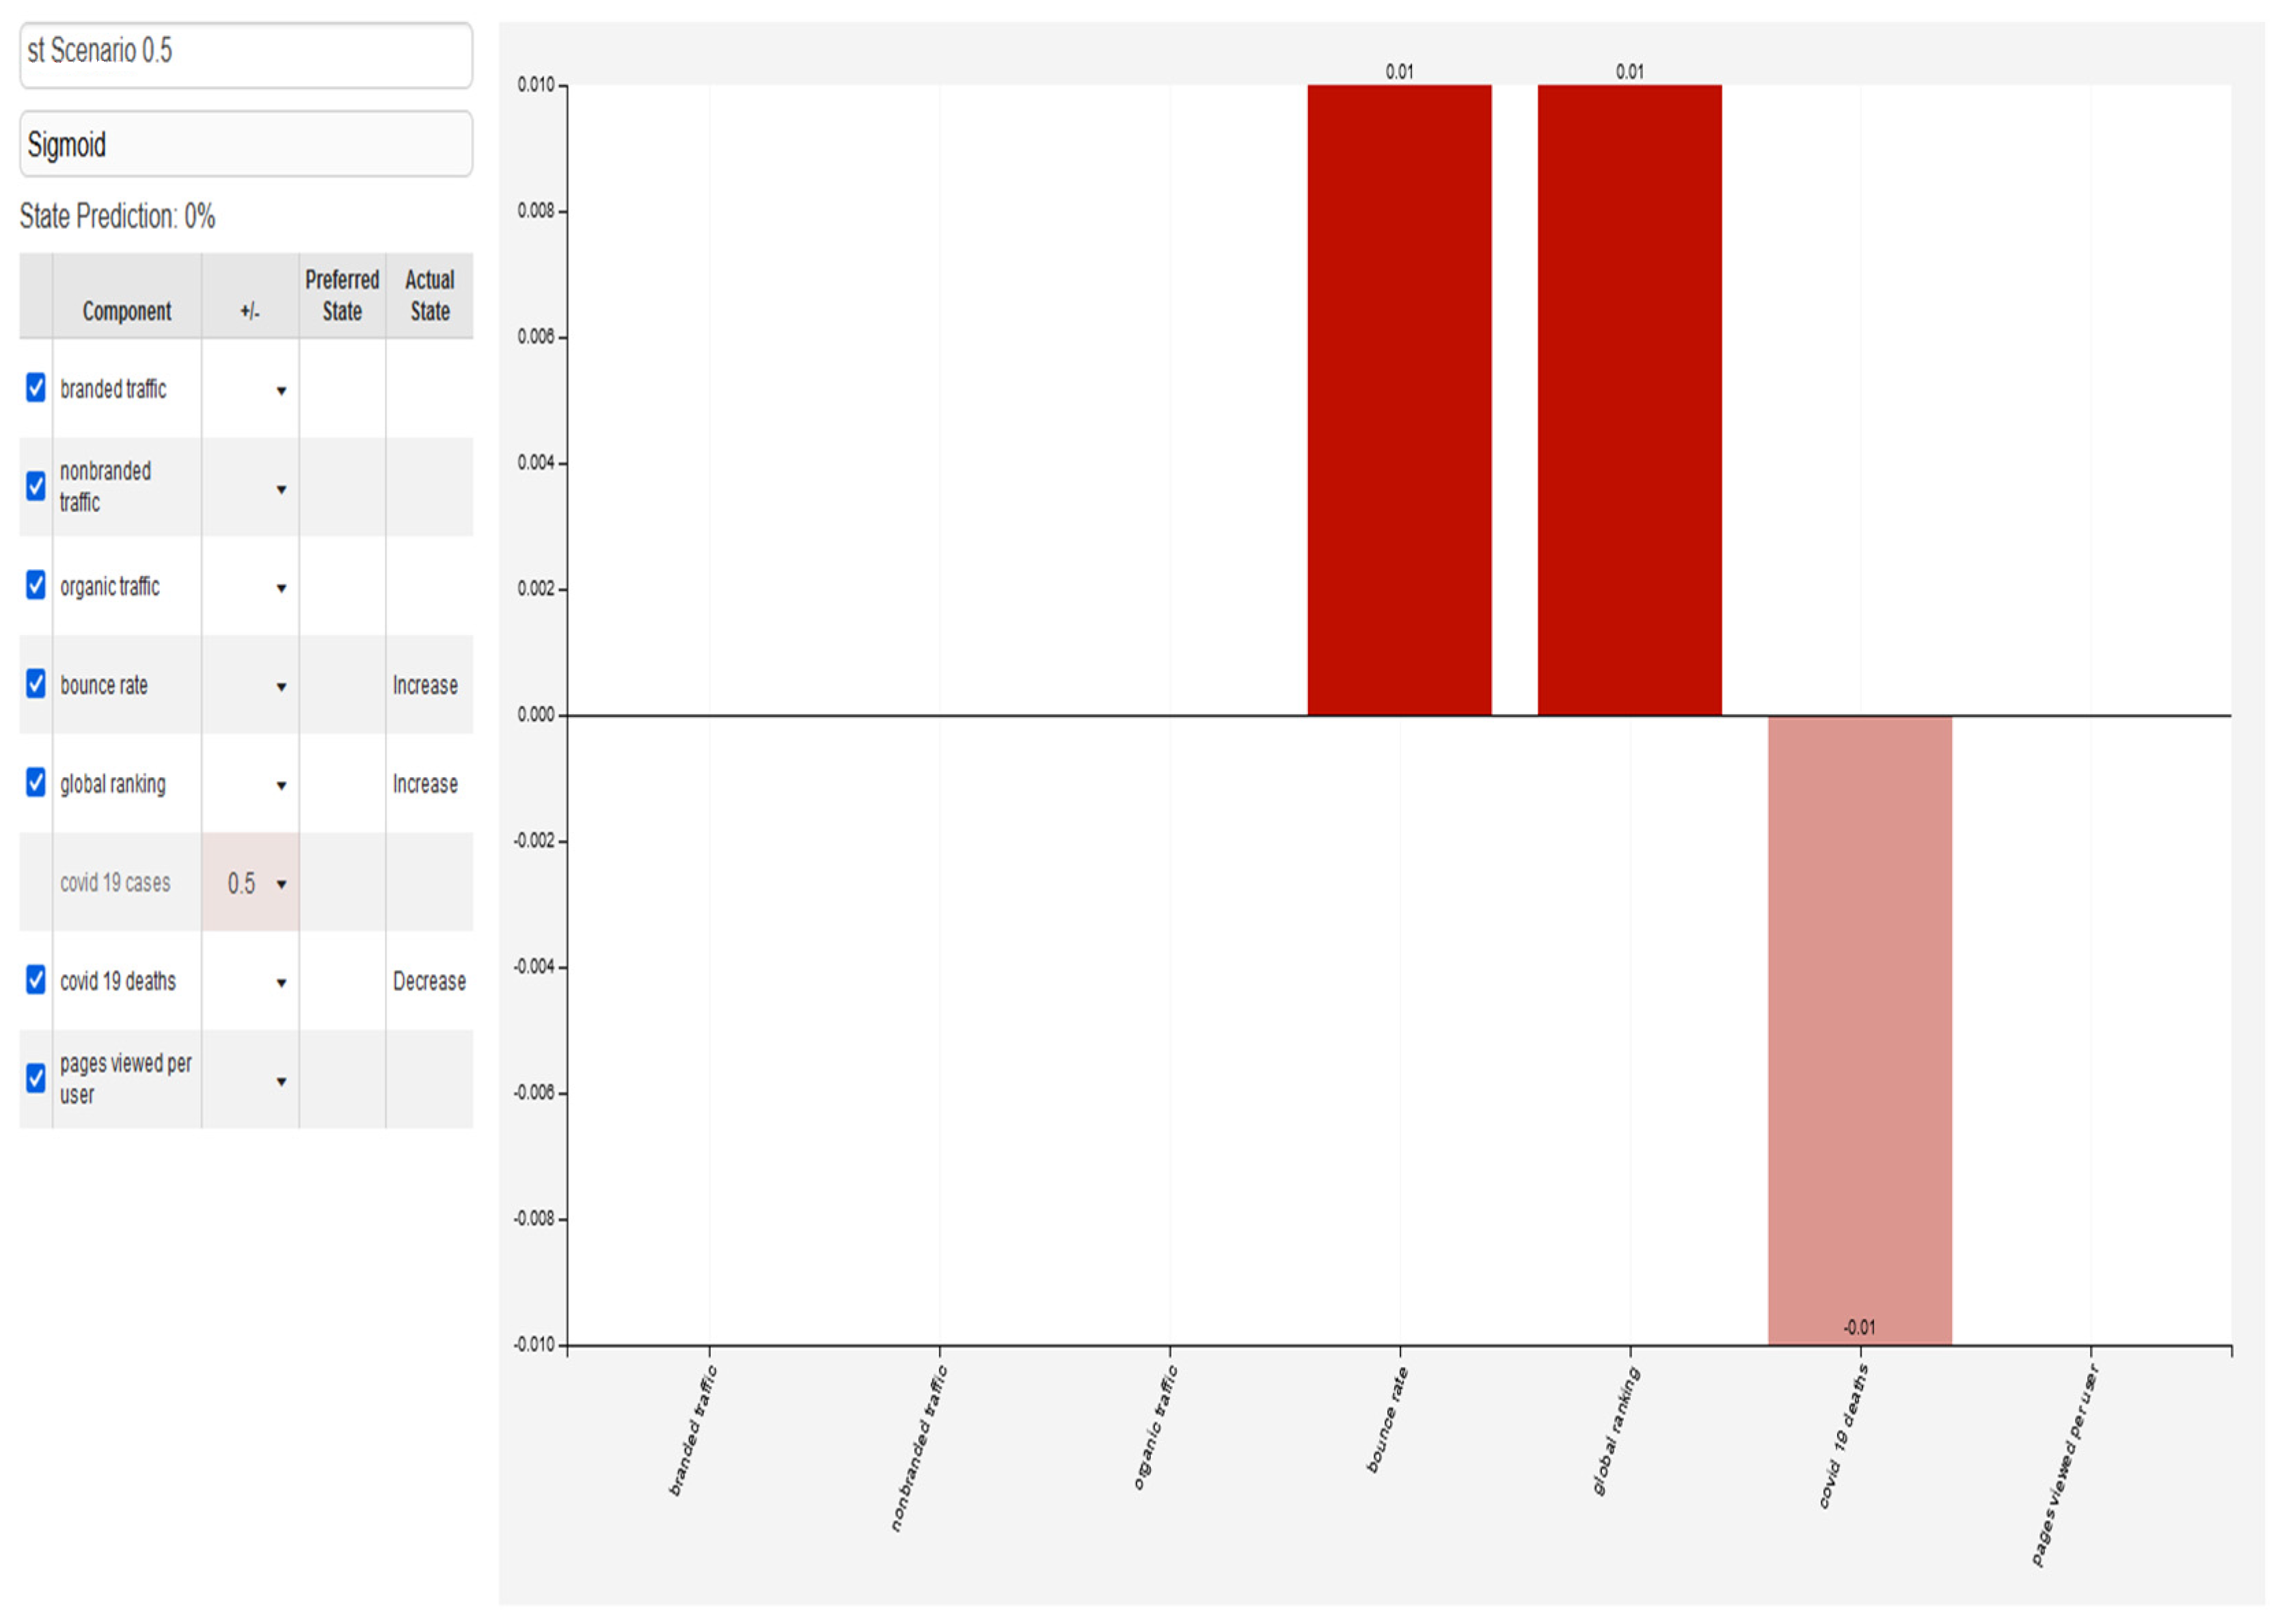
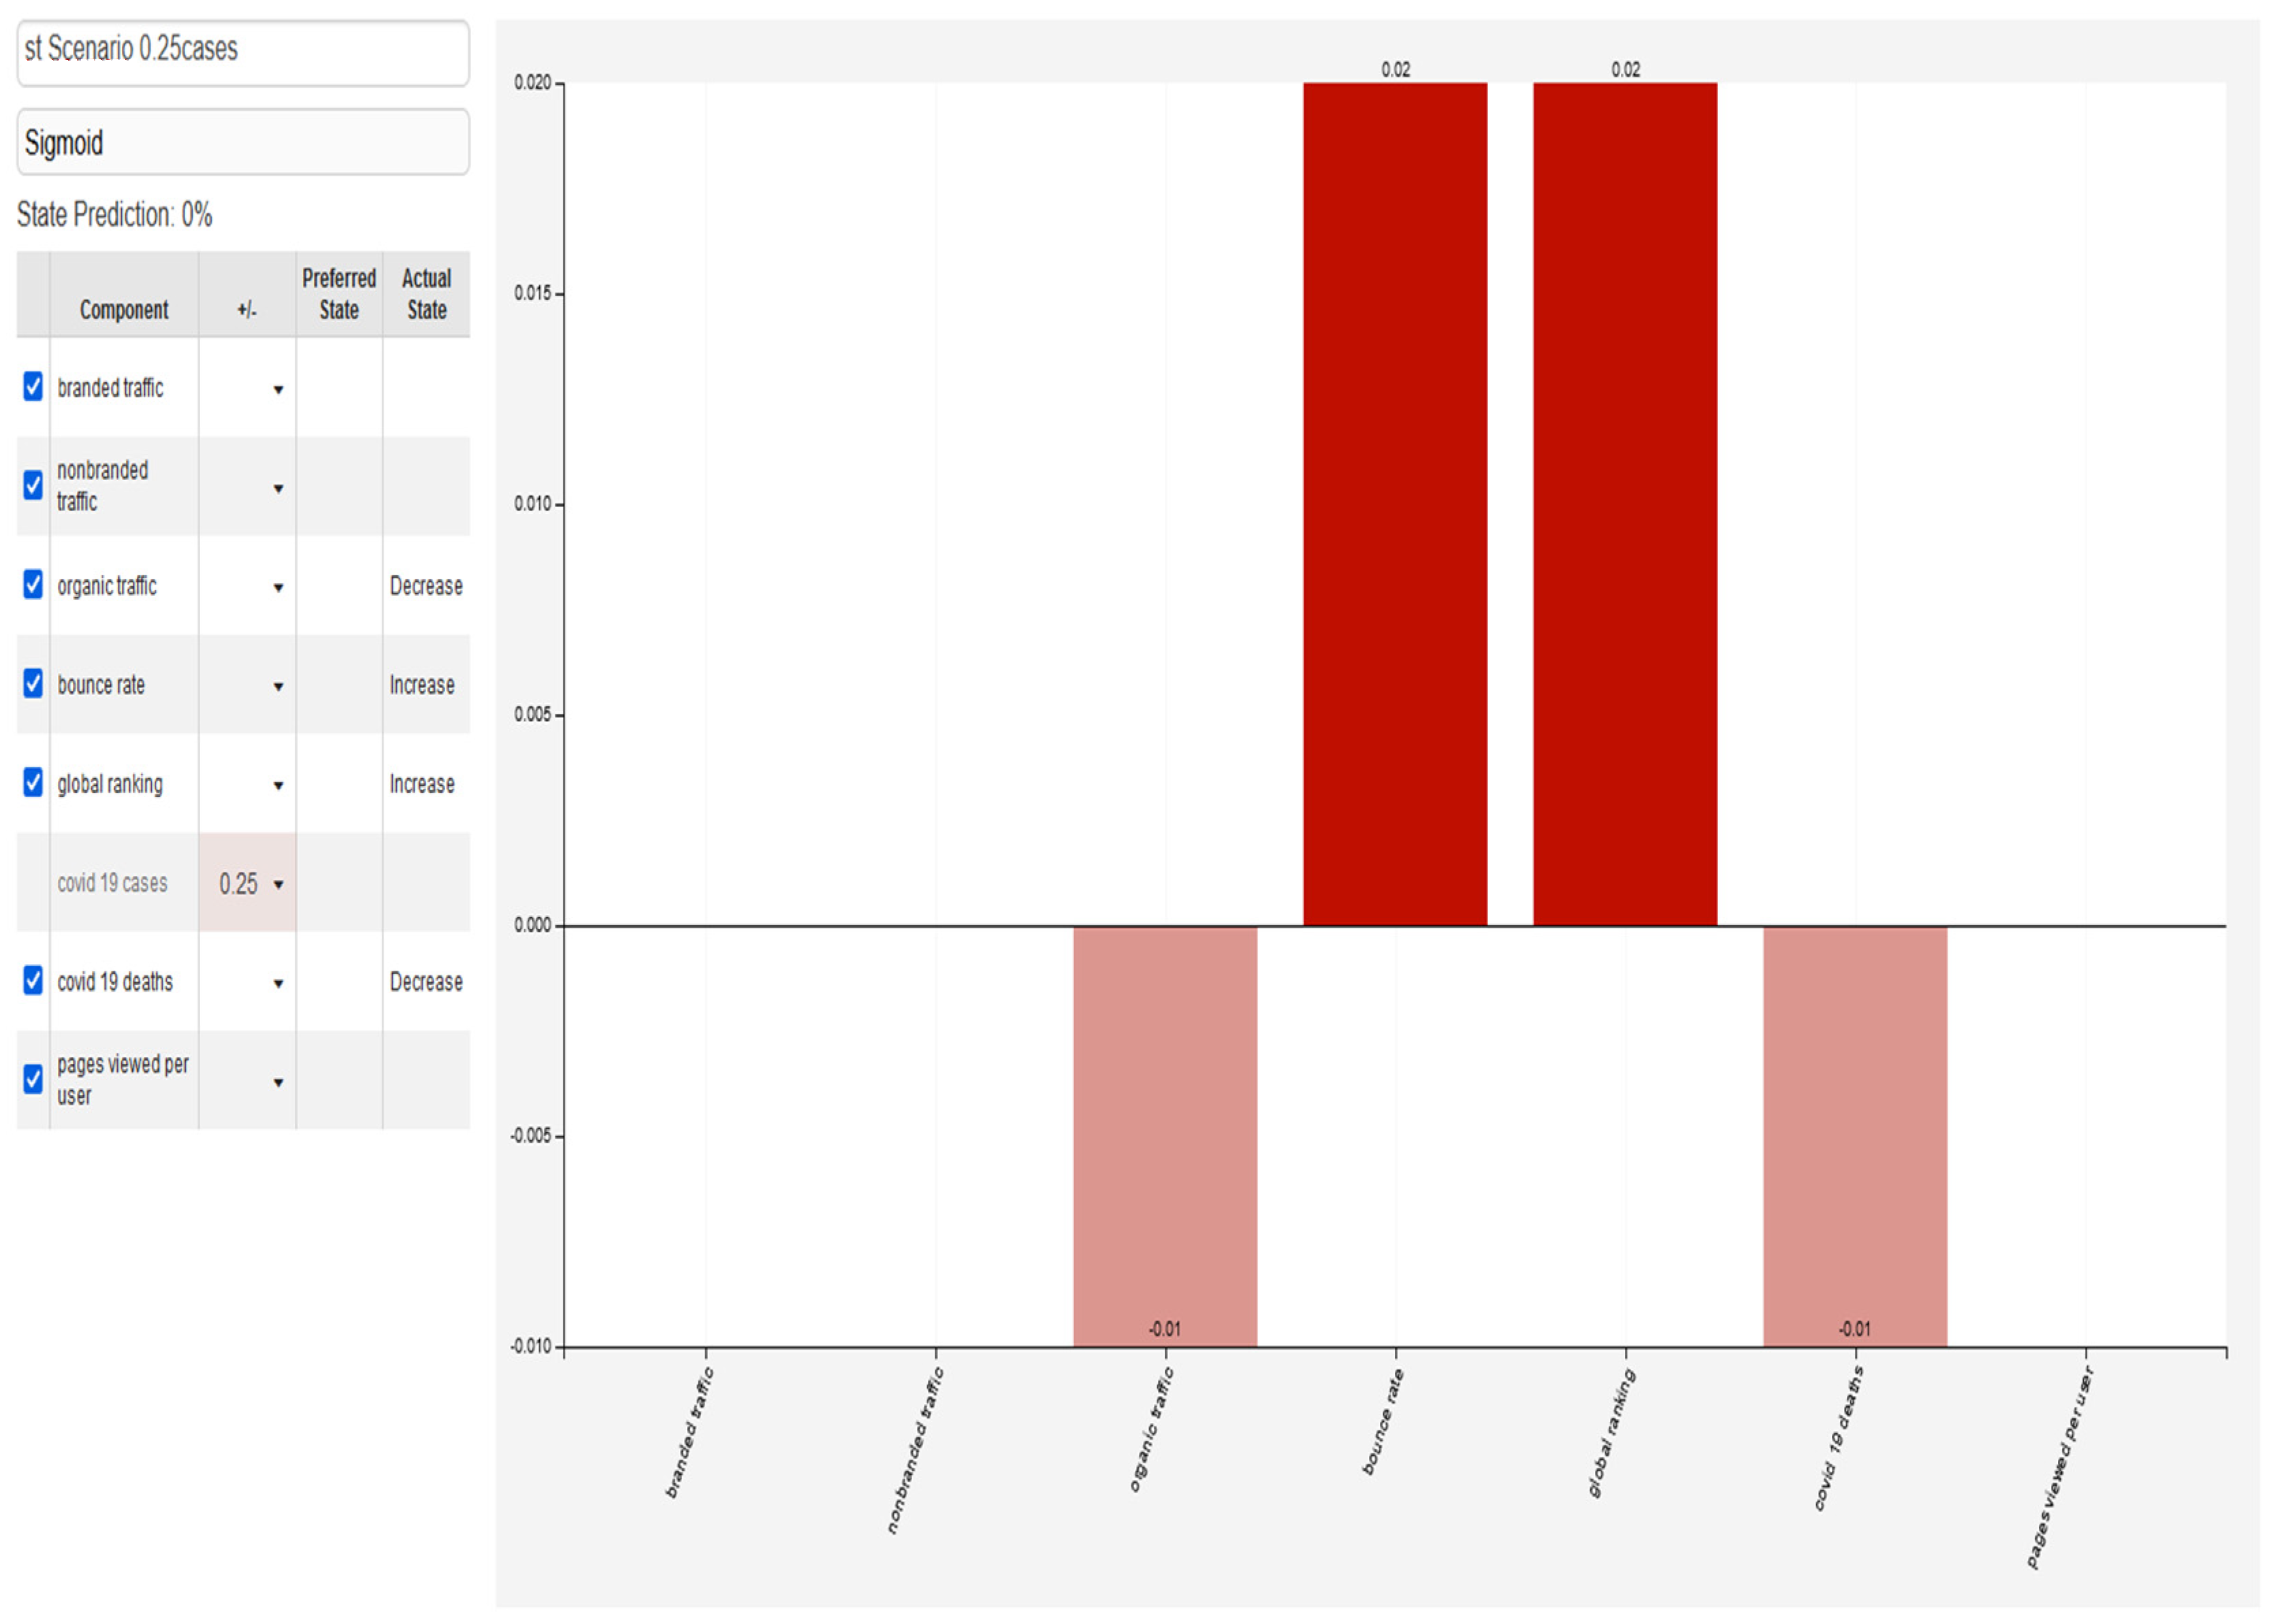
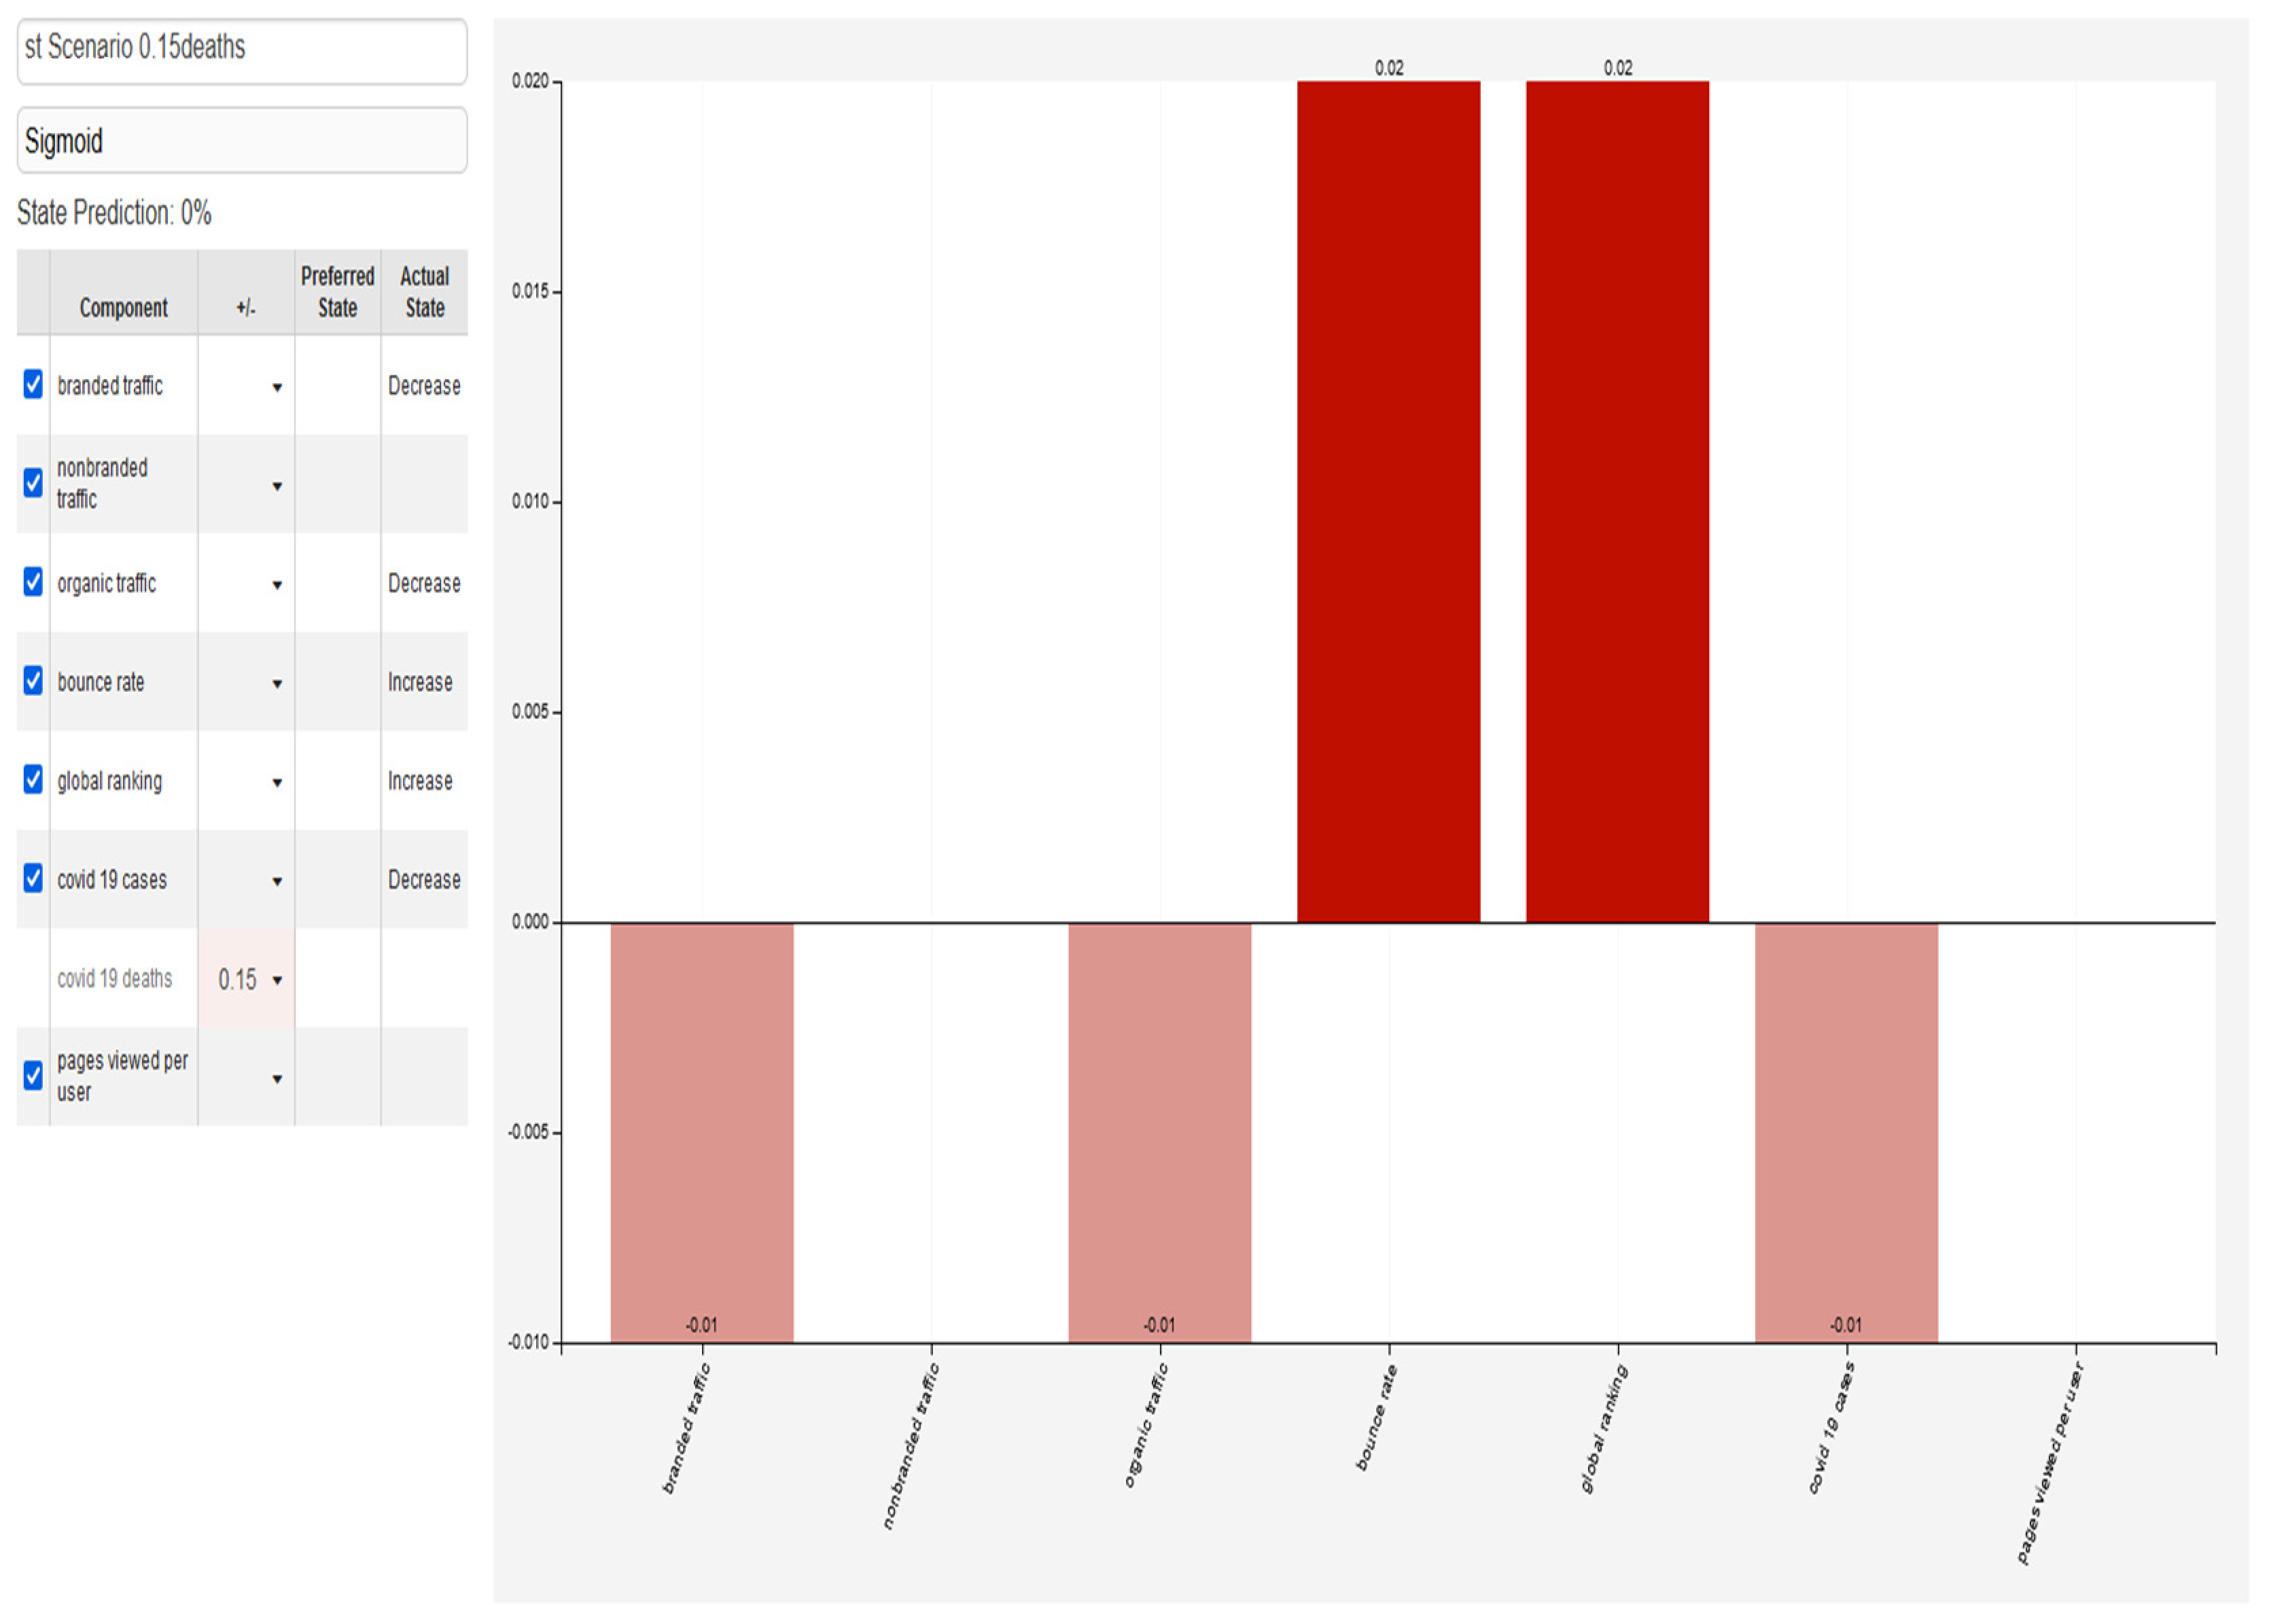
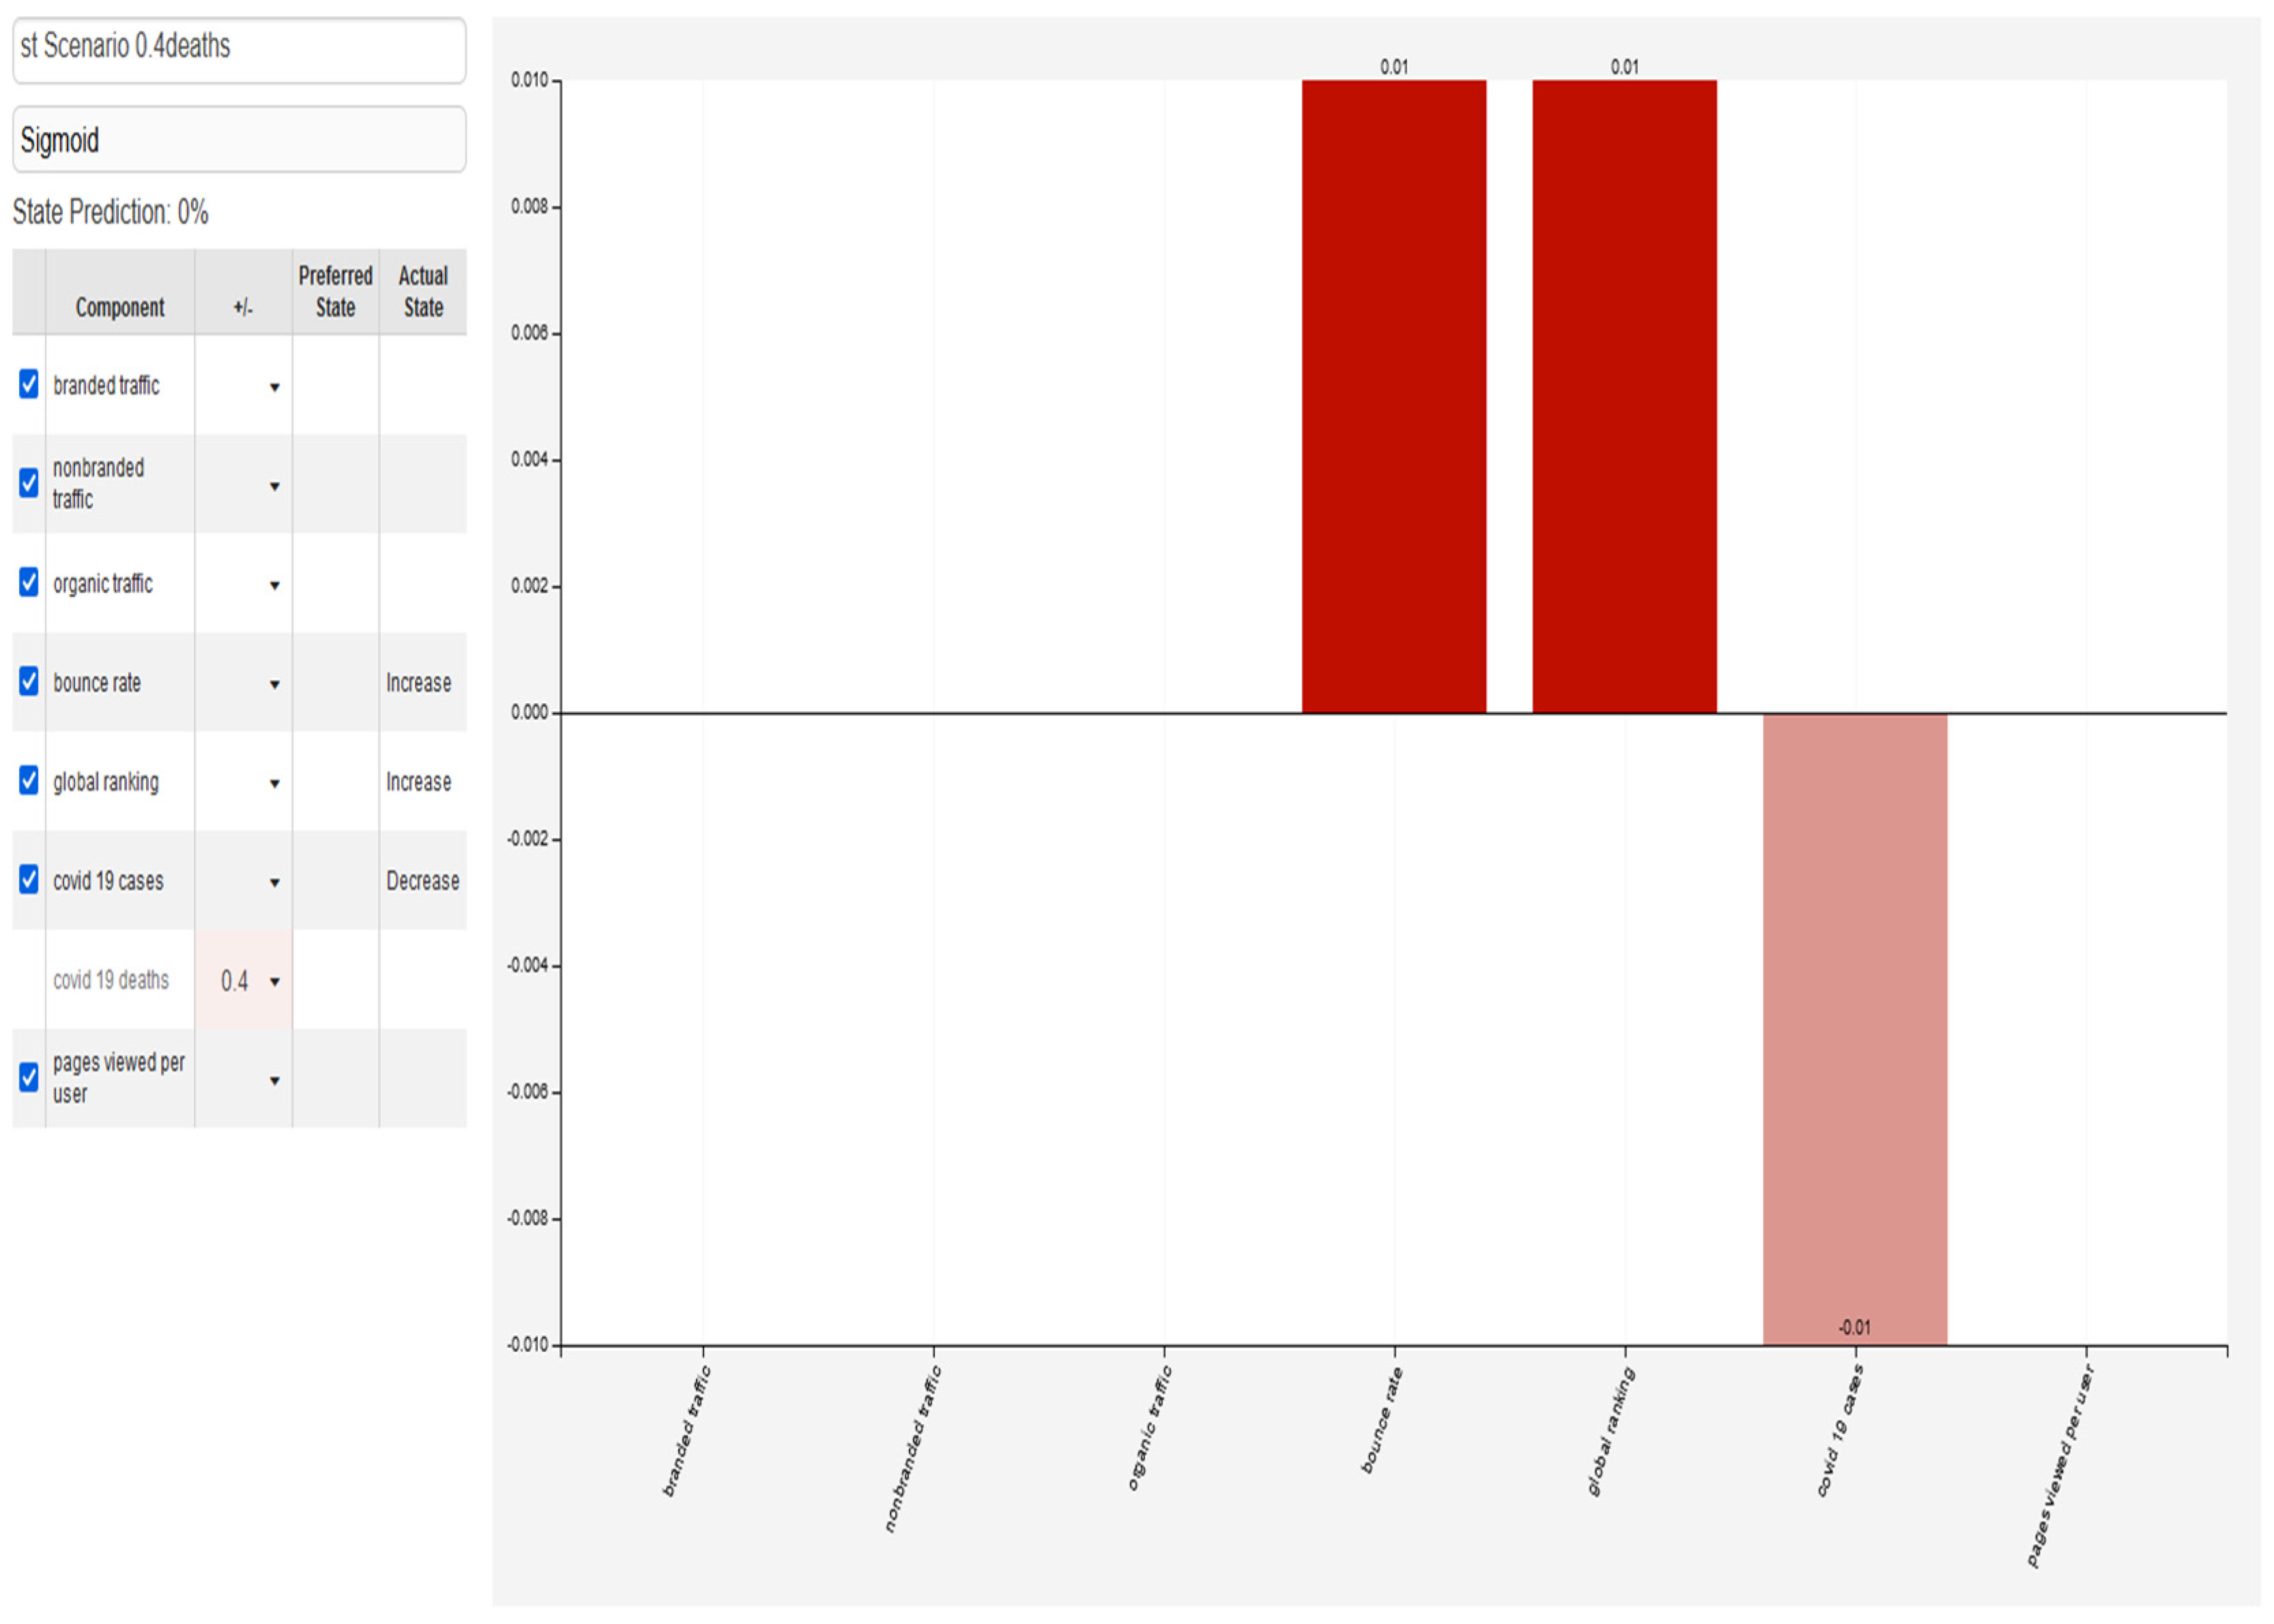
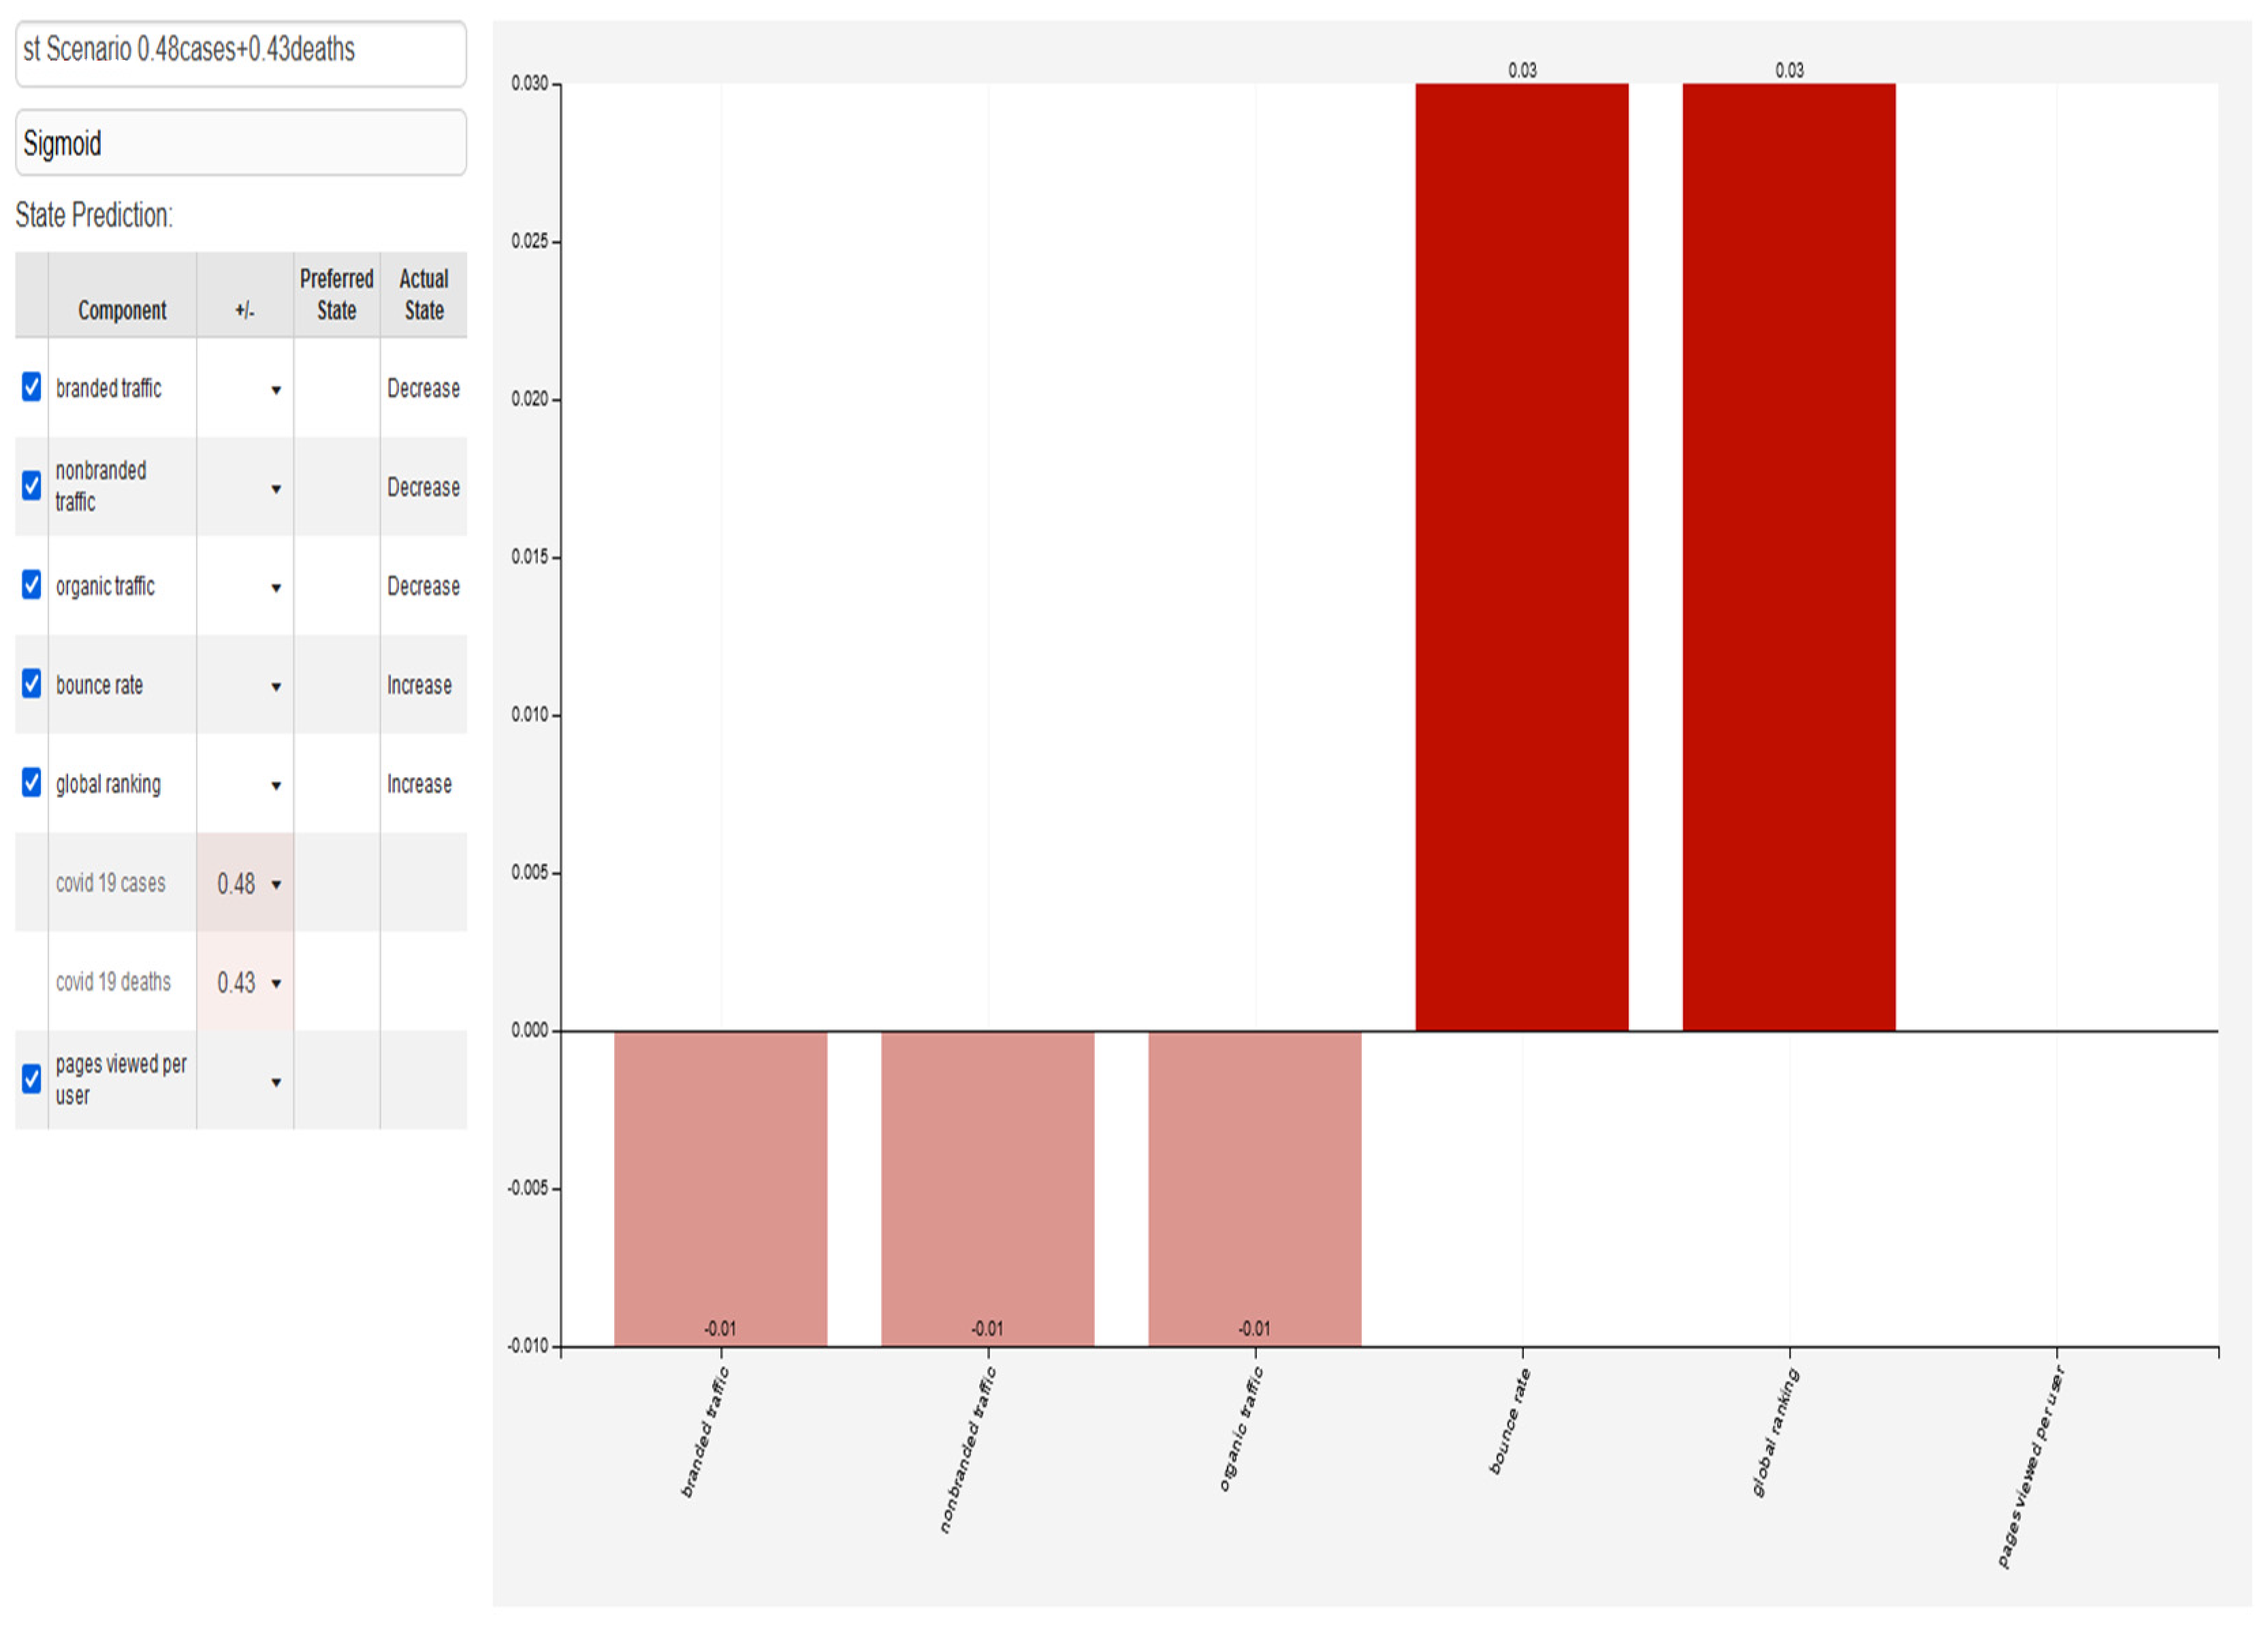
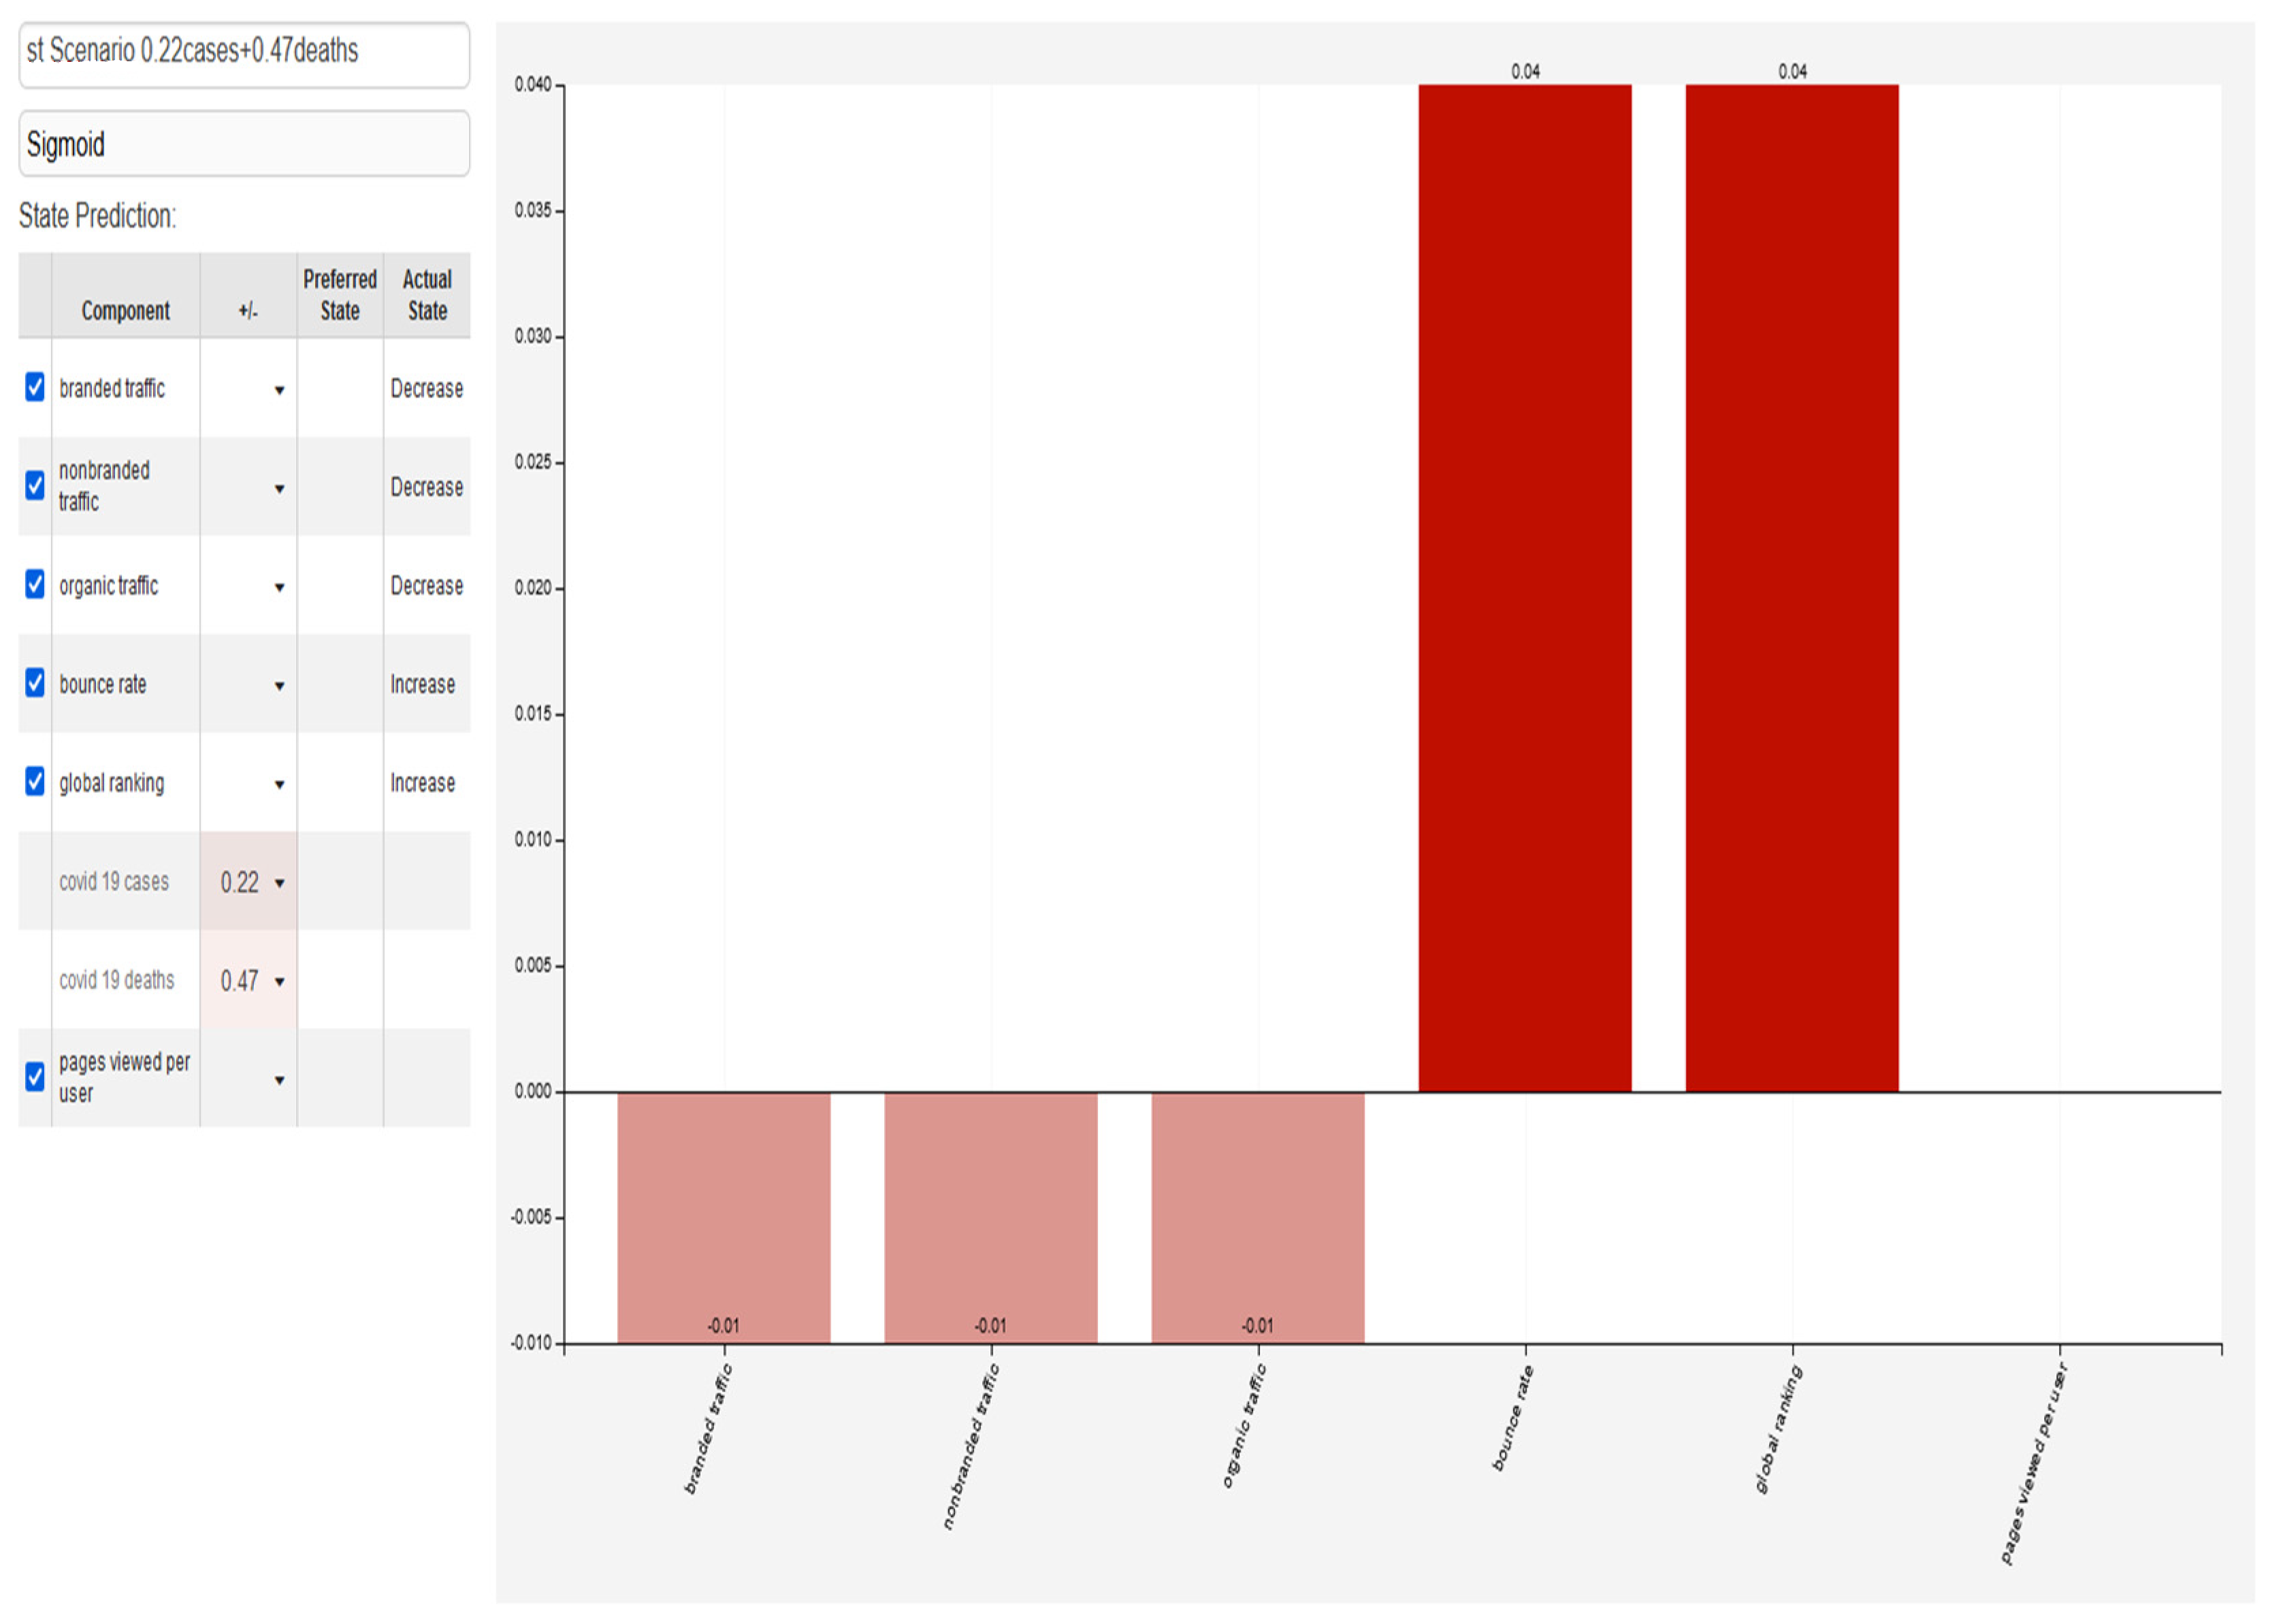
4.4. Outcomes of a Fuzzy Cognitive Mapping Scenario

For the COVID-19 scenario, six FCM possibilities were assessed. Based on the quantity of confirmed incidents, it simulated a moderate (1) and a more acute (2) situation of the crisis in Scenarios 1 and 2, respectively. The results of Scenarios 1 and 2 supported the statistical findings and showed that as COVID-19 cases mounted, the worldwide ranking altered (rises or falls) in response to rising non-branded traffic and rising branded traffic values, with the latter showing a more pronounced rise. These findings are relevant to, and consistent with, H1a and H2b.
Scenarios 1 and 2 further support the idea that the pages seen per user KPI is not significantly impacted by a rise in the number of confirmed cases, according to the statistical findings on hypotheses H3a and H3b.
The number of fatalities clearly linked to COVID-19 shows that the current study also simulated a crisis escalation at a moderate (scenario 3) and more severe (scenario 4) level.
The data from scenarios 3 and 4 supported the statistical findings by showing how the worldwide ranking improves (declines) as non-branded traffic and branded traffic values rise, with the latter showing a more significant increase in response to an increase in COVID-19-related mortality.
These scenarios corroborate the results related to Hypotheses H1a and H2b. The statistical results for H4a and H4b support the hypothesis that a spike in COVID-19-related mortality has no effect on the KPI for pages visited per user in scenarios 1 and 2. For scenario 5, a random date was selected in order to duplicate the dual influence of the two independent events on the KPI-related variables.
In terms of traffic-related and user engagement factors, scenario 5 produced more pronounced alterations while continuing the same pattern as compared to the statistical analysis of scenarios 1–4.
In Scenario 6, a pandemic with greater mortality per unit of illnesses than COVID-19 was simulated. The findings supported those from scenarios 1–4 and showed that trainee conduct was unaffected by lethality.
The pages seen per user KPI showed no discernible change in scenarios 5 or 6. The outcomes of the FCM simulation scenarios point to the need for online course platforms to further boost their brand reputation when a crisis worsens in order to handle the resulting company risk more skillfully.
Companies should invest in developing their digital marketing strategies and be ready to increase website traffic through paid advertising, SEO, and backlinks.
The results of the FCM simulation scenarios demonstrate that firms should not concentrate on optimizing their websites or adjusting their ideas for corporate risk management to take crisis lethality into consideration, as doing so would seem to be futile in both scenarios.

5. Discussion

The goal of this paper is to present a new procedure that supply chain companies can use to forecast how online learning environments and students’ perceptions of risk, including forecasting, will affect their behavior following an outbreak, as well as during the escalation of a novel crisis. Additionally, the paper aims to explore the ultimate impact of their behavior, guided by forecasting, on the company’s brand name and website.
The managers of SCRM will be able to use this information to make smart strategic decisions about investments that will reduce corporate risk to their company. This investigation drew on information about root domain rankings, website visitor behavior, traffic-related KPIs, and data mining from online analytics tools.
The COVID-19 outbreak had a big influence on all six KPIs, as evidenced by the comparison of data collected before and during the outbreak.
The outcomes of the KPIs relating to traffic support the conclusions made by Forster and Tang [46]. Researchers calculated the impact of the 2003 Hong Kong SARS epidemic on the web by comparing sales units to the daily number of SARS infections.
Online sales have increased significantly, according to researchers. These outcomes match those of the ongoing inquiry. During the COVID-19 crisis, another study with comparable findings [47] also showed a considerable rise in web activity.
Moreover, this study used web analytics data, statistical analysis, financial data, and questionnaires to look at how the COVID-19 problem affected trainee behavior in e-learning. The results of this study and the FCM-based findings are consistent, suggesting that learners may turn to online learning options in urgent situations. With the limits on migration imposed in almost every country, which have increased the demand for online education services, this tendency is expected. The react–cope–adapt (RCA) model, which suggests that trainees acquire new behaviors and coping mechanisms following an initial reaction to a new contextual limitation, is consistent with this outcome.
The findings suggest that this technique may be utilized to alleviate transportation limits brought on by pandemics, despite the fact that it was developed to address budgetary constraints. These results are consistent with a study by Sheth (2020), which indicated that trainee behavior reactions to COVID-19-induced house arrest included embracing new technology to encourage consumption.
The crisis had a substantial impact on online trainees’ choices for educational materials as well. Data research showed that once the crisis began, trainees began finding online courses’ platforms by searching for the name of the company.
This result supports the psychometric paradigm [12], which contends that despite significant difficulties in providing the desired level of services, trainees trusted specific businesses with a strong reputation rather than looking for online courses’ platforms services more generally. Although trainees undoubtedly turned to well-known brands during the crisis, they also appeared more interested in both branded and non-branded alternatives, suggesting that this relationship was not caused by the crisis’s escalation. This is due to the fact that there was no clear relationship between the ratio of non-branded to branded traffic at this time and the number of COVID-19 instances or deaths reported.
These results sparked attention in the research of McCullough [48,49], who proposed that trainees might make up for prior good experiences they had with a brand in order to mend their relationship with it via “trainee forgiveness.” The results show that students are more inclined to overlook a lesson failure or poor service from a company with which they have previously conducted business during times of crisis.
The authors of [50] also reinforce the significance of the “trust” aspect, which is emphasized by the findings of this study, by stating that establishing trust is one of the essential elements for successfully selling services and products online. The current findings do not support the findings regarding economic restraints in [51,52,53,54,55,56], indicating significant distinctions between pandemic-related and economic crises. Economic limits encourage consumers to choose less expensive options (non-branded, private-label options), whereas pandemic-related restrictions urge consumers to choose more reliable suppliers.
The results also demonstrated that—mostly as a result of an increase in organic traffic—the global ranking KPI of online course platforms, service providers, and root domains either improves or drops. This increase may be related to the crisis’s escalation, even though it is more pronounced in terms of the quantity of diseases associated with COVID-19 than the total number of deaths worldwide. This may be explained by the fact that infections, not deaths, are typically used as the key statistic reflecting the global COVID-19 rise.
The observation that the COVID-19 cases variable, as opposed to the COVID-19 deaths variable, had a stronger impact on the outcomes in the FCM simulation of a more deadly pandemic provides additional evidence in favor of this hypothesis (Scenario 6).
After the COVID-19 outbreak, the number of pages read per user grew significantly, albeit barely (average pages before COVID-19: 2.36; average pages after COVID-19: 2.49). Visitors to the parent domain’s informational web pages on COVID-19 can understand this outcome. The COVID-19 situation seems to have had a minor impact on this increase.

6. Conclusions

This study’s findings suggest that innovative online courses platforms should be ready to handle a potential crisis that would result in a significant flood of trainees. The platforms need to build out their infrastructure and acquire a better reputation if they want to service a significant number of users. Trainees, however, prefer to believe in well-known platforms.
To lessen the risks brought on by the crisis, firms will also need to focus on the development of digital learning, including forecasting, to anticipate future demands. On crisis-related pages, advertisements for the online course platform, based on forecasting, will need to be displayed. However, this strategic approach should not only raise the platform’s search engine rating but also enhance the forecasting accuracy for targeted marketing.

6.1. Limitations of the Research

Five companies made up the sample for the current study, and the market capitalization as of 1 January 2020 was used. This criterion was selected to guarantee the sample’s financial size uniformity. Even while each of the five organizations had a global presence, not all of them relied equally on their websites for business, which is why some of the collected KPIs exhibit notable company-specific variances. The homogeneity of internet traffic could be used to create a sample as an alternate survey design strategy [54].
The data were gathered using web analytics software. It is difficult for researchers to obtain high-quality data for a large sample due to the fact that the accessibility of these data varies depending on the distance learning provider, and not all KPIs are accessible on all platforms. On the other hand, this site is the only place at which one can find web analytics data that are useful for research.
Future research could concentrate on analyzing platform-specific KPIs to address this issue and guarantee data homogeneity without additional processing.
FCM is a relatively recent tool for examining how a crisis affects the behavior of e-learning trainees. This explains why there has not been much prior research and why it is challenging for academics to compare their findings with earlier approaches.
Using “soft computing” approaches to e-learning trainee behavior allows for the drawing of a greater number of comparative outcomes [7].

6.2. Future Research

Future research might be able to examine e-learning platform users and the features they seek. This might motivate businesses to cater to the tastes of their distance-learning students, and it might also drive course designers to modify their content. The impact of greater KPI data may be the subject of future research. In this manner, the simulation would include additional information.

Author Contributions

Conceptualization, D.K.N., D.M.M., D.A.A., N.K., T.F. and D.E.K.; methodology, D.K.N., D.M.M. and D.A.A.; software, D.K.N., D.M.M., D.A.A., T.F. and D.E.K.; validation, D.K.N., D.M.M. and D.A.A.; formal analysis, D.K.N., N.K., T.F. and D.E.K.; investigation, D.K.N., D.M.M., D.A.A. and N.K.; resources, D.K.N., D.M.M., D.A.A., N.K., T.F. and D.E.K.; data curation, D.K.N., D.M.M. and D.A.A.; writing—original draft preparation, D.K.N., D.M.M. and D.A.A.; writing—review and editing, D.K.N., D.M.M., D.A.A., N.K., T.F. and D.E.K.; visualization, D.K.N., D.M.M. and D.A.A.; supervision, D.K.N.; project administration, D.K.N., D.M.M. and D.A.A.; funding acquisition, D.K.N., D.M.M., D.A.A., N.K., T.F. and D.E.K. All authors have read and agreed to the published version of the manuscript.

Funding

This research received no external funding.

Data Availability Statement

Data is contained within the article.

Conflicts of Interest

The authors declare no conflict of interest.

References

  1. Bing, L. E-learning and modern education reform. Educ. Inf. 2001, 10, 21–25. [Google Scholar]
  2. Capper, J. E-Learning Growth and Promise for the Developing World. Available online: http://techknowlogia.org/TKL_Articles/PDF/266.pdf (accessed on 1 May 2001).
  3. Shahriar, S.H.B.; Arafat, S.; Sultana, N.; Akter, S.; Khan, M.M.R.; Nur, J.M.E.H.; Khan, S.I. The transformation of education during the corona pandemic: Exploring the perspective of the private university students in Bangladesh. Asian Assoc. Open Univ. J. 2021, 16, 161–176. [Google Scholar] [CrossRef]
  4. Cloete, M.; Ellington, J.; van Vuuren, A.J.; Marais, E.A.; Masinga, P. Migrating From Face-To-Face to Online Learning During the COVID-19 Pandemic: The Experiences of Psychology Students at a Private Higher Education Institution in Gauteng. Cent. Eur. J. Educ. Res. 2021, 3, 11–21. [Google Scholar] [CrossRef]
  5. Mikołajczyk, K. Changes in the approach to employee development in organizations as a result of the COVID-19 pandemic. Eur. J. Train. Dev. 2022, 46, 544–562. [Google Scholar] [CrossRef]
  6. Qiu, F.; Zhang, G.; Sheng, X.; Jiang, L.; Zhu, L.; Xiang, Q.; Jiang, B. Predicting students’ performance in e-learning using learning process and behavior data. Sci. Rep. 2022, 12, 453. [Google Scholar] [CrossRef]
  7. Available online: https://www.oecd.org/education/the-impact-of-covid-19-on-education-insights-education-at-a-glance-2020.pdf (accessed on 1 June 2020).
  8. Available online: https://www.tandfonline.com/doi/abs/10.1080/07360932.2022.2052738 (accessed on 23 March 2022).
  9. Shahriar, S.H.B.; Akter, S.; Sultana, N.; Arafat, S.; Khan, M.M.R. MOOC-based learning for human resource development in organizations during the post-pandemic and war crisis: A study from a developing country perspective. J. Res. Innov. Teach. Learn. 2023, 16, 37–52. [Google Scholar] [CrossRef]
  10. Sai, O. Consumer Behavior Models: An Overview. Sai Om J. Commer. Manag. 2014, 1, 34–43. [Google Scholar]
  11. Zaichkowsky, J.L. Consumer behavior: Yesterday, today, and tomorrow. Bus. Horiz. 1991, 34, 51–59. [Google Scholar] [CrossRef]
  12. Fischhoff, B.; Slovic, P.; Lichtenstein, S.; Read, S.; Combs, B. How Safe Is Safe Enough? A Psychometric Study of Attitudes Toward Technological Risks and Benefits. Policy Sci. 1978, 9, 127–152. [Google Scholar] [CrossRef]
  13. Sjöberg, L.; Moen, B.-E.; Rundmo, T. Explaining risk perception. An. Eval. Psychom. Paradig. Risk Percept. Res. 2004, 10, 612–665. [Google Scholar]
  14. Kahan, D.M. Cultural Cognition as a Conception of the Cultural Theory of Risk. In Handbook of Risk Theory: Epistemology, Decision Theory, Ethics, and Social Implications of Risk; Roeser, S., Hillerbrand, R., Sandin, P., Peterson, M., Eds.; Springer: Dordrecht, The Netherlands, 2012; pp. 725–759. ISBN 978-94-007-1433-5. [Google Scholar]
  15. Ha, H.-Y. The Effects of Consumer Risk Perception on Pre-purchase Information in Online Auctions: Brand, Word-of-Mouth, and Customized Information. J. Comput.-Mediat. Commun. 2002, 8, JCMC813. [Google Scholar] [CrossRef]
  16. Corbitt, B.J.; Thanasankit, T.; Yi, H. Trust and e-commerce: A study of consumer perceptions. Electron. Commer. Res. Appl. 2003, 2, 203–215. [Google Scholar] [CrossRef]
  17. Loukis, E.; Charalabidis, Y.; Androutsopoulou, A. Evaluating a Passive Social Media Citizensourcing Innovation. In Proceedings of the Electronic Government, Thessaloniki, Greece, 14 August 2015; Tambouris, E., Janssen, M., Scholl, H.J., Wimmer, M.A., Tarabanis, K., Gascó, M., Klievink, B., Lindgren, I., Parycek, P., Eds.; Springer: Cham, Switzerland, 2015; pp. 305–320. [Google Scholar]
  18. Charalabidis, Y.; Loukis, E.; Androutsopoulou, A.; Karkaletsis, V.; Triantafillou, A. Passive crowdsourcing in government usingsocial media. Transform. Gov. People 2014, 8, 283–308. [Google Scholar]
  19. Arts, K.; Melero, Y.; Webster, G.; Sharma, N.; Tintarev, N.; Tait, E.; Mellish, C.; Sripada, S.; MacMaster, A.-M.; Sutherland, H.; et al. On the merits and pitfalls of introducing a digital platform to aid conservation management: Volunteer data submission and the mediating role of volunteer coordinators. J. Environ. Manag. 2020, 265, 110497. [Google Scholar] [CrossRef] [PubMed]
  20. Kirsh, I.; Joy, M. Splitting the Web Analytics Atom: From Page Metrics and KPIs to Sub-Page Metrics and KPIs. In Proceedings of the 10th International Conference on Web Intelligence, Mining and Semantics, Biarritz, France, 30 June–3 July 2020; pp. 33–43. [Google Scholar]
  21. Mani, V.; Delgado, C.; Hazen, B.; Patel, P. Mitigating Supply Chain Risk via Sustainability Using Big Data Analytics: Evidenc from the Manufacturing Supply Chain. Sustainability 2017, 9, 608. [Google Scholar] [CrossRef]
  22. Mikusz, M.; Clinch, S.; Jones, R.; Harding, M.; Winstanley, C.; Davies, N. Repurposing Web Analytics to Support the IoT. Computer 2015, 48, 42–49. [Google Scholar] [CrossRef]
  23. Borgo, R.; Micallef, L.; Bach, B.; McGee, F.; Lee, B. Information Visualization Evaluation Using Crowdsourcing. Comput. Graph. Forum 2018, 37, 573–595. [Google Scholar] [CrossRef]
  24. Baye, M.R.; De los Santos, B.; Wildenbeest, M.R. Search Engine Optimization: What Drives Organic Traffic to Retail Sites? J. Econ. Manag. Strategy 2016, 25, 6–31. [Google Scholar] [CrossRef]
  25. Dijksterhuis, A.; Smith, P.K.; van Baaren, R.B.; Wigboldus, D.H.J. The Unconscious Consumer: Effects of Environment on Consumer Behavior. J. Consum. Psychol. 2005, 15, 193–202. [Google Scholar] [CrossRef]
  26. Simonov, A.; Hill, S. Competitive Advertising on Brand Search: Traffic Stealing and Click Quality. Mark. Sci. 2021, 40, 923–945. [Google Scholar] [CrossRef]
  27. Simonov, A.; Hill, S. Competitive Advertising on Brand Search: Traffic Stealing, Adverse Selection and Customer Confusion. SSRN J. 2018. [Google Scholar] [CrossRef]
  28. Schiffman, L.G.; Kanuk, L.L.; Kumar, S.R.; Wisenblit, J. Consumer Behavior; Pearson Education: London, UK, 2010. [Google Scholar]
  29. Sirgy, M.J. Self-Concept in Consumer Behavior: A Critical Review. J. Consum. Res. 1982, 9, 287. [Google Scholar] [CrossRef]
  30. Dimanche, F.; Havitz, M.E. Consumer Behavior and Tourism: Review and Extension of Four Study Areas. J. Travel Tour. Mark. 1995, 3, 37–57. [Google Scholar] [CrossRef]
  31. Reddipalli, R. Howard Sheth Model of Consumer Behaviour on Buying a Smartphone. SSRN J. 2020. [Google Scholar] [CrossRef]
  32. Tidwell, P. Compensatory Versus Non-Compensatory Choice Strategies in Limited Problem Solving Consumer Behavior: Engel-Kollat-Blackwell Versus Howard Models. In Proceedings of the 1996 Academy of Marketing Science (AMS) Annual Conference, Phoenix, AZ, USA, 29 May–1 June 1996; Wilson, E.J., Hair, J.F., Eds.; Springer: Cham, Switzerland, 2015; pp. 220–224, ISBN 978-3-319-13143-6. [Google Scholar]
  33. Vignali, C. Benetton’s Brand Position Explored and Developed through Nicosia’s Consumer-behaviour Model. J. Text. Inst. 1999, 90, 48–59. [Google Scholar] [CrossRef]
  34. Sherman, E.; Mathur, A.; Smith, R.B. Store environment and consumer purchase behavior: Mediating role of consumer emotions. Psychol. Mark. 1997, 14, 361–378. [Google Scholar] [CrossRef]
  35. Kosko, B. Fuzzy cognitive maps. Int. J. Man-Mach. Stud. 1986, 24, 65–75. [Google Scholar] [CrossRef]
  36. Papageorgiou, E.; Stylios, C.; Groumpos, P. Fuzzy Cognitive Map Learning Based on Nonlinear Hebbian Rule. In AI 2003: Advances in Artificial Intelligence; Lecture Notes in Computer Science; Gedeon, T.D., Fung, L.C.C., Eds.; Springer: Berlin/Heidelberg, Germany, 2003; Volume 2903, pp. 256–268. ISBN 978-3-540-20646-0. [Google Scholar]
  37. Liu, Z.; Satur, R. Contextual fuzzy cognitive map for decision support in geographic information systems. IEEE Trans. Fuzzy Syst. 1999, 7, 495–507. [Google Scholar]
  38. Diakoulakis, I.E.; Georgopoulos, N.B.; Koulouriotis, D.E.; Emiris, D.M. Towards a Holistic Knowledge Management Model. J. Knowl. Manag. 2004, 8, 32–46. [Google Scholar] [CrossRef]
  39. Papakostas, G.A.; Boutalis, I.S.; Koulouriotis, D.E.; Mertzios, B.G. Fuzzy Cognitive Maps for Pattern Recognition Applications. Int. J. Pattern Recognit. Artif. Intell. 2008, 22, 1461–1486. [Google Scholar] [CrossRef]
  40. Charitopoulos, A.; Rangoussi, M.; Koulouriotis, D.E. On the Use of Soft Computing Methods in Educational Data Mining and Learning Analytics Research: A Review of Years 2010–2018. Int. J. Artif. Intell. Educ. 2020, 30, 371–430. [Google Scholar] [CrossRef]
  41. Stylios, C.D.; Georgopoulos, V.C.; Malandraki, G.A.; Chouliara, S. Fuzzy cognitive map architectures for medical decision support systems. Appl. Soft. Comput. 2008, 8, 1243–1251. [Google Scholar] [CrossRef]
  42. Lee, K. Fuzzy cognitive map approach to web-mining inference amplification. Expert Syst. Appl. 2002, 22, 197–211. [Google Scholar] [CrossRef]
  43. Sakas, D.P.; Kamperos, I.D.G.; Reklitis, P. Estimating Risk Perception Effects on Courier Companies’ Online Customer Behavior during a Crisis, Using Crowdsourced Data. Sustainability 2021, 13, 12725. [Google Scholar] [CrossRef]
  44. Choi, T.-M.; Chan, H.; Yue, X. Recent Development in Big Data Analytics for Business Operations and Risk Management. IEEE Trans. Cybern. 2016, 99, 91–92. [Google Scholar] [CrossRef]
  45. Lee, K.C.; Lee, S. Interpreting the web-mining results by cognitive map and association rule approach. Inf. Process. Manag. 2011, 47, 482–490. [Google Scholar] [CrossRef]
  46. Forster, P.W.; Tang, Y. The Role of Online Shopping and Fulfillment in the Hong Kong SARS Crisis. In Proceedings of the 38th Annual Hawaii International Conference on System Sciences, Big Island, HI, USA, 3–6 January 2005; p. 271. [Google Scholar]
  47. Guthrie, C.; Fosso-Wamba, S.; Arnaud, J.B. Online consumer resilience during a pandemic: An exploratory study of e-commerce behavior before, during and after a COVID-19 lockdown. J. Retail. Consum. Serv. 2021, 61, 102570. [Google Scholar] [CrossRef]
  48. Sheth, J. Impact of Covid-19 on consumer behavior: Will the old habits return or die? J. Bus. Res. 2020, 117, 280–283. [Google Scholar] [CrossRef]
  49. McCullough, M.E. Forgiveness as Human Strength: Theory, Measurement, and Links to Well-Being. J. Soc. Clin. Psychol. 2000, 19, 43–55. [Google Scholar] [CrossRef]
  50. Kim, R.Y. The Impact of COVID-19 on Consumers: Preparing for Digital Sales. IEEE Eng. Manag. Rev. 2020, 48, 212–218. [Google Scholar] [CrossRef]
  51. She, J.; Jiang, J.; Ye, L.; Hu, L.; Bai, C.; Song, Y. 2019 Novel coronavirus of pneumonia in Wuhan, China: Emerging attack and management strategies. Clin. Transl. Med. 2020, 9, 19. [Google Scholar] [CrossRef]
  52. Koulouriotis, D.E.; Diakoulakis, I.E.; Emiris, D.M.; Antonidakis, E.N.; Kalliakatsos, I.A. Efficiently Modeling and Controlling Complex Dynamic Systems using Evolutionary Fuzzy Cognitive Maps. Int. J. Comput. Cogn. 2023, 1, 41–65. [Google Scholar]
  53. Koulouriotis, D.E.; Diakoulakis, I.E.; Emiris, D.M. Learning Fuzzy Cognitive Maps using Evolution Strategies: A Novel Schema for Modeling and Simulating High-Level Behavior. In Proceedings of the IEEE 2001 Congress on Evolutionary Computation (CEC- 2001), Seoul, Republic of Korea, 27–30 May 2001; pp. 364–371. [Google Scholar]
  54. Koulouriotis, D.E. Investment Analysis and Decision Making in Markets using Adaptive Fuzzy Causal Relationships. Oper. Res. Int. J. 2004, 4, 213–233. [Google Scholar] [CrossRef]
  55. Papakostas, G.A.; Polydoros, A.S.; Koulouriotis, D.E.; Tourassis, V.D. Towards Hebbian Learning of Fuzzy Cognitive Maps in Pattern Classification Problems. Expert Syst. Appl. 2012, 39, 10620–10629. [Google Scholar] [CrossRef]
  56. Ketipi, M.K.; Koulouriotis, D.E.; Karakasis, E.G.; Papakostas, G.A.; Tourassis, V.D. A flexible nonlinear approach for representing cause-effect relationships in FCMs. Appl. Soft Comput. 2012, 12, 3757–3770. [Google Scholar] [CrossRef]
Figure 1. Displaying the correlations between all eight variables is a fuzzy cognitive map (FCM). Blue and orange arrows, respectively, signify positive and negative associations. Each arrow’s direction indicates the cause-and-effect link, and their width corresponds to the degree of correlation. Using the cloud-based software Mental Modeler, this FCM was produced (http://www.mentalmodeler.com accessed on 1 January 2020).
Forecasting 05 00035 g001
Figure 2. A conceptual framework for comprehending the suggested factors that impact the global ranking of online learning platforms’ companies’ websites during the COVID-19 crisis escalation.
Forecasting 05 00035 g002
Figure 3. (a) Screenshot from Google.com with the date selected as the “0” level value, displaying daily new COVID-19 instances in all countries. (b) Screenshot from Google.com with the date set as the “1” level value, displaying daily new COVID-19 cases in all countries.
Forecasting 05 00035 g003
Figure 4. An illustration of Scenario 1′s results from mentalmodeler.com (accessed on 1 January 2020).
Forecasting 05 00035 g004
Figure 5. An illustration of Scenario 2′s effects from mentalmodeler.com (accessed on 1 January 2020).
Forecasting 05 00035 g005
Figure 6. An illustration of Scenario 3′s results from the website mentalmodeler.com (accessed on 1 January 2020).
Forecasting 05 00035 g006
Figure 7. (a) A screenshot from Google.com displaying the number of daily new COVID-19 instances reported globally with the date set as the “0” level value. (b) A screenshot from Google.com displaying the number of daily new COVID-19 cases reported globally with the date set as the “1” level value.
Forecasting 05 00035 g007
Figure 8. An illustration of Scenario 4′s results from the website mentalmodeler.com (accessed on 1 January 2020).
Forecasting 05 00035 g008
Figure 9. Two screenshots from google.com, (a) one showing the daily new COVID-19 instances reported globally in Scenario 5, and (b) the other showing the same information.
Forecasting 05 00035 g009
Figure 10. An illustration of Scenario 5′s outcomes from mentalmodeler.com (accessed on 1 January 2020).
Forecasting 05 00035 g010
Figure 11. An image from mentalmodeler.com showing the outcomes of Scenario 6.
Forecasting 05 00035 g011
Table 1. Factors based on trainees’ characteristics.
Social FactorsPersonal FactorsPsychological Factors
  • Social groups
  • Family
  • Social status
  • Age
  • Profession
  • Economic situation
  • Personality
  • Incentives
  • Perception
  • Beliefs
Table 2. An explanation of the studied key performance indicators (KPIs).
KPIDescription of the KPI
Global RankingThe level of a domain’s online exposure is indicated by its global rating, which is based on organic rankings and search traffic. This rating is determined by how frequently the domain appears for the displayed keywords in the database of the web analytics platform.
Organic Traffic“Organic traffic” refers to the quantity of users who access a website as a result of unpaid (“organic”) search results.
Branded Traffic Branded traffic is the percentage of website visitors who come from users who perform brand name searches.
Non-Branded TrafficNon-branded traffic refers to all search requests that did not contain the company’s name but yet resulted in a visit to the website [24].
Bounce RateThe bounce rate is the proportion of site visitors who land on one page before leaving without viewing any other pages.
Pages Viewed per UserThe number of pages viewed per user shows the proportion of visits to page views during the same reporting period.
Table 3. KPI-related descriptive statistics with Cronbach’s alpha rating.
VariableTime PeriodNMeanStandard DeviationStandard Error MeanCronbach’s Alpha
Global RankingPre-COVID-19121,314,2311,280,76236,2540.681
COVID-1912927,024182,37856,292
Branded TrafficPre-COVID-19124.6251.8680.5540.679
COVID-19128.8741.5890.451
Non-Branded TrafficPre-COVID-193652,278,2671,611,167481,1890.581
COVID-19365591,121112,28929,221
Organic TrafficPre-COVID-1912867,678,674861,651,556249,881,0890.610
COVID-191217,551,231,0003,581,709,6401,045,887,843
Bounce RatePre-COVID-19120.5660.05440.02100.589
COVID-19120.2300.01610.006
Pages Viewed per UserPre-COVID-19122.3650.1080.0290.589
COVID-19122.4780.0820.025
Table 4. Descriptive statistics of COVID-19-related variables.
VariableNMeanStandard DeviationStandard Error Mean
COVID-19 Cases122,215,802,6601,504,470,070434,303,099
COVID-19 Deaths1249,644,34724,349,4487,029,080
Table 5. Results of the descriptive independent samples t-test for the pre-COVID-19 KPI-related variable.
t-Test for Equality of Means
Variable Levene’s Test for Equality of Variances Significance (2-Tailed) Mean Difference Standard Error Difference
Global Ranking0.1670.000567.89289,674
Branded Traffic0.1890.000−5.3460.704
Non-Branded Traffic0.0000.0061,678,123563,988
Organic Traffic0.0000.000−5,818,907,5641,087,891,032
Bounce Rate0.0000.0000.9850.023
Pages Viewed per User0.5670.004−0.2340.04
Table 6. Correlations between variables that are statistically significant after PCC analysis.
VariablesPearson CorrelationSignificance (2-Tailed)
Branded TrafficandCOVID-19 Cases0.9890.000
Branded TrafficandCOVID-19 Deaths0.9670.001
Branded TrafficandGlobal Ranking−0.7840.029
Branded TrafficandPages Viewed per User0.7760.002
Branded TrafficandBounce Rate−0.8920.004
Branded TrafficandOrganic Traffic0.9670.000
Branded TrafficandNon-Branded Traffic0.9780.000
Non-Branded Traffic andCOVID-19 Cases0.8760.000
Non-Branded Traffic andCOVID-19 Deaths 0.8670.000
Non-Branded Traffic andGlobal Ranking−0.7760.002
Non-Branded Traffic andPages Viewed per User0.8720.015
Non-Branded Traffic andBounce Rate−0.7640.005
Non-Branded Traffic andOrganic Traffic0.9650.000
Organic TrafficandCOVID-19 Cases0.8990.000
Organic TrafficandCOVID-19 Deaths0.8850.000
Organic TrafficandGlobal Ranking−0.7820.004
Organic TrafficandPages Viewed per User0.6200.037
Organic TrafficandBounce Rate−0.7840.004
Bounce RateandCOVID-19 Cases−0.8430.001
Bounce RateandCOVID-19 Deaths −0.7830.004
Bounce RateandGlobal Ranking0.8710.004
Global RankingandCOVID-19 Cases−0.8120.002
Global RankingandCOVID-19 Deaths −0.5630.049
COVID-19 CasesandCOVID-19 Deaths 0.8780.000
Table 7. Showing all eight variables’ correlations in a matrix table. Correlations that are positive and negative are denoted by (+) and (−), respectively. This table was produced using the online tool Mental Modeler (http://www.mentalmodeler.com accessed on 1 January 2020).
Branded TrafficNon-Branded TrafficOrganic TrafficBounce RateGlobal RankingCOVID-19 CasesCOVID-19 DeathsPages Viewed per User
Branded Traffic10.980.97−0.89−0.780.990.970.78
Non-Branded Traffic0.9810.97−0.76−0.780.880.870.87
Organic Traffic0.970.971−0.78−0.780.90.890.62
Bounce Rate−0.89−0.76−0.7810.87−0.84−0.78
Global Ranking−0.78−0.78−0.780.871−0.81−0.56
COVID-19 Cases0.990.880.9−0.84−0.8110.88
COVID-19 Deaths0.970.870.89−0.78−0.560.881
Pages Viewed per User0.780.870.62 1
Table 8. The associations between all eight factors are shown in the Preferred state and metrics table. This Table was produced using the online tool Mental Modeler (http://www.mentalmodeler.com accessed on 1 January 2020).
ComponentIndegreeOutdegreeCentralityPreferred StateType
Total Components
8
Total Connections
56
Density
1
Connections per Component
7
Number of Driver Components
0
Number of Receiver Components
0
Number of Ordinary Components
8
Complexity Score
NaN
Branded Traffic7.367.35999999999999914.719999999999999 ordinary
Non-Branded Traffic7.117.10999999999999914.219999999999999 ordinary
Organic Traffic6.916.9113.82 ordinary
Bounce Rate5.925.9211.84 ordinary
Global Ranking5.585.58000000000000111.16 ordinary
COVID-19 Cases6.36.30000000000000112.60000000000001 ordinary
COVID-19 Deaths5.955.9511.9 ordinary
Pages Viewed per User3.273.276.54 ordinary
Disclaimer/Publisher’s Note: The statements, opinions and data contained in all publications are solely those of the individual author(s) and contributor(s) and not of MDPI and/or the editor(s). MDPI and/or the editor(s) disclaim responsibility for any injury to people or property resulting from any ideas, methods, instructions or products referred to in the content.

