
Predictive Data Analytics for Electricity Fraud Detection Using Tuned CNN Ensembler in Smart Grid


Abstract
:1. Introduction
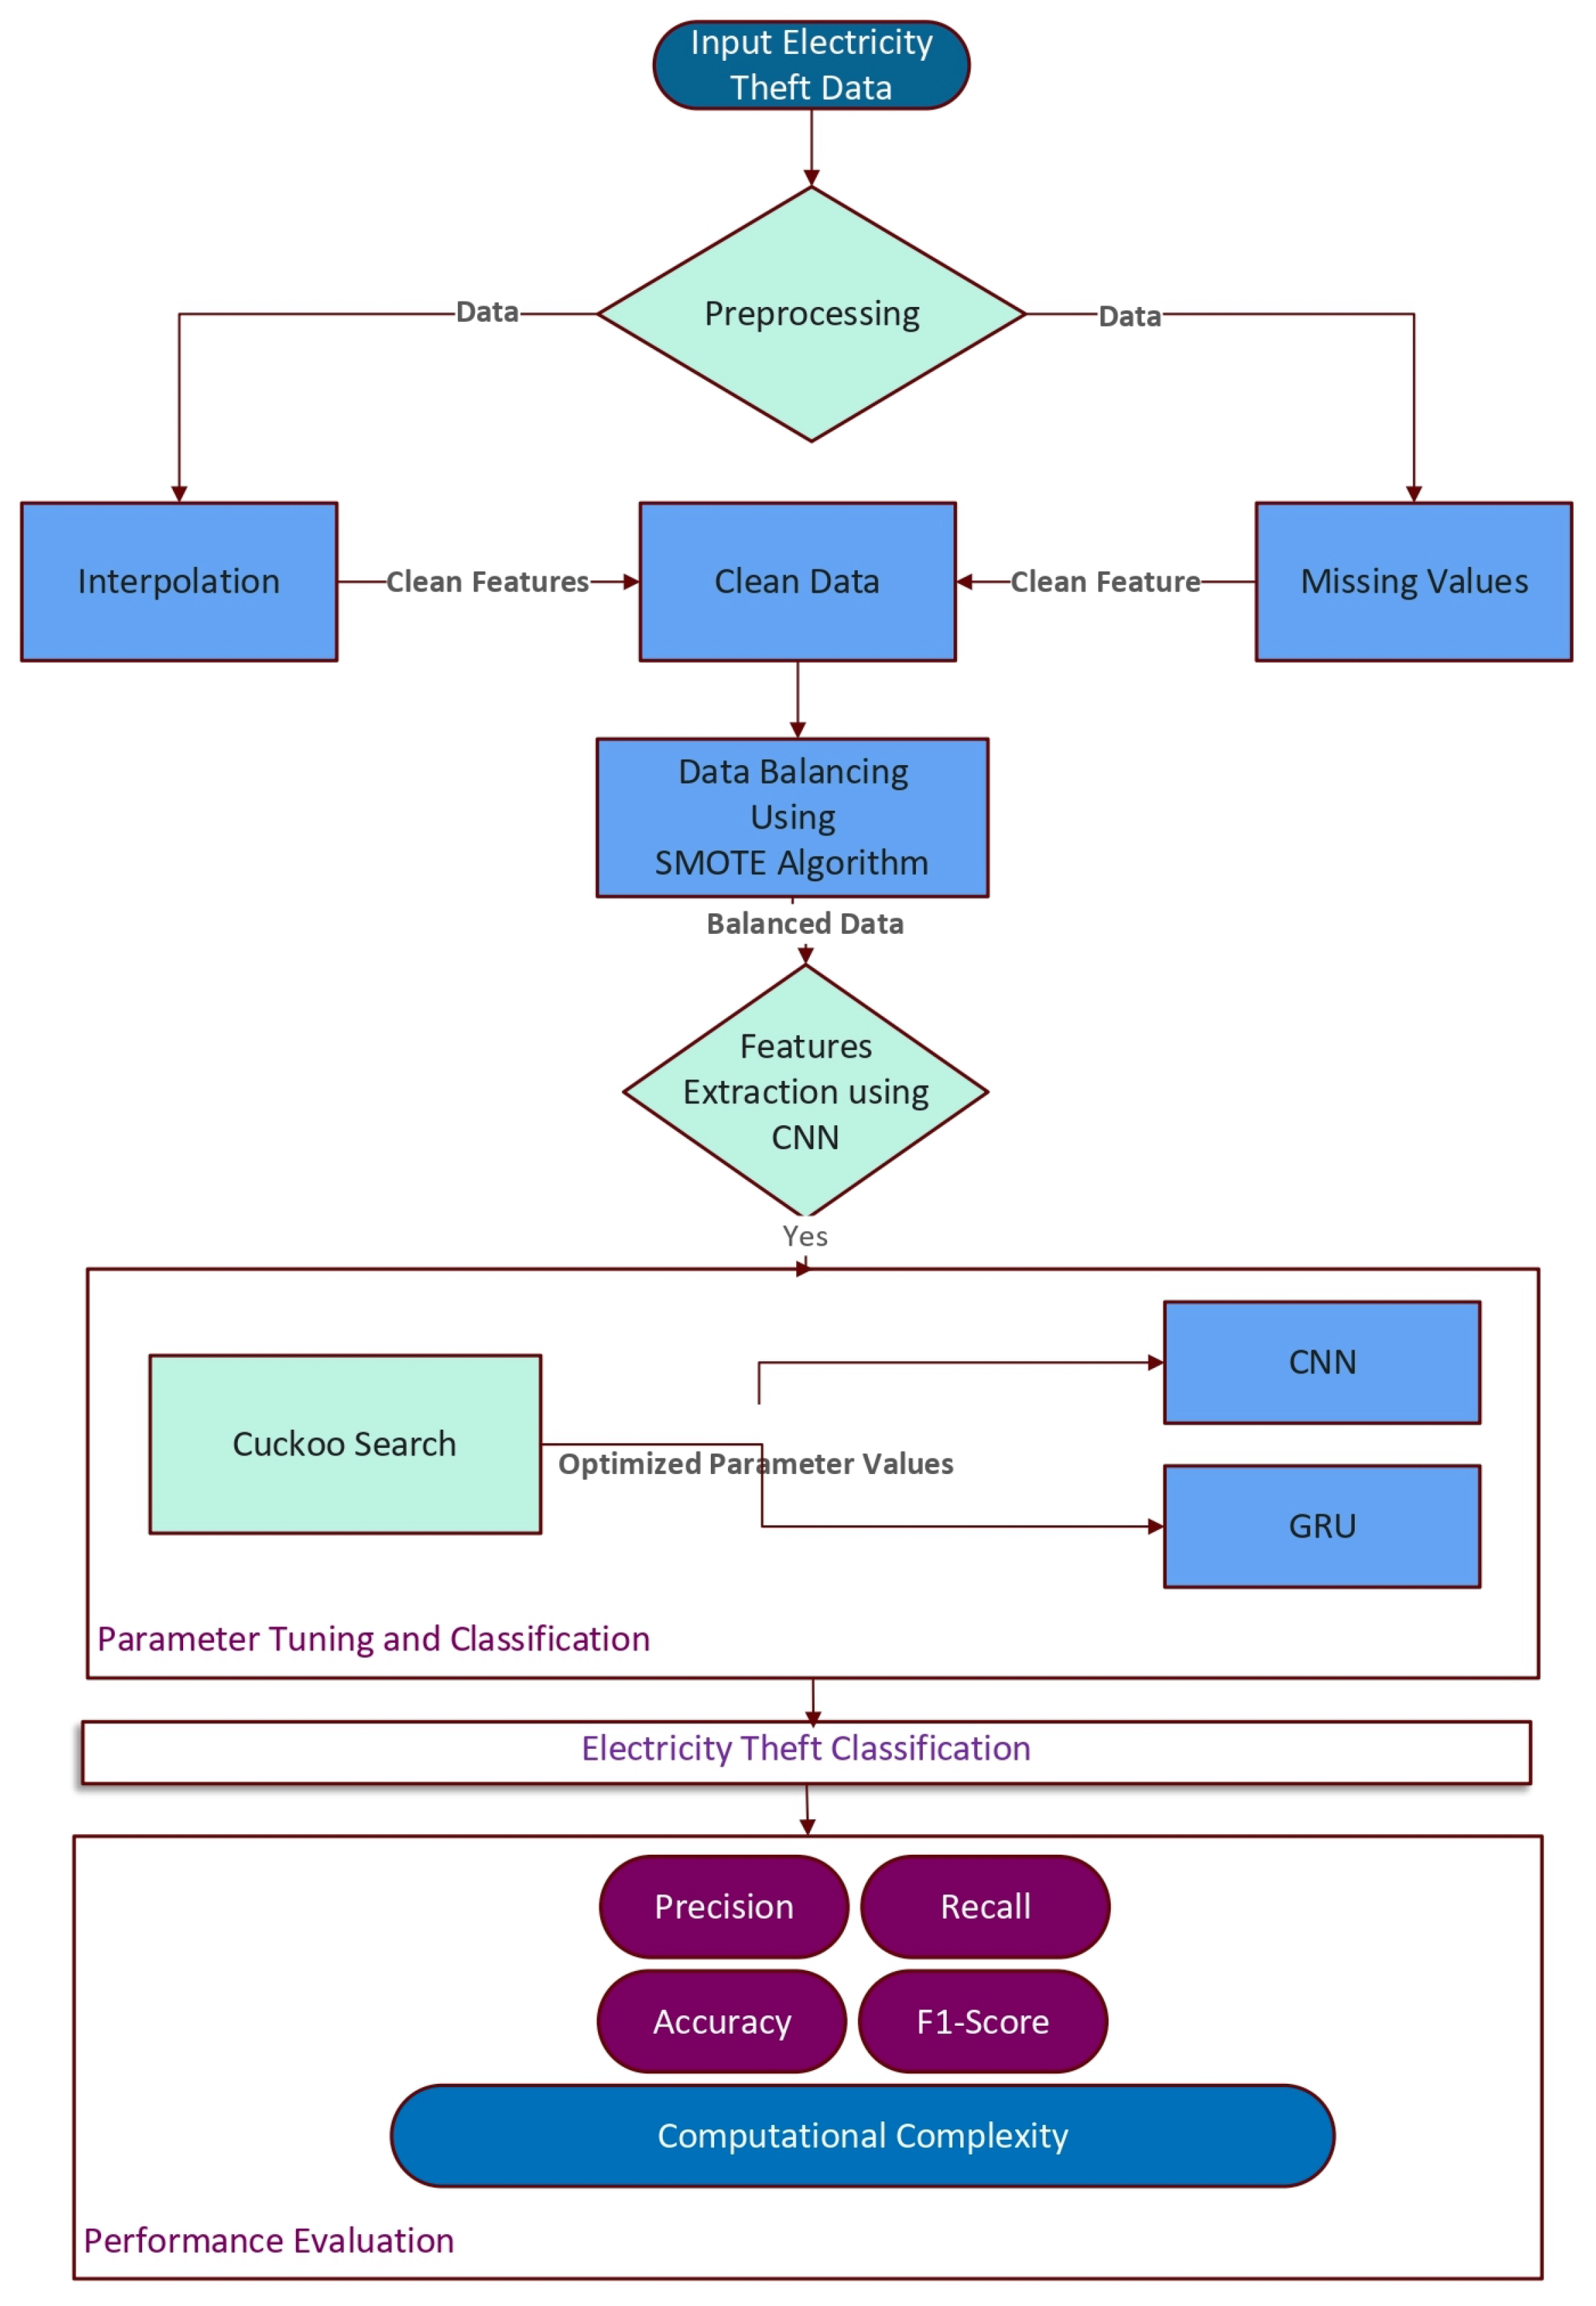
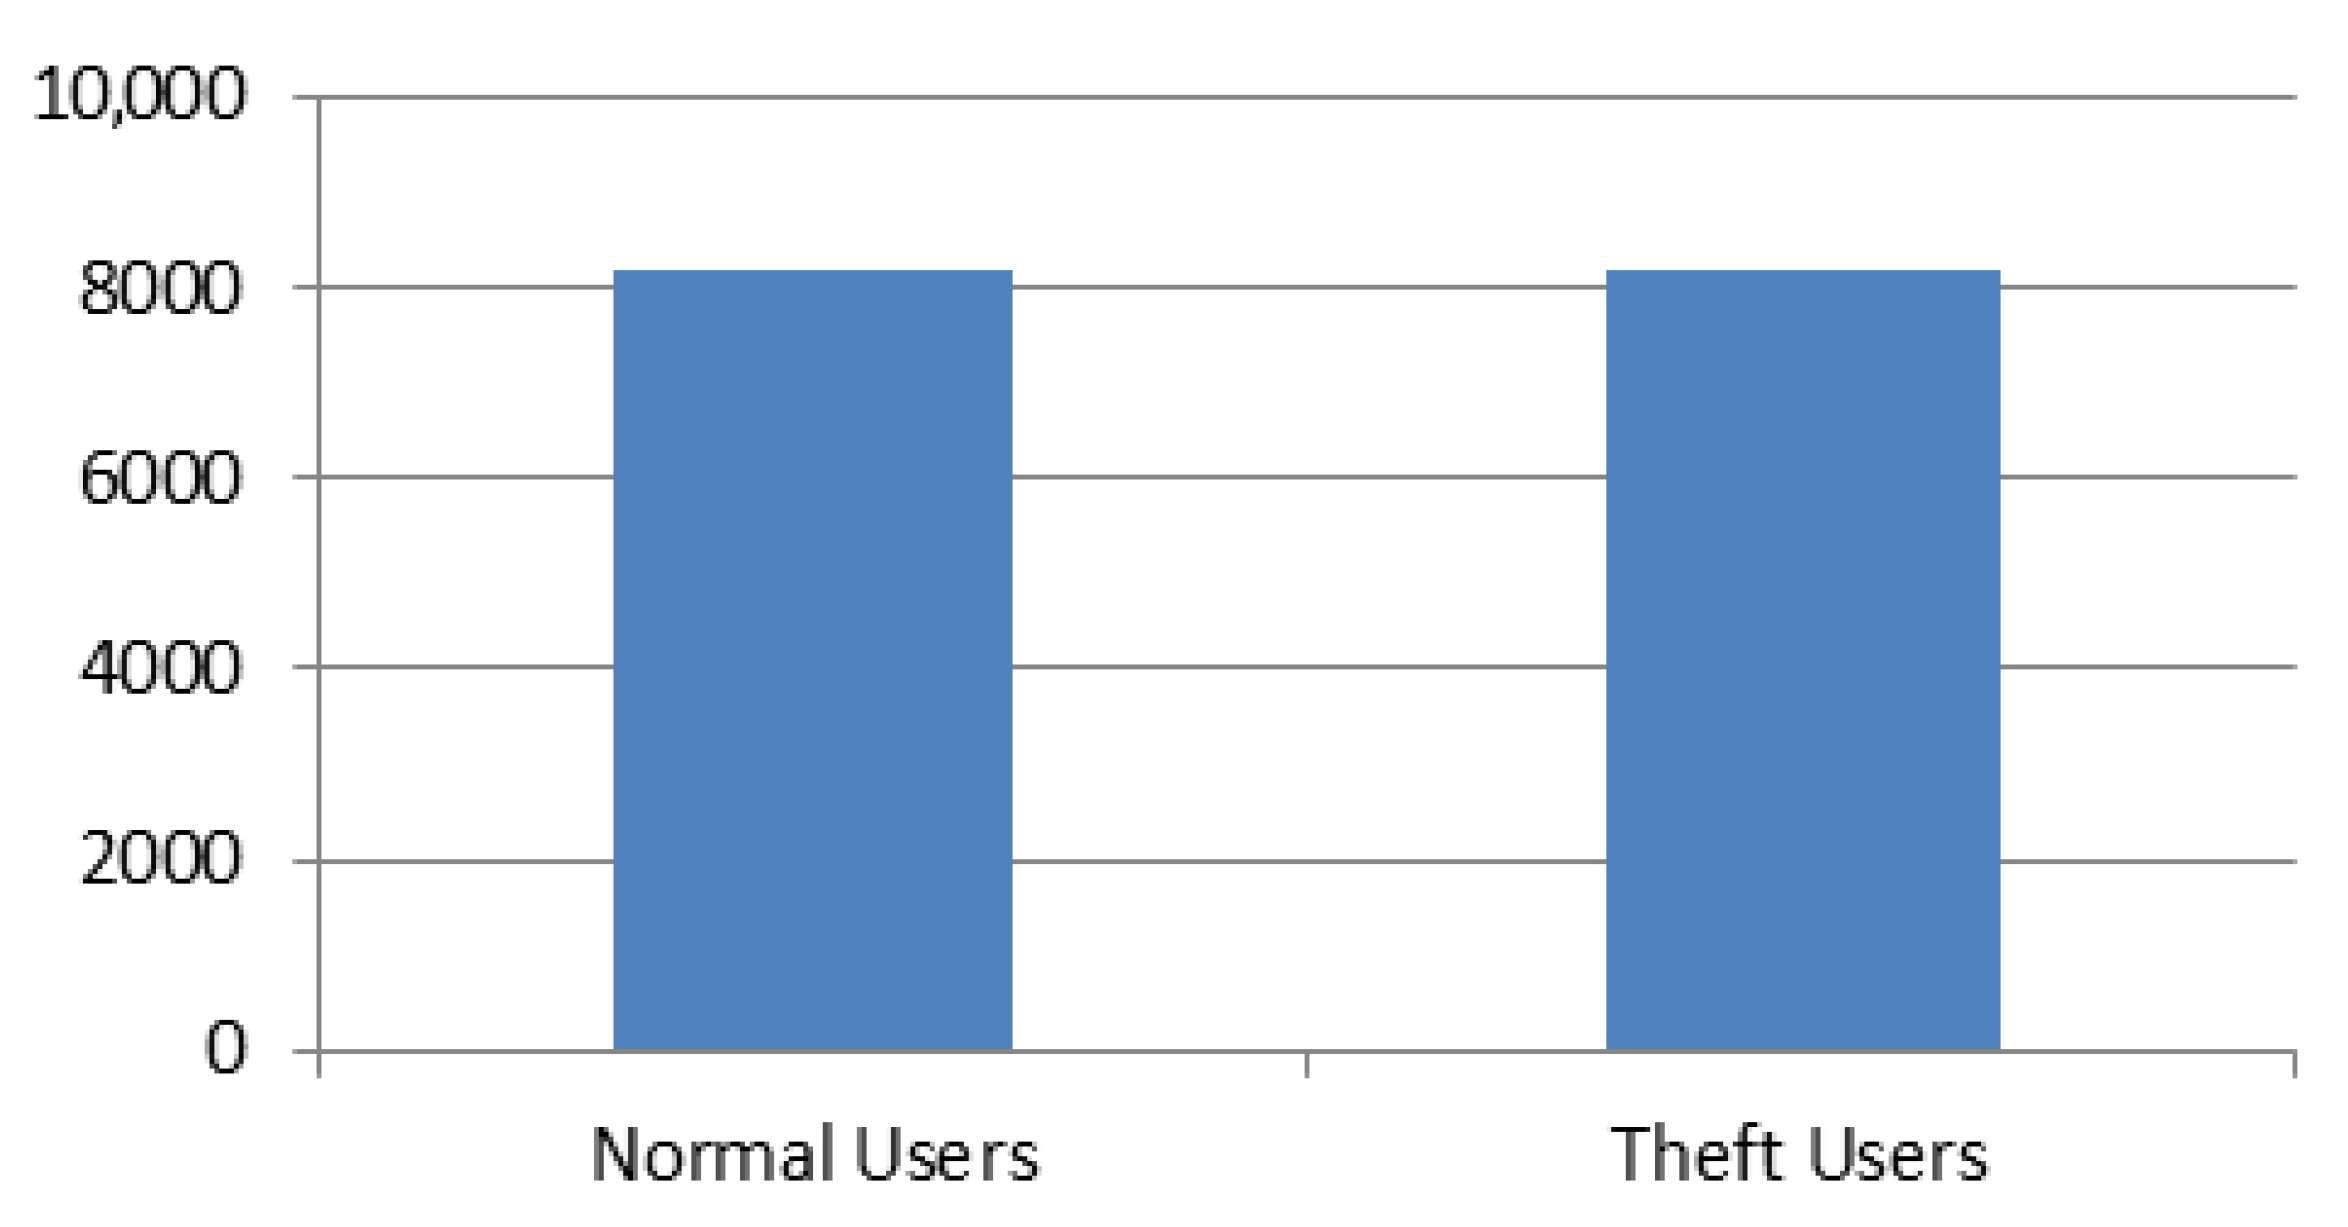
- Feature correlation and class separation problem is mitigated by oversampling the classes with a smaller observation sample using the SMOTE balancing algorithm.
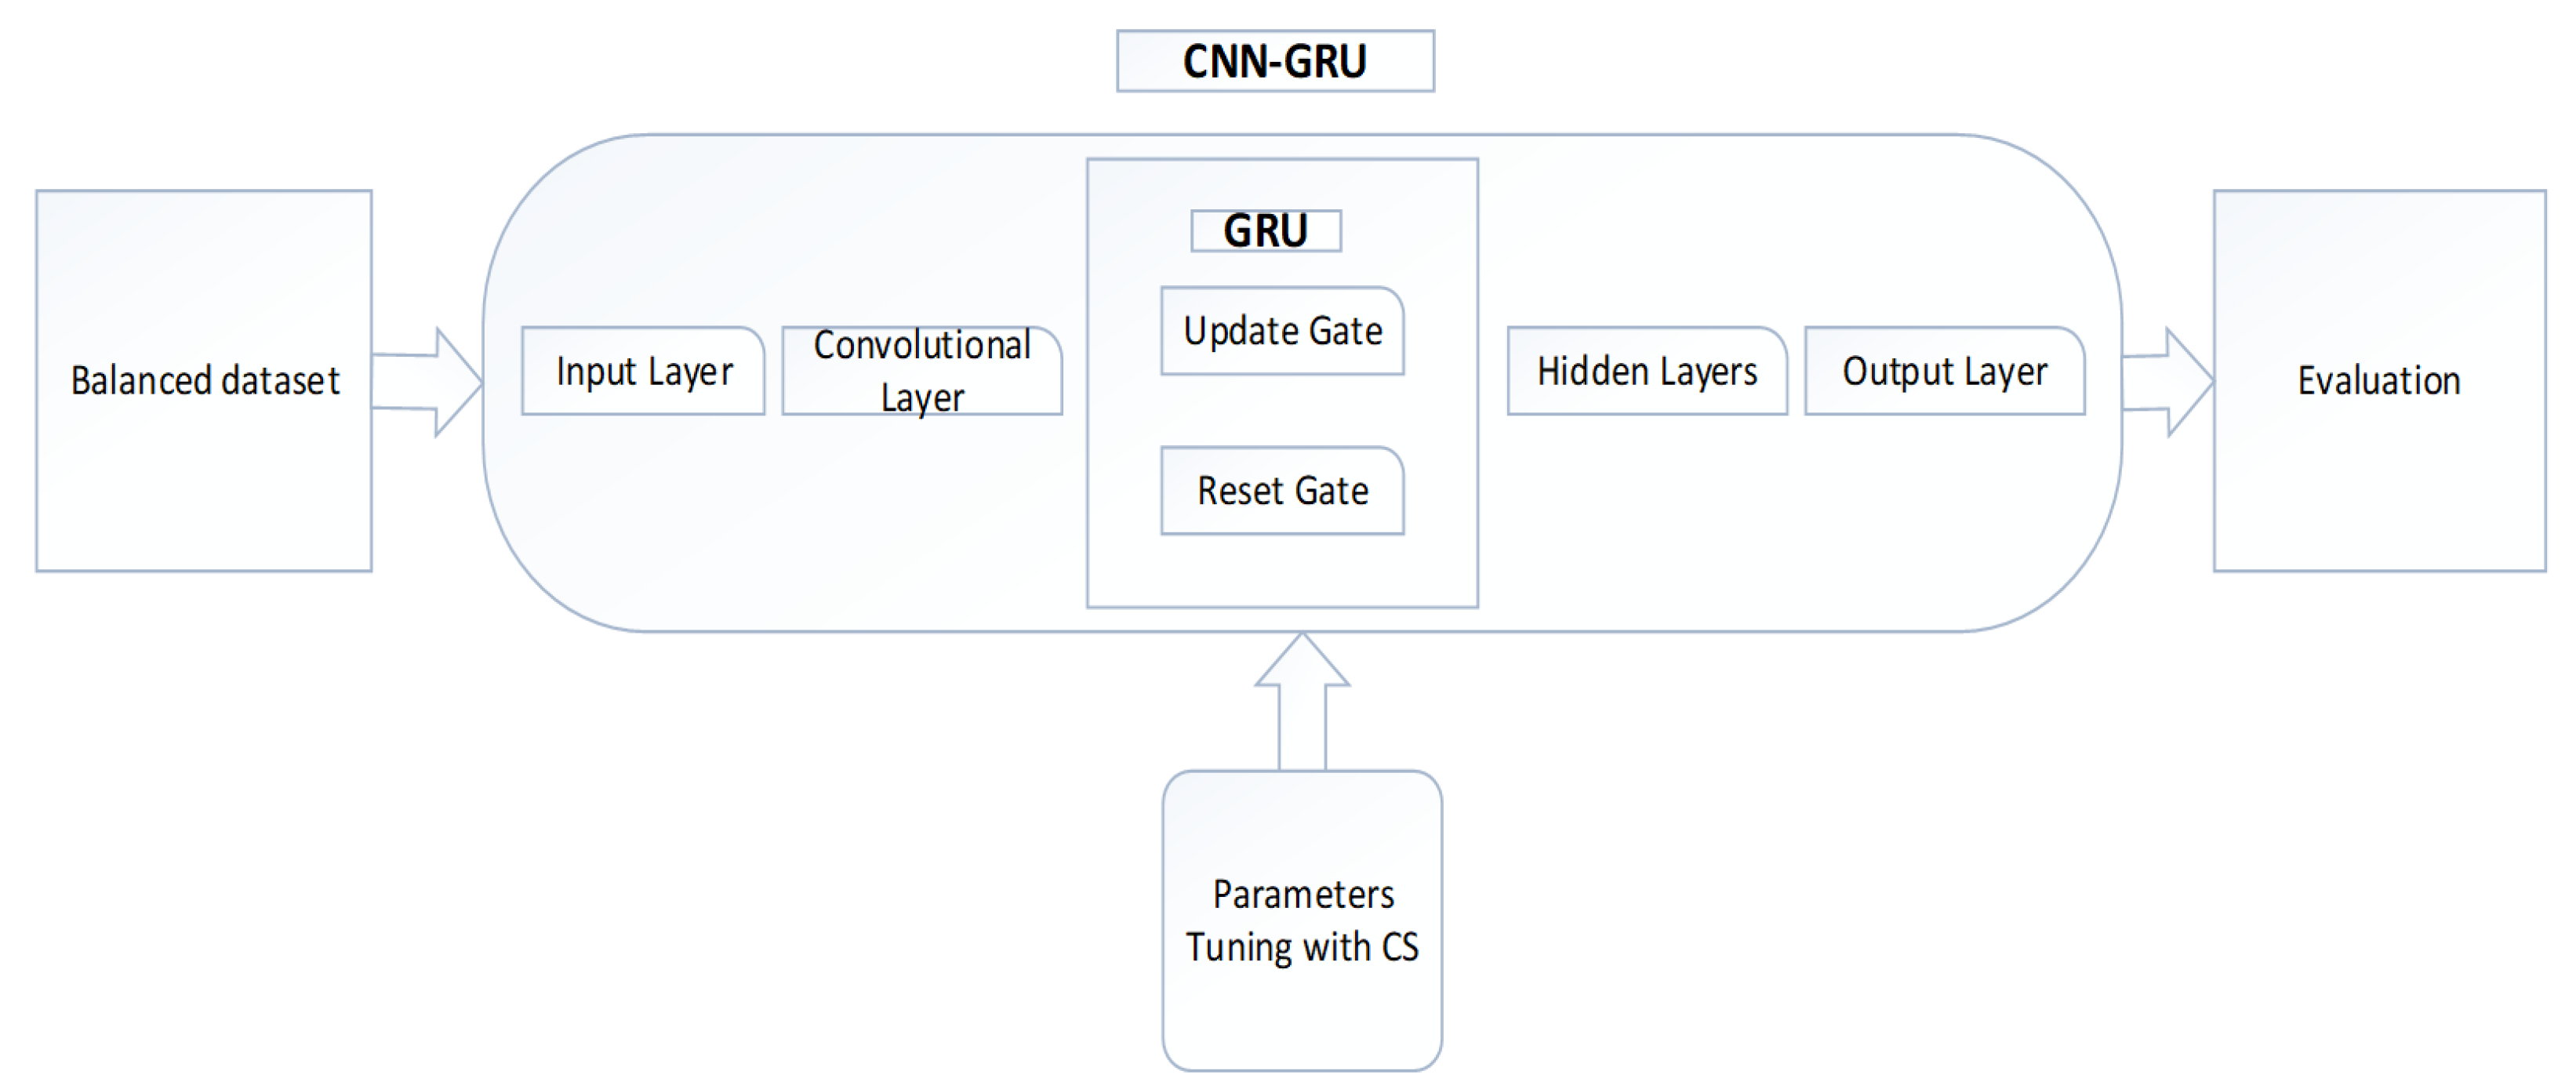
- For better training and classification, the CNN is combined with GRU and then tuned with the CS meta-heuristic technique.
- To detect theft users with no time, computational complexity is reduced by using the optimal parameters of CNN-GRU.
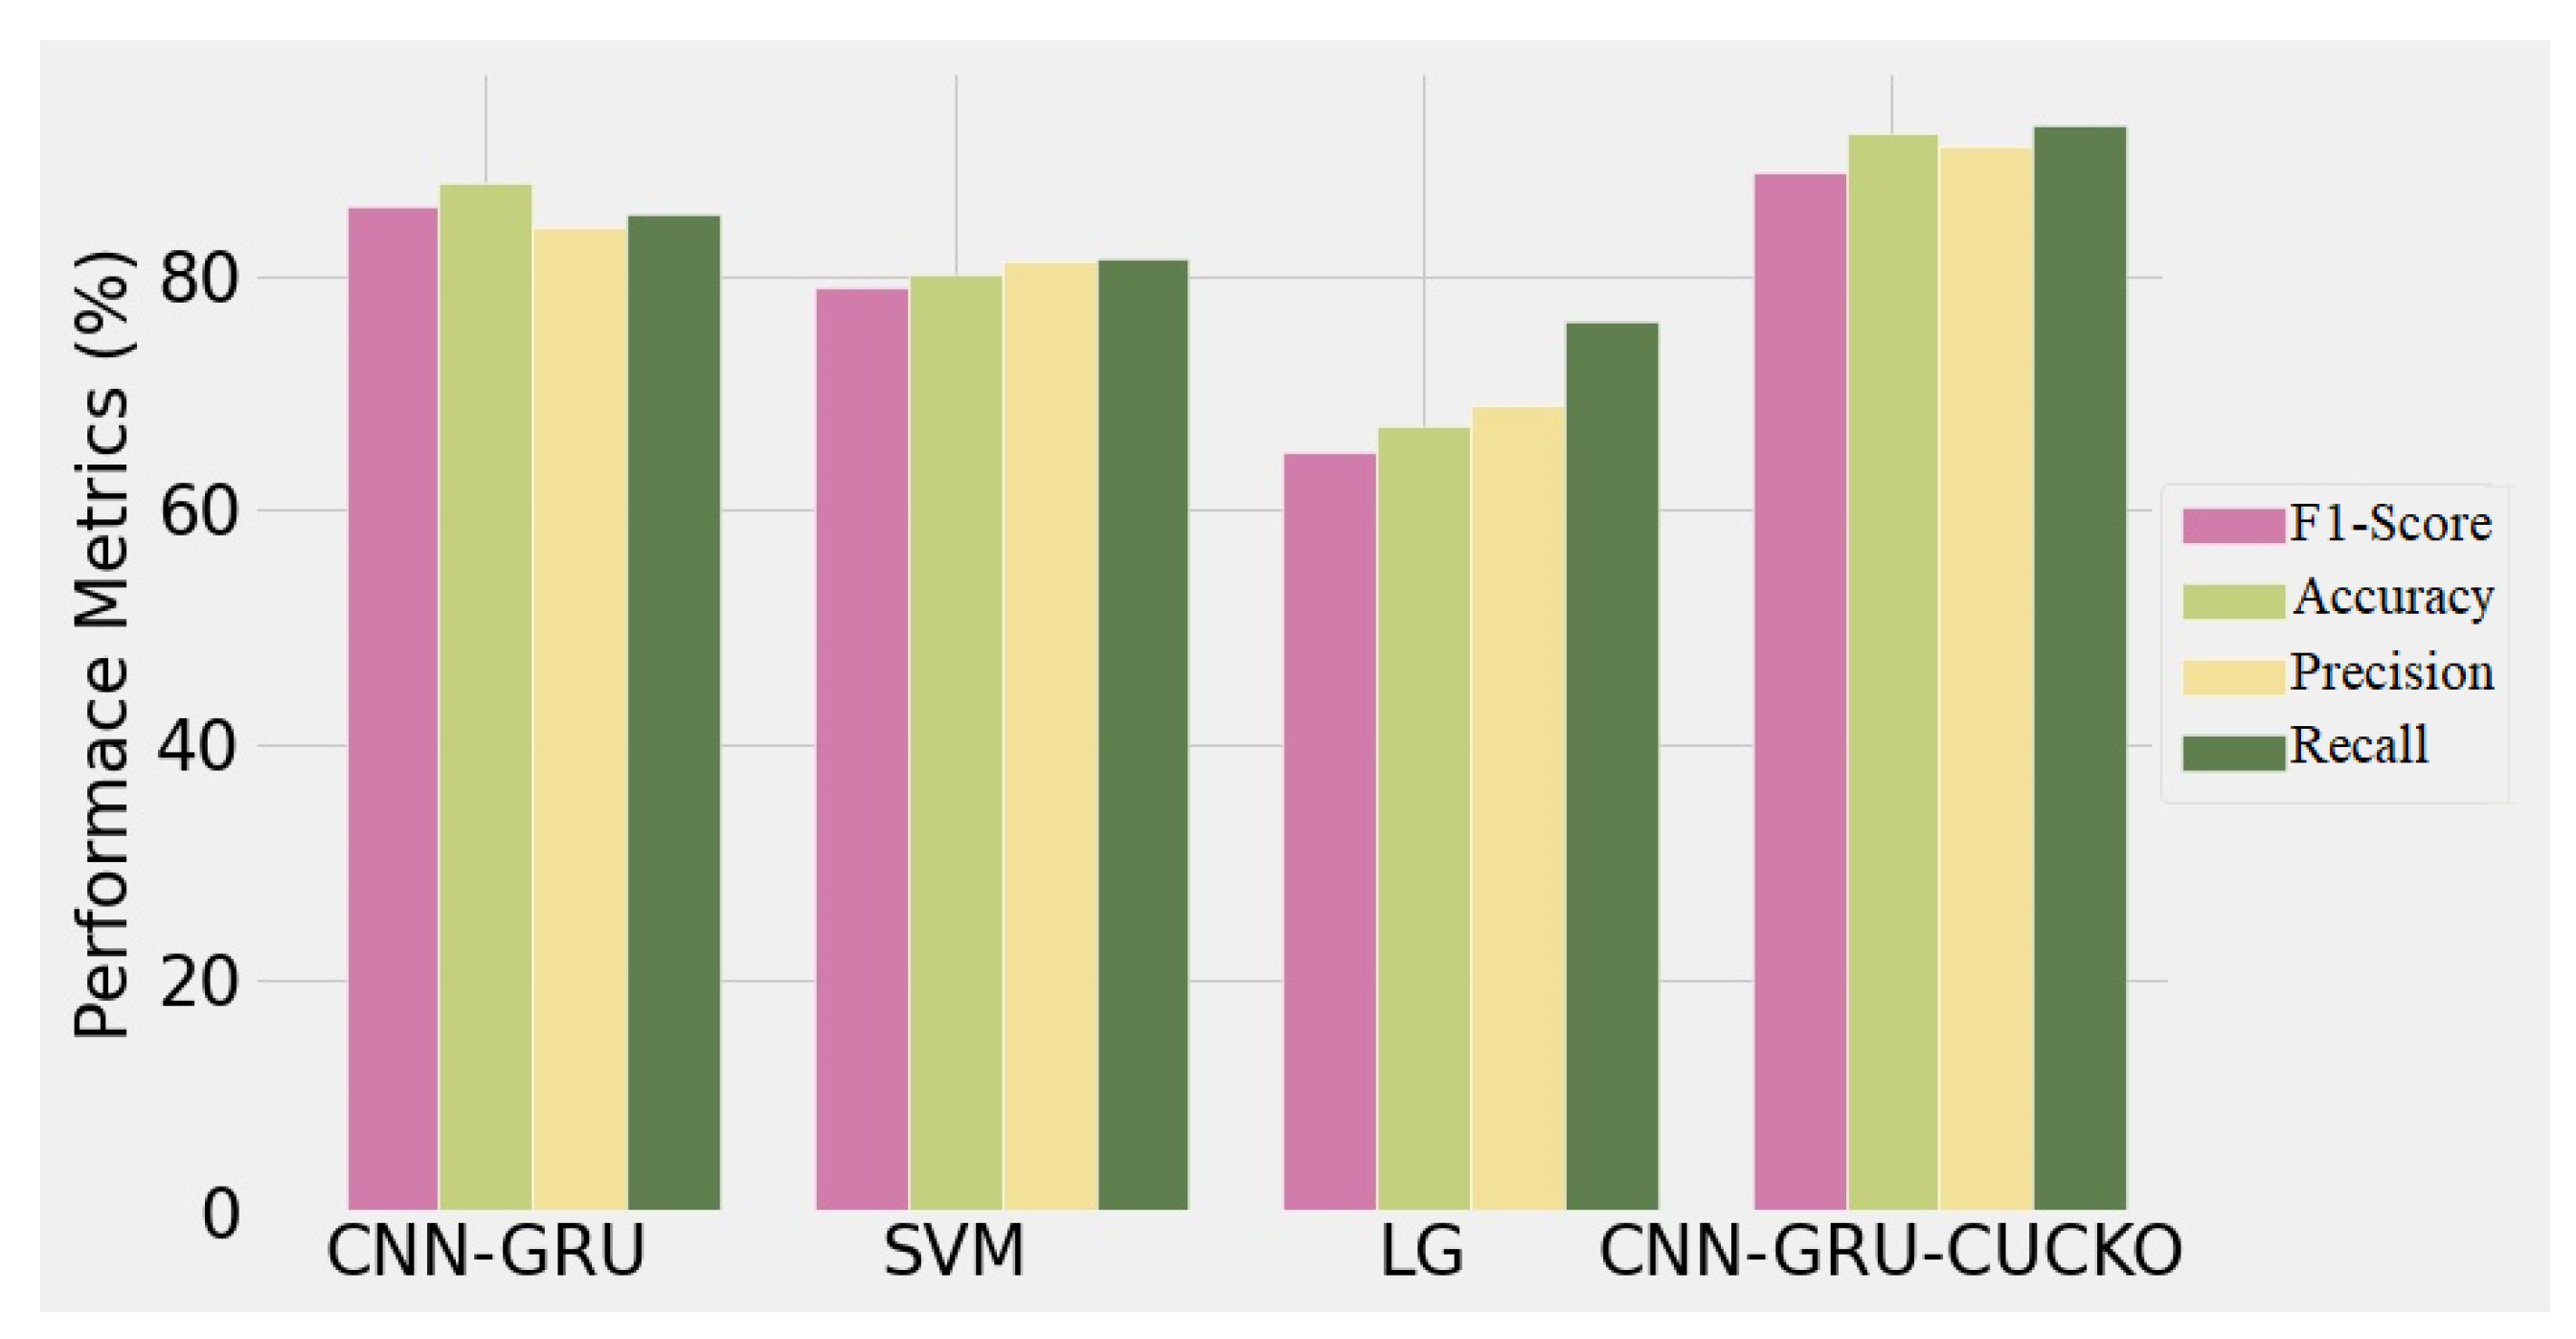
- Accurate classification is evaluated using performance evaluation metrics and gain classification performance is state of the art.
2. Materials and Methods
2.1. Electricity Theft Dataset
2.2. Data Preprocessing
2.2.1. Missing Values Computation
2.2.2. Creating Synthetic Data Points
3. Proposed CNN-GRU-CS Classification Model
3.1. CNN
3.2. GRU
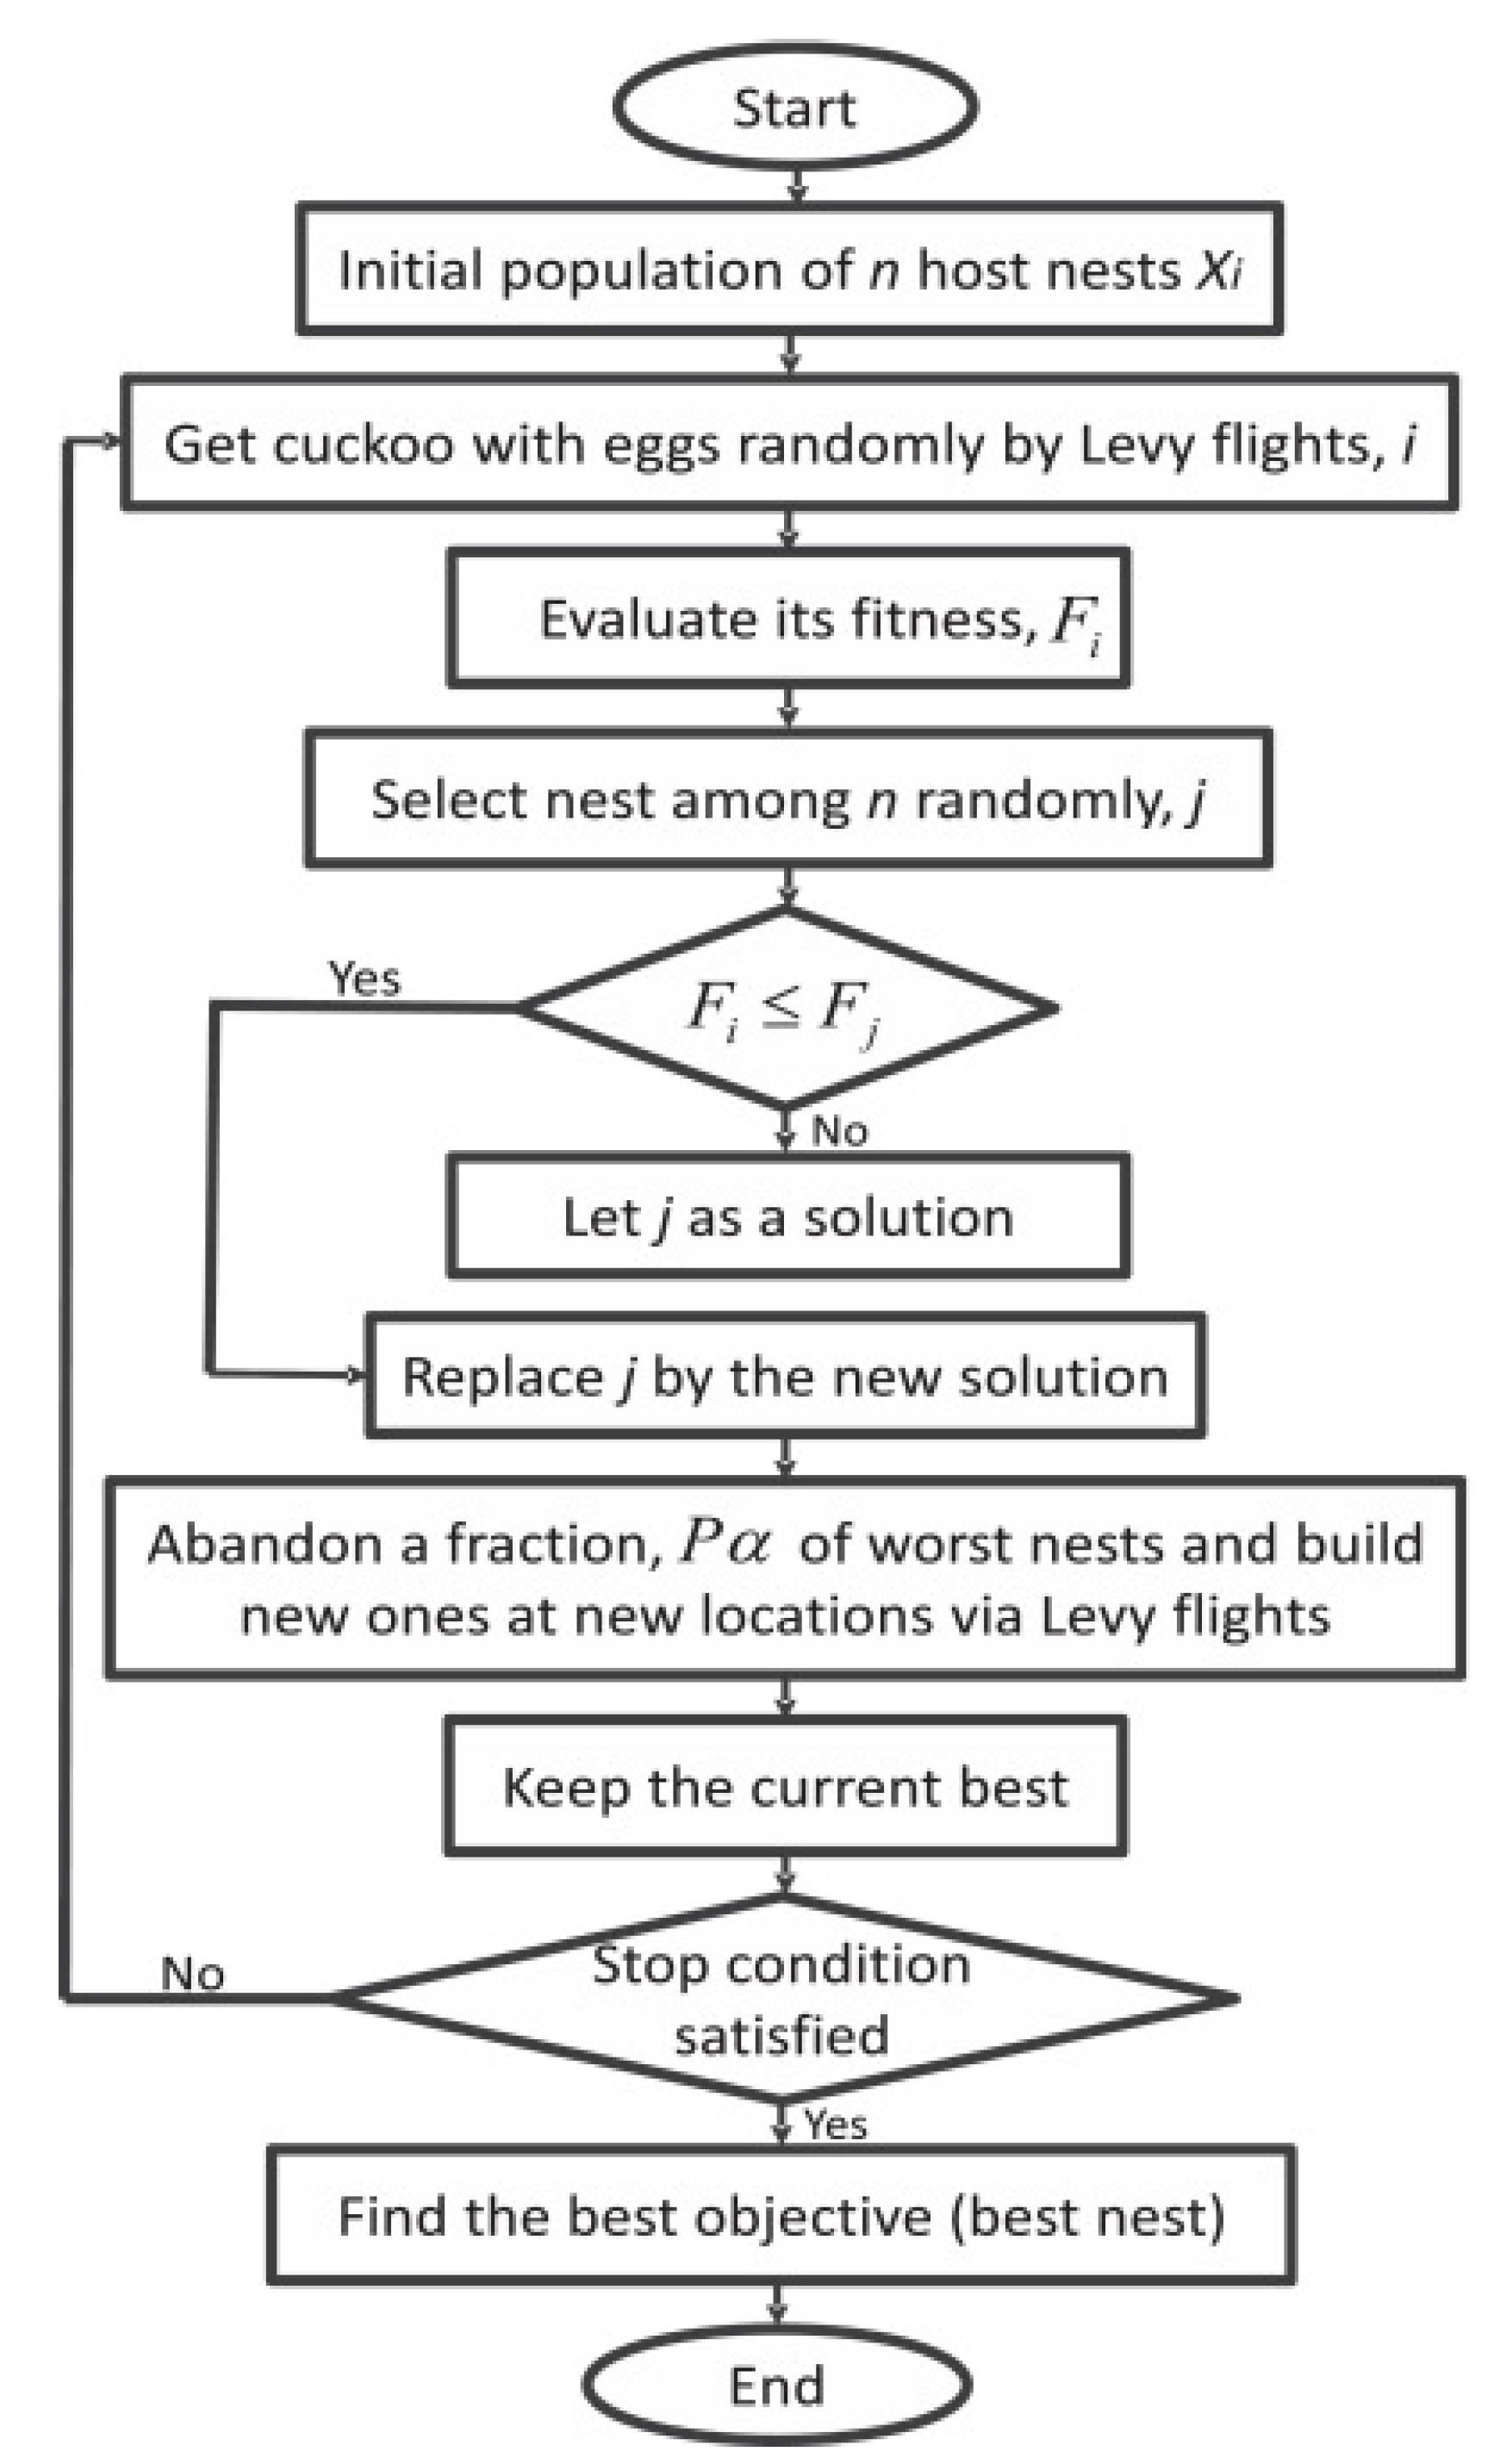
3.3. CS Algorithm
- Each cuckoo lays one egg at a time, and it is placed in a nest that is picked at random.
- The best nests and greatest eggs (solutions) will be passed down to the following generations.
- The host bird finds the alien egg with a probability of pa[0,1], and the number of available host nests is fixed. The nest is abandoned and a new one is constructed in a different location if the alien egg is found.
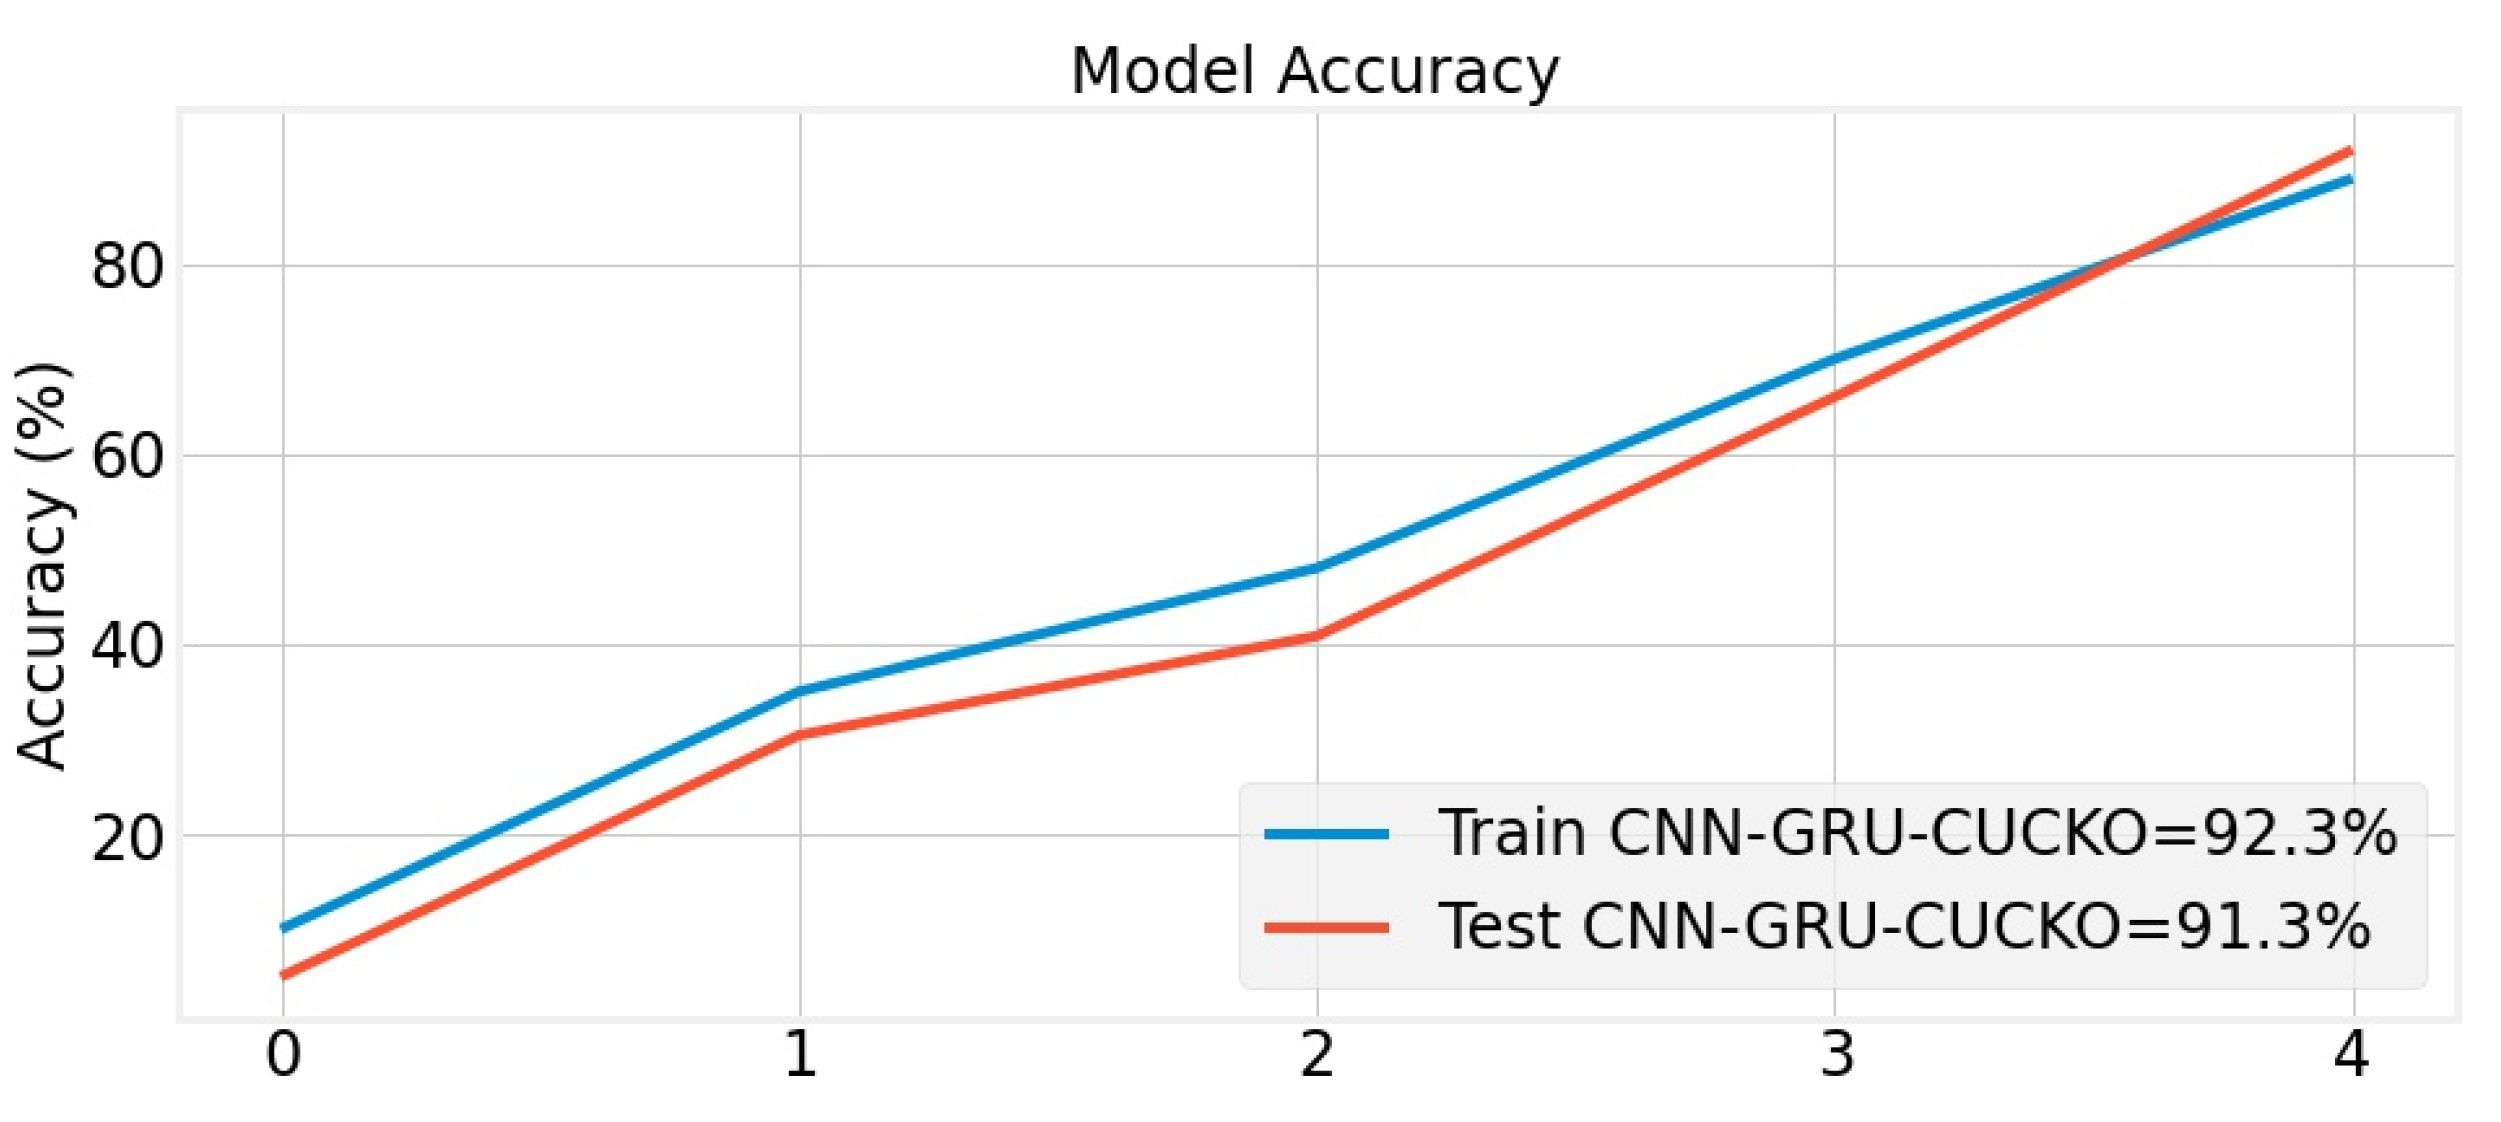
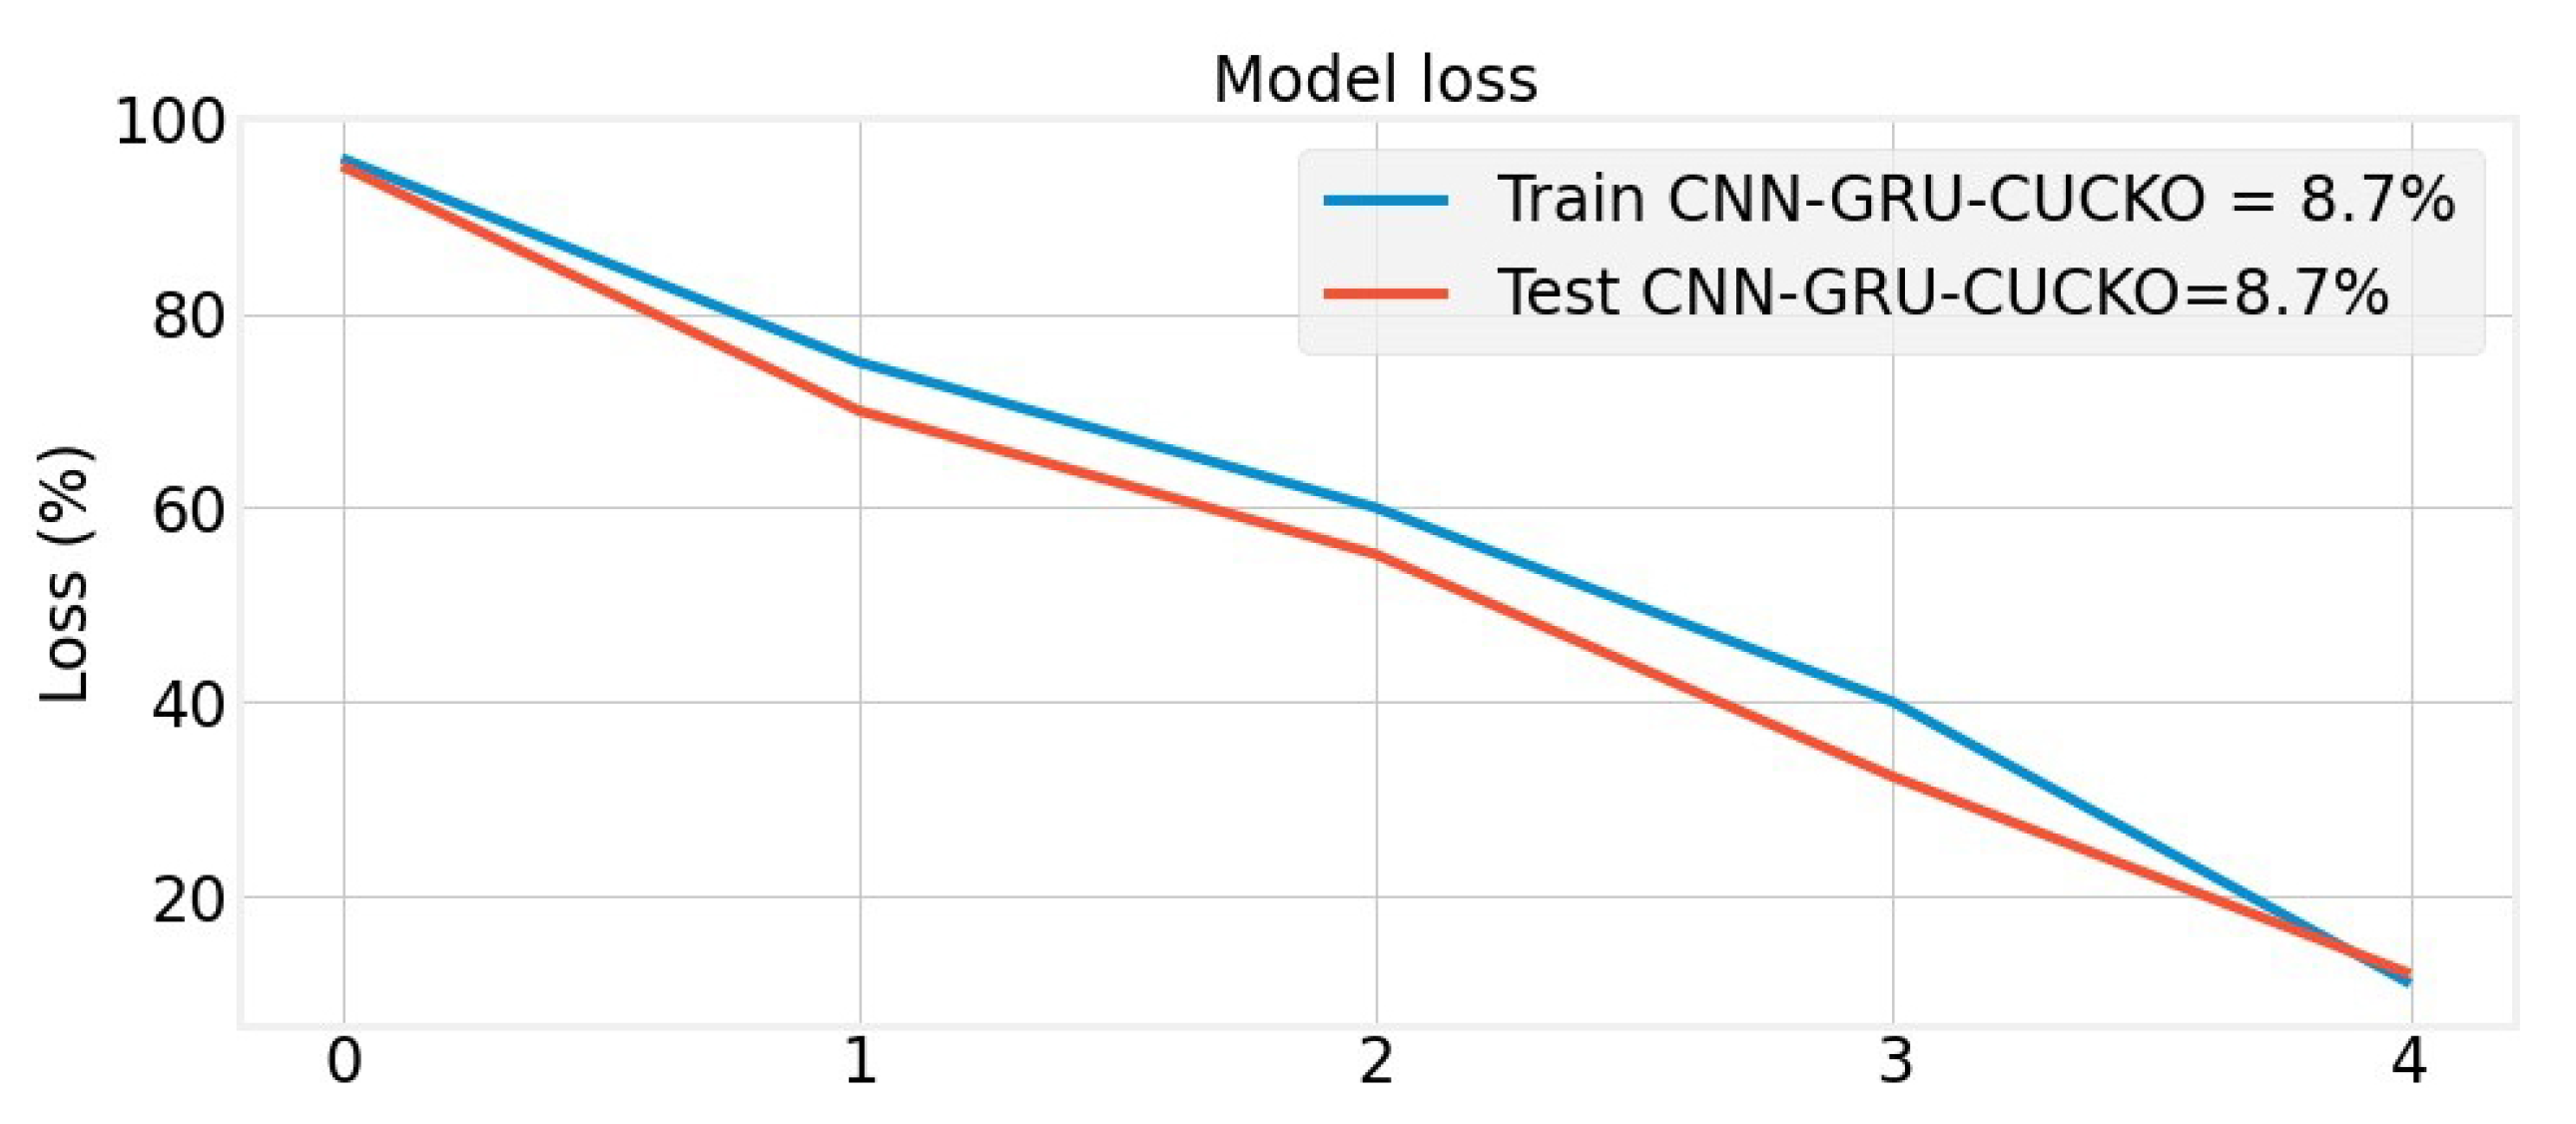
4. Results and Discussion
Experimental Results
5. Conclusions
Author Contributions
Funding
Data Availability Statement
Conflicts of Interest
Abbreviations
| NTL | Non Technical Loss |
| CNN | Convolutional Neural Network |
| CS | Cuckoo Search |
| SG | Smart Grid |
| TL | Technical Loss |
| SVM | Support Vector Machine |
| SM | Smart Meter |
| TL | Technical Loss |
| ETD | Electricity Theft Detection |
| LSTM | Long Short Term Memory |
| GWO | Grey Wolf Optimization |
| GRU | Gated Recurrent Unit |
| SMOTE | Synthetic Minority Over-sampling Technique |
| GWO | Grey Wolf Optimization |
| SGCC | State Grid Corporation of China |
References
- Aslam, S.; Herodotou, H.; Mohsin, S.M.; Javaid, N.; Ashraf, N.; Aslam, S. A survey on deep learning methods for power load and renewable energy forecasting in smart microgrids. Renew. Sustain. Energy Rev. 2021, 144, 110992. [Google Scholar] [CrossRef]
- Fan, D.; Ren, Y.; Feng, Q.; Liu, Y.; Wang, Z.; Lin, J. Restoration of smart grids: Current status, challenges, and opportunities. Renew. Sustain. Energy Rev. 2021, 143, 110909. [Google Scholar] [CrossRef]
- Aurangzeb, K.; Aslam, S.; Haider, S.I.; Mohsin, S.M.; Islam, S.u.; Khattak, H.A.; Shah, S. Energy forecasting using multiheaded convolutional neural networks in efficient renewable energy resources equipped with energy storage system. Trans. Emerg. Telecommun. Technol. 2022, 33, e3837. [Google Scholar] [CrossRef]
- Knayer, T.; Kryvinska, N. An analysis of smart meter technologies for efficient energy management in households and organizations. Energy Rep. 2022, 8, 4022–4040. [Google Scholar] [CrossRef]
- van Dinther, C.; Lau, M.; Terzidis, O. Case Studies in the Smart Grid Sector. In Smart Grid Economics and Management; Springer: Berlin/Heidelberg, Germany, 2022; pp. 223–229. [Google Scholar]
- Suriyan, K.; Ramalingam, N.; Jayaraman, M.K.; Gunasekaran, R. Recent developments of smart energy networks and challenges. In Smart Energy and Electric Power Systems; Elsevier: Amsterdam, The Netherlands, 2023; pp. 37–47. [Google Scholar] [CrossRef]
- Chuwa, M.G.; Wang, F. A review of non-technical loss attack models and detection methods in the smart grid. Electr. Power Syst. Res. 2021, 199, 107415. [Google Scholar] [CrossRef]
- Ponnusamy, V.K.; Kasinathan, P.; Madurai Elavarasan, R.; Ramanathan, V.; Anandan, R.K.; Subramaniam, U.; Ghosh, A.; Hossain, E. A Comprehensive Review on Sustainable Aspects of Big Data Analytics for the Smart Grid. Sustainability 2021, 13, 13322. [Google Scholar] [CrossRef]
- McLaughlin, S.; Holbert, B.; Fawaz, A.; Berthier, R.; Zonouz, S. A multi-sensor energy theft detection framework for advanced metering infrastructures. IEEE J. Sel. Areas Commun. 2013, 31, 1319–1330. [Google Scholar] [CrossRef]
- Firoozi, H.; Mashhadi, H.R. Non-technical loss detection in limited-data low-voltage distribution feeders. Int. J. Electr. Power Energy Syst. 2022, 135, 107523. [Google Scholar] [CrossRef]
- Ahmed, M.; Khan, A.; Ahmed, M.; Tahir, M.; Jeon, G.; Fortino, G.; Piccialli, F. Energy Theft Detection in Smart Grids: Taxonomy, Comparative Analysis, Challenges, and Future Research Directions. IEEE/CAA J. Autom. Sin. 2022, 9, 578–600. [Google Scholar] [CrossRef]
- Akram, R.; Ayub, N.; Khan, I.; Albogamy, F.R.; Rukh, G.; Khan, S.; Shiraz, M.; Rizwan, K. Towards Big Data Electricity Theft Detection Based on Improved RUSBoost Classifiers in Smart Grid. Energies 2021, 14, 8029. [Google Scholar] [CrossRef]
- Javaid, N.; Jan, N.; Javed, M.U. An adaptive synthesis to handle imbalanced big data with deep siamese network for electricity theft detection in smart grids. J. Parallel Distrib. Comput. 2021, 153, 44–52. [Google Scholar] [CrossRef]
- Javaid, N. A PLSTM, AlexNet and ESNN Based Ensemble Learning Model for Detecting Electricity Theft in Smart Grids. IEEE Access 2021, 9, 162935–162950. [Google Scholar] [CrossRef]
- Ahir, R.K.; Chakraborty, B. Pattern-based and context-aware electricity theft detection in smart grid. Sustain. Energy Grids Netw. 2022, 32, 100833. [Google Scholar] [CrossRef]
- Arif, A.; Alghamdi, T.A.; Khan, Z.A.; Javaid, N. Towards efficient energy utilization using big data analytics in smart cities for electricity theft detection. Big Data Res. 2022, 27, 100285. [Google Scholar] [CrossRef]
- Bochie, K.; Gilbert, M.S.; Gantert, L.; Barbosa, M.S.; Medeiros, D.S.; Campista, M.E.M. A survey on deep learning for challenged networks: Applications and trends. J. Netw. Comput. Appl. 2021, 194, 103213. [Google Scholar] [CrossRef]
- Duarte Soares, L.; de Souza Queiroz, A.; López, G.P.; Carreño-Franco, E.M.; López-Lezama, J.M.; Muñoz-Galeano, N. BiGRU-CNN Neural Network Applied to Electric Energy Theft Detection. Electronics 2022, 11, 693. [Google Scholar] [CrossRef]
- Yao, R.; Wang, N.; Liu, Z.; Chen, P.; Sheng, X. Intrusion detection system in the advanced metering infrastructure: A cross-layer feature-fusion CNN-LSTM-based approach. Sensors 2021, 21, 626. [Google Scholar] [CrossRef] [PubMed]
- Aslam, S.; Ayub, N.; Farooq, U.; Alvi, M.J.; Albogamy, F.R.; Rukh, G.; Haider, S.I.; Azar, A.T.; Bukhsh, R. Towards electric price and load forecasting using cnn-based ensembler in smart grid. Sustainability 2021, 13, 12653. [Google Scholar] [CrossRef]
- Khan, S.; Aslam, S.; Mustafa, I.; Aslam, S. Short-Term Electricity Price Forecasting by Employing Ensemble Empirical Mode Decomposition and Extreme Learning Machine. Forecasting 2021, 3, 28. [Google Scholar] [CrossRef]
- Irfan, M.; Raza, A.; Althobiani, F.; Ayub, N.; Idrees, M.; Ali, Z.; Rizwan, K.; Alwadie, A.S.; Ghonaim, S.M.; Abdushkour, H.; et al. Week Ahead Electricity Power and Price Forecasting Using Improved DenseNet-121 Method. Comput. Mater. Contin. 2022, 72, 4249–4265. [Google Scholar] [CrossRef]
- SGCC. SGCC Electricity Theft Dataset. Available online: https://github.com/henryRDlab/ElectricityTheftDetection (accessed on 18 October 2022).
- Zheng, Z.; Yang, Y.; Niu, X.; Dai, H.N.; Zhou, Y. Wide and deep convolutional neural networks for electricity-theft detection to secure smart grids. IEEE Trans. Ind. Inform. 2017, 14, 1606–1615. [Google Scholar] [CrossRef]
- Raja, P.; Thangavel, K. Missing value imputation using unsupervised machine learning techniques. Soft Comput. 2020, 24, 4361–4392. [Google Scholar] [CrossRef]
- Wu, L.; Kong, C.; Hao, X.; Chen, W. A short-term load forecasting method based on GRU-CNN hybrid neural network model. Math. Probl. Eng. 2020, 2020, 1428104. [Google Scholar] [CrossRef] [Green Version]
- Li, Z.; Liu, F.; Yang, W.; Peng, S.; Zhou, J. A survey of convolutional neural networks: Analysis, applications, and prospects. IEEE Trans. Neural Netw. Learn. Syst. 2021; early access. [Google Scholar] [CrossRef] [PubMed]
- Mareli, M.; Twala, B. An adaptive Cuckoo search algorithm for optimisation. Appl. Comput. Inform. 2018, 14, 107–115. [Google Scholar] [CrossRef]


| Indicator | Value |
|---|---|
| Dataset Period | 2 February 2021 to 2 February 2022 |
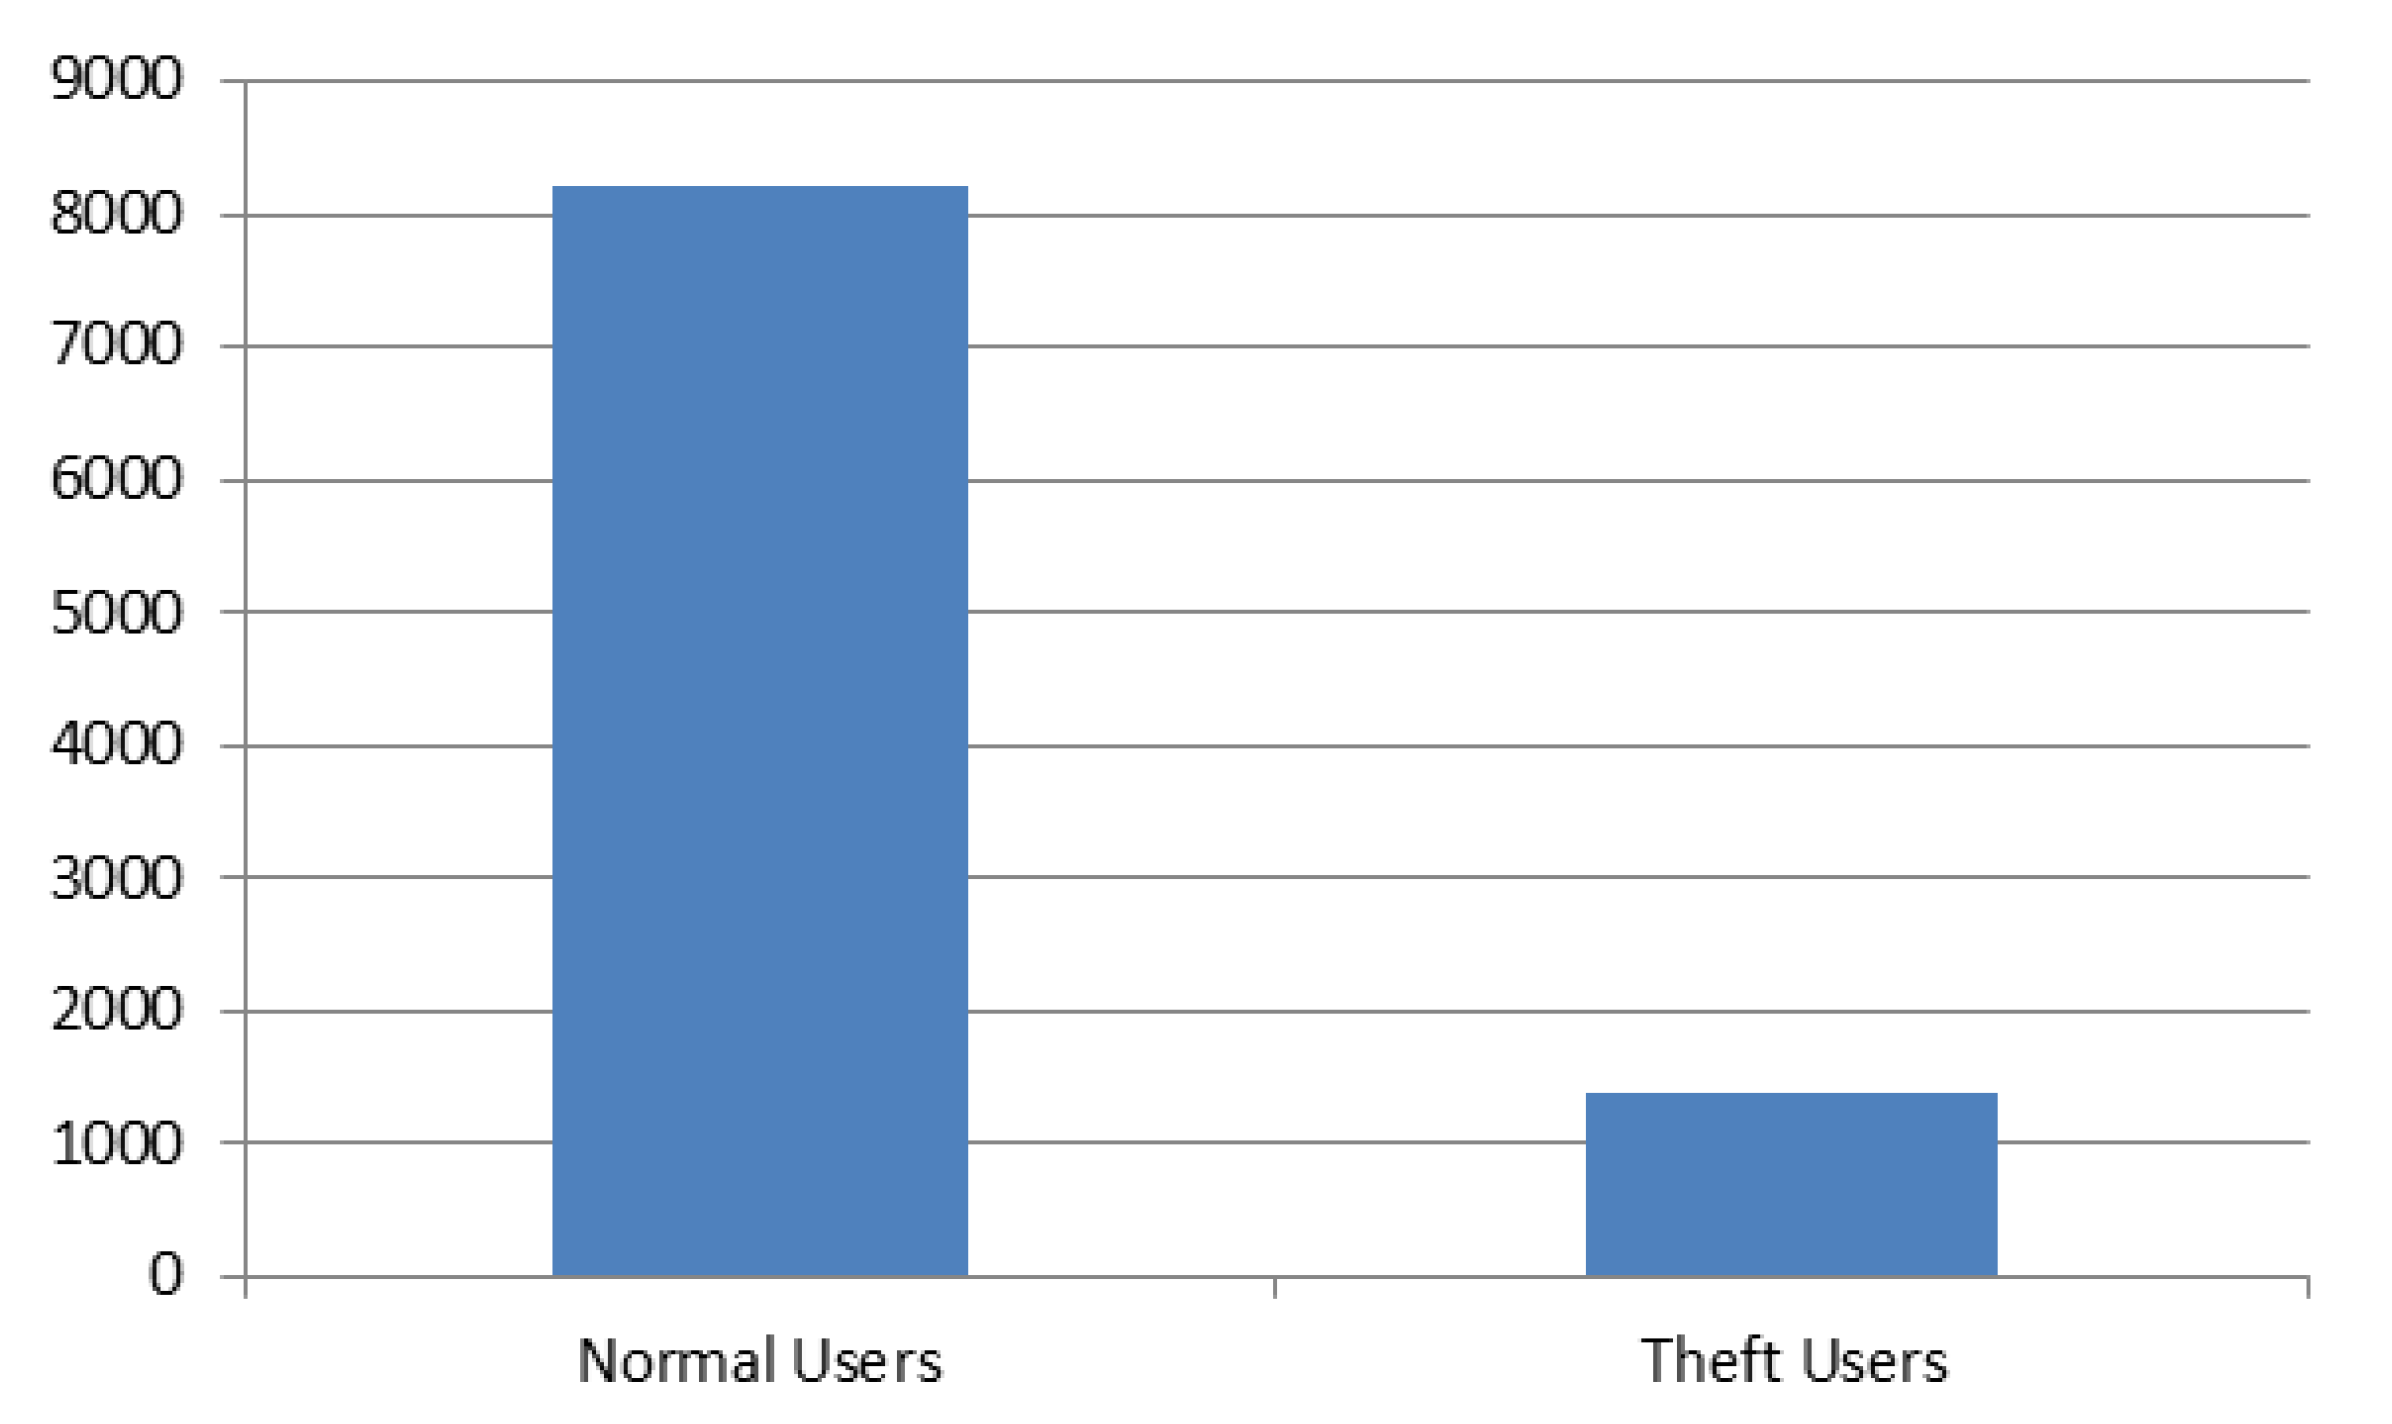
| Normal users | 8562 |
| Fraudulent users | 1394 |
| Total users | 9956 |
Publisher’s Note: MDPI stays neutral with regard to jurisdictional claims in published maps and institutional affiliations. |
© 2022 by the authors. Licensee MDPI, Basel, Switzerland. This article is an open access article distributed under the terms and conditions of the Creative Commons Attribution (CC BY) license (https://creativecommons.org/licenses/by/4.0/).
Share and Cite
Ayub, N.; Ali, U.; Mustafa, K.; Mohsin, S.M.; Aslam, S. Predictive Data Analytics for Electricity Fraud Detection Using Tuned CNN Ensembler in Smart Grid. Forecasting 2022, 4, 936-948. https://doi.org/10.3390/forecast4040051
Ayub N, Ali U, Mustafa K, Mohsin SM, Aslam S. Predictive Data Analytics for Electricity Fraud Detection Using Tuned CNN Ensembler in Smart Grid. Forecasting. 2022; 4(4):936-948. https://doi.org/10.3390/forecast4040051
Chicago/Turabian StyleAyub, Nasir, Usman Ali, Kainat Mustafa, Syed Muhammad Mohsin, and Sheraz Aslam. 2022. "Predictive Data Analytics for Electricity Fraud Detection Using Tuned CNN Ensembler in Smart Grid" Forecasting 4, no. 4: 936-948. https://doi.org/10.3390/forecast4040051