1. Introduction
Many are now considering 2020 the year when retail investors took control of stock markets. The combination of extended periods of free time stuck at home, government supplied stimulus and lack of sport events to bet on fueled a retail stock trading frenzy in an unseen before scope with smaller amounts of capital to trade and with many resorting to highly risky and (hopefully) highly profitable trading strategies, mainly involving stock options. The rapid recovery of markets worldwide from the coronavirus pandemic-induced crash only served to increase the retail traders already overly bullish sentiment.
This transition went largely unnoticed for the better part of 2020, as despite large amounts of new capital flowing into markets, single retail investors with small accounts had no real impact on price movements. This all changed when the members of the Reddit subreddit r/WallStreetBets (WSB) identified a trade opportunity and collaborated to execute it, catching large hedge funds by surprise and making the latter suffer heavy losses.
The frantic trading captured public attention, especially since a number of brokers moved to restrict retail trading of the stocks of interest as they stated they “are worried about the integrity of the marketplace and the clearing system” and “are concerned about the ability of the market and the clearing systems, through the onslaught of orders, to continue to provide liquidity. And we are concerned about the financial viability of intermediaries and the clearing houses” [
1].
This single event was enough for everyone to notice the power that retail investors can yield when working together. Regardless of the short timeframe, the short squeeze episode had serious implications—policymakers from the entirety of the political spectrum, as well as large financial institutions, talking about the need for transparency and fairness in financial markets and the rapid rise in WSB members. Despite the strong reaction from policymakers and two congressional hearings and promises for change in the order flow regulation, no changes have been implemented—neither by Congress nor the Securities and Exchange Commission (SEC).
Another important consequence is the rapid expansion of the WSB subreddit. It is important to note that before the January 2021 episode, it was considered a small niche community and at approximately 500th place by subreddit members. Following the short squeeze wave, its place in the rankings has been boosted to 52nd at the time of writing. Additionally, it should be pointed out that a membership in the subreddit is not required for viewing its contents, which likely means that the number of people looking at the content posted is much higher. Our assumption is that as the trade ideas and due diligence reports published are exposed to a much larger audience, this results in higher likelihood of coordinated trading by retail investors and rapid market movement.
In this paper, we explore the repercussions of the January 2021 short squeeze and attempt to use sentiment data gathered from the subreddit WSB, in conjunction with fundamental data and technical indicators, to create and train a machine learning model which is able to spot signals in the posting activity of the subreddit users for stocks which are about to experience a burst of volatility. We create a custom dataset, aggregating and extracting the most talked about stocks. We build two types of predictive models—autoregressive and non-autoregressive—to observe whether the trend of the stock would be captured and if it would improve model performance. We fit and test both linear (Logistic Regression) and non-linear models (Random Forest and Neural Network). Best results are achieved by the Random Forest classifier, however, despite the relatively high degree of accuracy achieved, it seems to be unable to predict the largest price swings, resulting in a net loss on the back-test conducted.
The remainder of this paper is structured as follows.
Section 2 provides the background around the WSB subreddit and the GameStop incident. The relevant literature review is explored in
Section 3. The data and the experimental setup adopted in this paper are presented in
Section 4 and
Section 5, respectively. The findings are summarised in
Section 6, while some concluding remarks are given in
Section 7.
2. Background
To call the first half of 2020 a tumultuous period in stock markets would be a gross understatement. In the face of uncertainty born of the rapidly spreading coronavirus pandemic, major indices experienced the largest price shock in more than a decade. Lockdowns in multiple countries soon followed—paving the way for even more investor panic. Driven by extremely fearful sentiment and massively reduced demand, oil prices briefly went into negative territory, with other commodities also suffering heavy losses. Yet only a month into the crash and in the height of lockdowns, markets began reversing and would record new highs only three months later.
Two main factors were responsible for that reversal, which seemed to defy logic. First, markets tend to overreact when specific events occur [
2]. Investors who overestimated the seriousness of the pandemic realised that they had made an error and benefitted from the significantly lower prices, which considerably stabilised markets and led to the fastest market recovery in history [
3]. Second, with large parts of the world economy essentially frozen and the population confined to their homes, governments had no choice but to enact massive economic-saving measures, which consisted of massive quantitative easing programmes to avoid widespread poverty and credit crisis. Additionally, in an unprecedented move, in developed nations, money was sent out to personal and business accounts as economic stimulus and large quantities of it were saved, not spent on necessities [
4].
However, unexpected side effects of these measures soon appeared. Many investors soon realised that despite the crisis, central banks were rapidly expanding their balance sheets, having ventured into corporate bonds to save struggling businesses and were artificially and infinitely inflating markets. The sentiment quickly shifted from extreme fear to cautious then extreme greed. That change was especially apparent in the hordes of newly minted retail “investors”, who, deprived of other forms of gambling due to lockdowns [
5] and armed with commission-free trading applications, turned to the only “casino” currently open and experiencing massive bouts of volatility—the stock market. Benefitting from the market recovery and in euphoria, many retail investors soon began looking for others to discuss trading strategies and show off their gains.
2.1. The r/WallStreetBets Subreddit
Reddit is an online forum created in 2005, where users can write posts and comments in response. It is structured as a series of subreddits—a “mini” forum, dedicated to a specific topic. The default page of every subreddit is the “Hot Page”, where only the most popular posts for the day are shown. When a new post is created, it is placed in the “New Posts” list and if it reaches sufficient traffic, it can move up to the hot page.
There are several finance-related subreddits—r/PersonalFinance, r/Investing, r/Stocks, that mostly contain sound financial advice and due diligence reports. However, WSB is best described by its tagline—“Like 4chan found a Bloomberg terminal (illness)”, and does not resemble them at all. It is a profanity and meme-ridden community, whose users—calling themselves “degenerates” [
6] —have no regard for risk and are mostly interested in a single form of financial instruments to trade—stock options. A defining trait of the subreddit are users revealing their highly risky positions, most frequently out of the money options close to expiration (sometimes bought on the same day they expire), so that they are able to boast about their gains or losses.
Due to the nature of their trades, the overall consensus is that the members of this subreddit are mostly financially uneducated and unsophisticated. However, that appears to not be the case as research has shown that on average a “buy” recommendation derived from WSB due diligence report results in a 1.1% two-day gain [
7]. The results are better for longer timeframes −2% over a month and 5% over the quarter. These results are in sharp contrast with the predominant opinion from both regulators and media, and confirm that (at least some) WSB members are not without skill.
It should also be noted that this project is not the first to explore the subreddit using a data-driven approach. Buz and de Melo’s [
6] findings confirm that valuable information can be obtained by analysing the activity of the users. They discover that the stocks mentioned on the subreddit are from sectors, which on average have performed better than indices in the last three years. Additionally, the stocks which are consistently discussed have been found to outperform the S&P 500 in relatively normal years as well as the tumultuous 2020.
2.2. r/WallStreetBets Rise to Prominence—The GameStop Episode
Despite its unique premise, WSB has been largely unnoticed for the majority of its existence. This all changed in January 2021 when members of the subreddit became the driving force in a series of short squeezes of heavily shorted stocks, namely GameStop, AMC Entertainment Holdings, Koss, BlackBerry, etc.
While at first these stocks do not seem connected at all, they did have two things in common—horrible fundamentals and a high short interest, making them perfect targets for a short squeeze. The most extreme case was that of GameStop, where according to the analytics firm S3 [
8], the short interest was 141.8% of the float on the first trading day of 2021, with short sellers promising to deliver as much as 260% [
9] at the peak, due to the illegal practice of “naked” short selling, meaning that shareholders at that time would have someone to sell their shares to with absolute certainty.
During the squeeze, a YouTuber and member of WSB named Keith Gill (handle u/DeepF***ingValue) became the de facto leader of the movement, with his daily updates showing his trading account and his refusal to sell, despite having made an enormous unrealised profit (over forty million dollars), prompting other members to hold onto shares and buy more (“If he is holding, I am holding”). Such as other influential investors participating in online forums, Keith Gill also possessed an information advantage [
10]. The short interest accumulation of GameStop was not a spontaneous event, and he was one of the first investors to discover the opportunity and began to accumulate call options in September 2019, sharing his trades on WSB and posting two videos in late July and early August 2020 about the short interest and possible trend reversal of GameStop.
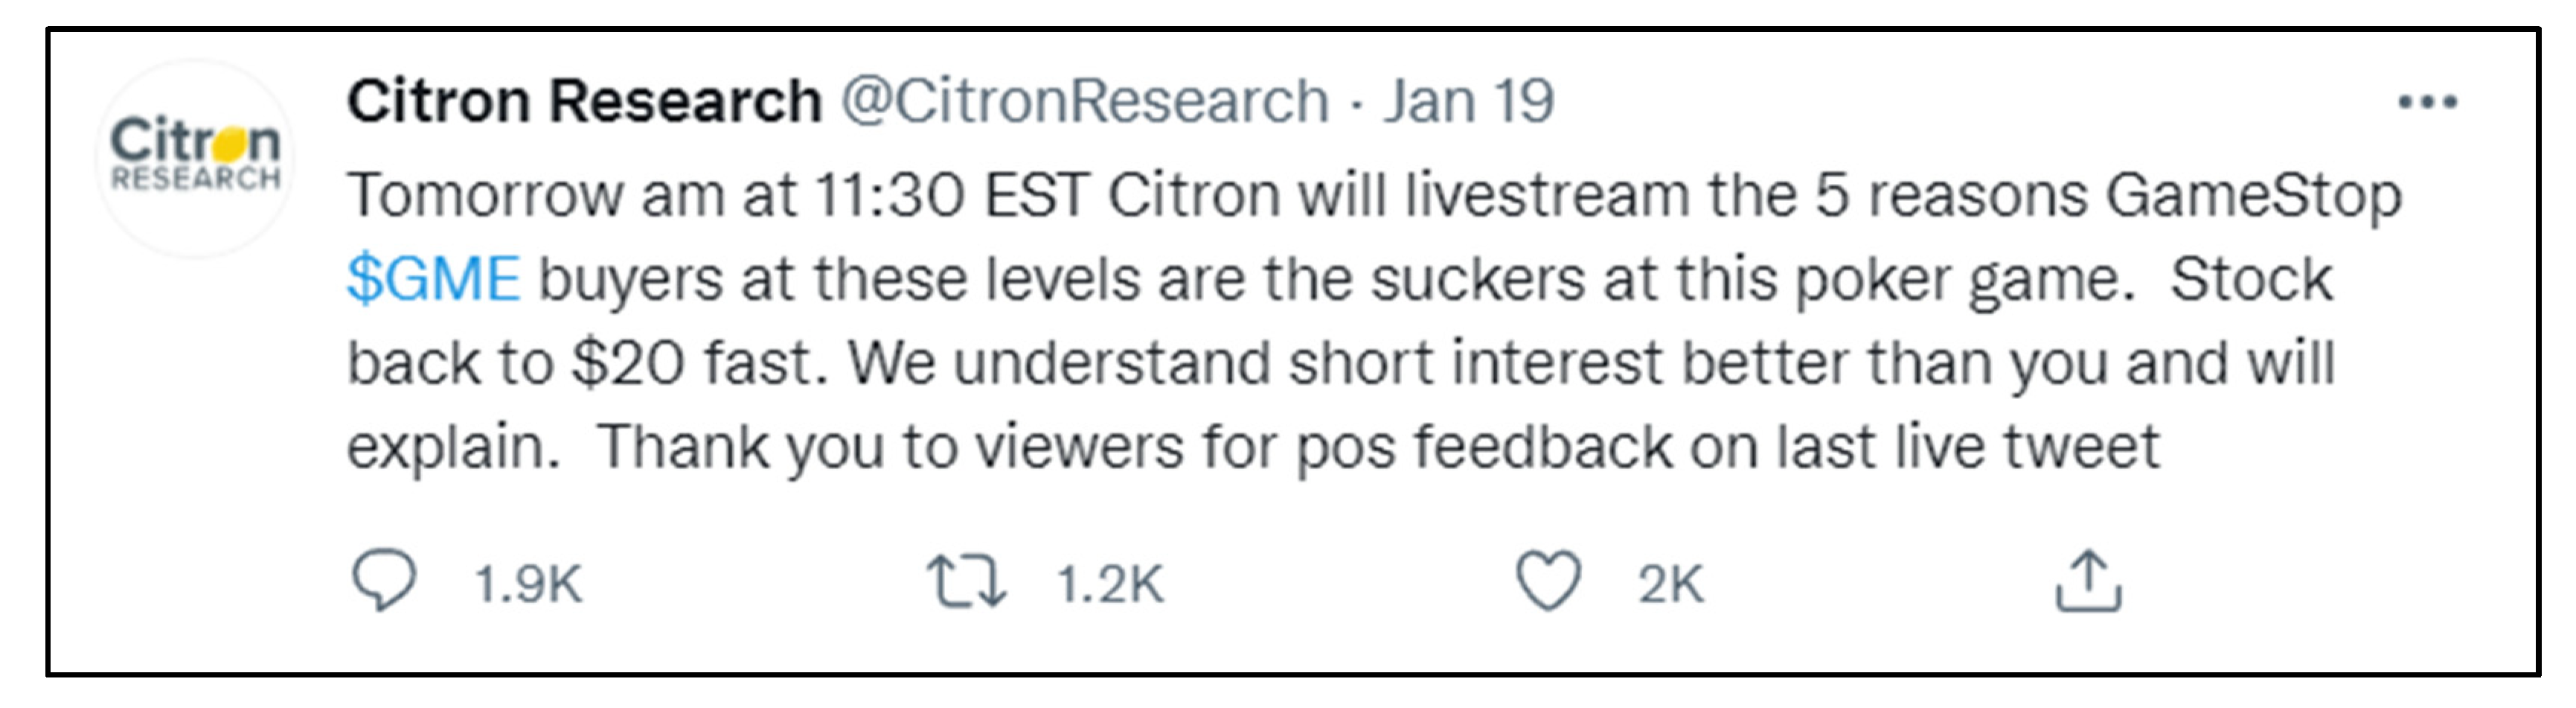
Once this information gained traction, due in no small part to a taunting tweet by Citron Research (available in the
Appendix A), a large portion of WSB members began aggressively accumulating as many shares as possible using their favourite instrument—call options, which allowed them to significantly amplify both their buying power and risk. This resulted in a rapid price movement of the shorted stocks, with GameStop being a prime example—it had started the year trading at approx. 17 USD but recorded an intraday high of
$483 dollars on the 28th of January. A number of hedge funds (Melvin Capital, Citron Research, Capital Partners) were caught by these unexpected movements and suffered heavy losses with some requiring cash injections by other firms to avoid shutting down.
While it did appear that retail investors had won, it seemed a Pyrrhic victory at the time, with many of them experiencing massive losses when prices retracted sharply (down to
$50 from
$483 intraday high for GameStop) due to several commission-free brokerages restricting the trading of the securities experiencing massive volumes, shorts covering, and investors taking profit (
Figure 1).
2.3. Herd Behaviour in WallStreetBets during the Short Squeeze Episode
Komeda, Inukai, Wiisdom, and Toyokawa [
11] define herding as “an alignment of thoughts or behaviours of individuals in a group” which are converging due to interactions between the individuals instead of being coordinated by a leader or centralised authority.
This herding instinct is present throughout many aspects of life (protests, riots, etc.) but more interestingly, it is also apparent in financial markets. The phenomenon occurs when an investor reactively follows the others around them believing that the others have already done their due diligence [
12]. Herding, combined with the fear of missing out, can lead to considerable rallies in prices of assets with little or no fundamental support, started by seemingly unrelated news or overly optimistic sentiment.
A well-known example of herding mentality is the Dotcom bubble at the beginning of the century [
13], when effortless access to capital, speculation, and prevailing positive sentiment (all of which were present at the beginning of 2021 [
14]) made investors disregard the fact that the companies they were investing in were not generating any revenue.
The above definition and analogy perfectly describe the retail sentiment in the period when short squeezes were occurring. While initially only the more well-informed investors (such as Keith Gill) were opening long positions due to their information advantage, once the price started rapidly increasing, the fear of missing out became the driving factor for the late entries of many retail investors, long after the share price had lost all fundamental basis.
2.4. The Expansion of WallStreetBets
Despite only lasting for ten days,
Figure 2 shows that the trading frenzy served to increase the members of the subreddit tenfold to approx. 10 million. Additionally, the growth in users was so rapid that the average age of the membership in the nine-year forum was only two days.
Following the short squeeze episode, the goal of WSB members changed to being the generation of the momentum needed for triggering an algorithmic response that would move their out-of-the-money options into profitable territory [
15], provided that the forum now and approx. ten times more members would help with the execution of such a plan.
3. Literature Review
3.1. Sentiment Analysis and Predictive Modelling
In this paper, we will be utilising predictive models—both linear (regression) and non-linear (machine learning methods), to make predictions about the performance of stocks talked about by retail investors. Such models have already found application in the field of finance, with logistic regression used to model stock performance relative to an index on the Indian stock exchange [
16]. The machine learning algorithms used in this paper have also been extensively used in financial research, with Neural Networks found to be the dominant technique used [
17] and Random Forest later found to be outperforming other algorithms used in literature [
18].
Such techniques have also been used in the field of sentiment analysis for financial forecasting, making them suitable for our purposes. So far, Twitter was predominantly found in literature as a source of data for such an analysis. Bollen, Mao, and Zeng [
19] researched the correlation between public mood and the Dow Jones Industrial Average performance and found that such correlation does exist, and predictability can be improved based on public mood. Pagolu, Reddy, Panda, and Majhi [
20] attempted to do the opposite by using the price data of Microsoft’s stock to classify a tweet’s sentiment, with their best performing classifier reaching 70% accuracy.
However, Twitter is not the only place where sentiment data can be gathered. Khedr, Salama, and Yaseen [
21] turned towards the mainstream media for their analysis. They used an ensemble learner, where a first learner extracts sentiment from the news and adds it to the historical performance of the security, with the final model, trained on the full dataset, reaching an accuracy of up to 89.8%.
Thomas Renault [
22] directed his attention towards a social media platform (Stocktwits) specifically designed for discussing investing and trading. He used the narrow focus of the messages to create a lexicon of the words that are commonly used by investors online, which were demonstrably outperforming the more common dictionary models. Furthermore, using this lexicon, he was able to aggregate the sentiment on the platform in 30 min intervals. He discovered that the sentiment of retail traders is indicative of intraday sentiment-driven trading. Renault’s research supports our hypothesis that a large number of retail traders, trading following the same plan or emotion, are able to impact the prices of securities in the short term. Additionally, his approach of using the post activity to create a lexicon specific for the analysis purposes is directly applicable to our research.
3.2. Existing Research into WallStreetBets
WSB has increasingly been the topic of discussion and subsequently research. Due to the recent nature of the events that made both researchers and institutional market participants take note of the subreddit, research regarding WSB is severely lacking. Furthermore, following the short squeeze wave, the nature of the popular posts has shifted due to the large influx of new members as well as the change in narrative.
WSB is usually the place where users would share their most absurd trade ideas, gains, or losses. They would either look for reinforcement that their opinion is right, and they should keep holding with “diamond hands”—not selling despite already having suffered heavy losses, and share their considerable gains for gratification or significant losses for others to laugh at [
23]. Through participant observation and conducting interviews with members, Boylston, Palacios, and Tassev [
23] also uncovered that despite the hostile environment, where every “YOLO” trade is mercilessly scrutinised and the author is called obscenities, this is important to its members, who are looking for additional excitement by sharing their trades or by laughing at other’s trades with friends.
Mendoza-Denton [
24] explored the massive narrative change during the GameStop episode. While, before the hype, the subreddit was not taking itself seriously, it quickly became obsessed with fighting “greedy” hedge funds looking to bankrupt companies such as GameStop, AMC, etc., through excessive shorting of their stock. Some users were drawing parallels to the 2008 housing bubble, when they experienced home foreclosures, citing the greed of Wall Street as a main driver for it in their posts. Many were seeing their participation in the event, by holding shares and options for the shorted companies, as revenge for what they experienced in 2008, and as their way to make these “greedy institutions bleed.” This change in sentiment coincided with the large influx of new members to the subreddit and solidified its current perma-bullish status.
Buz and de Melo [
6] took a data-driven approach to analysing WSB, similar to what is attempted by this project. By examining posts created between 2019–2021 and gathered using Reddit’s PushShift API, they were able to reveal which companies were most often the topic of interest of the community. They were able to compile a list of most mentioned companies and were able to differentiate between proactive and reactive signals to price movements based on the posting activity. Comparing different trading strategies for the days and weeks following a signal, the authors were able to confirm that a considerably better than average performance was achieved if an investment was made upon a buy signal instead of a standard investment tactic such as dollar cost averaging. Additionally, it was uncovered that the smaller the market capitalisation of the company in question, the higher the retail-induced volatility following a signal. Furthermore, they found that prices of the mentioned assets tended to fall in the short term after a reactive buy signal was identified.
4. Data and Relevant Information
4.1. Data Collection and Labelling
This project utilises two types of data in our attempt to model price movements of “meme” stocks—posts from WSB and price data for the companies talked about on the subreddit. All of the WSB data used in this research was accessed through the PushShift API—a big data storage and analytics repository archiving the contents of Reddit. We filtered it down and selected the five most usable attributes—title, text, score, flair, and timestamp. The price and volume data on a daily timeframe was accessed through the yFinance API. The period of interest ranges from mid-February to September 2021, as it was the only period when WSB had acquired the majority of its users and was after the mania phase over the short squeeze of GameStop had died down.
To be used for modelling purposes, the raw data needed to be transformed and labelled. Under normal circumstances, sentiment analysis data is either manually labelled or pre-trained machine learners are used to assign a positive, negative, or neutral sentiment to each post. However, due to time and budget constraints, manual labelling was not possible and due to the unique nature of submission content using automated methods to detect the sentiment would produce unsatisfactory results.
Fortunately, as explained in
Section 2, the predominant expressed sentiment on WSB since January 2021 is extremely bullish, due to in no small part the very accommodative monetary policy and quantitative easing [
14], propping up the market. This is evidenced by the numerous posts with comments such as “Who the f*** shorts in this market?”, “HOLD THE LINE AMC DIAMOND HANDED APES!! Shorts out of ammo”, “GEO YOLO—Deep Value Turnaround and f*** the shorts!!”, etc.
Due to the narrative of the GameStop episode and posts such as the aforementioned examples, we have reason to believe that we are correct in our assumption of the sentiment. In turn, this allows us to treat every mention of a ticker in a post as a buy signal from a member of the forum and the post’s score as an indicator as to how many other members agree. We believe that we can find a connection between posting activity by aggregating the number of mentions, scores, and flair of posts for each mentioned ticker and price movements.
4.2. Data Processing and Addition of Supplemental Features
We compiled a list of all tickers on major exchanges (NYSE, NASDAQ, etc.) as the stocks talked about by users do not all reside on a specific exchange. We proceeded by creating a list of tickers that are also words in the English language—such as “UP”, “HOLD”, “HAS”, “YOLO”, “TELL”, “MOON”, etc. The full list is available in
Appendix A.
Then, we split the post data into months and mined it for tickers and other relevant data. Firstly, we removed any special characters from the title and post text. The title and text are split into lists of words. Then, we checked if each word is present in our ticker list i.e., it is a ticker. If a word in either the title or text was recognised as a ticker, we recorded a mention, as well as the post’s score and flair. Then, the mentions, score, and number of each flair type were added for each day. After this process was completed, the tickers with less than 20 mentions for the month were removed from the data, as we deemed that they had not been able to gather sufficient attention to be of interest.
We continued by adding price data to each entry by matching the dates and tickers to their respective open, high, low, and close prices as well as volume for the respective days. However, stock markets are closed on weekends and official holidays, so an inconsistency became apparent. This inconsistency is handled by setting the prices for the days of no trading to those of the last day of trading and volume set to zero. To additionally increase the usability of the data, we added time-lagged variables to each observation. Those variables are the mentions, score, flair type as well as returns from one, three, and seven days before the observation.
4.3. Data Analysis
The final dataset created was a panel one with the ticker being the panel variable and the date being the time one. The panel was unbalanced due to some stocks being mentioned on more days than others. Additionally, due to lapses in the post data, some gaps remained for the time variable as well. The dataset contained 8135 observations from our target period, for 200 different stocks. The number of features for each observation is 102. All data points, with the exceptions of tickers and dates, are floating point numbers. We uncovered that the ranges of our features are quite significant. While there are stocks which have only been mentioned once in a day, the peak value for daily mentions is 1879. The gap for score is even wider—total daily scores range from 0 to 265,131. The average amount of daily mentions of posts with more than 20 mentions per month is 9.67 and they have an average score of 178.
The flair of the posts also holds valuable information—we can see that we had reached a maximum of 331 YOLO posts on a single day for a single post. This serves as a strong confirmation that traders are in fact responsible for considerable inflows into their respective stocks, as the requirements for an approved YOLO post mandate a screenshot of an already opened sizeable position be posted. Furthermore, we are also able to see that there are up to 64 due diligence reports posted for a single stock on one day at peak times. Due diligence posts are indicative of users actually conducting research and serve as a catalyst on the forum (the GameStop episode was triggered in no small part due to Keith Gill’s due diligence report posted on WSB). The per cent differences between prices on different days also showcase the impact of the forum on the prices of the stocks it talks about. While the mean rarely exceeds 4%, there is a high standard deviation ranging from 8 to 22%. Furthermore, the data indicates that the high price for the next day can rise upwards of 200% but also fall as much as 80%. These values stand at 305% and −83% looking three days ahead and 521% and −82% looking seven days ahead, respectively.
However, the most indicative feature of the impact of the forum on financial markets is the increase in trading volume—it ranges between 110 and 250% on average looking one to seven days ahead. We uncovered that despite our dataset containing the two hundred most mentioned stocks on the subreddit, the gap in the interest shown to each specific stock (measured by the total number of mentions in the data) is colossal.
Figure 3 demonstrates that consequences of the events that transpired towards the end of January are still profoundly felt until September, with the mentions of GameStop and AMC accounting for 22 percent of the total 157,356 mentions. Other commonly mentioned stocks were BlackBerry, Clover Health, Rocket Companies, Wish, Palantir, Sundial Growers, Workhorse Group, UWM Holdings, and Microvision—all of which had been mentioned more than 1000 times.
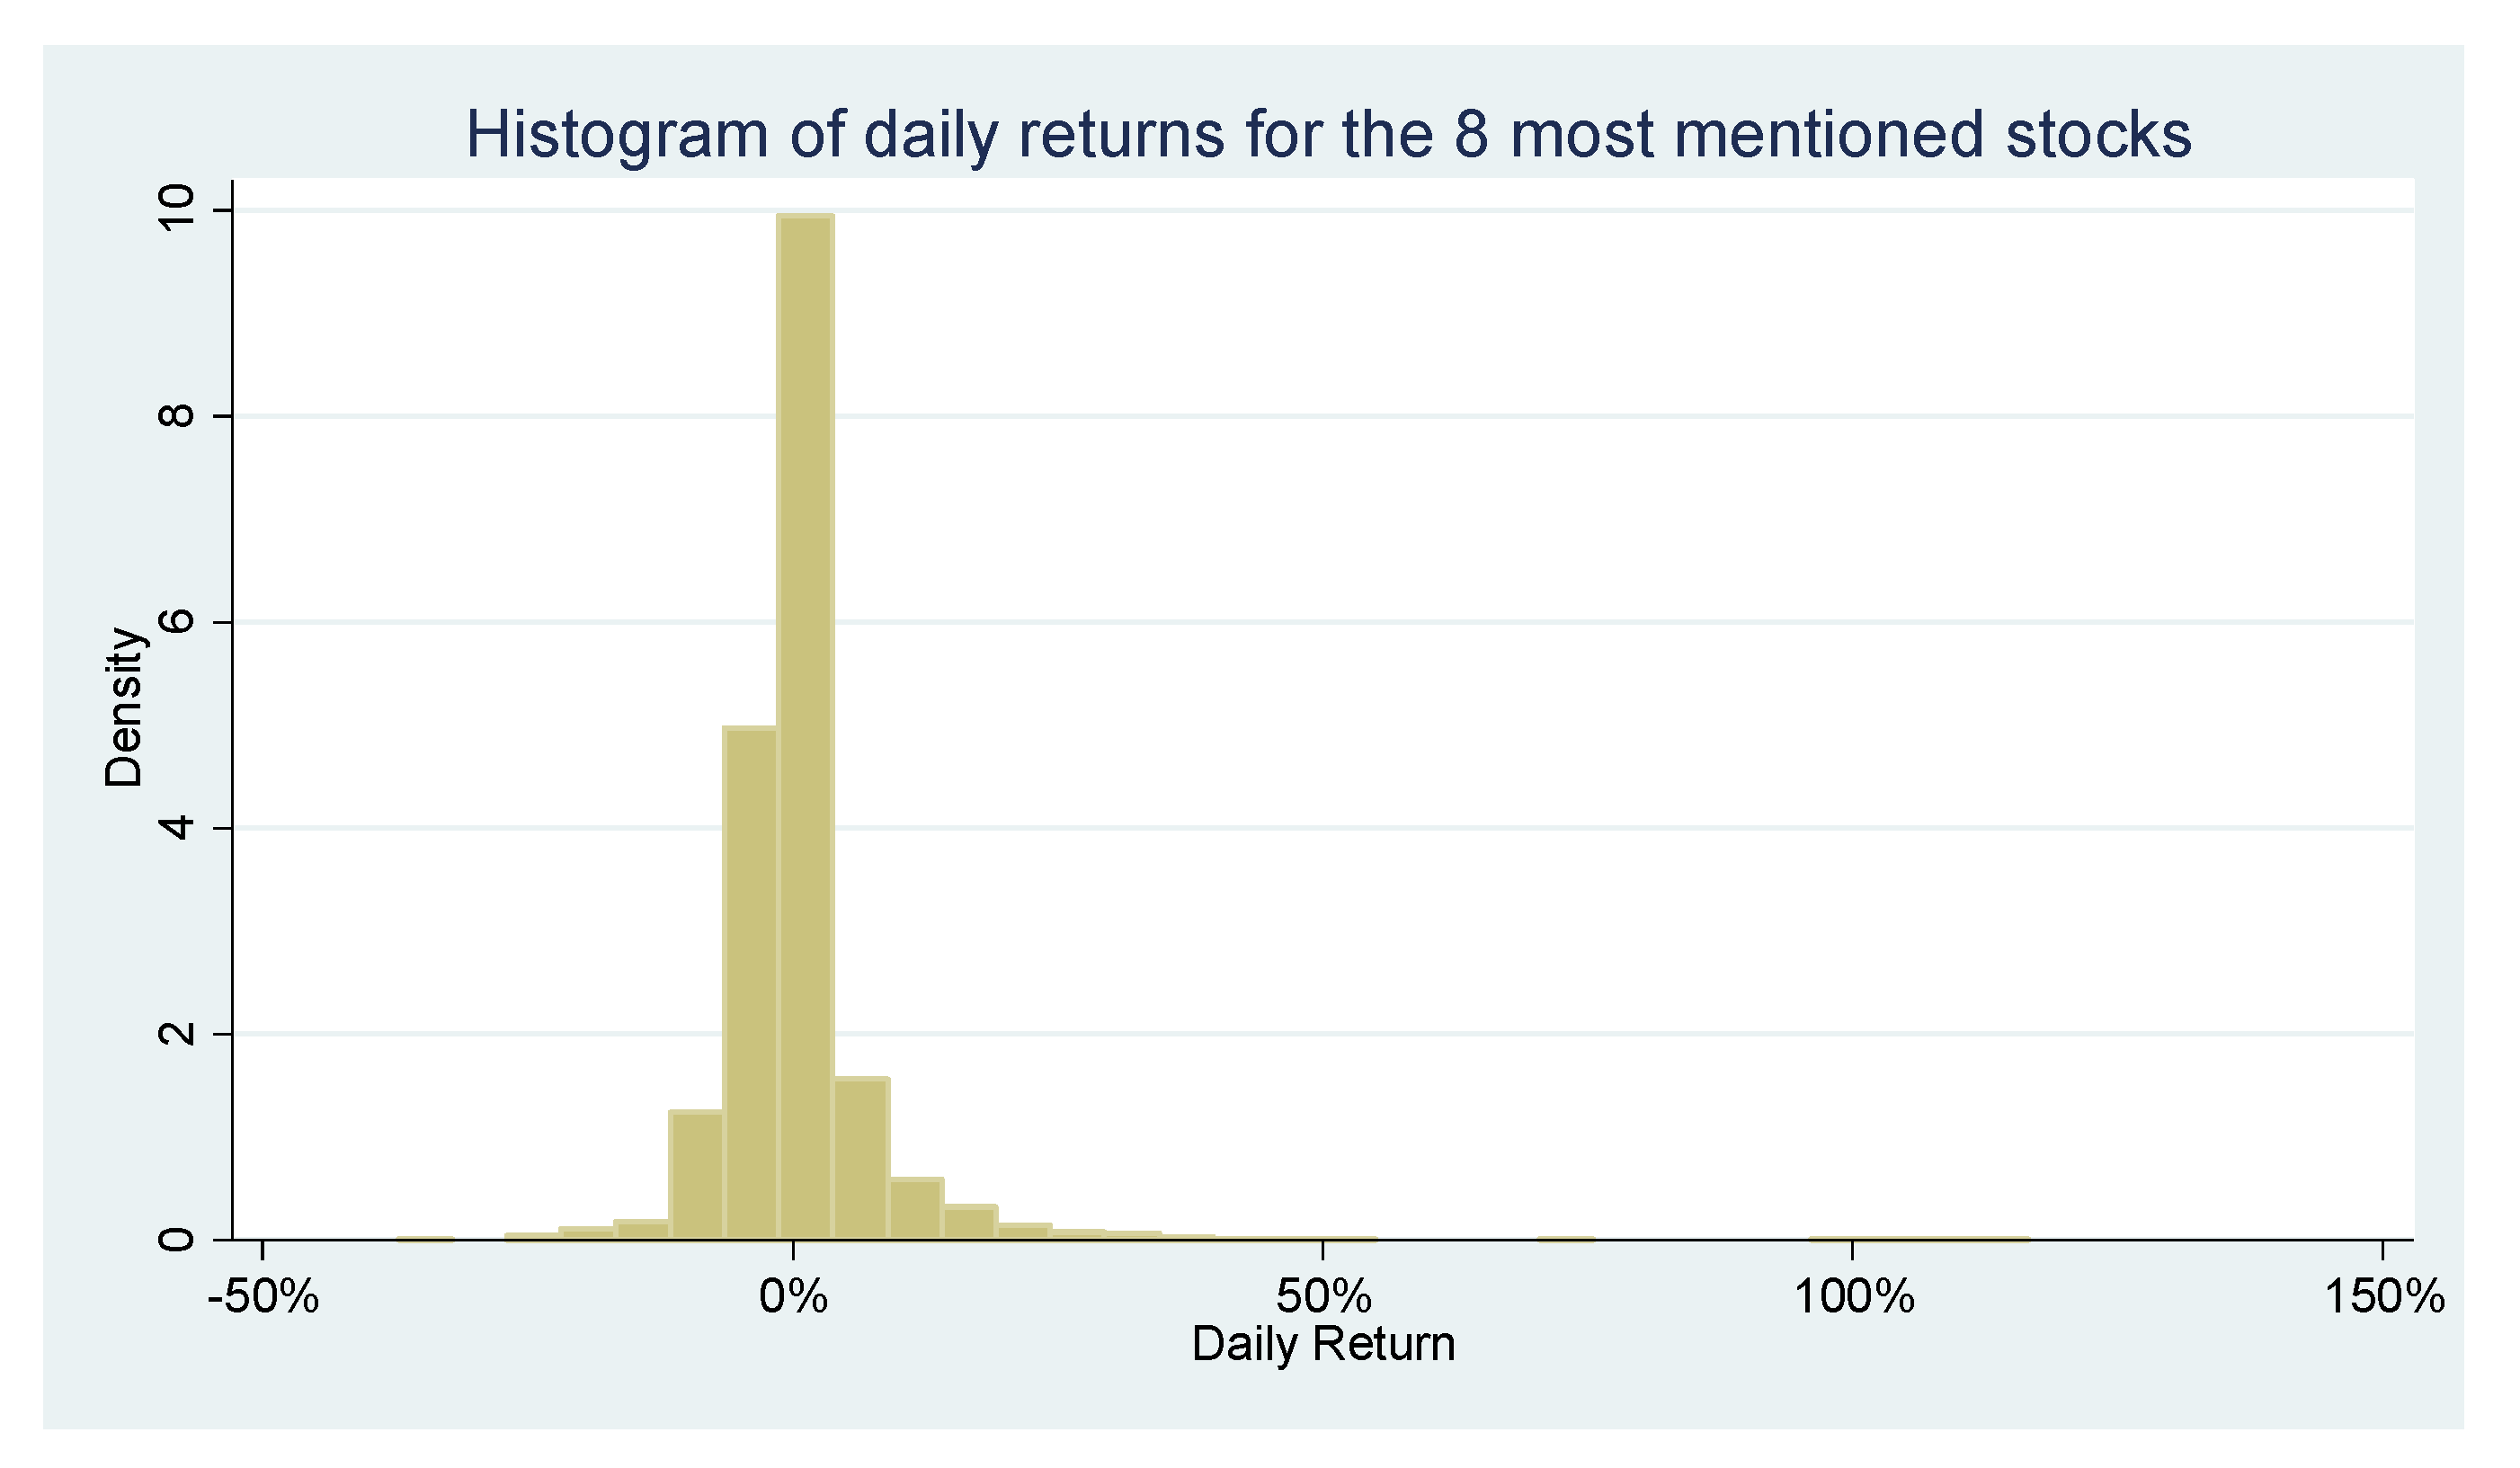
We proceeded with our analysis by examining the trends present in our data features. We use a subset of the data—the eight most mentioned stocks—for readability purposes. By plotting the histograms (
Figure 4) for the daily mentions and returns of the most popular stocks, it is revealed that there is a heavy positive skewness in both mentions and returns. This gives us a reason to believe that despite being consistently talked about by the largest retail trading forum, there are a limited number of days where these stocks are influenced by a retail trading frenzy and significant price volatility.
These assumptions are confirmed by
Figure 5, which verifies that there are only a few clusters of extreme volatility from February to September.
Figure 5 also showcases that the spikes in the number of mentions coincided with increased volatility for these specific stocks. It should be noted that these stocks tend to move together during these highly volatile periods—for example, GameStop, AMC and Rocket Companies between February and April, and AMC, Clover Health, Rocket, Wish and Blackberry in May and June.
The above information inclines us to believe that there are trends in the data that can be used for a more accurate classification of the signals for a specific stock. We believe that this can be achieved by the addition of data about a number of days in the past to each observation. Autoregressive models are suitable for analysing such types of data and are likely to have high explanatory power.
5. Experimental Setup
We conducted experiments with a number of different categories—linear, non-linear, autoregressive, non-autoregressive. In this section, we discuss their specifications and features. In this project, the only linear model to be utilised is logistic regression. Despite being a predictive model specialised for classification problems, it falls between the fields of statistics and machine learning. While
Figure 6 indicates that the data might not be linearly separable, we believe that it might be able to fit the data relatively well and its performance can be used as a benchmark for the following experiments with more advanced machine learning algorithms.
The other algorithms to be experimented with—Random Forest and Neural Network—are capable of solving non-linear problems. All models, both linear and non-linear, will be fit using three different targets—the high price for one, three, and seven days in the future. The results provide insights into the length of time during which we can make price movement predictions based on posting activity in retail forums. We fit non-autoregressive models, i.e., models which do not use data from previous observations to draw their predictions from, for all three algorithms and test the hypothesis that the posting activity for the day on its own is enough for an accurate classification of the day as either a proactive or reactive signal. Those models include the following features from the previous day—daily mentions, score, and the number of each type of flair post for each stock. We are able to formalise the non-autoregressive model using only the current observation to calculate probability of the observation belonging to one of the classes (Equation (1)) as:
where
p is the probability of the observation belonging to a class and
β is the coefficient for each input.
The autoregressive models differ quite dramatically from the non-autoregressive ones. These models are widely used in finance due to their ability to capture trends in securities prices and achieve high accuracy rates. In this project, the autoregressive models used are trained using both returns (per cent difference for the open, high, low, close prices, and volume at the time of the observation with those of one, five, and seven days ago), and post data from one, three, and seven days before the current observation, in addition to the features from the observation. The formalised model (Equation (2)) for the autoregressive logistic regression model using the current and previous (−1) observations to calculate probability of the observation belonging to one of the classes is as follows:
where
p is the probability of the observation classed as either proactive or reactive signal, β is the coefficient for each feature and the subscript following each feature shows the time lag. The model shown (Equation (2)) uses one time lag and contains 25 features in total. Those looking further back into the past have, i.e., from three and seven days ago, 40 and 55 features, respectively.
6. Results
In this section, we report the results of our experiments with the different algorithms, in order to compare the results achieved and the goodness of the fit for each model. Upon finding the best model, we conducted a back-test, in order to gauge if the model’s predictions can be used as a part of a trading strategy. We trained a model using data for either the current day only or including the data from the previous day and from three and seven days ago. We also tested these models for each of our three labels, trying to classify the posting and price action as proactive or reactive, looking one, three, or seven days ahead. This resulted in twelve models being trained per algorithm for a total of thirty-six models across all algorithms.
Table 1 shows that the number of proactive and reactive signals is relatively similar for all labels. It is also indicative that we have comparable levels of reactive and proactive signals for each target.
6.1. Logistic Regression
The logistic regression being a linear classifier is expected to have the worst performance of all models, due to the lack of linear separability of the data. Yet, the majority of the logit models are statistically significant at the 1% confidence level, except for the non-autoregressive models as shown in
Table 2. The accuracy of the models ranges between 55% and 64%. It should be noted that the non-autoregressive models appear to perform better with the longer-term predictions for three and seven days than for the next day. The opposite holds true for the autoregressive ones—the accuracy rates achieved for the next day predictions are better than for the longer-term ones.
Yet, despite the fairly good accuracy rates, the majority of the models were heavily biased towards reactive predictions, and in some of the extreme cases, 8100 out of 8135 observations are classified as reactive. This bias is only somewhat missing in two of the models—the three and seven days’ lagged autoregressive models which are categorising posts for the next day (Day + 1 label). Overall, despite being a non-linear classifier, the logistic regression was able to produce some relatively accurate models when testing on seen data, reaching a 63.75% accuracy rate with minimal bias.
6.2. Random Forest
The Random Forest, being a non-linear classifier, is expected to perform better on this data than the Logistic Regression models, however, that is not the case with the non-autoregressive models. Whereas, despite its heavy bias, the Logistic Regression is able to correctly categorise 55–56% of the observations correctly (depending on inputs and targets), the Random Forest results are as low as 51.6%. We also confirmed that the trend of higher accuracy being achieved by the non-autoregressive models for longer-term predictions (three and seven days) is also present in the Random Forest models (
Table 3).
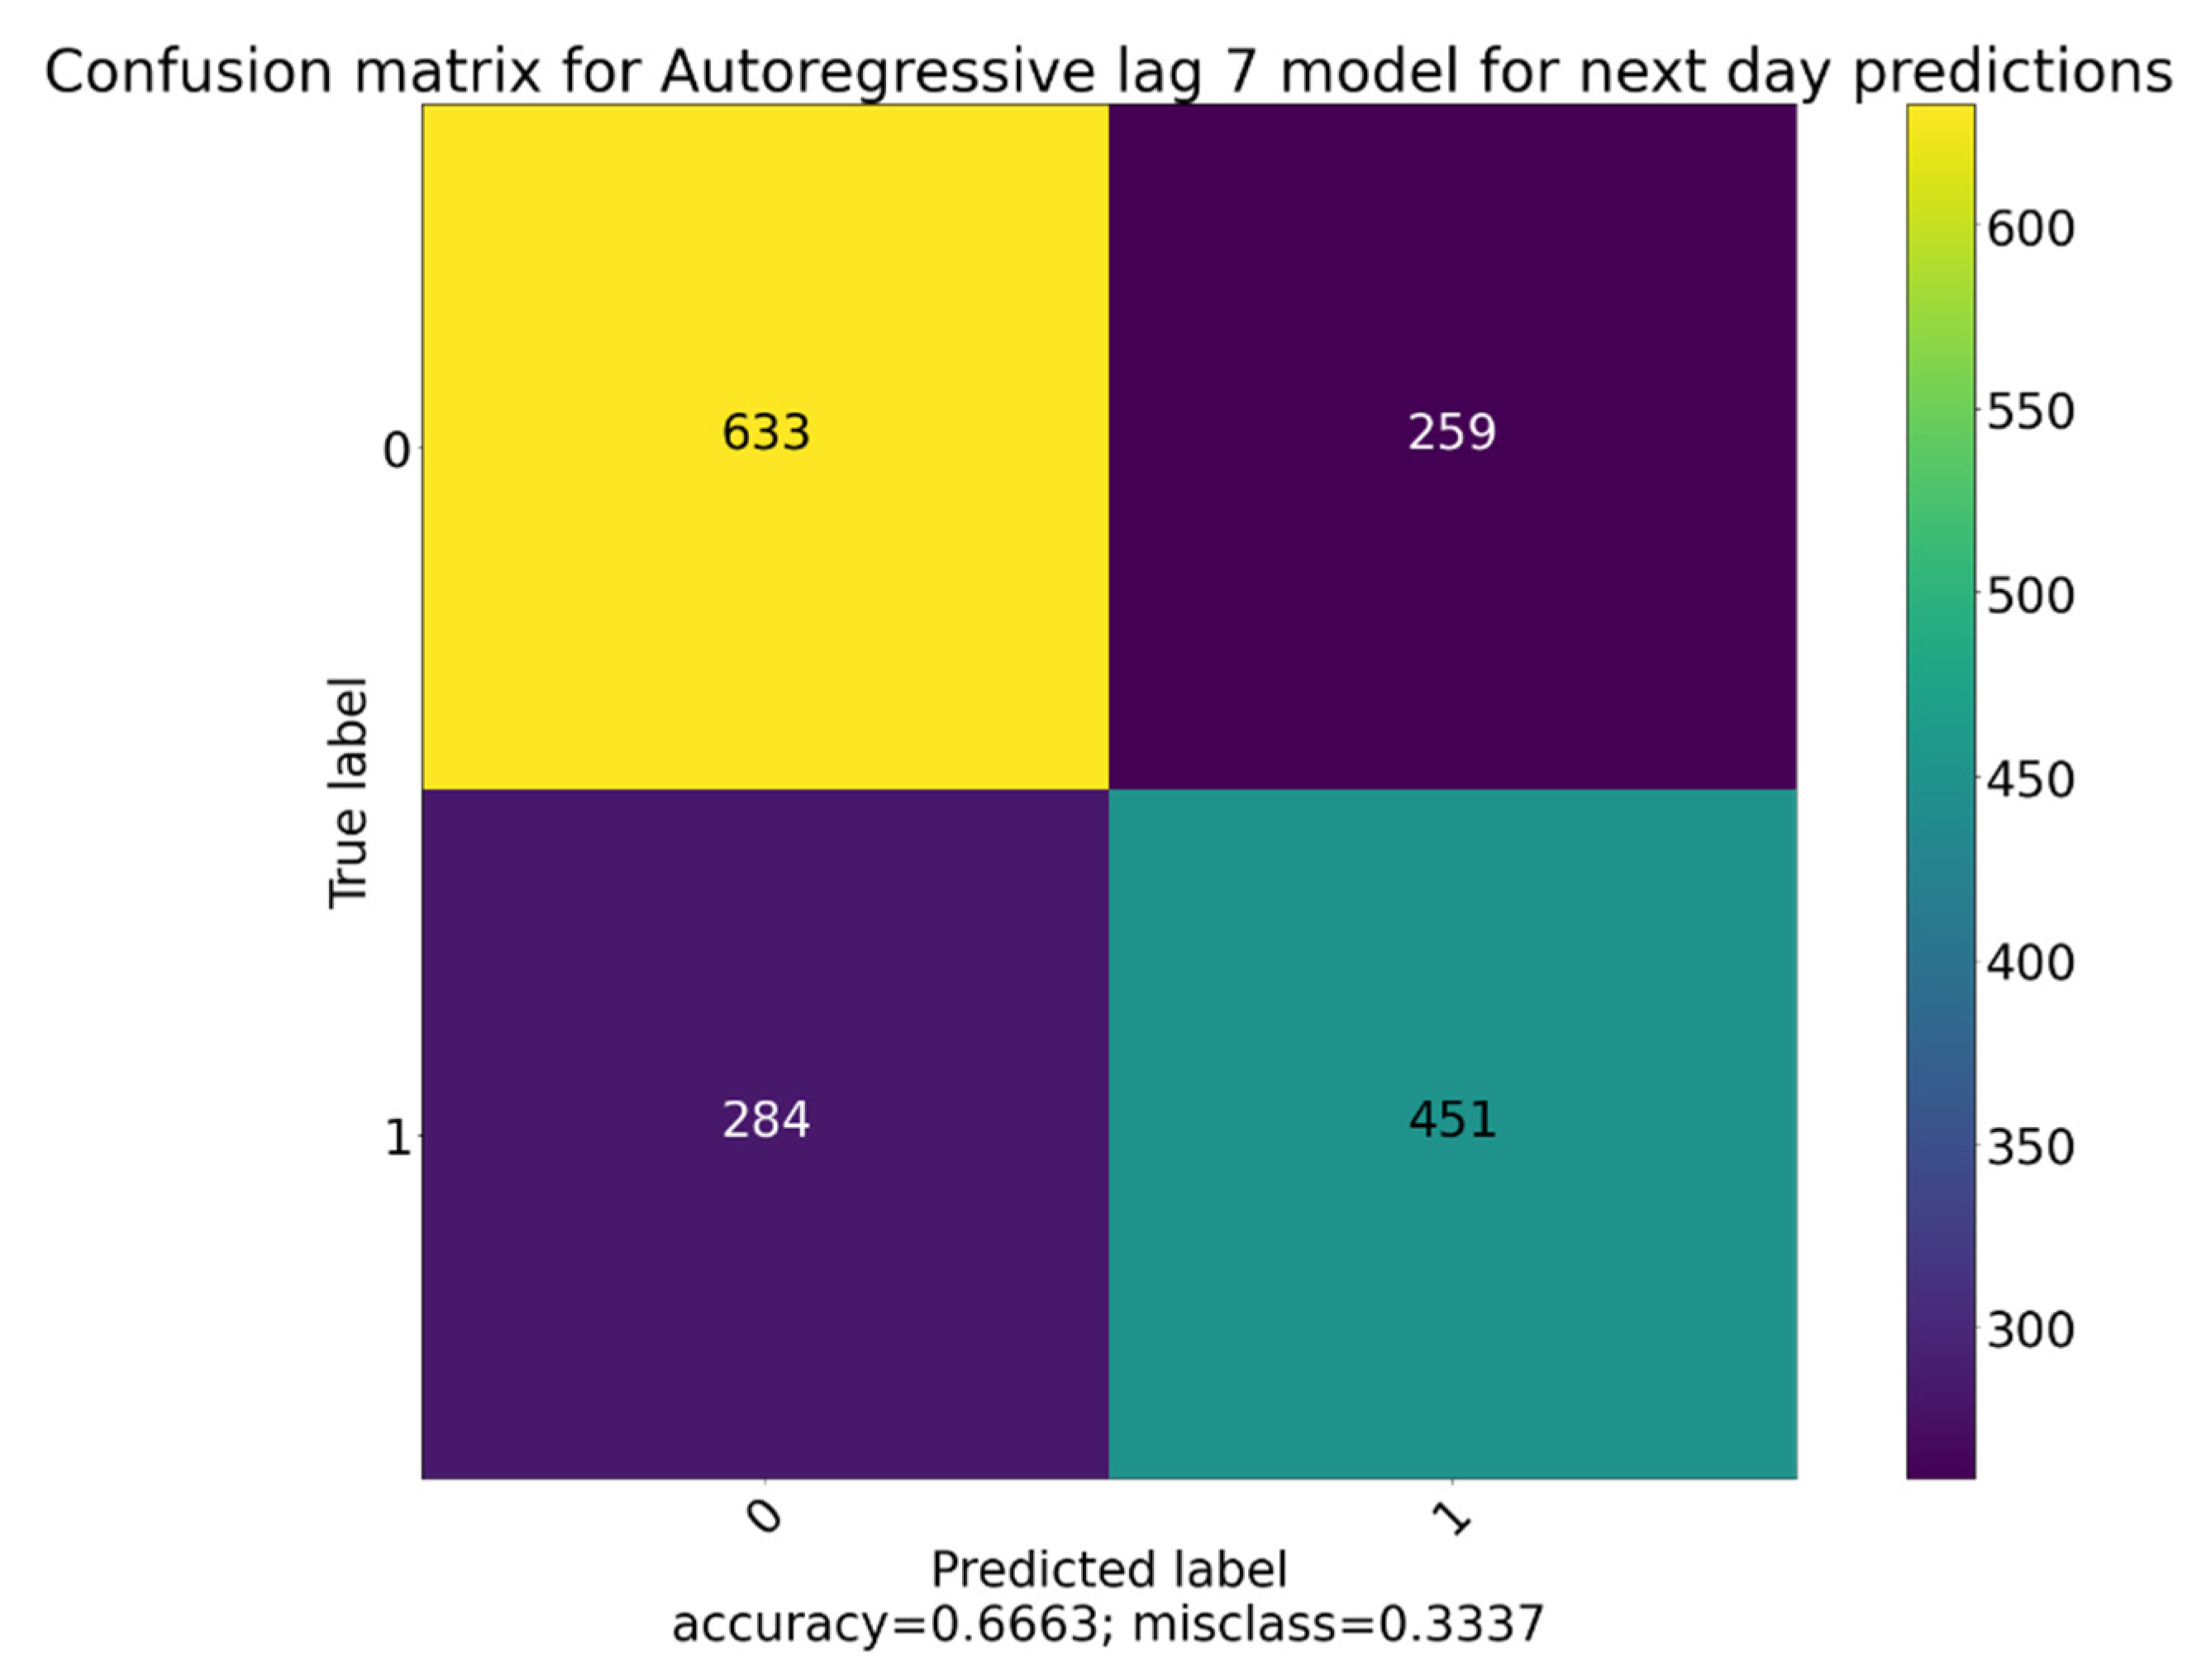
However, the Random Forest models begin to outperform the Logistic Regression ones in the autoregressive models, especially in the one day ahead categorisation. Once again, the longest-term predictions experience the heaviest bias towards the reactive category, followed by the middle-term ones. We are able to achieve impressive accuracy, in the range 66–70% for the autoregressive lag 7 model for next day predictions. Furthermore, upon inspecting its confusion matrix (
Figure 7) we confirmed that it is not heavily biased toward one category and can generalise the data well as indicated by the low number of false positives and false negatives.
Due to its unique nature, the Random Forest classifier also calculates each feature’s importance and provides us with the opportunity to find out which input features are the most important (
Figure 8). Surprisingly, the post activity for the day is shown to be considerably less valuable for accurate predictions than the stock returns in the previous week, which seems to indicate that the model is able to capture the price trend and use it successfully. The total stock scores for the day over the previous week appears to be the most significant features within the post data, followed by mentions, YOLO, and news posts. Somewhat expectedly, technical analysis and loss posts are the least important features in the data.
6.3. Neural Network
The neural network is the most complex classificator out of the three that we are working with due to the sheer number of possible model configurations that can be created. Yet, in this particular case, it was not able to fit the data very well, due to either model limitations or incorrect experimental configuration, which translates to a worse than expected performance.
We do not see the same trend in the neural network predictions for the non-autoregressive models. It achieves 55 to 55.5% accuracy in all three models with a heavy bias towards the reactive class. Its predictions are improved with the inclusion of the time-lagged variables, which it is able to classify relatively well, however, it is unable to outperform the Random Forest classifier (
Table 4).
As is in the other two classifiers, the longest-term predictions are the worst in terms of both prediction accuracy and heavy bias toward one of the categories for both the autoregressive and non-autoregressive models, while the shortest-term ones are the best.
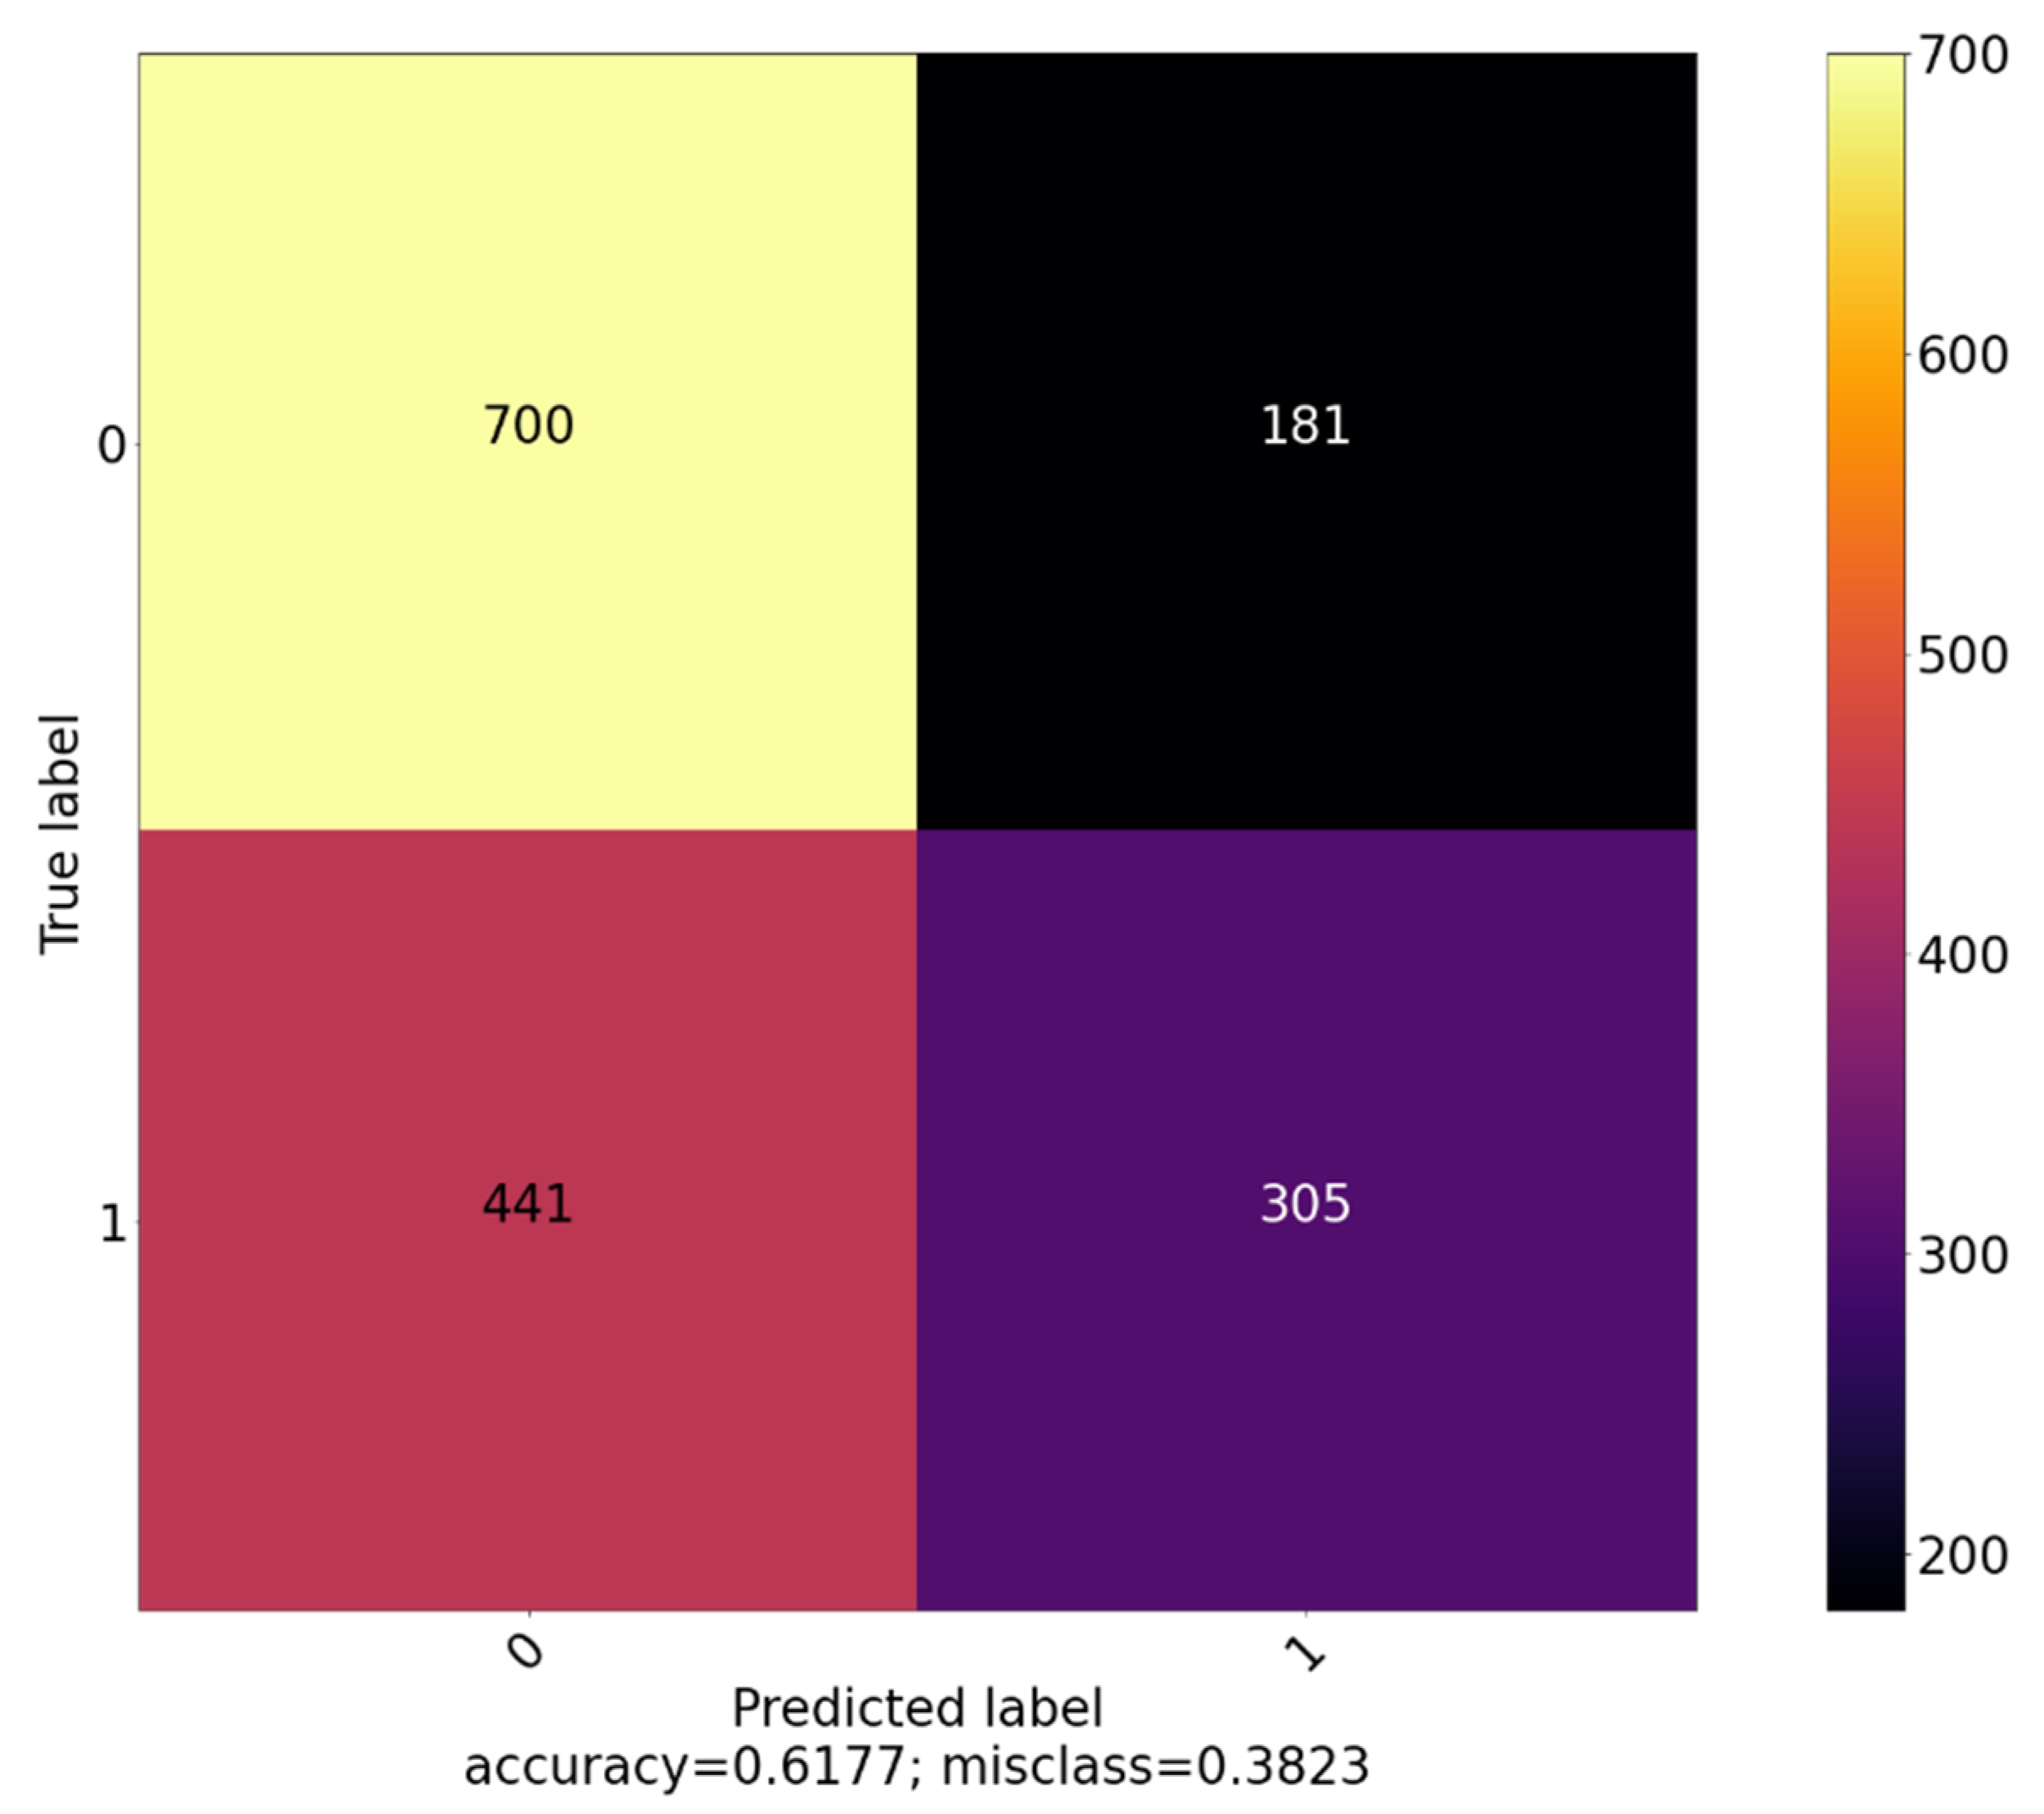
While the classification bias significantly improves with the addition of time-lagged variables (
Figure 9), it is never absent as it is in the Random Forest Classifier (
Figure 7).
However, it is important to note that the best predictions for the next and three day ahead forecast are obtained when working with only three lags. We believe that seven days’ lagged models begin to suffer from the Curse of Dimensionality due to the limited number of observations we are working with.
7. Discussion
Considering our results, the models produced by the three algorithms have achieved similar results in the 53–63% accuracy range. However, upon analysis of their confusion matrices, we uncovered that many of them are heavily biased toward one of the classes, which would make them unusable. Taking into consideration accuracy rate during testing, whether the test data is seen or unseen, and bias towards a specific class, we conclude that the best model created during our experiments is the Random Forest autoregressive model with 7 lags for signal classification based on the next day prices. It has displayed both balanced and accurate predictions, which make it a prime candidate for trading strategy applications.
Despite the best model showing predictions in the 66–70% range for those specific stocks, a result usually considered low, the fact that we are predicting the direction of the stock market, considered the Holy Grail in the world of finance, must also be considered. Still, in the best-case scenario, the model is wrong approximately 30% of the time and given that we are examining a highly volatile environment, it may very well be the case that losses suffered due to investments made due to bad predictions result in an overall loss.
In order to discover if the best-fitting model can be used for investment advice, we conducted a back-test. This back-test consisted of us attempting to implement a trading strategy, where a long position is opened upon the prediction of a proactive signal and a short position is opened on a reactive signal prediction. The test simulates ideal conditions and does not consider trading fees, taxes, and any trading-related costs. The test is conducted using the predictions of the testing set for the autoregressive lag 7 Random Forest classifier for next day predictions. It is assumed that for every signal output by the model, we invest $100 in the respective long/short position and are able to close it at maximum profitability on the next day. Using this strategy, we found out that we would have a maximum profit of 71% and a maximum loss of 85% in a trade for trades that are done with our test data. The total invested amount is $139,700, and the total return is $126,618 for a total net loss of 9.36%, indicating that the 30% of predictions that are wrong are occurring in the times of greatest volatility.
While these results are initially discouraging, better ones are likely to be achieved using a dataset with a higher granularity. Evidence shows that an aggregate of the retail sentiment on specialised platforms, with less users than WSB [
25], such as Stocktwits can be used for intraday forecasting [
22]. It is likely that with its larger size and members, prone to using highly leveraged instruments to trade, the intraday effect of WSB can be felt even more acutely.
8. Conclusions
This paper aims to provide insight into whether widely used machine learning models are able to accurately forecast the direction of stocks being actively discussed in one of the largest retail investor forums, following its considerable increase in size and capital.
The January 2021 short squeeze of hedge funds by coordinated retail investors was unprecedented and provides a glimpse into the power of herding behaviour when provided with a large enough (online) forum. We provided background information on what were the events that caused the short squeeze wave and what were its implications to both the WSB subreddit and the wider world.
We believe that the rapid expansion of WSB has made it possible for events, resulting in such abnormal returns to reoccur in the future, in line with existing evidence [
15], and turned our attention to analysing the posts on the subreddit, attempting to extract Alpha from them using machine learning models. We explored existing literature regarding machine learning techniques and found evidence that a high degree of accuracy is possible when classifying sentiment towards a specific topic. Additionally, existing research into the subreddit itself revealed that stocks talked about by members, especially smaller market cap ones, tended to experience volatility bursts. Furthermore, it was discovered that selling a stock is generally frowned upon by members of the community and that there had been a significant change in both community size and narrative following short squeeze wave.
We utilised the inherent bullishness of the subreddit users to gather and aggregate data about which stocks were mostly talked about, what other users thought about the opinion expressed (score of the post), and in what context (flair of the post). We then added the daily returns data for each stock with sufficient daily mentions—with threshold set at 20 mentions—and based on future returns, generated labels if the signal was reactive or proactive.
We experimented with models which use both non-autoregressive (using the data for the current day only) and autoregressive (using data from up to seven days before) models to predict if the stock’s returns would be positive or negative in one, five, and seven days in the future. The best performing classifier is an autoregressive Random Forest model, which used data from the past seven days to predict where the stock price would be in seven days, achieving an accuracy of 70%. Despite the respectable accuracy rate achieved, after performing a back-test using predictions as signals to long or short a stock, we concluded that the model is unable to capture volatility bursts, resulting in a net loss of 9.36% in the test. These results confirmed that these predictions alone are not sufficient for a profitable trading strategy.
While our work attempted to find if the post data from WSB and price data for the most talked about stocks is sufficient to identify trading signals proactively, it was not successful in creating accurate predictions to establish a profitable trading strategy. Limiting factors in this research are the low (daily) granularity data, as well as the lack of a custom-created lexicon, specific to the WSB language and terminology, or emotion classifier trained on a large, manually labelled excerpt of the forum.
Future work can include the introduction emotion (bullishness or bearishness) classification. The addition of fundamental data and news, both which are often the catalyst for large moves, could also prove to be quite beneficial. Macroeconomic and monetary policy data is also likely to improve forecasts, as retail-driven events such as the short squeezes of January 2021 require specific, favourable conditions to become possible. Finally, more advanced, and finely tuned models may achieve a better fit of the data, whose predictions may result in a profitable trading strategy.


