Article

Extraction and Characterization of Cellulose Obtained from Banana Plant Pseudostem

by
Rosa E. A. Nascimento
1,
Mónica Carvalheira
2,3,
João G. Crespo
1 and
Luísa A. Neves
1,*
1
LAQV/REQUIMTE, Chemistry Department, NOVA School of Science and Technology, Universidade NOVA de Lisboa, Campus de Caparica, 2819-516 Caparica, Portugal
2
Associate Laboratory i4HB—Institute for Health and Bioeconomy, NOVA School of Science and Technology, Universidade NOVA de Lisboa, Campus de Caparica, 2829-516 Caparica, Portugal
3
UCIBIO—Applied Molecular Biosciences Unit, Department of Chemistry, NOVA School of Science and Technology, Universidade NOVA de Lisboa, Campus de Caparica, 2829-516 Caparica, Portugal
*
Author to whom correspondence should be addressed.
Clean Technol. 2023, 5(3), 1028-1043; https://doi.org/10.3390/cleantechnol5030052
Submission received: 8 July 2023 / Revised: 10 August 2023 / Accepted: 25 August 2023 / Published: 29 August 2023
(This article belongs to the Special Issue Valorization of Industrial and Agro Waste)

Abstract

:
Each year, the amount of residue generated from food production increases, caused by the continuous population growth. Banana is one of the most consumed fruits in the world, with an annual production of 116.78 million tonnes. However, just 12 wt% of the plant, corresponding to the bunch, is effectively used. After the bunch is harvested, the rest of the plant is disposed of as residue, the pseudostem (PS) being the main constituent. Aiming to give an added-value application to the PS, this work is focused on the extraction of cellulose from this waste. For this, three different fractions of PS particles—a non-classified fraction (milled but without sieving), a fine fraction (≤180 μm), and a coarse fraction (≥2000 μm)—and three extraction methods—alkaline-acid hydrolysis, enzymatic hydrolysis, and TEMPO oxidation—were studied to determine the most promising method for the cellulose extraction from the PS. The alkaline-acid hydrolysis samples presented a higher number of amorphous compounds, resulting in lower crystallinity (13.50% for the non-classified fraction). The TEMPO-oxidation process, despite allowing the highest cellulose extraction yield (25.25 ± 0.08% on a dried basis), resulted in samples with lower thermal stability (up to 200 °C). The most promising extraction method was enzymatic, allowing the extraction of 14.58 ± 0.30% of cellulose (dried basis) and obtaining extracts with the highest crystallinity (68.98% for the non-classified fraction) and thermal stability (until 250 °C).

1. Introduction

The banana plant is a large-scale herbaceous plant belonging to the Musaceae family, Zingiberales order, and Musa genus, which originates from India, Malaysia, and Japan. There are around 70 species of classified banana plants, which are cultivated in more than 130 countries, mainly in tropical and subtropical regions [1]. Banana plant contains a rhizomatous underground stem, from which starts its leaves, presenting spirally arranged pods that look like a false stem—the so-called pseudostem (PS). Each banana plant produces just one banana bunch during its life cycle, which takes between 80 and 180 days to be fully grown [1]. The banana plant PS size has a range of 3–5 m high and a diameter of 40–60 cm [2].
Because of the world population increase and consequent demand for food, the world banana production has presented significant growth in the last few years, reaching 116.78 million tonnes of production per year [3]. However, the increase in banana production also leads to an increase in residues generated during the harvesting process. Each ton of harvested bananas corresponds to 100 kg of rejected fruit and around 4 tonnes of lignocellulosic-based waste (3 tonnes of PS, 160 kg of stem, 480 kg of leaves, and 440 kg of husks) [4]. Most of these residues present no application, so they are left untreated and disposed of through dumping into the land, burning, or landfilling. This type of residue disposal can lead to adverse effects, like soil contamination and the production of greenhouse gases. Because of this and in accordance with the 12th goal of 2030 United Nations Sustainable Development Goals: Sustainable Production and Consume, it is important to develop a sustainable and efficient management of the agro-industrial residues, respecting the circular economy principles, as a regenerative economic model [5,6]. The suitable management of these residues, despite reducing the environmental impacts and health hazards, will also contribute to maximizing its payback, generating a new income for the banana producers and resulting in overall favorable balances for the environment and the economy.
The PS is the main residue generated from banana production, presenting a high content of lignocellulosic compounds, making it an interesting raw material for the extraction of added-value chemical compounds, such as cellulose. Cellulose presents unique properties, such as biocompatibility, biodegradability, and non-toxicity. It is mainly obtained from plants, but it can also have microbial origin (e.g., fungal, bacterial, and algal). One of the main research areas nowadays is focused on the extraction of cellulose from natural resources, for example, from rice husk, pine needles, and cotton, using different chemical, mechanical, and green extraction techniques, which can be used to produce, for example, nanocomposites, paper, and packaging materials [7,8].
The chemical composition of a PS is variable, depending on the banana plant species, cultivation area and conditions, and the methods used to extract its components [9]. Regarding the cellulose content, it can present values from 32.4 to 64.0 wt% [10,11,12,13,14]. The main reason associated with the large range of cellulose content reported lies in the cellulose recovery methods employed [10]. To the best of our knowledge, there are no studies published so far regarding the influence of PS particle size on cellulose extraction yield.
This work evaluates the influence of PS particle size on cellulose extraction by testing three different PS particle size ranges—non-classified fraction (milled but without sieving), fine fraction (≤180 μm), and coarse fraction (≥2000 μm)—and three different extraction methods—alkaline-acid hydrolysis, enzymatic hydrolysis, and TEMPO oxidation. The main goal is to obtain cellulose, aiming to add value to the residues generated from banana plant production. The obtained extracts are characterized with the following techniques: high-pressure liquid chromatography (HPLC), Fourier transform infrared (FTIR) spectroscopy, X-ray diffraction (XRD), and thermal gravimetrical analysis (TGA).

2. Materials and Methods

2.1. Biomass Preparation

The PS (from Musa acuminata Colla) was collected on the island of Madeira, Portugal. The PS was harvested, opened, and completely dried at room temperature. Once dried, the PS was sliced and crushed using a crushing machine (A10; IKA, Staufen, Germany), producing the non-classified fraction. After that, a portion of the non-classified fraction was selected to perform the particle size characterization by using eight stainless steel sieves placed in series (woven wire; Endecotts Ltd.; London, UK) with a grid diameter between 180 μm and 2000 μm. The crushed PS particles were dispersed on the top of the sieve with the highest grid diameter and shaken on top of a sieve shaker (Octagon 200; Endecotts; London, UK) for 15 min. The PS particle size distribution was analyzed (presented in Section 3.1), resulting in the selection of fine (≤180 μm) and coarse (≥2000 μm) fractions to be studied together with the non-classified fraction (milled but without sieving).

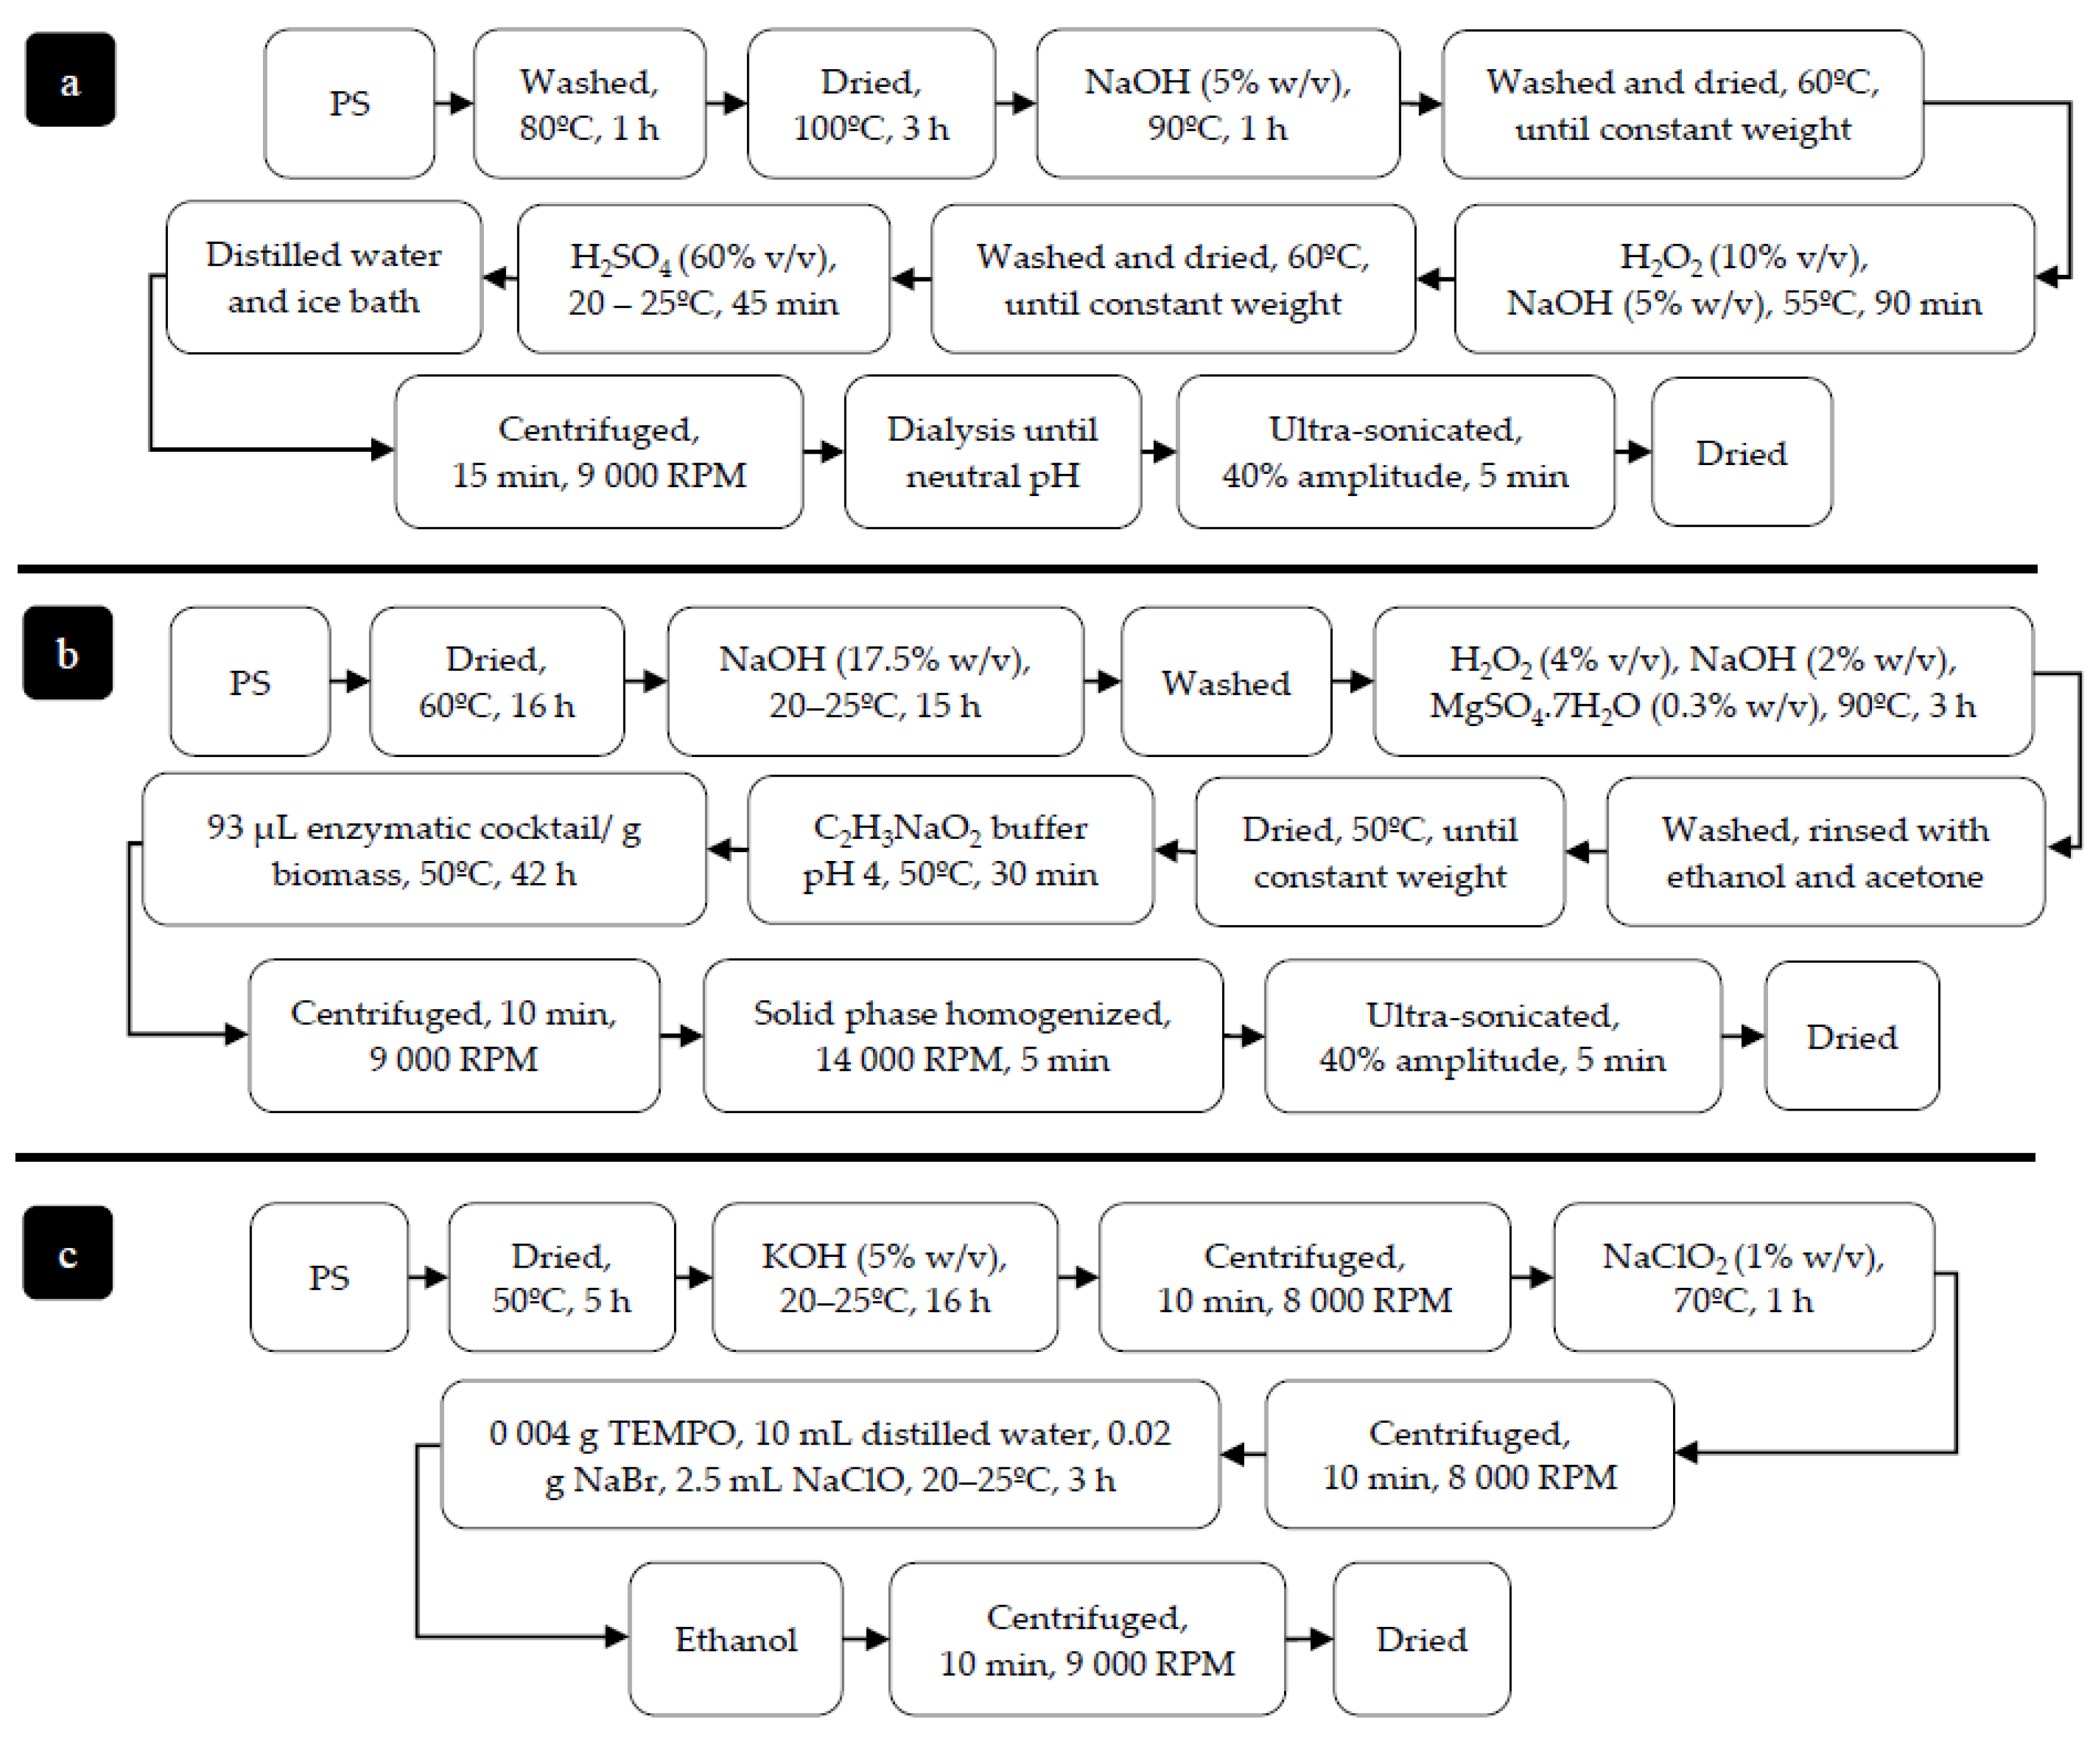
2.2. Cellulose Extraction

Cellulose extraction from the PS was performed using three different extraction methods (Figure 1). Method 1 was an alkaline-acid hydrolysis (Figure 1a) based on the method by Prado et al. [14]. The biomass (PS particles) was immersed in deionized water at 80 °C for 1 h and then dried in an oven (Ovenvan N 24; Ovan, Spain) at 100 °C for 3 h. After that, the samples were treated with 20 mL of sodium hydroxide (5% w/v)/g biomass at 90 °C for 1 h under constant stirring. The samples obtained from this step were washed with deionized water and dried at 60 °C until a constant mass was reached. Then, the samples were treated with 40 mL of a solution of hydrogen peroxide (16% v/v) and sodium hydroxide (5% w/v))/g biomass at 55 °C for 90 min under stirring. After rinsing with deionized water and drying in the oven at 60 °C until a constant mass was reached, the samples were treated with 20 mL sulfuric acid (60% v/v)/g biomass for 45 min at room temperature (20 to 25 °C) under constant stirring. Then, the reaction was stopped by cooling the samples in an ice bath and adding 200 mL of cold deionized water to the samples. After that, the samples were washed with deionized water through 15 min centrifugation (4–16 KS; Sigma-Aldrich; Missouri, USA) at 9000 RPM, and finally, its pH was neutralized via dialysis (12–14 KDa dialysis membrane; Spectrum Laboratories, Rock Hill, SC, USA) against deionized water. Finally, the samples were ultrasonicated (VCX 750; Sonics & Materials, Inc.; Connecticut, USA) with 40% amplitude, a pulse of 1 s on and 1 s off for 5 min, and dried in the oven at 60 °C until constant mass was reached.
Method 2 was an enzymatic hydrolysis (Figure 1b) based on the method described by Martelli-Tosi et al. [15]. The biomass was dried at 60 °C for 16 h and then suspended in 70 mL of sodium hydroxide (17.5% w/v)/g biomass for 15 h at room temperature. After that, the samples were washed with deionized water and then bleached with 30 mL of hydrogen peroxide (4% v/v), sodium hydroxide (2% w/v), and magnesium sulfate heptahydrate (0.3% w/v) at 90 °C for 3 h under stirring. Then, the samples were washed with deionized water, rinsed with ethanol and acetone, dried at 50 °C until reaching constant mass, and hydrolyzed with 50 mL sodium acetate buffer at pH 4 at 50 °C for 30 min. After 30 min, 93 μL of a cellulase enzymatic cocktail Optimash VR (DuPont; Wilmington, DE, USA)/g biomass was added to the samples and left at 50 °C for 42 h under stirring. The reaction was stopped by submersing the reaction flask at 96 °C for 15 min. Samples were centrifuged for 10 min at 9000 RPM. After that, the insoluble fraction (pellet) was resuspended in deionized water, homogenized with an ultraturrax disperser (T25; IKA, Staufen, Germany) at 14,000 RPM for 5 min, and ultrasonicated with 40% amplitude, a pulse of 1 s on and 1 s off, for 5 min. Lastly, the samples were dried in the oven at 60 °C until constant mass was reached.
Method 3 was a TEMPO-mediated oxidation (Figure 1c) adapted from the method by Faradilla et al. [16]. The biomass was dried in the oven at 50 °C for 5 h and then soaked in 30 mL potassium hydroxide (5% w/v)/g biomass for 16 h at room temperature with constant stirring. After washing with deionized water via 10 min centrifugation at 8000 RPM, samples were bleached with 20 mL sodium chlorite (1% w/v)/g biomass at 70 °C for 1 h under stirring, and the centrifugation step was repeated. Samples were bleached in oxyl (TEMPO) solution—(0.02 g sodium bromide, 0.004 g TEMPO, and 10 mL deionized water)/g biomass—and 2.5 mL sodium hypochlorite (12% w/v) for 3 h at room temperature using constant stirring. After that, the reaction was stopped by adding 0.5 mL of ethanol to the samples. Then, the samples were washed via centrifugation and dried in the oven at 60 °C until constant mass was reached.

2.3. Extracts Characterization

The final solid extracts obtained from the three extraction methods applied were characterized in terms of physical and chemical properties. Also, the initial untreated PS and the commercial cellulose (Sigmacell microcrystalline cellulose 20 μm; Sigma-Aldrich, Burlington, MA, USA) as the control were characterized.

2.3.1. Sugars Quantification

To validate the success of cellulose extraction, the extracts were digested with 0.8 mL sulfuric acid (30% v/v)/mg biomass at 100 °C for 2 h [17]. The extracted solution was analyzed in terms of glucose content using high-pressure liquid chromatography (Dionex ICS-3000; ThermoFisher Scientific, Waltham, MA, USA) equipped with a refractive index detector. Sugar analysis was performed using a column Thermo Carbopac PA 10 (4.6 × 250 mm), with a gradient elution of 18 mM NaOH and a flow rate of 1 mL/min. The injection volume was 10 μL, and the column temperature was 25 °C.

2.3.2. Chemical Composition Identification

The functional groups present in the samples were identified by Fourier transform infrared (FTIR) spectroscopy. This analysis was carried out in a spectrometer (Spectrum Two; PerkinElmer; Waltham, MA, USA), using a wavelength range between 400 and 4000 cm−1 and 10-scan acquisition.

2.3.3. Crystallinity Determination

The crystallinity of the samples was analyzed through X-ray diffraction (XRD) using an X-ray diffractometer (Miniflex; Rigaku, Tokyo, Japan) at room temperature, with a scanning range between 10° and 80° and a copper X-ray tube (30 kV/15 mA) as a radiation source.
The crystallinity index (Icrystallinity) of the samples was calculated according to Equation (1), as described by Segal et al. [16]:
I crystallinity   ( % ) = I crystallin   I non   crystallin   I crystallin × 100
where Icrystallin is the diffraction intensity near to 2θ = 22–24°, characteristic of a crystalline material, and Inon crystallin is the diffraction intensity near 2θ = 18°, characteristic of an amorphous material.

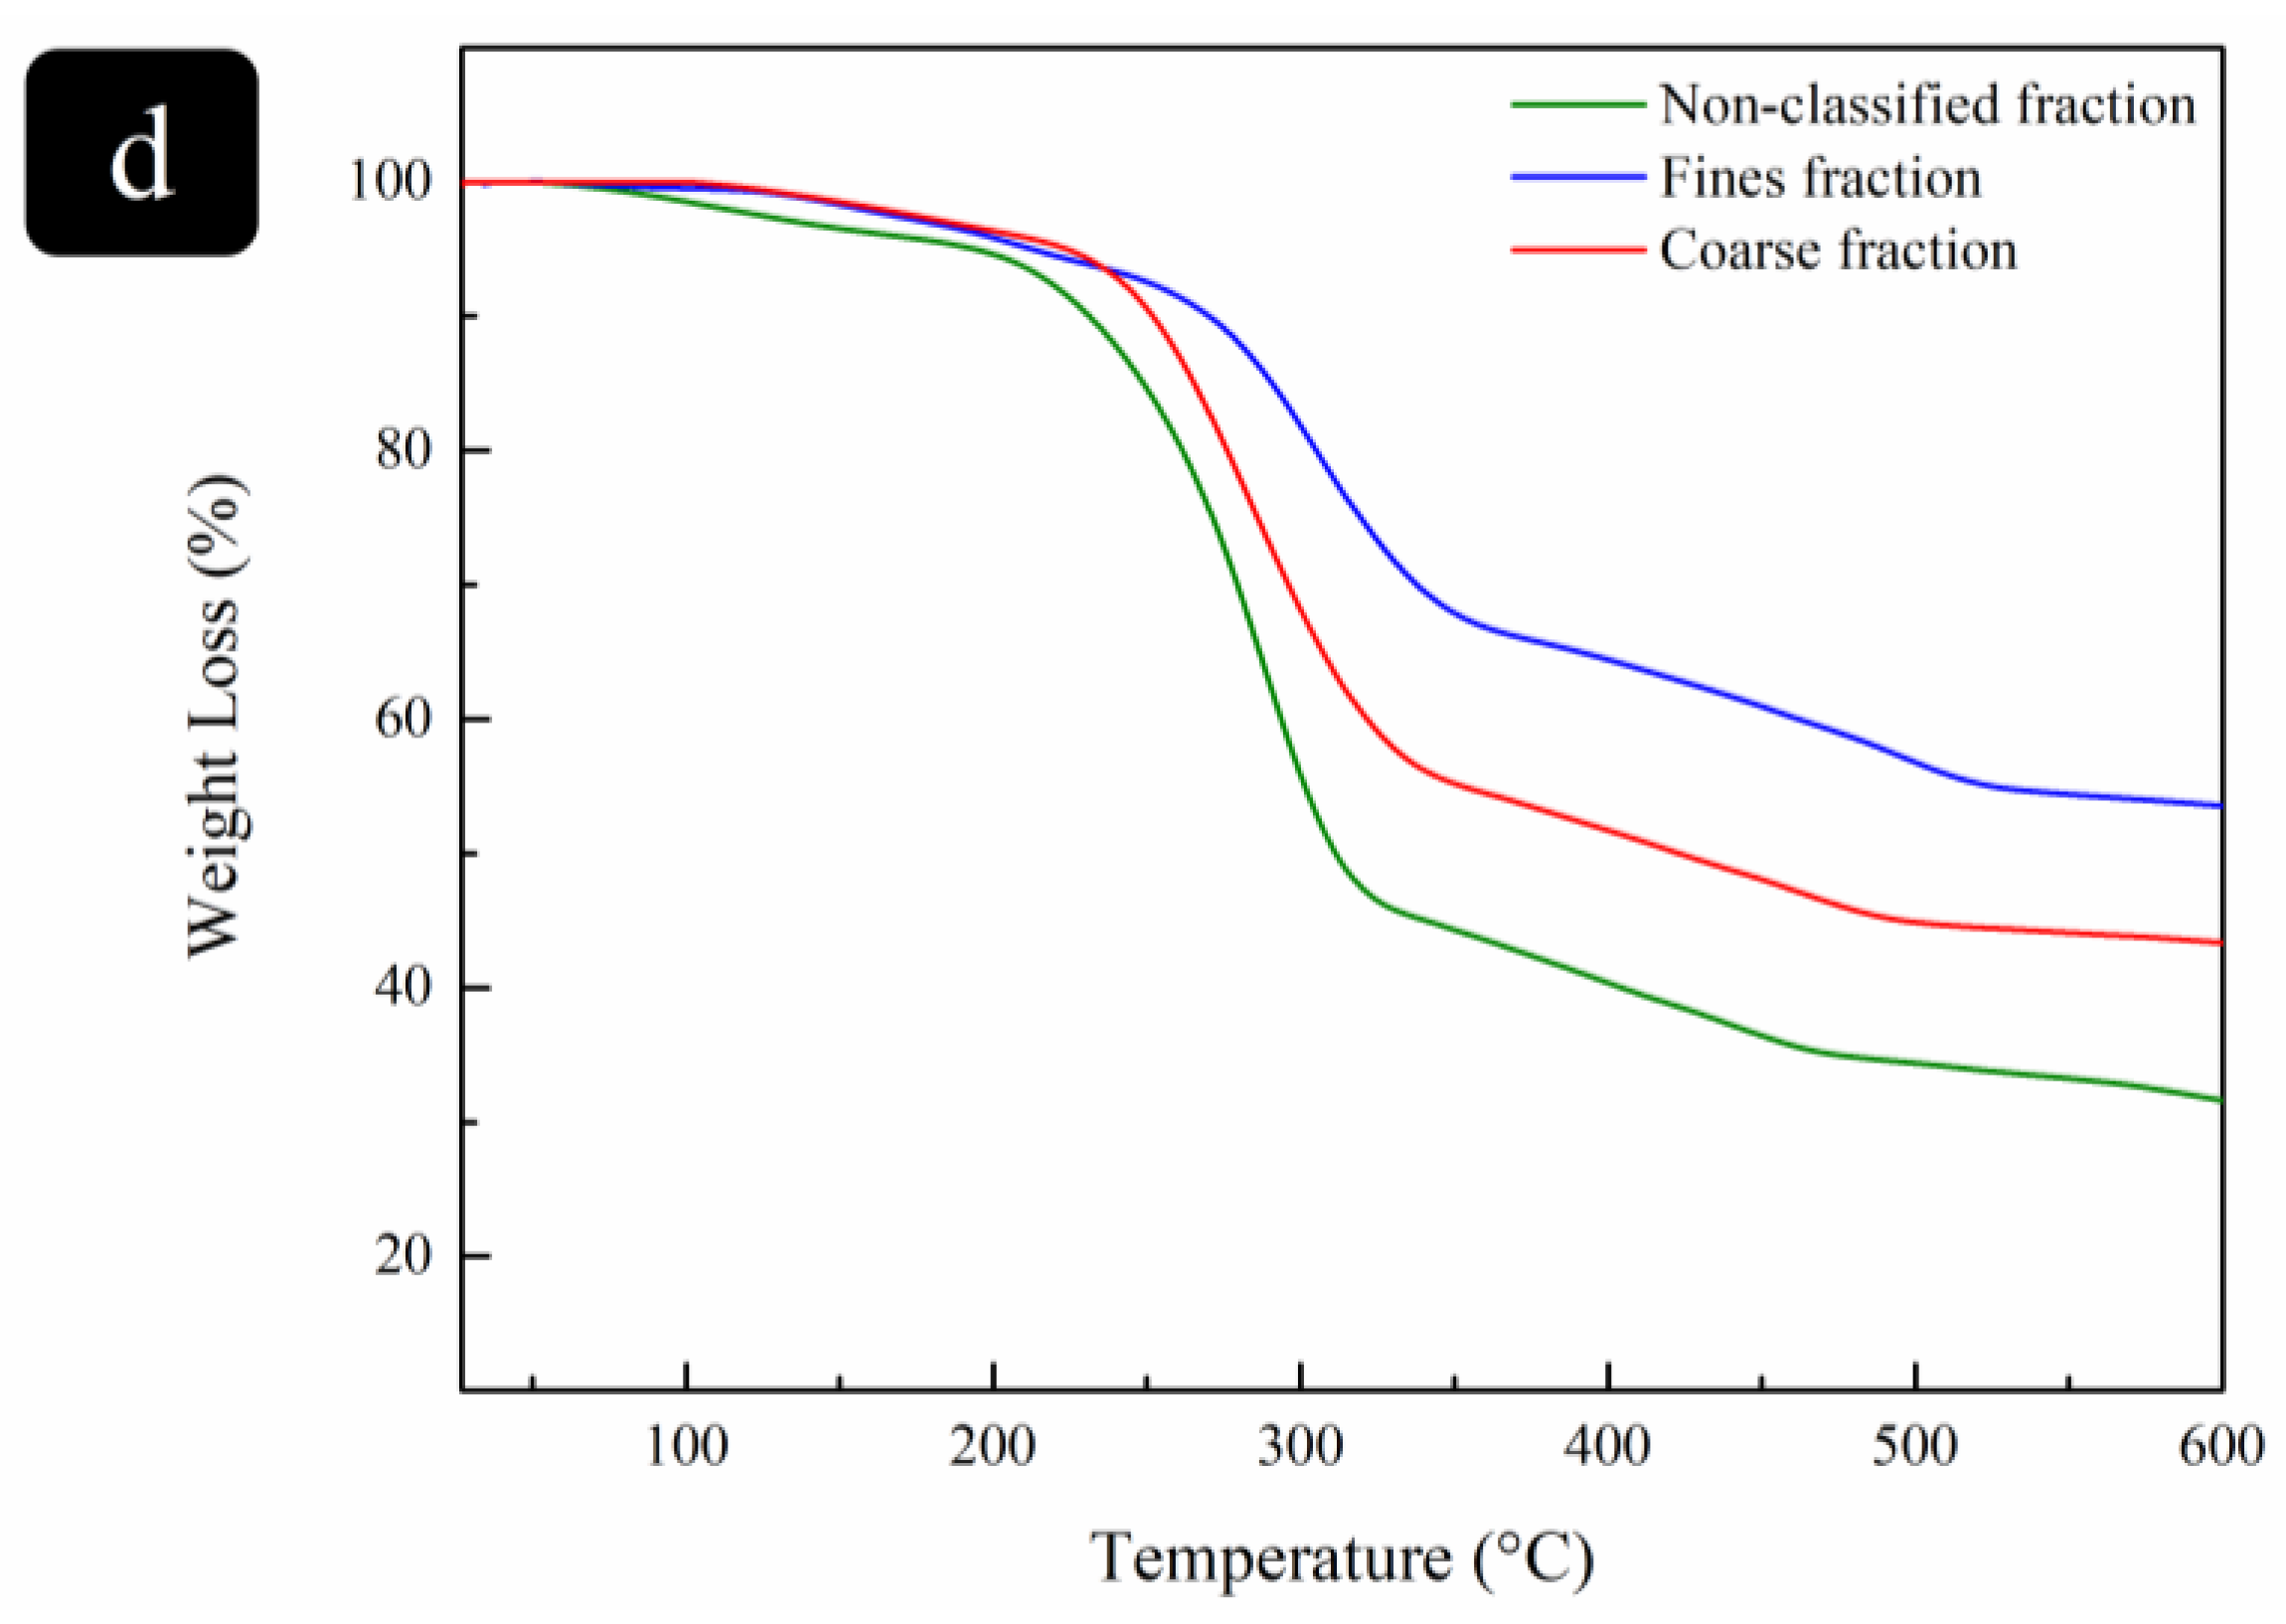
2.3.4. Thermal Stability Analysis

The thermal stability of the solid extracts was evaluated by thermogravimetric analysis (TGA). The analysis was performed in a TA instrument (Labsys EVO; Setaram, Caluire, France) in an argon atmosphere with a temperature increase from 25 to 475 °C and a 10 °C/min heating rate.

3. Results and Discussion

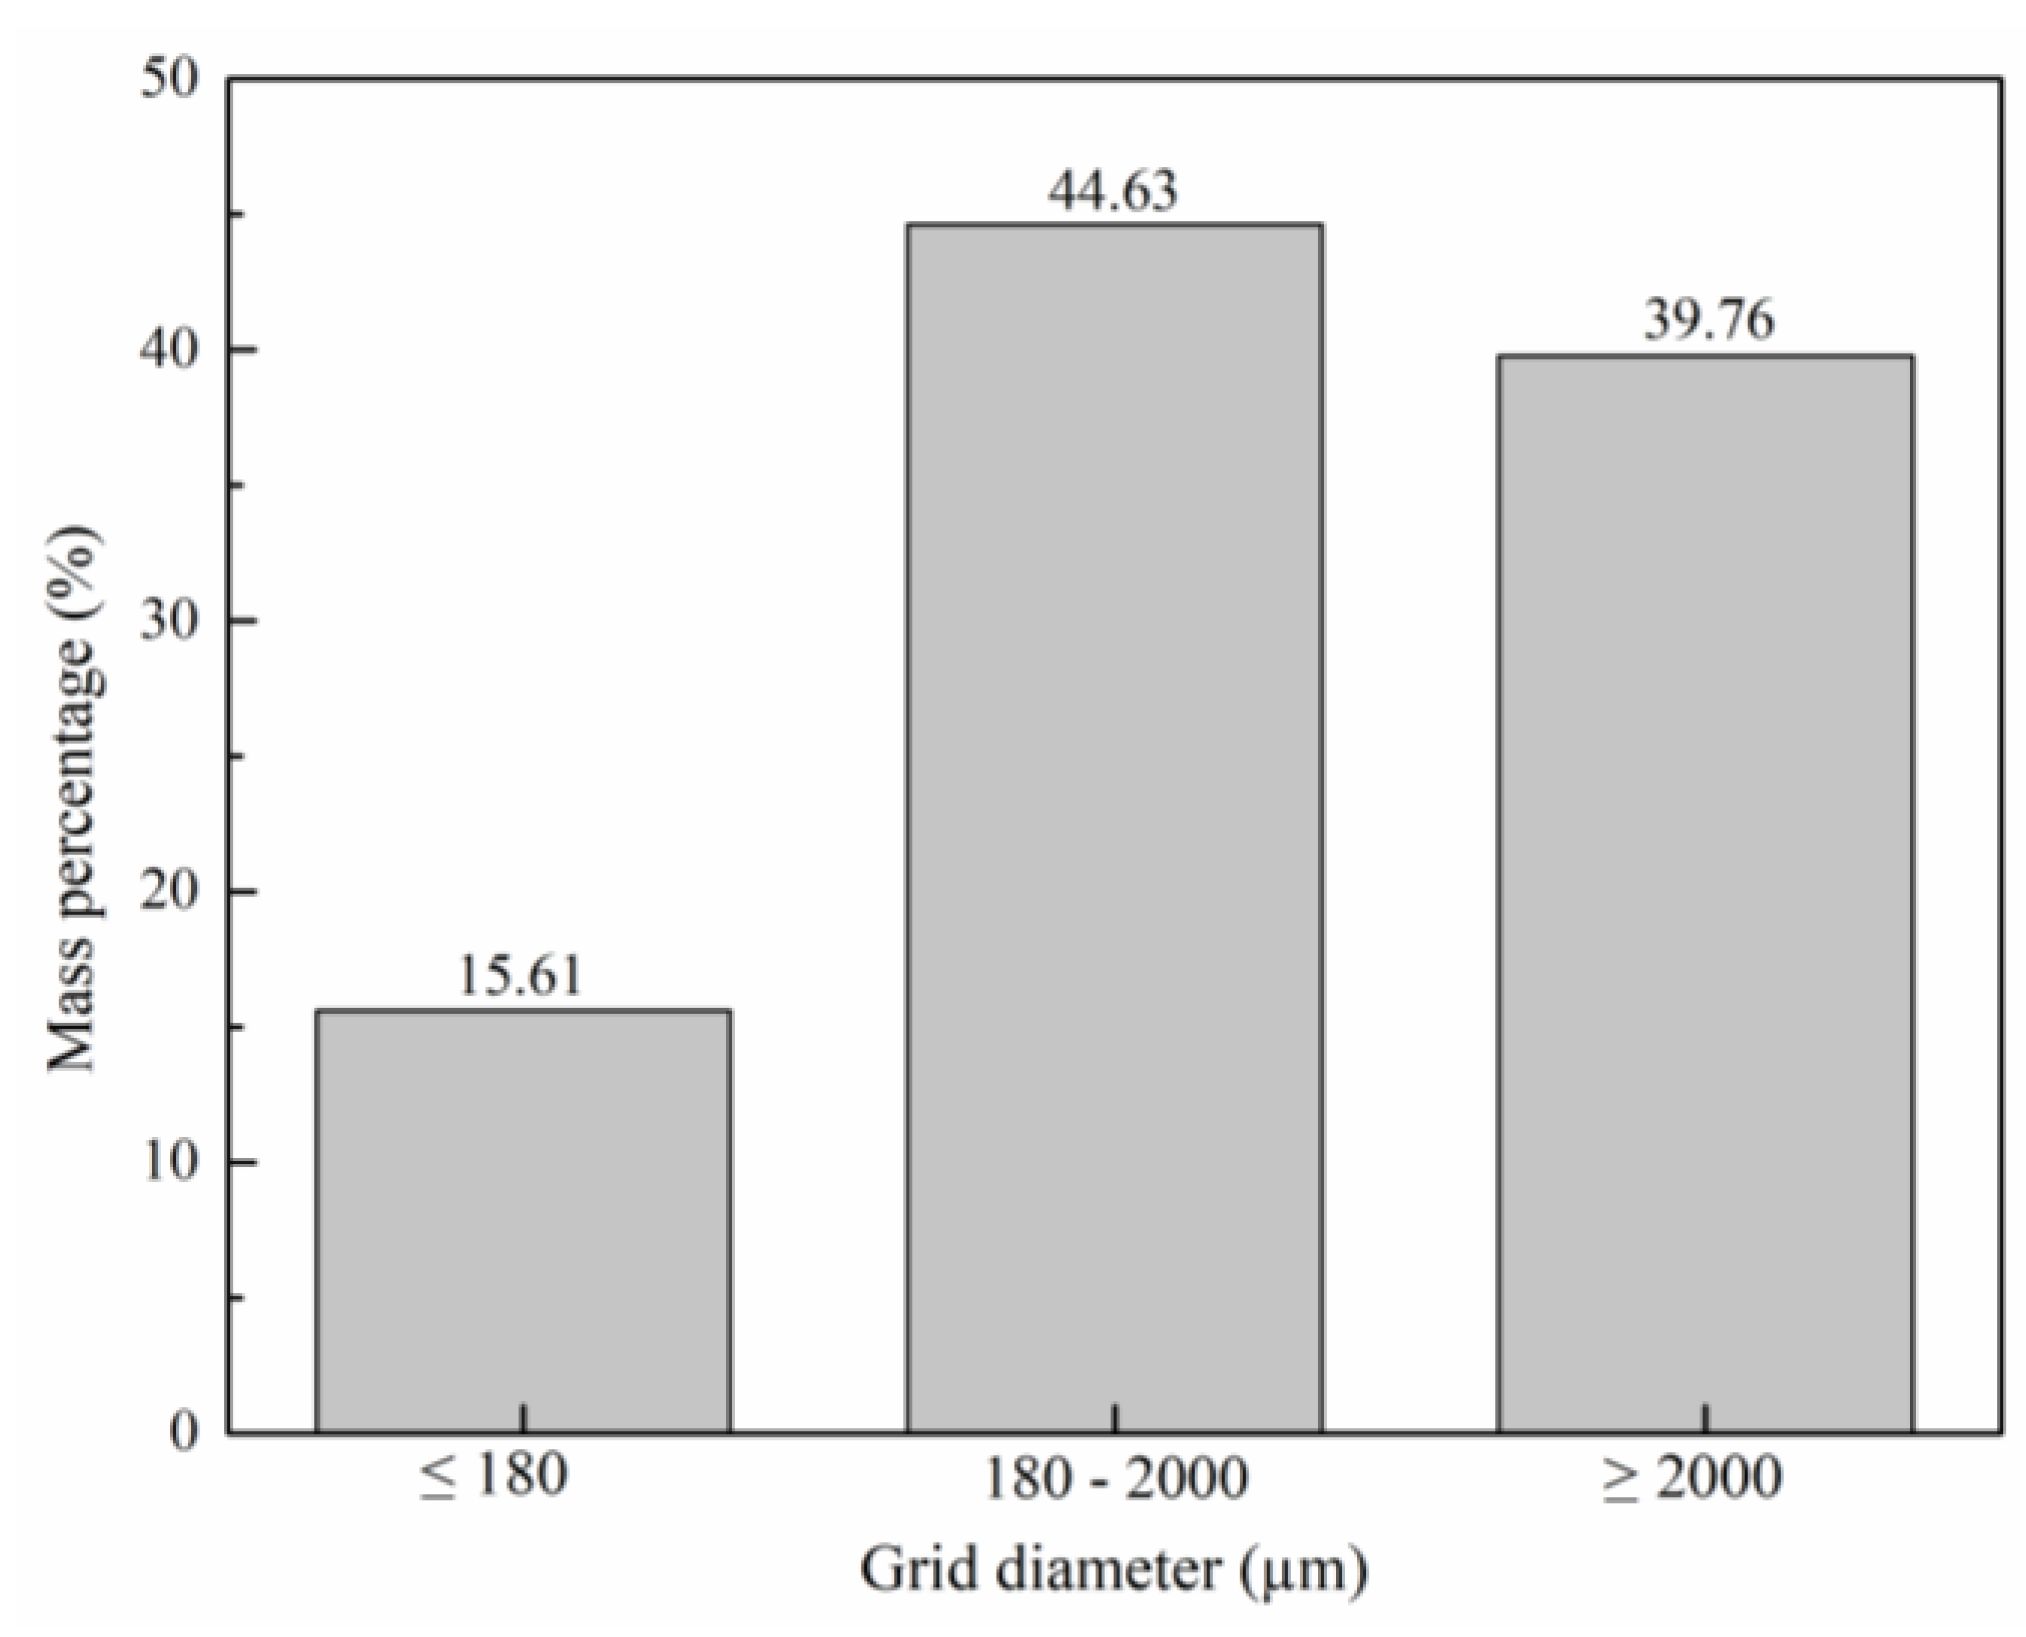
3.1. Biomass Preparation

The particle size distribution obtained after milling and sieving is shown in Figure 2. The three fractions were selected in order to cover relevant situations: a fraction composed of fine particles (sizes less than 180 µm, the smallest size possible with the sieves available), a fraction composed of coarse particles (sizes larger than 2000 µm, the largest size possible with the sieves available), and an intermediate fraction (particle sizes between 180 µm and 2000 µm).
To understand the influence of the biomass particle size on the content and yield of cellulose extraction, three particle samples were selected to be studied: milled but without sieving, denominated the non-classified fraction, ≤180 μm as the fine fraction, and ≥2000 μm as the coarse fraction.

3.2. Extracts Characterization

Initially, to study the influence of the extraction methods on the cellulose content and extraction yield obtained, the fine fraction was selected to perform the three different extraction methods. The results of the final solid extract characterization are presented in Section 3.2.1.

3.2.1. Sugars Quantification

From the analysis of the obtained cellulose content and extraction yield (Table 1), it is possible to notice that the highest values were obtained for the TEMPO-oxidation method: 6.76 × 10⁻² ± 7.76 × 10⁻⁴ mg/g biomass (dried basis) and 25.25 ± 0.08% (dried basis), respectively. These results suggest that the reagents used in the TEMPO-oxidation method are more effective in extracting cellulose.
The enzymatic hydrolysis presented lower cellulose yield values (14.58 ± 0.30% on a dried basis) than the obtained through the TEMPO oxidation (25.25 ± 0.08% on a dried basis). Previous studies reported a cellulose yield of 70.5 ± 2.4% (not dried) using PS as biomass and pectinase as enzyme [18] and a yield of 7.5% (dried basis) using banana peel and xylanase [19]. In these studies, the influence of the enzymes used on the extraction yield obtained is clear, being higher for the enzyme that most effectively extracted cellulose (pectinase). Also, these studies revealed that the chemical composition of the different parts of the banana plant is variable, in which the cellulose extraction yield obtained for the banana peel (7.5%, not dried) was lower than that reported for the PS (70.5 ± 2.4%) [19].
A cellulose extraction yield of 40.2 ± 2–3% (dried basis) was also reported using PS as biomass and the Kurschner–Hoffner approach to determine the cellulose content [11], and 23.8% (dried basis) was reported using PS and the nitrate method [20]. The yield obtained by Meng et al. [20] was similar to that obtained with the TEMPO-oxidation method (25.25 ± 0.08%, dried basis). These results indicate the influence of the extraction method on the cellulose yield obtained [9].
To understand the influence of the particle size and extraction method on the quality of the cellulose obtained, three particle fractions were studied—non-classified (milled but without sieving) and fine (≤180 μm) and coarse (≥2000 μm) fractions—in each of the three extraction methods: alkaline-acid hydrolysis, enzymatic hydrolysis, and TEMPO oxidation. The final solid extracts were characterized, and the obtained results are presented below.

3.2.2. Obtained Extracts

Table 2 presents the images of the final solid extracts obtained. It is possible to observe a darker color in alkaline-acid extracts, associated with the presence of lignin [21]. This colorimetric analysis was supported by the chemical composition analysis of the samples (Section 3.2.3).

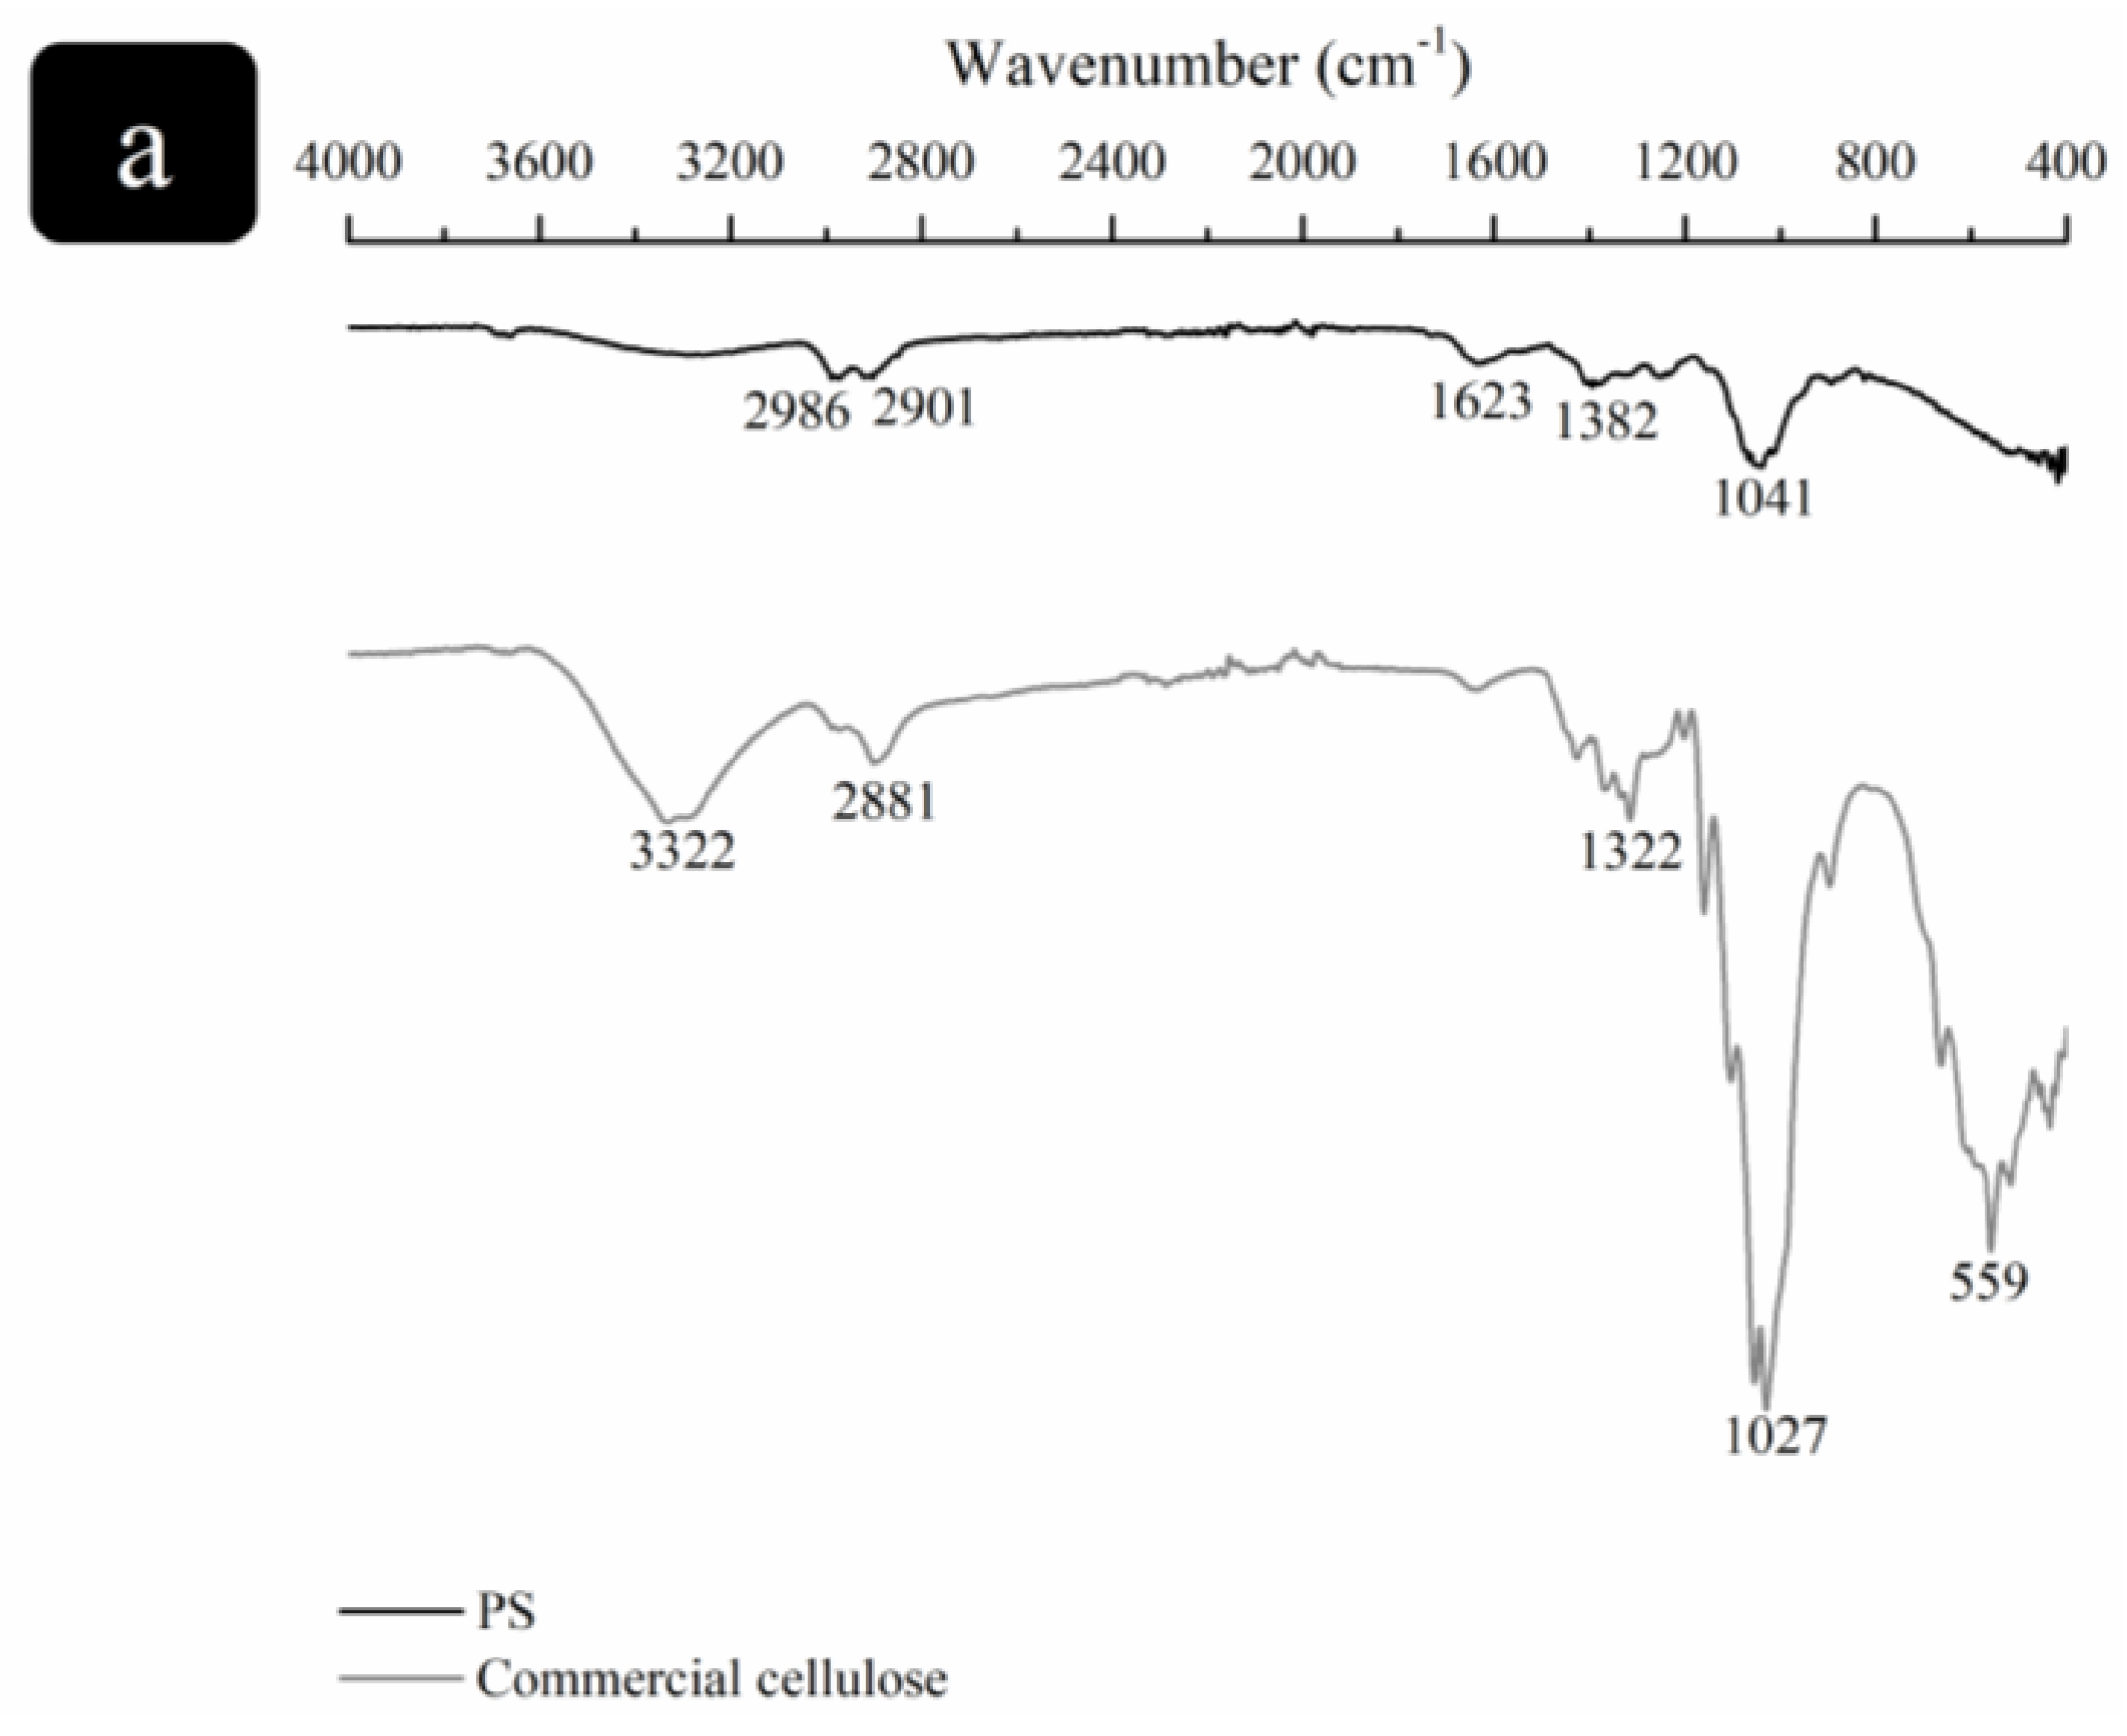
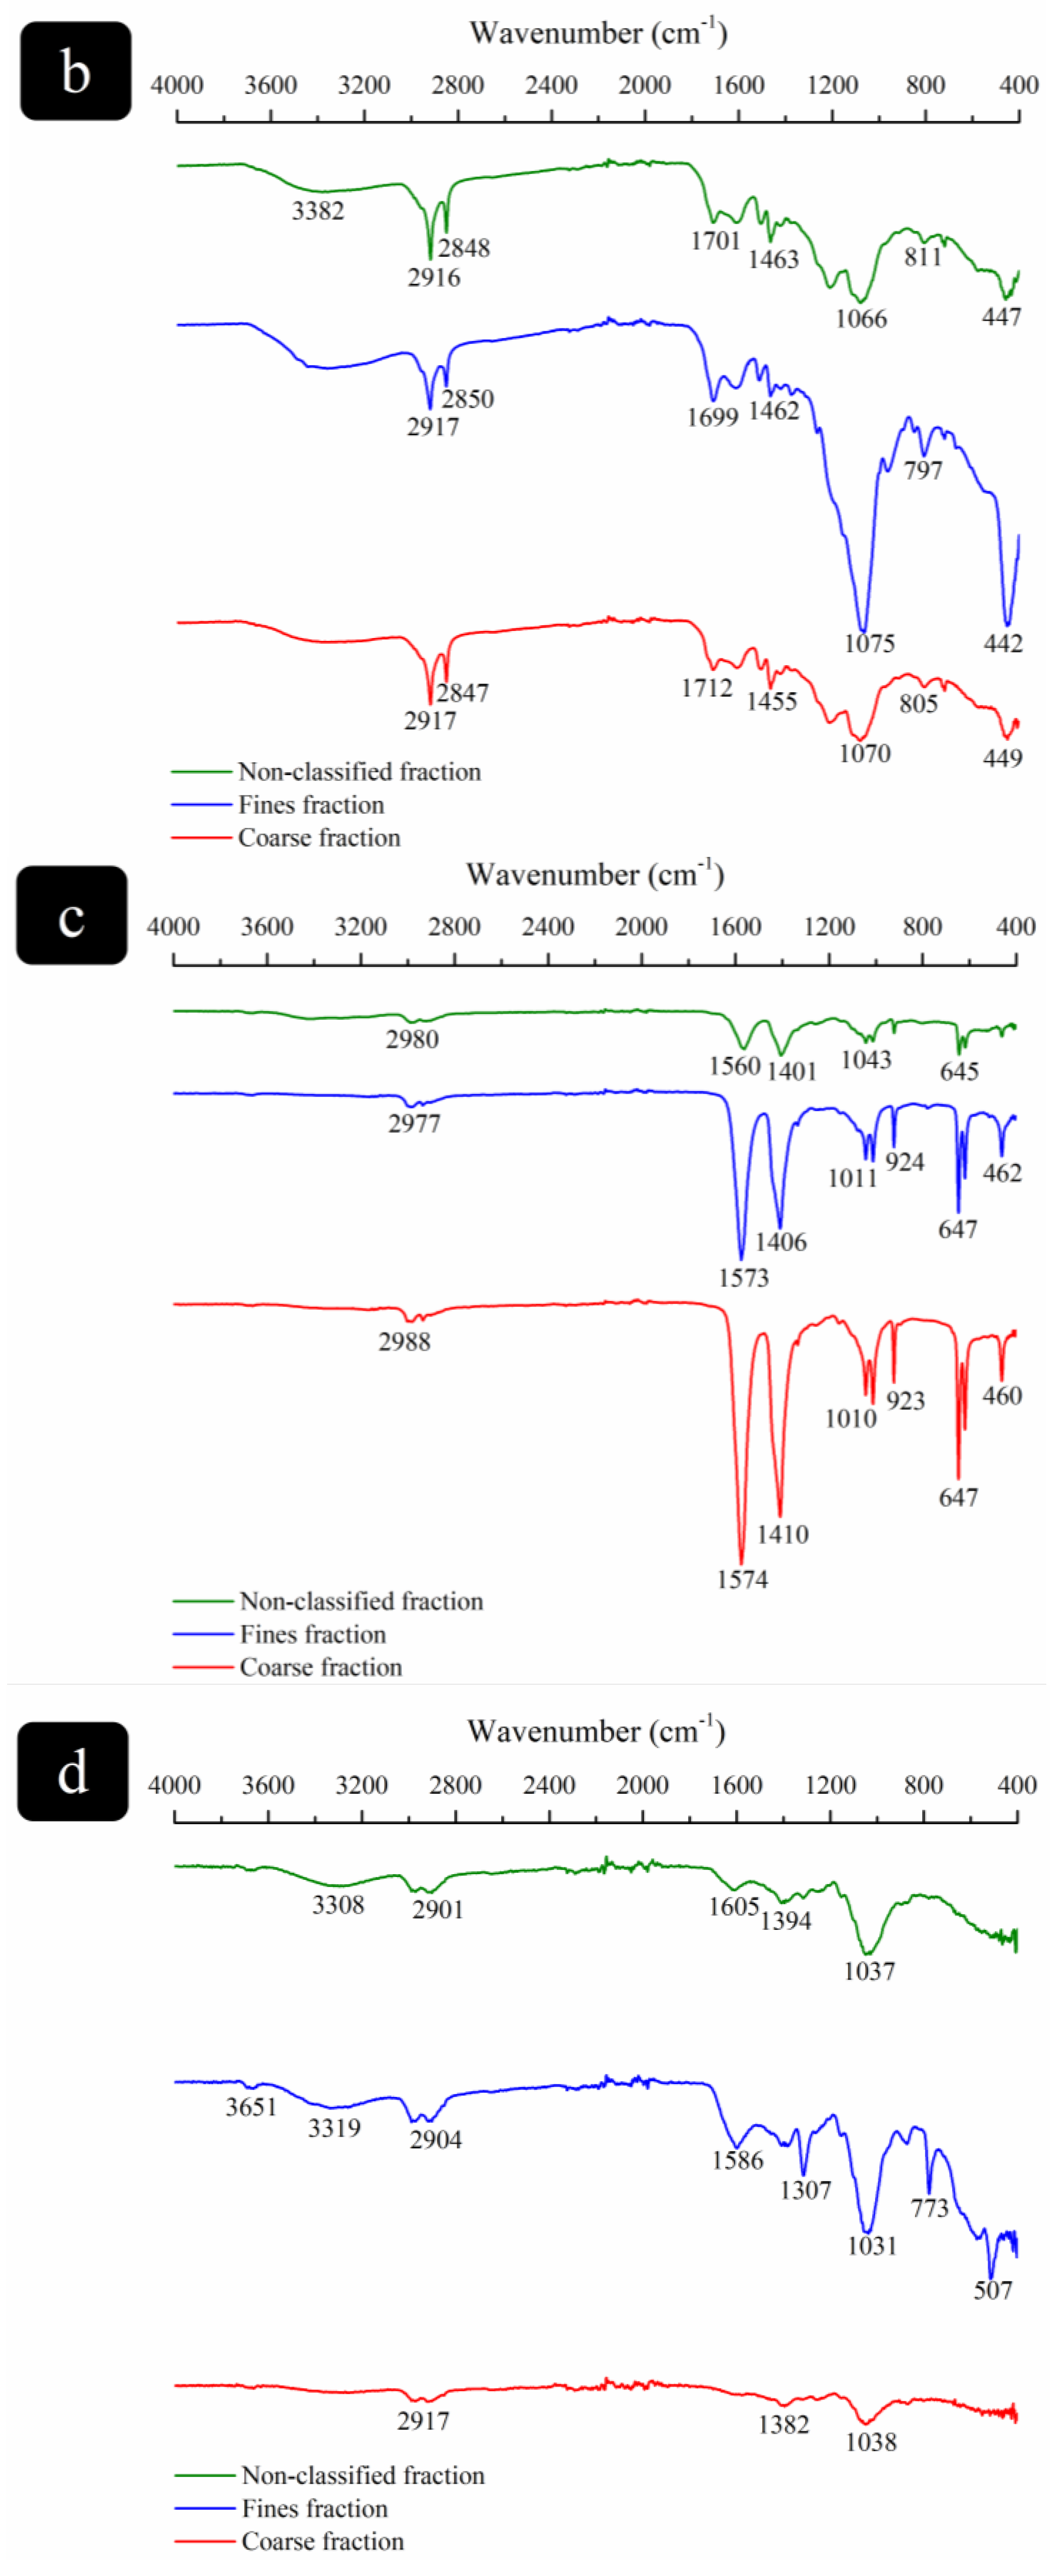
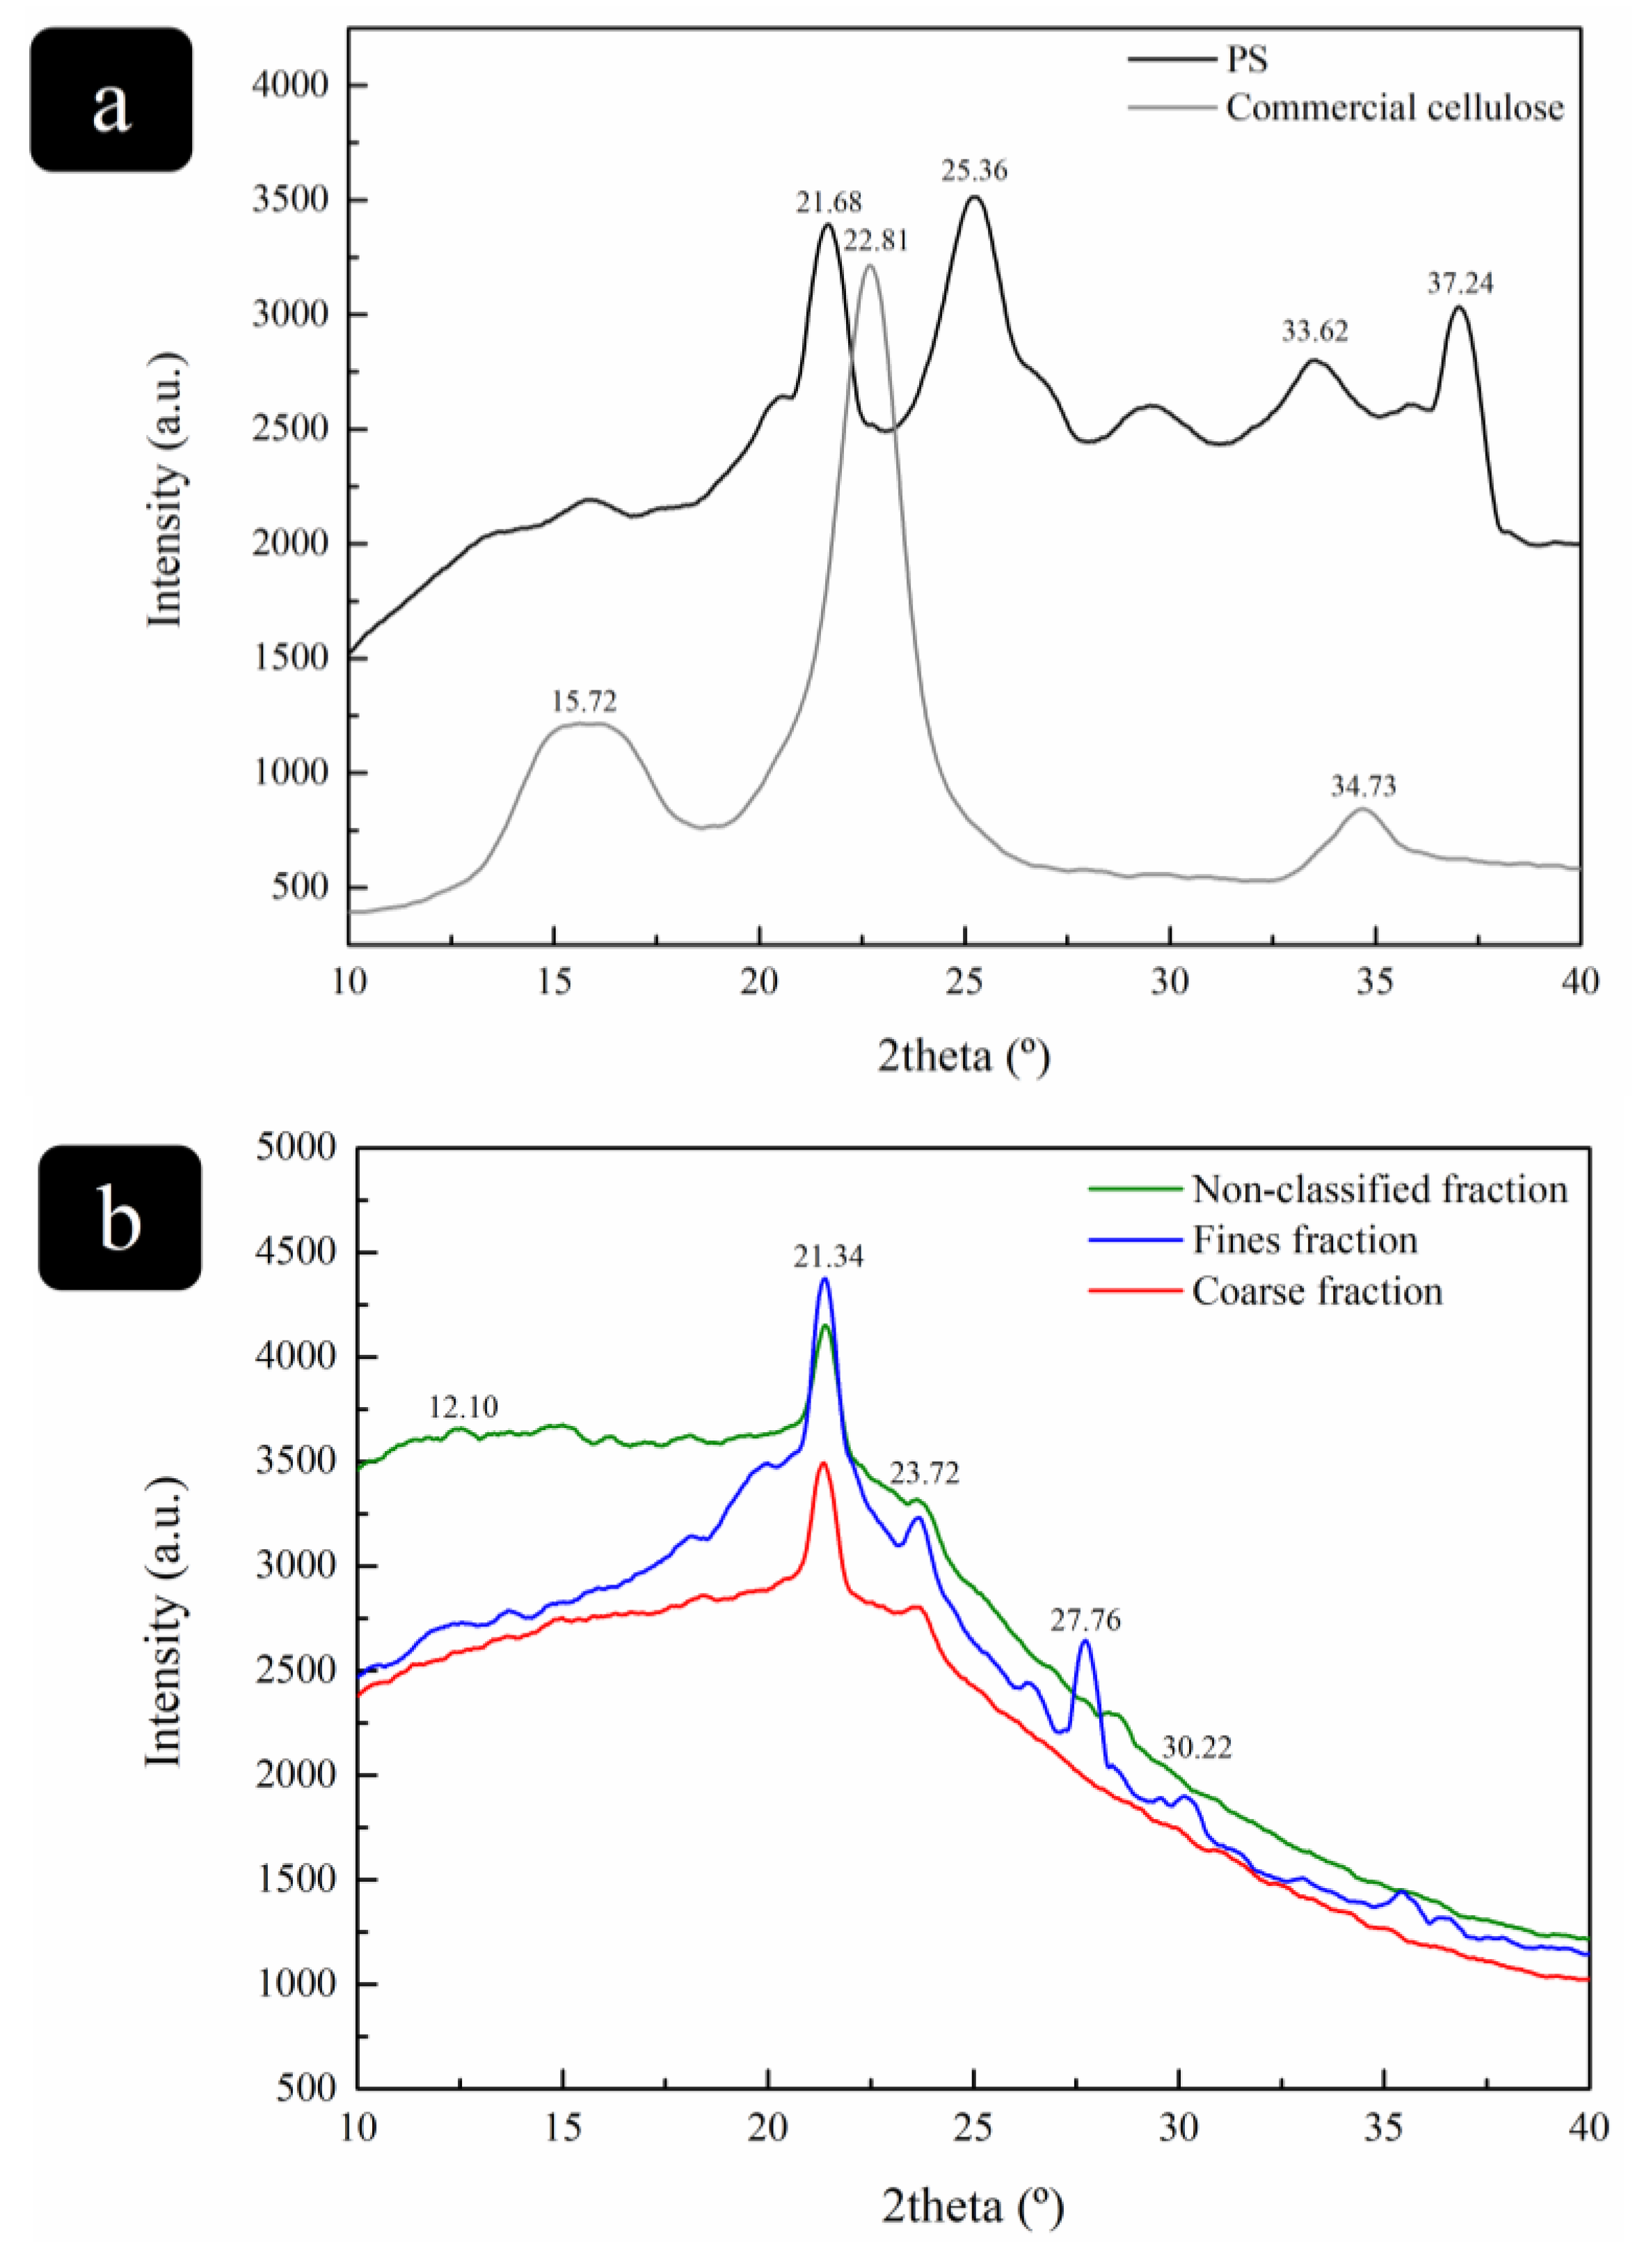
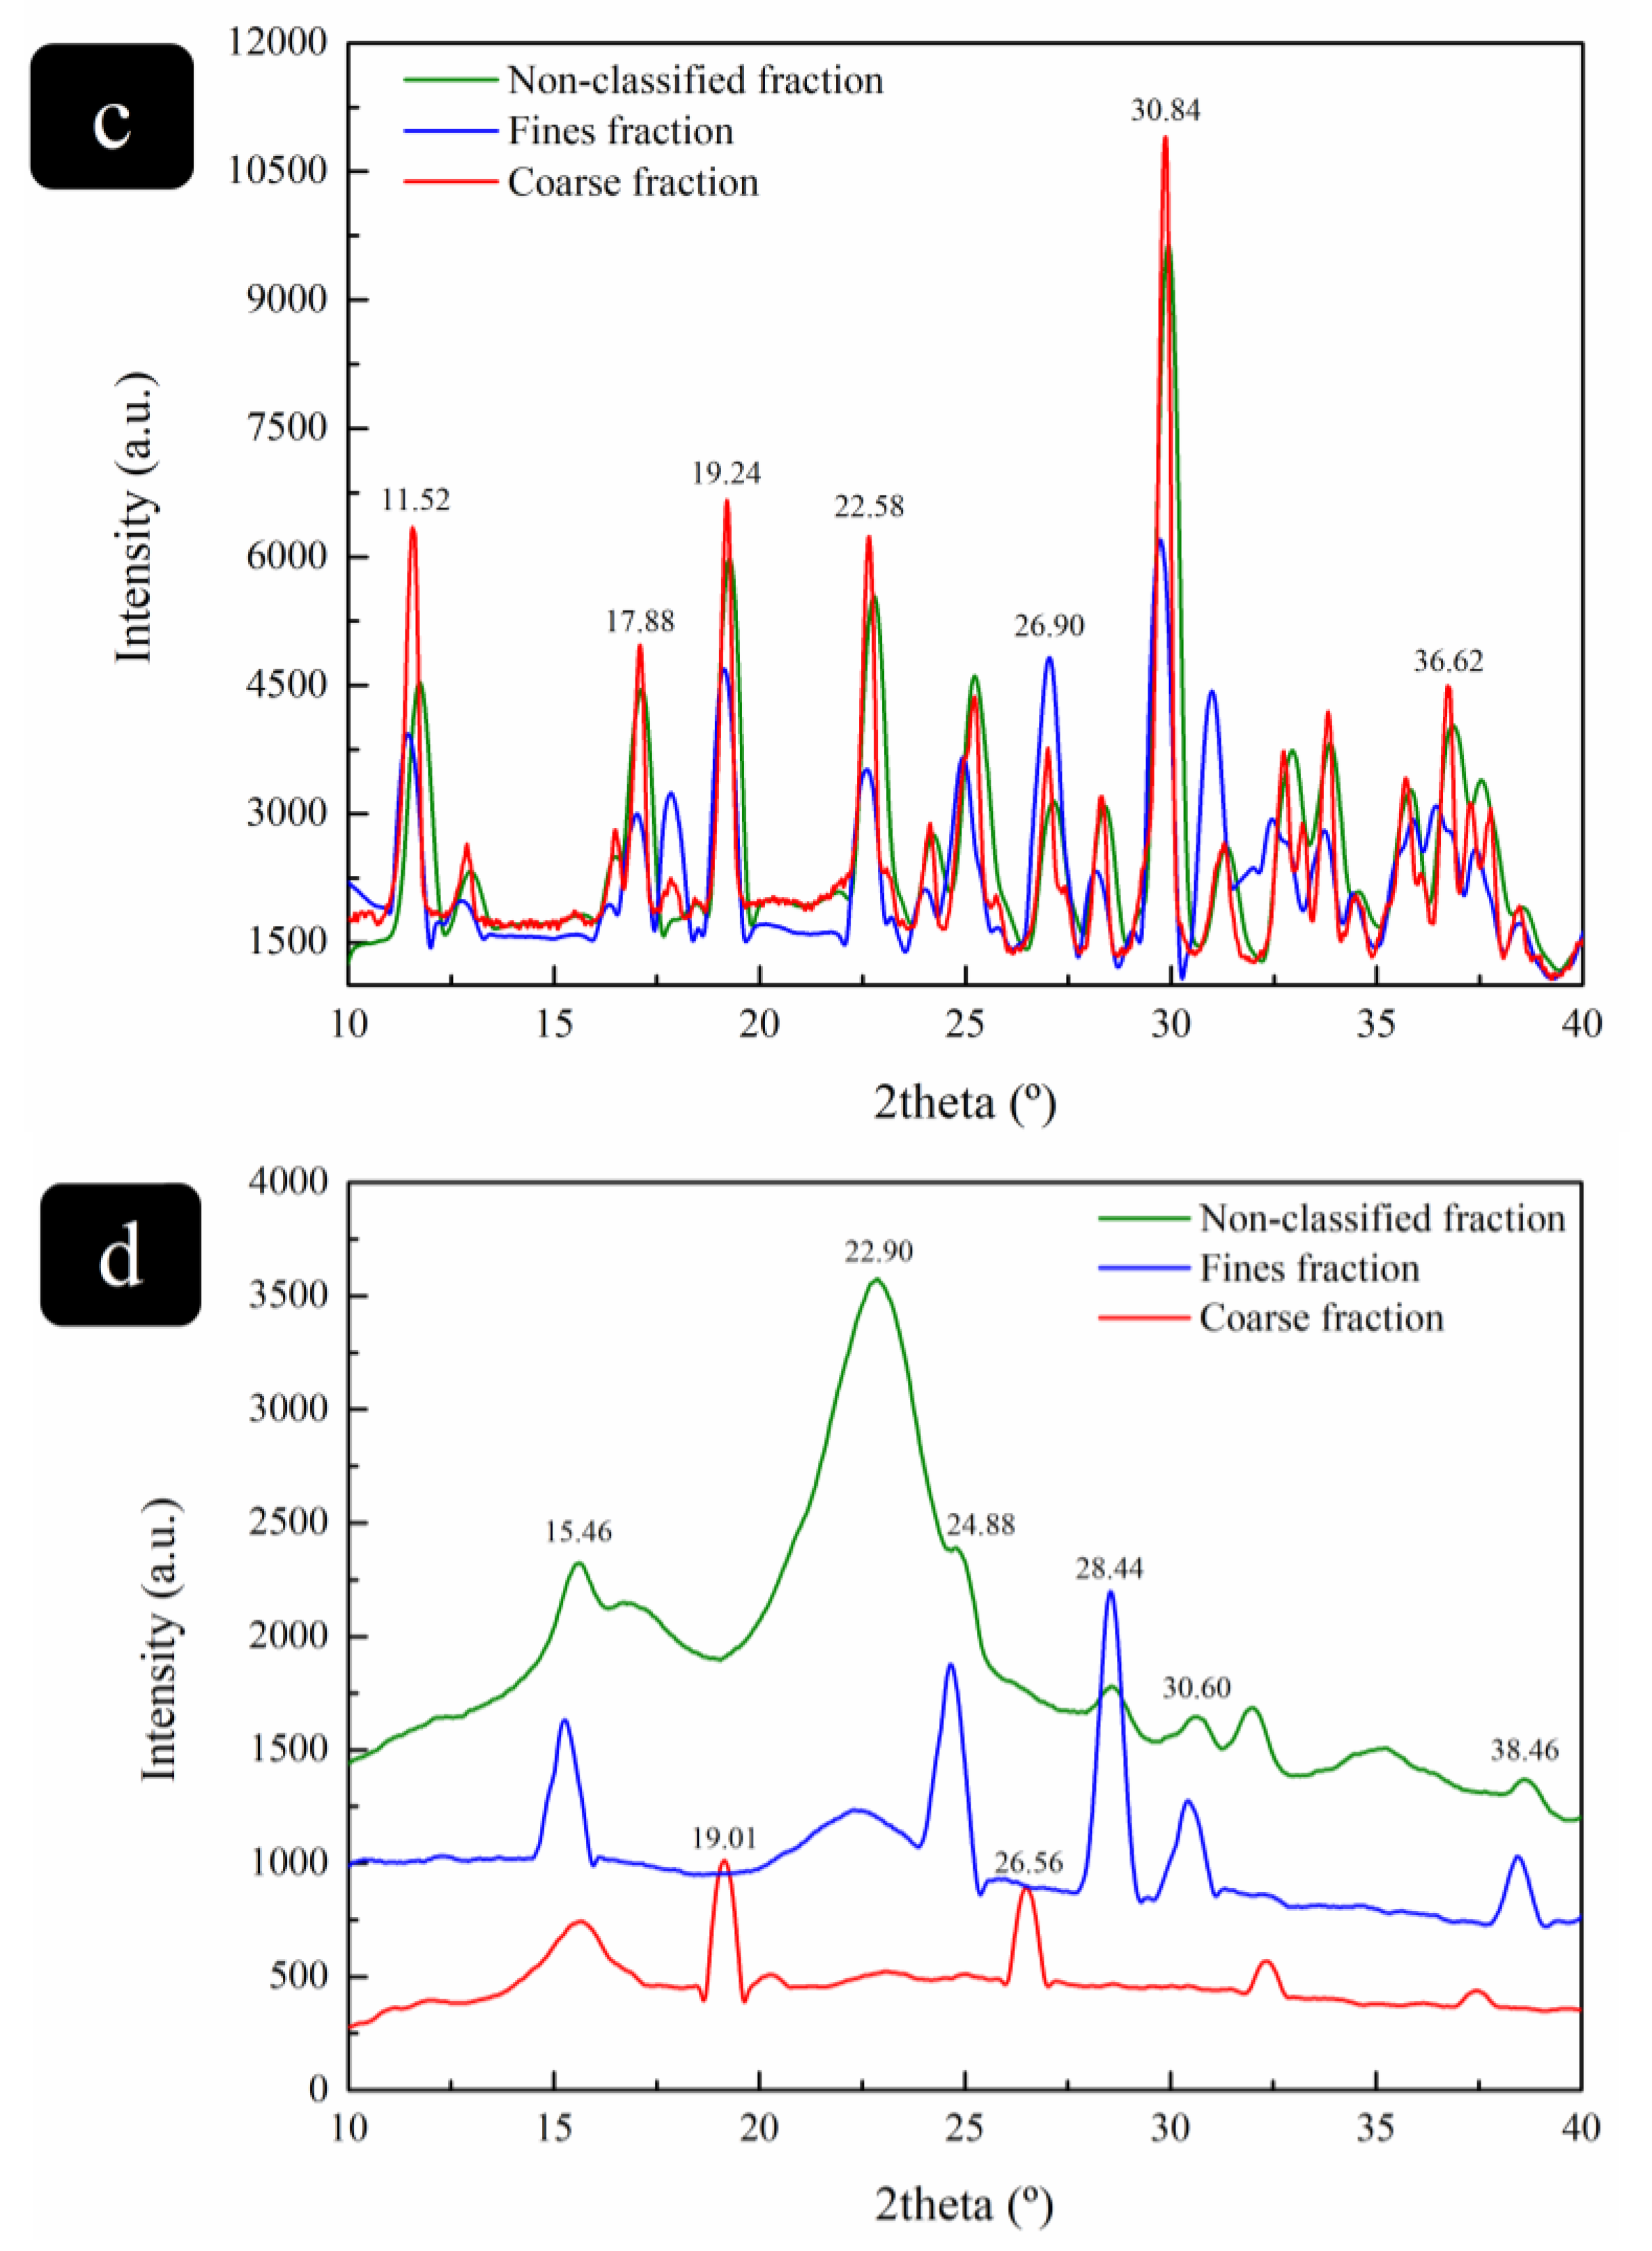
3.2.3. Chemical Composition Determination

Figure 3 shows the FTIR spectra obtained for commercial cellulose, untreated PS, and the final solid extracts obtained by the three extraction methods performed.
All the final solid extracts analyzed showed absorption peaks characteristic of cellulose, around 3300 cm−1, 2900 cm−1, and 1000 cm−1, associated with O–H vibration and interactions between cellulosic chains, asymmetric stretching vibration of aliphatic saturated C–H, and C–O–C stretching in the pyranose ring, respectively, as can be confirmed by the commercial cellulose absorption spectra (Figure 3a) [12]. In general, the highest cellulose band intensities were obtained for the fine fraction.
The TEMPO-oxidation extracts (Figure 3d) presented lower cellulose bands for the coarse fraction than those obtained for the untreated PS (Figure 3a), suggesting the degradation of cellulose during this process caused by the TEMPO reagent strong oxidation [22].
The absorption bands between 1700 and 1500 cm−1 are characteristic of non-cellulosic compounds. The bands around 1700 cm−1 are associated with C=O stretching vibrations in acetyl groups and uronic esters in hemicellulose and with C=O ester linkages between hydroxyl groups and p-coumaric or ferulic carboxylic groups in lignin [23]. Around 1600 cm−1, the band corresponds to the aromatic skeleton C=C stretching of lignin, and around 1500 cm−1, the band corresponds to the aromatic skeletal vibration of lignin polyphenolic groups [24]. The bands around 1630 cm−1 are associated with H–O–H deformation of the absorbed water [12].
In all extraction methods, it was possible to notice some residue of hemicellulose and lignin, more for alkaline-acid hydrolysis (Figure 3b), as confirmed by the dark-brown color presented by the extracts (Table 2, Section 3.2.2), showing that this method was less effective at removing hemicellulose and lignin [21].
All extracts presented two bands at around 1600 and 1400 cm−1, associated with calcium oxalate. This compound is naturally present in more than 200 plant families that accumulate these crystals in their tissues (3–80% of their dry weight) [25]. The enzymatic hydrolysis extracts (Figure 3c) presented higher intensity associated with this compound. The other extraction methods used harsher chemical conditions that led to the removal of most of these crystals. The intense absorption band, obtained for enzymatic hydrolysis extracts, at around 1400 cm−1 is called the crystallin band, demonstrating the high crystallinity of these extracts, attributed not only to the crystalline cellulose but also to calcium oxalate crystals that increase the crystallinity of the samples [26].

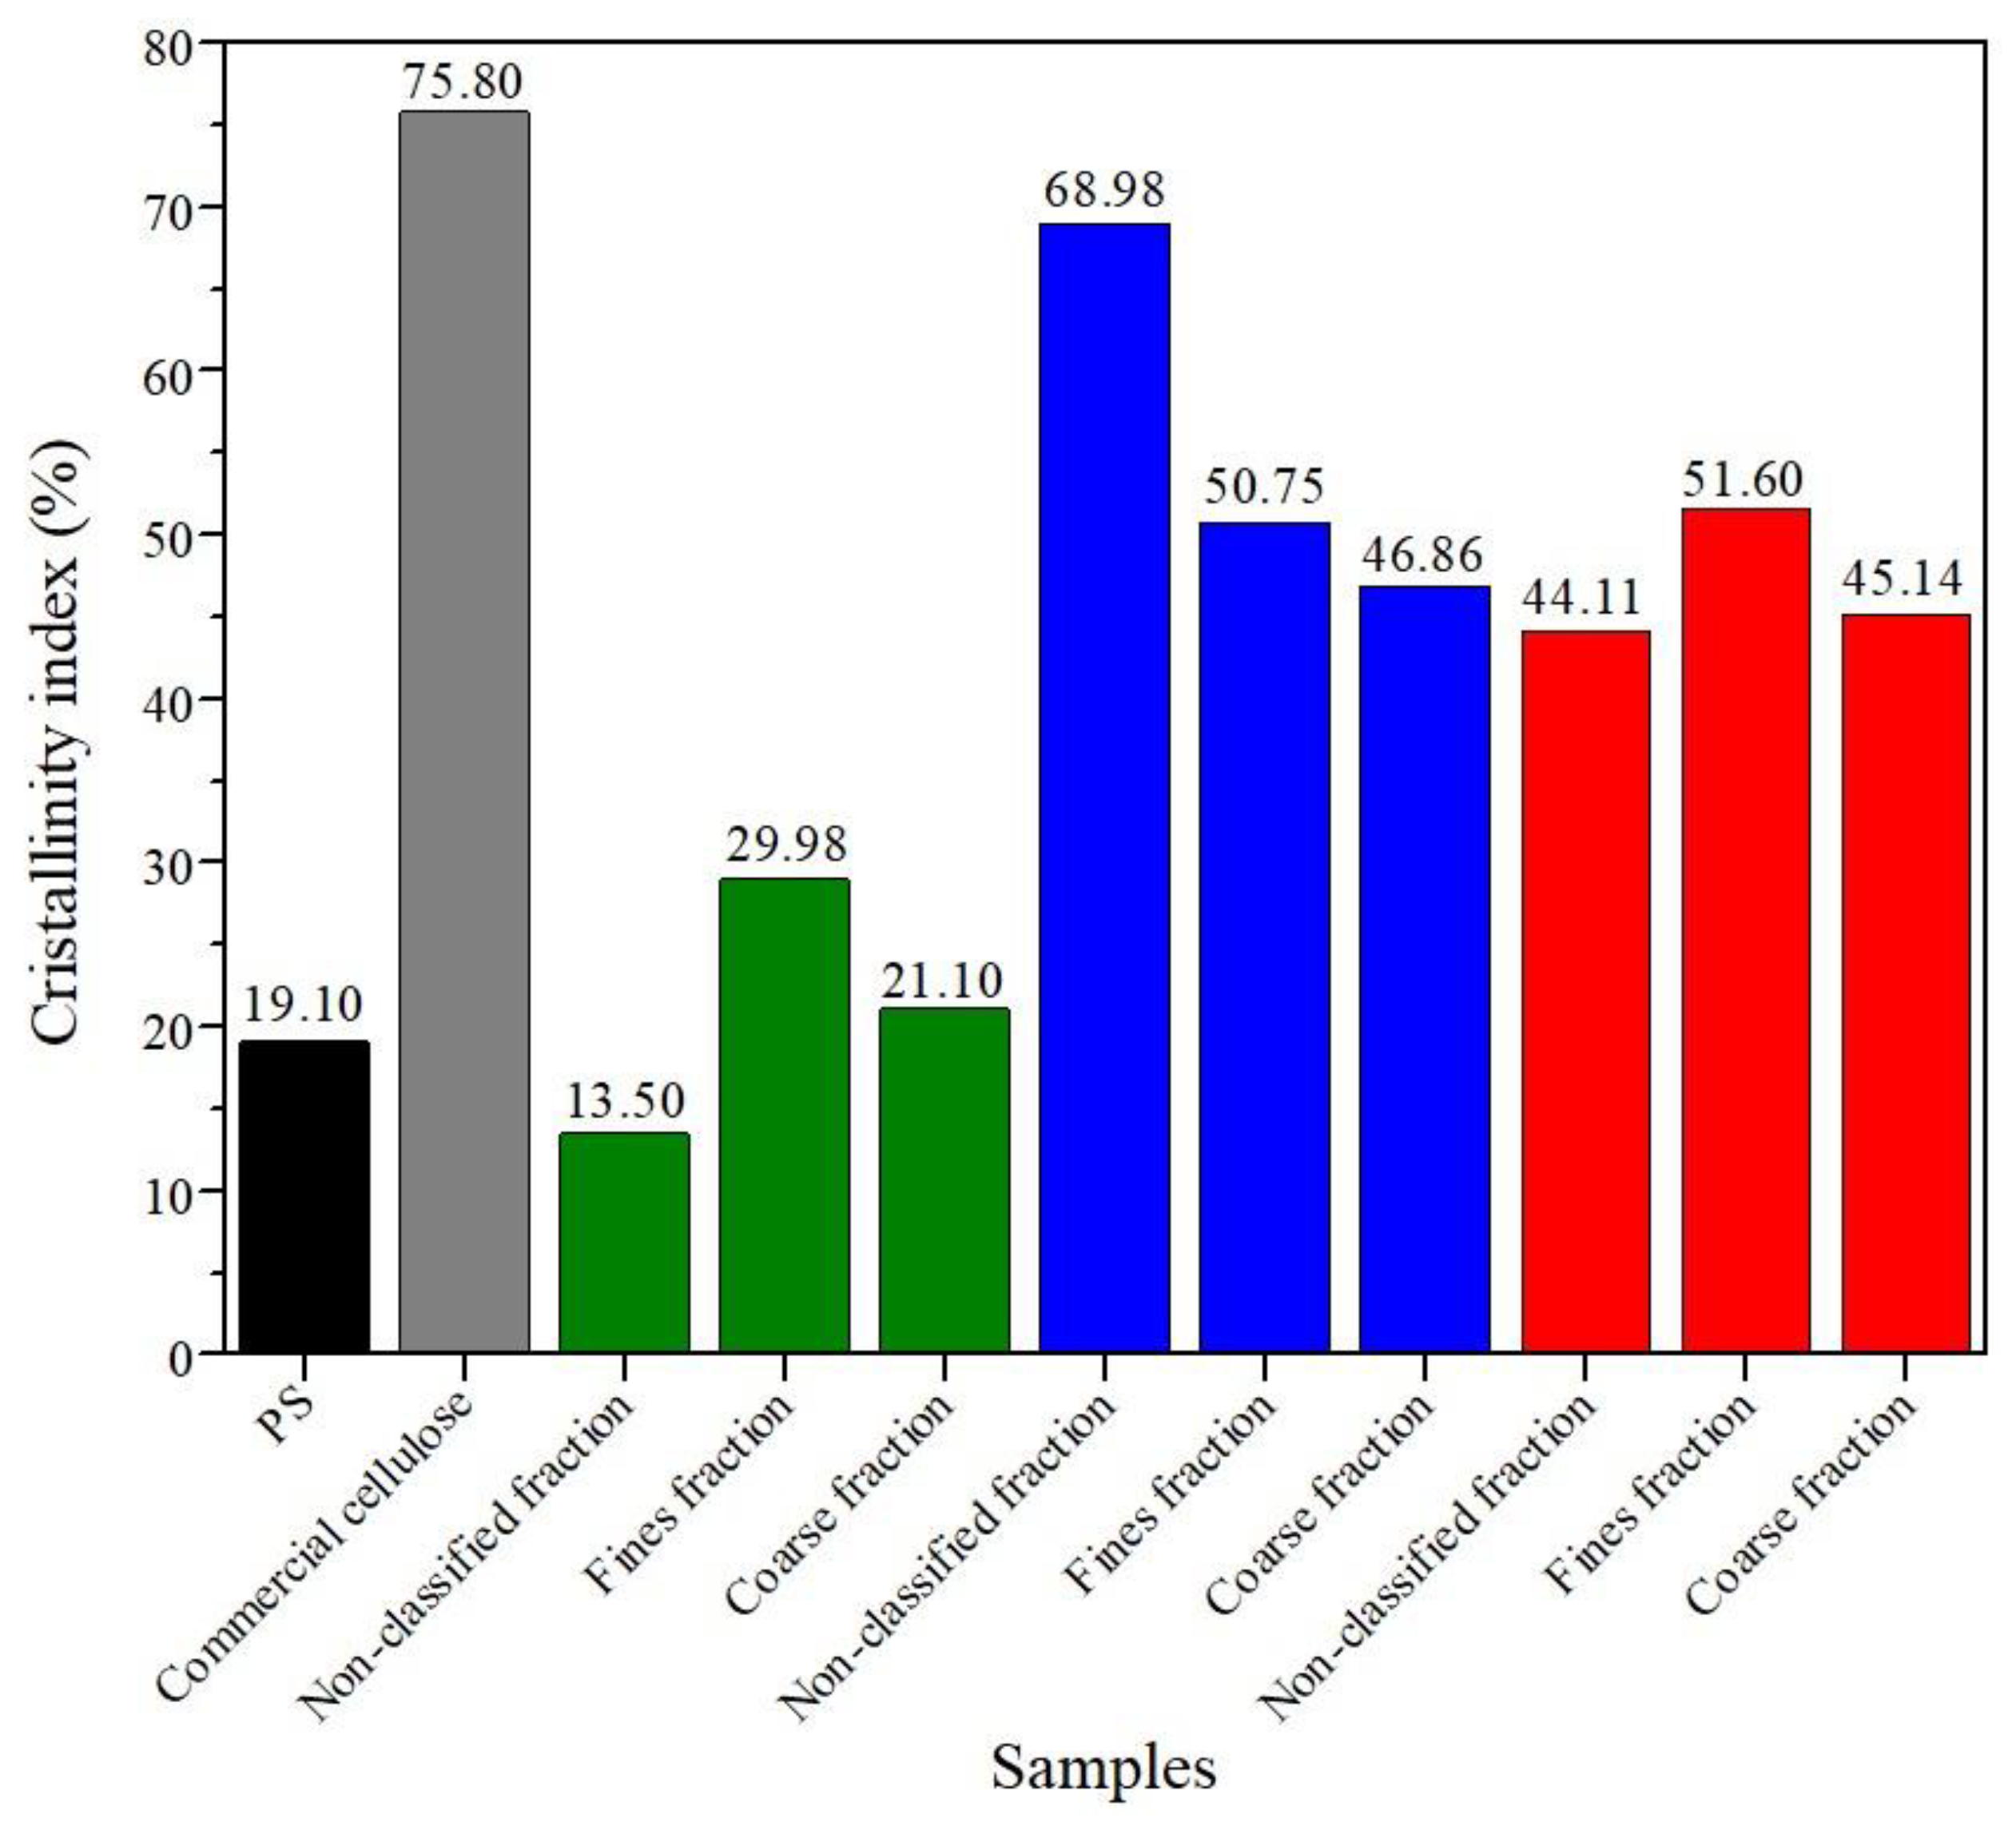
3.2.4. Crystallinity Determination

The influence of the cellulose extraction method and initial PS particle size on the crystalline nature of the extracts obtained was investigated. The obtained diffraction patterns are presented in Figure 4. Comparing the extraction methods tested, it was observed that the TEMPO-oxidation method (Figure 4d) presented peaks with the lowest intensity, proving that cellulose degradation occurs throughout the process, supporting the previous results (Section 3.2.3). The cellulose crystalline structure is formed by hydrogen bonds and Van der Waals forces between adjacent molecules [20]. In this case, the TEMPO reagent might have oxidized the cellulose structure, consuming hydrogen bonds, which not only modified the cellulose’s surface chemical groups but also changed its crystalline three-dimensional network [20].
There are four different types of cellulose polymorphs: I, II, III, and IV. Type I occurs naturally in nature; type II occurs from changes in the crystalline structure of type I; type III occurs from the treatment of cellulose I or II with amines; and type IV occurs after the treatment of cellulose type III with glycerol at high temperatures. Celluloses I and II are crystalline, while III and IV are mainly amorphous [27].
The alkaline-acid hydrolysis (Figure 4b) presented cellulose type I main peaks at around 2θ = 16° and 21°, associated with the (101) and (110) planes, respectively [28,29]. Also, it showed a wide peak at around 12°, related to the amorphous compounds still present in the final samples—water soluble, pectins, hemicellulose, and lignin—as observed in the previous results (Section 3.2.3). The enzymatic hydrolysis (Figure 4c) showed the narrowest and sharpest peaks, proving that these samples were the ones with the highest crystallinity. In this case, the reagents used (enzymatic cocktail with cellulase) successfully removed the amorphous compounds present in PS, resulting in a crystallinity increase [30]. Also, the presence of a mixture of cellulose polymorphs was observed, not only cellulose type I but also cellulose type II typical peaks. Cellulose II peaks are present at around 2θ = 12°, 20°, and 21°, associated with the (110), (110), and (200) planes, respectively [31].
In the enzymatic hydrolysis, it was possible to identify three peaks that are attributed to calcium oxalate crystals: 15°, 24°, and 30°. The most intense peak, at 30°, is associated with the plane (2, 0, −2) of calcium oxalate. This result is in accordance with the chemical composition determination (Section 3.2.3) [25].
Regarding the crystallinity index (Figure 5), the highest value was obtained for the enzymatic hydrolysis method with the non-classified fraction. Since the alkaline-acid samples presented a higher content of amorphous compounds than TEMPO, it resulted in a crystalline index for TEMPO samples higher than for alkaline-acid. These results indicate that the enzymatic hydrolysis reagents were the most effective at removing the cellulose amorphous regions by cleaving its glycosidic bounds and consequently removing the amorphous compounds, increasing the accessibility within the crystalline cellulose [20]. The presence of calcium oxalate crystals also contributes to the increase in the crystallinity index.
Faradilla et al. [16] reported a crystallinity index of 66% for cellulose extracted from PS using TEMPO-mediated oxidation with an initial particle size of 2000 μm, and Shrestha et al. [32] reported a crystallinity index of 81.67% for an initial particle size < 180 μm via alkaline-acid hydrolysis. These results differ from those obtained in this study because of the difference in the extraction methods performed and the PS particle sizes used [9].

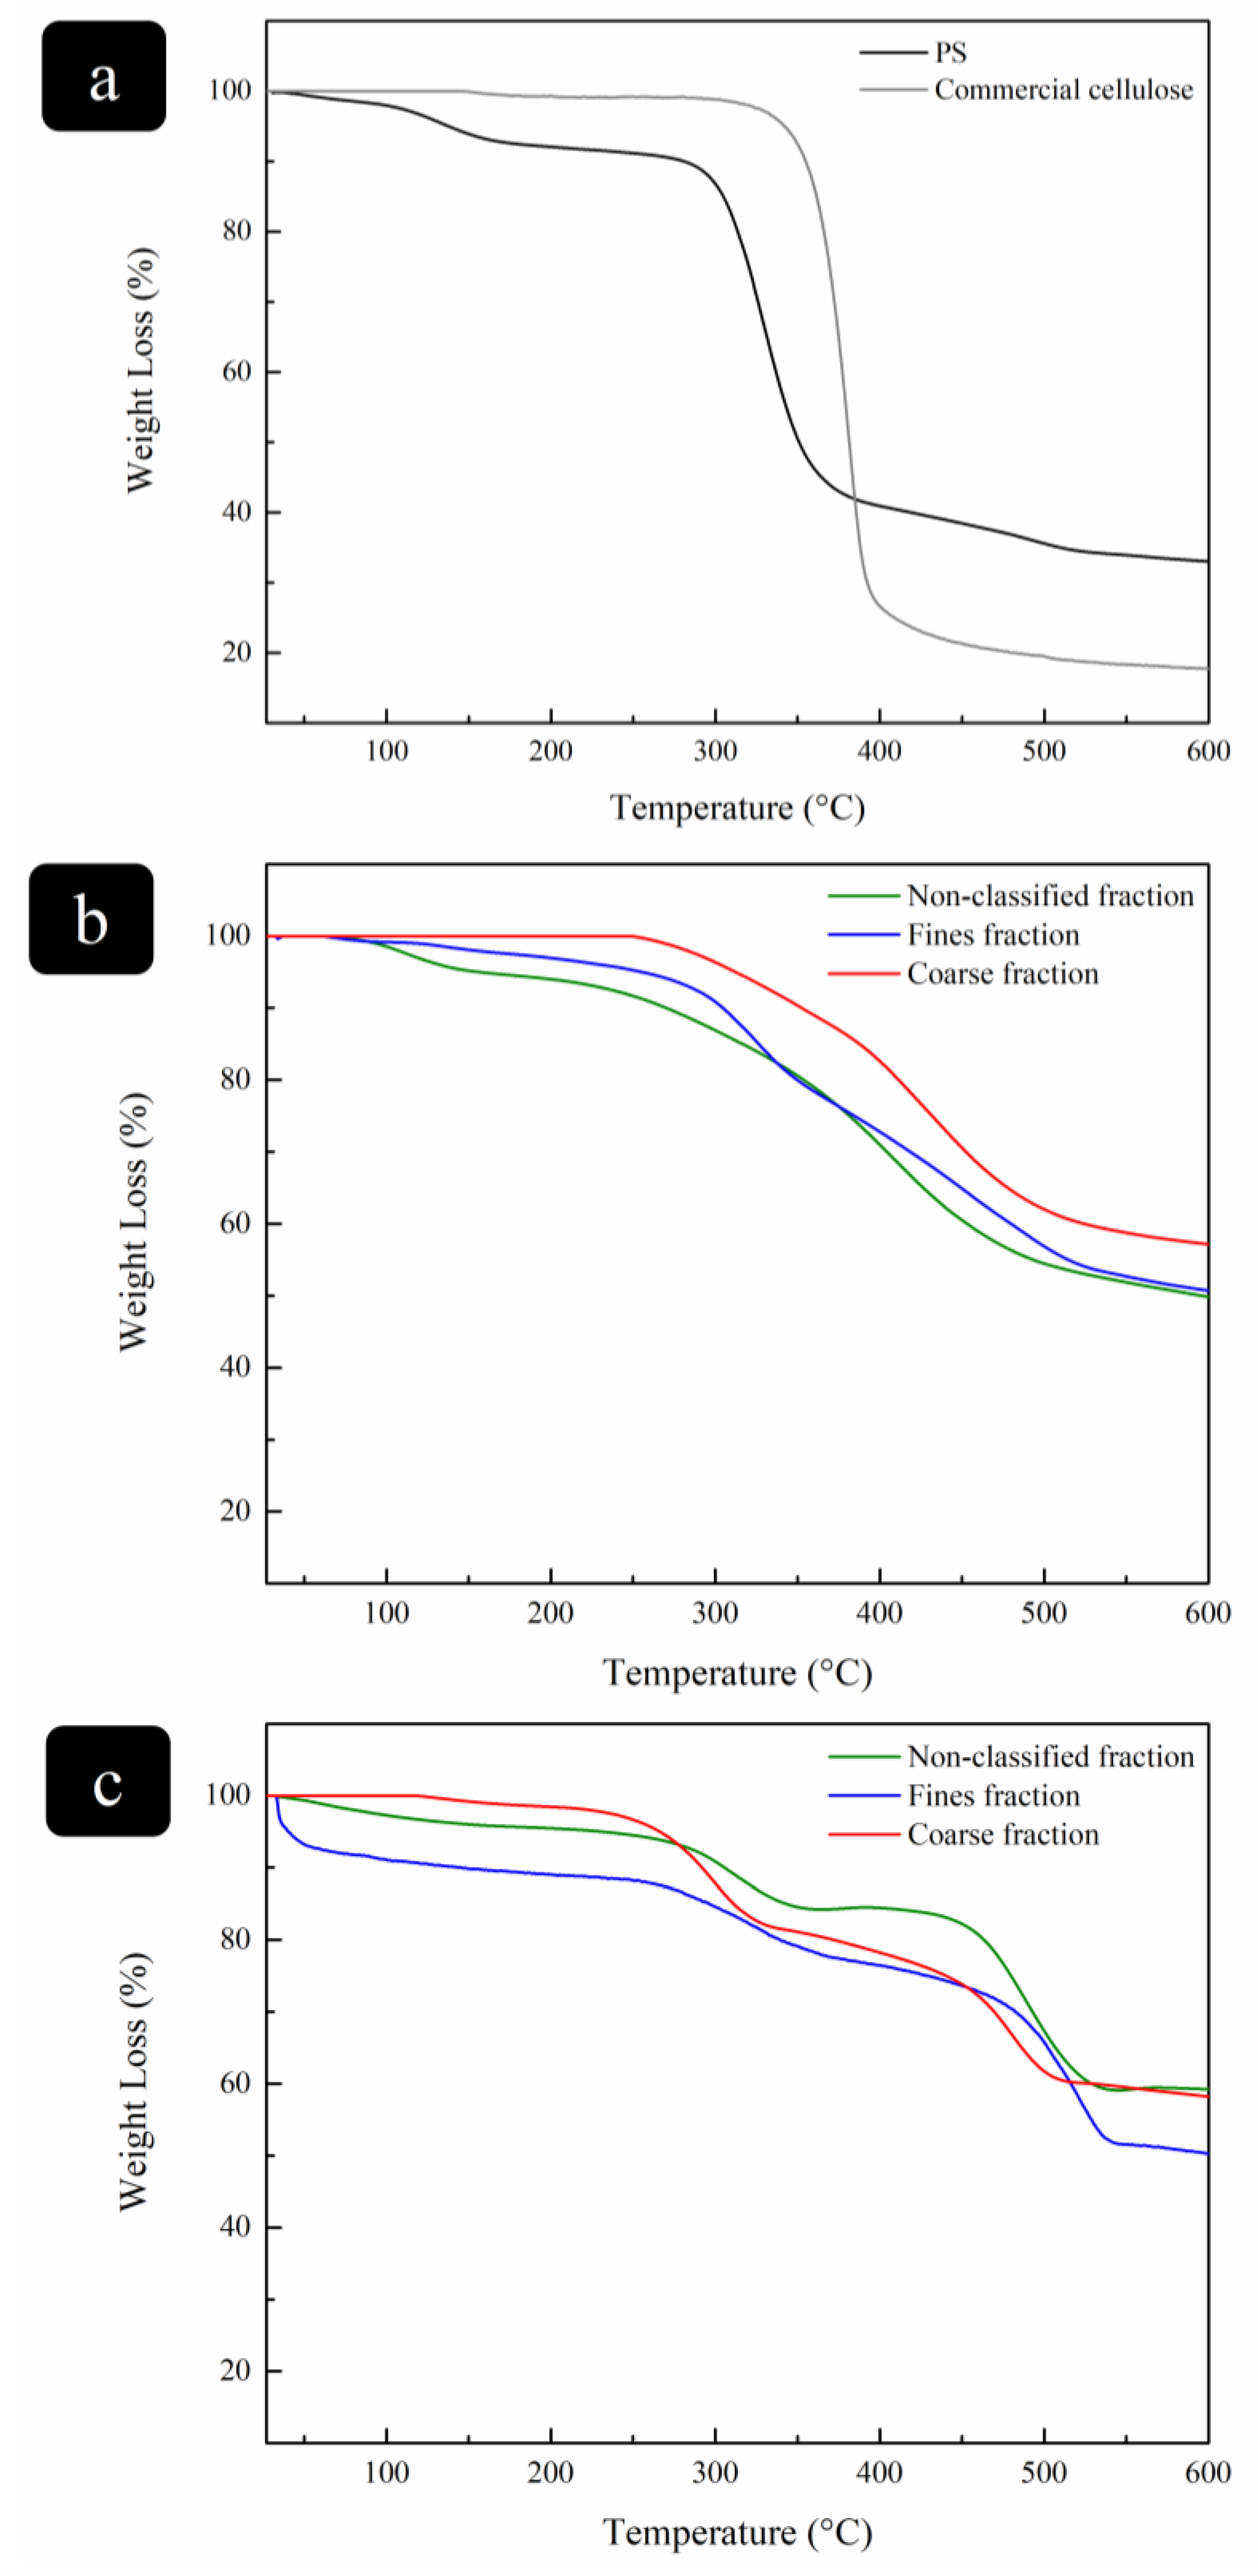
3.2.5. Thermal Stability Analysis

From the analysis of the thermograms obtained (Figure 6), it was possible to identify three main weight loss regions. The first one, which occurs at temperatures up to 120 °C, is associated with the evaporation of structural or physically bound water molecules [33]. This phenomenon is common in plant fibers, which increase their flexibility [34]. This weight loss was higher for the enzymatic hydrolysis extract (Figure 6c) with the fine fraction (~12%).
The second region of weight loss is around 200–350 °C, associated with cellulose degradation, as observed in the commercial cellulose thermogram (Figure 6a) [29,32]. In this range, the depolymerization of heteropolysaccharides might occur, generating free radicals that result from the degradation of cellulose [35]. It has been reported that the weight loss magnitude increases with the increase in amorphous compounds—such as hemicellulose and lignin—and, on the other hand, decreases with the increase of crystallinity [29]. As expected, the TEMPO-oxidation samples presented the lowest temperature (200 °C) and the highest weight loss (~45%). This extraction method introduces -COONa groups to cellulose C6, reducing its thermal stability [16]. The enzymatic hydrolysis was the method that allowed the highest thermal stability—second degradation occurring at around 250 °C—and presented the lowest weight loss (~11%). This could be related to the high crystallinity of the samples (Section 3.2.4).
The last region of weight loss occurred between 350 and 500 °C, related to the carbonization of the degraded compounds [12]. This weight loss was higher (~25%) and at higher temperatures (starting at 350 °C) for the enzymatic hydrolysis samples. This might happen because of the presence of the calcium oxalate crystals that entangled on the cellulose structure, increasing its crystallinity and, consequently, its thermal stability.
It was not possible to establish a direct correlation between the particle size and the thermal stability of the samples. Overall, it can be concluded that the extraction method that resulted in samples with the highest thermal stability was enzymatic hydrolysis.

4. Conclusions

This work aims to understand the influence of PS particle size and the extraction methods performed on the quantity and quality of the obtained cellulose through the characterization of the final solid extracts.
Overall, the obtained results, using complementary characterization techniques, indicate that the enzymatic hydrolysis method presents the most promising results for cellulose extraction (14.58 ± 0.30%, dry basis) because of the low amount of sugar degradation that occurred during the process, the higher crystallinity detected (68.98% for the non-classified fraction), and consequent higher thermal stability (~11% weight loss at 250 °C), indicating the extraction method had a great effect on the obtained extract composition. The influence of the fraction used was not clear in all the techniques. However, it was possible to notice a higher cellulose band intensity in FTIR spectra for the fine fraction, suggesting that a smaller particle size allows for a higher interaction with the reagents, improving cellulose extraction [36].
This is an important opportunity to develop new applications with the residues generated from banana production, reducing their environmental impact and creating a source of value. From future work perspectives, the optimization of the enzymatic hydrolysis extraction of the fine fraction will be studied through the testing of different enzymatic cocktails, aiming to obtain pure nanocellulose that can be used for the development of polymeric structures in the form of films or gels.

Author Contributions

Conceptualization: R.E.A.N. and L.A.N.; investigation: R.E.A.N. and M.C.; Visualization and methodology: R.E.A.N.; writing—original draft: R.E.A.N.; writing—review and editing: R.E.A.N., M.C., J.G.C. and L.A.N.; supervision: L.A.N. and J.G.C.; funding acquisition: L.A.N. All authors have read and agreed to the published version of the manuscript.

Funding

This work was supported by the Associate Laboratory for Green Chemistry—LAQV, which is financed through national funds from FCT/MCTES (UIDB/50006/2020 and UIDP/50006/2020). The PhD scholarship of Rosa E. A. Nascimento (2020.05490.BD) was also funded through national funds from FCT-Portugal. Mónica Carvalheira acknowledges FCT—Fundação para a Ciência e a Tecnologia, I.P., in the scope of the project UIDP/04378/2020 and UIDB/04378/2020 of the Research Unit on Applied Molecular Biosciences—UCIBIO and the project LA/P/0140/2020 of the Associate Laboratory Institute for Health and Bioeconomy—i4HB. Luísa A. Neves acknowledges Fundação para a Ciência e a Tecnologia (FCT)/MCTES) for the assistant researcher contract under Scientific Employment Stimulus (2022.00689.CEECIND).

Institutional Review Board Statement

Not applicable.

Informed Consent Statement

Not applicable.

Data Availability Statement

All data analyzed during this study is included in this published article.

Conflicts of Interest

The authors declare no conflict of interest. The funders had no role in the design of the study; in the collection, analyses, or interpretation of data; in the writing of the manuscript; or in the decision to publish the results.

References

  1. Ahmad, T.; Danish, M. Prospects of banana waste utilization in wastewater treatment: A review. J. Environ. Manag. 2018, 206, 330–348. [Google Scholar] [CrossRef] [PubMed]
  2. Kusuma, S.A.F.; Febriyanti, M.; Farzadillah, N. Natural Oral Anti-Dysentery from Pseudostem of Klutuk (Musa Balbisiana Colla) and Kepok (Musa Paradisiaca L.) Banana Plant from Indonesia. J. Pharm. Sci. Res. 2018, 10, 2443–2447. [Google Scholar]
  3. Statista. Production Volume of Bananas Worldwide from 2010 to 2021. Available online: https://www.statista.com/statistics/716037/global-banana-market-volume/#:~:text=Volume%20of%20bananas%20produced%20worldwide%202010-2021&text=In%202021%2C%20the%20volume%20of,been%20generally%20increasing%20since%202010 (accessed on 19 April 2023).
  4. de Oliveira Maia, B.G.; de Oliveira, A.P.N.; de Oliveira, T.M.N.; Marangoni, C.; Souza, O.; Sellin, N. Characterization and Production of Banana Crop and Rice Processing Waste Briquettes. Environ. Prog. Sustain. Energy 2018, 37, 1266–1273. [Google Scholar] [CrossRef]
  5. Nations, U. Sustainable Development Goals. Available online: https://unric.org/en/united-nations-sustainable-development-goals/ (accessed on 12 December 2022).
  6. Suárez-Eiroa, B.; Fernández, E.; Méndez-Martínez, G.; Soto-Oñate, D. Operational Principles of Circular Economy for Sustainable Development: Linking Theory and Practice. J. Clean. Prod. 2019, 214, 952–961. [Google Scholar] [CrossRef]
  7. Chopra, L.; Manikanika. Extraction of Cellulosic Fibers from the Natural Resources: A Short Review. Mater. Today Proc. 2021, 48, 1265–1270. [Google Scholar] [CrossRef]
  8. Boufi, S. 6—Agricultural crop residue as a source for the production of cellulose nanofibrils. In Cellulose-Reinforced Nanofibre Composites; Elsevier: Amsterdam, The Netherlands, 2017; pp. 129–152. [Google Scholar]
  9. Del Mar Verde Méndez, C.; Forster, M.P.; Rodríguez-Delgado, M.Á.; Rodríguez-Rodríguez, E.M.; Romero, C.D. Content of Free Phenolic Compounds in Bananas from Tenerife (Canary Islands) and Ecuador. Eur. Food Res. Technol. 2003, 217, 287–290. [Google Scholar] [CrossRef]
  10. Idicula, M.; Boudenne, A.; Umadevi, L.; Ibos, L.; Candau, Y.; Thomas, S. Thermophysical Properties of Natural Fibre Reinforced Polyester Composites. Compos. Sci. Technol. 2006, 66, 2719–2725. [Google Scholar] [CrossRef]
  11. Cordeiro, N.; Belgacem, M.N.; Torres, I.C.; Moura, J.C.V.P. Chemical Composition and Pulping of Banana Pseudo-Stems. Ind. Crops Prod. 2004, 19, 147–154. [Google Scholar] [CrossRef]
  12. Pereira, N.R.L.; Lopes, B.; Fagundes, I.V.; de Moraes, F.M.; Morisso, F.D.P.; Parma, G.O.C.; Zepon, K.M.; Magnago, R.F. Bio-Packaging Based on Cellulose Acetate from Banana Pseudostem and Containing Butia Catarinensis Extracts. Int. J. Biol. Macromol. 2022, 194, 32–41. [Google Scholar] [CrossRef]
  13. Zhang, C.; Li, J.; Liu, C.; Liu, X.; Wang, J.; Li, S.; Fan, G.; Zhang, L. Alkaline Pretreatment for Enhancement of Biogas Production from Banana Stem and Swine Manure by Anaerobic Codigestion. Bioresour. Technol. 2013, 149, 353–358. [Google Scholar] [CrossRef]
  14. Prado, K.S.; Spinacé, M.A.S. Isolation and Characterization of Cellulose Nanocrystals from Pineapple Crown Waste and Their Potential Uses. Int. J. Biol. Macromol. 2019, 122, 410–416. [Google Scholar] [CrossRef] [PubMed]
  15. Martelli-Tosi, M.; Masson, M.M.; Silva, N.C.; Esposto, B.S.; Barros, T.T.; Assis, O.B.G.; Tapia-Blácido, D.R. Soybean Straw Nanocellulose Produced by Enzymatic or Acid Treatment as a Reinforcing Filler in Soy Protein Isolate Films. Carbohydr. Polym. 2018, 198, 61–68. [Google Scholar] [CrossRef] [PubMed]
  16. Faradilla, R.H.F.; Lee, G.; Arns, J.Y.; Roberts, J.; Martens, P.; Stenzel, M.H.; Arcot, J. Characteristics of a Free-Standing Film from Banana Pseudostem Nanocellulose Generated from TEMPO-Mediated Oxidation. Carbohydr. Polym. 2017, 174, 1156–1163. [Google Scholar] [CrossRef]
  17. Nascimento, R.E.A.; Monte, J.; Cadima, M.; Alves, V.D.; Neves, L.A. Rendering Banana Plant Residues into a Potentially Commercial Byproduct by Doping Cellulose Films with Phenolic Compounds. Polymers 2021, 13, 843. [Google Scholar] [CrossRef]
  18. Brindha, R.; Narayana, C.K.; Vijayalakshmi, V.; Nachane, R.P. Effect of Different Retting Processes on Yield and Quality of Banana Pseudostem Fiber. J. Nat. Fibers 2019, 16, 58–67. [Google Scholar] [CrossRef]
  19. Tibolla, H.; Pelissari, F.M.; Menegalli, F.C. Cellulose Nanofibers Produced from Banana Peel by Chemical and Enzymatic Treatment. LWT 2014, 59, 1311–1318. [Google Scholar] [CrossRef]
  20. Meng, F.; Wang, G.; Du, X.; Wang, Z.; Xu, S.; Zhang, Y. Extraction and Characterization of Cellulose Nanofibers and Nanocrystals from Liquefied Banana Pseudo-Stem Residue. Compos. Part B Eng. 2019, 160, 341–347. [Google Scholar] [CrossRef]
  21. Ajao, O.; Jeaidi, J.; Benali, M.; Restrepo, A.M.; El Mehdi, N.; Boumghar, Y. Quantification and Variability Analysis of Lignin Optical Properties for Colour-Dependent Industrial Applications. Molecules 2018, 23, 377. [Google Scholar] [CrossRef]
  22. Chen, Z.; Wang, Y.; Cheng, H.; Zhou, H. Hemicellulose Degradation: An Overlooked Issue in Acidic Deep Eutectic Solvents Pretreatment of Lignocellulosic Biomass. Ind. Crops Prod. 2022, 187, 115335. [Google Scholar] [CrossRef]
  23. Dube, A.M. Isolation and characterization of cellulose nanocrystals from Ensete ventricosum pseudo-stem fiber using acid hydrolysis. Biomass Convers. Biorefiney 2022, 2022, 1–16. [Google Scholar] [CrossRef]
  24. Zope, G.; Goswami, A.; Kulkarni, S. Isolation and Characterization of Cellulose Nanocrystals Produced by Acid Hydrolysis from Banana Pseudostem. Bionanoscience 2022, 12, 463–471. [Google Scholar] [CrossRef]
  25. Perez-Pimienta, J.A.; Lopez-Ortega, M.G.; Chavez-Carvayar, J.A.; Varanasi, P.; Stavila, V.; Cheng, G.; Singh, S.; Simmons, B.A. Characterization of Agave Bagasse as a Function Ofionic Liquid Pretreatment. Biomass Bioenergy 2015, 75, 180–188. [Google Scholar] [CrossRef]
  26. Solikhin, A.; Murayama, K. Enhanced Properties of Poly(Vinyl Alcohol) Composite Films Filled with Microfibrillated Cellulose Isolated from Continuous Steam Explosion. Int. J. Plast. Technol. 2018, 22, 122–136. [Google Scholar] [CrossRef]
  27. Nunes, R.C.R. 13—Rubber nanocomposites with nanocellulose. In Progress in Rubber Nanocomposites; Elsevier: Amsterdam, The Netherlands, 2017; pp. 463–494. [Google Scholar]
  28. Kafle, K.; Greeson, K.; Lee, C.; Kim, S.H. Cellulose Polymorphs and Physical Properties of Cotton Fabrics Processed with Commercial Textile Mills for Mercerization and Liquid Ammonia Treatments. Text. Res. J. 2014, 84, 1692–1699. [Google Scholar] [CrossRef]
  29. Diarsa, M.; Gupte, A. Preparation, characterization and its potential applications in Isoniazid drug delivery of porous microcrystalline cellulose from banana pseudostem fibers. 3 Biotech 2021, 11, 334. [Google Scholar] [CrossRef]
  30. Tibolla, H.; Pelissari, F.M.; Rodrigues, M.I.; Menegalli, F.C. Cellulose Nanofibers Produced from Banana Peel by Enzymatic Treatment: Study of Process Conditions. Ind. Crops Prod. 2017, 95, 664–674. [Google Scholar] [CrossRef]
  31. Zuluaga, R.; Luc, J.; Cruz, J.; Vélez, J.; Mondragon, I.; Gañán, P. Cellulose microfibrils from banana rachis : Effect of alkaline treatments on structural and morphological features. Carbohydr. Polym. 2009, 76, 51–59. [Google Scholar] [CrossRef]
  32. Shrestha, P.; Bilal, M.; Kumar, A. Development of Antibacterial Biocomposites Reinforced with Cellulose Nanocrystals Derived from Banana Pseudostem. Carbohydr. Polym. Technol. Appl. 2021, 2, 100112. [Google Scholar] [CrossRef]
  33. Wang, S.; Ren, J.; Li, W.; Sun, R.; Liu, S. Properties of Polyvinyl Alcohol/Xylan Composite Films with Citric Acid. Carbohydr. Polym. 2014, 103, 94–99. [Google Scholar] [CrossRef]
  34. De Paiva, J.M.F.; Frollini, E. Unmodified and Modified Surface Sisal Fibers as Reinforcement of Phenolic and Lignophenolic Matrices Composites: Thermal Analyses of Fibers and Composites. Macromol. Mater. Eng. 2006, 291, 405–417. [Google Scholar] [CrossRef]
  35. Poletto, M.; Zattera, A.J.; Forte, M.M.C.; Santana, R.M.C. Thermal Decomposition of Wood: Influence of Wood Components and Cellulose Crystallite Size. Bioresour. Technol. 2012, 109, 148–153. [Google Scholar] [CrossRef] [PubMed]
  36. Bullard, J.W.; Jin, Q.; Snyder, K.A. How Do Specific Surface Area and Particle Size Distribution Change When Granular Media Dissolve. Chem. Eng. J. 2021, 406, 127098. [Google Scholar] [CrossRef]
Figure 1. Cellulose extraction methods used: (a) alkaline-acid hydrolysis, (b) enzymatic hydrolysis, and (c) TEMPO oxidation.
Cleantechnol 05 00052 g001
Figure 2. PS particle size distribution achieved after milling and sieving.
Cleantechnol 05 00052 g002
Figure 3. FTIR results for (a) PS and commercial cellulose, (b) alkalineacid hydrolysis, (c) enzymatic hydrolysis, and (d) TEMPOoxidation final solid extracts, where black line corresponds to PS, grey line to commercial cellulose, green line to non-classified fraction (milled but without sieving), blue line to the fine fraction (≤180 μm), and red line to coarse fraction (≥2000 μm).
Cleantechnol 05 00052 g003aCleantechnol 05 00052 g003b
Figure 4. Diffraction patterns obtained for (a) PS and commercial cellulose, (b) alkalineacid hydrolysis, (c) enzymatic hydrolysis, and (d) TEMPO oxidation, where black line corresponds to PS, grey line to commercial cellulose, green line nonclassified fraction (milled but without sieving), blue line to the fine fraction (≤180 μm), and red line to coarse fraction (≥2000 μm).
Cleantechnol 05 00052 g004aCleantechnol 05 00052 g004b
Figure 5. Crystallinity index for PS (black), commercial cellulose (grey), alkaline-acid hydrolysis (green), enzymatic hydrolysis (blue), and TEMPO oxidation (red).
Cleantechnol 05 00052 g005
Figure 6. Thermal degradation results of (a) PS and commercial cellulose, (b) alkaline-acid hydrolysis, (c) enzymatic hydrolysis, and (d) TEMPO oxidation, where black line corresponds to PS, grey line to commercial cellulose, green line to non-classified fraction (milled but without sieving), blue line to fine fraction (≤180 μm), and red line to coarse fraction (≥2000 μm).
Cleantechnol 05 00052 g006aCleantechnol 05 00052 g006b
Table 1. Cellulose content and extraction yield obtained for the fine fraction in the three extraction methods and for the PS untreated biomass.
Extraction MethodCellulose Content
(mg/g Biomass, Dried Basis)
Cellulose Yield
(%, Dried Basis)
PS2.68 × 10−1 ± 7.60 × 10⁻²-
Alkaline-acid hydrolysis9.09 × 10−3 ± 1.06 × 10−33.40 ± 0.11
Enzymatic hydrolysis3.90 × 10−2 ± 3.0 × 10−314.58 ± 0.30
TEMPO oxidation6.76 × 10−2 ± 7.76 × 10−425.25 ± 0.08
Table 2. Images of the final solid extracts obtained.
Particle Fraction Non-ClassifiedFinesCoarse
Method
Alkaline-acid
hydrolysis
Cleantechnol 05 00052 i001Cleantechnol 05 00052 i002Cleantechnol 05 00052 i003
Enzymatic hydrolysisCleantechnol 05 00052 i004Cleantechnol 05 00052 i005Cleantechnol 05 00052 i006
TEMPO oxidationCleantechnol 05 00052 i007Cleantechnol 05 00052 i008Cleantechnol 05 00052 i009
Disclaimer/Publisher’s Note: The statements, opinions and data contained in all publications are solely those of the individual author(s) and contributor(s) and not of MDPI and/or the editor(s). MDPI and/or the editor(s) disclaim responsibility for any injury to people or property resulting from any ideas, methods, instructions or products referred to in the content.

