Article

Torrefaction of Pine Using a Pilot-Scale Rotary Reactor: Experimentation, Kinetics, and Process Simulation Using Aspen Plus™

by
Suchandra Hazra
1,2,
Prithvi Morampudi
2,
John C. Prindle
2,
Dhan Lord B. Fortela
2,3,
Rafael Hernandez
2,3,
Mark E. Zappi
2,3 and
Prashanth Buchireddy
2,3,*
1
SafeSource Direct, LLC, Broussard, LA 70518, USA
2
Chemical Engineering Department, University of Louisiana at Lafayette, Lafayette, LA 70504, USA
3
Energy Institute of Louisiana, University of Louisiana at Lafayette, Lafayette, LA 70504, USA
*
Author to whom correspondence should be addressed.
Clean Technol. 2023, 5(2), 675-695; https://doi.org/10.3390/cleantechnol5020034
Submission received: 15 March 2023 / Revised: 19 April 2023 / Accepted: 6 May 2023 / Published: 17 May 2023
(This article belongs to the Special Issue Valorization of Industrial and Agro Waste)

Abstract

:
Biomass is an excellent sustainable carbon neutral energy source, however its use as a coal/petroleum coke substitute in thermal applications poses several challenges. Several inherent properties of biomass including higher heating value (HHV), bulk density, and its hydrophilic and fibrous nature, all contribute to challenges for it to be used as a solid fuel. Torrefaction or mild pyrolysis is a well-accepted thermal pretreatment technology that solves most of the above-mentioned challenges and results in a product with superior coal-like properties. Torrefaction involves the heating of biomass to moderate temperatures typically between 200 °C and 300 °C in a non-oxidizing atmosphere. This study focused on evaluating the influence of torrefaction operating temperature (204–304 °C) and residence time (10–40 min) on properties of pine. Tests were performed on a continuous 0.3 ton/day indirectly heated rotary reactor. The influence of torrefaction operational conditions on pine was evaluated in terms of the composition of torrefied solids, mass yield, energy yield, and HHV using a simulated model developed in Aspen Plus™ software. A kinetic model was established based on the experimental data generated. An increase in torrefaction severity (increasing temperature and residence time) resulted in an increase in carbon content, accompanied with a decrease in oxygen and hydrogen. Results from the simulated model suggest that the solid and energy yields decreased with an increase in temperature and residence time. Solid yield varied from 80% at 204 °C to 68% at 304 °C, and energy yield varied from 99% at 204 °C to 70% at 304 °C, respectively. On the other hand, HHV improved from 22.8 to 25.1 MJ/kg with an increase in temperature at 20 min residence time. Over the range of 10 to 40 min residence time at 260 °C, solid and energy yields varied from 77% to 59% and 79% to 63%, respectively; however the HHV increased by only 3%. Solid yield, energy yield, and HHV simulated data were within the 5% error margin when compared to the experimental data. Validation of the simulation parameters was achieved by the conformance of the experimental and simulation data obtained under the same testing conditions. These simulated parameters can be utilized to study other operating conditions fundamental for the commercialization of these processes. Desirable torrefaction temperature to achieve the highest solid fuel yield can be determined using the energy yield and mass loss data.

1. Introduction

Torrefaction is a thermochemical process used for the conversion of biomass into a substance such as coal, which has improved fuel characteristics compared to the original biomass. This helps in minimizing the use of fossil fuels by developing/producing sustainable, renewable energy supplies [1]. At present, biomass is acknowledged as a significant source of renewable energy, and it comprises around 11% of the global energy consumption [2]. Biomass used for energy production comes from forestry, agricultural, waste, and industrial resources. Forestry and agricultural residues are the primary sources, whereas waste and industrial resources are considered to be secondary since they are derived from the primary sources [3]. Woody biomass has some drawbacks that limit its applicability as a wide-scale alternative energy source. Compared to conventional fuel such as coal, biomass has a higher oxygen content, a lower calorific value, a lower bulk density, a higher moisture content, and a higher hygroscopic nature, and hence, faces several technical challenges in energy conversion systems [4]. Moreover, raw biomass, with its high moisture content, poses issues with transportation, storage, and processing as a direct fuel.
In many countries, biomass use over fossil fuels can enhance sustainable development and improve energy security. Heat and power can be produced from the direct use of biomass or a blend with coal in a combustion or co-combustion system. [5]. Renewable energy had a breakthrough year in 2019, as installed power capacity increased more than 200 gigawatts (GW). In 2020, more than 260 GW of renewable capacity was added globally [2]. The carbon content in the biomass is taken directly from the atmosphere, and therefore the fuel is considered to be carbon neutral. Compared to coal, biomass contains less nitrogen, sulfur, ash, and heavy metals, which is another added benefit. Despite these advantages, there are still numerous drawbacks associated with biomass that prevent its application for power production on a larger scale [6]. As a thermal pretreatment method, torrefaction or mild pyrolysis plays an important role in improving the fuel properties by solving the aforementioned problems. Along with this, torrefaction also helps in enhancing the heating value, energy density, and improved grindability [1].
The torrefaction process usually occurs within the temperature range of 250–300 °C under anaerobic conditions [1]. The resulting product from torrefaction contains solids with reduced moisture, lower volatile matter, and an improved fixed carbon content. The energy densification of biomass occurs during torrefaction by losing 30% of mass but still retaining 90% of the energy in the solid products. The end product is usually called bio-coal, torrefied biomass, or green coal [6]. The extent and quality (characteristics) of the products generated depend on the biomass species and torrefaction process conditions. The lignocellulosic composition of biomass varies widely with the type of biomass species. For example, the hemicellulose content for pine is 20.5% compared to 25.4% for straw. Under the torrefaction regime, hemicellulose, which is the most reactive component of lignocellulosic biomass, undergoes extensive degradation to produce a solid product (bio-coal) along with volatiles and gases. Lignin and cellulose contents, which also vary with the type of biomass, undergo limited devolatilization during the process. Thus, biomass with higher hemicellulose typically produces lower bio-coal yields accompanied by higher volatile and gas contents. Furthermore, with an increase in torrefaction temperature, the yield of the condensable and non-condensable gases increases, resulting in lower carbon-rich solid yields. Thus, the distribution of torrefaction products, namely bio-coal, condensable volatiles, and gases vary with the biomass species and the operating conditions utilized. The condensable volatiles and gases can be combusted and reutilized to generate the thermal energy required/necessary for the drying and torrefaction processes [7].
Biomass is composed of hemicellulose, cellulose, and lignin. These complex structures are also responsible for the existence of the various conflicting models of the thermal degradation pathway for biomass. At present, all the kinetic studies on torrefaction are restricted to isothermal conditions. The most used torrefaction model established by Colomba Di Blasi, and Mario Lanzetta (1997) initially described the degradation of xylans under an inert atmosphere in the temperature range of 200–340 °F [8]. Thurner and Mann (1981) investigated the pyrolysis of oak sawdust over the range of 300–400 °C using reaction kinetics. The kinetic parameters established from the Arrhenius plots were 88.6, 112.7, 106.5 kJ/mol, 8.61 × 10⁵, 2.47 × 10⁸, and 4.43 × 10⁷ min−1 for the activation energies and frequency factors, respectively for wood decomposition into gas, tar, and char defined by three parallel first-order reactions [9]. Shang et al. (2013) studied the decomposition kinetics and devolatilization of wheat straw in a thermogravimetric analyzer coupled with a mass spectrometer. They applied a two-step reaction kinetic model considering the initial dynamic heating period. This helped them obtain precise data that matched with the experimental results at different temperatures. The activation energy and pre-exponential factors established for these two reactions were 71.0 and 76.6 kJ mol−1, and 3.48 × 10⁴ and 4.34 × 10³ s−1, respectively. These parameters and model successfully predicted the residual mass of wheat straw on a batch torrefaction reactor [10].
Research involving kinetic parameters were mostly successful in studying the effects of temperature, but information is limited when it comes to the effects of residence/reaction time. Wilk et al. (2017) used kinetic parameters to find that conducting torrefaction at a higher temperature helped in decreasing the activation energy of the combustion process of miscanthus pine with improved fuel properties [11]. Moreover, results on composition, mass yield, energy yield, and higher heating values were not always reported and/or validated with experimental results, which is a critical part of ensuring the success of a model.
Lately, there has been an increase in the number of studies focusing on torrefaction characteristics for a wide varieties of biomass species. The primary focus of the research has been on the fuel properties of torrefied products obtained using different process parameters [6,12,13,14,15,16,17]. Although there are several torrefaction studies available, the majority of them focus on experimental approaches. These studies therefore provide limited information on process scale-up [6]. For instance, lab-scale experiments pose challenges in obtaining information on process energy requirement, which is critical for industrialization and commercialization of the process. These reasons might have hindered implementation of torrefaction technology to produce solid biofuel on an industrial scale to an extent. [18,19]. In order to minimize the gap between academia and industry, more process modeling studies are required. There is a scarcity of torrefaction process-modeling works in the literature. [20,21,22,23]. In a simple torrefaction model by Hardianto et al. [20] and Dudgeon [24], they estimated the yield and the heating value of torrefied biomass. Nikolopoulos et al. [21] studied the torrefaction of wheat straw using a combination of an Aspen Plus [25] model and chemical kinetics. However, none of these works provided any information on energy consumption and process energy efficiency.
Previous studies have used known compositions of the feed obtained from experimental studies and these results were incorporated into a stoichiometric (RStoic) or a conversion reactor (Ryield), or both reactor types in tandem [20,26,27]. As stated by Bach et al. (2017) [28], the issue was that these pre-defined reactors could not model the actual torrefaction reaction successfully. In order to address this issue, in this study, a simplified kinetic model using the Arrhenius equation has been developed for carbon, oxygen, and hydrogen separately based on experimental data obtained at various temperatures and residence times. The novelty of this study lies in the fact that this model was simulated using Aspen PlusTM through a CSTR reactor that can account for changes in both the temperature and the residence time, and the reaction kinetics has been developed based on results obtained from a pilot-scale torrefaction. A CSTR (continuous stirred tank reactor) is commonly used in industrial processing operations. The advantages associated with CSTR are effective mixing and well-maintained and controlled reactor temperatures. Under steady-state conditions, the output composition is identical to composition of the material inside the reactor, which is a function of the residence time and the reaction rate [29]. These properties of the CSTR reactor were found to be suitable for the simulation of the torrefaction conditions with the assumption of steady-state and the uniform mixing of the materials within the reactor.
In addition to predicting the yields, the proposed simulation model can also provide valuable information and insights into managing energy consumption, scale-up, and optimization of the reactor conditions.

2. Materials and Methods

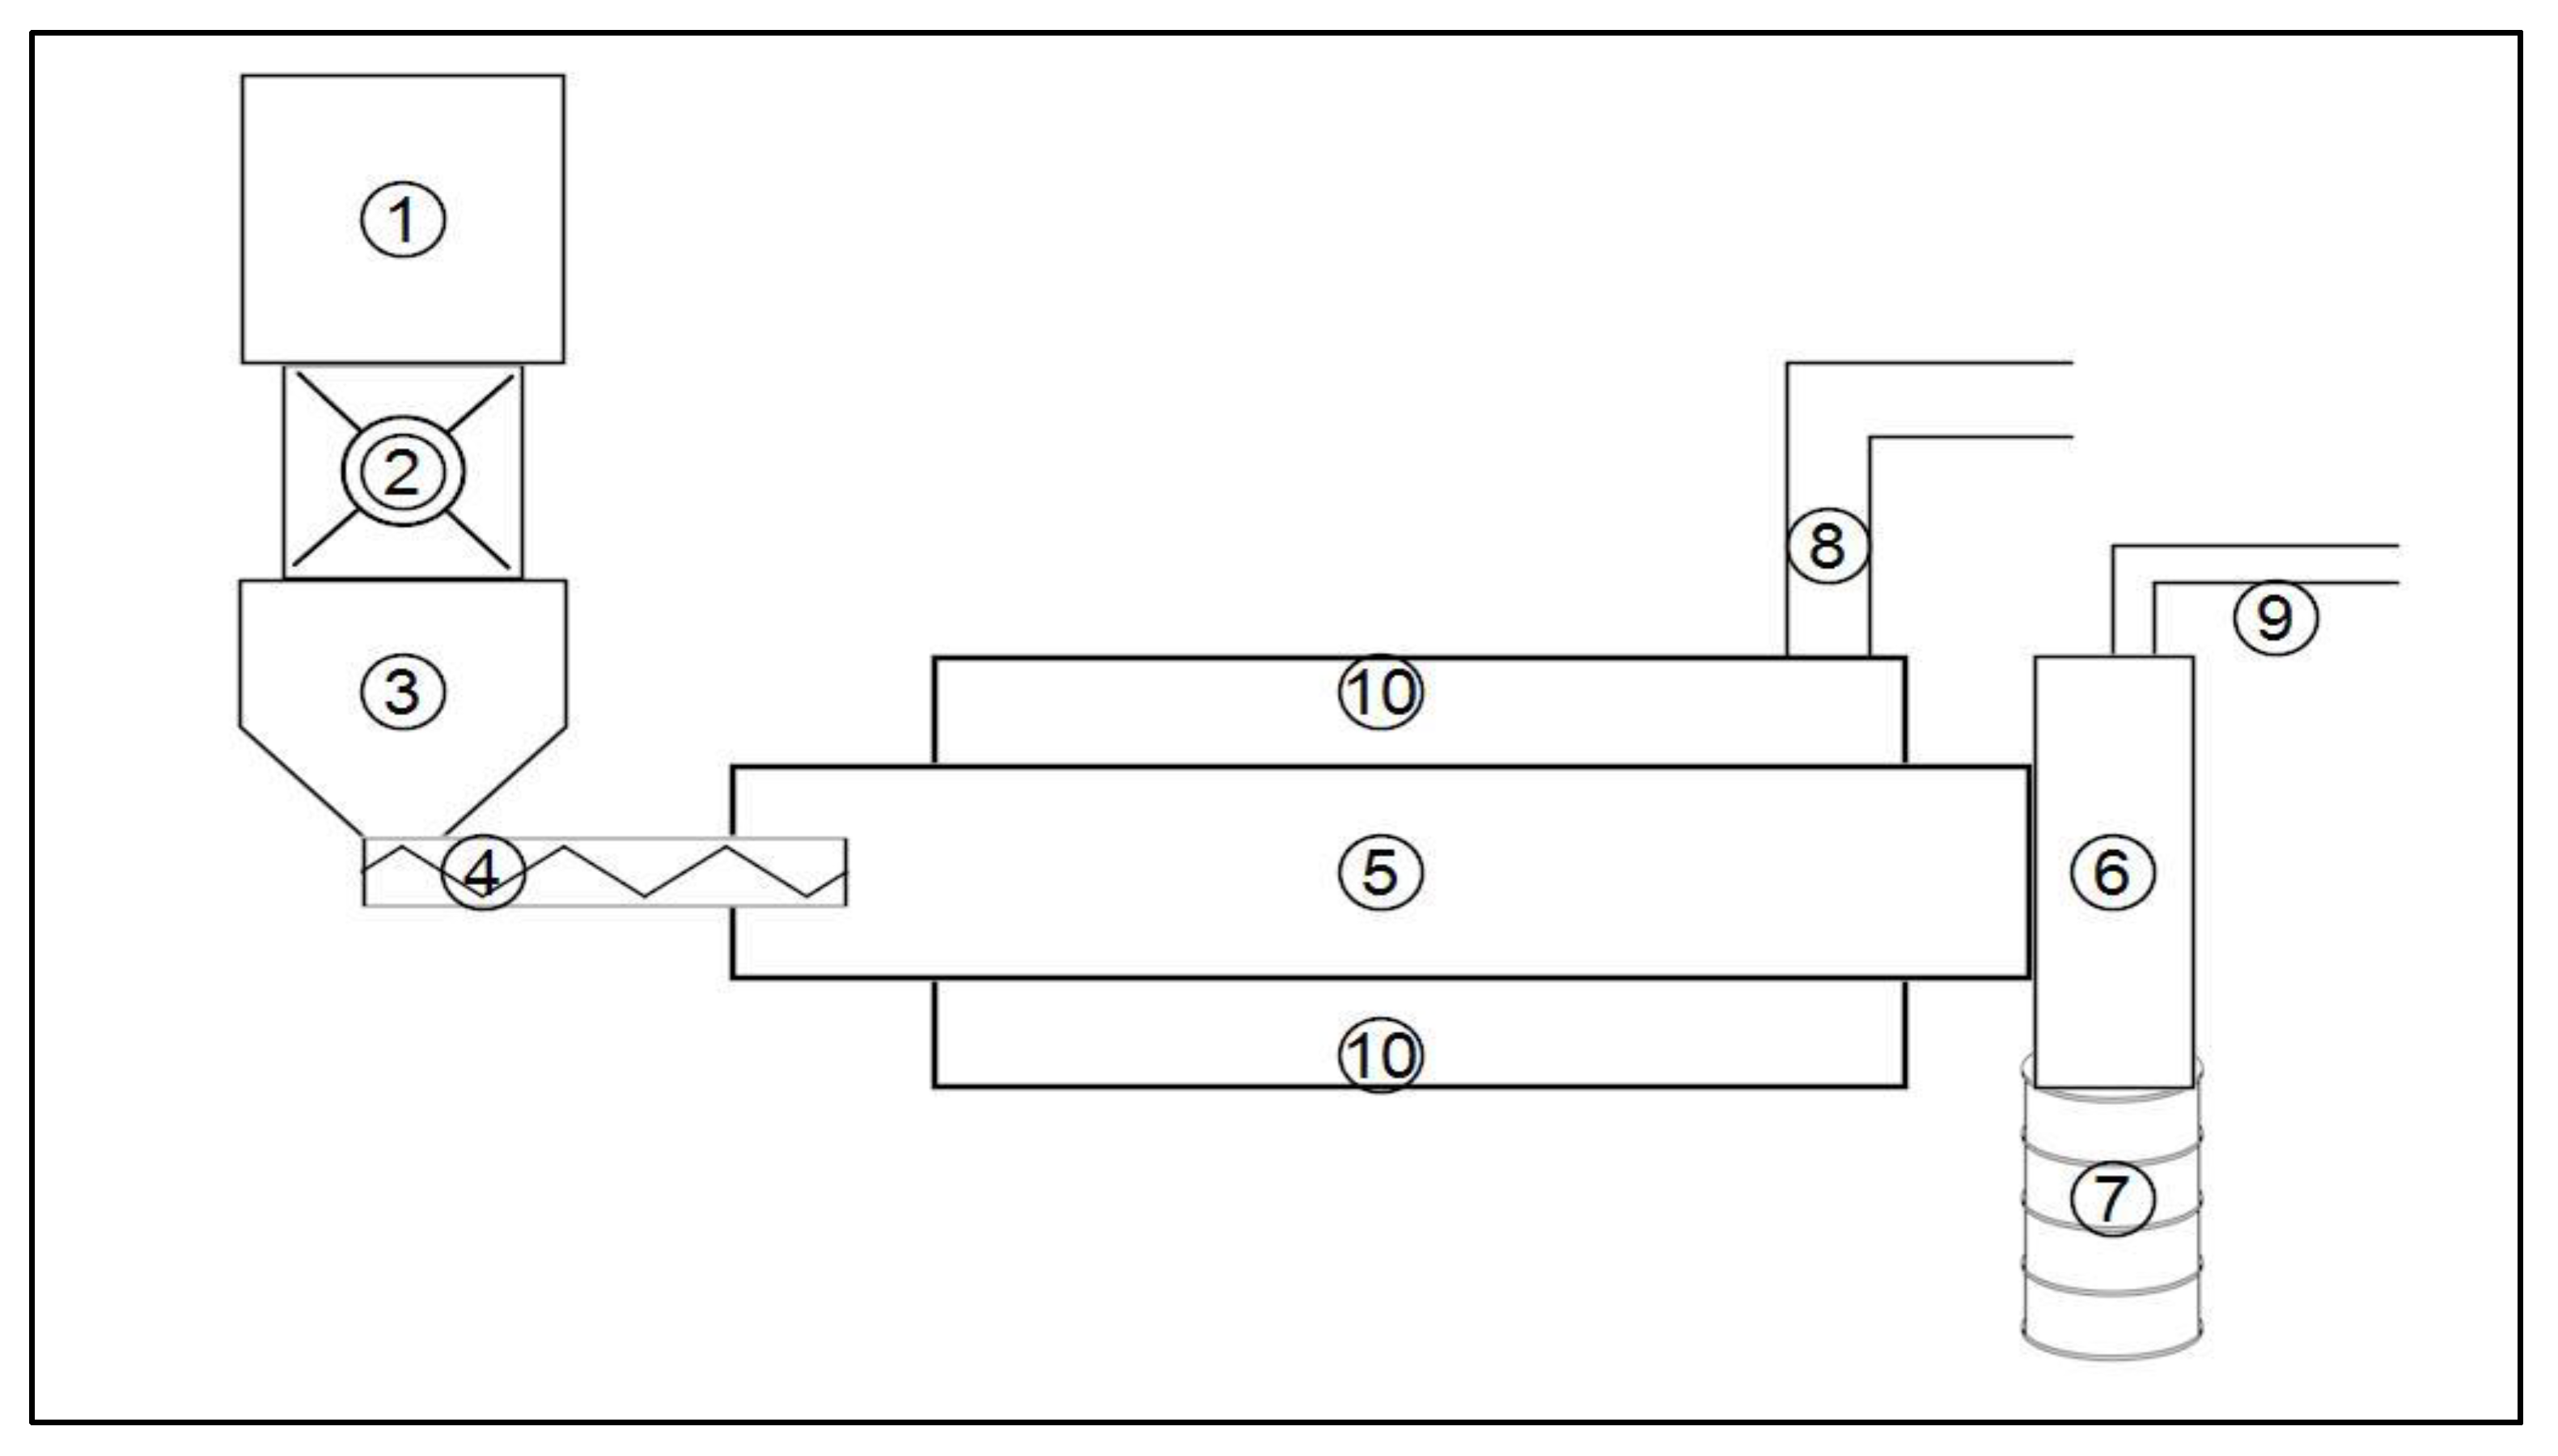
2.1. Pilot-Scale Experiments

2.1.1. Materials and Experimental Procedure

Pine wood chips were procured from Winn Timber depot, Winnfield, LA, USA (February 2018) for further processing and experimentation. The pine chips obtained had an initial moisture content of 50 wt.% and were approximately 45 × 25 × 10 mm in size on an as-received basis. Pine chips were processed through a commercial chipper (one pass) to reduce the size to approximately 25 × 13 × 6 mm and smaller and stored for further analysis and experimentation. Torrefaction tests were performed on a 15 kg/h natural gas fired indirectly heated rotary reactor. The dimensions and details of the reactor system are provided in detail [30]. The effects of temperature and residence times on mass yield, energy yield, higher heating values, proximate and ultimate analysis, and the energy yield in the off-gases on various feedstocks on a simulated torrefaction unit were all evaluated in this study.

2.1.2. Pilot-Scale Experimental Procedure

A schematic of the torrefaction reactor set up is presented in Figure 1. Pine chips were loaded into a hopper (1), which were dropped via rotary air lock (2) into a mechanically vibrated hopper (3) and continuously fed into the rotary reactor (5) through a screw conveyer (4). As the reactor rotates, chips were transported along the heated section of the reactor (5) which was located within the heating chamber (10). Chips were torrefied as they passed the reactor. Torrefied pine was dropped into a sampling drum (7), which was hermitically sealed to the discharge end of the reactor (6) and cooled by purging nitrogen continuously. The volatile gas stream released during the process leaves the reactor from the process side gas exit (9), while the combustion flue gases exit the heating chamber at the flue gas exit (8). The torrefaction temperature referred throughout this document was based on the thermocouple located in the center zone of the reactor, which was controlled by adjusting the natural gas flow rates. The residence times were controlled by adjusting the rotary reactor rpm’s. The inert atmosphere was maintained by purging nitrogen and maintaining a positive pressure inside the reactor system. The detailed experimental procedure can be found in the thesis [30], where a total of 12 experiments were conducted using pine at various temperatures and residence times ranging between 232–315 °C and 16–24 min, respectively. The tolerance for process temperatures was ±7 °C, and ±10% for residence times, respectively.

2.1.3. Post-Experimental Analysis

All the analytical methods used in this study such as the higher heating value, and the ultimate and proximate values of raw biomass and torrefied biomass samples were performed strictly adhering to ASTM procedures. All samples were analyzed at least in duplicates to ensure accuracy.
The higher heating value (HHV) was measured using a bomb calorimeter according to the ASTM standard D-2015. A PARR 6200 Bomb Calorimeter (Parr calorimeter Model No. A1290DDEB, Parr Instrument Company, Moline, IL, USA) was used for the determination of the HHV.
The moisture content of the samples was determined as per the ASTM Method 4442. Two different instruments were used to analyze the moisture content independently: (1) a moisture analyzer (HB43-S Halogen Mettler Toledo), and (2) the oven dry method. A Vario Micro Cube Elemental Analyzer was used to determine the elemental composition of pine and torrefied pine samples. Volatile matter and ash content of the samples were determined in accordance with the STM standards D-3175-11 and ASTM E-1755-01, respectively. Analysis was carried out using a high-temperature vertical tube furnace (MTI GSL-1100X-S MTI, USA) and a box furnace (Lindberg Blue BF51828C-1, Ashville, NC, USA). Fixed carbon was calculated based on the measured moisture content, volatile matter, and ash content of the samples.

2.2. Aspen Plus™ Simulation

Aspen Plus™ was used to simulate the torrefaction process. This flow-sheeting software was developed by AspenTech, that permits the simulation of the industrial processes by incorporating chemical and physical transformations in a comprehensive way [31]. This simulation technique uses the principle of a sequential modular approach to calculate the steady-state heat and mass balance, scale-up, sizing, and cost analysis for a chemical process. There are certain limitations associated with the traditional modular approach due to the flow of information being unalterable, as it is pre-determined in the process flow structure. On the other hand, the biggest advantage of the sequential modular approach lies in its robustness, flexibility, and reliability [32]. Aspen Plus™ modeling was conducted using block units that can simulate the inter-connected steps involving material streams and energy flows in unit operations and sub processes. This software has an enormous list of chemical compounds with their properties. It also supports the use of non-conventional components such as coal and biomass via ultimate, proximate, and sulfate analysis [33]. Aspen Plus™ also provides calculator blocks to incorporate a Fortran code and change the design conditions. This software utilizes an iterative solution method to achieve convergence with a string of calculating streams blocks [34].
Simulation of torrefaction of pine using Aspen Plus™ was divided into two sections in series-drying and torrefaction. The simulation design is shown in Figure 2. Biomass contains a significant amount of moisture, and hence was first dried prior to entering the torrefaction reactor. Drying is typically a high energy demanding step [35]. Pre-drying of biomass is a crucial step for successful torrefaction application where it can generate greater than 80% of the process heat required by combusting the volatile organic compounds from the biomass. This was demonstrated at North Carolina State University [36]. However, the amount of energy available from process volatiles is dictated by the torrefaction processing conditions such as temperature and residence time. Commercial applications have followed this step and incorporated pre-drying methods in their designs. The Biomass Technology Group used this principle, and utilized the gases released in the reactor as a heat source for drying by burning them in a combustion chamber [36]. The design shown in this study has a recycled heat source from the exhaust gases utilized in drying.
Various components, including condensable and non-condensable species added to the simulation, were identified from the pilot-scale experimental studies and the literature review provided in the supplementary material (Table S1) [10,13,14,37,38,39,40,41,42,43,44,45]. The general input parameters used for the simulation are shown in Table 1.

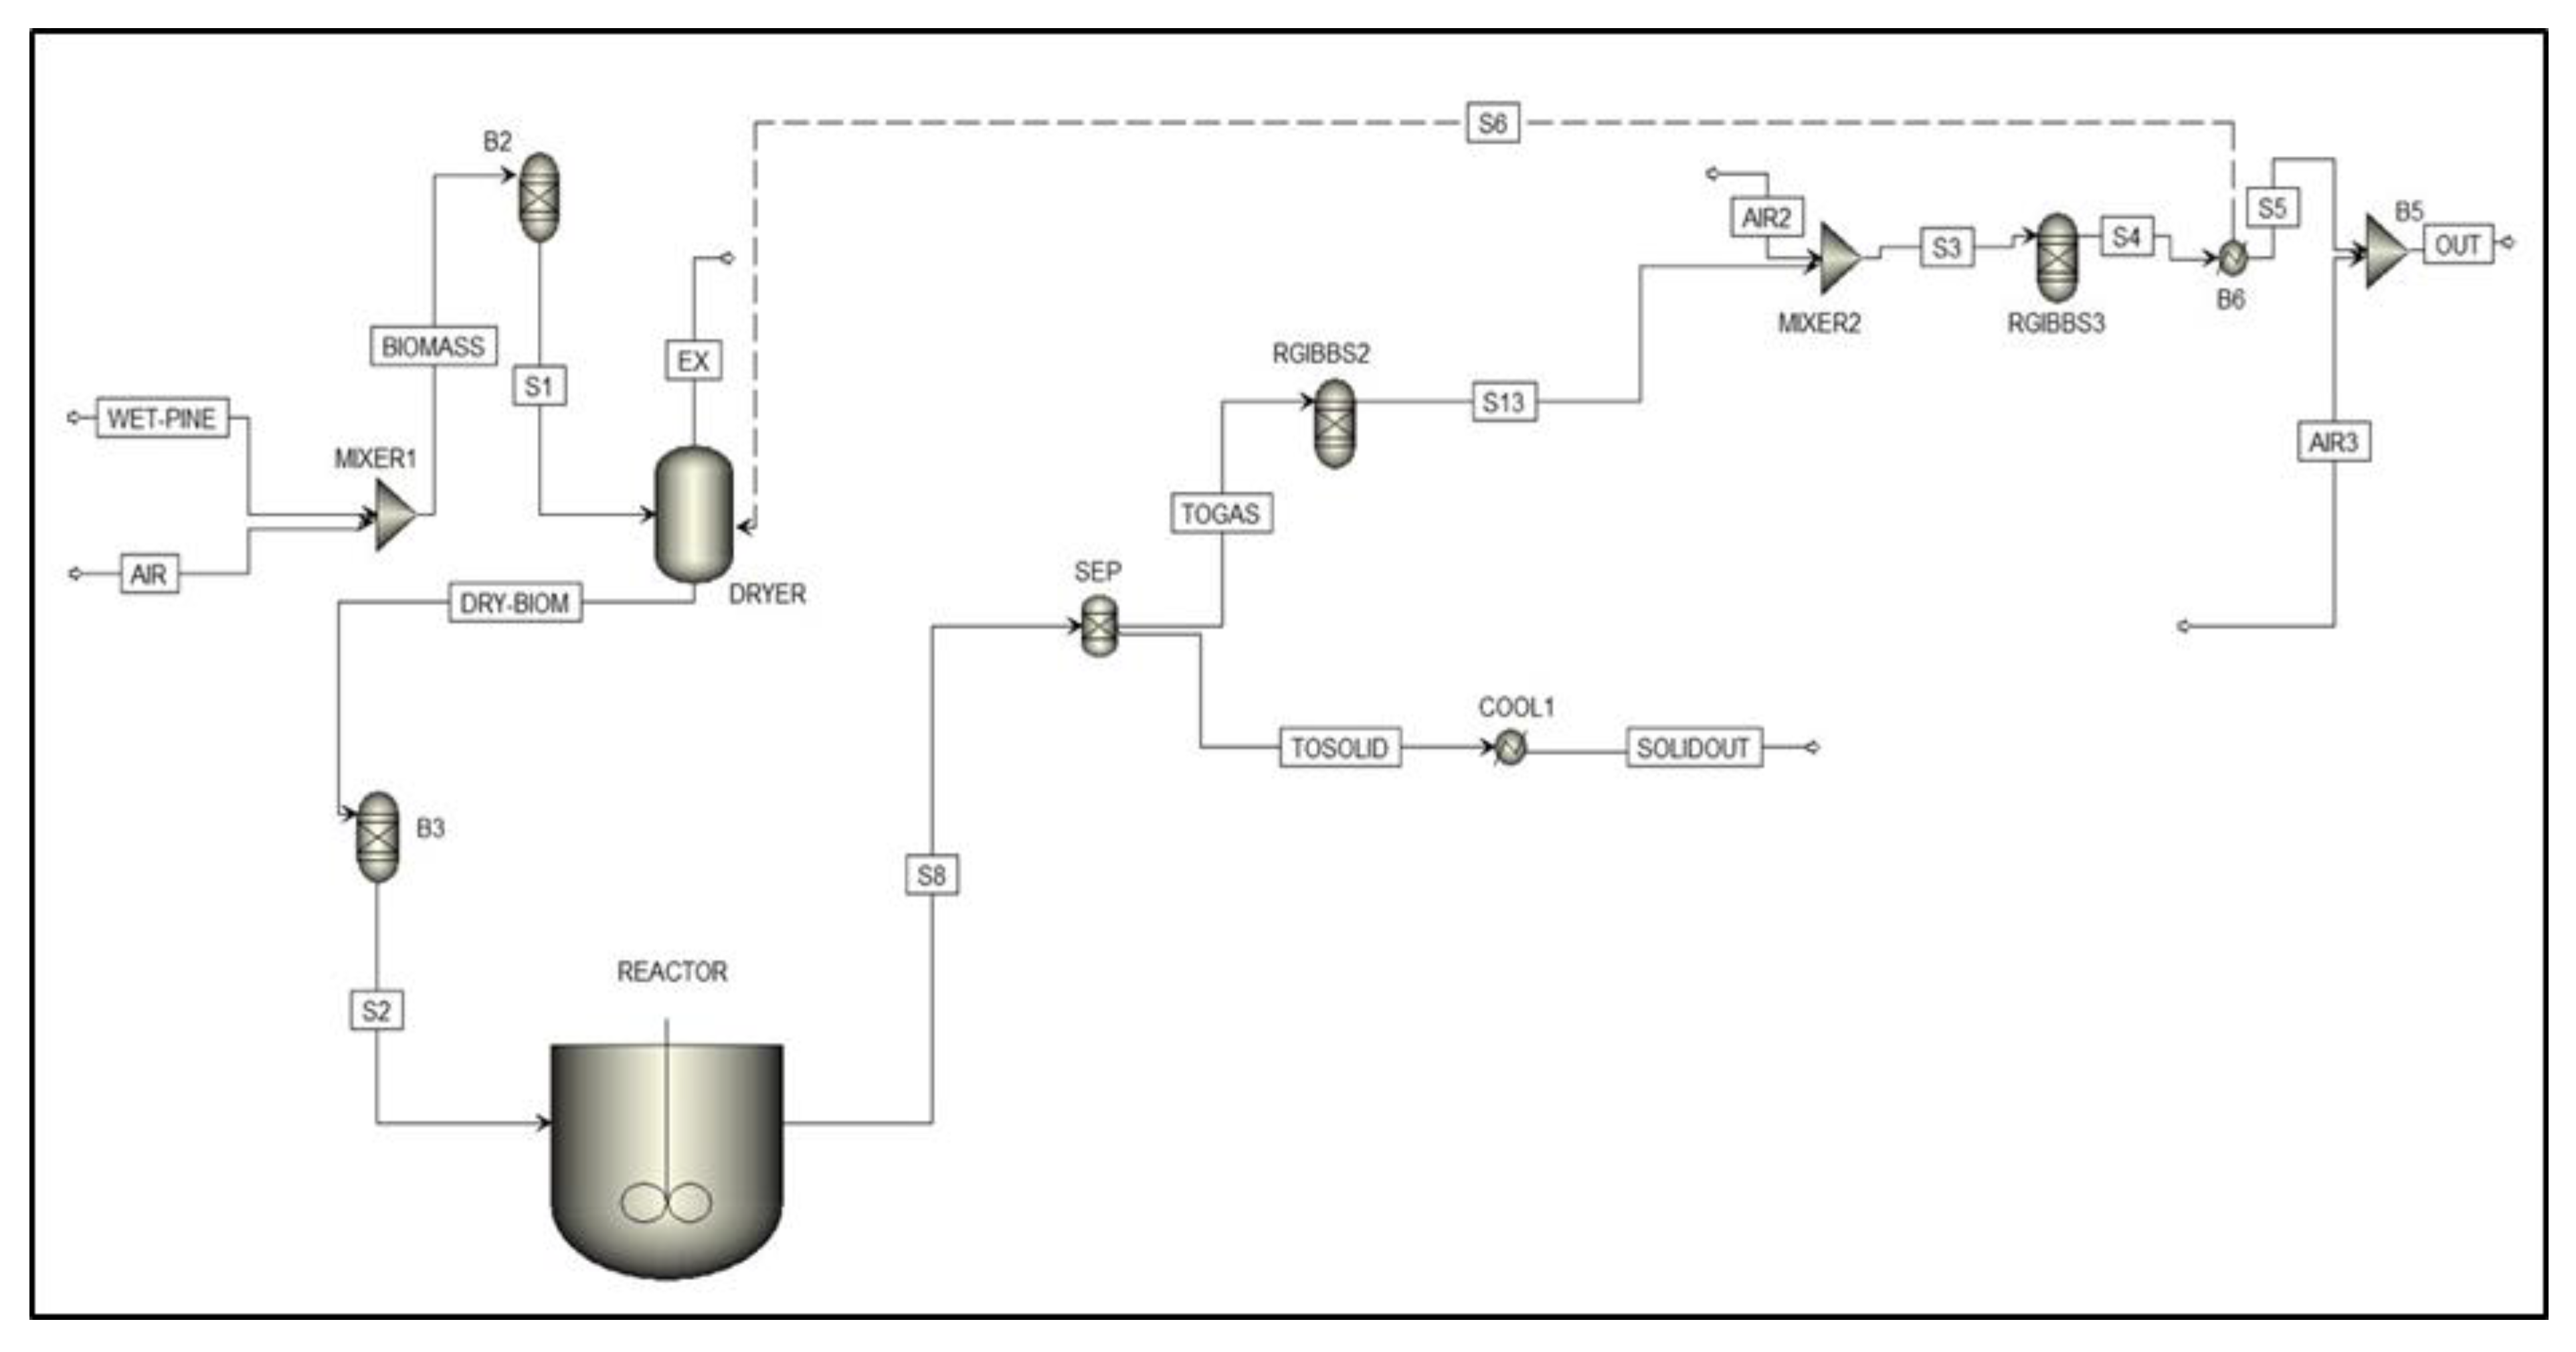
Process Flow Sheeting

The following general assumptions were held while constructing the simulation:
  • The process being continuous and steady-state, with the mechanical aspects of the equipment being disregarded. The model does not consider the movement of the material within the dryer or reactor.
  • The simulation process was conducted at atmospheric pressure (1 atm).
  • The air used for drying and combustion was at a temperature of 250 °C and 25 °C, respectively.
  • The ultimate and proximate analysis data were used to define the non-conventional biomass feedstock. For the enthalpy and density calculations, the solid property models of HCOALGEN and DCOALIGT for coal were used.
  • Due to the low or near atmospheric processing pressures (1 atm) and the presence of conventional gaseous compounds (such as H2O, CO, and CO2), the ideal gas law equation was adopted for calculating thermodynamic properties.
The sequential modular simulation of the process of torrefaction of the dried biomass with the utilization of Aspen PlusTM blocks is shown in the “torrefaction” section as:
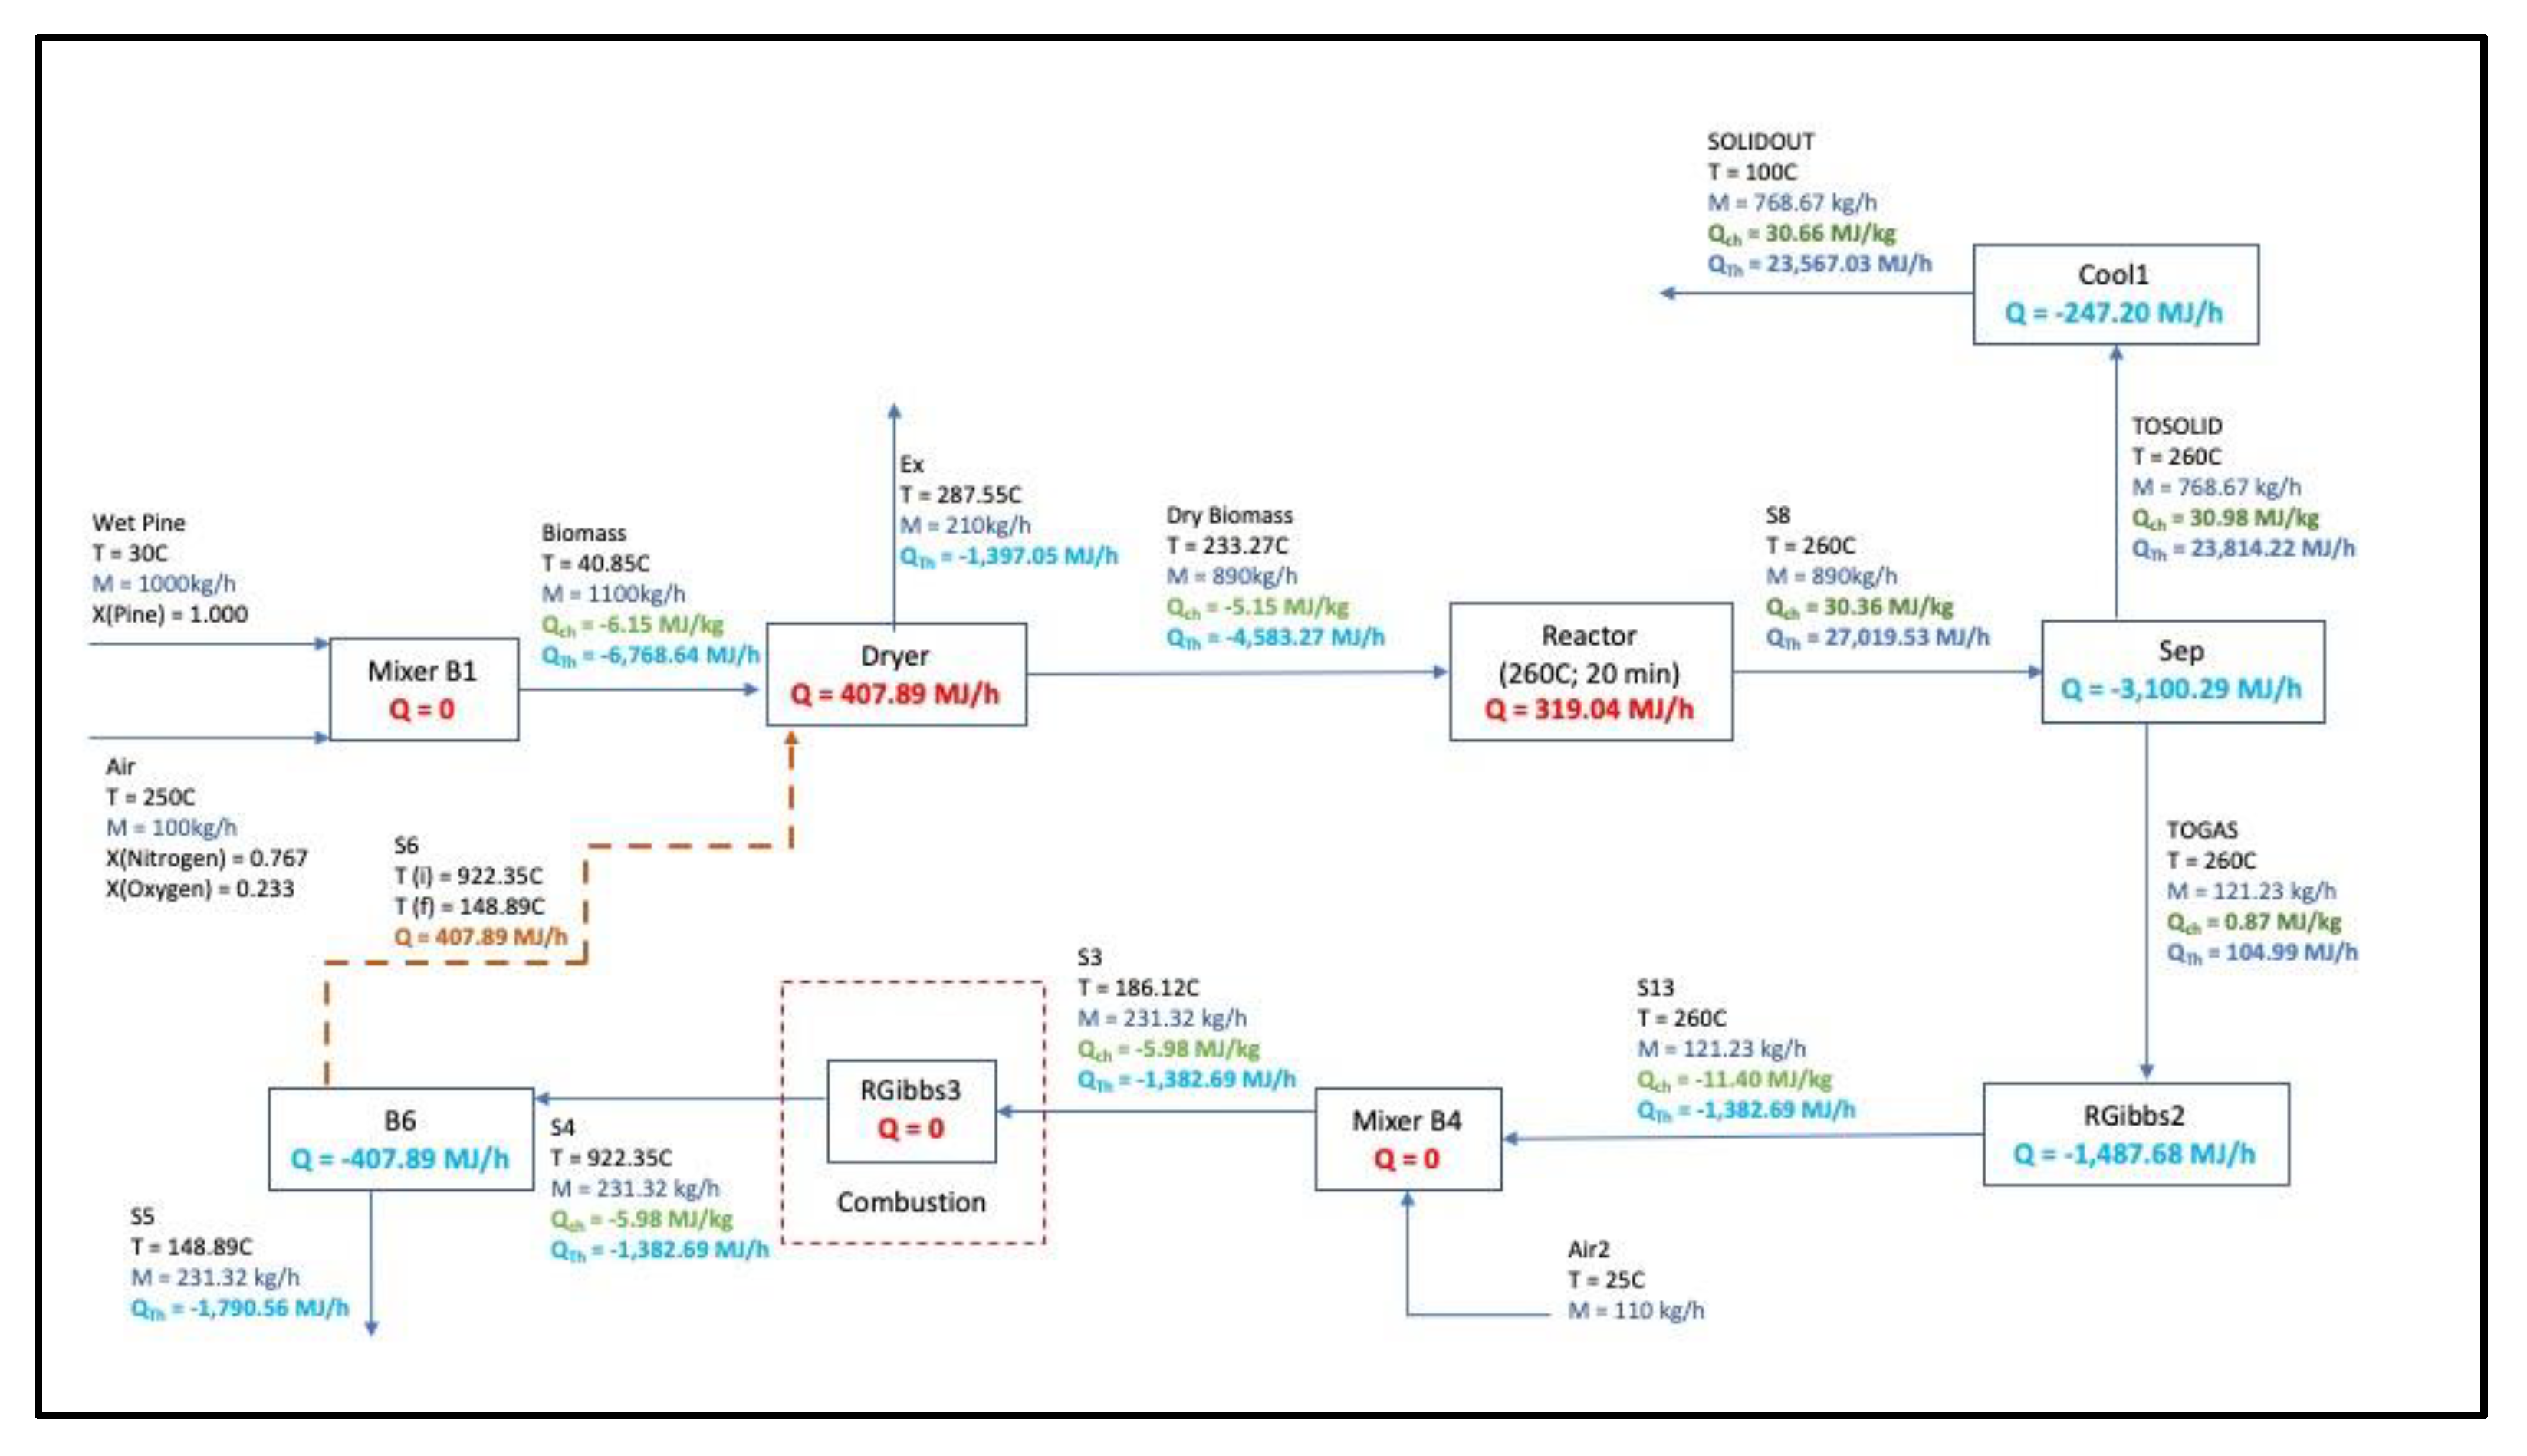
  • B2 is a first stage torrefaction with a RYield block to ensure the final drying of pine to 0% wt. moisture.
  • DRYER block separates the moisture from the biomass, which is subsequently released through the exhaust stream along with air.
  • B3 uses the elemental composition of the biomass to convert the incoming non-conventional dry biomass into a conventional form.
  • The reactor is a RCSTR block with a specified temperature and residence time. In this block, the kinetic model that was developed based on the experimental data was used to determine the yield of torrefied solid product. Reaction kinetic parameters are shown in Table 2.
  • SEP separates the solid torrefied product (TOSOLID) from torrefied gas (TOGAS).
  • RGIBBS2 recomposes the gaseous products in stream TOGAS from its elemental constituents.
  • B4, RGIBBS3, and B6 are used in the combustion section. Exhaust gases after torrefaction are mixed with air to ensure the complete combustion of the torrefied gases. The heat generated from combustion is then recycled into the dryer to minimize the energy requirement for the drying process.
  • Final step involves the cooling of both TOGAS and torrefied solids. This section is implemented in Aspen Plus™ by means of conventional “heat exchanger” blocks (Figure 2). After combustion, the torrefied gases are mixed with air. This dilutes the exhaust gases and decreases the temperature before releasing them into the atmosphere.

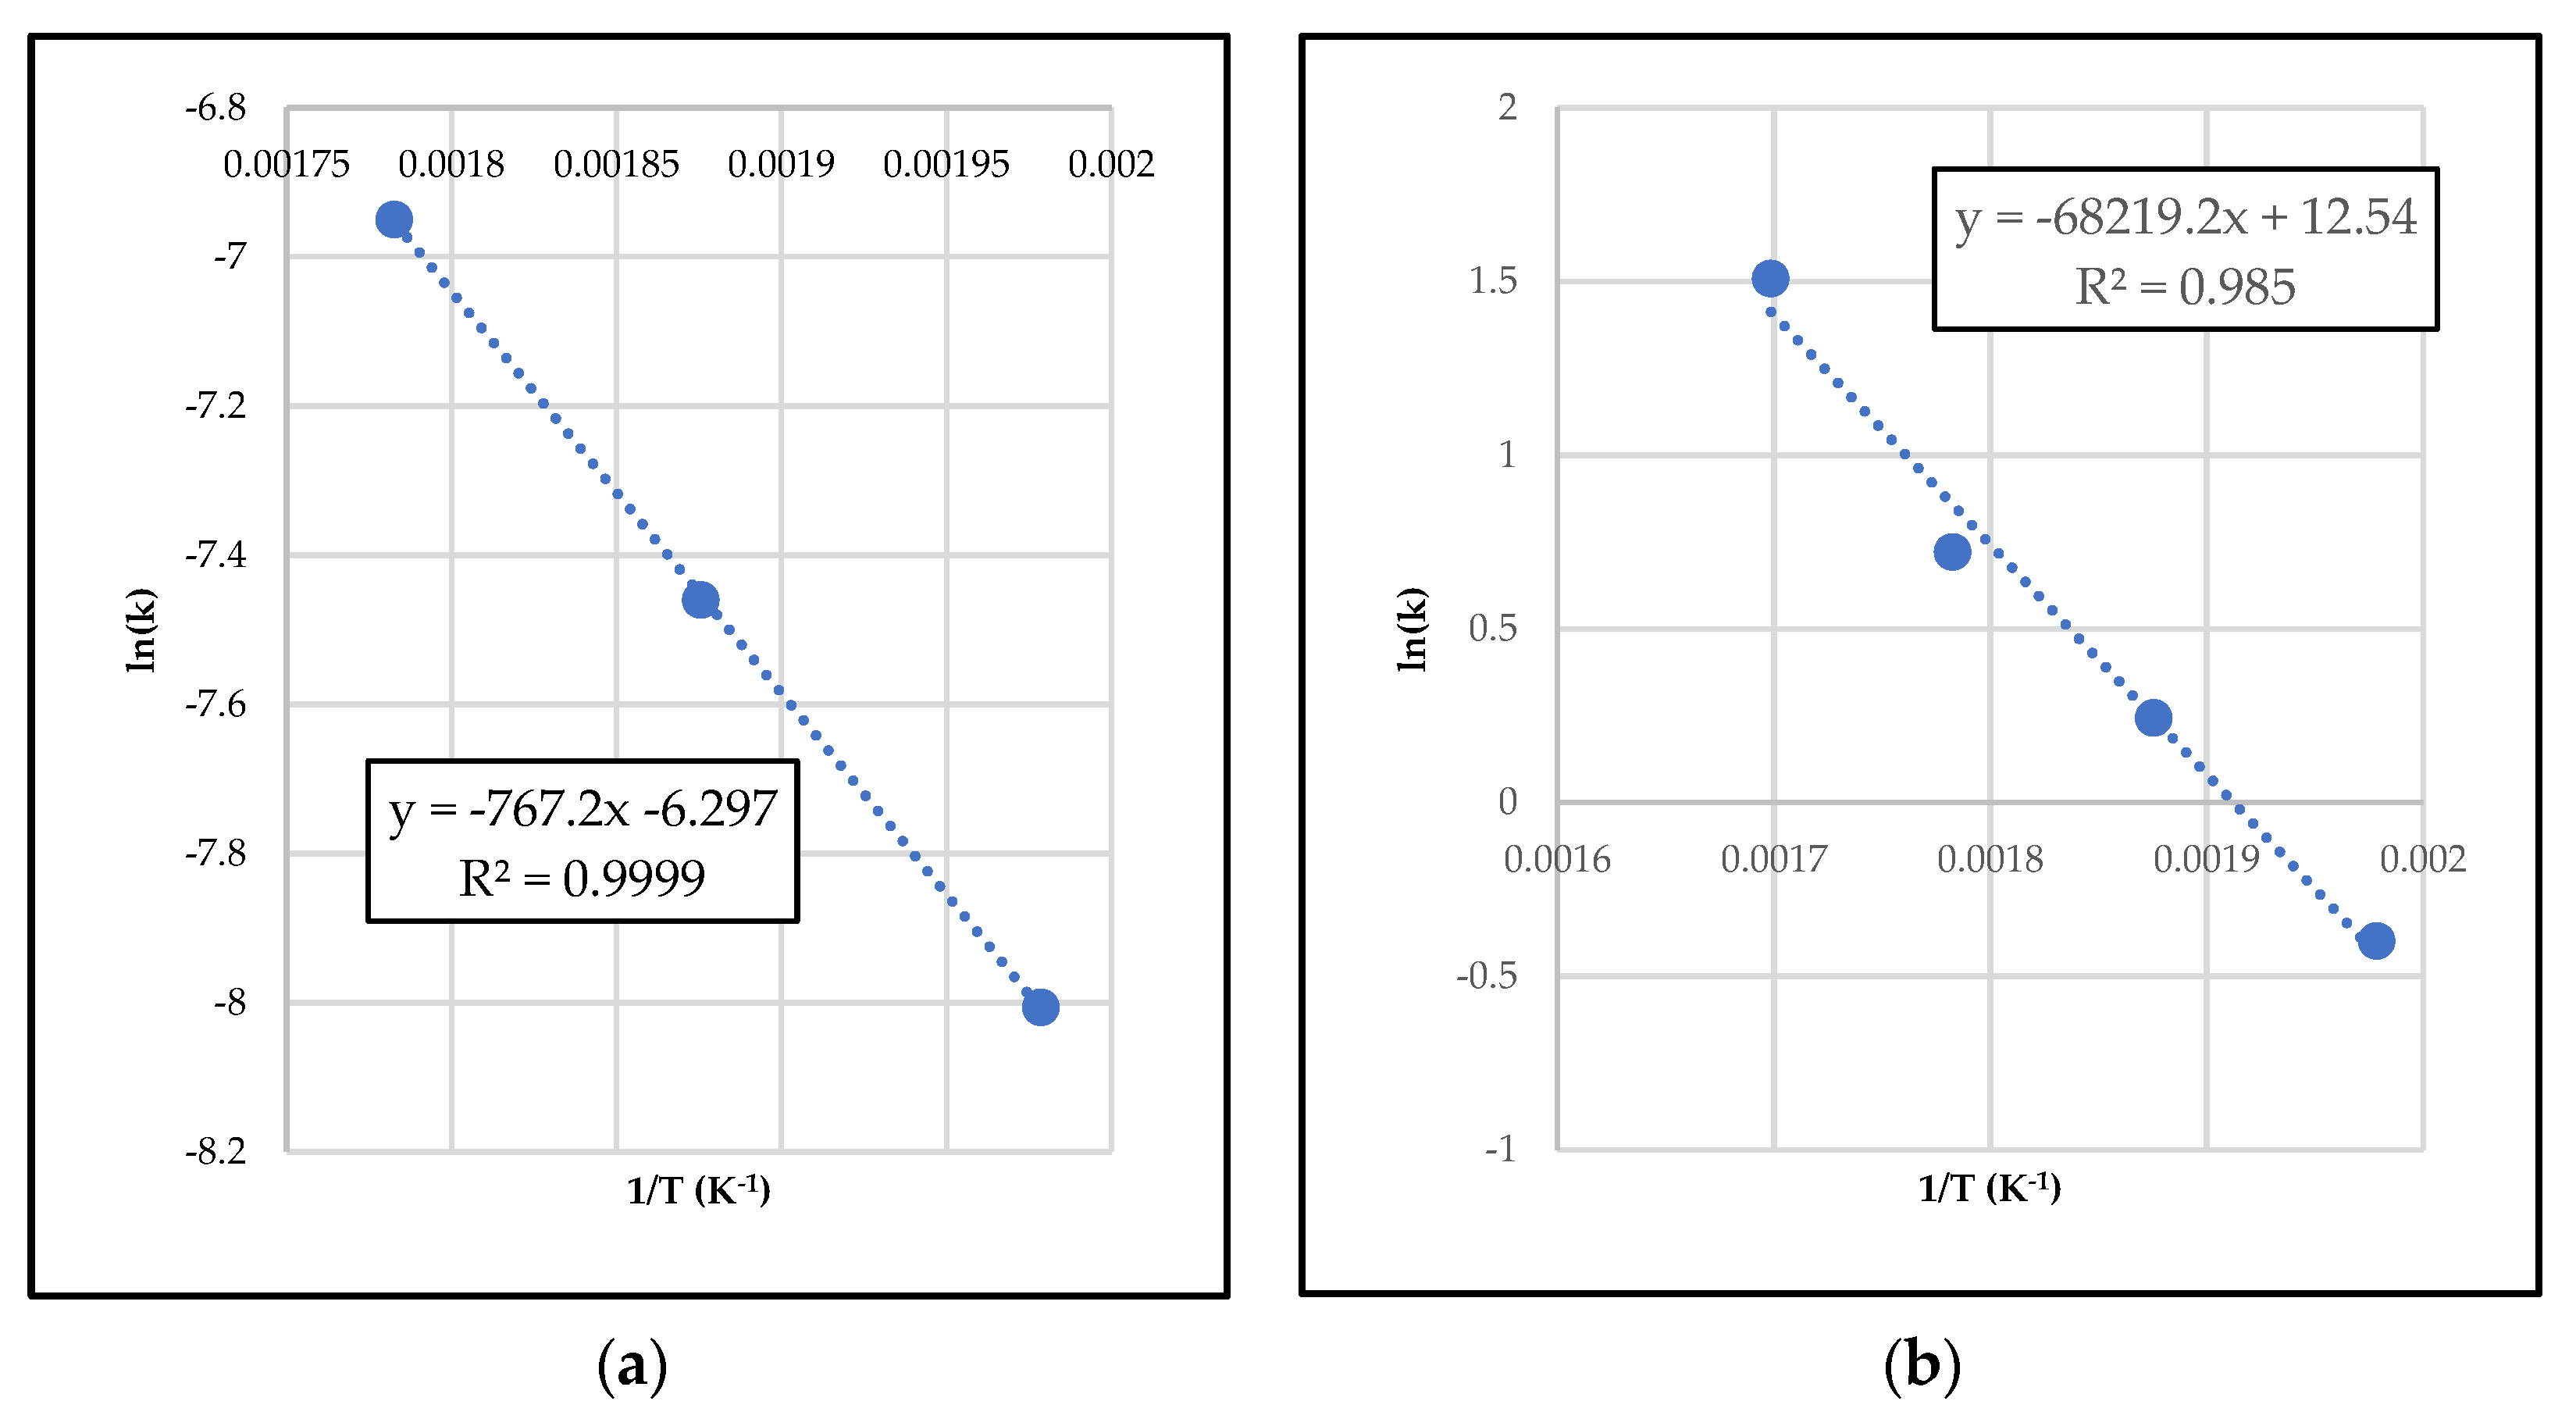
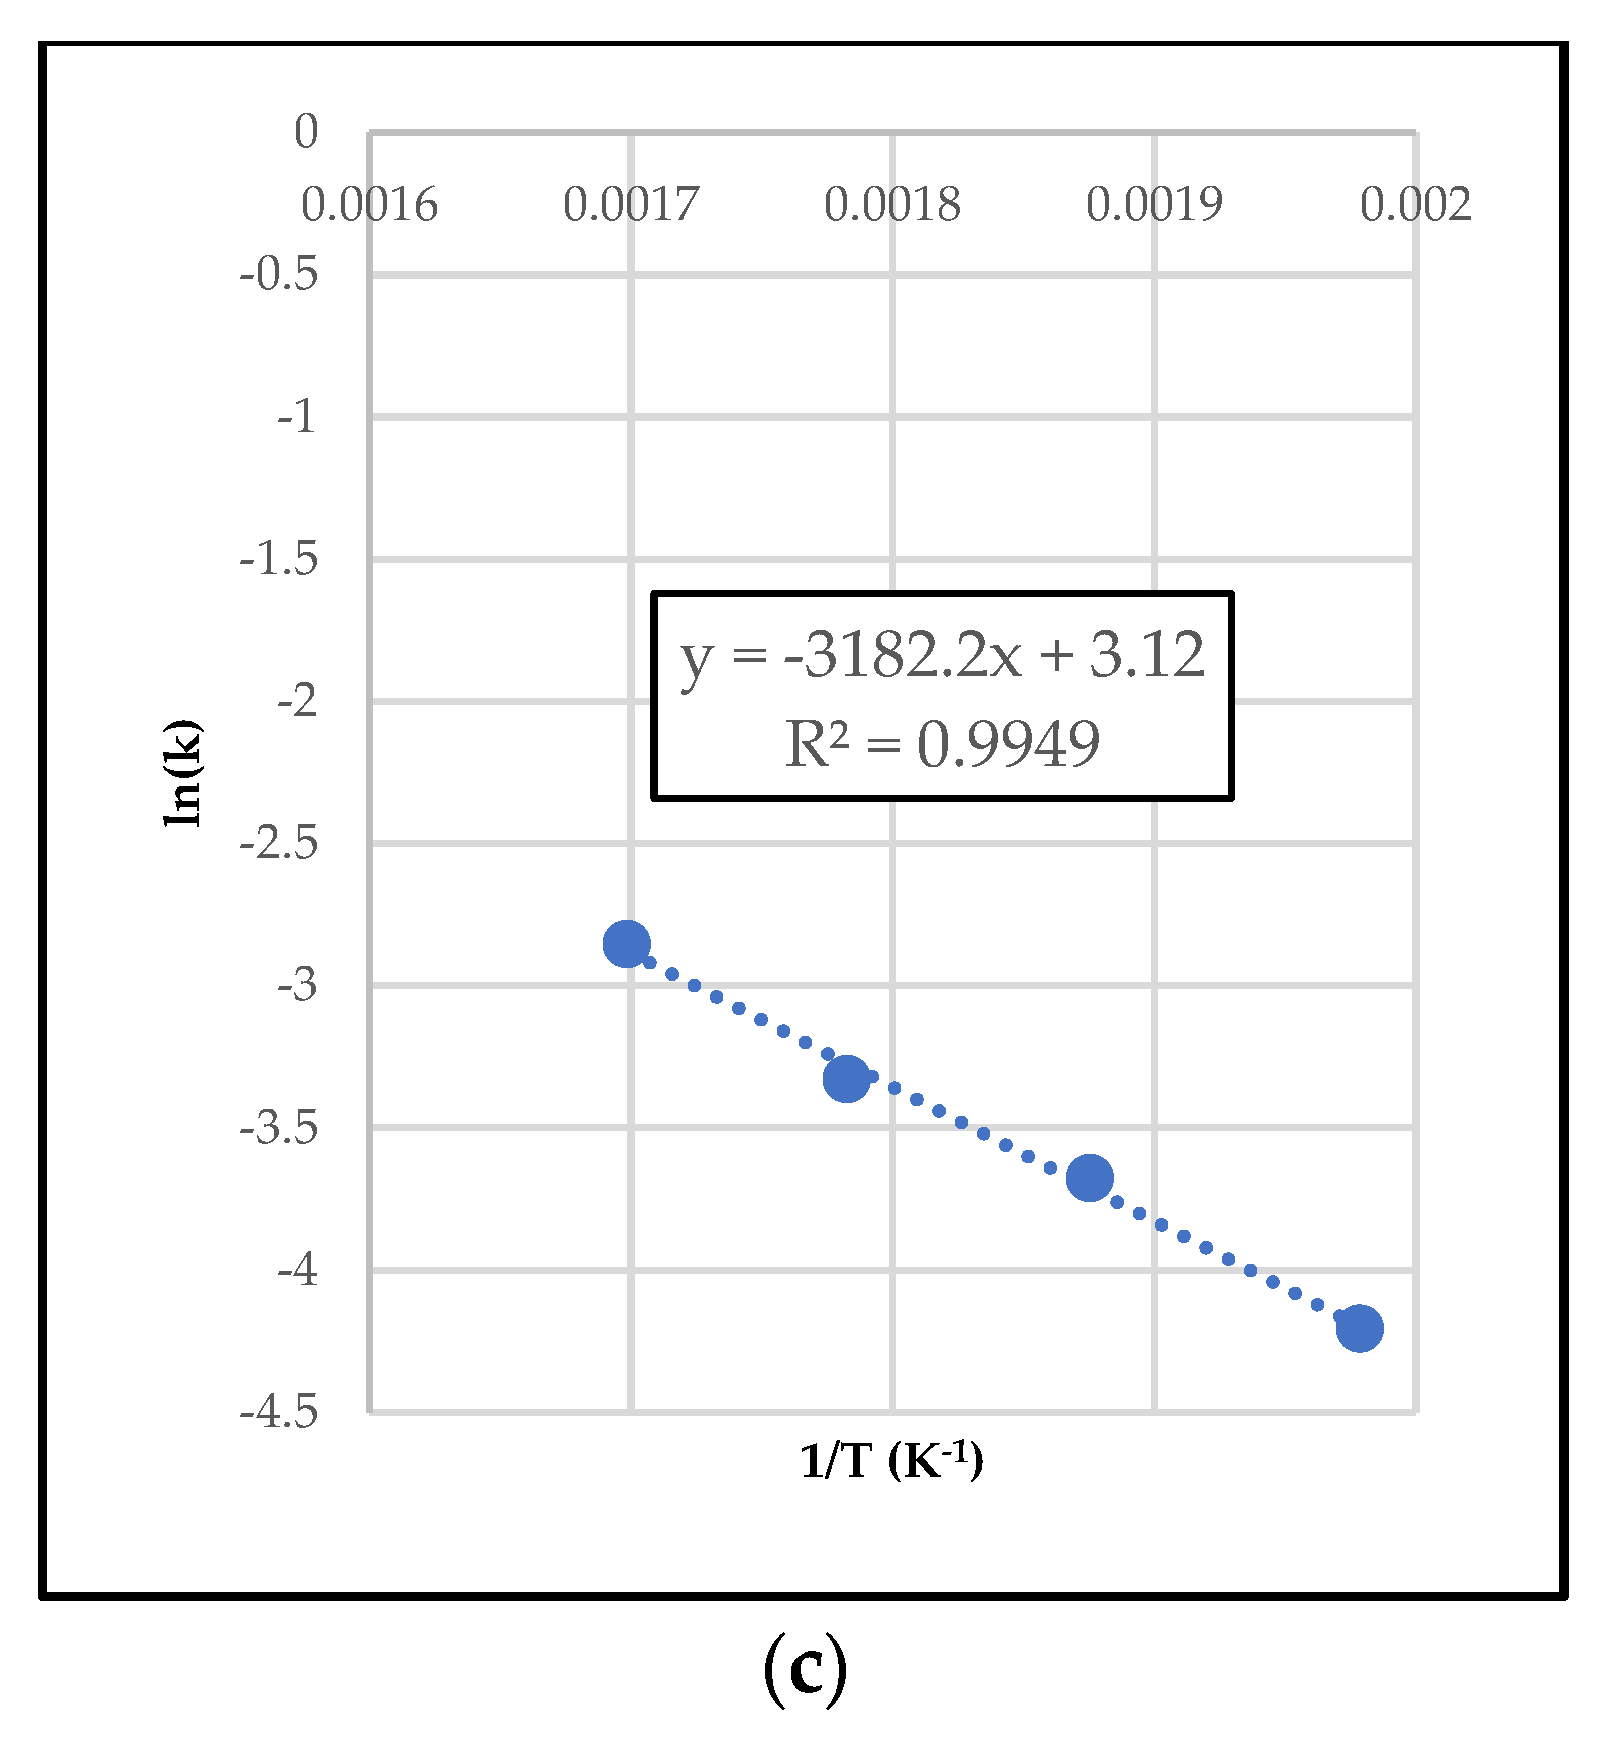
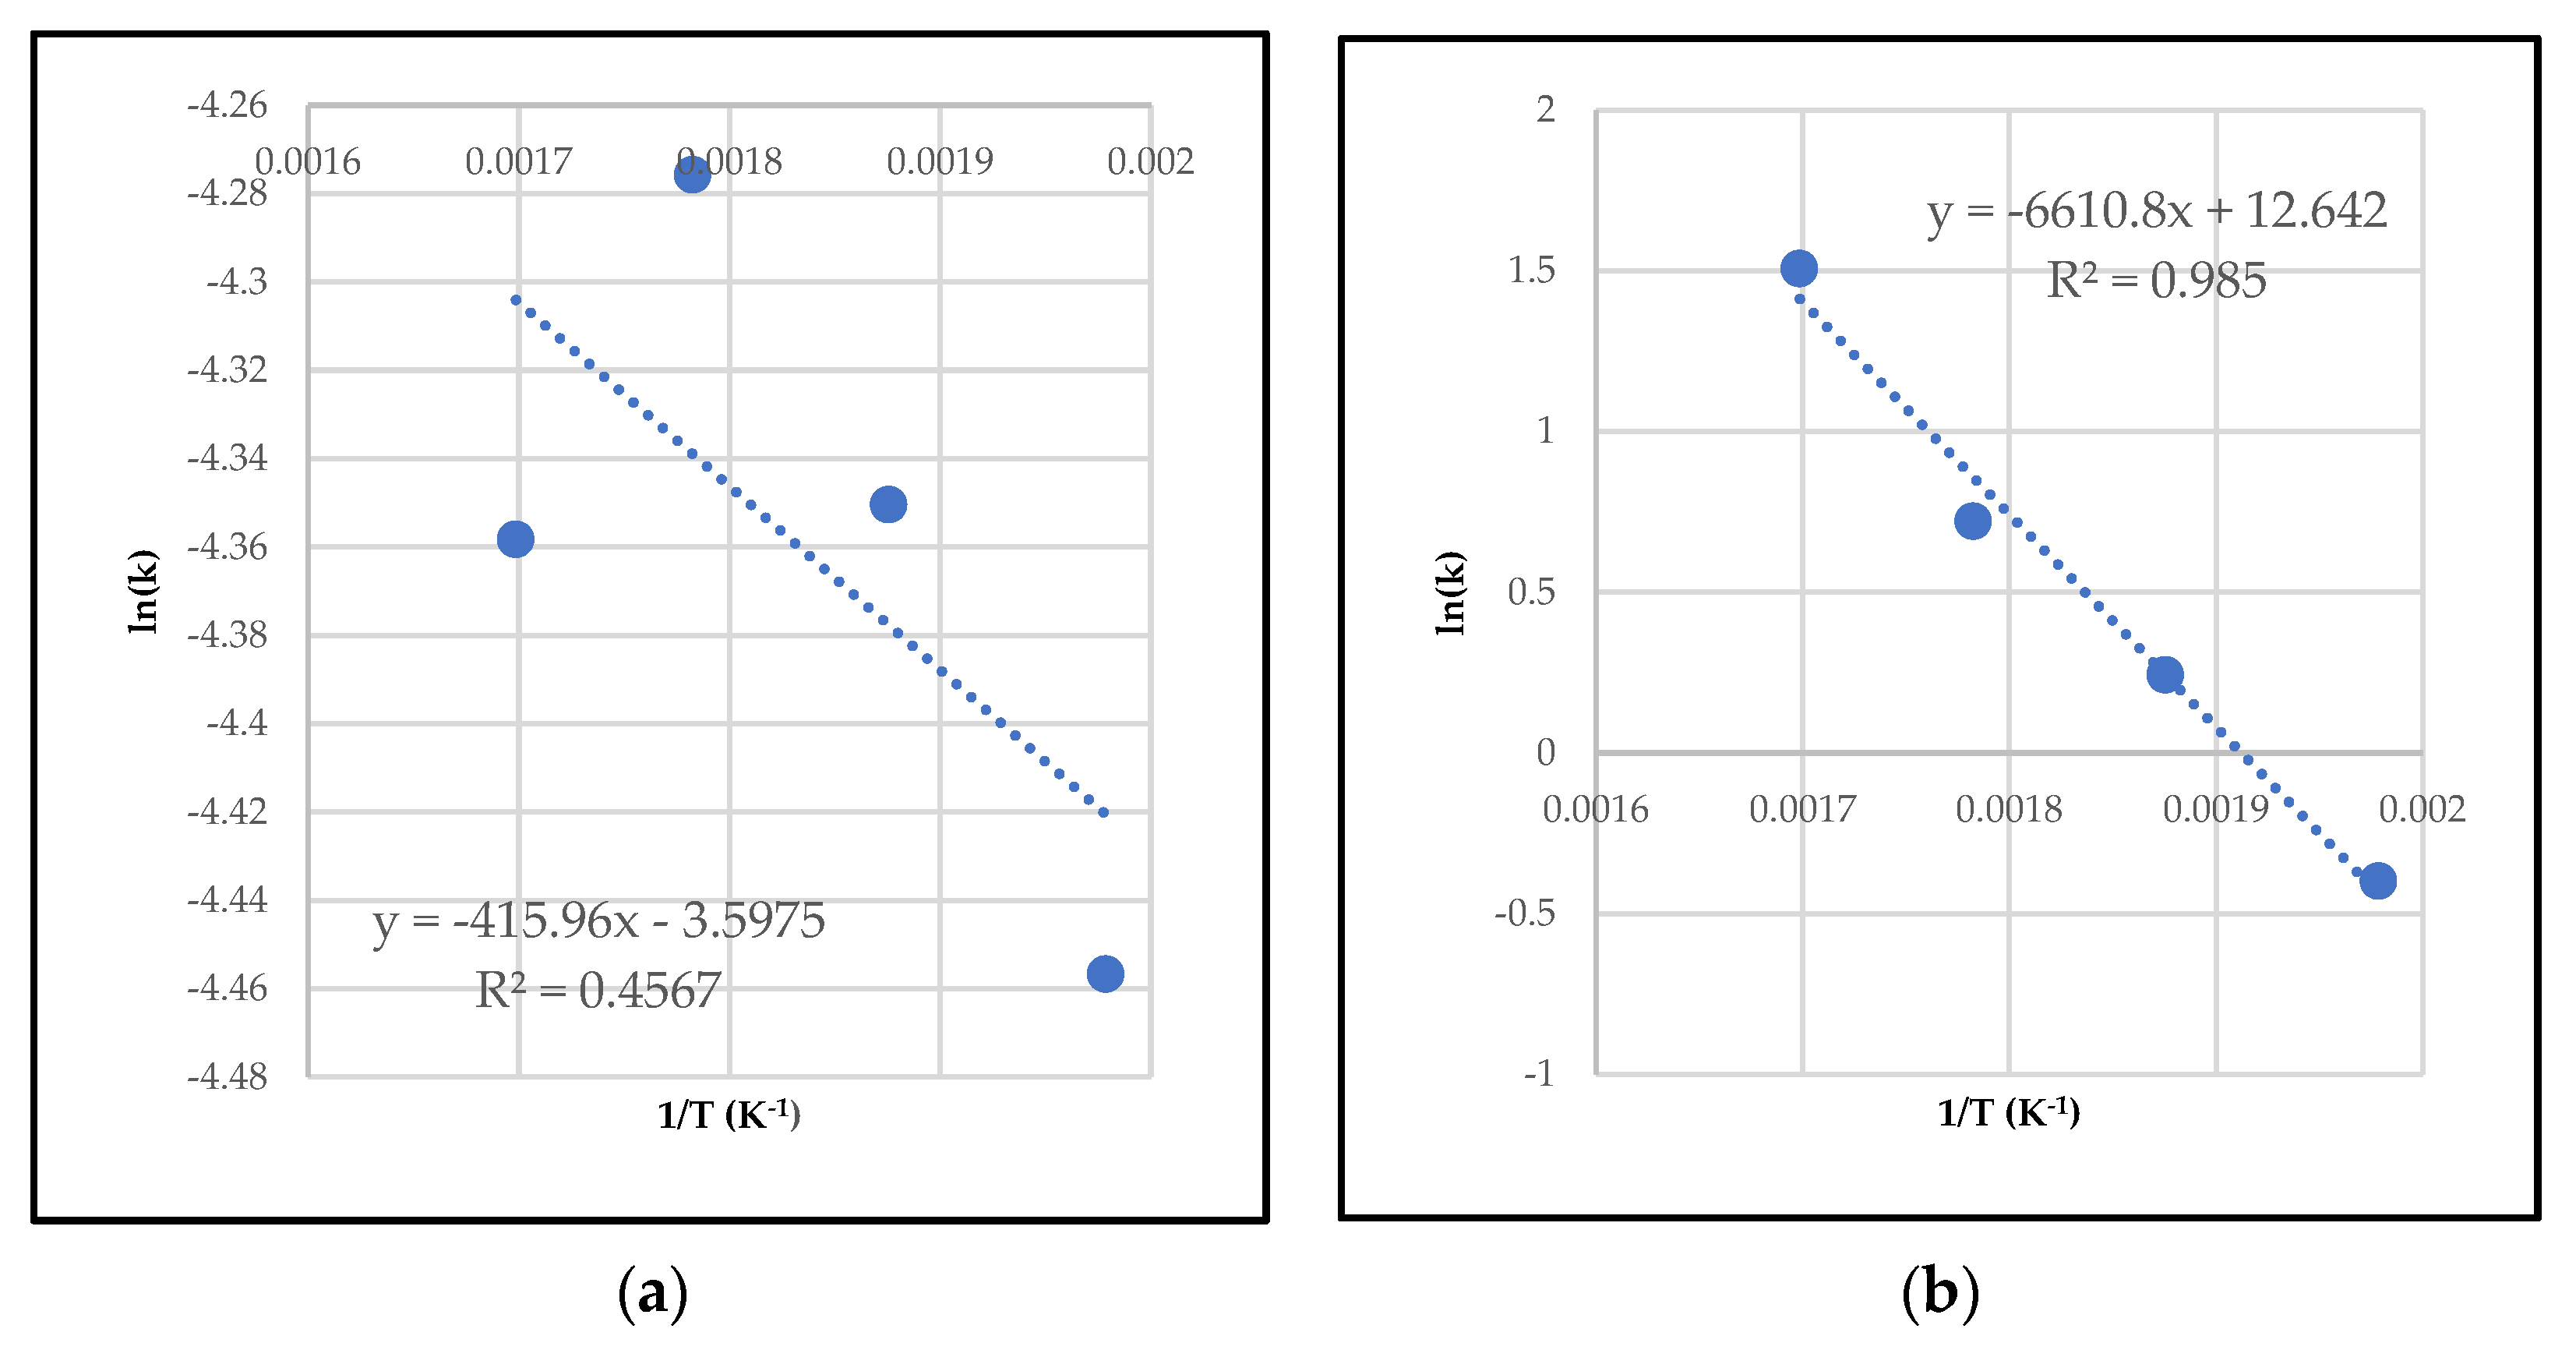
2.3. Torrefaction Kinetic Modelling

2.3.1. Differential Method of Rate Law

Differential rate laws express the rate of reaction as a function of a change in the concentration of one or more reactants over a specified time interval. These rate laws help in determining the reaction (or process) by which the reactants turn into products. The differential form of reaction is expressed as:
d C A d T = r A = k C A α  
In the kinetic modelling, it was assumed only solids were present at the initial condition of torrefaction and the kinetic rates are based on the ultimate analysis of the feed. The kinetic reaction rates were represented by the Arrhenius equation where it consists of two parameters, namely the pre-exponential factor (A) and the activation energy (Ea). The kinetic models were implemented as power-law type kinetic expressions with the reaction rate calculated in Aspen PlusTM by Equation (1), where r is the rate of reaction, A is the pre-exponential factor, T the absolute temperature, Ea the activation energy, and R is the gas constant. The value of k (reaction rate constant) and α (reaction order) were predicted using polymath non-linear regression (L-M) at each temperature. For each temperature, the value of α was fixed and the value of k was predicted. The method was repeated until a constant value of k with adjusted R2 value above 0.9 was obtained. The kinetic parameters for the reaction temperatures 232–288 °C (450–550 °F) are shown in Table 2. The Arrhenius plots of these data are shown in Figure 3a–c. The slopes and intercepts were calculated by linear regression using excel and were utilized for obtaining the values of the activation energy and the pre-exponential factor. Polymath regression analysis data are provided in the supplementary material (Figures S1–S6).
Ln k = E a R T + ln A
R e a c t a n t k P r o d u c t
R e a c t i o n   T i m e ,   t m i n = C a o 1 α C a 1 α / k 1 α
r C a r b o n = k 1 ( C c a r b o n ) α
r O x y g e n = k 2 ( C O x y g e n ) α
r H y d r o g e n = k 3 ( C H y d r o g e n ) α

2.3.2. Integral Method of Rate Law

Integrated rate laws express the rate of reaction as a function of the initial concentration and a measured concentration of one or more reactants after a specific amount of time (t) has passed. They are used to determine the rate constant and the reaction order from experimental data (Kissinger, 1957). The concentration in terms of mole fractions of each component were calculated on a basis of 1 g of biomass, and the final value was obtained after multiplying with the solid yield. In this study, an integral method was utilized to determine the reaction order. Experimental results for carbon, oxygen, and hydrogen were studied, and results were fitted to zero-order, 1st order, 2nd order, and 3rd order reactions. The value of R2 for the linear regression was used to determine which reaction order was most applicable to the tested dataset. The equations for each reaction order are shown in Table 3. The Arrhenius plots for the corresponding reactions are shown in Figure 4a–c. The Arrhenius plots for the other reaction orders (zero—2nd order) are provided in the supplementary materials (Figures S7–S9).
The reaction kinetics for the formation of torrefied solid products, and experimental correlations (Equation (11)) providing the dependence of torrefaction operating conditions on the conversion of the elemental constituents carbon, hydrogen, and oxygen, as well as the HHV, was derived from experimental data. The correlation parameters for the HHV were predicted using polymath non-linear regression (L-M), and Equation (12) was developed.
H V   B T U l b ,   d b = 237.4014 C 505.1785 H + 19.69328 O 5805.122 N A d j u s t e d   R 2 = 0.9434  
M a s s   Y i e l d   M Y = 0.0221 C + 0.071 H + 0.098 O 11.057 N A d j u s t e d   R 2 = 0.9146
E n e r g y   y i e l d   E Y = M Y d b H H V   o f   t o r r e f i e d   b i o m a s s H H V   o f   r a w   b i o m a s s

2.4. Simulation Runs and Data Validation

The simulation data generated was compared with the experimental results obtained from the torrefaction pilot-scale unit at four different temperatures—232, 260, and 288 °C, respectively, and three residence times—16, 20, and 24 min, respectively. A standard error of 5% was applied on the experimental data to clearly distinguish the deviations between the simulation results and the experimental data. Both the differential and integral methods were used to determine the reaction order for each elemental species. The results presented are based on the predicted activation energy and the pre-exponential factors shown in Table 2 using the differential method of rate law. These parameters were found to be the most suited for this study based on the data fitting and comparison to the experimental results.

3. Results

3.1. Proximate and Ultimate Analysis of Pine

Proximate and ultimate analysis of pine used in this study are presented in Table 4. This compositional data was used in the Aspen simulation. Proximate and ultimate analysis of torrefied pine obtained at various operational conditions are presented in Tables S2–S4.

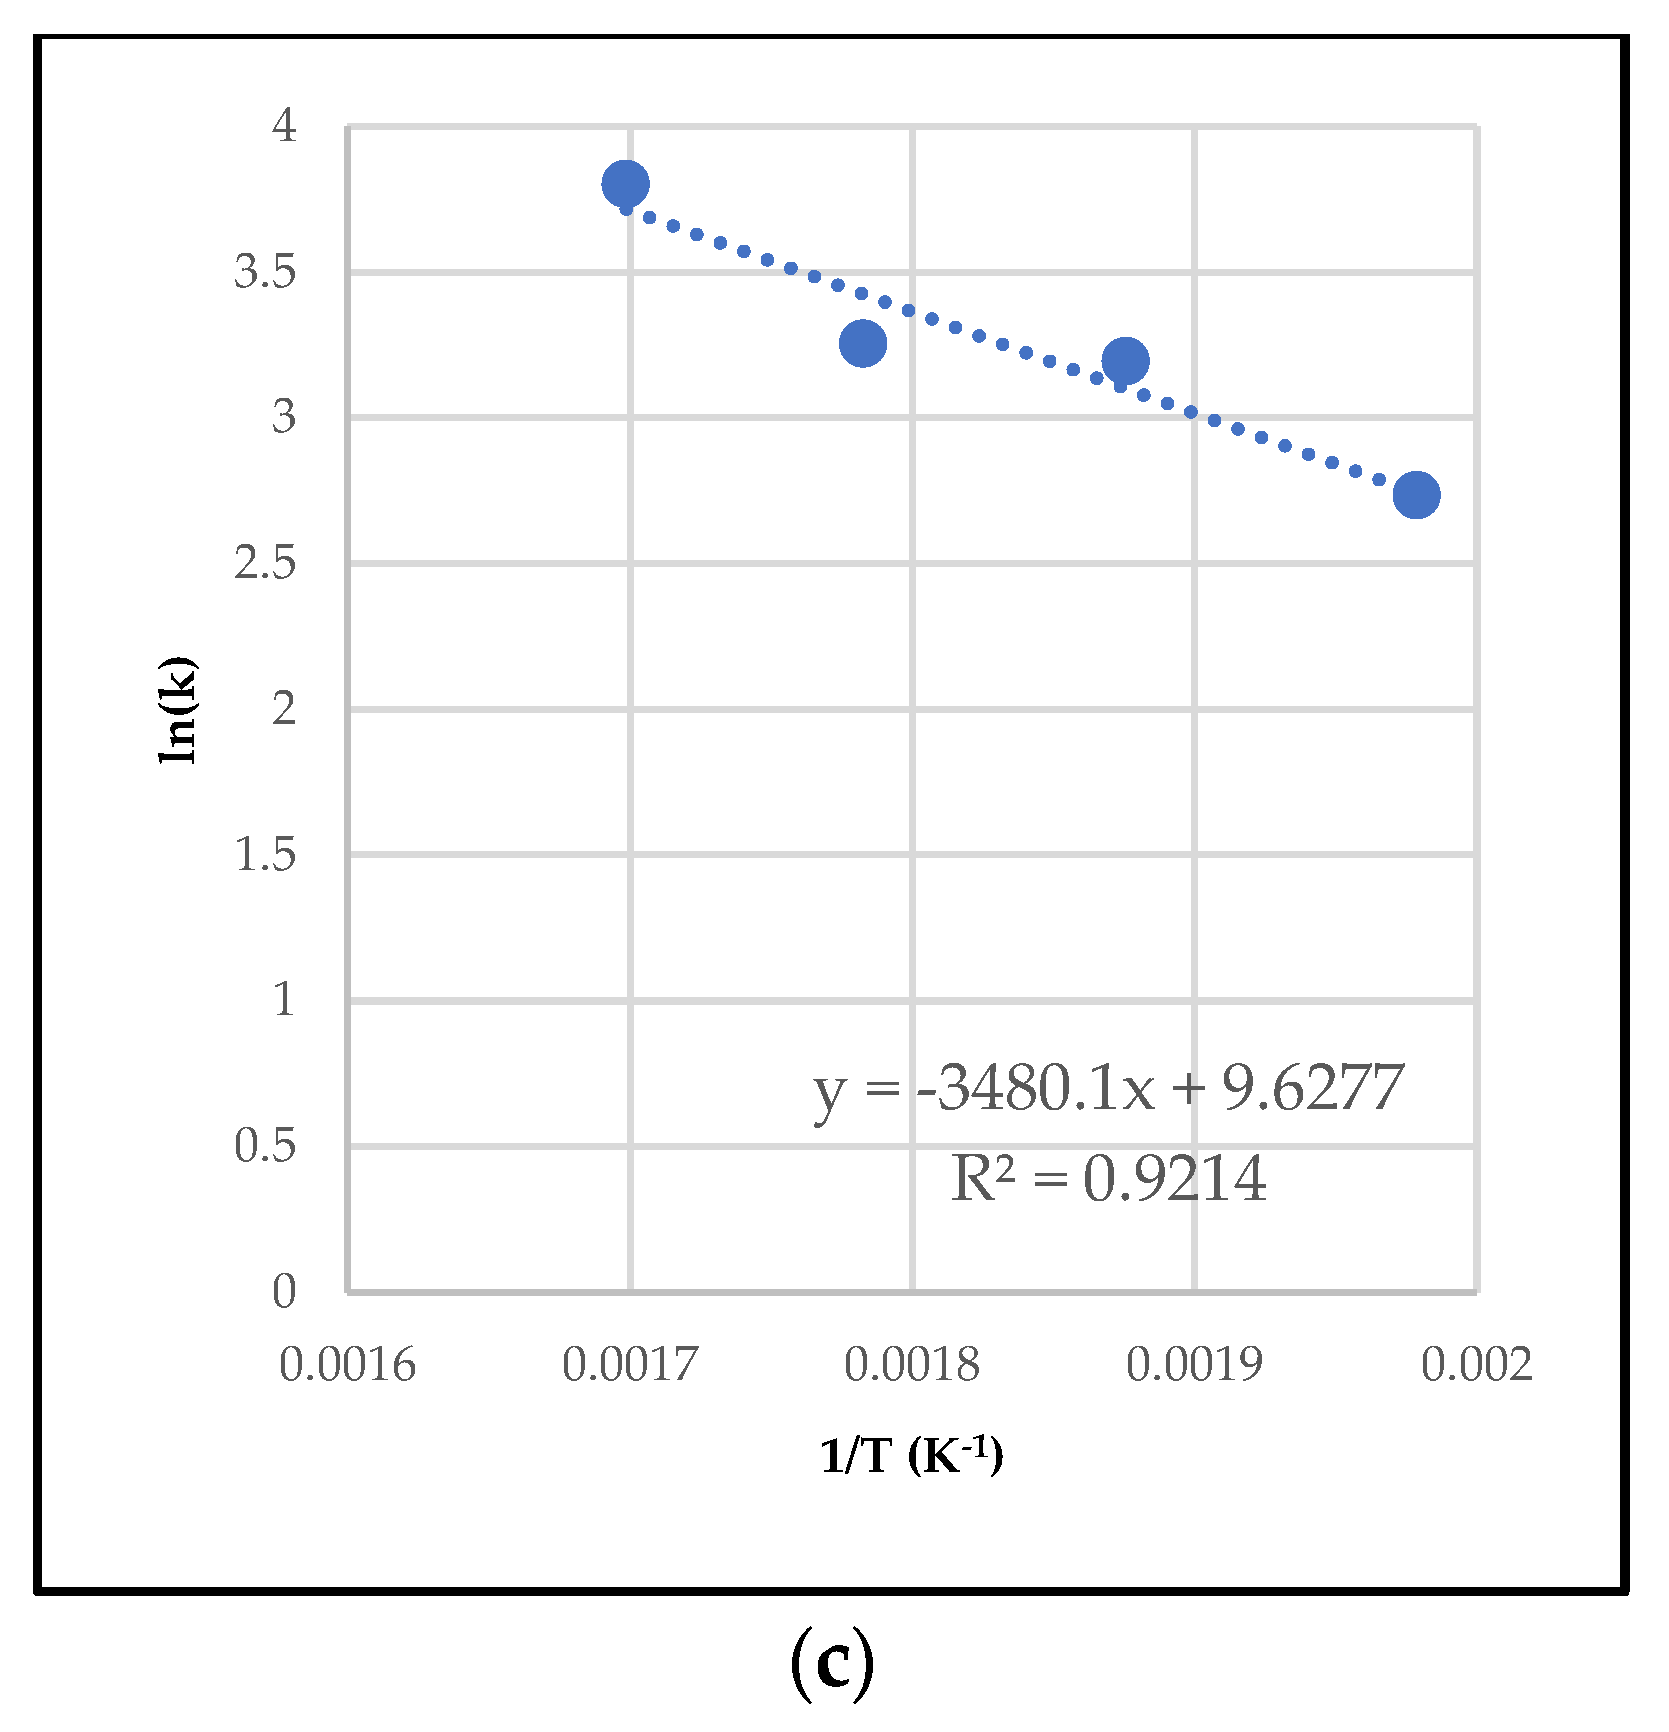
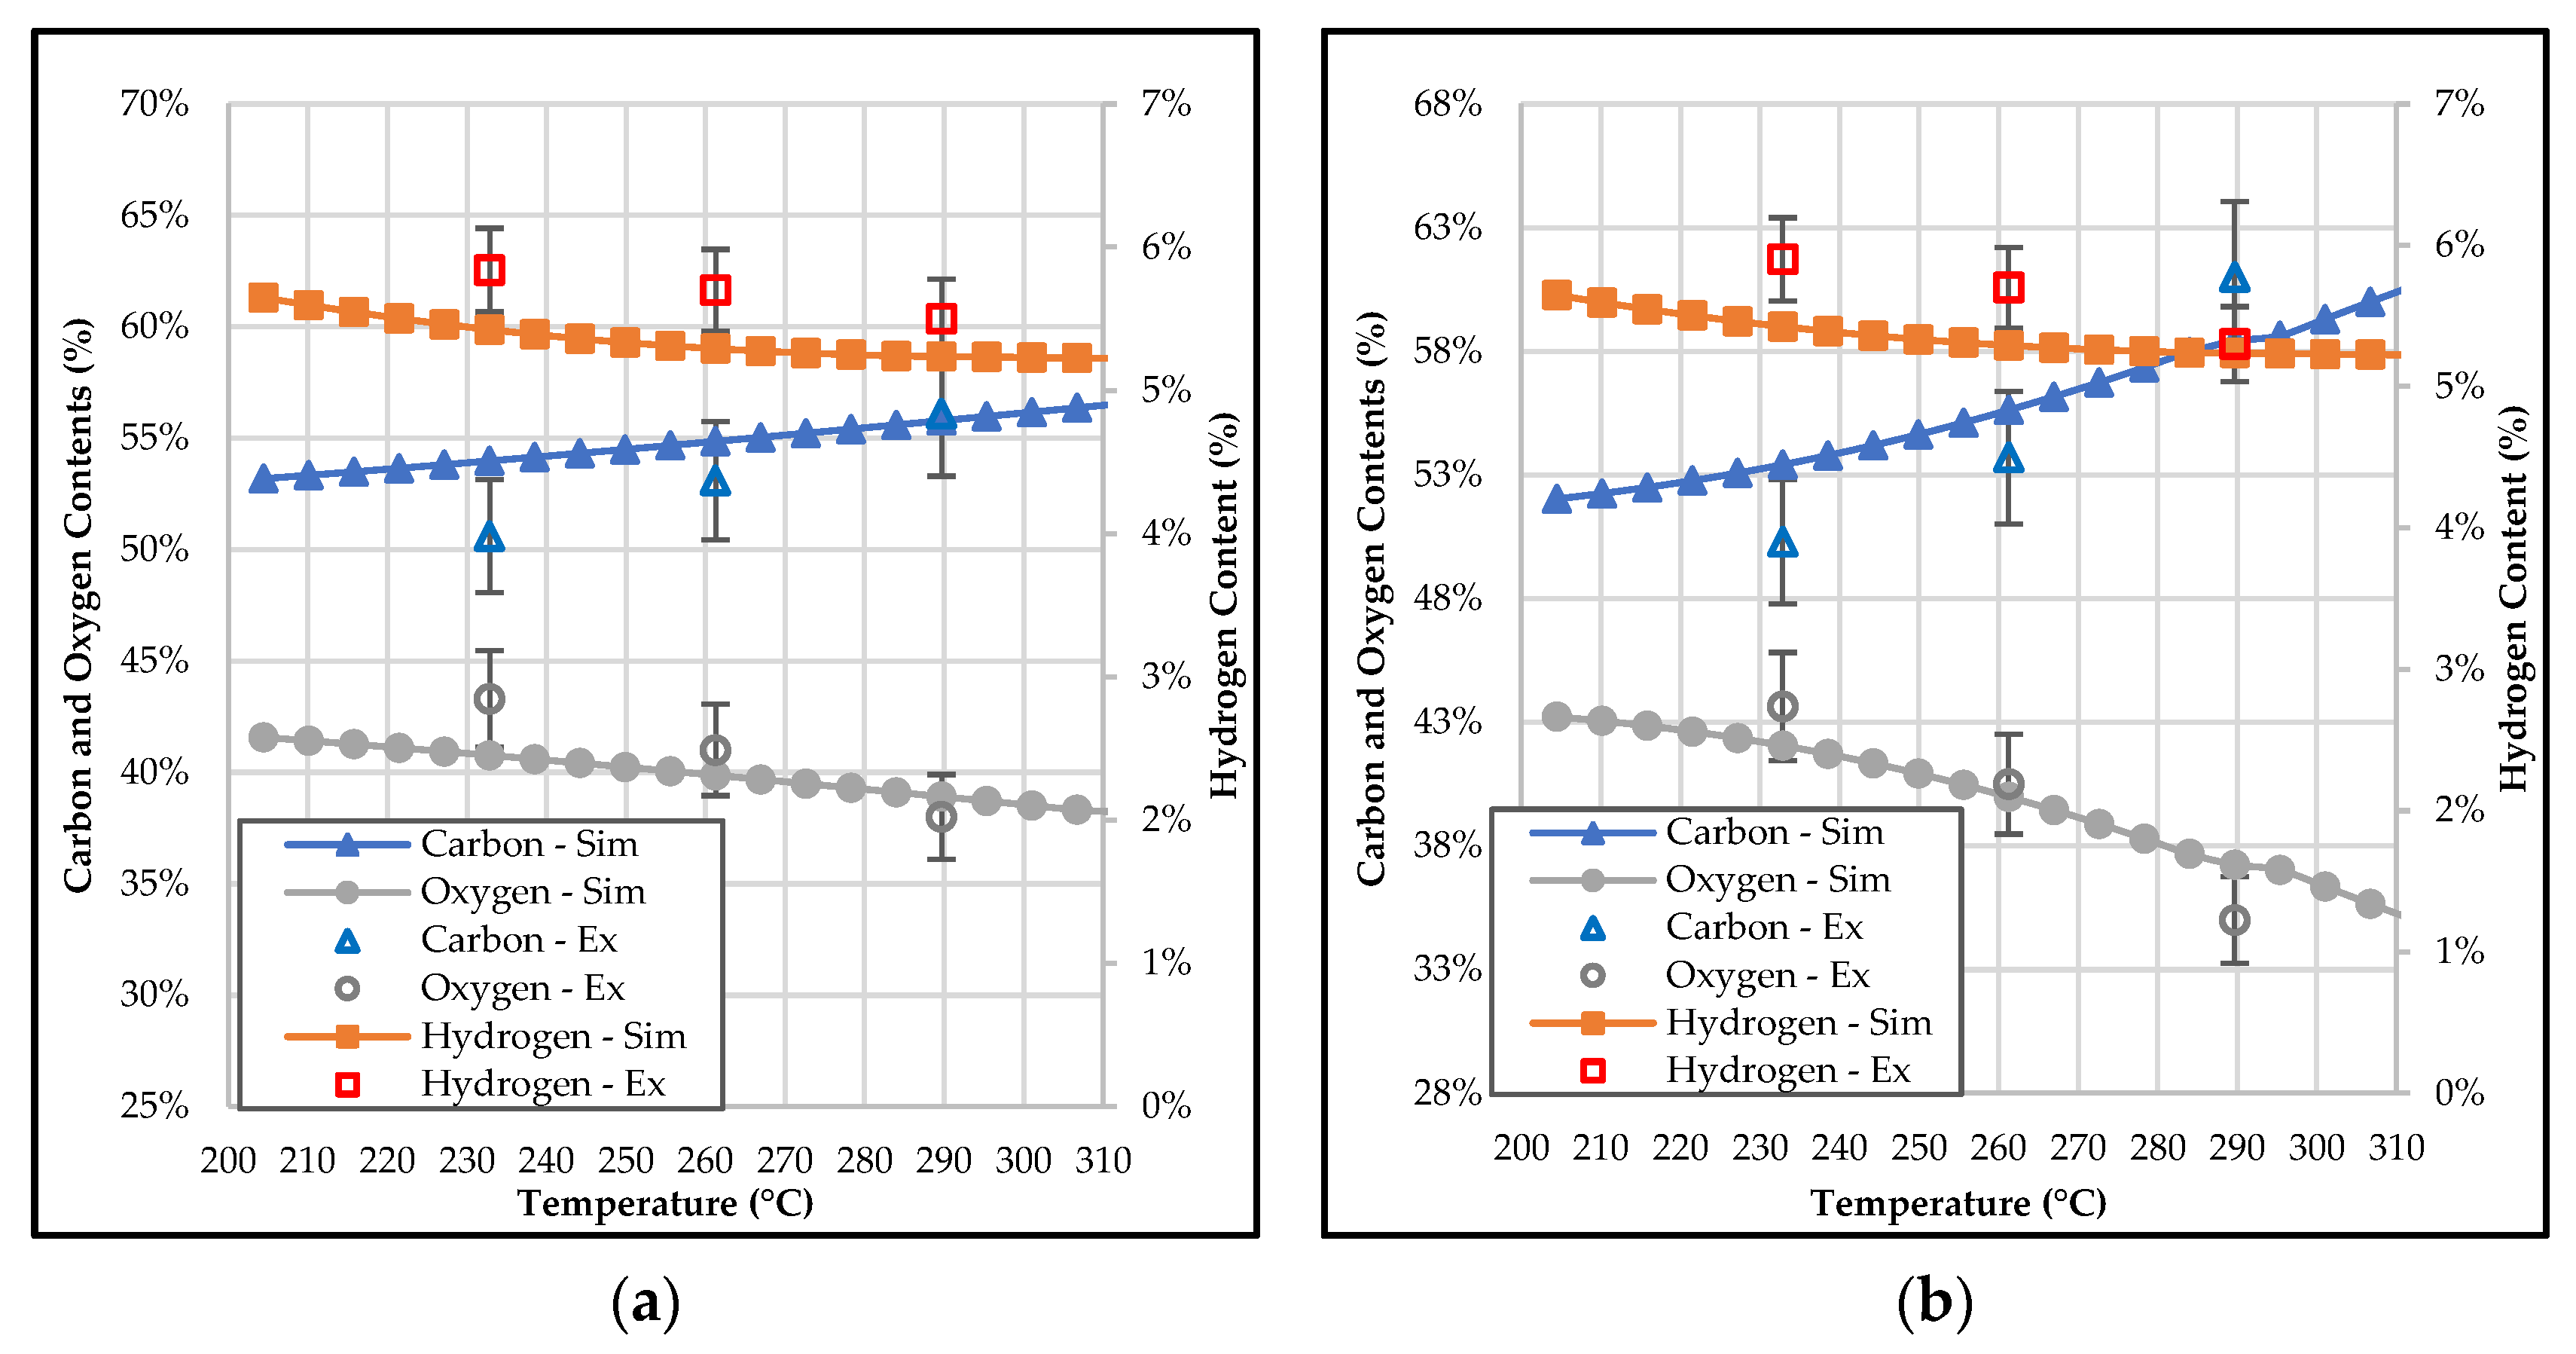
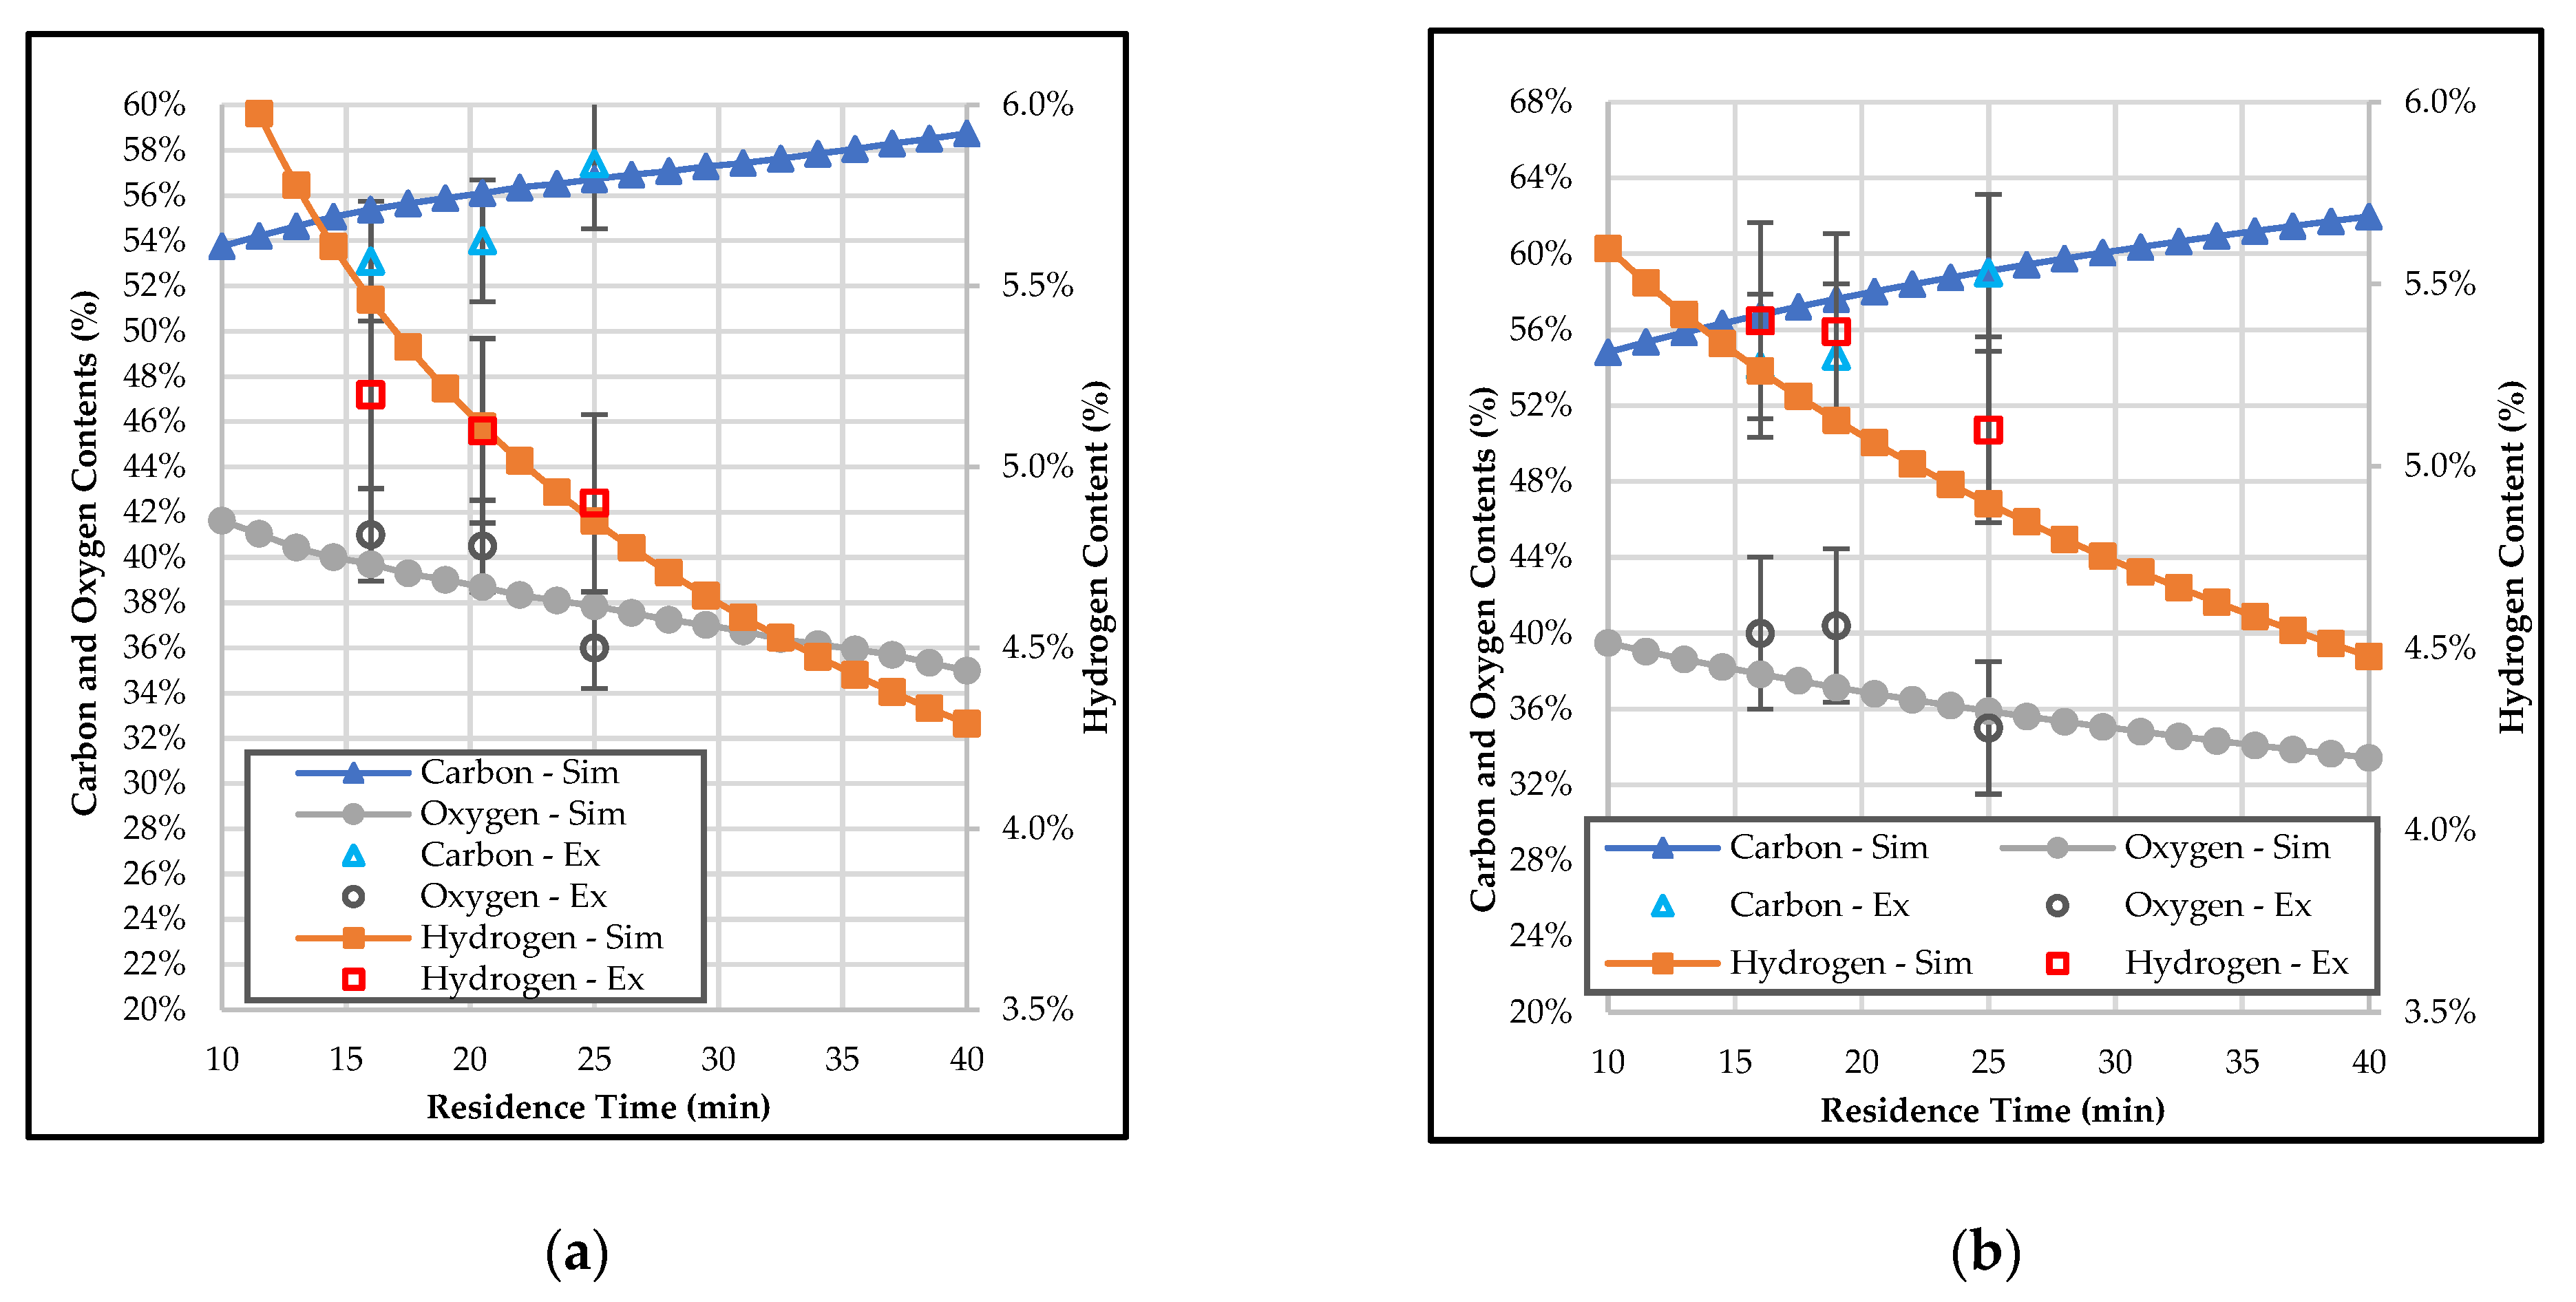
3.2. Effect of Temperature and Residence Time on the Composition of Bio-Coal

Torrefaction reaction was successfully simulated through the RCSTR reactor while taking the variation of both the temperature and the residence times into consideration. Figure 5a,b show the composition of torrefied solid obtained from the simulation at various temperatures for 16 min and 20 min residence time, respectively. Figure 6a,b show the composition of torrefied solid obtained from the simulation at 260 °C and 288 °C, respectively, with the residence time varying from 10 min to 40 min. Figure 5 and Figure 6 also present experimental data in comparison to the simulated values. Carbon content in the torrefied biomass was found to have increased with an increase in temperature, while oxygen and hydrogen content decreased. Carbon content increased from 53% at 204 °C to 56% at 304 °C, respectively. An increase of 5.6% was observed over a range of 100 °C temperature change, and the rate of increase was about 0.056% for a 10 °C rise in temperature. Oxygen decreased from 43% to 38%, and the decline in hydrogen content was from 5.6% to 5.2%, respectively. The total decrease in oxygen and hydrogen were about 11.6% and 0.3%, respectively. Similar trends were observed by Strandberg, et al. (2015). This loss of oxygen and hydrogen contributes to the mass loss of pine with increasing temperatures [6,46]. A similar trend was also observed for 20 min residence time, however the increase in carbon content was higher, and the loss of hydrogen and oxygen was higher as well compared to the 16 min run. Also, the corresponding increase in the carbon content and the rapid removal of oxygen from the biomass contributed to the resulting increase in the higher heating value. This decrease in the hydrogen and the oxygen content with the temperature could be attributed to the devolatilization reactions, during which the hydrogen and the oxygen were lost in the form of water, CO, and CO2 [47]. Similar trends were observed when the residence time was changed keeping the temperature constant. At 260 °C (500 °F), the residence time was varied from 10–40 min. Carbon content in the torrefied material increased, while hydrogen and oxygen contents decreased with increasing residence time. Carbon content increased from 54% to 59% at 40 min, respectively, which is about a 9.2% total increase. The rate of increase was about 0.23% for every 2.5 min increase in residence time. At 288 °C, the carbon content increased from 55% to 68%, respectively. Oxygen content decreased from 40% to 33%, respectively, while hydrogen content decreased from 5.6% to 4.5%, respectively, over the range from 10 min to 40 min residence time. The total decrease in oxygen content was about 17.5%, and that of hydrogen was 19.6%. The total changes for the elements showed that the temperature had a more pronounced effect on carbon than the residence time. On the other hand, for hydrogen, the influence of the residence time was higher than that of the temperature. For oxygen, temperature, and residence time both had similar effects, however temperature was more pronounced. Although temperature has a greater influence on torrefaction compared to residence time, both parameters are critical to obtain a product with the desired specifications.
The elemental composition obtained from the simulation was compared to the experimental results with a 5% standard error. Simulated results and experimental results for carbon and oxygen were within the 5% error margin. In the case of hydrogen, the simulated results followed the same trend as the experimental results, however a 5–8% deviation was observed at 232 °C. The simulated and experimental data for carbon, oxygen, and hydrogen were all within the 5% error margin when the residence time was varied. Observed deviations, although small between the simulated and the experimental data, could be contributed to limited data at higher temperatures.

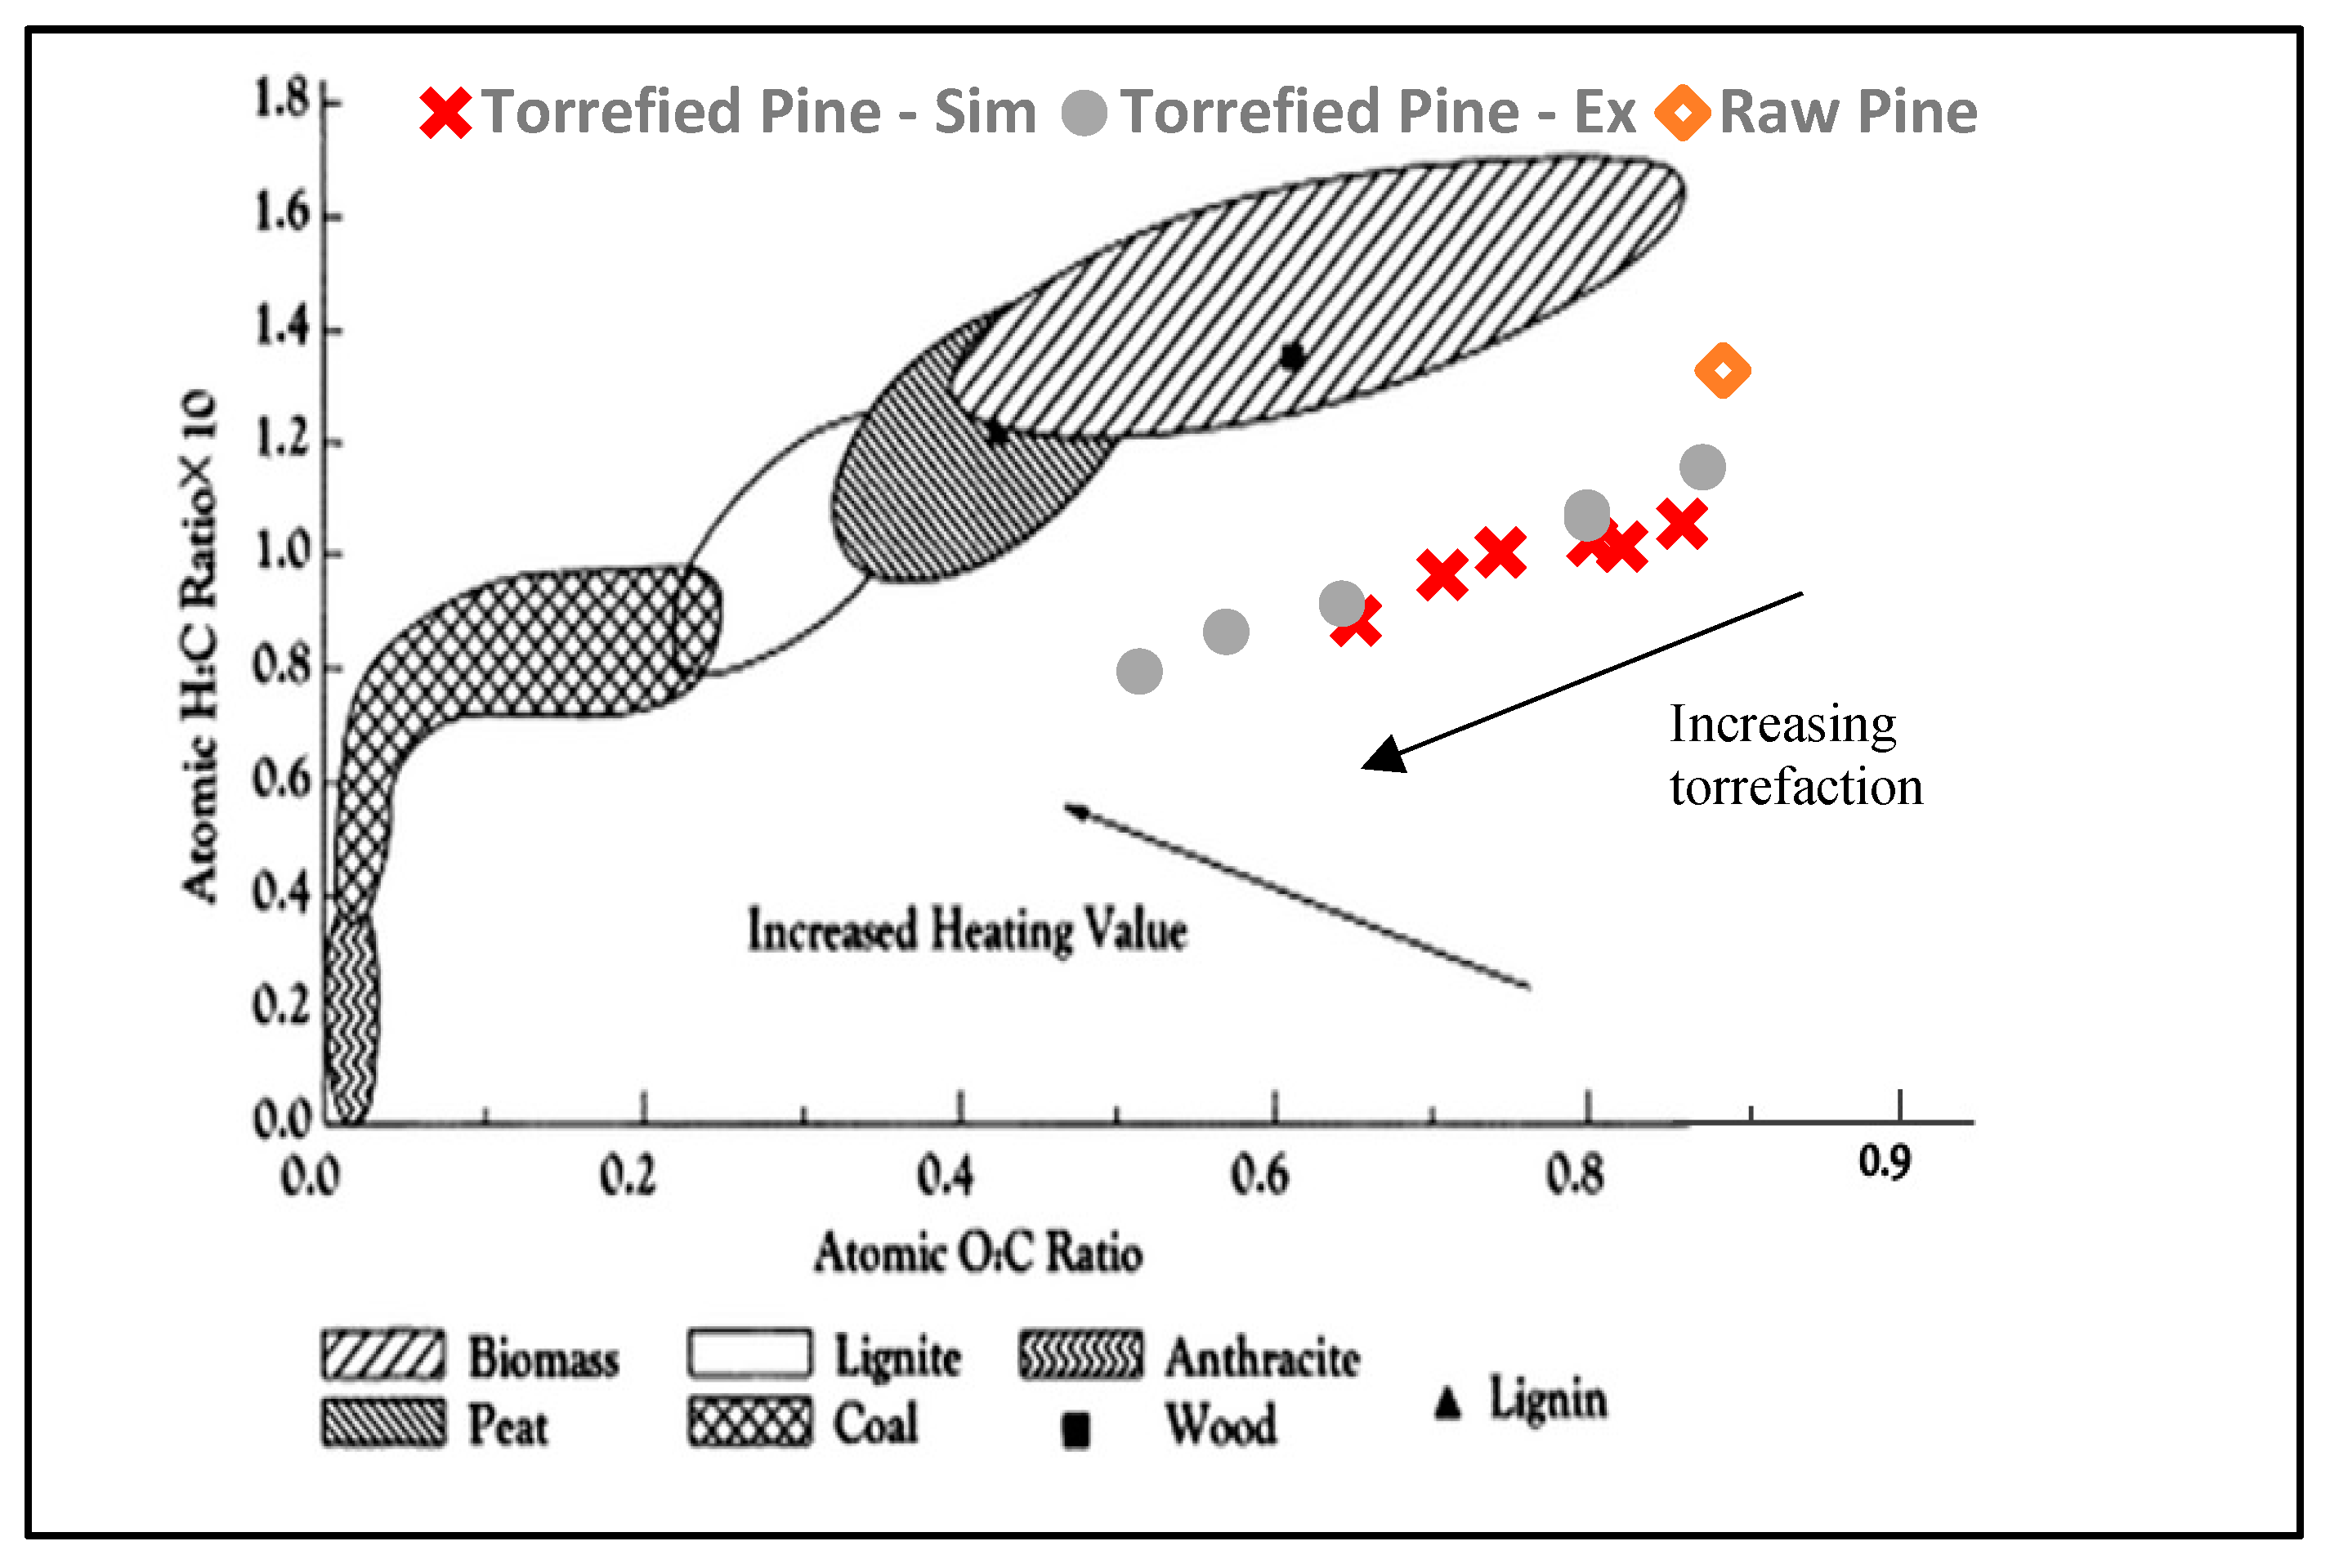
3.3. Van Krevelen Plot

An increase in torrefaction severity, from 204–304 °C, over 10 to 40 min, caused the decomposition of biomass in terms of oxygen and hydrogen loss that can be seen from Figure 7, which is a van Krevelen diagram that provides an insight into the differences in the elemental compositions of biomass, torrefied pine, and coal. Volatiles have high H/C and O/C ratios, which implies a decrease in the H/C and O/C atomic ratios of the remaining solid after torrefaction. The simulated results indicated the same. As the torrefaction severity of pine increased above 302 °C (575 °F), the H/C vs. O/C ratio decreased from 1.2 to 0.6, respectively, and the elemental composition of pine fell under [48] the range of peat. This indicated that collecting more experimental data over a narrower range of temperature and residence time can improve the modeling parameters, consequently helping in the improvement of the model. Similar results were reported by Manouchehrinejad and Mani (2019), where they simulated the torrefaction of pine wood chips over a range of 230–290 °C with 30 min residence time using reaction kinetics and compared their results with the experimental data. The O/C and H/C ratios declined with increased temperature due to the dehydrogenation and deoxygenation reactions happening during the torrefaction process. This resulted in an increased HHV [49].

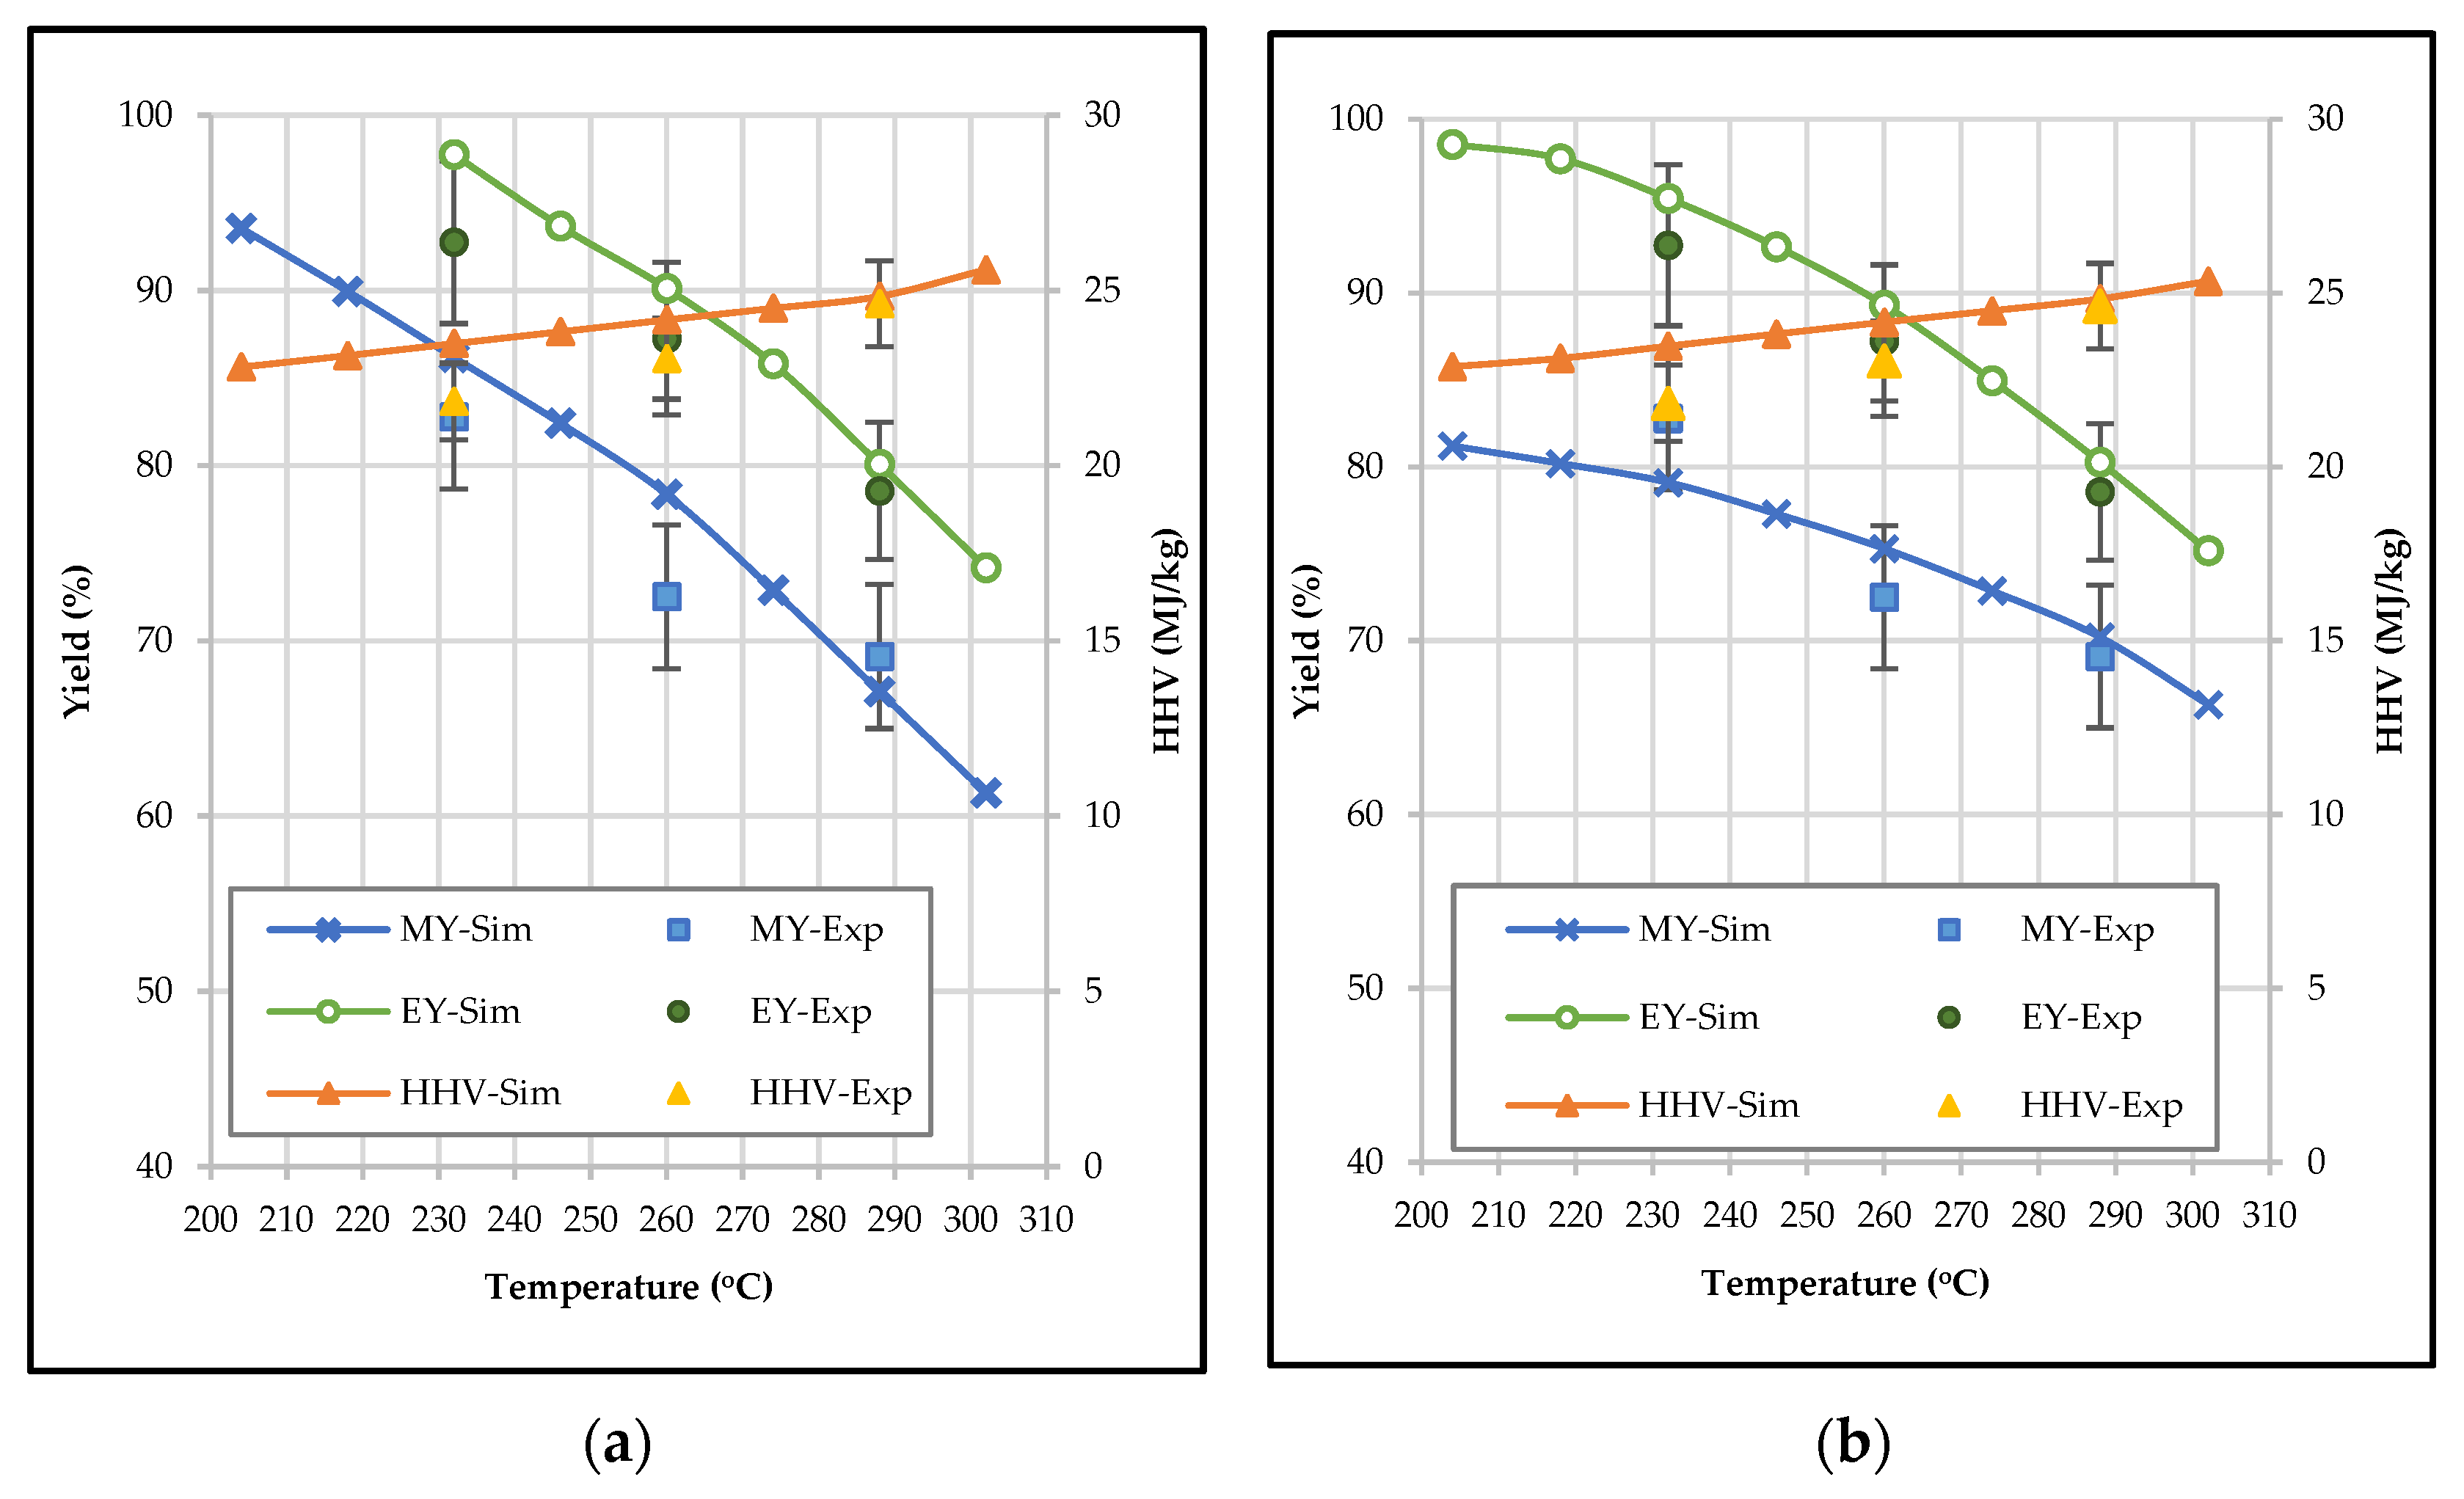
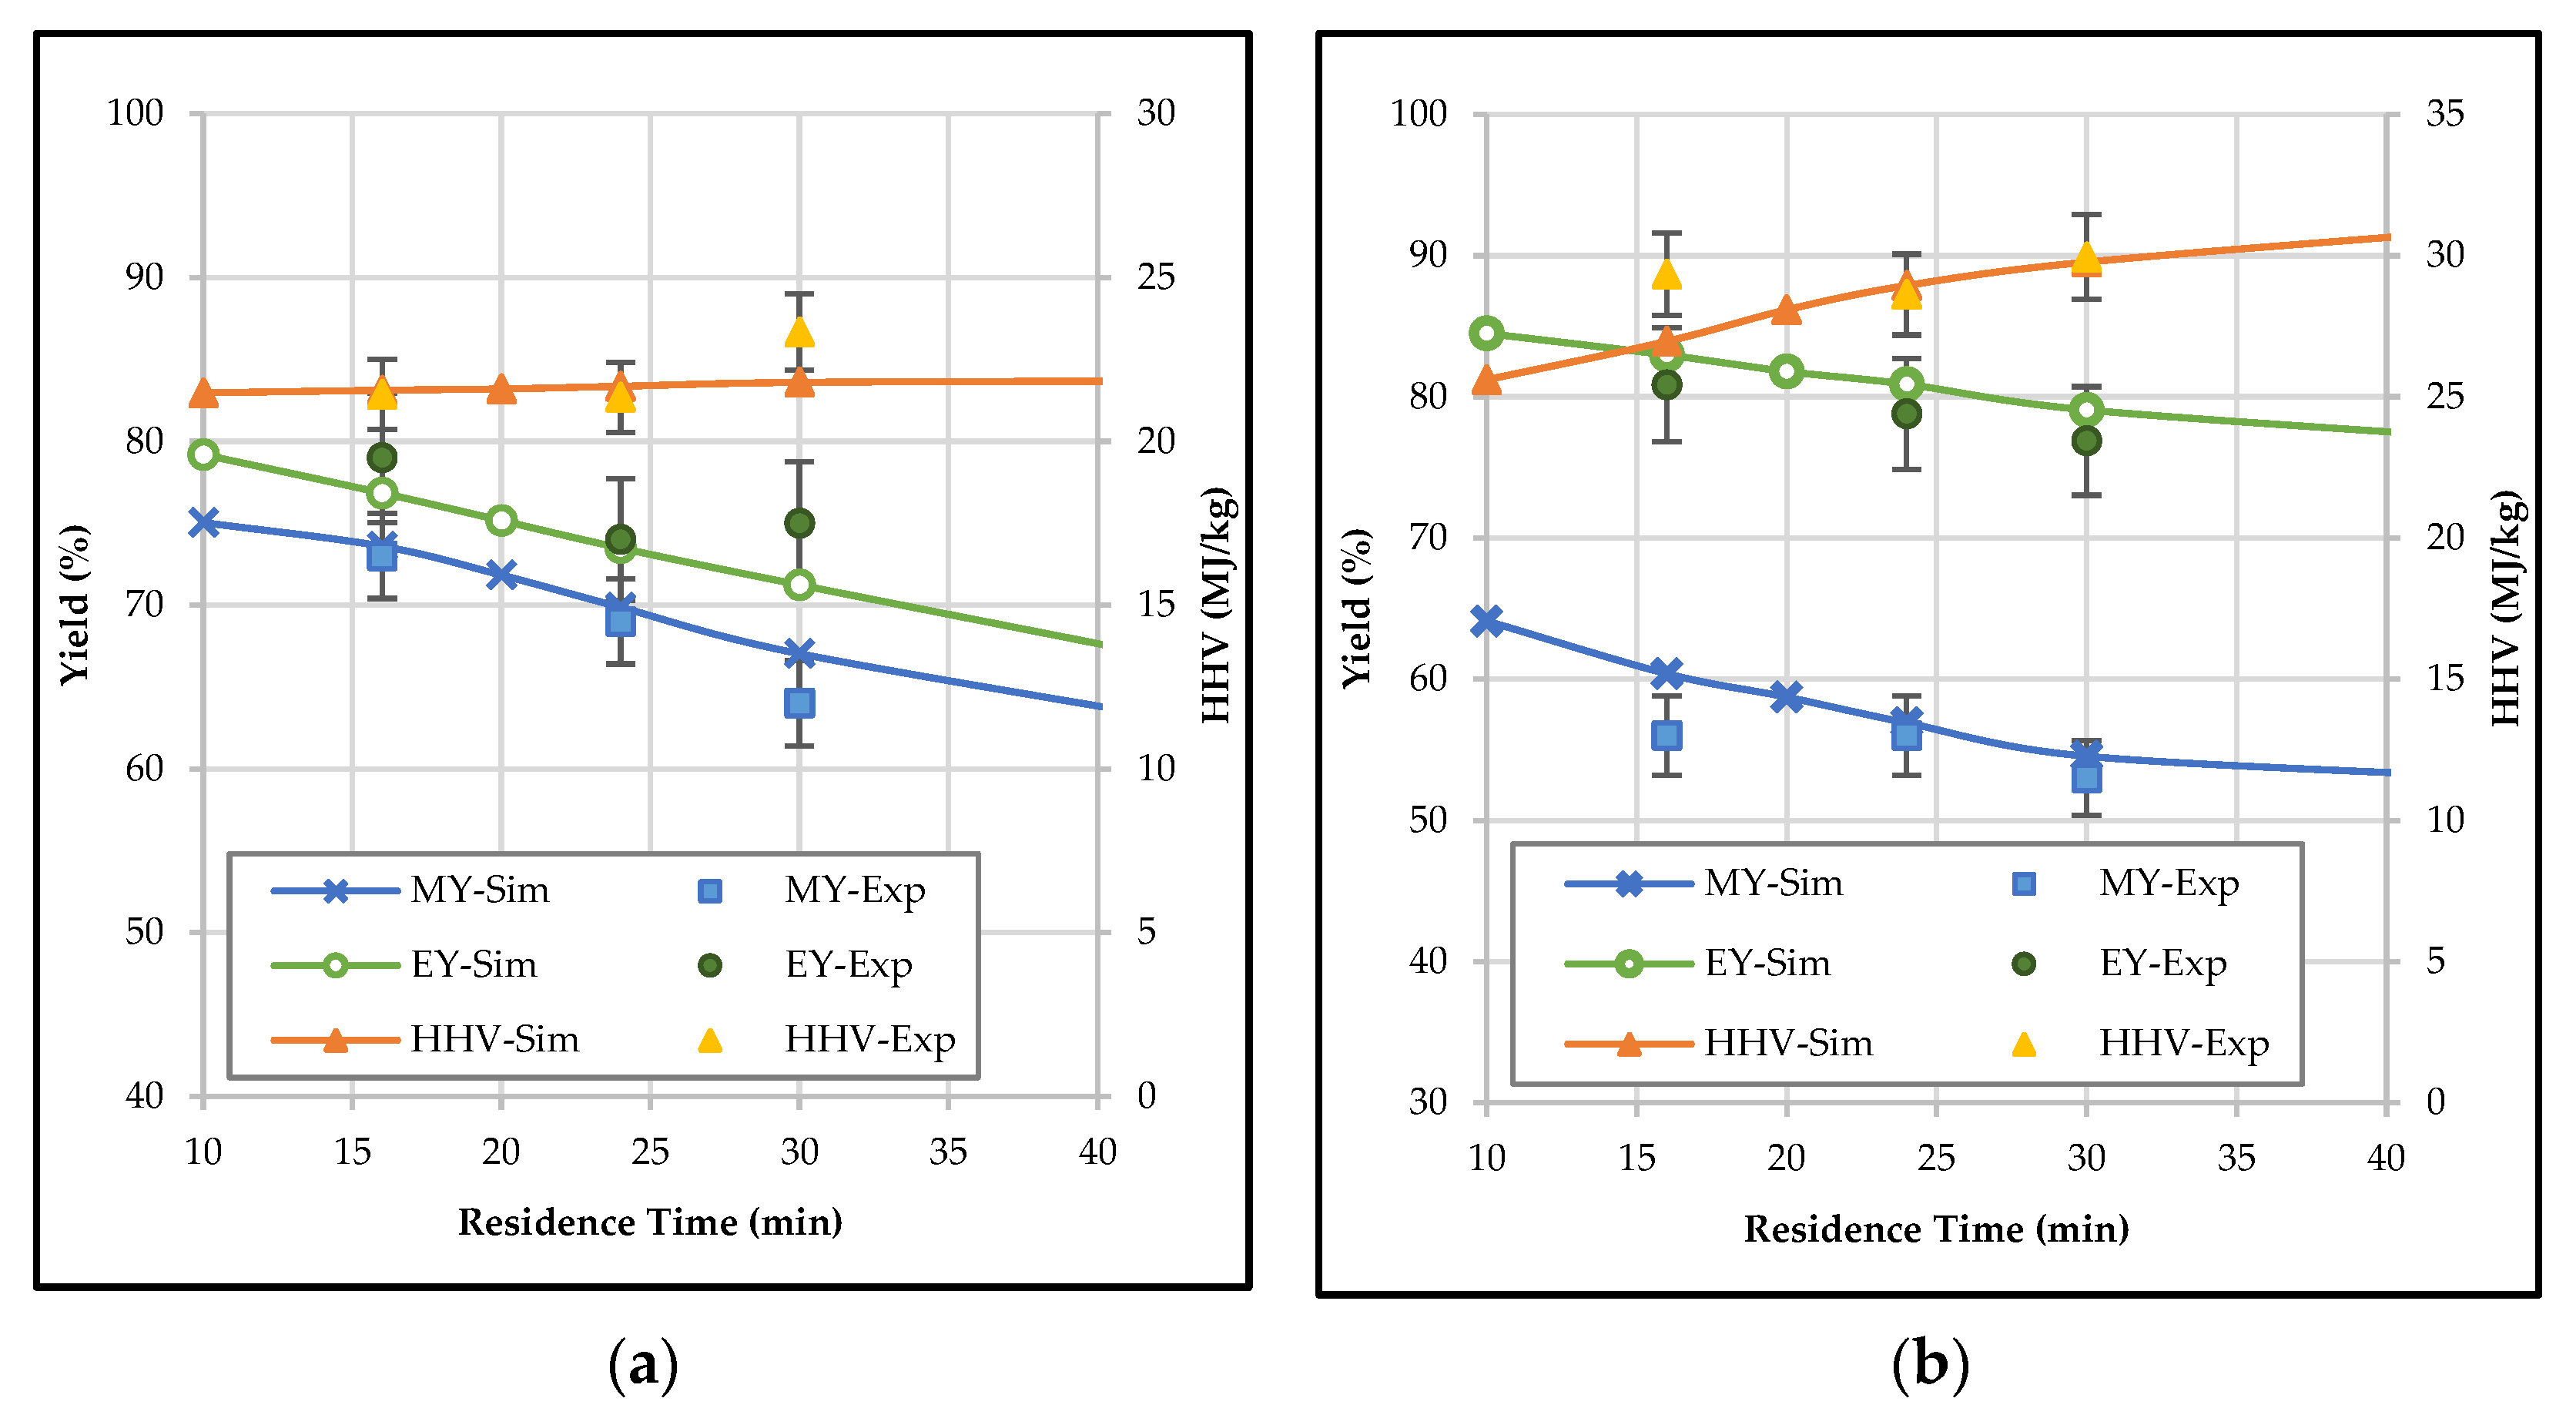
3.4. Effect of Temperature and Residence Time on the Properties of Bio-Coal in Terms of Mass Yield, Energy Yield, and HHV

The results of solid mass yield, energy yield, and torrefied solid HHV from the simulation model compared with the experimental data from torrefaction of pinewood chips at 232, 260, and 288 °C with 16, 20, and 24 min residence time are exhibited in Figure 8a,b and Figure 9a,b. The thermal decomposition of biomass increased with an increase in torrefaction temperature. This resulted in a gradual decline of solid mass yield, whereas the solid yield decreased with increasing residence time. The mass loss was mainly attributed to the degradation of the hemicellulose content in the biomass. The hemicellulose decomposition temperature ranges from 190 °C to 320 °C, where primarily the weight loss occurs at 230 °C due to the cleavage of glycosidic bonds and decomposition of side chains, and at 290 °C, due to the fragmentation of monosaccharide units, the weight loss is extensive [51].
An increase in the torrefaction temperature resulted in a decrease in the energy yields which was calculated using Equation (14). There is a fine balance between the mass loss and the quality gain (HHV) resulting in a desired energy yield. This energy yield can be used as an indicator for the optimal torrefaction temperature and the solid fuel yield. Simulated solid yield results varied from 80% at 204 °C to 63% at 300 °C, respectively, while the energy yield varied from 99% at 204 °C to 69% at 300 °C, respectively. Over the range of 10 to 40 min residence time, solid yield and energy yield varied from 75% to 69% and 79% to 65%, respectively. Shang et al. (2013) studied the torrefaction of wood chips in a pilot-scale continuous reactor. They observed an increased mass loss and a higher HHV in the temperature range of 250–300 °C due to the degradation of hemicellulose in the 200–250 °C range, along with cellulose and lignin degradation in the 270–300 °C temperature range. They reported that the preservation of energy in the torrefied material is possible at mild torrefaction conditions involving a low temperature and a short residence time. They also mentioned that if a high energy density is desired, then only severe torrefaction conditions should be used [10]. This observation supports the findings that was made in this paper. The predicted solid yields at various torrefaction temperatures by simulation were slightly higher, while the energy yields were slightly lower than that of the experimental data. Experimental results for all the parameters were available only within the temperature range of 232–288 °C (450–550 °F), so the kinetics developed for the simulation was more appropriate for this temperature range. This might be the reason for the minor differences observed between the simulated and experimental results, especially for the temperature outside the given range. Approximate control of the reaction temperature and retention time in the lab experiments can also play a role. The simulated higher heating values were close to the experimental data, all being within the 5% standard error. This indicates the precision of the developed correlation used in the simulation for approximating the calorific value of the torrefied pine in the simulation process. The acceptable conformity between the simulation results and the experimental data at the specified residence time validated the simulation parameters, which can be further utilized to evaluate other operating conditions.

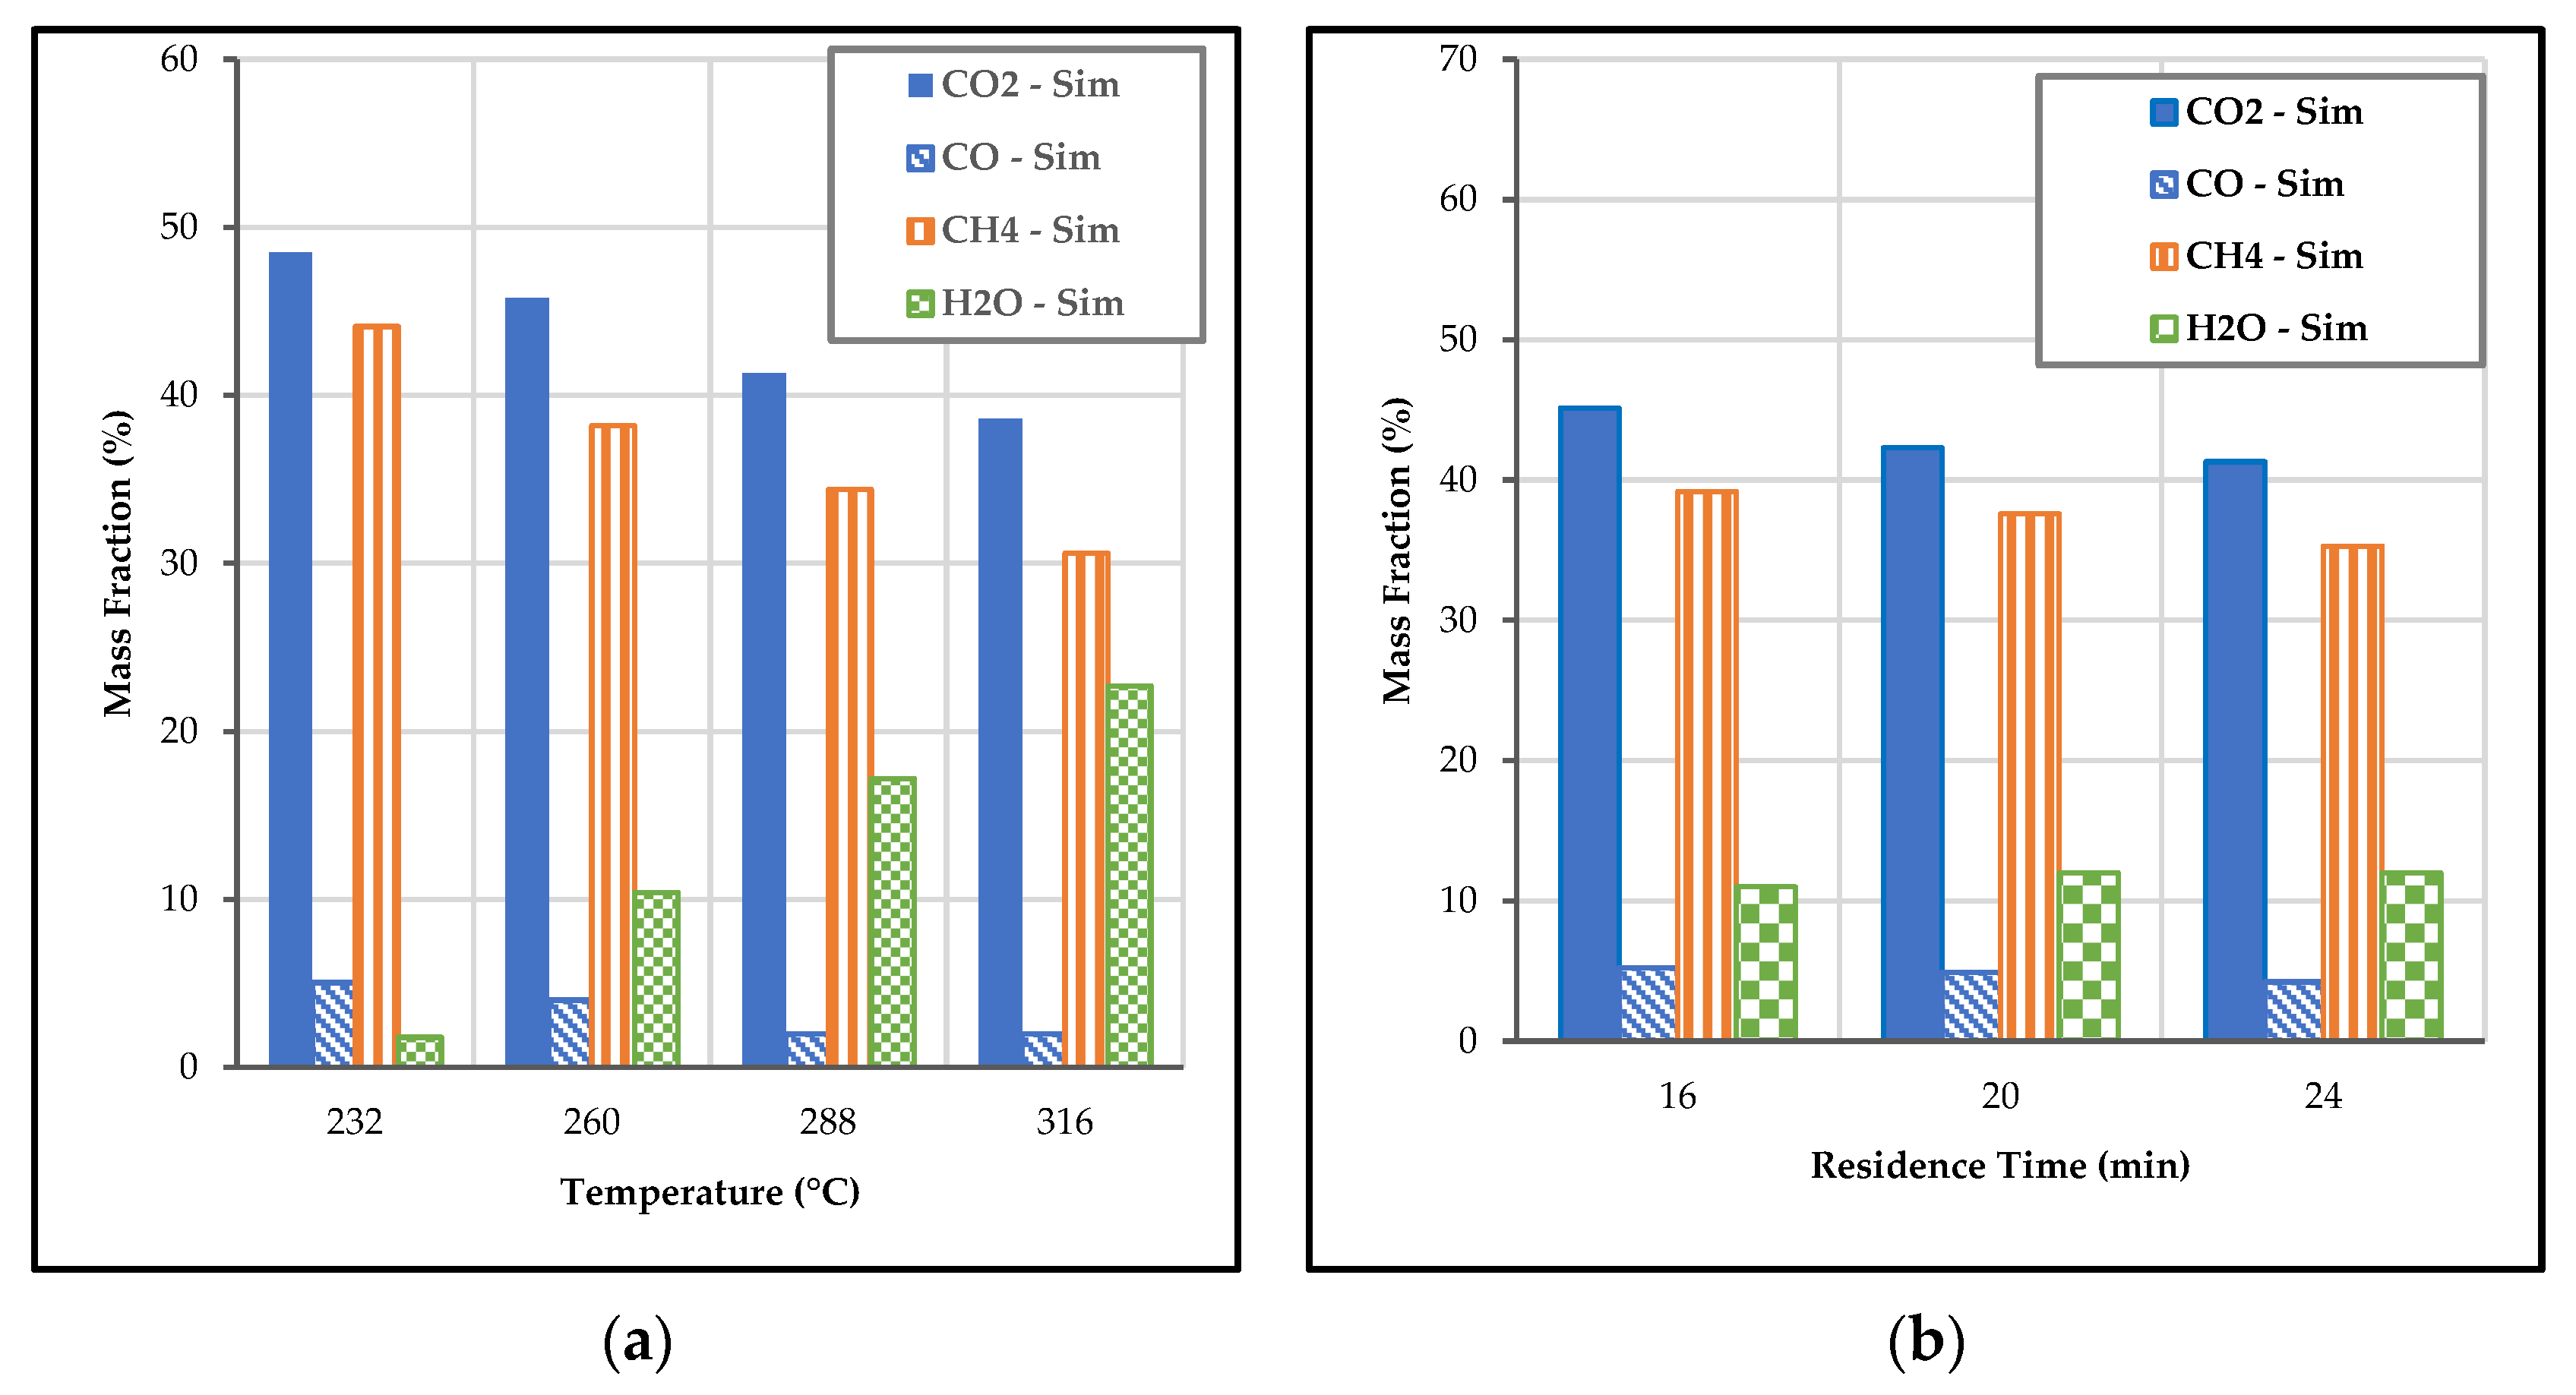
3.5. Effect of Temperature and Residence Time on Product Distribution

In the simulated results, the effect of temperature on the yield of condensable and volatiles was higher than that of residence time as shown in Figure 10a,b. Owing to the increased decomposition of biomass, the solid yields decreased with the increase in residence time at a specific temperature. This weight loss was mainly attributed to the hemicellulose content in the biomass. Compared to other components, hemicellulose is more reactive, and causes the decline in solid yield during torrefaction [42]. Similar results were obtained by Chang et al. (2012) in a torrefaction process of spruce wood and bagasse. In both cases, the solid yield of torrefied biomass decreased from about 81% to 66% when temperature was increased from 204 °C to 300 °C, respectively. Under the same conditions, the yields of condensable and volatiles were found to have increased [42]. The same trend was observed by Manouchehrinejad and Mani (2019), with a decrease in solid and energy yield observed with an increase in temperature [49]. The composition of gases obtained after torrefaction are shown in Figure 11a,b. Formation of carbon dioxide, carbon monoxide, and methane decreased, while water content increased with the increase in torrefaction temperature at a specified residence time. Carbon monoxide content was found to be low, ranging between 2–5%. A similar trend was observed when the residence time was increased, keeping the temperature constant. Carbon dioxide content in the torrefied gas stream on a mass basis varied from 48% to 38%, methane varied from 44% to 30%, and water varied from 1.8% to 22.7% when temperature was changed from 204 °C to 300 °C with a 15 min residence time, respectively. At 260 °C with 16, 20, and 24 min, carbon dioxide decreased from 45% to 41%, methane decreased from 39% to 35%, and water increased from about 11% to 12%, respectively. Although experimental results for the gaseous composition were not available, other studies showed comparable results. Chang et al. 2012 reported the same trend of decreasing carbon dioxide formation with an increase in temperature. The formation of carbon dioxide was primarily owing to the decarboxylation reaction of unstable carboxyl groups present in the hemicellulose of pine wood [42].

3.6. Mass and Energy Balance Flowsheet

Figure 12 shows the overall mass and energy balance flow diagram. Mass and energy balances were calculated based on a 1 ton/hour feed rate. Heat duties of the process were obtained from the simulation. The heats utilized by the system are represented by Q, the enthalpy flow of the system is represented by Qth, the mass enthalpy is represented as Qch, the mass flow is denoted as M, and the temperature as T. Most of the total energy required by the dryer was provided by the combusted heat stream. Thus, heat required by the dryer decreased significantly with this recycled heat stream from the combusted torrefied gases. An energy requirement comparison was made with and without the recycled heat stream, and it showed that 100% of the energy required for drying was provided by the recycled heat stream. The excess heat can be further utilized in the reactor to achieve the target torrefaction temperature. The calculated heat required by the dryer by Equation (15) was 248.62 MJ/h.
Q D r y e r = H e a t   o f   v a p o r i z a t i o n   o f   w a t e r k J k g F e e d   r a t e k g h M o i s t u r e   c o n t e n t   i n   t h e   f e e d
This also helped in minimizing the heat required for torrefaction in the reactor. As most of the heat required in the reactor goes to heating up the biomass to the torrefaction target temperature, it was assumed that minimal heat losses were observed from the equipment not incorporated in the energy balance calculations. The heat released in the separator block (SEP) was due to the enthalpy of mixing of carbon, hydrogen, oxygen, and nitrogen where they were finally separated into solid (TOSOLID), condensable, and volatile (TOGAS) streams. This was verified by finding the values for enthalpy of mixing in the inlet stream, S8 to the SEP block, and the two outlet streams TOGAS and TOSOLID using the equation [52]:
H m i x t u r e = H m i x + x i H i
where
H m i x t u r e :   t o t a l   e n t h a l p y   o f   t h e   s y s t e m   a f t e r   m i x i n g ; H m i x : e n t h a l p y   o f   m i x i n g ; x i : m o l e   f r a c t i o n   o f   t h e   c o m p o n e n t s ;   and H i : e n t h a l p y   o f   p u r e   c o m p o n e n t
The enthalpy of the mixture and the enthalpy of the pure components were both obtained from Aspen Plus™ property analysis at 260 °C. The difference in the enthalpy values in the inlet and outlet streams was close to the heat released by the SEP block. This explains some of the discrepancies observed in the energy balance due to the enthalpy of mixing ofvarious components. The sensible heat of the torrefied biomass was extracted through the cooling sections. The final torrefied product temperature was reduced to 100 °C using heat exchangers. The exhaust gases after combustion were cooled down to an ambient temperature before releasing them into the atmosphere with the use of air. The torrefaction process was simulated at various temperatures ranging from 204 °C to 304 °C, respectively over a range of 10 min to 40 min residence time. The energy for heating up the biomass to the torrefaction target temperature increased slightly with the increase in torrefaction temperature. At the same time, the heat released from the reactor due to the reactions also increased. Thus, the overall energy requirements for drying and torrefaction did not change considerably. A similar observation was made by Manouchehrinejad and Mani (2019). At higher torrefaction temperatures above 260 °C (500 °F), the torrefaction was considered as exothermic [3], and hence the heat inputs for torrefaction to occur can be supplemented by the exothermic reactions without a further increase in the heat supply to the system within the range of higher 260–316 °C (550–600 °F) torrefaction temperatures.

4. Conclusions

This study focused on evaluating the performance of a pilot-scale reactor to produce bio-coal and developing a simulation model for optimizing the torrefaction process. Based on the experimental work performed, it can be concluded that the fuel properties of pine, including the higher heating value, carbon content, and energy density, were improved from the torrefaction process using an indirectly heated rotary drum reactor. The solid fuel obtained at higher temperatures had properties closer to that of lignite and coal. An indirectly heated pilot-scale rotary drum reactor was successfully used to produce bio-coal from pine chips with production rates of up to 9 kg per hour under the conditions tested. Thus, the study has provided conclusive evidence that rotary reactor technology is a promising option and has an excellent potential to be scaled up for the commercial production of bio-coal.
Integral and differential methods of rate were used to fit the experimental results and predict the kinetic parameters for the reaction. The differential method of rate law was used to predict the kinetic parameters for the simulation, as these results were in close approximation with the experimental results. The simulated results were within 5–7% of the error margin when compared to the experimental results. Based on the experiments performed on the pilot-scale unit to produce bio-coal, the simulation model was validated, and showed that both temperature and residence time play important roles in this process. Choosing the right reaction parameters are crucial to the success of the process. The simulation successfully generated accurate results in the range of a 200–300 °C temperature range. Increasing the temperature improves the higher heating value, carbon content, and energy density of the product. The solid fuel obtained at higher temperatures had properties closer to that of lignite. The energy efficiency of the process also increased at higher temperatures with the use of recycled heat stream after combusting the torrefied gases.
There are many areas of this project which merit further study. The most significant way in which these results can be expanded upon is the verification of the Aspen Plus™ model results with further experimental testing. Additional validation, refinement, and improvement of the model can then be achieved.

Supplementary Materials

The following supporting information can be downloaded at: https://www.mdpi.com/article/10.3390/cleantechnol5020034/s1, Table S1: Condensable species recovered from the torrefaction of pinewood at various temperatures; Figure S1: (a–c) Polymath graphs showing the fitting of carbon data at 232 °C, 260 °C, and 288 °C (experiment vs. calculated); Figure S2: (a–c) Polymath graphs showing the fitting of oxygen data at 232 °C, 260 °C, and 288 °C (experiment vs. calculated); Figure S3: (a–c) Polymath graphs showing the fitting of hydrogen data at 232 °C, 260 °C, and 288 °C (experiment vs. calculated); Figure S4: Polymath report for carbon data regression at 232 °C (450 °F); Figure S5: Polymath report for oxygen data regression at 288 °C (550 °F); Figure S6: Polymath report for hydrogen data regression at 260 °C (500 °F); Figure S7: (a) Arrhenius plots for zero-order, (b) 1st order, and (c) 2nd order reactions of carbon obtained by the integral rate law method; Figure S8: Arrhenius plots for (a) zero-order, (b) 1st order, and (c) 2nd order reactions of oxygen obtained by the integral rate law method; Figure S9: Arrhenius plots for (a) zero-order, (b) 1st order, and (c) 2nd order reactions of hydrogen obtained by the integral rate law method; Table S2: Experimental results showing biomass composition after torrefaction at 232, 260, 288, and 316 °C at 16 min residence time; Table S3: Experimental results showing biomass composition after torrefaction at 232, 260, 288, and 316 °C at 20 min residence time; Table S4: Experimental results showing biomass composition after torrefaction at 232, 260, 288, and 316 °C at 24 min residence time. References [10,12,15,30,37,38,39,40,41,43,44,45,53] are cited in the supplementary materials.

Author Contributions

Conceptualization, S.H. and P.B.; methodology and investigation, S.H., P.M., P.B., J.C.P. and D.L.B.F., simulation, S.H., J.C.P. and D.L.B.F.; data curation, P.M., S.H. and P.B.; formal analysis, S.H., P.B. and D.L.B.F., writing—original draft presentation, S.H. and P.B.; writing-review and editing, S.H., P.B., R.H. and M.E.Z. supervision, P.B., J.C.P. and D.L.B.F. All authors have read and agreed to the published version of the manuscript.

Funding

This research was funded by the Louisiana Board of Regents through the Industrial Ties Research Sub Program (ITRS), Contract No: LEQSF (2012–2015)-RD-B-07 and Cleco Power (Pineville, LA, USA).

Institutional Review Board Statement

Not applicable.

Informed Consent Statement

Not applicable.

Conflicts of Interest

The authors declare no conflict of interest.

References

  1. Basu, P. Biomass Gasification, Pyrolysis and Torrefaction, 2nd ed.; Prabir Basu: Kolkata, India, 2013; ISBN 9780123965431. Available online: https://www.elsevier.com/books/biomass-gasification-pyrolysis-and-torrefaction/basu/978-0-12-396488-5 (accessed on 13 March 2022).
  2. REN21. Renewables 2020 Global Status Report; REN21: Paris, France, 2020; ISBN 978-3-948393-00-7. [Google Scholar]
  3. Faleeva, J.M.; Sinelshchikov, V.A.; Sytchev, G.A.; Zaichenko, V.M. Exothermic Effect during Torrefaction. J. Phys. Conf. Ser. 2018, 946, 012033. [Google Scholar] [CrossRef]
  4. van der Stelt, M.J.C.; Gerhauser, H.; Kiel, J.H.A.; Ptasinski, K.J. Biomass Upgrading by Torrefaction for the Production of Biofuels: A Review. Biomass Bioenergy 2011, 35, 3748–3762. [Google Scholar] [CrossRef]
  5. Balat, M. Mechanisms of Thermochemical Biomass Conversion Processes. Part 2: Reactions of Gasification. Energy Sources Part A Recovery Util. Environ. Eff. 2008, 30, 636–648. [Google Scholar] [CrossRef]
  6. Barskov, S.; Zappi, M.; Buchireddy, P.; Dufreche, S.; Guillory, J.; Gang, D.; Hernandez, R.; Bajpai, R.; Baudier, J.; Cooper, R.; et al. Torrefaction of Biomass: A Review of Production Methods for Biocoal from Cultured and Waste Lignocellulosic Feedstocks. Renew. Energy 2019, 142, 624–642. [Google Scholar] [CrossRef]
  7. Zappi, M.E.; Buchireddy, P. Part B: Torrefaction of Lignocellulosic Agricultural Waste into Biocoal. In Biomass and Waste Energy Applications; ASME Press: New York, NY, USA, 2021; pp. 3–83. [Google Scholar]
  8. Di Blasi, C.; Lanzetta, M. Intrinsic Kinetics of Isothermal Xylan Degradation in Inert Atmosphere. J. Anal. Appl. Pyrolysis 1997, 40–41, 287–303. [Google Scholar] [CrossRef]
  9. Thurner, F.; Mann, U. Kinetic Investigation of Wood Pyrolysis. Ind. Eng. Chem. Process Des. Dev. 1981, 20, 482–488. [Google Scholar] [CrossRef]
  10. Shang, L.; Ahrenfeldt, J.; Holm, J.K.; Barsberg, S.; Zhang, R.Z.; Luo, Y.H.; Egsgaard, H.; Henriksen, U.B. Intrinsic Kinetics and Devolatilization of Wheat Straw during Torrefaction. J. Anal. Appl. Pyrolysis 2013, 100, 145–152. [Google Scholar] [CrossRef]
  11. Wilk, M.; Magdziarz, A.; Gajek, M.; Zajemska, M.; Jayaraman, K.; Gokalp, I. Combustion and Kinetic Parameters Estimation of Torrefied Pine, Acacia and Miscanthus Giganteus Using Experimental and Modelling Techniques. Bioresour. Technol. 2017, 243, 304–314. [Google Scholar] [CrossRef]
  12. Chen, W.H.; Hsu, H.C.; Lu, K.M.; Lee, W.J.; Lin, T.C. Thermal Pretreatment of Wood (Lauan) Block by Torrefaction and Its Influence on the Properties of the Biomass. Energy 2011, 36, 3012–3021. [Google Scholar] [CrossRef]
  13. Chen, W.H.; Cheng, W.Y.; Lu, K.M.; Huang, Y.P. An Evaluation on Improvement of Pulverized Biomass Property for Solid Fuel through Torrefaction. Appl. Energy 2011, 88, 3636–3644. [Google Scholar] [CrossRef]
  14. Prins, M.J.; Ptasinski, K.J.; Janssen, F.J.J.G. Torrefaction of Wood: Part 1. Weight Loss Kinetics. J. Anal. Appl. Pyrolysis 2006, 77, 28–34. [Google Scholar] [CrossRef]
  15. Prins, M.J.; Ptasinski, K.J.; Janssen, F.J.J.G. Torrefaction of Wood. Part 2. Analysis of Products. J. Anal. Appl. Pyrolysis 2006, 77, 35–40. [Google Scholar] [CrossRef]
  16. Medic, D.; Darr, M.; Shah, A.; Potter, B.; Zimmerman, J. Effects of Torrefaction Process Parameters on Biomass Feedstock Upgrading. Fuel 2012, 91, 147–154. [Google Scholar] [CrossRef]
  17. Arias, B.; Pevida, C.; Fermoso, J.; Plaza, M.G.; Rubiera, F.; Pis, J.J. Influence of Torrefaction on the Grindability and Reactivity of Woody Biomass. Fuel Process. Technol. 2008, 89, 169–175. [Google Scholar] [CrossRef]
  18. Cremers, M.; Koppejan, J.; Sokhansanj, S.; Melin, S.; Madrali, S. Status Overview of Torrefaction Technologies—A Review of the Commercialization Status of Biomass Torrefaction; IEA Bioenergy: Paris, France, 2015; ISBN 978-1-910154-23-6. Available online: https://www.ieabioenergy.com/wp-content/uploads/2015/11/IEA_Bioenergy_T32_Torrefaction_update_2015b.pdf (accessed on 13 March 2022).
  19. Wilèn, C.; Jukola, P.; Järvinen, T.; Sipilä, K.; Verhoeff, F.; Kiel, J. Wood Torrefaction–Pilot Tests and Utilization; TT Technical Research Centre of Finland: VOstolaskut, Finland, 2013; Volume 122. [Google Scholar]
  20. Hardianto, T.; Pasek, A.D.; Suwono, A.; Azhari, R.; Ardiansyah, W. The Aspen TM Software Simulation of a Peat Torrefaction System Using RYield and SSplit Block as Reactor Model. In Proceedings of the International Symposium on Sustainable Energy and Environmental Protection (ISSEEP), Yogyakarta, Indonesia, 23–26 November 2009; pp. 23–26. [Google Scholar]
  21. Nikolopoulos, N.; Isemin, R.; Atsonios, K.; Kourkoumpas, D.; Kuzmin, S.; Mikhalev, A.; Nikolopoulos, A.; Agraniotis, M.; Grammelis, P.; Kakaras, E. Modeling of Wheat Straw Torrefaction as a Preliminary Tool for Process Design. Waste Biomass Valorization 2013, 4, 409–420. [Google Scholar] [CrossRef]
  22. Bergman, P.C.A.; Boersma, A.; Zwart, R.; Kiel, J.H.A. Torrefaction for Biomass Co-Firing in Existing Coal-Fired Power Stations; Energy Research Centre of the Netherlands ECN: Petten, The Netherlands, 2005; p. 71.
  23. Arteaga-Pérez, L.E.; Segura, C.; Espinoza, D.; Radovic, L.R.; Jiménez, R. Torrefaction of Pinus Radiata and Eucalyptus Globulus: A Combined Experimental and Modeling Approach to Process Synthesis. Energy Sustain. Dev. 2015, 29, 13–23. [Google Scholar] [CrossRef]
  24. Dudgeon, R. An Aspen Plus Model of Biomass Torrefaction; University Turbine Systems Research (UTSR) Fellowship 2009; Electric Power Research Institute: Charlotte, NC, USA, 2009; p. 12.
  25. Lisboa, M.H.; Alves, M.; Vitorino, D.; Delaiba, W.B.; Finzer, J.R.D.; Barrozo, M.A.S. Study of the Performance of the Rotary Dryer with Fluidization. In Proceedings of the 14th International Drying Symposium, Saõ Paulo, Brazil, 22–25 August 2004; Volume 3, pp. 1668–1675. [Google Scholar]
  26. Cherry, R.S.; Wood, R.A.; Westover, T.L. Analysis of the Production Cost for Various Grades of Biomass Thermal Treatment; INL/EXT-13-30348; U.S. Department of Energy Office of Scientific and Technical Information: Idaho Falls, ID, USA, 2013. [CrossRef]
  27. Visconti, A.; Miccio, M.; Juchelková, D. An Aspen Plus® Tool for Simulation of Lignocellulosic Biomass Pyrolysis via Equilibrium and Ranking of the Main Process Variables. Int. J. Math. Model. Methods Appl. Sci. 2015, 9, 71–86. [Google Scholar]
  28. Bach, Q.V.; Skreiberg, Ø.; Lee, C.J. Process Modeling and Optimization for Torrefaction of Forest Residues. Energy 2017, 138, 348–354. [Google Scholar] [CrossRef]
  29. Scott Fogler, H. Elements of Chemical Reaction Engineering; Prentice Hall: Hoboken, NJ, USA, 2017. [Google Scholar]
  30. Morampudi, P. Pilot Scale Evaluation of Torrefaction Operating Process Parameters on Thermal Properties of Biomass; University of Louisiana at Lafayette: Lafayette, LA, USA, 2019. [Google Scholar]
  31. Sofia, D.; Coca Llano, P.; Giuliano, A.; Iborra Hernández, M.; García Peña, F.; Barletta, D. Co-Gasification of Coal–Petcoke and Biomass in the Puertollano IGCC Power Plant. Chem. Eng. Res. Des. 2014, 92, 1428–1440. [Google Scholar] [CrossRef]
  32. Montagna, J.M.; Iribarren, O.A. A New Strategy for Process Simulation with the Sequential Modular Approach. Comput. Ind. 1989, 12, 23–29. [Google Scholar] [CrossRef]
  33. Ferrentino, G.; Barletta, D.; Balaban, M.O.; Ferrari, G.; Poletto, M. Measurement and Prediction of CO2 Solubility in Sodium Phosphate Monobasic Solutions for Food Treatment with High Pressure Carbon Dioxide. J. Supercrit. Fluids 2010, 52, 142–150. [Google Scholar] [CrossRef]
  34. Diego, B.; Paola, B.; Antonio, G.; Michele, M. Simulation and Flowsheeting of Agro Industrial Residues Torrefaction the Case of Tomato Peels Waste. In Proceedings of the Fifth International Conference on Advances in Civil, Structural and Environmental Engineering—ACSEE 2017, Rome, Italy, 27–28 May 2017; Institute of Research Engineers and Doctors, LLC: New York, NY, USA, 2017; pp. 27–31. [Google Scholar]
  35. EverGreenRenewable, LLC. Biomass Torrefaction as a Preprocessing Step for Thermal Conversion. 2009, pp. 1–4. Available online: https://www.scribd.com/document/348196215/Biomass-Torrefaction-as-a-Preprocessing-Step-for-Thermal-Conversion-Evergreen (accessed on 13 March 2022).
  36. Pirraglia, A.; Gonzalez, R.; Saloni, D.; Wright, J.; Denig, J. Fuel Properties and Suitability of Eucalyptus Benthamii and Eucalyptus Macarthurii for Torrefied Wood and Pellets. BioResources 2012, 7, 217–235. [Google Scholar]
  37. Lê Thành, K.; Commandré, J.M.; Valette, J.; Volle, G.; Meyer, M. Detailed Identification and Quantification of the Condensable Species Released during Torrefaction of Lignocellulosic Biomasses. Fuel Process. Technol. 2015, 139, 226–235. [Google Scholar] [CrossRef]
  38. Commandré, J.M.; Leboeuf, A. Volatile Yields and Solid Grindability after Torrefaction of Various Biomass Types. Environ. Prog. Sustain. Energy 2015, 34, 1180–1186. [Google Scholar] [CrossRef]
  39. Anca-Couce, A.; Mehrabian, R.; Scharler, R.; Obernberger, I. Kinetic Scheme to Predict Product Composition of Biomass Torrefaction. Chem. Eng. Trans. 2014, 37, 43–48. [Google Scholar] [CrossRef]
  40. Portilho, G.R.; de Castro, V.R.; de Cássia Oliveira Carneiro, A.; Zanuncio, J.C.; Zanuncio, A.J.V.; Surdi, P.G.; Gominho, J.; de Araújo, S.O. Potential of Briquette Produced with Torrefied Agroforestry Biomass to Generate Energy. Forests 2020, 11, 1272. [Google Scholar] [CrossRef]
  41. Candelier, K.; Chaouch, M.; Dumaray, S.; Pétrissans, A.; Pétrissans, M.; Gérardin, P. Utilization of Thermodesorption Coupled to GC–MS to Study Stability of Different Wood Species to Thermodegradation. J. Anal. Appl. Pyrolysis 2011, 92, 376–383. [Google Scholar] [CrossRef]
  42. Chang, S.; Zhao, Z.; Zheng, A.; He, F.; Huang, Z.; Li, H. Characterization of Products from Torrefaction of Sprucewood and Bagasse in an Auger Reactor. Energy Fuels 2012, 26, 7009–7017. [Google Scholar] [CrossRef]
  43. Nocquet, T.; Dupont, C.; Commandre, J.M.; Grateau, M.; Thiery, S.; Salvador, S. Volatile Species Release during Torrefaction of Wood and Its Macromolecular Constituents: Part 1-Experimental Study. Energy 2014, 72, 180–187. [Google Scholar] [CrossRef]
  44. Repellin, V.; Govin, A.; Rolland, M.; Guyonnet, R. Modelling Anhydrous Weight Loss of Wood Chips during Torrefaction in a Pilot Kiln. Biomass Bioenergy 2010, 34, 602–609. [Google Scholar] [CrossRef]
  45. Bourgois, J.; Guyonnet, R. Characterization and Analysis of Torrefied Wood. Wood Sci. Technol. 1988, 22, 143–155. [Google Scholar] [CrossRef]
  46. Strandberg, M.; Olofsson, I.; Pommer, L.; Wiklund-Lindström, S.; Åberg, K.; Nordin, A. Effects of Temperature and Residence Time on Continuous Torrefaction of Spruce Wood. Fuel Process. Technol. 2015, 134, 387–398. [Google Scholar] [CrossRef]
  47. Bridgeman, T.G.; Jones, J.M.; Shield, I.; Williams, P.T. Torrefaction of Reed Canary Grass, Wheat Straw and Willow to Enhance Solid Fuel Qualities and Combustion Properties. Fuel 2008, 87, 844–856. [Google Scholar] [CrossRef]
  48. Radics, R.I.; Gonzalez, R.; Bilek, E.M.; Kelley, S.S. Systematic Review of Torrefied Wood Economics. BioResources 2017, 12, 6868–6884. [Google Scholar] [CrossRef]
  49. Manouchehrinejad, M.; Mani, S. Process Simulation of an Integrated Biomass Torrefaction and Pelletization (IBTP) Plant to Produce Solid Biofuels. Energy Convers. Manag. X 2019, 1, 100008. [Google Scholar] [CrossRef]
  50. Mckendry, P. Energy Production from Biomass (Part 2): Conversion Technologies. Bioresour. Technol. 2002, 83, 47–54. [Google Scholar] [CrossRef]
  51. Chen, D.; Gao, A.; Cen, K.; Zhang, J.; Cao, X.; Ma, Z. Investigation of Biomass Torrefaction Based on Three Major Components: Hemicellulose, Cellulose, and Lignin. Energy Convers. Manag. 2018, 169, 228–237. [Google Scholar] [CrossRef]
  52. Sinnott, R.; Towler, G. Chemical Engineering Design; Elsevier: Amsterdam, The Netherlands, 2019; ISBN 9780081025994. [Google Scholar]
  53. Deng, J.; Wang, G.; Kuang, J.; Zhang, Y.; Luo, Y. Pretreatment of Agricultural Residues for Co-Gasification via Torrefaction. J. Anal. Appl. Pyrolysis 2009, 86, 331–337. [Google Scholar] [CrossRef]
Figure 1. Schematic side view of the torrefaction reactor. (1) Hopper, (2) rotary air lock, (3) agitated hopper, (4) screw feeder, (5) retort, (6) discharge section, (7) sampling barrel, (8) heating chamber flue gas exit, (9) process gases exit, and (10) heating chamber.
Cleantechnol 05 00034 g001
Figure 2. Aspen Plus™ simulation design.
Cleantechnol 05 00034 g002
Figure 3. Arrhenius plots for (a) carbon; (b) oxygen; (c) hydrogen.
Cleantechnol 05 00034 g003aCleantechnol 05 00034 g003b
Figure 4. (a) Arrhenius plot for the first-order reaction of carbon; (b) Arrhenius plot for the second-order reaction of oxygen; and (c) the Arrhenius plot for the third-order reaction of hydrogen.
Cleantechnol 05 00034 g004aCleantechnol 05 00034 g004b
Figure 5. Comparison (experimental and simulated) of variation in the elemental composition of pine at various temperatures: (a) Temperature range of 210–304 °C and 16 min residence, and (b) temperature range of 204–304 °C and 20 min residence time.
Cleantechnol 05 00034 g005
Figure 6. Comparison (experimental and simulated) of variation in the elemental composition of pine at various residence times: (a) residence time (10–40 min) at 260 °C, and (b) residence time (10–40 min) at 288 °C.
Cleantechnol 05 00034 g006
Figure 7. Experimental and simulated torrefaction data overlay on a van Krevelen diagram. Adapted from [50].
Cleantechnol 05 00034 g007
Figure 8. Comparison (experimental and simulated) of the variation in mass yield, energy yield, and HHV of pine with temperature at (a) 16 min residence time, and (b) 20 min residence time.
Cleantechnol 05 00034 g008
Figure 9. Comparison (experimental and simulated) of the variation in mass yield, energy yield, and HHV of pine with residence time at (a) 260 °C, and (b) 288 °C.
Cleantechnol 05 00034 g009
Figure 10. Effect of torrefaction temperature (a) on the product distribution with a residence time of 15 min; and (b) residence time on the product distribution at 260 °C (500 °F).
Cleantechnol 05 00034 g010
Figure 11. Composition of gaseous products formed in biomass torrefaction (a) at different temperature with 15 min residence time; and (b) with a different residence time at 260 °C (500 °F).
Cleantechnol 05 00034 g011
Figure 12. Mass and energy balance flow diagram.
Cleantechnol 05 00034 g012
Table 1. Processing conditions and input parameters used in the Aspen Plus™ simulation.
Capacity10,000 tons/year
Plant typeStand alone
Feed stockPine, 11% moisture content
Torrefaction conditionsResidence time: 10–40 min
Torrefaction temperature: 204–304 °C (400–580 °F)
Flow rate: 8760 ton/year
Production rates7000–8000 ton/year
Available utilitiesNatural gas, water, air
Raw pine softwood HHV (MJ/kg) (db)20.5
Apparent density of raw pinewood (kg/m3)440
Density of dry pine wood (kg/m3)250
Table 2. Kinetic parameters for torrefaction temperature at 232, 260, and 288 °C for three different residence times–16, 20, and 24 min, respectively.
ParametersCarbonOxygenHydrogen
Reaction order (α)1.051.981.97
Activation energy ( ( E a )   k J k m o l ) 6378.50168,334.526,457.6
Pre-exponential factor0.00184 (min−1)2799.52 (g·mol−1·min−1)22.64 (g·mol−1·min−1)
Table 3. Integral forms of the reaction equations (Equations (8)–(12)) [29].
Reaction OrderIntegral Form of the Equation
Zero-order C a = k t + C a o (8)
First-order ln C a = k t + ln C a o   (9)
Second-order 1 C a = k t + 1 C a o (10)
Third-order 1 C a 2 = k t + 1 C a o 2 (11)
Table 4. Properties of pine obtained from experimental studies.
Proximate analysis—pine
Volatile matter (%)82.5
Fixed carbon (%)17.0
Ash (%)0.45
Ultimate analysis—pine
C (%)50
H (%)6.6
O (%)43.2
N (%)0.1
S (%)0.0
higher heating value (MJ/Kg) * db (Btu/lb)20.3 (8680)
Biomass typeSoftwood
Disclaimer/Publisher’s Note: The statements, opinions and data contained in all publications are solely those of the individual author(s) and contributor(s) and not of MDPI and/or the editor(s). MDPI and/or the editor(s) disclaim responsibility for any injury to people or property resulting from any ideas, methods, instructions or products referred to in the content.

