1. Introduction
A novel coronavirus occurred in Wuhan in 2019 [
1,
2] and spread throughout the world. More than two years later, the virus is still mutating and causing infections around the world, with a cumulative total of 550 million infections and 6.3 million deaths.
Several measures have been taken across the globe to suppress the spread of COVID-19. The basic idea is to prevent infected individuals from coming into contact with susceptible people. Two ways to restrict peoples’ activity are monitoring and lockdown.
The monitoring method is a simple but efficient strategy to identify the people who require treatment or isolation. In this method, thorough contact tracing and quarantine of infected people are conducted as needed by collecting the positional information of infected individuals. However, due to privacy concerns, this method has been applied by only a few countries, such as China [
3,
4], Taiwan [
5,
6,
7], and South Korea [
8,
9].
The strongest measure to control the spread of infectious diseases is considered to be the (local) lockdown, which forces one not to come into contact with others in the community regardless of one’s health condition. The lockdown method has been implemented in many countries and is believed to have reduced the size of the spread of infectious diseases and to have avoided the collapse of the medical system caused by the rapid increase in the number of infected patients. However, it is difficult to sustain a lockdown over the long term, as it causes significant damage to people’s daily lives and economic activities.
China is still trying to achieve “zero COVID” by the monitoring method with the help of information technology. Indeed, it is credited with suppressing the numbers of COVID-19 patients from 2020 to 2021 after the outbreak in Wuhan, reducing the cases to a significantly lower level. However, two years after the outbreak in Wuhan, the situation has changed with the emergence of the Omicron variant, which has a strong infectivity via not only droplet but also aerosol transmission and can easily break through the immunity obtained by vaccination. Due to the surge in COVID-19 from the Omicron variant, massive outbreaks have occurred in many parts of the world, and the lockdown method has been used to suppress it in China.
There have been some evaluations of the extent to which a local lockdown or behavioral restrictions on infected persons have reduced the spread of infectious diseases [
10,
11,
12,
13]. This is based on the counterfactual assumption that uses the mean field SIR model over the population in which the cases are calculated as continuing to increase by the basic reproduction number,
, for every infected person during the infection period until herd immunity is achieved. Consequently, this would lead to the conclusion that any measures are effective if the daily confirmed cases tend to reduce, as it does not consider the transmission networks between individuals. From another point of view, several models regarding the impact of the behavior of individuals [
14,
15,
16] have been investigated. Their results concluded that the behavior change of individuals was an important factor in explaining the dynamics of the spread of infectious disease, along with the decision for such behavior change caused by the information about and the fear of the disease. The goal of this paper is to estimate the effects of the measures to restrict social activity by using the broken-link model.
2. Methods
We briefly review the broken-link model [
17,
18], which is proposed as a new compartment model with the consideration of unconnected infectional transmission links. The cumulative number of cases in this model is described by the Gompertz function with three parameters, the cumulative number of infected people
, the connection probability of transmission links
k, and the basic reproduction number
with constant
a. These parameters were determined by fitting the procedure to the reported data. In this paper, we define the emergence of a new wave as triggered by the appearance or invasion of new variants of a coronavirus in the community. The start date is controlled by the introduction of a “shift” parameter, which for each wave was when its cumulative number of cases reached one hundred. The
is evaluated at the starting date.
In the SIR model, which is the traditional compartment model first developed by Kermack and McKendrick in 1927 [
19], the basic reproduction number
is the averaged number of cases directly generated by one case in populations where all individuals are susceptible to infections. The
is composed of several factors including the duration of the infectivity of the affected individual, the infectiousness of the virus, and the frequency of contact with infected people in the population; so, it is determined on a regional basis. The
in the broken-link model is defined in a similar sense and can be compared with that in the SIR model.
The surge of infectious disease analyzed through the broken-link model always subsides without any measures, because an infected person quarantines if the PCR test result is positive, whether symptomatic or asymptomatic, which leads to a k less than 1. A small k is favorable for the suppression of infectious diseases and is achieved by a strong quarantine system under the monitoring method.
In this paper, the effects of behavioral restriction including lockdown are evaluated by comparing the sizes and link-connection probabilities in two surges in Taiwan, where COVID-19 was well controlled without a lockdown, and one surge in Shanghai, where a lockdown was implemented to suppress the Omicron surge.
3. Results
3.1. The Alpha Surge in Taiwan
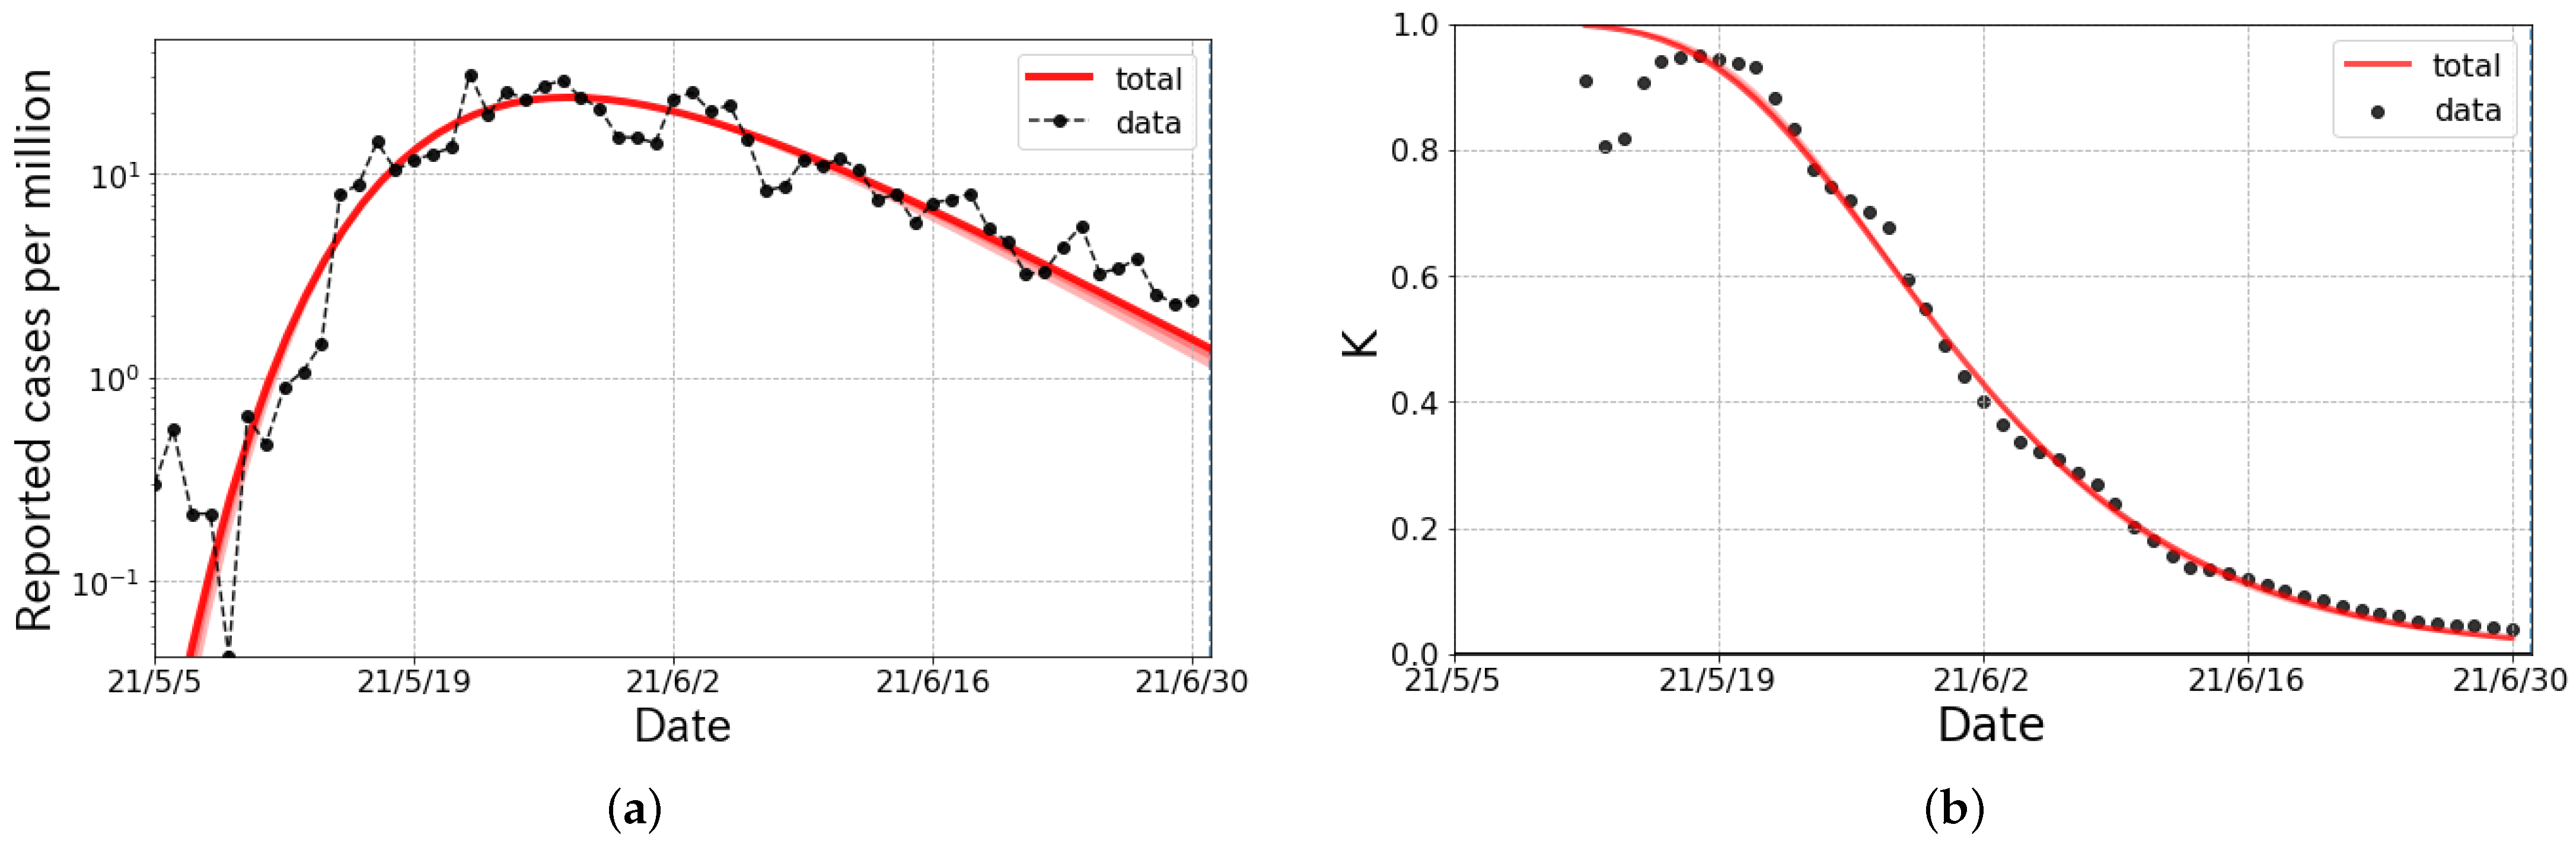
From the beginning of May to the middle of July 2021, a surge in COVID-19, due to the Alpha variant, occurred in Taiwan. Though measures such as school closures were taken, a lockdown was not. However, a “zero COVID” policy with monitoring occurred during this period. As a result of the Alpha surge, about 13 thousand people were infected in Taiwan.
The epicurve, whose numbers are reported by the Center for Systems Science and Engineering (CSSE) at Johns Hopkins University [
20], was fitted by a single Gompertz curve called a
wave. Both the numbers of the daily confirmed cases shown in
Figure 1a and the K-values in
Figure 1b were well reproduced with the fit parameters listed in
Table 1. It is interesting to compare the
k in the Alpha surge with the
k in the first surge in Taiwan from 20 March to 10 April 2020. The link-connection probability in the Alpha surge was larger than the
(
) in the first surge [
17].
Under the same policy, the k was more or less the same in magnitude. The effects of the shift from to was about a 5 times larger number of daily confirmed cases at the peak.
3.2. The Omicron Surge in Taiwan
For the period of the Omicron surge in Taiwan, the policy changed from “zero COVID” to “pandemic management” [
21,
22,
23]. After the change in measures, the daily confirmed cases markedly increased with the proliferation of BA.1.1 and BA.2 [
24] in terms of the PANGO (Phylogenetic Assignment of Named Global Outbreak) Lineages [
25,
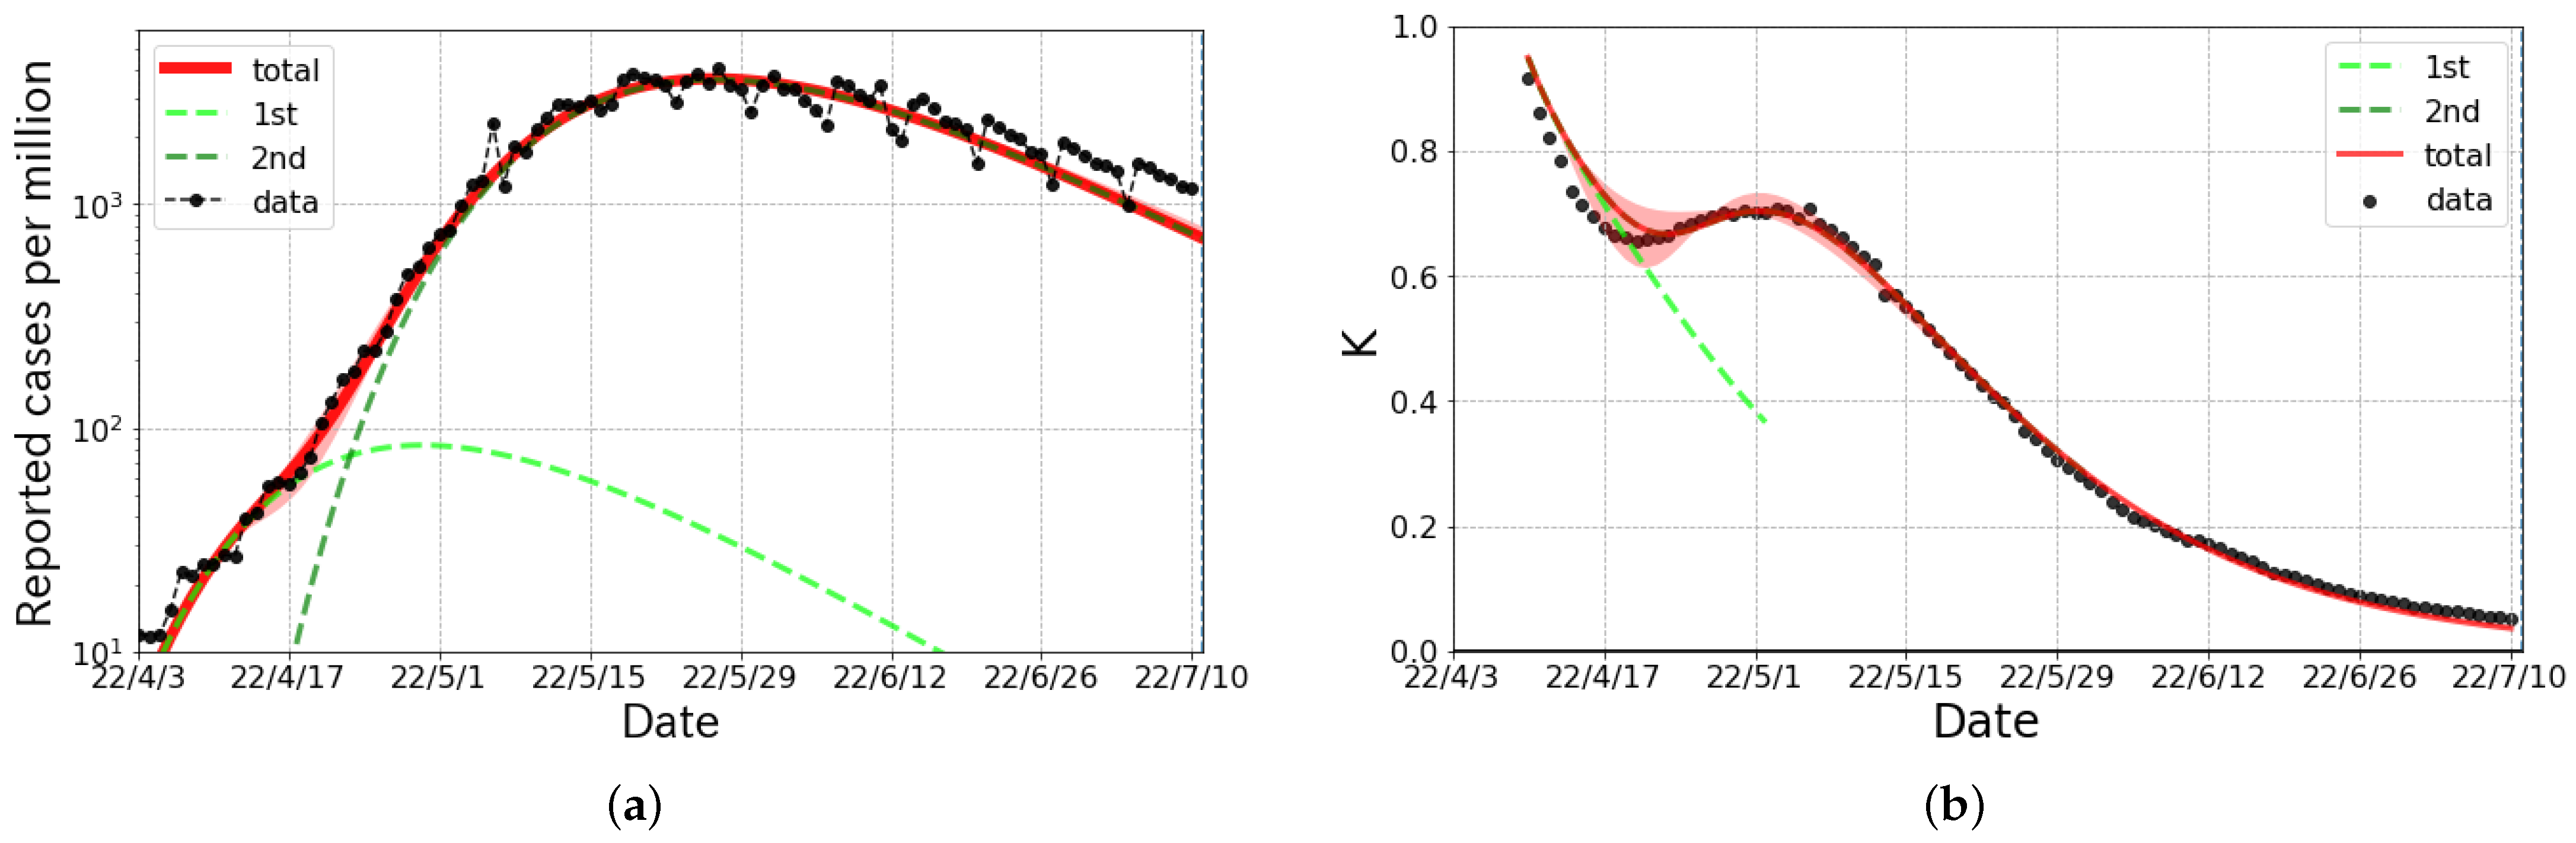
26]. As shown in
Figure 2, the Omicron surge in Taiwan was decomposed into two waves, whose onsets were synchronized to the emergence of new variants of the coronavirus. As shown in
Table 2, the size of the first wave was quite small compared with the size of the second wave. Thus, we mainly discuss the second wave, although the first wave is indispensable to reproduce the epicurve.
It is notable that the
ks for both the first and second wave were much larger than the previous waves in Taiwan because of the change in policy. The relaxation of the measures was evaluated as the change in
k from that in the Alpha surge, which was about 0.05, to about a 15 times larger number of daily confirmed cases at its peak, according to Figure 5 in Ref. [
18]. It is concluded that a “zero COVID” policy without a lockdown sufficiently reduced the value of the probability
k, when we compare the values for the Alpha surge. Moreover, the value of
k in the Omicron surge was comparable with that in Japan [
17,
18], where the monitoring method was not applied.
It is also worth noting that Taiwan did not change any major policy during the period of the Omicron surge. This fact is consistent with the natural suppression of infectious diseases due to the voluntary behavioral changes assumed in the broken-link model.
3.3. The Omicron Surge in Shanghai
In Shanghai, the Omicron surge that occurred in early March was analyzed based on the broken-link model. In order to control the surge in COVID-19, Shanghai commenced a city-wide lockdown in late March, dividing the city into east and west districts (from 28 March for the east district and from 1 April for the west district). In each of the east and west districts, all residents were given two PCR tests at the beginning of the lockdown. Those who tested positive were sent to a medical facility, and those who had close contacts with a tested positive person were placed in an isolation facility. This was called the half-lockdown [
27].
Subsequently, the full-lockdown [
28,
29,
30] commenced on 11 April, in which the entire city was managed in three areas as follows,
A “blockade area”: The area was closed, and one was not allowed to leave the house. An attendant visited them to supply foods if necessary.
A “controlled area”: Walks, etc., within a small area were allowed, but it was prohibited to gather in groups or leave one’s area.
A “precautionary area”: One could do anything within the administrative ward.
These measures were important to see how effective severe behavioral restrictions on people were against the spread of infectious diseases.
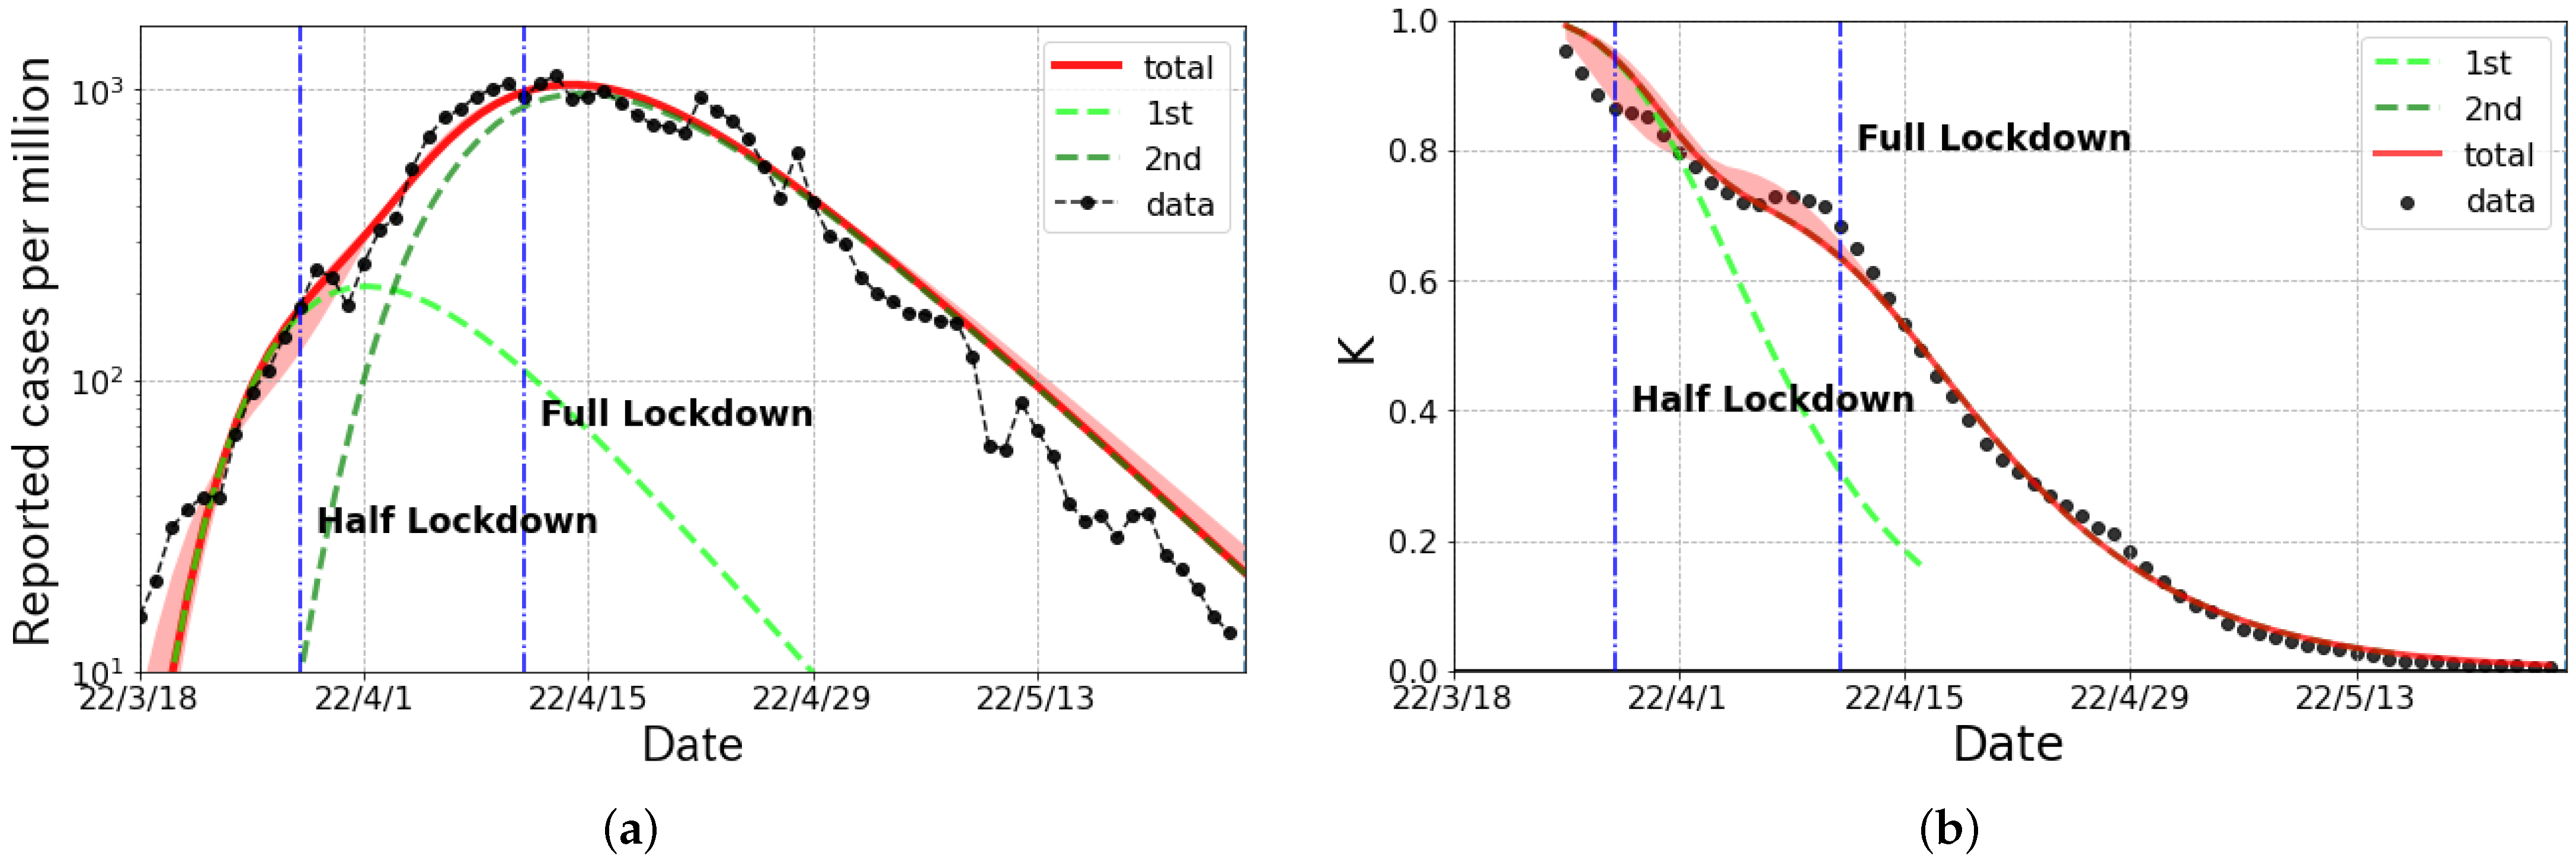
Figure 3a shows the daily confirmed cases including both symptomatic and asymptomatic cases in Shanghai from mid-March to June 2022, and the corresponding K-values are given in
Figure 3b. These curves were plotted with the data reported by the China-CDC (Chinese Center for Disease Control and Prevention) [
31]. The epicurve had a peak just after the commencement of the full-lockdown measures.
This fact does not lead to the conclusion that only the full-lockdown was meaningful to reduce the daily cases, as even the half-lockdown was a comparatively strong measure.
The broken-link model revealed that the epicurve consisted of two partial waves. The first and second wave were caused by BA.2 and BA.2.2, respectively. As shown in
Figure 3a, the magnitude of the first wave was much smaller than that of the second wave. The curve from the broken-link model nicely reproduced the epicurve and K-values in Shanghai.
The parameters of each partial wave are given in
Table 3.
4. Discussion
We analyzed the daily confirmed cases for the Alpha and the Omicron surges in Taiwan and the Omicron surge in Shanghai using the broken-link model. These data were nicely described by the combination of partial wave components.
In Taiwan, although the lockdown method was not used for the Alpha and the Omicron surge periods, they changed from a “zero COVID” policy [
5] in period of the Alpha surge to a “pandemic management” policy [
21,
22,
23] during the period of the Omicron surge, with different prevention measures. The policy change in Taiwan decreased the broken-link probability
, which caused about a 15 times larger number of daily confirmed cases at its peak position.
We also found that the k was similar in magnitude under the same policy. This fact is helpful to predict the growth of infectious diseases by the broken-link model.
Next, we discuss the Omicron surge in Shanghai. As shown in
Figure 3, the broken-link model nicely reproduced both the daily confirmed cases and the K-values. From
Table 3, both of these two waves had large basic reproduction numbers with
and
, while both of the
ks were at most
, which is quite small compared with other countries under the Omicron surge [
18]. In spite of a large
R0s in both waves, the cumulative cases in the period of the Omicron surge were only up to 2.4% of the population because of the small
k. The
k depends on the level of behavioral restrictions, political measures, immunity of humans, etc. It also depends on the strictness of the lockdown measures, but it is considered to be far less sensitive with the stringent monitoring activity of people under quarantine or isolation, because an entire epicurve can be reproduced with a single
k including before and after the commencement of a lockdown. We need to examine the risk associated with the commencement of a lockdown, since residents may come into contact with each other while hoarding commodities to prepare for it. This behavior may enhance the spread of COVID-19.
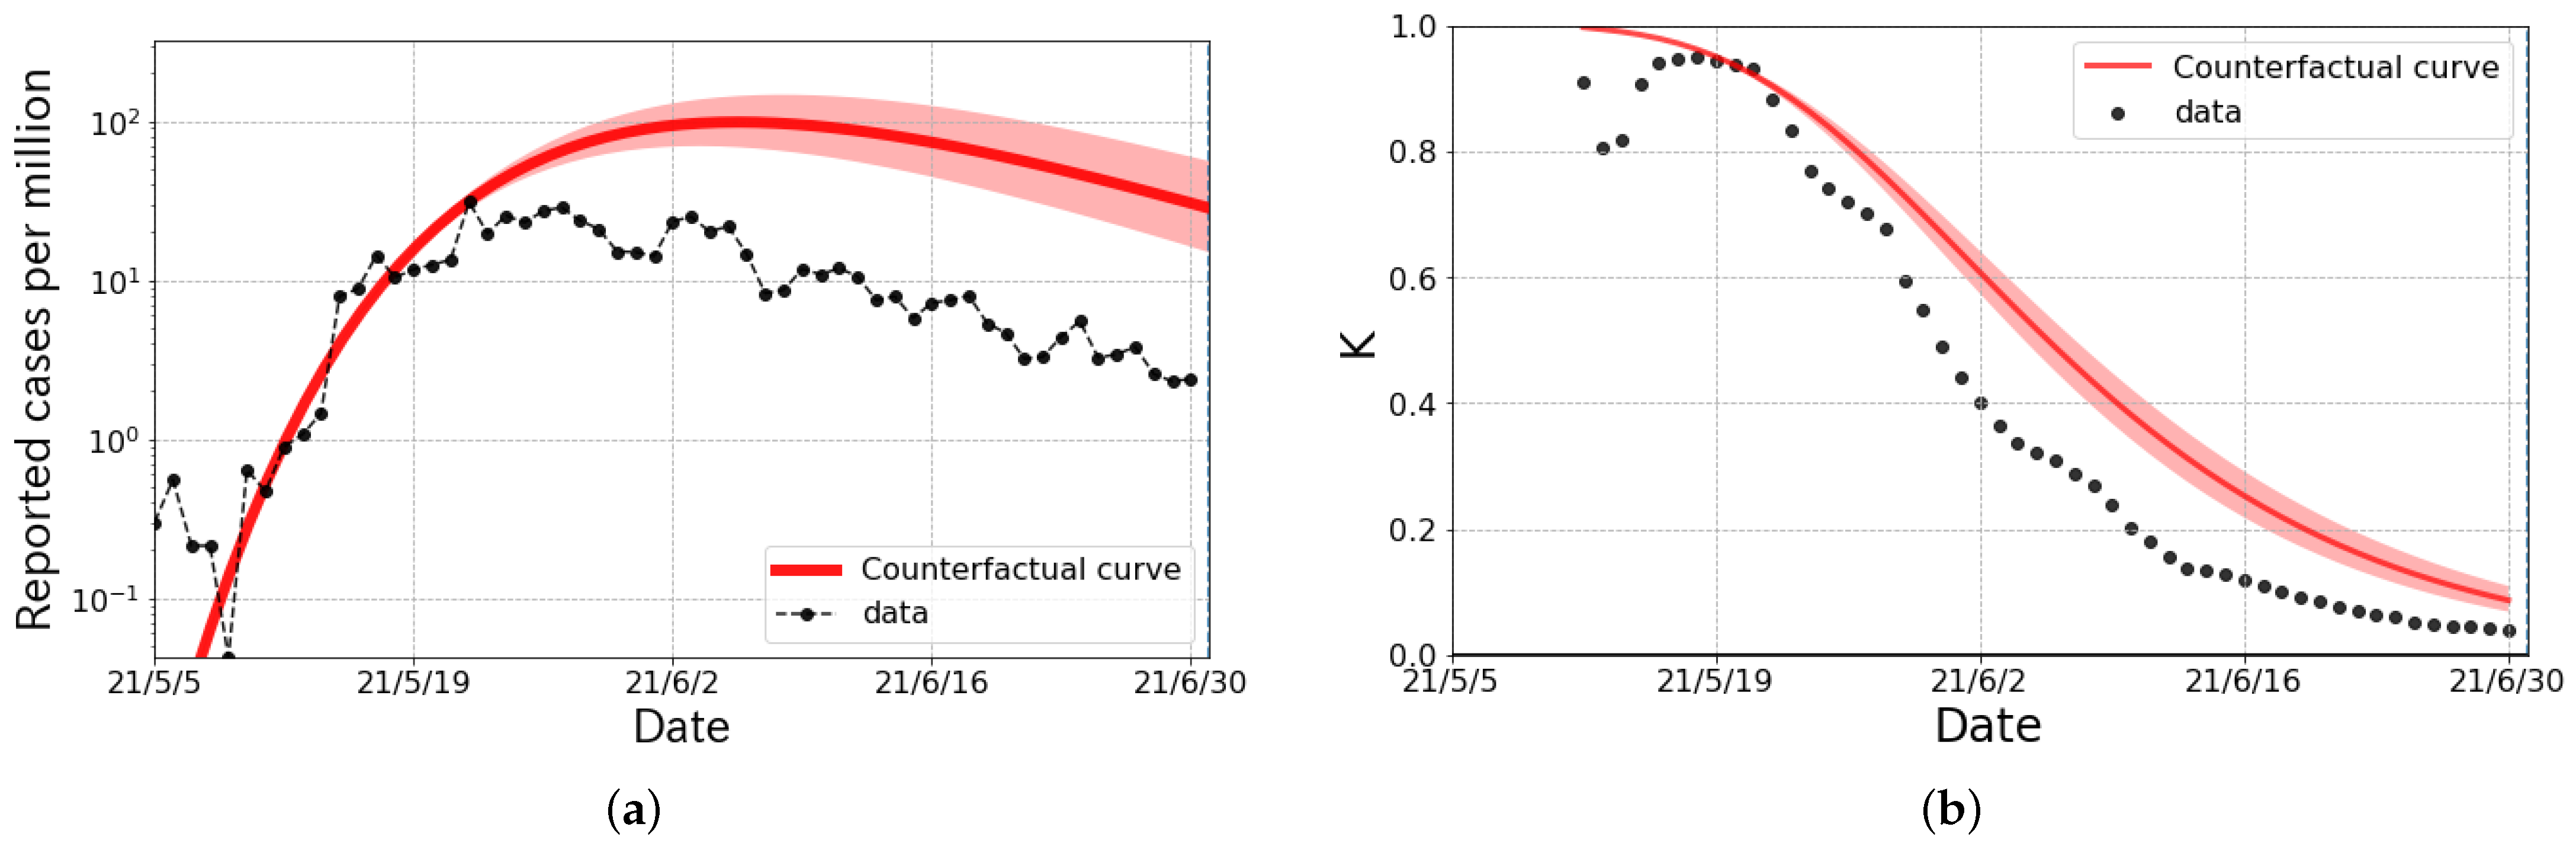
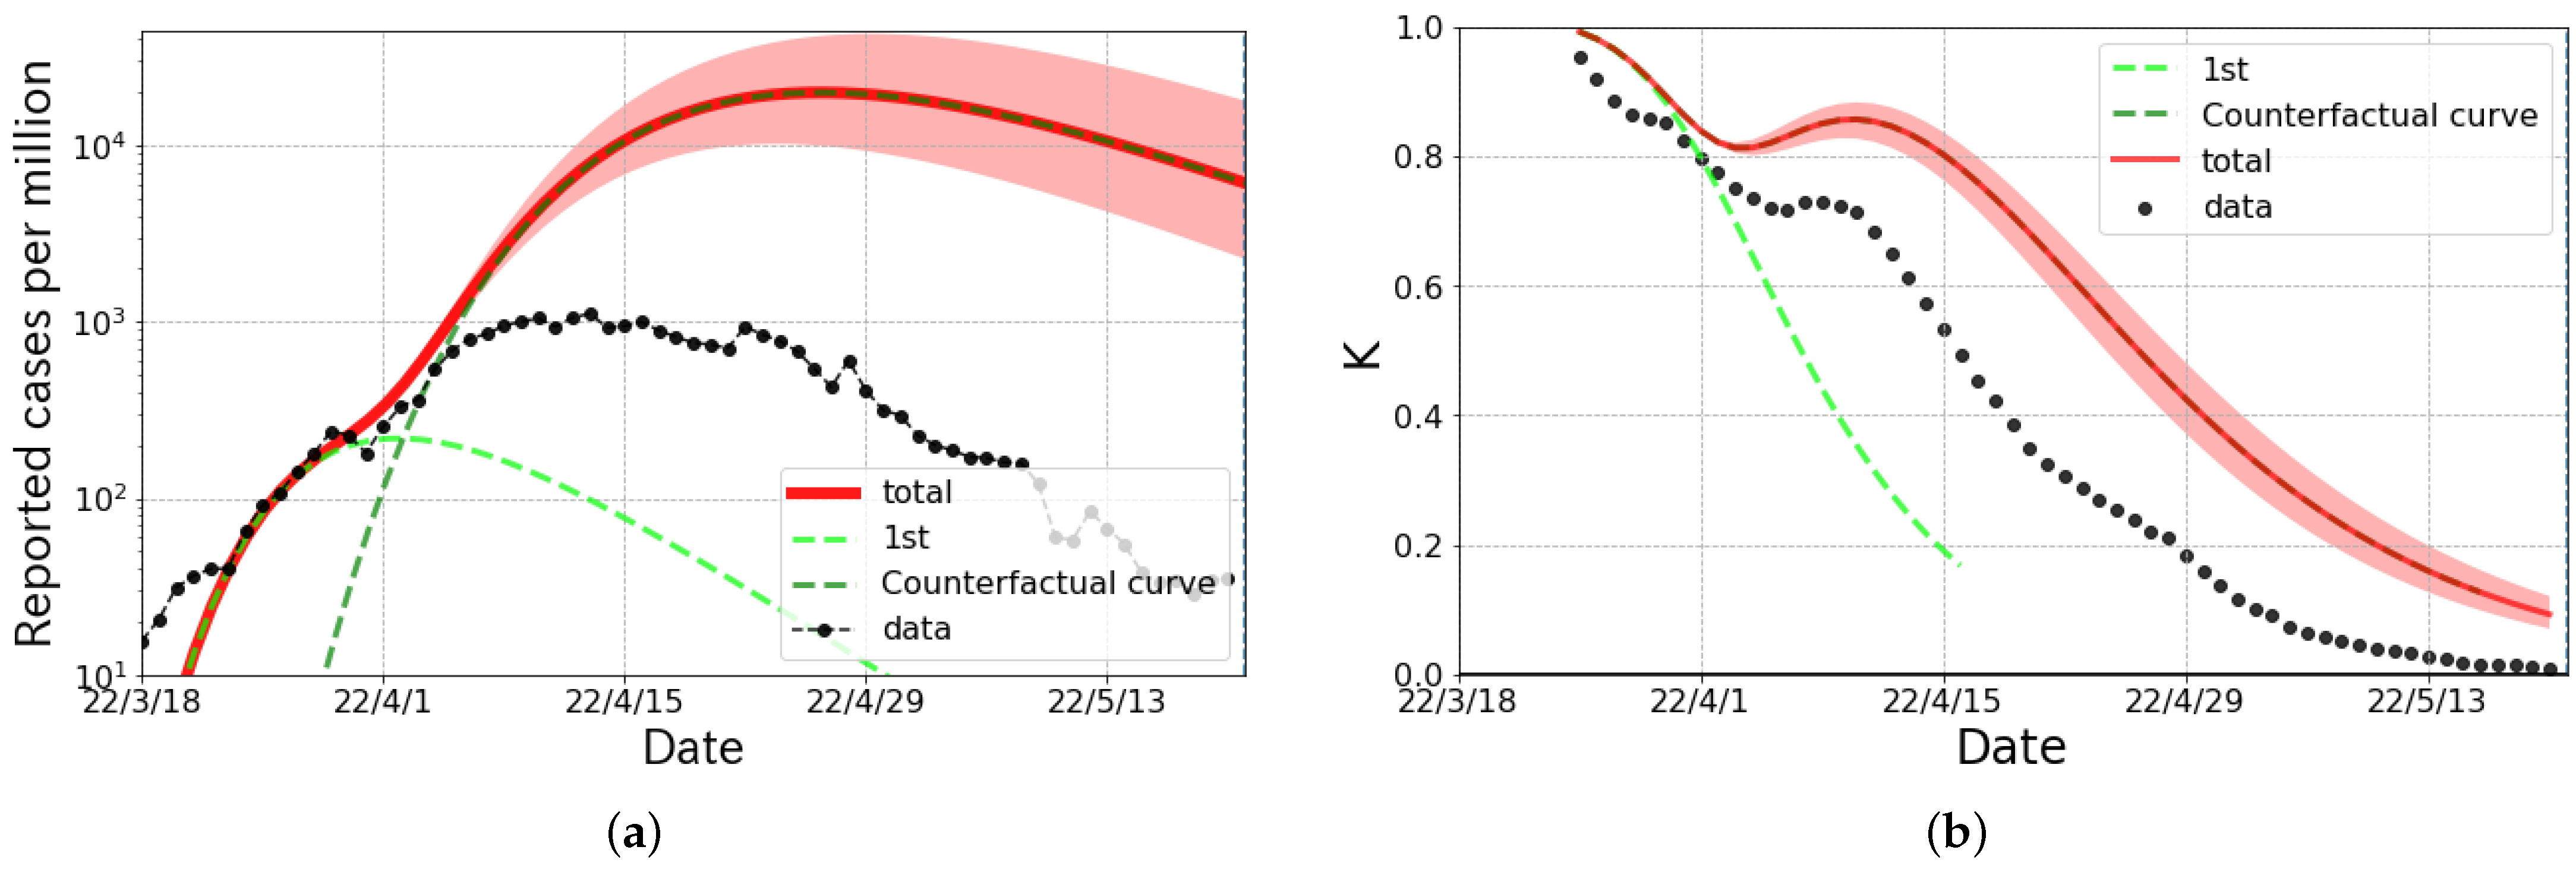
As a counterfactual hypothesis, we considered the Alpha surge in Taiwan and the second partial wave of the Omicron surge in Shanghai by changing the link-connected probability to
, which was the typical value in Japan [
17,
18]. As shown in
Figure 4, a counterfactual hypothesis curve, considered as the result of the “with COVID” policy clearly deviated from the observed data, and the total size of infected people per million was about 6 times larger than the actual numbers. The K-value of the counterfactual result was quite different from the actual data, especially in the slope. Furthermore, the result of the counterfactual hypothesis shown in
Figure 5 indicates that the maximum number of infected persons per day per million was 23 times larger, and the size of the infected population per million was 30 times larger than the actual numbers. Again, we can see the clear difference in the K-value even in the early stage of the wave. This can be considered the effect of stringent behavioral restrictions against the spread of COVID-19.
It is interesting to compare the results of the Omicron surge in Taiwan with fewer behavioral restrictions and in Shanghai with the stringent behavioral restrictions, given the similar population size. The number of cumulative cases and the link-connection probability in Taiwan was 6 times and 5% larger than that in Shanghai, respectively. This difference can be attributed to the change in the behavioral restriction policy to return to normal economic activity. Therefore, we have to consider how to save people’s lives from infectious diseases, alongside the economy, through examining the effectiveness of behavioral restriction measures and the virulence of causative viruses.
5. Conclusions
We found that the link-connection probability k defined in the broken-link model, which mainly controls the size of cumulative cases, was insensitive to lockdown measures if the activities of people under isolation or quarantine were strictly monitored. Although there is discussion of whether the behavioral monitoring of people may be an invasion of privacy, the stringent monitoring method was effective in suppressing the surge in infectious disease. In fact, comparing the data in Taiwan and Shanghai to counterfactual hypothetical results under the “zero COVID” policy, we find that the effect of measures of stringent behavioral monitoring is strongly suppresses the size of the infection. On the other hand, we found that the link-connection probability k was not very small, even when a strict lockdown was enforced. This indicates that there are unavoidable infections or transmission from one’s close neighbors if an infectious disease with high infectivity enters one’s community.
Author Contributions
Conceptualization, K.S., Y.I. and T.N.; formal analysis, K.S.; validation, T.N.; writing original draft, K.S.; writing—review and editing, Y.I. and T.N. All authors contributed to the interpretation of the results obtained in this study and the final manuscript. All authors have read and agreed to the published version of the manuscript.
Funding
This research received no external funding.
Institutional Review Board Statement
Not applicable.
Informed Consent Statement
Not applicable.
Data Availability Statement
Not applicable.
Acknowledgments
We thank the members of the Division of Scientific Information and Public Policy (SiPP) at the Center for Infectious Disease Education and Research (CiDER) Osaka University for useful discussions. This research was supported by The Nippon Foundation—Osaka University Project for Infectious Disease Prevention.
Conflicts of Interest
The authors declare no conflict of interest.
References
- Huang, C.; Wang, Y.; Li, X.; Ren, L.; Zhao, J.; Hu, Y.; Zhang, L.; Fan, G.; Xu, J.; Gu, X.; et al. Clinical features of patients infected with 2019 novel coronavirus in Wuhan, China. Lancet 2020, 395, 497–506. [Google Scholar] [CrossRef]
- Phelan, A.L.; Katz, R.; Gostin, L.O. The Novel Coronavirus Originating in Wuhan, China: Challenges for Global Health Governance. JAMA 2020, 323, 70–710. [Google Scholar] [CrossRef] [PubMed]
- Business Insider. As China Lifts Its Coronavirus Lockdowns, Authorities are Using a Color-Coded Health System to Dictate Where Citizens Can Go. Here’s How It Works. Available online: https://www.businessinsider.com/coronavirus-china-health-software-color-coded-how-it-works-2020-4 (accessed on 29 July 2022).
- The Associated Press. Chinese Smartphone Health Code Rules Post-Virus Life. Available online: https://apnews.com/article/virus-outbreak-health-smartphones-ap-top-news-international-news-88f837f24461c6e40480c96b55a4b6db (accessed on 29 July 2022).
- Ministry of Foreign Affairs, Republic of China (Taiwan). The Taiwan Model for Combating COVID-19. Available online: https://en.mofa.gov.tw/theme.aspx?n=2294&sms=294&s=87 (accessed on 25 June 2022).
- Tsou, H.H.; Cheng, Y.C.; Yuan, H.Y.; Hsu, Y.T.; Wu, H.Y.; Lee, F.J.; Hsiung, C.A.; Chen, W.J.; Sytwu, H.K.; Wu, S.I.; et al. The effect of preventing subclinical transmission on the containment of COVID-19: Mathematical modeling and experience in Taiwan. Contemp. Clin. Trials 2020, 96, 106101. [Google Scholar] [CrossRef] [PubMed]
- Jian, S.-W.; Cheng, H.-Y.; Huang, X.-T.; Liu, D.-P. Contact tracing with digital assistance in Taiwan’s COVID-19 outbreak response. Int. J. Infect. Dis. 2020, 101, 348–352. [Google Scholar] [CrossRef] [PubMed]
- South Korea Ministry of Health and Welfare. COVID-19 Response. Available online: http://ncov.mohw.go.kr/en/baroView.do?brdId=11&brdGubun=111 (accessed on 25 June 2022).
- Choi, K.; Choi, H.; Kahng, B. COVID-19 epidemic under the K-quarantine model: Network approach. Chaos Solitons Fractals 2022, 157, 111904. [Google Scholar] [CrossRef] [PubMed]
- Kucharski, A.J.; Klepac, P.; Conlan, A.J.; Kissler, S.M.; Tang, M.L.; Fry, H.; Gog, J.R.; Edmunds, W.J.; Emery, J.C.; Medley, G.; et al. Effectiveness of isolation, testing, contact tracing, and physical distancing on reducing transmission of SARS-CoV-2 in different settings: A mathematical modelling study. Lancet Infect. Dis. 2020, 20, 1151–1160. [Google Scholar] [CrossRef]
- MacIntyre, C.R. Case isolation, contact tracing, and physical distancing are pillars of COVID-19 pandemic control, not optional choices. Lancet Infect. Dis. 2020, 20, 1105–1106. [Google Scholar] [CrossRef]
- Aleta, A.; Martin-Corral, D.; Pastore, Y.; Piontti, A.; Ajelli, M.; Litvinova, M.; Chinazzi, M.; Dean, N.E.; Halloran, M.E.; Longini, I.M., Jr.; et al. Modelling the impact of testing, contact tracing and household quarantine on second waves of COVID-19. Nat. Hum. Behav. 2020, 4, 964–971. [Google Scholar] [CrossRef] [PubMed]
- Grassly, N.C.; Pons-Salort, M.; Parker, E.P.; White, P.J.; Ferguson, N.M.; Ainslie, K.; Baguelin, M.; Bhatt, S.; Boonyasiri, A.; Brazeau, N.; et al. Comparison of molecular testing strategies for COVID-19 control: A mathematical modelling study. Lancet Infect. Dis. 2020, 20, 1381–1389. [Google Scholar] [CrossRef]
- Singh, M.; Marathe, A.; Marathe, M.V.; Swarup, S. Behavior model calibration for epidemic simulations. In Proceedings of the 17th International Conference on Autonomous Agents and MultiAgent Systems (AAMAS’ 18), Stockholm, Sweden, 10–15 July 2018; International Foundation for Autonomous Agents and Multiagent Systems: Richland, SC, USA, 2018; pp. 1640–1648. [Google Scholar]
- Bi, K.; Chen, Y.; Zhao, S.; Ben-Arieh, D.; Wu, C.-H.J. Modeling learning and forgetting processes with the corresponding impacts on human behaviors in infectious disease epidemics. Comput. Ind. Eng. 2019, 129, 563–577. [Google Scholar] [CrossRef]
- Liu, Y.; Shi, H.; Li, Y.; Amin, A. Factors influencing Chinese residents’ post-pandemic outbound travel intentions: An extended theory of planned behavior model based on the perception of COVID-19. Tour. Rev. Aiest Int. Assoc. Sci. Expert. Tour. 2021, 76, 871–891. [Google Scholar] [CrossRef]
- Nakano, T.; Ikeda, Y. Novel Indicator to Ascertain the Status and Trend of COVID-19 Spread: Modeling Study. J. Med. Internet Res. 2020, 22, e20144. Available online: https://www.jmir.org/2020/11/e20144 (accessed on 15 July 2022). [CrossRef] [PubMed]
- Ikeda, Y.; Sasaki, K.; Nakano, T. A New Compartment Model of COVID-19 Transmission: The Broken-Link Model. Int. J. Environ. Res. Public Health 2022, 19, 6864. [Google Scholar] [CrossRef] [PubMed]
- Kermack, W.O.; McKendrick, A.G. A Contribution to the Mathematical Theory of Epidemics. Proc. R. Soc. A 1927, 115, 700–721. [Google Scholar]
- Dong, E.; Du, H.; Gardner, L. An interactive web-based dashboard to track COVID-19 in real time. Lancet Inf. Dis. 2020, 20, 533–534. Available online: https://github.com/CSSEGISandData/COVID-19 (accessed on 15 July 2022). [CrossRef]
- Executive Yuan, Republic of China (Taiwan). Government ‘Pushes New Taiwan Model’ of Zero Severe COVID Cases and Effective Management of Mild Cases. Available online: https://english.ey.gov.tw/Page/61BF20C3E89B856/30b342f1-1261-408c-b915-a61a9af78e29 (accessed on 25 June 2022).
- Taiwan Centers for Disease Control. Epidemic Prevention Measures to be Loosened from March 1 to March 31; CECC Makes Adjustments to Related Measures and Urges Public to Voluntarily Follow Epidemic Prevention and Control Measures to Safeguard Epidemic Prevention Efforts in Community. Available online: https://www.cdc.gov.tw/En/Bulletin/Detail/kksm1_X69KAuSs_gyR-7Dg?typeid=158 (accessed on 25 June 2022).
- Taiwan Centers for Disease Control. CECC to Relax Home Isolation Rules Starting Today and Make Rolling Adjustments Based on Pandemic Situation. Available online: https://www.cdc.gov.tw/En/Bulletin/Detail/zDWL6S8oSvKsHOBjkLUsgQ?typeid=158 (accessed on 25 June 2022).
- Mullen, J.L.; Tsueng, G.; Latif, A.A.; Alkuzweny, M.; Cano, M.; Haag, E.; Zhou, J.; Zeller, M.; Hufbauer, E.; Matteson, N.; et al. Outbreak.info: A Standardized, Open-Source Database of COVID-19 Resources and Epidemiology Data Outbreak.info. 2020. Available online: https://outbreak.info/ (accessed on 25 June 2022).
- Rambaut, A.; Holmes, E.C.; O’Toole, Á.; Hill, V.; McCrone, J.T.; Ruis, C.; du Plessis, L.; Pybus, O.G. A Dynamic Nomenclature Proposal for SARS-CoV-2 Lineages to Assist Genomic Epidemiology. Nat. Microbiol. 2020, 7, 1403–1407. [Google Scholar] [CrossRef] [PubMed]
- PANGO Lineages: Latest Epidemiological Lineages of SARS-CoV-2. Available online: https://cov-lineages.org/index.html (accessed on 25 June 2022).
- Shanghai Municipal Health Commission. Notice on the City-Wide Nucleic Acid Screening. Available online: https://wsjkw.sh.gov.cn/xwfb/20220327/b9d985cedb4042a2843fb8b108c401f4.html (accessed on 29 July 2022). (In Chinese)
- Shanghai Municipal Health Commission. The City’s Implementation of Zoning and Grading of Differentiated Prevention and Control. Available online: https://wsjkw.sh.gov.cn/xwfb/20220411/f220dd0ff87448f7981c33cd5ee3b528.html (accessed on 29 July 2022). (In Chinese)
- NIKKEI Asia. Inside Shanghai’s COVID Lockdown Nightmare. Available online: https://asia.nikkei.com/Spotlight/The-Big-Story/Inside-Shanghai-s-COVID-lockdown-nightmare (accessed on 29 July 2022).
- Al Jazeera English. Shanghai Tweaks Lockdown Rules Amid COVID-19 Surge. Available online: https://www.aljazeera.com/news/2022/4/12/shanghai-tweaks-lockdown-rules-amid-covid-19-surge (accessed on 29 July 2022).
- Chinese Center for Disease Control and Prevention (China CDC). Tracking the Epidemic. 2022. Available online: https://weekly.chinacdc.cn/news/TrackingtheEpidemic.htm (accessed on 25 June 2022).
| Publisher’s Note: MDPI stays neutral with regard to jurisdictional claims in published maps and institutional affiliations. |
© 2022 by the authors. Licensee MDPI, Basel, Switzerland. This article is an open access article distributed under the terms and conditions of the Creative Commons Attribution (CC BY) license (https://creativecommons.org/licenses/by/4.0/).


