1. Introduction
Working environments are characterized by different environmental factors, including elements of biological, chemical and/or physical nature. Physical factors in the form of noise and vibrations can occur, for example, in stationary machines or commercial vehicles. When exceeding limit values, sound exposure can lead to hearing loss, and exposure to whole-body vibration (WBV) can cause diseases, e.g., of the spine. However, even below the legally defined lower trigger and daily exposure limit values, sound and vibration can be perceived as annoying in such working situations as well as reduced comfort. This could affect concentration at work, leading to a reduction in performance. Occupational noise and vibration are evaluated based on weighted RMS sound pressure level and, in the case of vibration exposure, on weighted RMS acceleration. However, although both stimuli can occur simultaneously at the workplace, both stimuli are assessed separately, even though humans perceive their environment multimodally [
1], and thus, interactions are likely to occur.
Hence, in recent decades, several authors have focused on the exploration of the perception of simultaneous sound and vibration and possible interaction effects between them, aiming to describe this relationship mathematically in the form of models. Many of these studies have been carried out using different exposure values and units as well as different environments where combined noise and vibration can occur, as in buildings [
2,
3,
4,
5], vehicles [
6,
7,
8,
9], airplanes [
10] or helicopters [
11,
12]. Trolle et al. [
13] summarize some studies on WBV in buildings caused by ground transportation. They conclude that in all considered studies, which investigated combined noise and vibration exposure, both stimuli contribute to total annoyance, and, therefore, both should be taken into account.
However, it has not yet been conclusively determined how much the vibration influences total annoyance and how much the noise influences total annoyance. Furthermore, it is unclear whether these influences apply to the entire level range and, if not, how a perceptual interaction might be described. Howarth and Griffin [
3] and Paulsen and Kastka [
5] suggest prediction equations consisting of additive terms from vibration and noise exposure only but without an extra interaction term. However, in a previous study, Howarth and Griffin [
2] considered including a multiplicative term of noise and vibration in the additive equation. However, this did not result in an improvement of the model performance compared to the equation without the interaction term. Paulsen and Kastka [
5] concluded that noise has more impact on total annoyance than vibration. Nicht and Altinsoy [
7], as well as Maravich and Altinsoy [
9], came to similar conclusions in their studies. Maravich and Altinsoy [
9] also propose a model in which the interaction is also taken into account as a multiplicative interaction term. Another interaction is presented by Decor et al. [
12] for combined noise and vibration exposure in helicopters. The authors found that the discomfort caused by both stimuli can be predicted using an additive equation that includes the difference of both contributions as an additional term. They note that the prediction with the difference of both contributions provides better results than the equation with a multiplicative interaction term. Another way of expressing the interaction or mutual influence of noise and vibration is proposed by Aladdin et al. [
14] by defining a perturbation effect of noise on discomfort caused by WBV. They determine ranges in which noise exposure has a synergistic or antagonistic effect on vibration, and predict discomfort by vibration exposure with an additional factor expressing the perturbation effect of noise.
However, not only the exclusion of interaction effects between sound and vibration exposures can lead to deviations in the prediction of total annoyance, but also frequency weightings for noise and for vibration could influence the prediction. In the case of vibration, the International Standard ISO 2631-1 [
15] provides frequency weightings for the evaluation of WBV in relation to health considerations as well as comfort aspects. The most common frequency weighting for the vertical direction of vehicle vibration, i.e., WBV during a seated position, is the W
k-weighting. The standard suggests that signals with equal frequency weighted RMS accelerations produce the same perceived discomfort. However, in the past, this standard was also viewed critically [
16]. In recent years, there have been studies that have shown that there can be deviations in the evaluation, e.g., that vibrations with identical RMS frequency-weighted signals cause different degrees of comfort [
11,
16,
17,
18,
19]. In those cases, the discomfort of the vibration could be over- or underestimated. Kaneko et al. [
18] investigated whether random vibrations with the same W
k-frequency-weighted RMS acceleration but different vibration spectra cause different comfort reactions. For this purpose, the participants evaluated vibrations with three different spectra (equal intensity at different frequencies; most intensity at the high frequencies and most intensity at the low frequencies) in five different acceleration steps ([0.2, 0.4, 0.8, 1.2, 1.8] m/s
2) using a category scale rated with five items, like in ISO 2631-1 [
15] in Annex C.2.3. The results show that the participants perceived the low-frequency vibrations as the most annoying vibration followed by the vibration with equal intensity at different frequencies. The vibrations with the high-frequency component were the least annoying vibration. The effect was only present from vibrations with an acceleration of 0.8 m/s
2. Low vibration levels at 0.2 m/s
2 were not perceived as annoying by the participants, and, therefore, no difference was observed. In contrast, Huang and Li [
17] showed that for micro commercial vehicles, despite the same RMS frequency weighted acceleration, vibrations with dominant high frequency components and magnitudes from 1.5 m/s
2 were perceived as more annoying than those without.
Thus, in some cases, frequency weighting of the measured acceleration alone might not be sufficient to predict the degree of comfort, and it is possible that other attributes become more important. The use of frequency weightings is also insufficient for the evaluation of noise annoyance in some scenarios. Psychoacoustic parameters such as loudness, sharpness or roughness [
20] can be more suitable for quality or annoyance [
21]. The question arises whether this equivalence or these methods also apply to vibrations. Declor et al. [
11] addressed the issue of improving the evaluation index of the ISO 2631-1 [
15] Annex C for the case of amplitude-modulated WBV. They showed that helicopter vibrations frequently contain amplitude modulation, leading to greater discomfort than non-modulated vibrations and thus to an underestimation according to ISO 2631-1 [
15]. They suggest a penalty for amplitude-modulated signals, which leads to a better prediction of the discomfort of such signals. Another approach to describe WBV is based on the sensory–perceptual attributes by Rosenkranz and Altinsoy [
22]. They describe vibration-based layperson understandable perceptual attributes such as “up and down”, “tingling” and “weak”, which refer to waveforms such as sinusoidal, amplitude-modulated sinusoidal, white Gaussian noise and signal characteristics such as vibration level, frequency, bandwidth and modulation frequency. The relationship between physical parameters and elicited verbal attribute rating were determined through perception experiments with participants on a motion platform. The attribute “tingling” for sinusoidal signals for example, is associated with the frequency range around 50 Hz at levels further above the perception threshold, whereby the sensation described as “up and down” is felt by the participants below 10 Hz. Furthermore, they utilized the observed mappings to synthesize vibration for virtual reality car scenarios [
23]. Currently, it is still unclear, whether these attributes are associated with discomfort or annoyance yet. Another approach is provided by the study of Krause et al. [
24], in which the unpleasantness of sinusoidal WBV with different frequencies and levels was connected with the relevant body parts in the context of aircraft. Using a body map, they asked their participants in which parts of the body the discomfort was perceived. The results show that different body parts are involved in the perception of unpleasantness, but for all examined frequencies, the buttock is associated with higher unpleasantness.
Many studies mainly concentrate on evaluating the perception of WBV, while others investigate the interaction between sound and vibration and mostly focus on the intensity of both factors. The perception of annoyance could be influenced by different characteristics of sound and vibration, which might vary depending on the type of vehicle. In a field study comparing electric and combustion engine vehicle, Wang et al. [
25] searched for sound and vibration characteristics of different vehicle types in terms of overall ride comfort. The characteristics that were important for the annoyance judgment differed depending on the vehicle type. However, only a limited number of studies explicitly investigate the interaction of spectral as well as temporal characteristics in both sound and vibration signals. In a series of studies, Oetjen et al. [
26] investigated the perception of modulation-based psychoacoustic measures in the context of WBV. In one study, they investigated the perception of attributes such as roughness and unpleasantness of recorded vehicle sounds in the presence of vibration. They found that the perception of the attributes was affected by the change in vibration level and concluded that the evaluation of sound quality in vehicles by purely acoustical perception experiments might not reflect reality. Töpken et al. [
27], for example, examined the interaction between the spectrum of sound and vibrations with respect to congruent tonal components in both stimuli using the example of the pleasantness of sound and vibrations on airplane seats. However, interactions between frequency levels and with or without a congruent tone were not significant. Maravich and Altinsoy [
9,
28] also studied the influence of different vibration spectra of simultaneous noise and vibration. The interaction effects between noise and vibration levels were significant, but the vibration spectrum had no significant influence on the total annoyance, although there are tendencies that the lower frequency components of the WBV are perceived as more annoying despite equal W
k-weighted levels in one of their studies [
9]. However, the results were ambiguous, possibly because of potential crosstalk to other axis and due to the small number of participants in one of their studies [
9]. A different type of signal was investigated by Festa et al. [
29]. They examined the mutual effects of tactile and auditory stimuli on the intensity perception of transient road excitations. Their results showed that neither vibration nor noise had any influence on the perception of the intensity of the other stimulus.
To investigate the interactions of noise and WBV and the influence of the vibration spectrum of frequency-weighted WBV in commercial vehicles, two experiments with simultaneous sound and WBV were conducted under the following assumptions: (1) There is an interaction between noise and WBV. (2) Sinusoidal components in WBV change the perception of total annoyance in commercial vehicles despite the same Wk-weighted RMS vibration. Both experiments are based on recorded signals, which have been modified.
In experiment 1, the described perceptual attributes of WBV by Rosenkranz and Altinsoy [
22], which were presented in this section, are used. Two different frequencies, which are connected to different perceptual attributes, were selected and inserted or removed as sinusoidal components in the recorded vibration signal. In experiment 2, a recorded vibration signal was strongly modified from the original recording, and the categories broadband, narrowband, sinusoidal as well as mixed WBV were created and could be compared.
Both experiments are part of an experimental series of a DFG-funded project. The aim of this project is to create a prediction model for the annoyance of simultaneous noise and vibrations in vehicles. For this purpose, the signals recorded in vehicles are modified to create further realistic scenes. These scenes are connected to the annoyance ratings of the participants in order to create a prediction model from the entirety of the data.
2. Experimental Setup
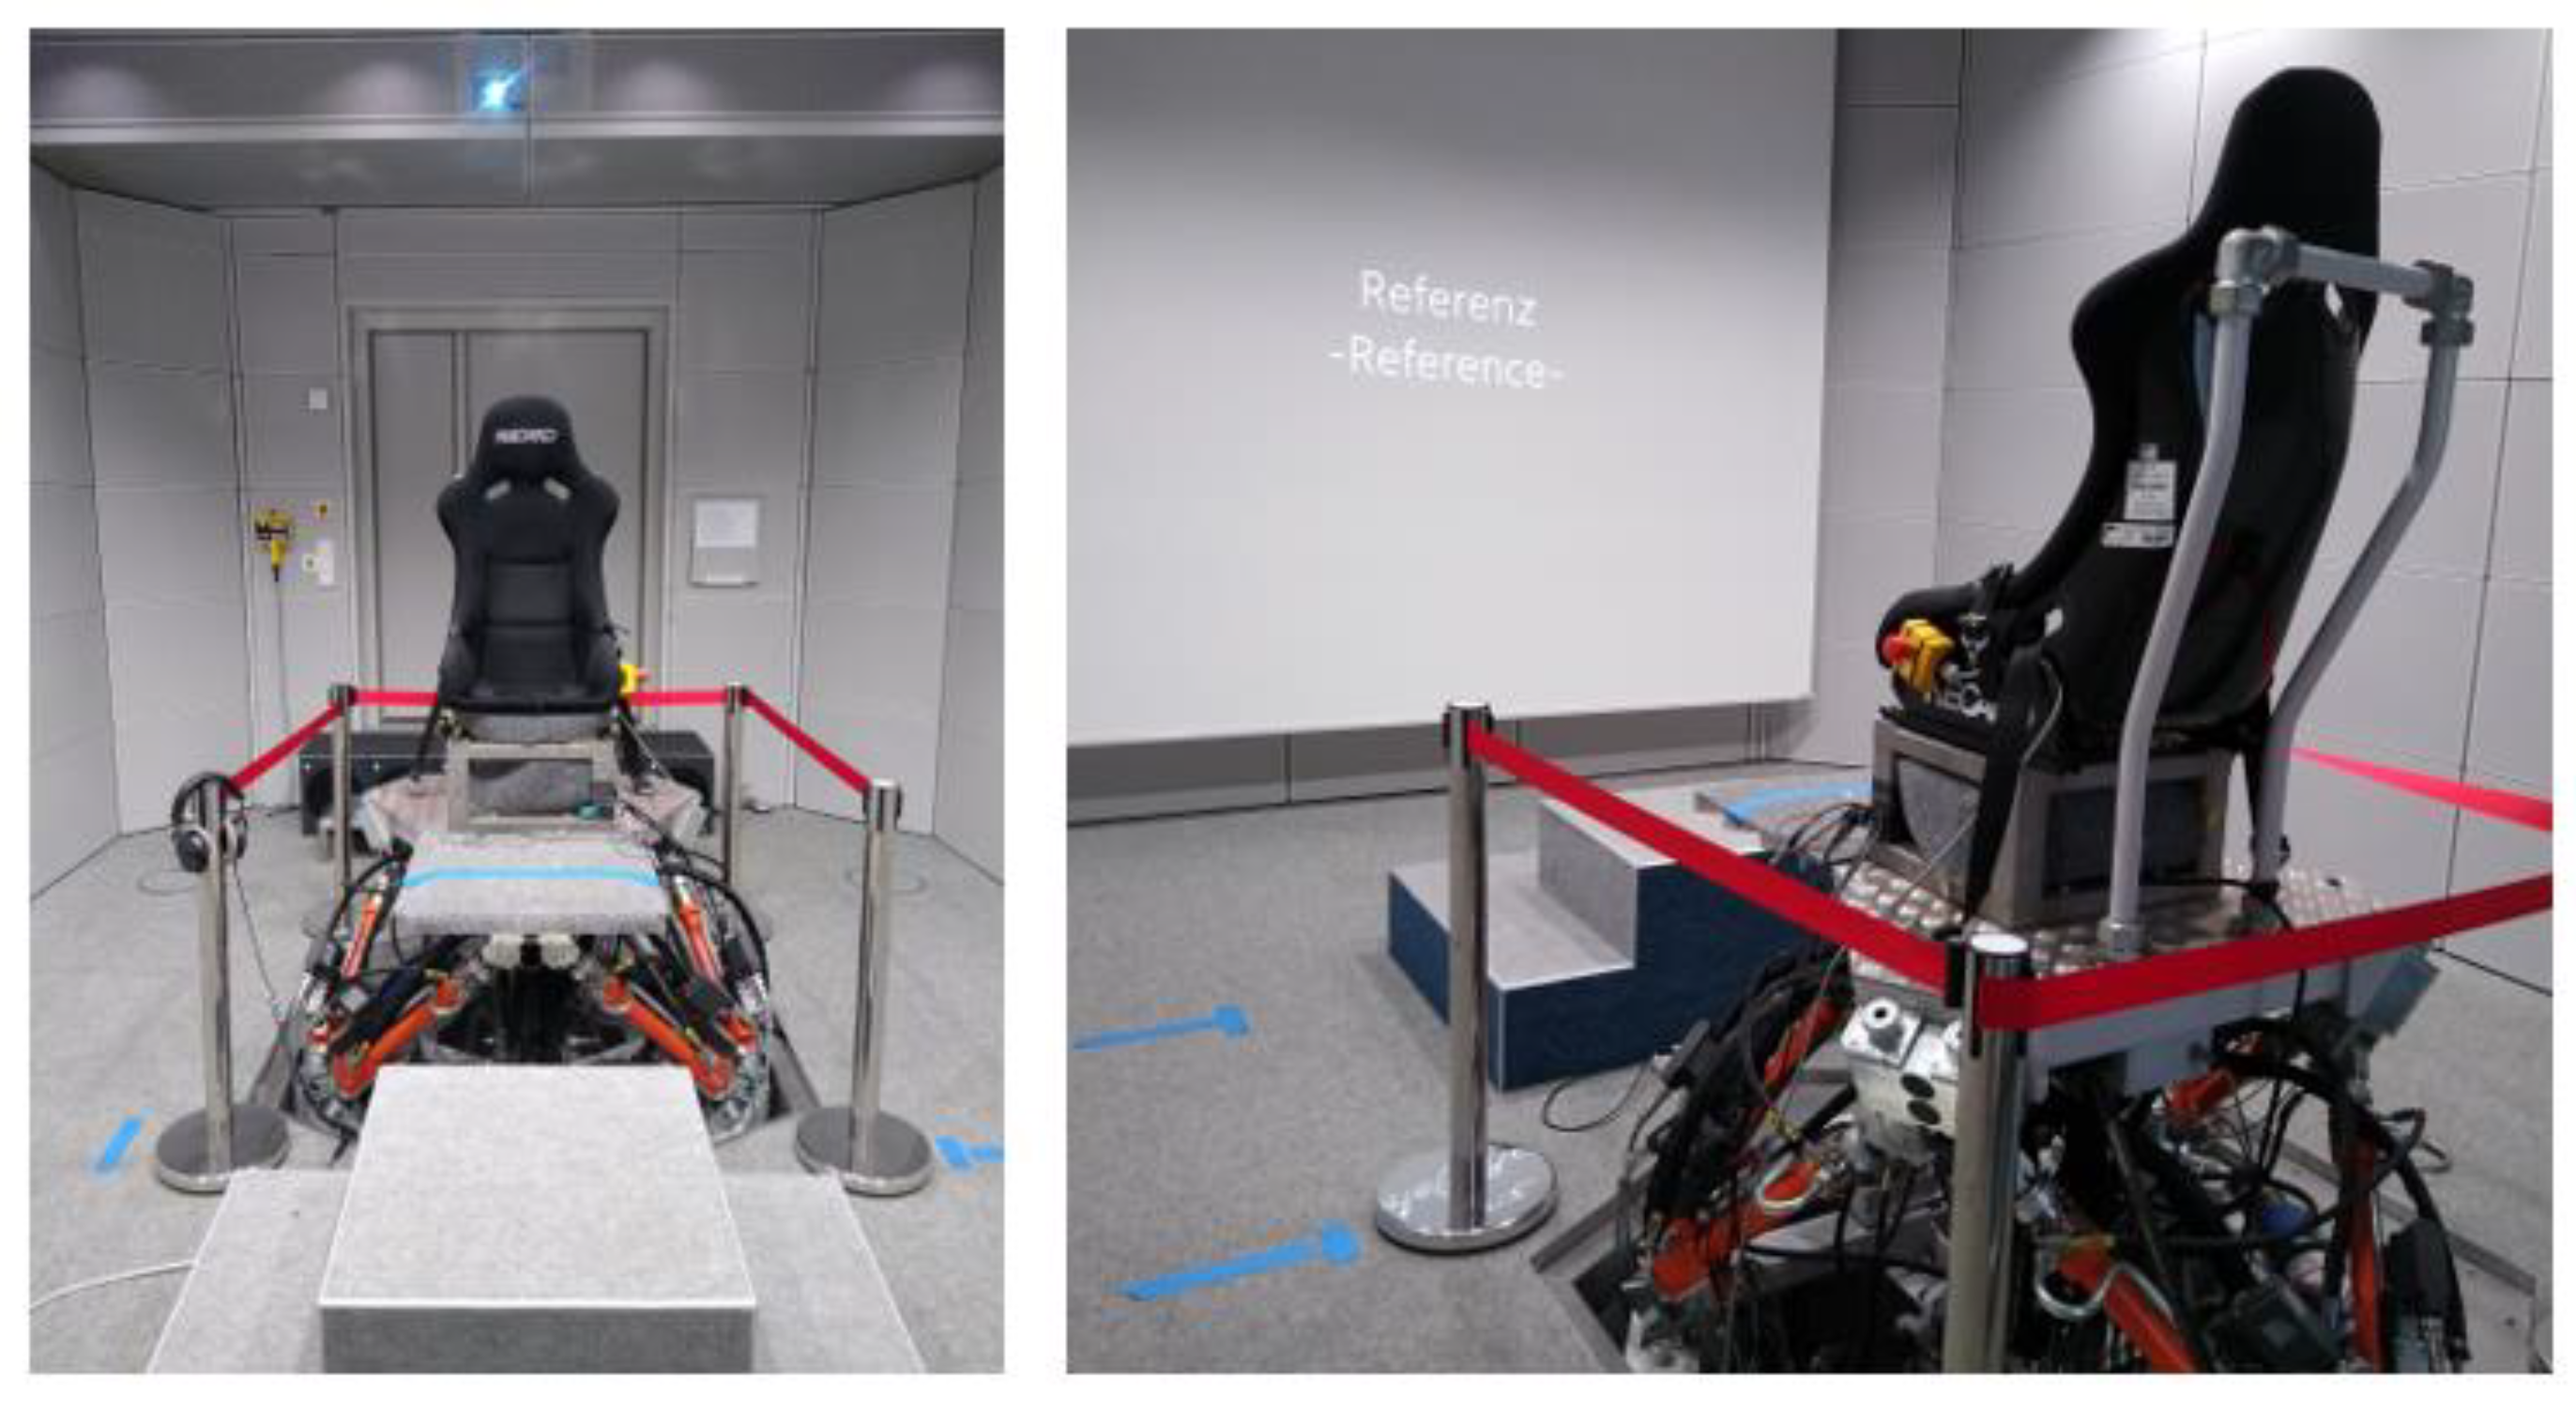
Both perception experiments were carried out in the multimodal measurement laboratory of the TU Dresden [
30], see
Figure 1, which can reproduce seat vibrations and noise simultaneously.
For the reproduction of the seat vibrations, there is a hydraulic motion platform (Hagenbuch Hydraulic Systems AG, Ebikon, Switzerland) on which a vehicle seat is mounted. This platform is able to reproduce motions in three translational and three rotational directions. In order to complement the system, there is also an electrodynamic shaker (ESE 201 Typ 11075, VEB Schwingungstechnik und Akustik WIB, Dresden, Germany) under the vehicle seat, which can reproduce vertical vibrations for higher frequencies. For each participant and before each experiment, the transfer function of the electrodynamic shaker was compensated by using an FIR filter. The reproduced vibrations of the whole system, including crosstalk to lateral axes, were measured using a seat pad (Triaxial Seat Accelerometer Type 4515B, Brüel & Kjær Sound & Vibration Measurement A/S, Nærum, Denmark) and described as well as discussed in the respective sections.
The sound was presented via headphones (DT 990 Pro 250 OHM, Sennheiser, Germany) with a preamp (One-AMP G93, Lake People electronic GmbH, Konstanz, Germany). The level of the stimuli was calibrated using a head and torso simulator (45BB KEMAR Head and Torso, GRAS Sound & Vibration, Holte, Denmark) with integrated microphones (Type 40AD, GRAS Sound & Vibration, Holte, Denmark).
In order to make sure that the background noise of the motion platform was masked by the stimuli, the noise was measured by using a binaural headset (BHS II, Head Acoustics, Herzogenrath, Germany). The A-weighted RMS sound pressure level of the lowest reproduced level was more than 15 dB higher than the background noise of the platform.
The Graphical User Interface (GUI) for evaluation was presented by using a projector, and the entries could be made using a mouse and numerical pad.
3. Experiment 1
3.1. Hypothesis
In addition to the interaction effects between sound and vibrations in vehicles, this study also investigates the perception of the vibration spectrum in a multimodal context.
When perceiving acoustic signals, certain perceptual characteristics of noises, such as the presence of sinusoidal components, can lead to greater annoyance, despite the same A-weighted RMS levels, which are taken into account in current standards as a tonality penalty [
31,
32]. Furthermore, there are also indications that higher-frequency tonal components are perceived as more annoying than those below 1 kHz in comparison to equal loudness contours [
33].
Such established psychoacoustic relationships, as in acoustics, in which, in this case, the presence of sinusoidal components leads to greater annoyance, do not exist in the perception of WBV and have only rarely been investigated. Due to the assumption that WBV with the same Wk-weighted RMS values should cause the same discomfort, there are fewer studies on whether some perceptual properties can possibly increase the discomfort or whether such properties only become relevant with simultaneous noise.
Rosenkranz and Altinsoy [
22] developed a design language for WBV in the context of virtual environments independent of existing WBV evaluation, such as ISO 2631-1 [
15]. They investigate different perceptual attributes for the perception of different frequency ranges of different vibration signal types.
They found out that sinusoidal vibration, 36 dB above the perception threshold, in the range of 5–10 Hz, is perceived as very “up and down”, and sinusoidal vibration over 35 Hz, with a maximum of 50 Hz, is perceived as “tingling”. In an older study by Jones and Saunders [
34], female subjects also reported a “tingling” sensation during exposure to WBV in the 60–80 Hz range.
This experiment investigates whether the dominance of different perceptual attributes (“up and down” and “tingling”) in recorded seat vibrations with simultaneous noise, lead to different levels of annoyance. For this purpose, additional sinusoidal components with two different frequencies, 50 Hz for the perceptual sensation “tingling” and 6 Hz for the perceptual sensation “up and down”, were inserted separately and together into the recorded vertical vehicle seat vibrations.
3.2. Stimuli
For experiment 1, acoustic and vibration signals from a big street sweeper on asphalt were used, which were recorded from the driver’s perspective. The street sweeper was provided by Stadtreinigung Dresden. The sound recordings were made with a binaural headset (BHS II, Head Acoustics, Herzogenrath, Germany), and the seat vibrations were recorded using a triaxial seat pad (Triaxial Seat Accelerometer Type 4515B, Brüel & Kjær Sound & Vibration Measurement A/S, Nærum, Denmark).
Sound pressure and vibration levels were not reproduced at the original level for every stimulus because the experiments are part of a series of experiments investigating total annoyance below or close to the daily exposure limits of 106–115 dBW
k (ref 1 × 10
−6 m/s
2) and adjusted to the same levels for this purpose. However, they reflect realistic exposures. The vibration signal of the street sweeper was amplified to 112 dBW
k (ref 1 × 10
−6 m/s
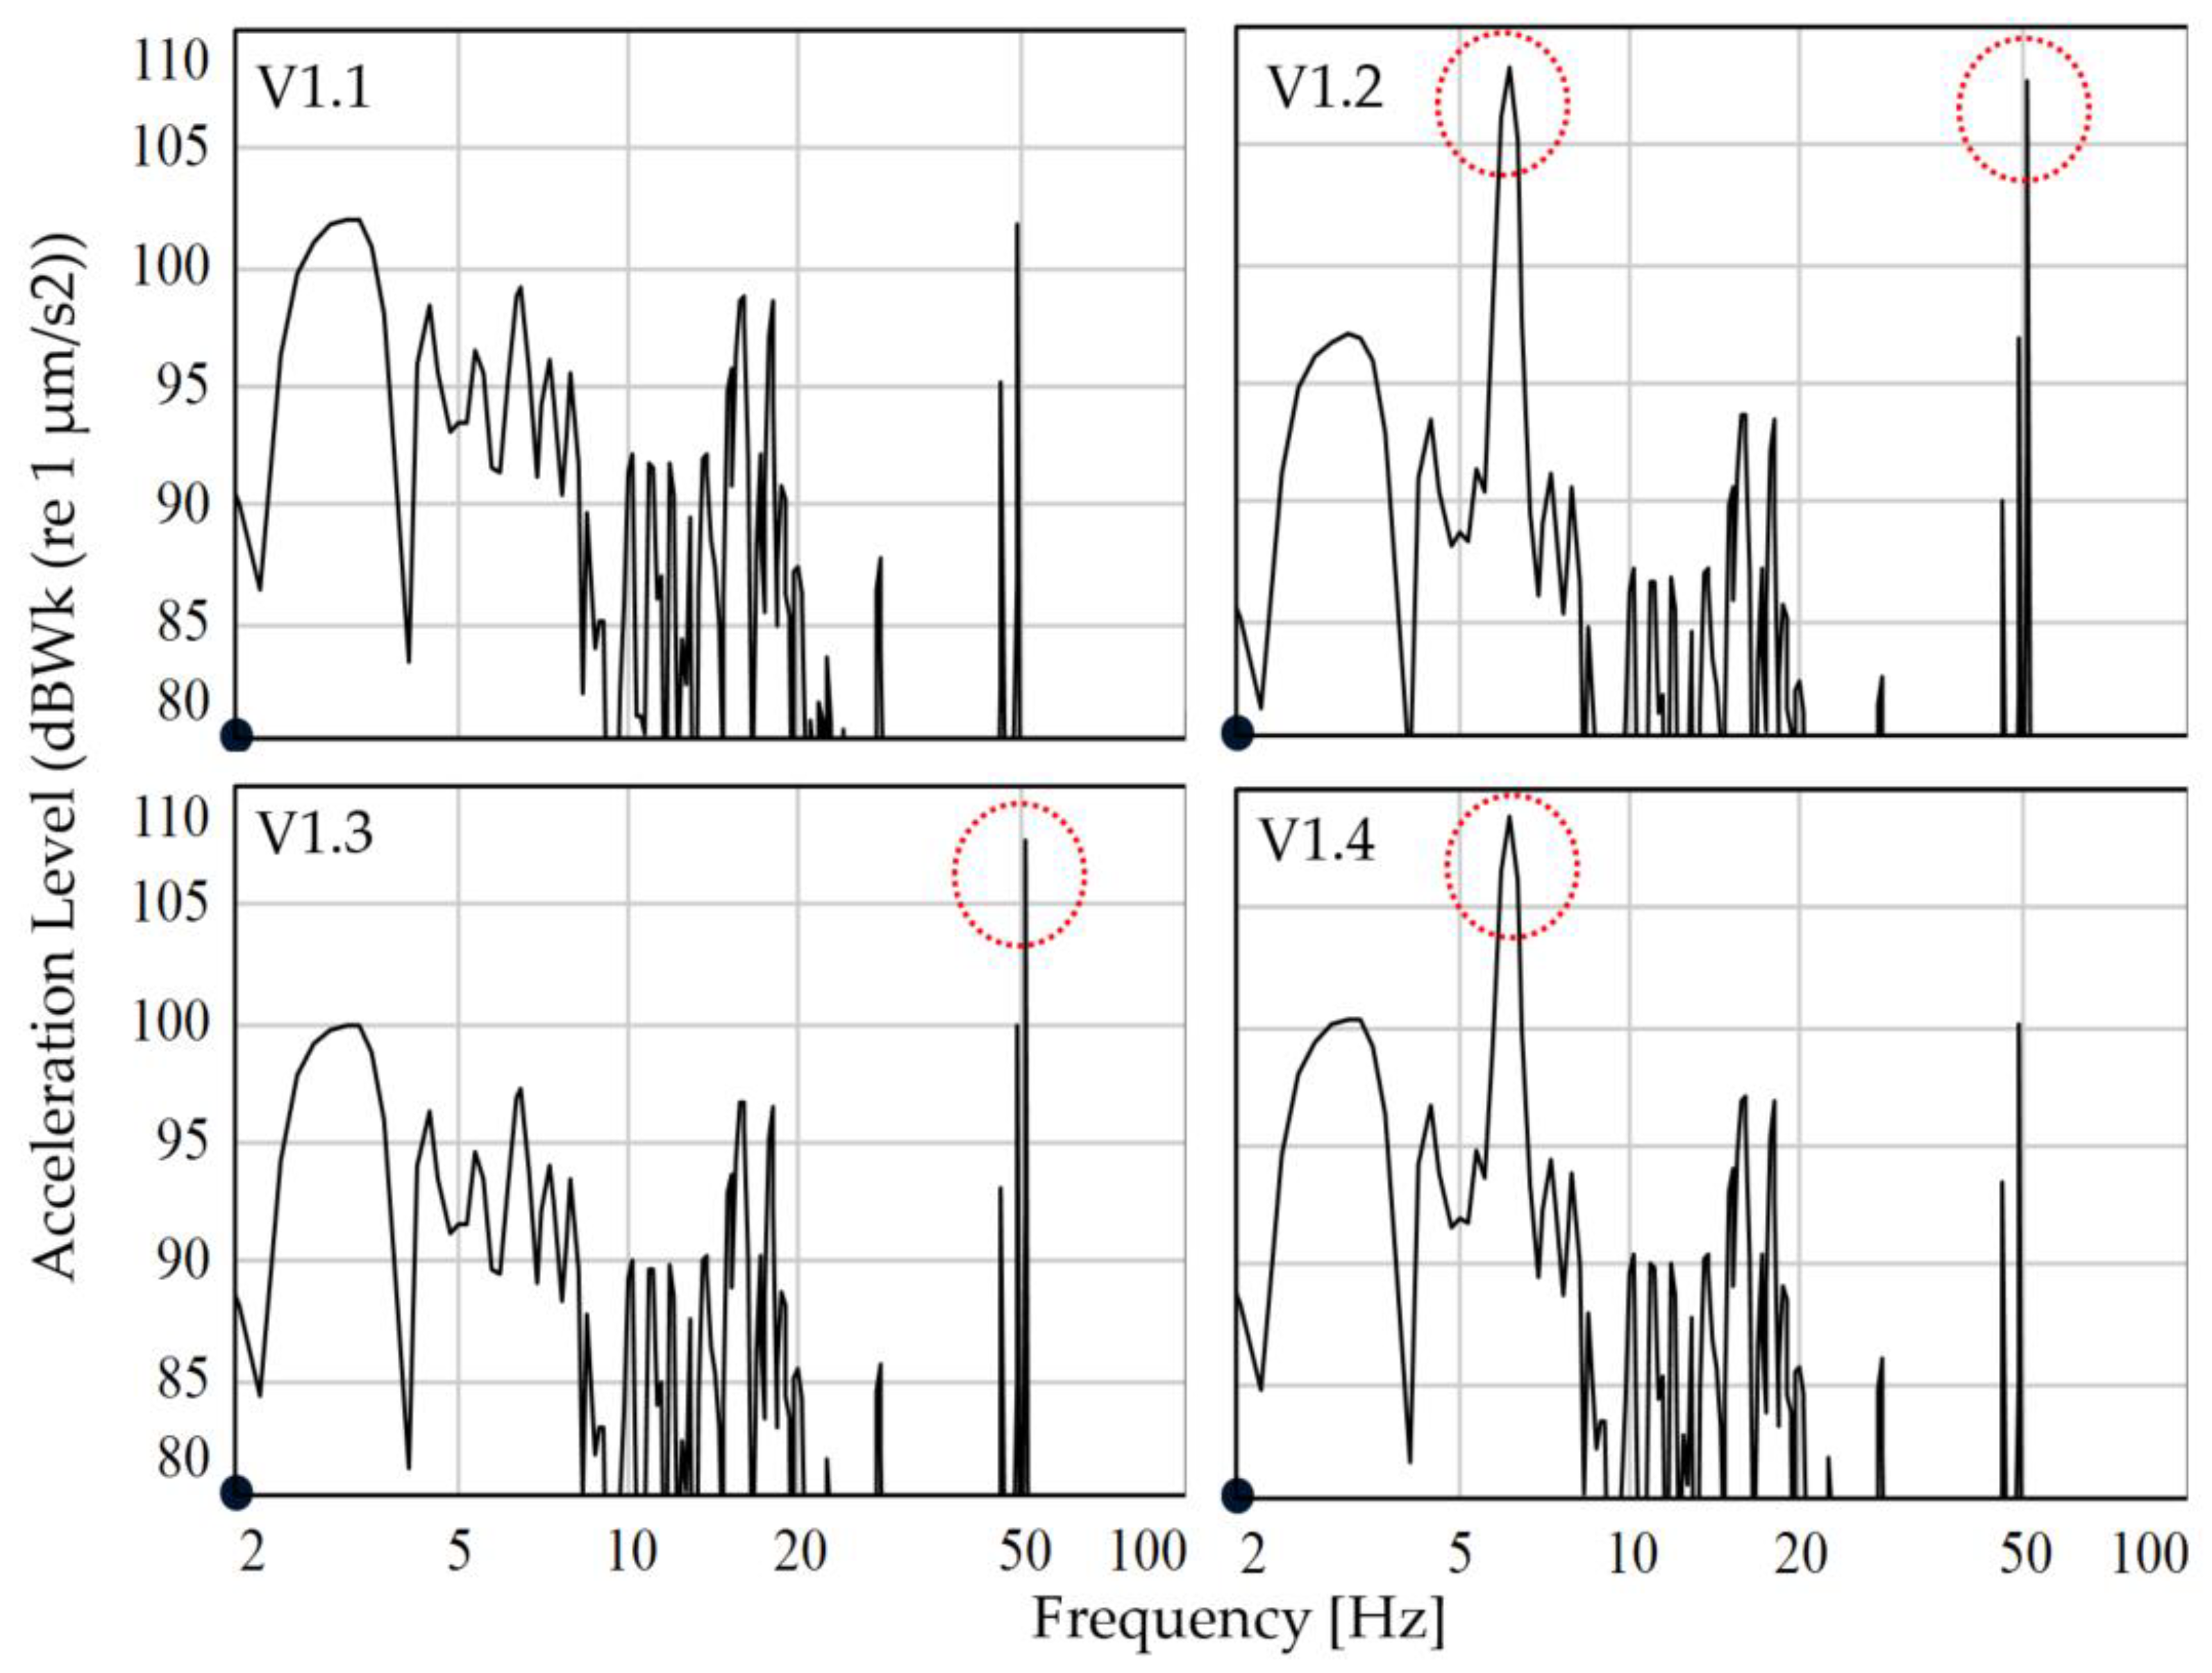
2), and the frequency content was modified, resulting in four variations, see
Figure 2. All four vibration signals were high-pass filtered from 2 Hz, and the following variations were created (VX.X.: VibrationSpectraNumber. Experiment-Number):
V1.1: Frequency content (FC) of a big street sweeper
V2.1: FC + 6 Hz, +50 Hz sinusoidal component
V3.1: FC + 50 Hz sinusoidal component
V4.1: FC + 6 Hz sinusoidal component
Figure 2.
FFT (Spectrum size: 262144, Overlap: 50%, Window function: HAN) of different vibration spectra of vertical seat vibrations of experiment 1 (t = 4 s, LV = 112 dBWk (ref 1 × 10⁻⁶ m/s2)).
Figure 2.
FFT (Spectrum size: 262144, Overlap: 50%, Window function: HAN) of different vibration spectra of vertical seat vibrations of experiment 1 (t = 4 s, LV = 112 dBWk (ref 1 × 10⁻⁶ m/s2)).
Since the street sweeper contains a 50 Hz sinusoidal component in its original vibration frequency content, this example is based on reality and can certainly have practical relevance. All vibration signals V1.1–V4.1 were adjusted to identical W
k-weighted RMS levels (0.4 m/s
2 or 112 dBW
k (ref 1 × 10
−6 m/s
2)), which means that inserting and amplifying the sinusoidal component, might lead to a changing weighting of the rest of the signal, see
Figure 2. All peaks of sinusoidal components have the same RMS value of 108 dBW
k (ref 1 × 10
−6 m/s
2) at the stimulus step of 112 dBW
k (ref 1 × 10
−6 m/s
2).
The four vibration spectra V1.1-V4.1 were adjusted to +3 dB, −3 dB and −6 dB resulting in four different vibration levels L
V = (106, 109, 112, 115) dBW
k (ref 1 × 10
−6 m/s
2), corresponding to (0.20, 0.28, 0.40, 0.56) m/s
2 W
k, for each vibration spectrum. The measured crosstalk of the vibration stimuli on the horizontal axes was comparable for all four vibration stimuli types and increased with increasing vertical vibration level. On the
x-axis, “fore and aft”, (90–97 dBW
d (ref 1 × 10
−6 m/s
2)), the crosstalk was higher than on the
y-axis, “left and right”, (79–86 dBW
d (ref 1 × 10
−6 m/s
2)). Since signals are only classified as perceptible from approx. 85 dBW, according to VDI 2057 [
35], lateral vibrations on the
x-axis can be neglected. However, according to VDI 2057 [
35], the signals on the
y-axis were “easily perceptible”. Since the level differences between the vertical and horizontal axes were at least 10 dB, the vector sum was calculated in accordance with ISO 2631-1 [
15]. The vertical axis is, therefore, the dominant axis, and the crosstalk on the
x-axis can be neglected.
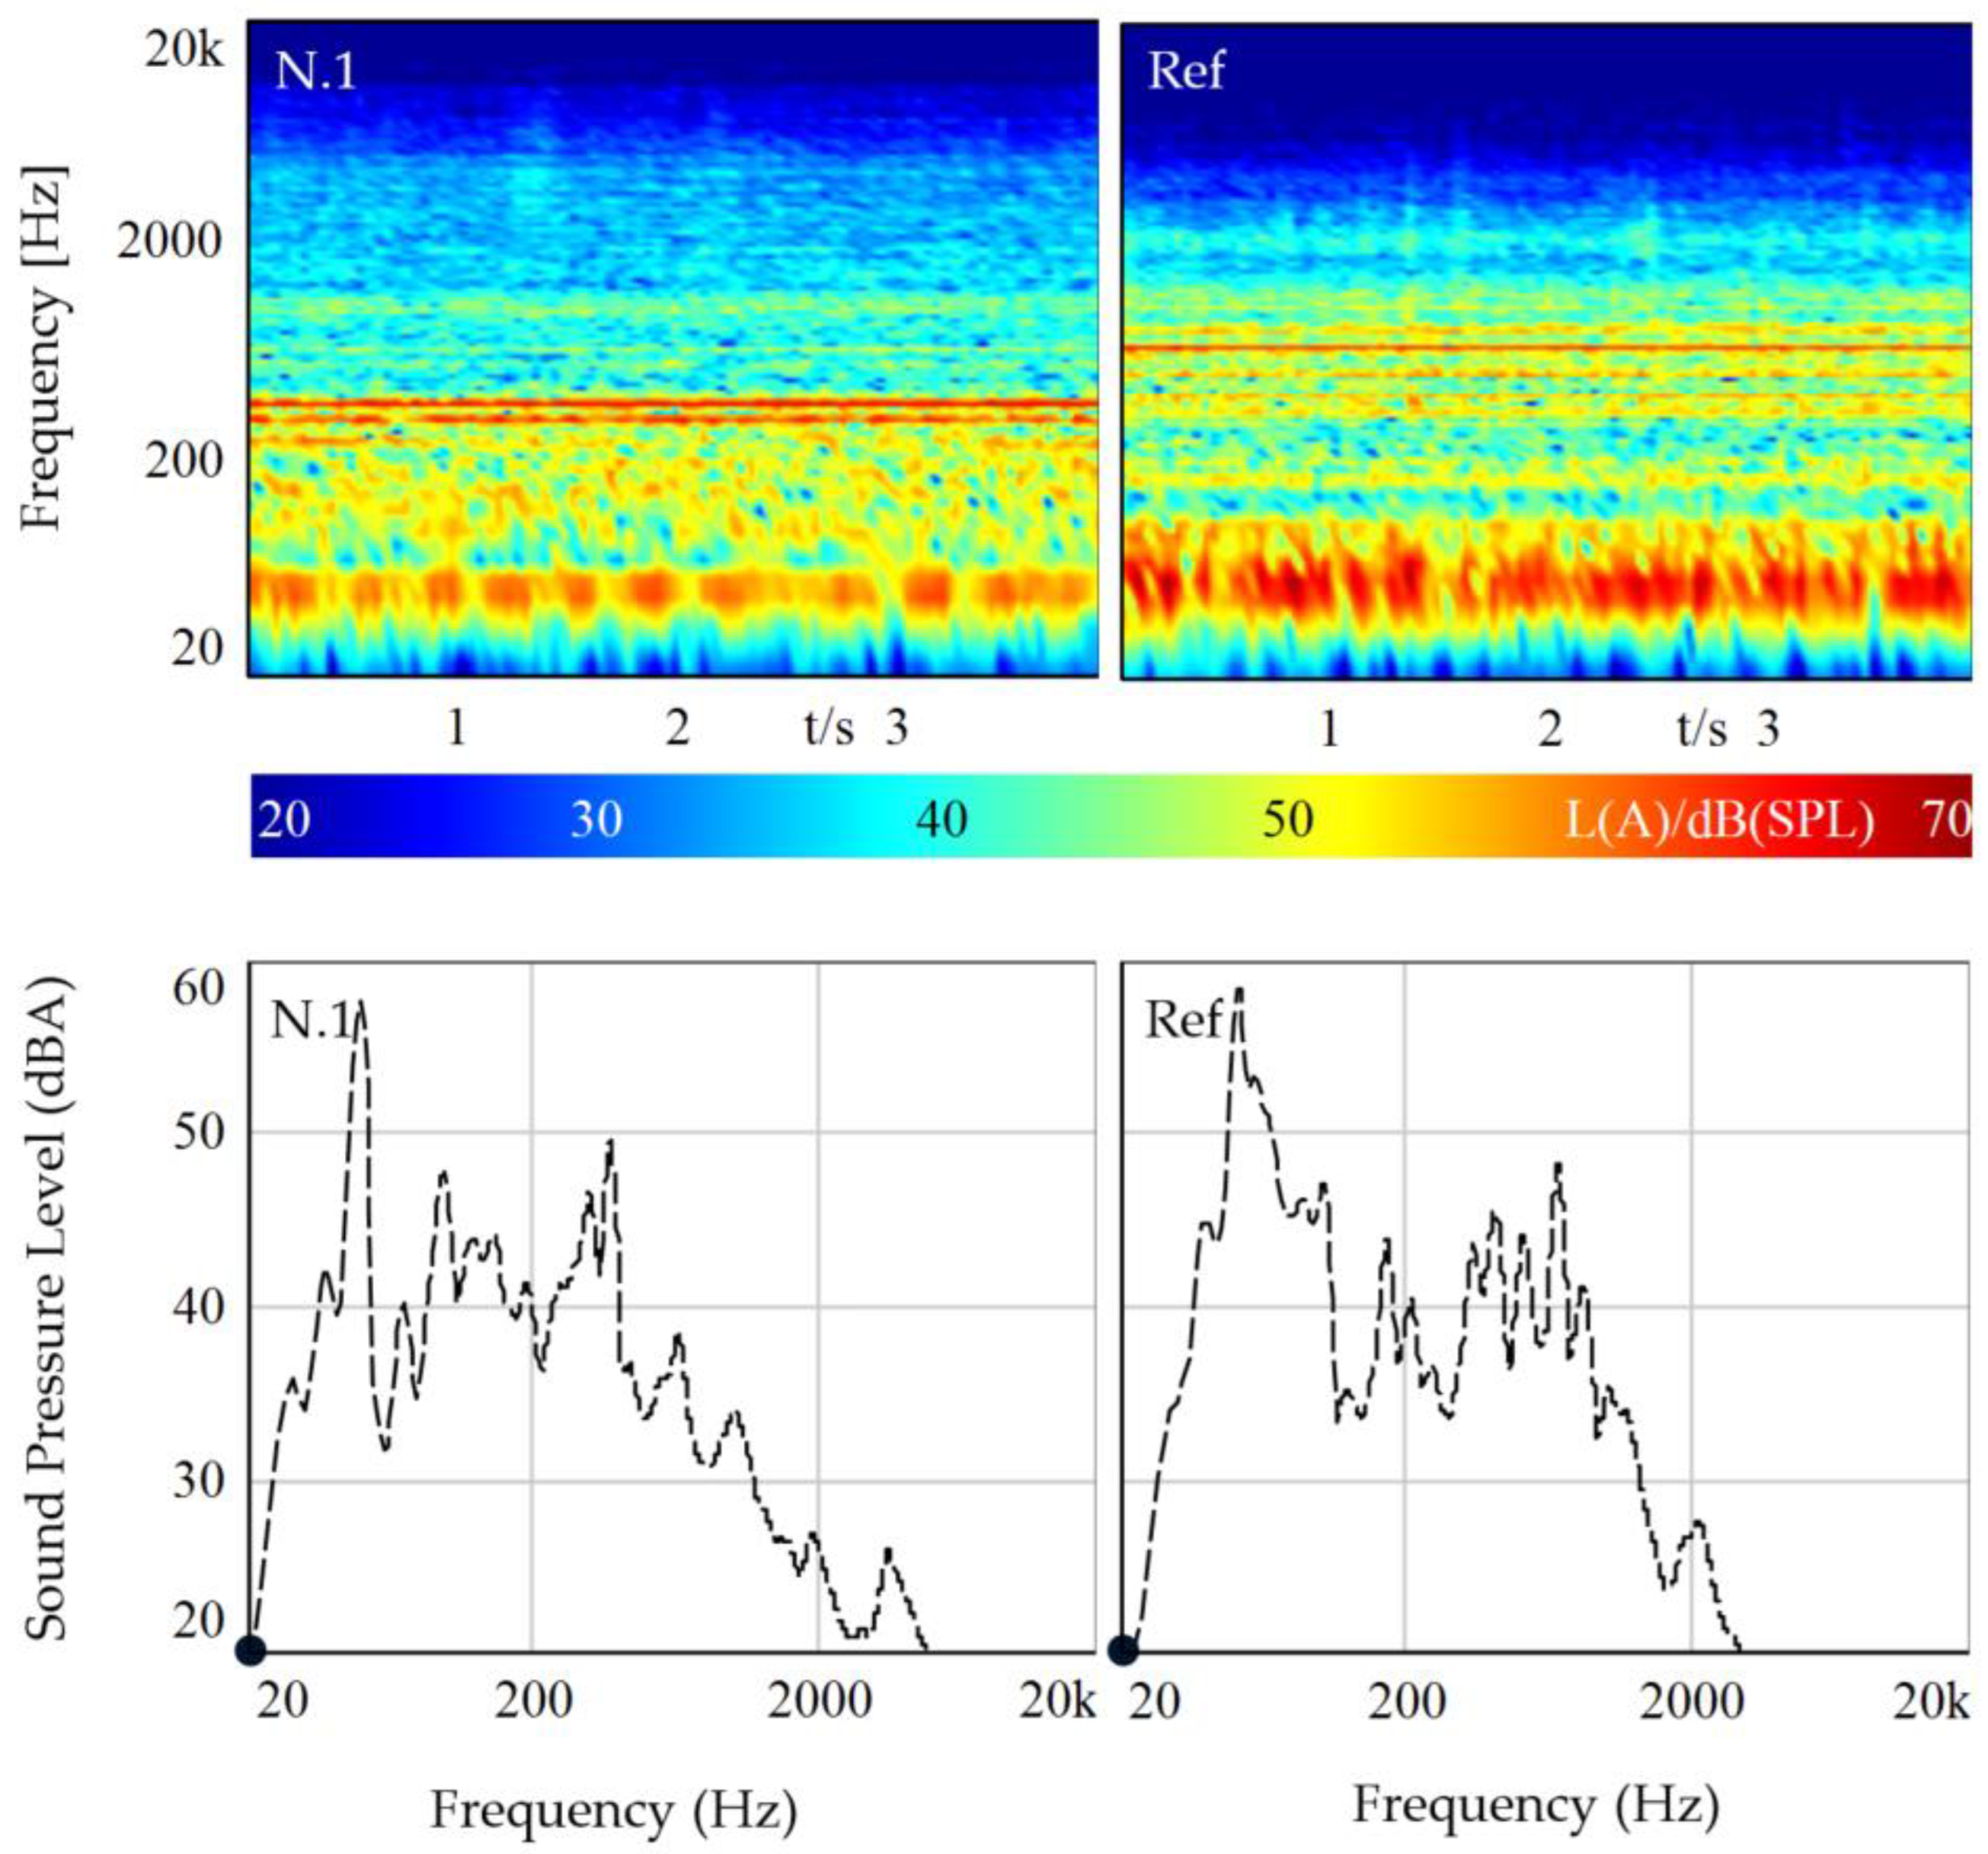
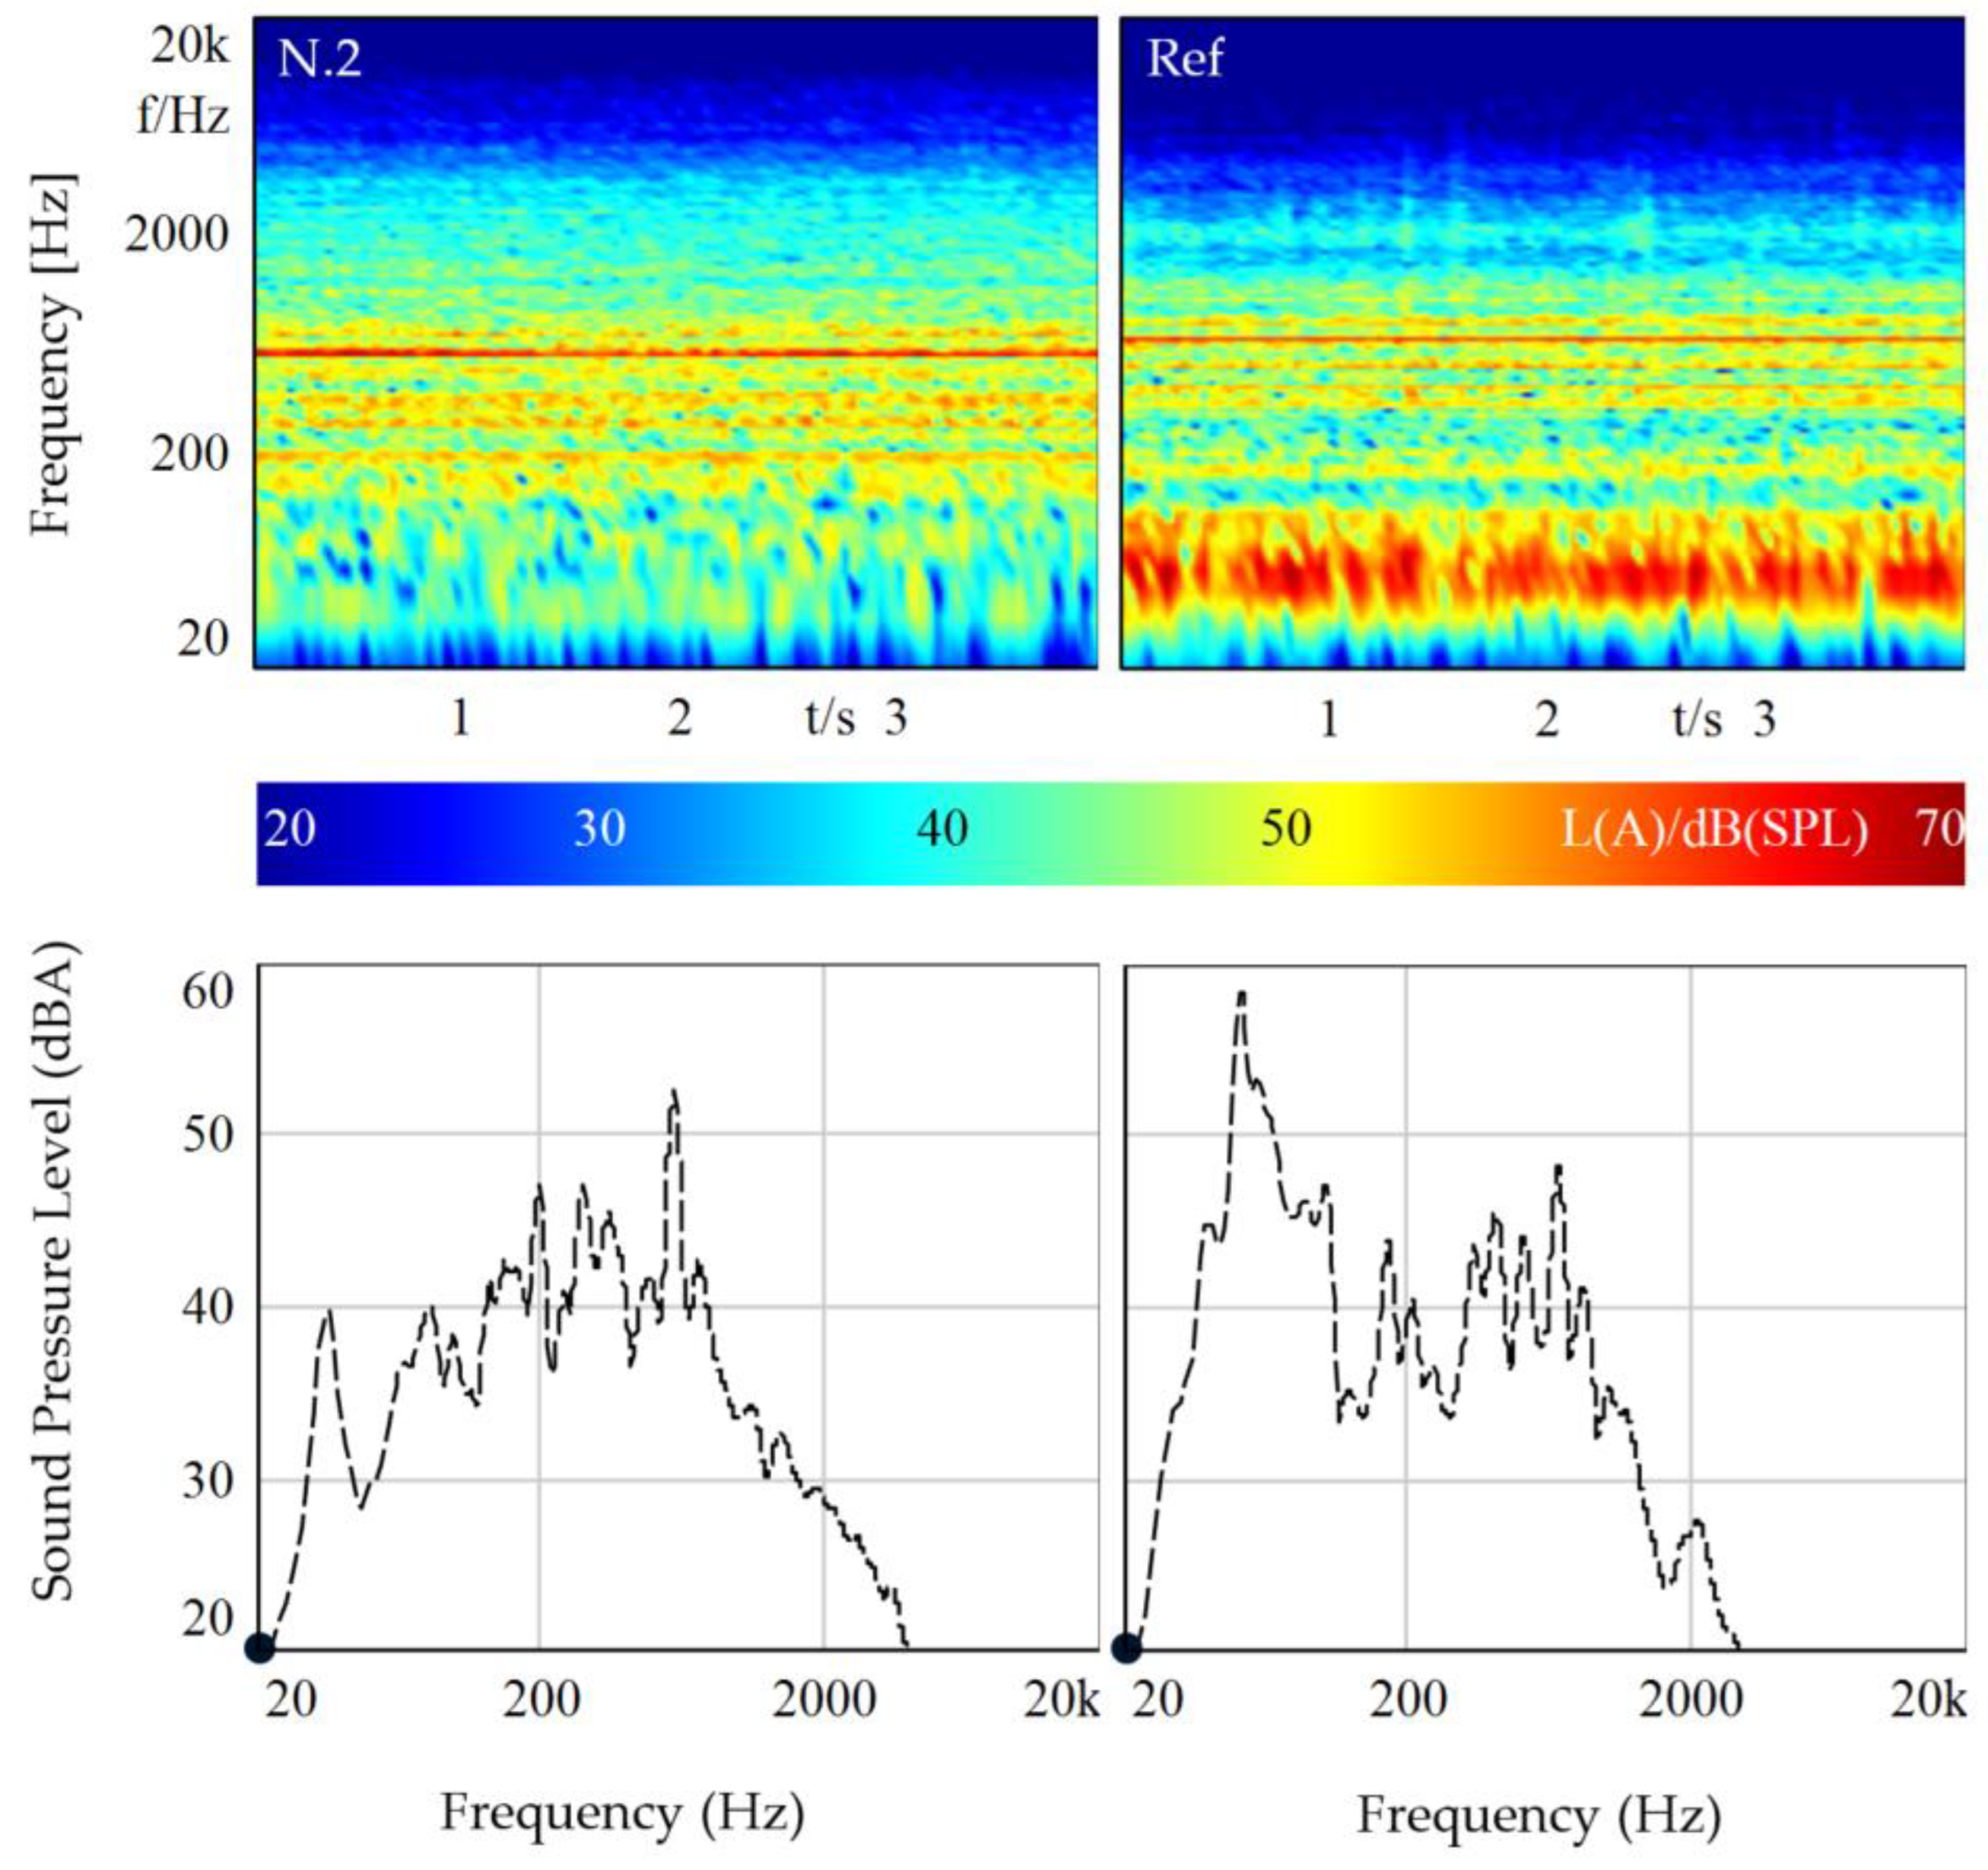
The sound signal was high-pass filtered for plausible reproduction, while the remaining frequency content was retained, see
Figure 3. The sound signal was presented simultaneously with the vibration. Three different noise levels L
N = (64, 70, 76) dBA with no change in frequency were used.
There was also a pure acoustical reference signal used in both of the experiments of this study; see
Figure 3 (right) and
Section 3.3. The reference signal was recorded in a mini excavator with the already described equipment, high-pass filtered for plausible reproduction as well as adjusted to L
N = 70 dBA. Both acoustical stimuli (Reference and sweeper) were additionally presented without vibrations in four levels L
N = (64, 70, 76, 79) dBA.
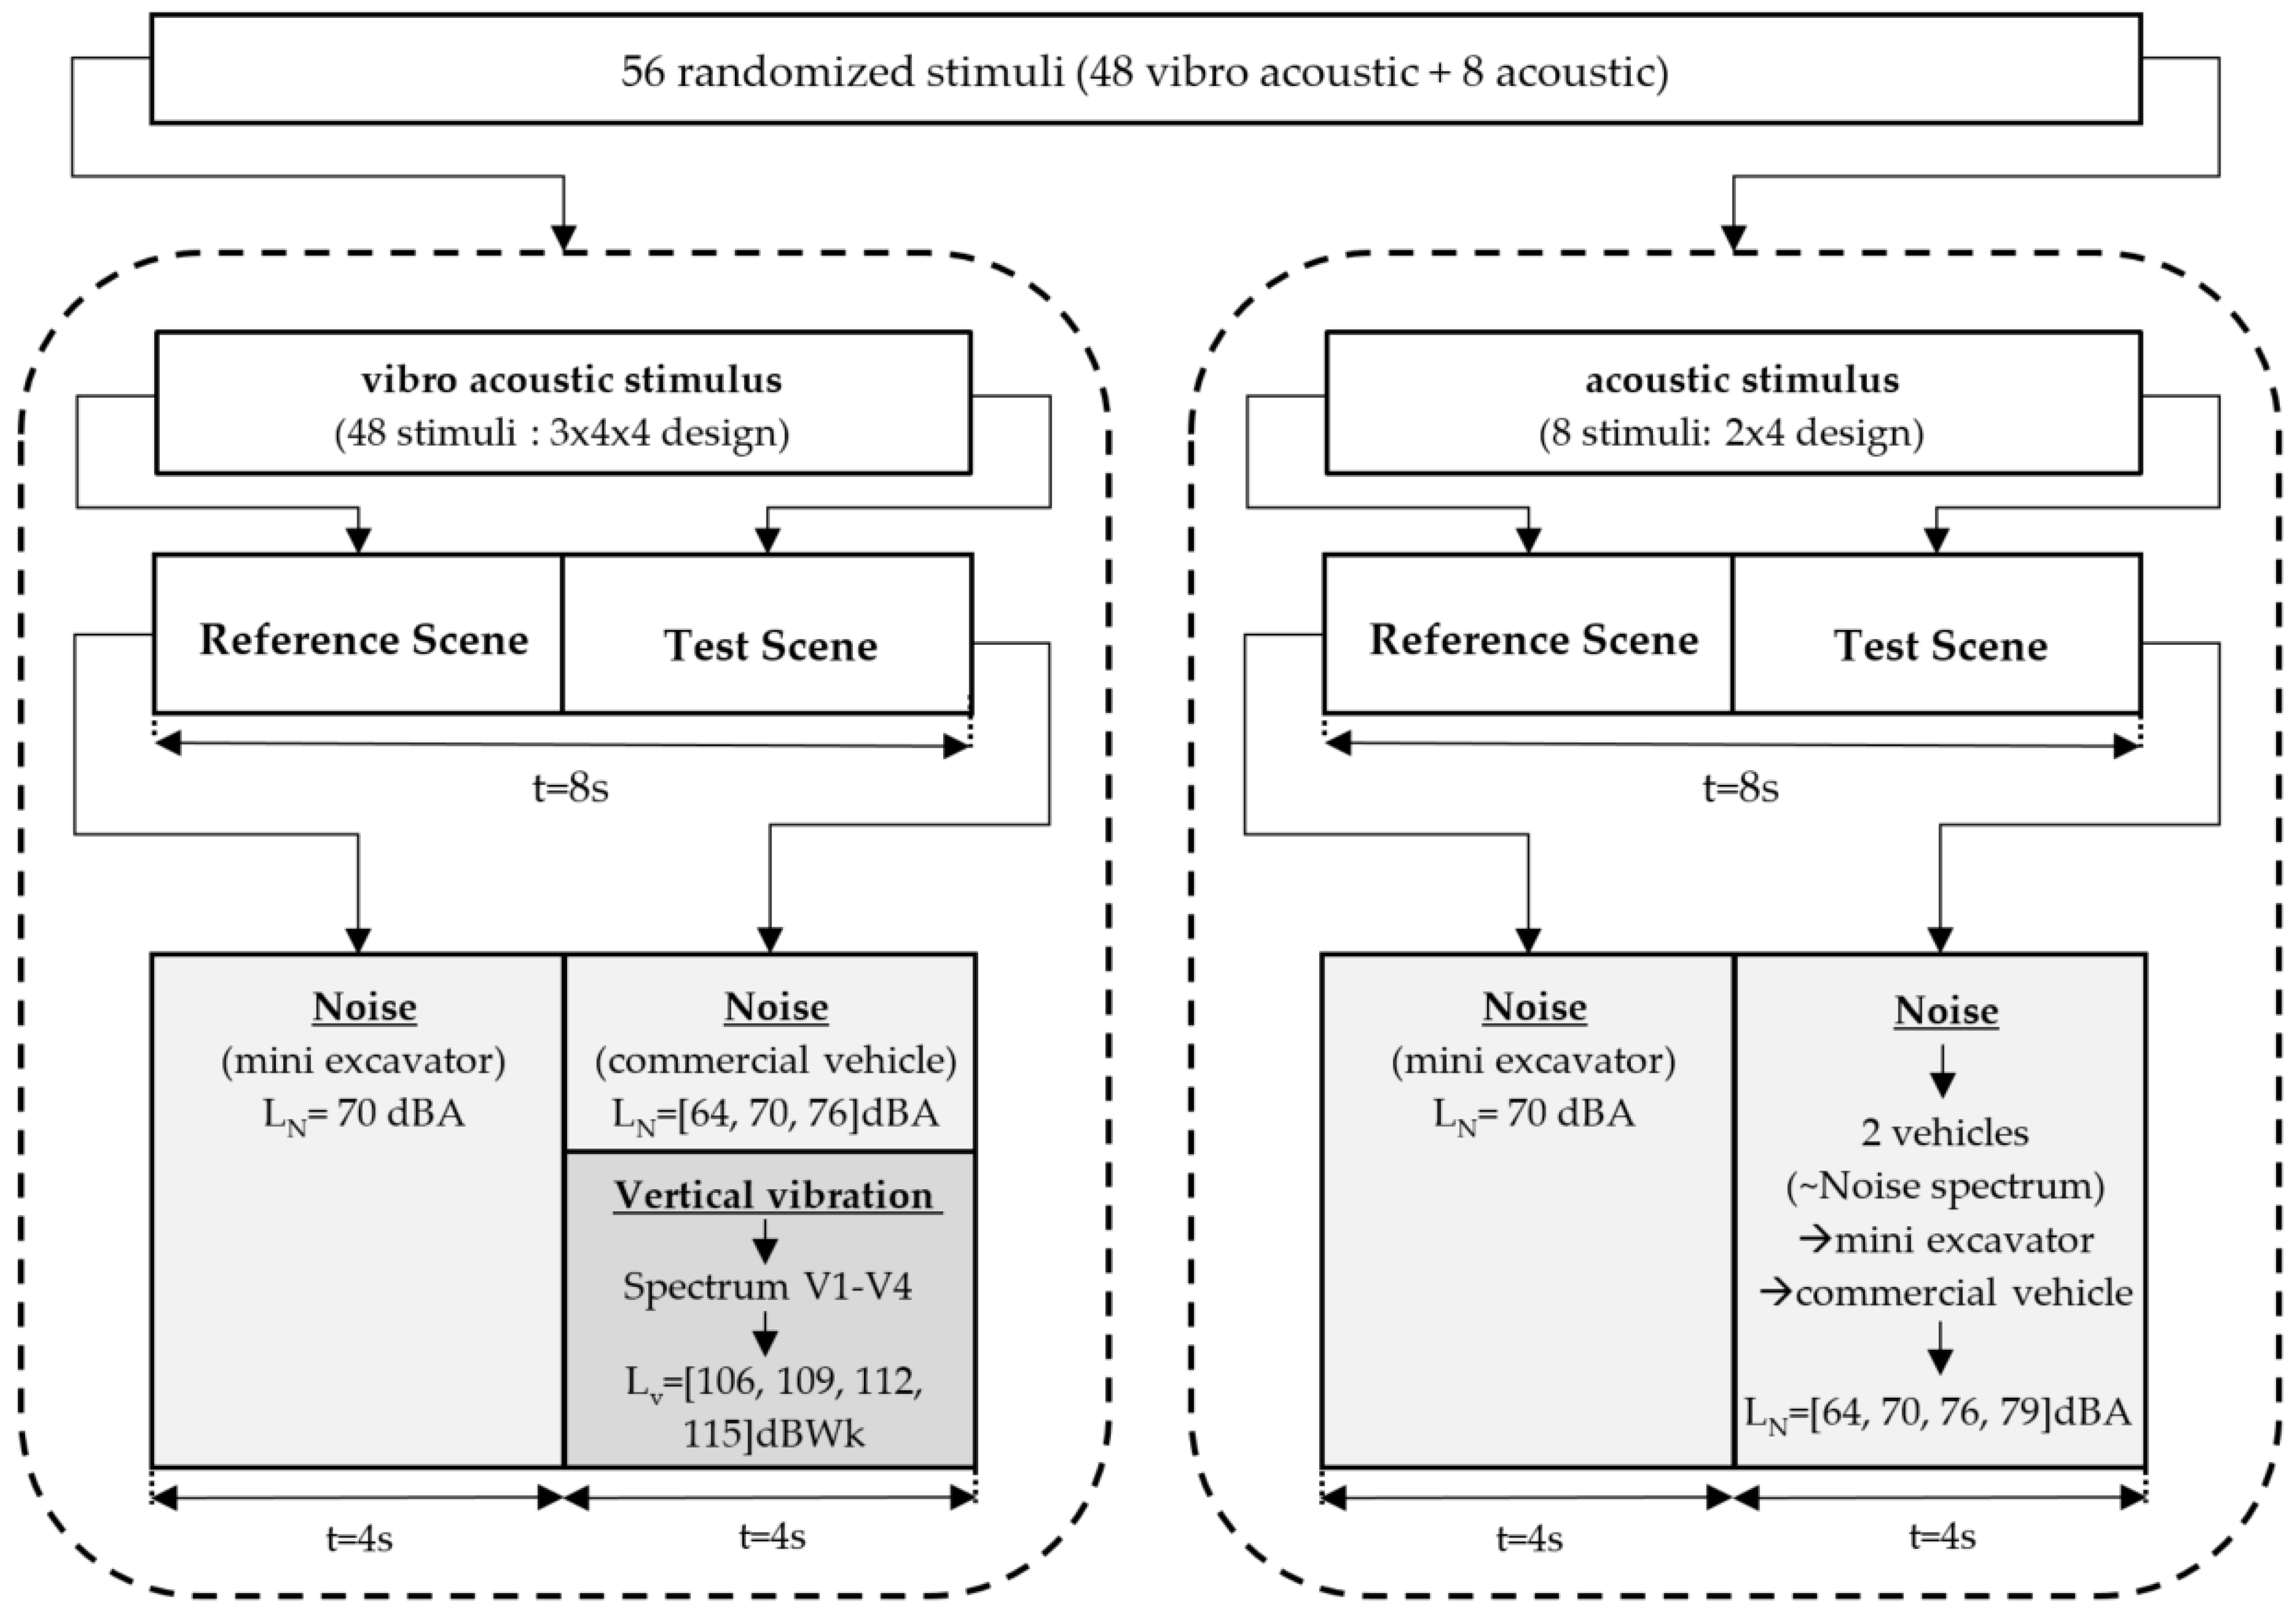
In the first experiment, 56 stimuli were presented: 48 vibro-acoustic and eight acoustic stimuli. All stimuli have a duration of four seconds and were reproduced without visual feedback.
3.3. Design and Methodology
Both experiments were fundamentally structured as a 3-factorial design with the three factors “vibration frequency” (4 levels), “sound pressure level” (3 levels), and “vibration level” (4 levels), which corresponds to a total of 48 (4 × 3 × 4) stimuli. In addition, the acoustic signals (2 × 4) were also presented, as described in
Section 3.2. The structure of the 56 stimuli to be evaluated is shown in the block diagram of
Figure 4.
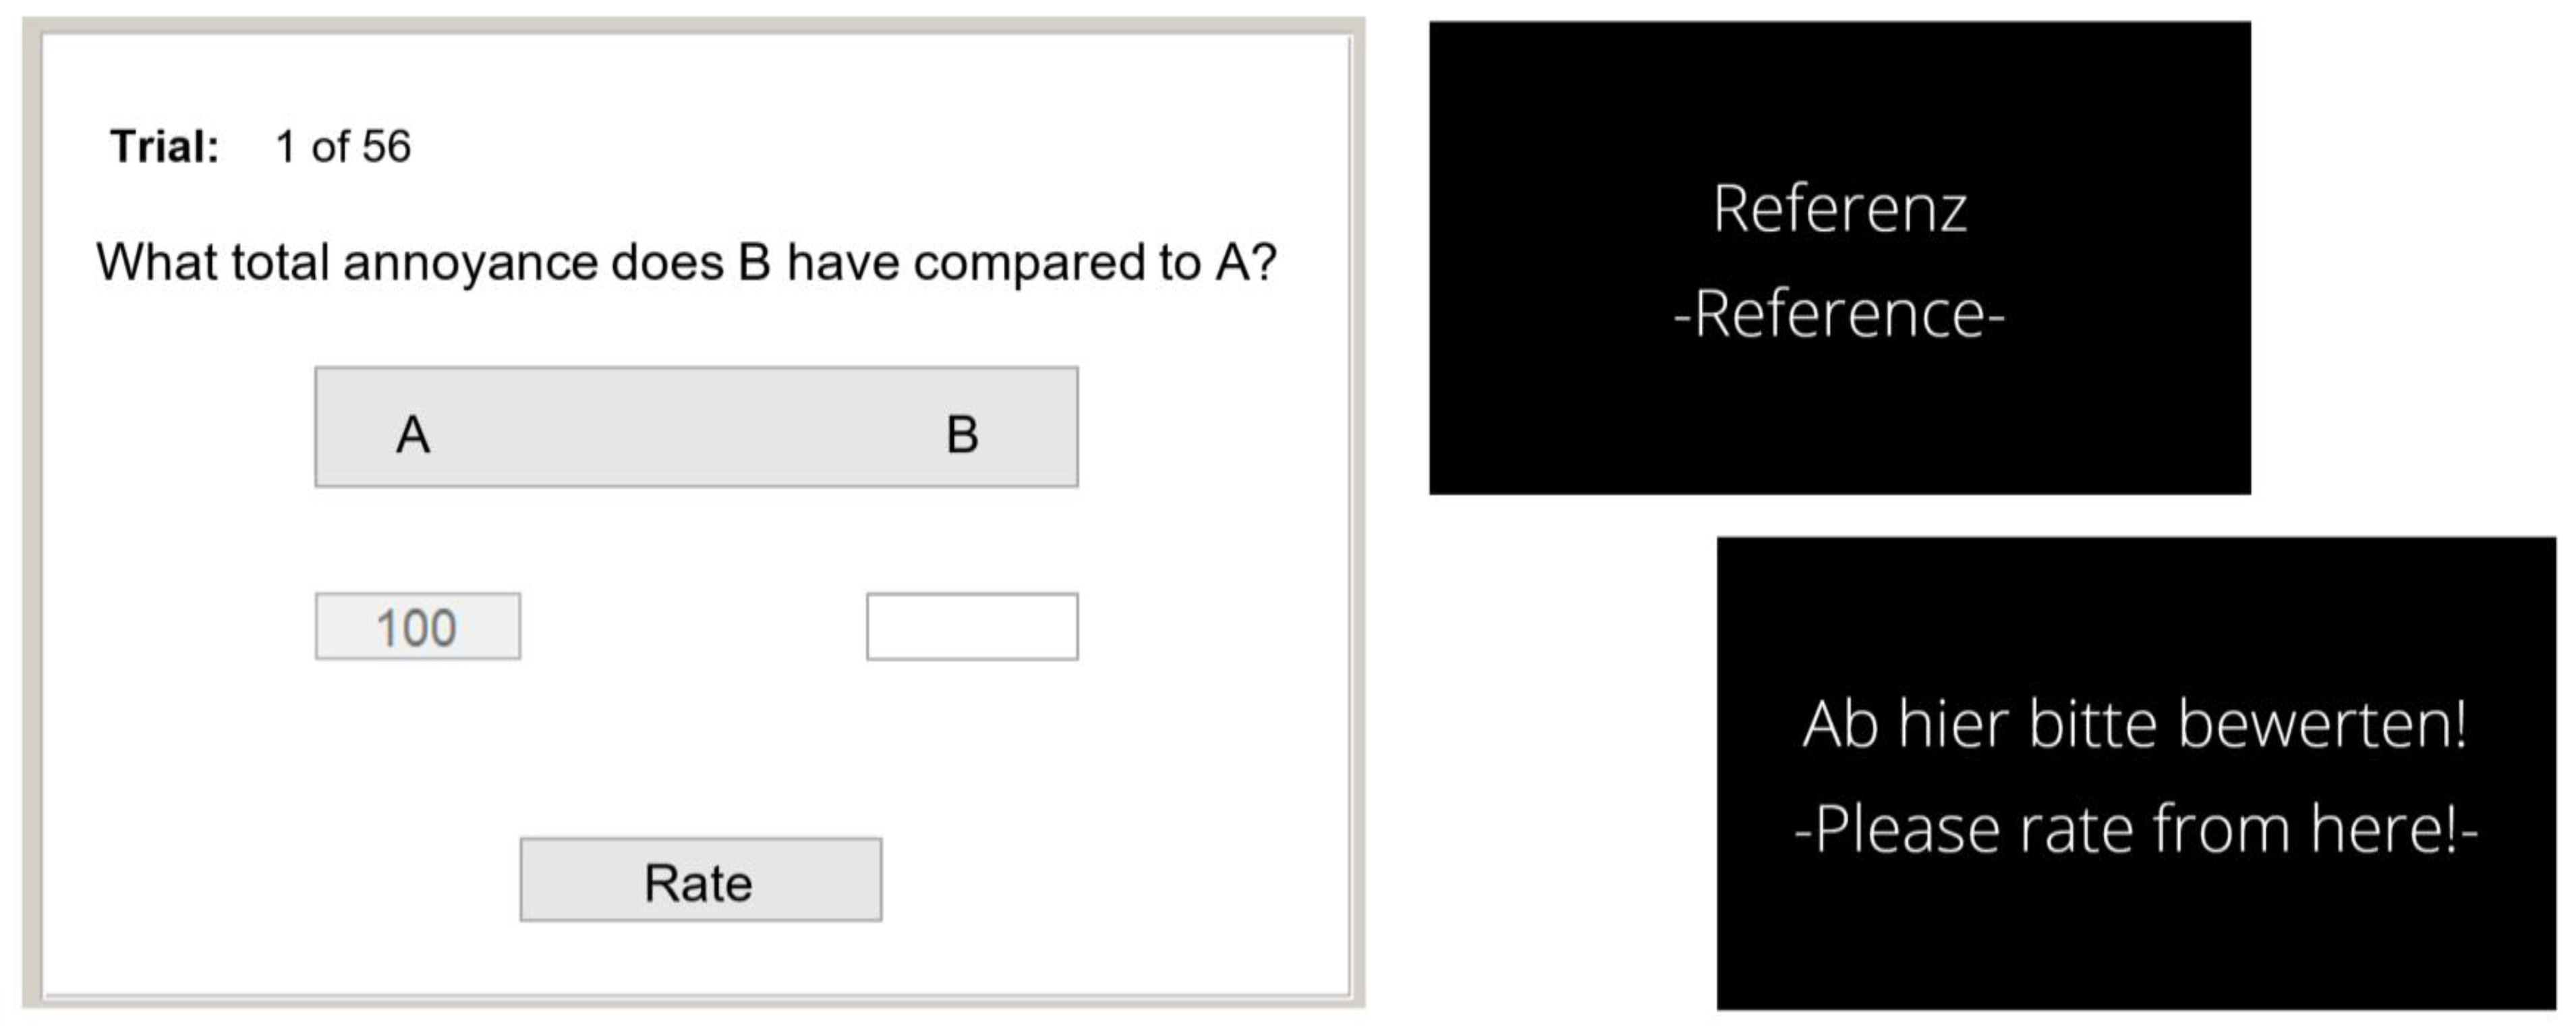
Magnitude estimation with a reference (numerical value 100), see stimuli in
Section 3.2, was used to evaluate the stimuli. With the help of the GUI from
Figure 5, the participants were asked to rate the total annoyance of the stimuli in comparison to the reference (in
Figure 5 left: field below “A”), with a numerical value (in
Figure 5 left: empty field below “B”). The reference and stimulus to be evaluated were played sequentially (8 s total, 4 s per stimulus) after the long button labeled “A B” was pressed. The reference, therefore, had to be listened to at every trial. After the “A B” button was pressed, the reference appeared with the visual feedback from
Figure 5, top right, and then the stimulus was evaluated with the visual feedback from
Figure 5, bottom right.
The participants had to evaluate 56 stimuli, which could be repeated at any time by pressing the “A B” button again. After adding a number in the field below “B”, the participants had to press the “Rate” button to load the next stimulus. The stimuli were presented in randomized order for each participant. Before the experiment, four training stimuli were presented to familiarize participants with the situation and to explain the procedure. The training stimuli were the same for each subject and in the same order. An experimental run per participant with an explanation lasted a maximum of one hour, with the subjects sitting on the motion platform for a maximum of 30 min.
3.4. Participants
In this experiment, 23 healthy participants voluntarily attended. The participant mean age was 32.4 years, with a standard deviation of 11.8 years. In total, four female participants and 19 male participants attended the experiment. Most of them were students or employers at the university.
3.5. Results
The results of the vibro-acoustic stimuli and the acoustic stimuli were analyzed separately. Therefore, two Repeated Measures Analysis of Variance (rmANOVA) were run with the log-transformed data using IBM SPSS Statistics. First, a three-way rmANOVA with the results of the 48 vibro-acoustic stimuli was carried out with the following factors: “vibration frequency” with the levels V1.1, V2.1, V3.1, V4.1, “sound pressure level” with the levels (64, 70, 76) dBA and “acceleration level” with the levels (106, 109, 112, 115) dBW (ref 1 × 10⁻⁶ m/s2). Second, a two-way rmANOVA with the results of the eight acoustic stimuli was carried out with the factors “vehicle type” (Street sweeper and mini excavator) and “sound pressure level” with the levels (64, 70, 76, 79) dBA. The Mauchly test was used for checking sphericity. In case of violation of sphericity, the degree of freedom was corrected by using the Greenhouse–Geisser adjustment.
Before running the rmANOVA the Shapiro–Wilk test was performed on the 56 stimuli to check the groups for normal distribution. Five of these groups were, according to the Shapiro–Wilk test, not normally distributed. These groups were visually checked by using the histograms. No strong deviations from the normal distribution were observed. The reference (Mini excavator with LN = 70 dBA) was also presented in the experiment. A total of 22 of 23 participants rated this stimulus with 100, and only one person with 110. It can be assumed that all participants evaluated the experiment attentively.
3.5.1. Vibro-Acoustic Stimuli: Main Effects
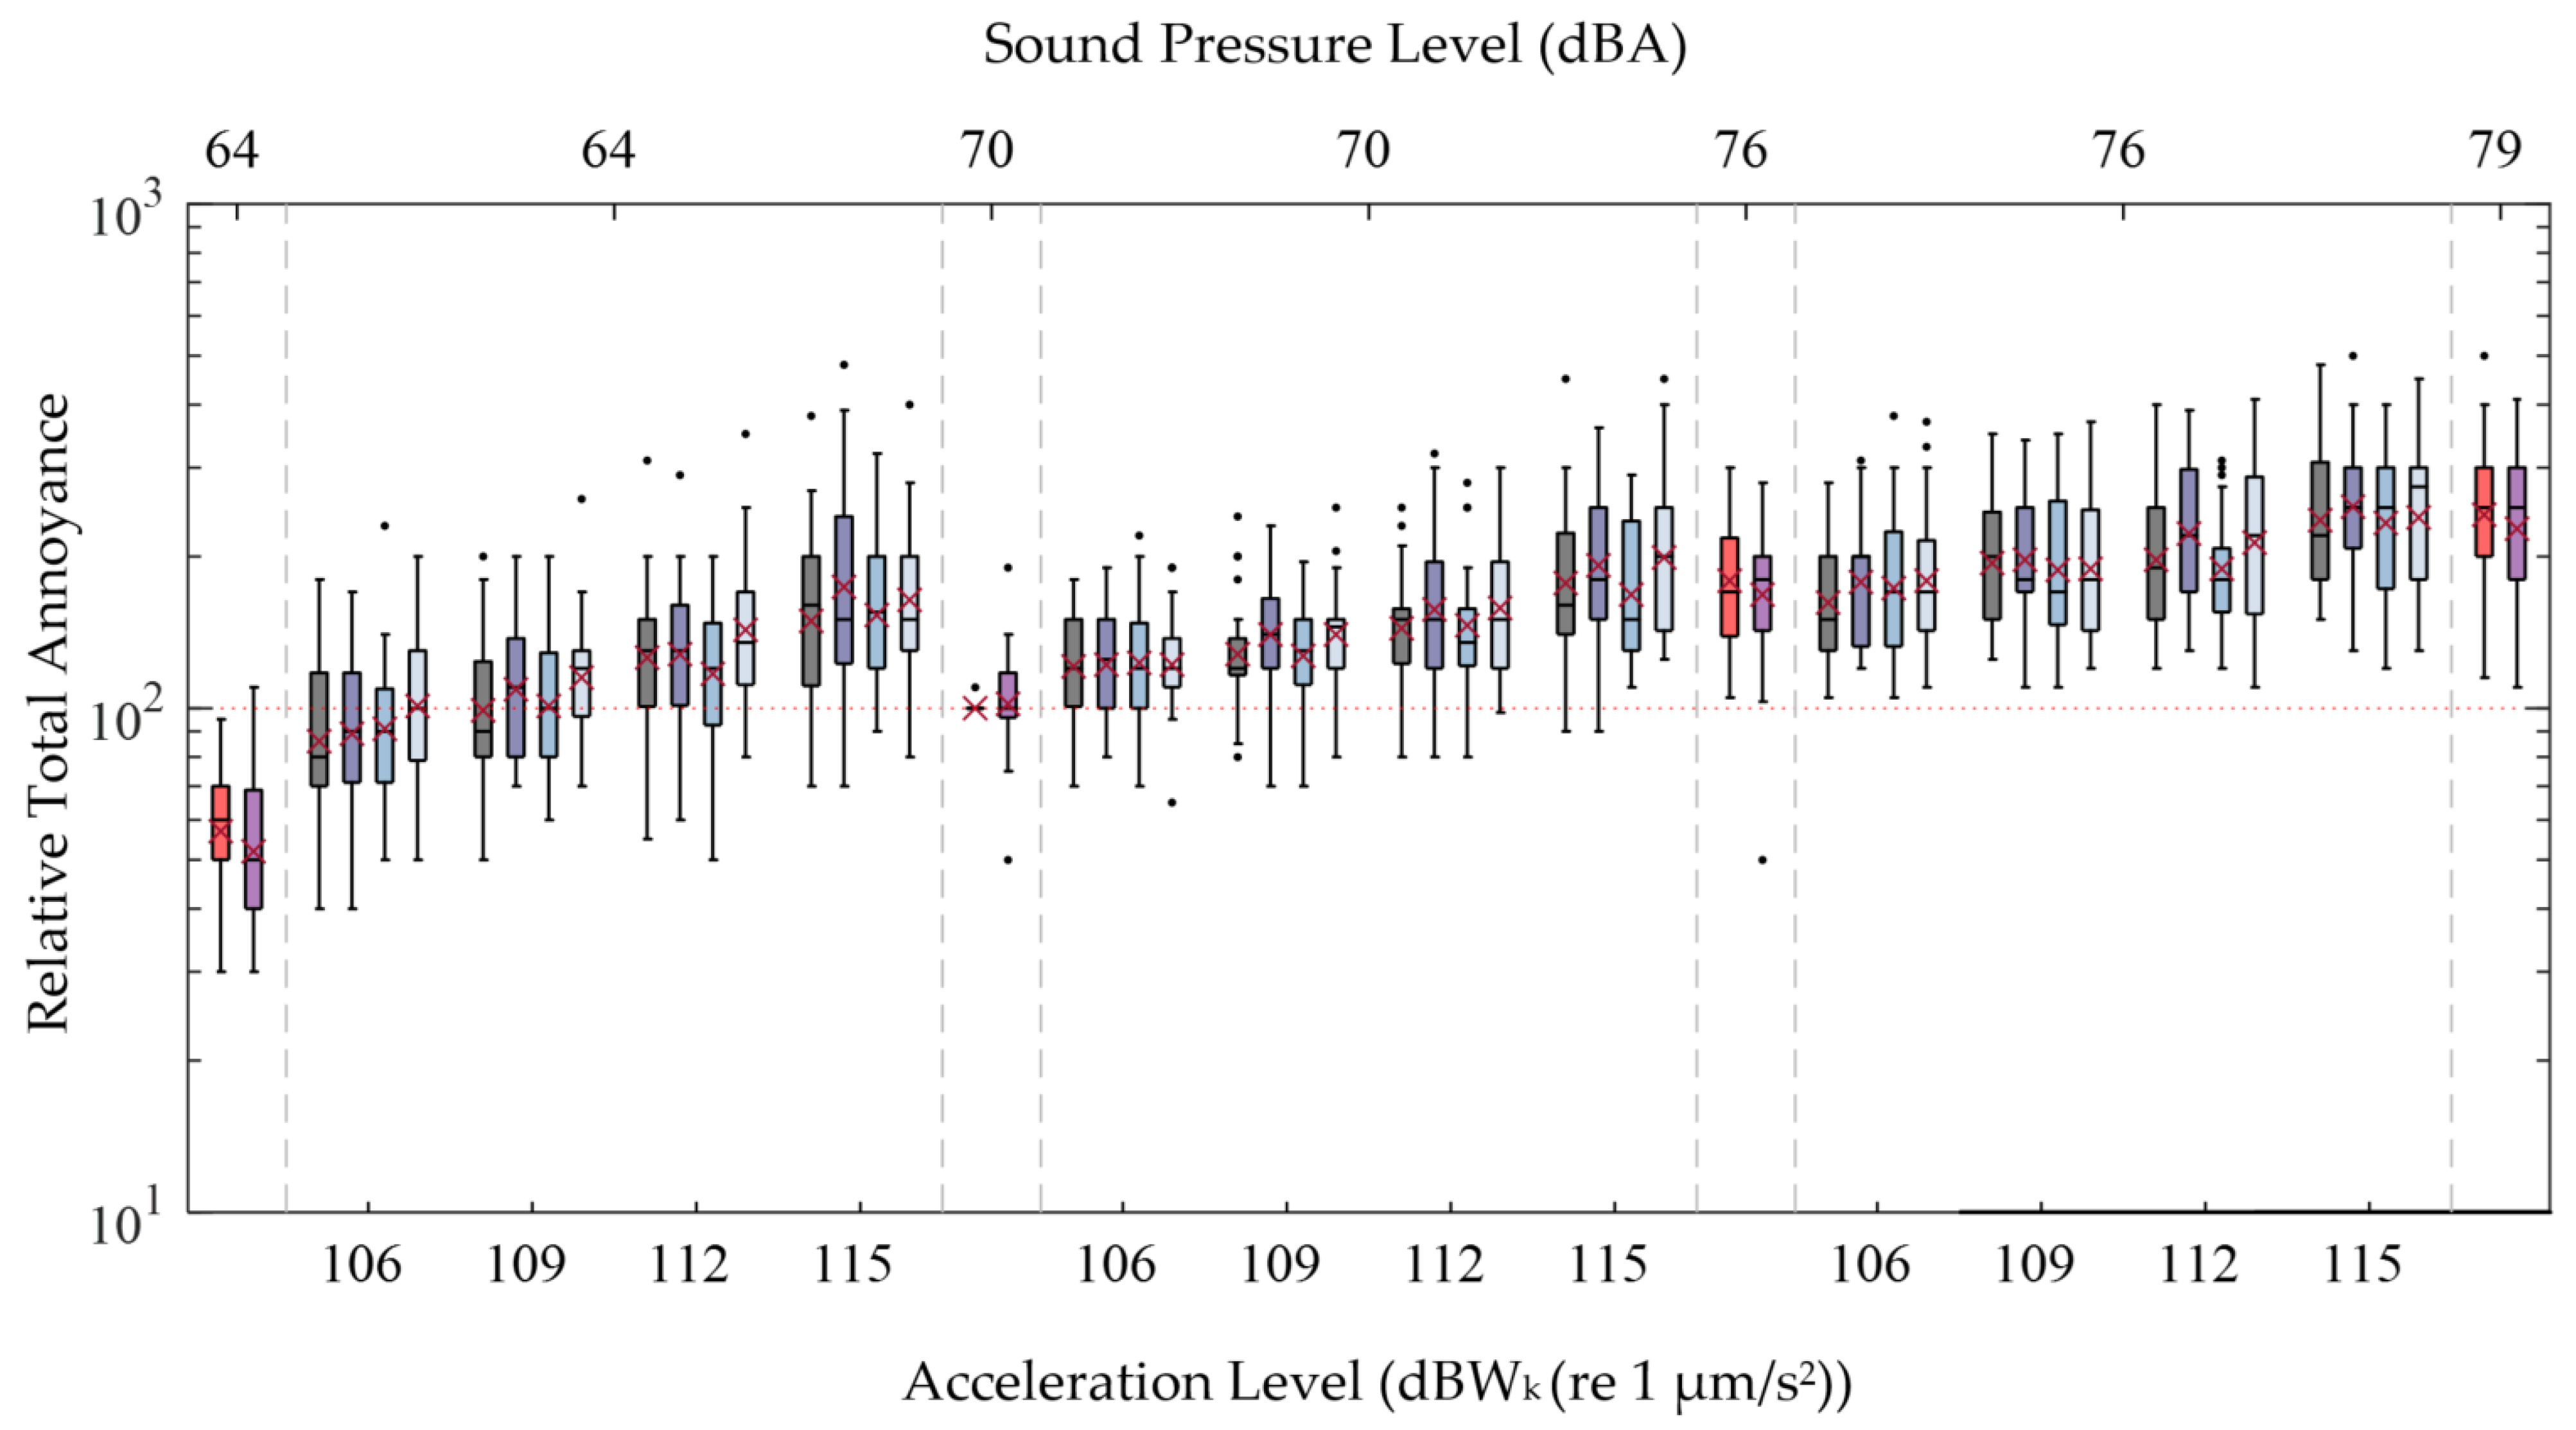
Figure 6 shows all results of magnitude estimation as boxplots and the geometric mean values. The slope of the ratings at high sound pressure levels (L
N = 76 dBA) over the acceleration levels seems flatter than the slope of the ratings at lower sound pressure levels (L
N = 64 dBA). The color bars symbolize the different vibration spectra.
The analysis of the vibro-acoustic stimuli showed a highly significant influence of sound pressure and acceleration level (
F(1.101, 24.216) = 95.278,
p < .001, partial η
2 = .812 and
F(1.405, 30.901) = 106.445,
p < .001, partial η
2 = .829) and a very strong effect size according to Cohen [
36]. Bonferroni-corrected pair comparisons also showed that all steps of sound pressure and acceleration level differ significantly from each other (
p < .001).
The main factor, “vibration frequency”, also showed a significant effect (
F(3, 66) = 13.038,
p < .001, partial η
2 = .372) and a very strong effect size, according to Cohen [
36]. Pairwise comparisons with Bonferroni-correction showed that the vibration spectrum of V2.1 (+6 Hz, +50 Hz) and V4.1 (+6 Hz) differs significantly from V1.1 (frequency content of a big street sweeper) and V3.1 (+50 Hz), see
Table 1. The mean values showed that the stimuli with the 6 Hz sinusoidal component, V2.1 and V4.1, were generally perceived as more annoying than stimuli V1.1 and V3.1 without the extra 6 Hz component. Despite the 50 Hz sinusoidal component, there was no difference in the significance between V2.1 and V4.1 (
p = 1.000), or between V1.1 and V3.1 (
p = 1.000), see
Table 1.
3.5.2. Vibro-Acoustic Stimuli: Interaction Effects
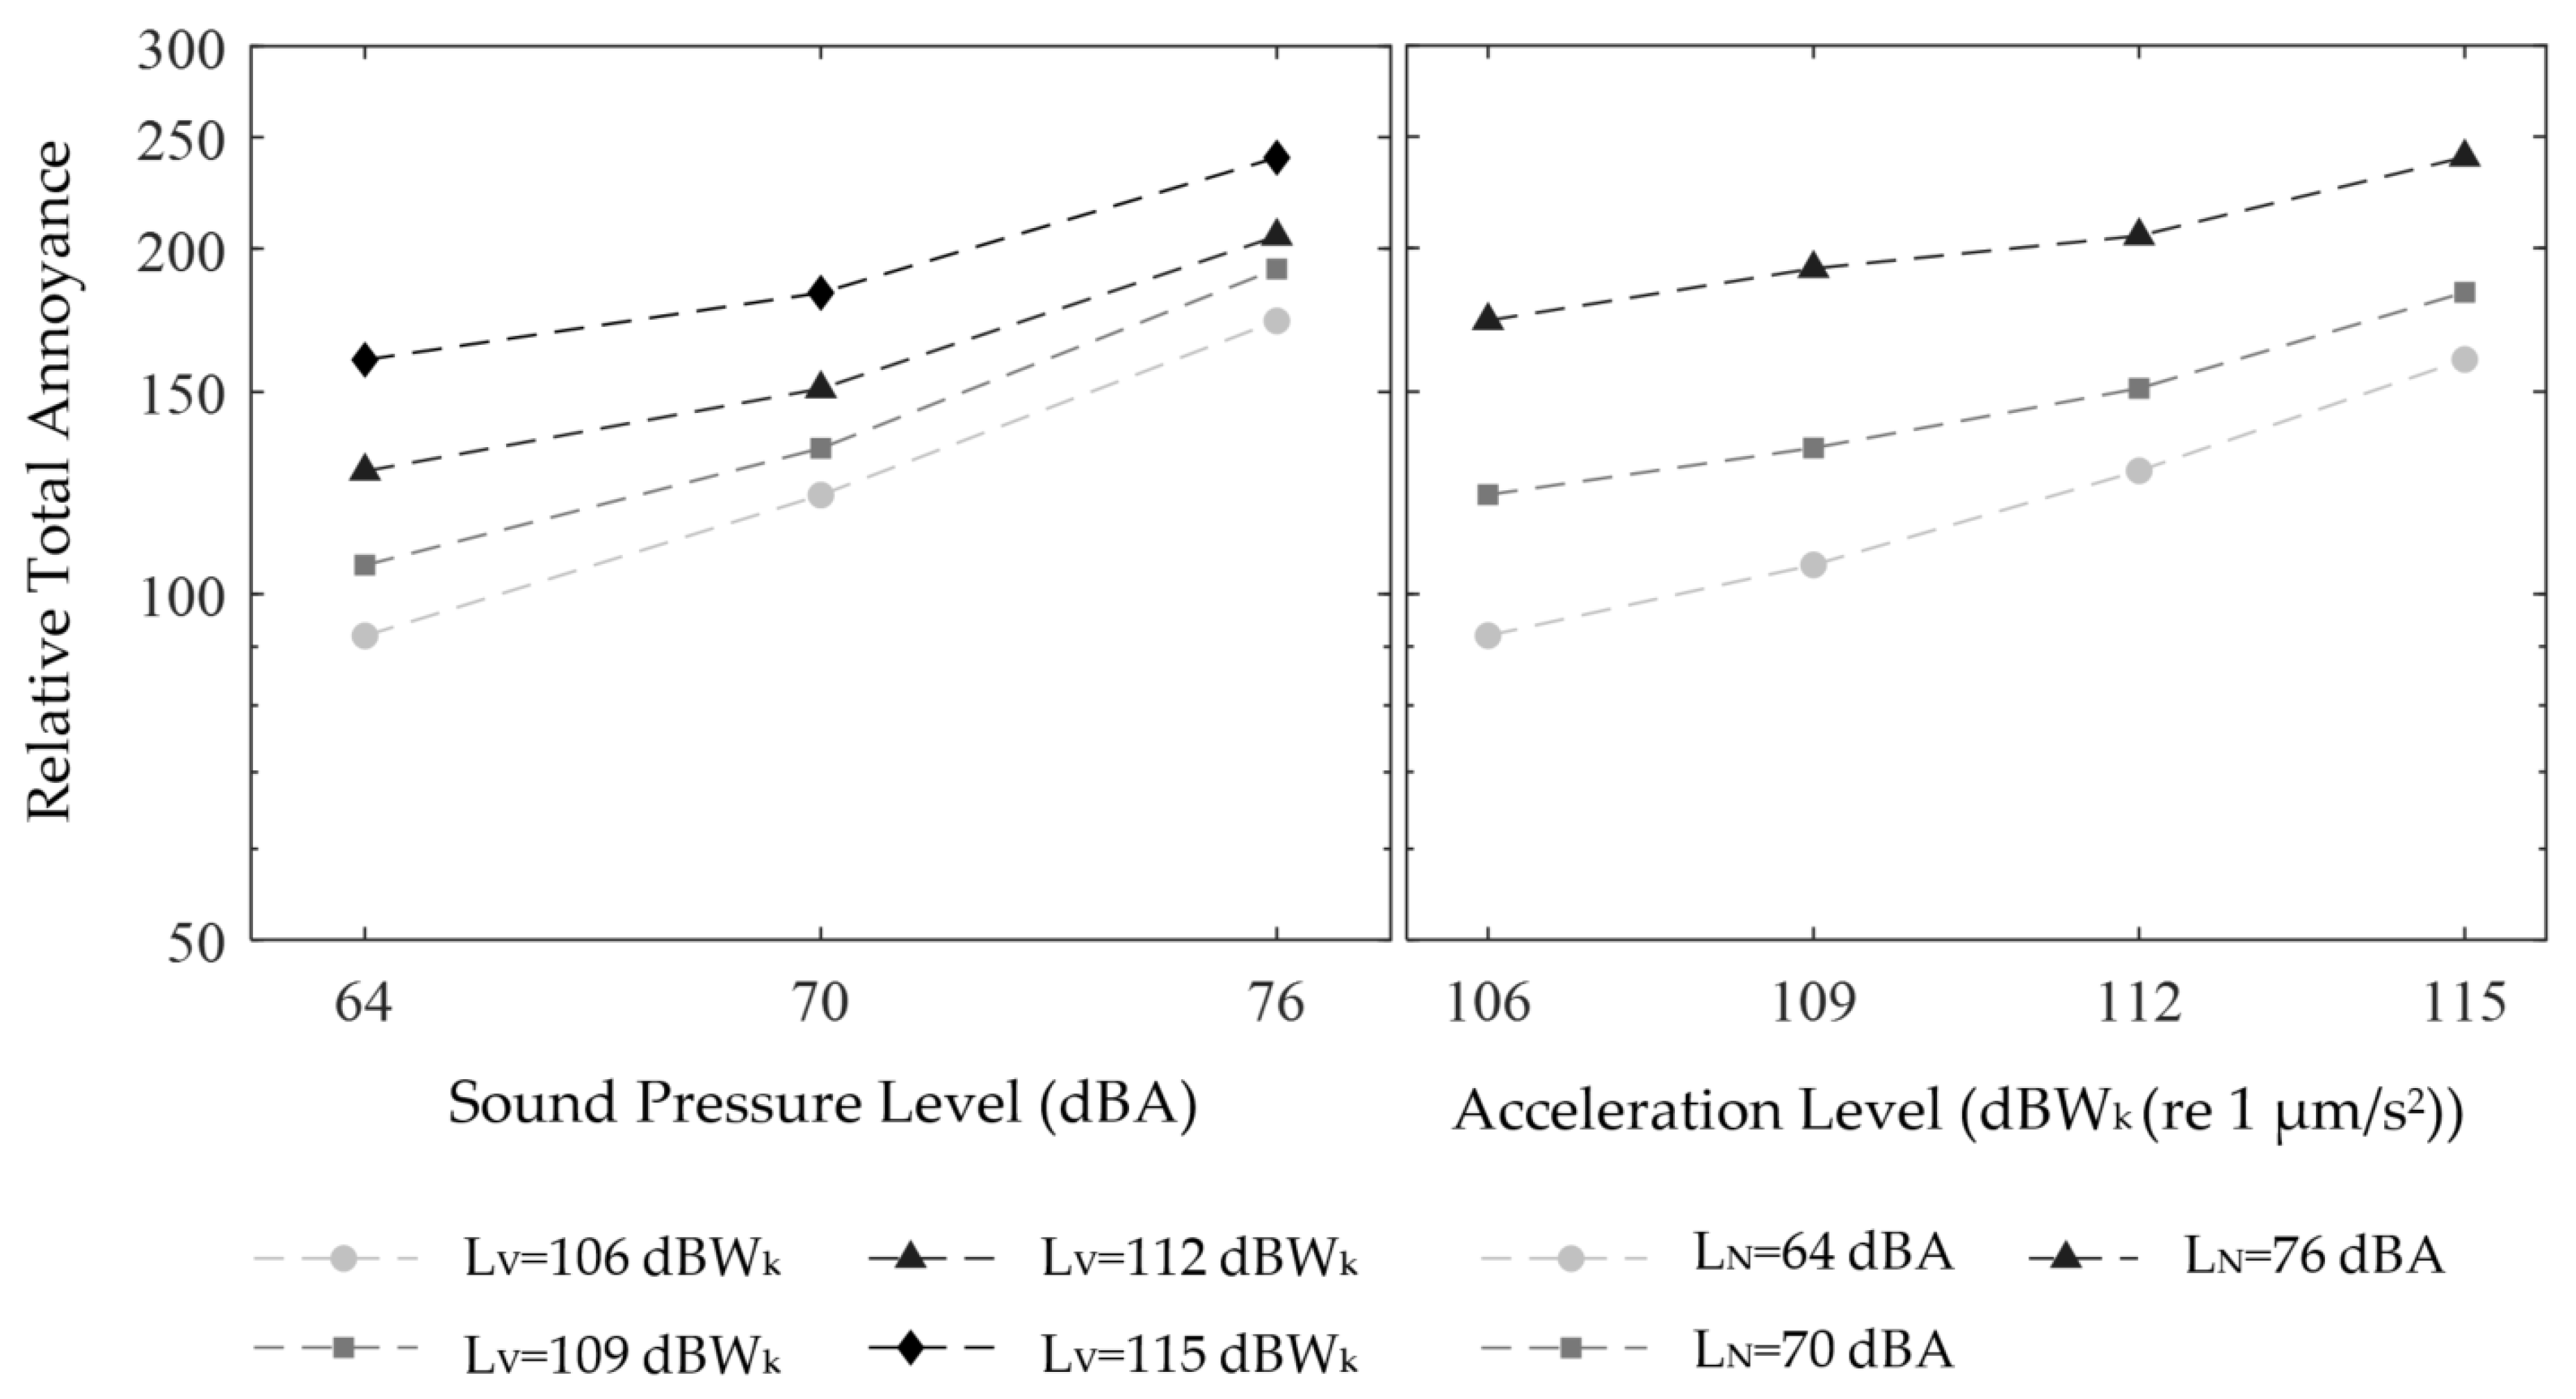
The interaction between sound pressure and acceleration level is highly significant (
F(6, 132) = 6.206,
p < .001, partial η
2 = .220), and according to Cohen [
36], to be interpreted as a very strong effect.
The higher the sound pressure level, the less the influence of increasing acceleration on the annoyance rating. If the sound pressure level is lower, the acceleration level also has more weight in the evaluation, and the annoyance ratings increase more steeply with increasing acceleration level, see
Figure 7.
The other two first-order interactions, sound pressure level and vibration frequency and acceleration level and vibration frequency, showed no statistically significant effect, (F(3.865, 85.029) = 1.694, p = .161) and (F(5.156, 113.435) = 1.294, p = .271), as well as the second-order interaction of all three main factors (F(18, 396) = 0.978, p = .48).
3.5.3. Acoustic Stimuli: Main and Interaction Effects
The unimodal acoustic stimuli were analyzed separately using an rmANOVA with the main factors “vehicle type” (2 levels) and “sound pressure level” (4 levels), see
Section 3.5. The results showed a highly significant effect of sound pressure level (
F(1.357, 29.855) = 137.197,
p < .001, partial η
2 = .862) with a very high effect size, according to Cohen [
36]. Bonferroni-corrected pairwise comparisons showed that all sound pressure level steps are significantly different from each other (
p < .001). There were no significant effect between the vehicle types (
F(1, 22) = 1.049,
p = .317). The interaction of sound pressure level and vehicle type showed no statistically significant effect (
F(2, 44) = 1.265,
p = .317).
4. Experiment 2
4.1. Hypothesis
Like the previous experiment, see
Section 3.1, this experiment examines the interaction effects of noise and vibration levels, the vibration spectrum, and their influence on total annoyance. Since frequency-weightings for WBV can also lead to different ratings, see
Section 1, this experiment aims to investigate the possible difference in annoyance in a multimodal context of sinusoidal vibration and random vibration below approx. 20 Hz, as well as a combination of both. Using real recorded signals, the question comes up whether a single sinusoidal vibration is perceived as more annoying than a complex vibration containing a sinusoidal component or as a complex signal without any sinusoidal component.
4.2. Stimuli
Experiment 2 is based on acoustic and vibration signals from a refuse collection vehicle on the highway. Like in experiment 1, the signals were recorded from the driver’s view. Stadtreinigung Dresden provided the refuse collection vehicle, and the scenes were recorded during a normal shift. The sound recordings were made with two microphones (Type 4188 with Preamplifier Type 2671, Brüel & Kjær Sound & Vibration Measurement A/S, Nærum, Denmark) mounted at the driver’s seat at ear position, and the seat vibrations were recorded using a triaxial seat pad (Triaxial Seat Accelerometer Type 4515B, Brüel & Kjær Sound & Vibration Measurement A/S, Nærum, Denmark).
In order to compare both experiments, the chosen vibration signal was also adjusted to 112 dBW
k (ref 1 × 10
−6 m/s
2), and the frequency content varied, see
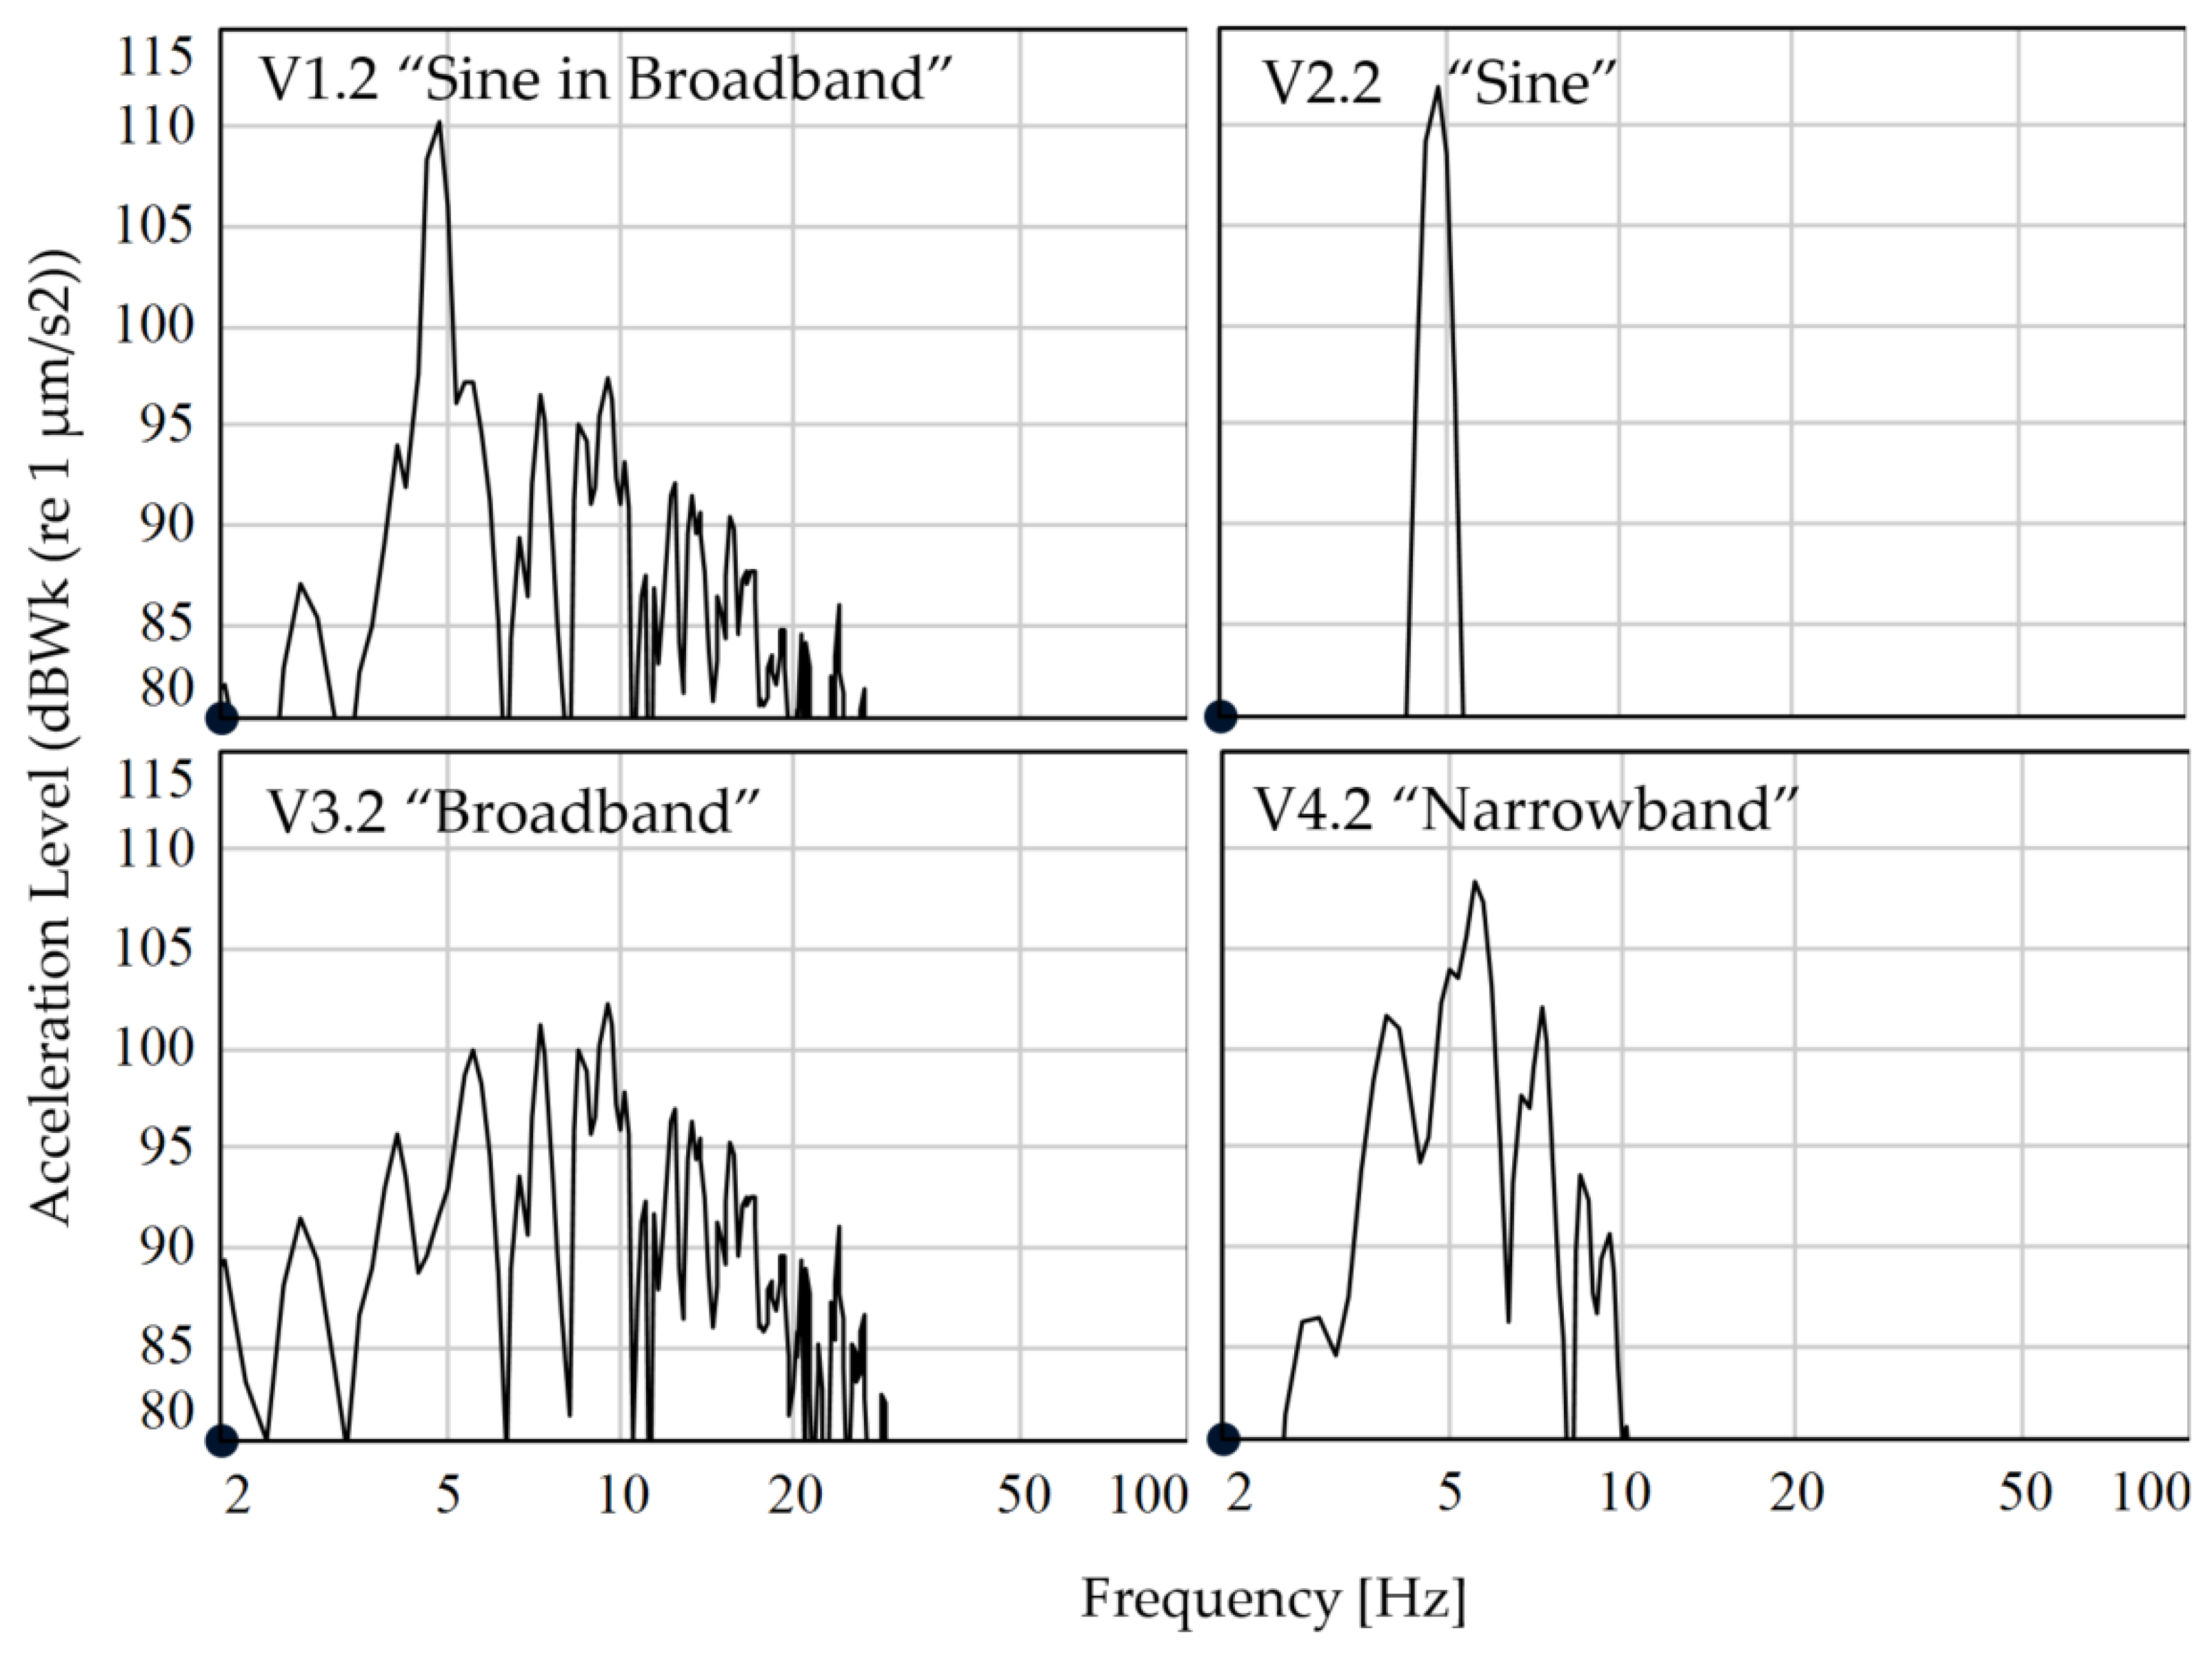
Figure 8.
All vibration signals were high-pass filtered from 2 Hz, and four variations were generated and labeled as follows (VX.X.: VibrationSpectraNumber. Experiment-Number):
V1.2: Frequency content (FC) of a refuse collection vehicle: “Sine in Broadband”
V2.2: 4.75 Hz Sinus: “Sine”
V3.2: FC without 4.75 Hz Sine: “Broadband”
V4.2: V3.2 filtered from 4 to 6 Hz: “Narrowband”
The vibration spectrum (V1.2) of the refuse collection vehicle on the highway contains a sinusoidal component, 4.75 Hz (“Sine in Broadband”). Based on this signal structure, the frequency variation V2.2 consists of a single sine of 4.75 Hz (“Sine”). V3.2 consists of the vibration spectrum V1.2 without the 4.75 Hz sinusoidal component (“Broadband”), and V4.2 is a narrowband version of V3.2 from 4 to 6 Hz (“Narrowband”). The following four variants of the vibration spectrum result: a sinusoidal component in a broadband signal (V1.2), a pure sine signal (V2.2), a broadband signal with no sinusoidal component (V3.2), and narrowband noise (V4.2).
All vibration signals V1.2–V4.2 were adjusted to identical Wk-weighted RMS levels (0.4 m/s2 or 112 dBWk (ref 1 × 10⁻⁶ m/s2)). The vibration spectra V1.2–V4.2 were adjusted to +3 dB, −3 dB and −6 dB resulting in four different levels (106, 109, 112, 115) dBWk (ref 1 × 10⁻⁶ m/s2), corresponding to (0.20, 0.28, 0.40, 0.56) m/s2 Wk, for each vibration spectrum identical to experiment 1.
The measured crosstalk of the vibration stimuli on the horizontal axes was comparable for all four vibration stimuli types and increased with increasing vertical vibration level. On the
x-axis, “fore and aft”, (90–100 dBW
d (ref 1 × 10
−6 m/s
2)), the crosstalk was higher than on the
y-axis, “left and right”, (78–88 dBW
d (ref 1 × 10
−6 m/s
2)). “Left and right” vibrations can be neglected, according to VDI 2057 [
35]. The signals on the
y-axis were “easily perceptible”. Except for signal V3.1 (“Broadband”), all signals had comparable crosstalk on the horizontal axes. While the crosstalk on the
x-axis for the vibration spectra V1.2, V2.2 and V4.2 ranged from 92 to 100 dBW
d (ref 1 × 10
−6 m/s
2) depending on the level, the crosstalk for V3.2 was around 5 dB lower at 88–95 dBW
d (ref 1 × 10
−6 m/s
2). This should be taken into account when interpreting the results.
Despite the crosstalk, the level difference from the vertical to the horizontal axes was at least over 10 dB, from which it can be assumed that the vertical axis is the dominant axis according to ISO 2631-1 [
15].
Like in experiment 1, the sound signal was high-pass filtered for plausible reproduction with no further changes in frequency structure, see
Figure 9. The sound signals were presented simultaneously with the vibration signals with three different sound pressure levels (64, 70, 76) dBA. The reference was the same as in experiment 1; see
Section 3.2. Both acoustical stimuli (Reference and refuse collection vehicle) were additionally also presented without vibrations in four sound pressure level steps (64, 70, 76, 79) dBA.
Experiment 2 includes 56 stimuli: 48 vibro-acoustic and eight acoustic stimuli. Each of them has a duration of four seconds and no visual feedback.
4.3. Design and Methodology
The design and procedure of the second experiment were identical to the first experiment and were described in more detail in
Section 3.2.
4.4. Participants
In this Experiment, 23 healthy participants voluntarily attended. The participant mean age was 31.1 years (Standard deviation 10.8 years). In total, five female and 18 male participants attended the experiment. Most of them were students or employees at the university. Of these 23 participants of this experiment, 16 participants have already taken part in experiment 1 and thus had previous experience with regard to the evaluation method. The experiments took place on different days at least four weeks apart.
4.5. Results
Because of the same design, the results of the annoyance ratings were analyzed, like in experiment 1. Therefore, the log-transformed data of the vibro-acoustic and acoustic stimuli were analyzed separately with two different Repeated Measures Analysis of Variance (rmANOVA) using IBM SPSS Statistics. For the results of the 48 vibro-acoustic stimuli, a three-way rmANOVA was carried out with the factors: “vibration frequency” with the levels V1.2, V2.2, V3.2, V4.2, “sound pressure level” with the levels (64, 70, 76) dBA and “acceleration level” with the levels (106, 109, 112, 115) dBWk (ref 1 × 10⁻⁶ m/s2). For the results of the eight acoustic stimuli, a two-way rmANOVA with was carried out with the factors “vehicle type” (refuse collection vehicle and mini excavator) and “sound pressure level” with the levels (64, 70, 76, 79) dBA. Sphericity was checked with the Mauchly test, and Greenhouse–Geisser adjustment was used to correct the degree of freedom in case of any violation.
Before running the rmANOVA, the normal distribution was checked for the results of the 56 stimuli by using the Shapiro–Wilk test. The results show, according to the Shapiro–Wilk test, that approx. a quarter of the groups are not normally distributed. All these groups were visually checked using a histogram. No strong deviations from the normal distribution were observed. The reference (mini excavator LN = 70 dBA) was repeated in the experiment. A total of 22 of 23 participants rated this stimulus with 100 and only one participant with 110, so that can be assumed that all participants evaluated the experiment attentively.
4.5.1. Vibro-Acoustic Stimuli: Main Effects
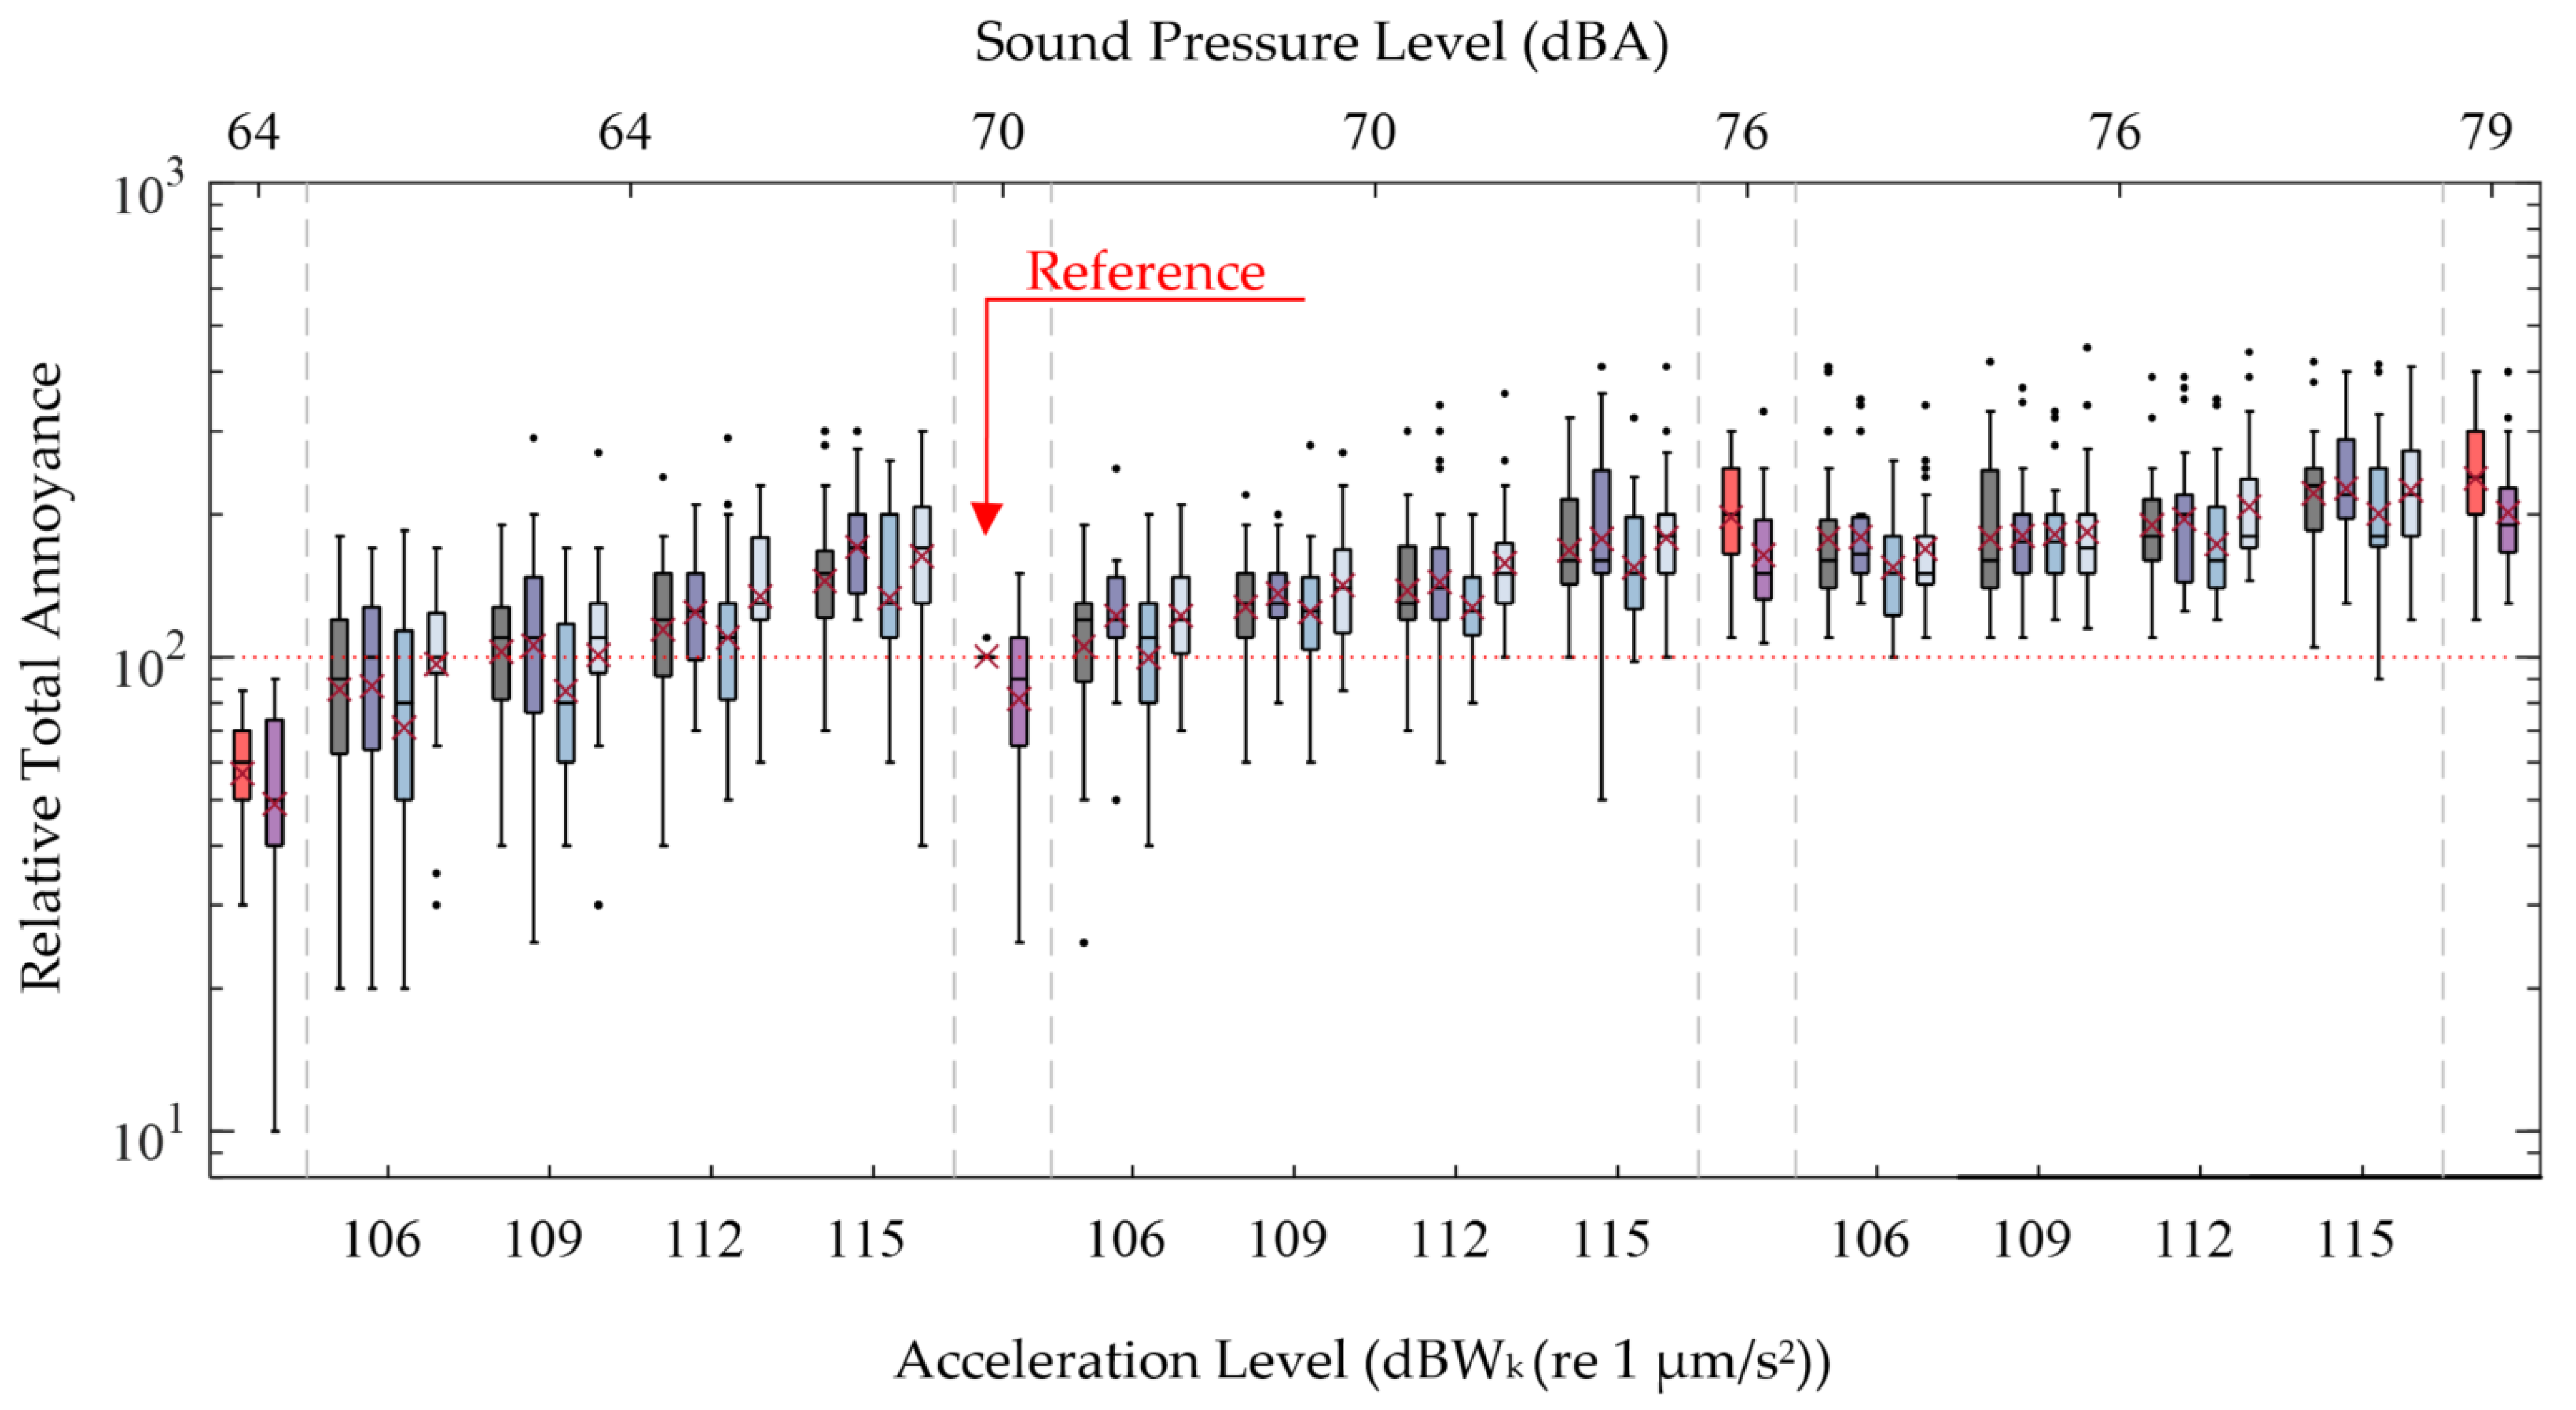
Figure 10 shows the results of relative total annoyance ratings using the magnitude estimation of each stimulus group as boxplot and the geometric mean values. The different color bars symbolize the vibration spectra (V1.2–V4.2).
Comparable to the results of experiment 1, the slope of the ratings at high sound pressure levels (LN = 76 dBA) over the acceleration levels is flatter than the slope of the ratings at lower sound pressure levels (LN = 64 dBA).
The analysis of the vibro-acoustic stimuli showed a highly significant influence of sound pressure and acceleration level (
F(1.068, 23.493) = 57.899,
p < .001, partial η
2 = .725 and
F(1.822, 40.084) = 182.552,
p < .001, partial η
2 = .892) and a very strong effect size according to Cohen [
36]. Bonferroni-corrected pair comparisons also showed that all levels of sound pressure and acceleration level differ significantly from each other (
p < .001).
The main factor, “vibration frequency”, also showed a significant effect (
F(3, 66) = 33.080,
p < .001, partial η
2 = .601) and a very strong effect size, according to Cohen [
36]. Stimuli combinations with the label “Sine in Broadband” were perceived as more annoying than “Broadband” but less than ”Narrowband” and “Sine”. Pairwise comparisons with Bonferroni correction showed that all vibration spectra differ significantly from each other except V2.2 (“Sine”) and V4.2 (“Narrowband”), see
Table 2. The stimuli with the vibration spectra labeled “Narrowband” and “Sine” were perceived as the most annoying. Stimuli with the vibration spectrum “Broadband” were perceived as least annoying.
4.5.2. Vibro-Acoustic Stimuli: Interaction Effects
The interaction between sound pressure and acceleration level is highly significant (
F(6132) = 11.737,
p < .001, partial η
2 = .348) and, according to Cohen [
36], to be interpreted as a very strong effect. In this experiment, there is a comparable kind of interaction observed, like in the first experiment, which was described in
Section 3.5.2.
The other two first-order interactions, sound pressure level and vibration frequency, as well as acceleration level and vibration frequency, showed no statistically significant effect, (F(3.835, 84.375) = 2.396, p = .059) and (F(4.518, 99.404) = 1.198, p = .298), as well as the interaction of all three main factors (F(7.684, 169.044) = 0.974, p = .489).
4.5.3. Acoustic Stimuli: Main and Interaction Effects
The acoustic stimuli were analyzed separately using an rmANOVA with the main factors “vehicle type” (2 levels) and “sound pressure level” (4 levels); see
Section 4.5.
The results show a highly significant influence of the sound pressure level (
F(1.659, 36.498) = 170.159,
p < .001, partial η
2 = .886) with a very high effect size, according to Cohen [
36]. Bonferroni-corrected pairwise comparisons showed that all levels differ significantly from each other (
p < .001).
The sound frequency (“vehicle type”) has a significant effect (
F(1, 22) = 10.333,
p = .004, partial η
2 = .320) with a high effect size, according to Cohen [
36]. The anchor stimuli of the mini excavator were perceived as more annoying than the noise of the refuse collection vehicle.
The interaction of sound pressure level and sound frequency showed no statistically significant effect (F(1.837, 40.412) = 0.152, p = .928).


