

Ultrasonic Signal Time-Expansion Using DAC Frequency Modulation

Abstract
:1. Introduction
2. Materials and Methods
- A sampled sinusoidal ultrasonic signal is time-expanded with the calculation of its spectrum.
- The process is generalized to a generic band-limited signal.
2.1. Sinusoidal Input
2.2. Extension to Passband Ultrasonic Signals
2.3. Simulations Results
3. Experimental Results
4. Discussion
Author Contributions
Funding
Data Availability Statement
Conflicts of Interest
Abbreviations
| DAC | digital-to-analog converter |
| Ksps | kilo samples per second |
| MDPI | Multidisciplinary Digital Publishing Institute |
References
- Mac Aodha, O.; Gibb, R.; Barlow, K.E.; Browning, E.; Firman, M.; Freeman, R.; Harder, B.; Kinsey, L.; Mead, G.R.; Newson, S.E.; et al. Bat detective—Deep learning tools for bat acoustic signal detection. PLoS Comput. Biol. 2018, 14, e1005995. [Google Scholar] [CrossRef] [PubMed] [Green Version]
- Stathopoulos, V.; Zamora-Gutierrez, V.; Jones, K.E.; Girolami, M. Bat Echolocation Call Identification for Biodiversity Monitoring: A Probabilistic Approach. J. R. Stat. Soc. Ser. C Appl. Stat. 2018, 67, 165–183. [Google Scholar] [CrossRef] [Green Version]
- Russo, D.; Jones, G. Identification of twenty-two bat species (Mammalia: Chiroptera) from Italy by analysis of time-expanded recordings of echolocation calls. J. Zool. 2002, 258, 91–103. [Google Scholar] [CrossRef] [Green Version]
- Thiagavel, J.; Santana, S.E.; Ratcliffe, J.M. Body Size Predicts Echolocation Call Peak Frequency Better than Gape Height in Vespertilionid Bats. Sci. Rep. 2017, 7, 828. [Google Scholar] [CrossRef] [Green Version]
- Fraser, E.E.; Silvis, A.; Brigham, R.M.; Czenze, Z.J. Bat Echolocation Research: A Handbook for Planning and Conducting Acoustic Studies, 2nd ed.; Bat Conservation International: Austin, TX, USA, 2020. [Google Scholar]
- Zölzer, U. Time-segment processing. In DAFX: Digital Audio Effects, 2nd ed.; Helmut Schmidt University—University of the Federal Armed Forces City: Hamburg, Germany, 2011; pp. 185–215. [Google Scholar]
- Ferreira, A.J.S. A new frequency domain approach to time-scale expansion of audio signals. In Proceedings of the 1998 IEEE International Conference on Acoustics, Speech and Signal Processing, ICASSP ’98 (Cat. No.98CH36181), Seattle, WA, USA, 15 May 1998; Volume 6, pp. 3577–3580. [Google Scholar] [CrossRef]
- Laroche, J.; Dolson, M. Improved phase vocoder time-scale modification of audio. IEEE Trans. Speech Audio Process. 1999, 7, 323–332. [Google Scholar] [CrossRef] [Green Version]
- Ferreira, A.J.S. An odd-DFT based approach to time-scale expansion of audio signals. IEEE Trans. Speech Audio Process. 1999, 7, 441–453. [Google Scholar] [CrossRef] [PubMed]
- Dun, Y.; Liu, G. A Fine-Resolution Frequency Estimator in the Odd-DFT Domain. IEEE Signal Process. Lett. 2015, 22, 2489–2493. [Google Scholar] [CrossRef]
- Ferreira, A.J.S. Accurate estimation in the ODFT domain of the frequency, phase and magnitude of stationary sinusoids. In Proceedings of the 2001 IEEE Workshop on the Applications of Signal Processing to Audio and Acoustics (Cat. No.01TH8575), New Platz, NY, USA, 24 October 2001; pp. 47–50. [Google Scholar]
- Berthaut, F.; Janin, D.; Martin, B. Advanced Synchronization of Audio or Symbolic Musical Patterns: An Algebraic Approach. Int. J. Semant. Comput. 2012, 6, 409–427. [Google Scholar] [CrossRef] [Green Version]
- Zölzer, U. Time-Frequency Processing. In DAFX: Digital Audio Effects; Wiley: Hoboken, NJ, USA, 2011; pp. 219–278. [Google Scholar] [CrossRef]
- Almenar, V.; Girona, A.; Flores, S.; Marin-Roig, J. Transmit Diversity Scheme for OFDM Systems Using the Odd DFT. IEICE Trans. Commun. 2011, E94-B, 2411. [Google Scholar] [CrossRef] [Green Version]
- Stojanovic, V.; Nedic, N. Robust Kalman filtering for nonlinear multivariable stochastic systems in the presence of non-Gaussian noise. Int. J. Robust Nonlinear Control. 2016, 26, 445–460. [Google Scholar] [CrossRef]
- Stojanovic, V.; Nedic, N.; Prsic, D.; Dubonjic, L. Optimal experiment design for identification of ARX models with constrained output in non-Gaussian noise. Appl. Math. Model. 2016, 40, 6676–6689. [Google Scholar] [CrossRef]
- Marks, R.J. Handbook of Fourier Analysis & Its Applications; Oxford University Press: Oxford, UK, 2009. [Google Scholar] [CrossRef]
- Kahrs, M.; Brandenburg, K. Applications of Digital Signal Processing to Audio and Acoustics; Springer: Berlin/Heidelberg, Germany, 2013. [Google Scholar]
- Winder, S. Analog and Digital Filter Design; Elsevier: Amsterdam, The Netherlands, 2002. [Google Scholar]


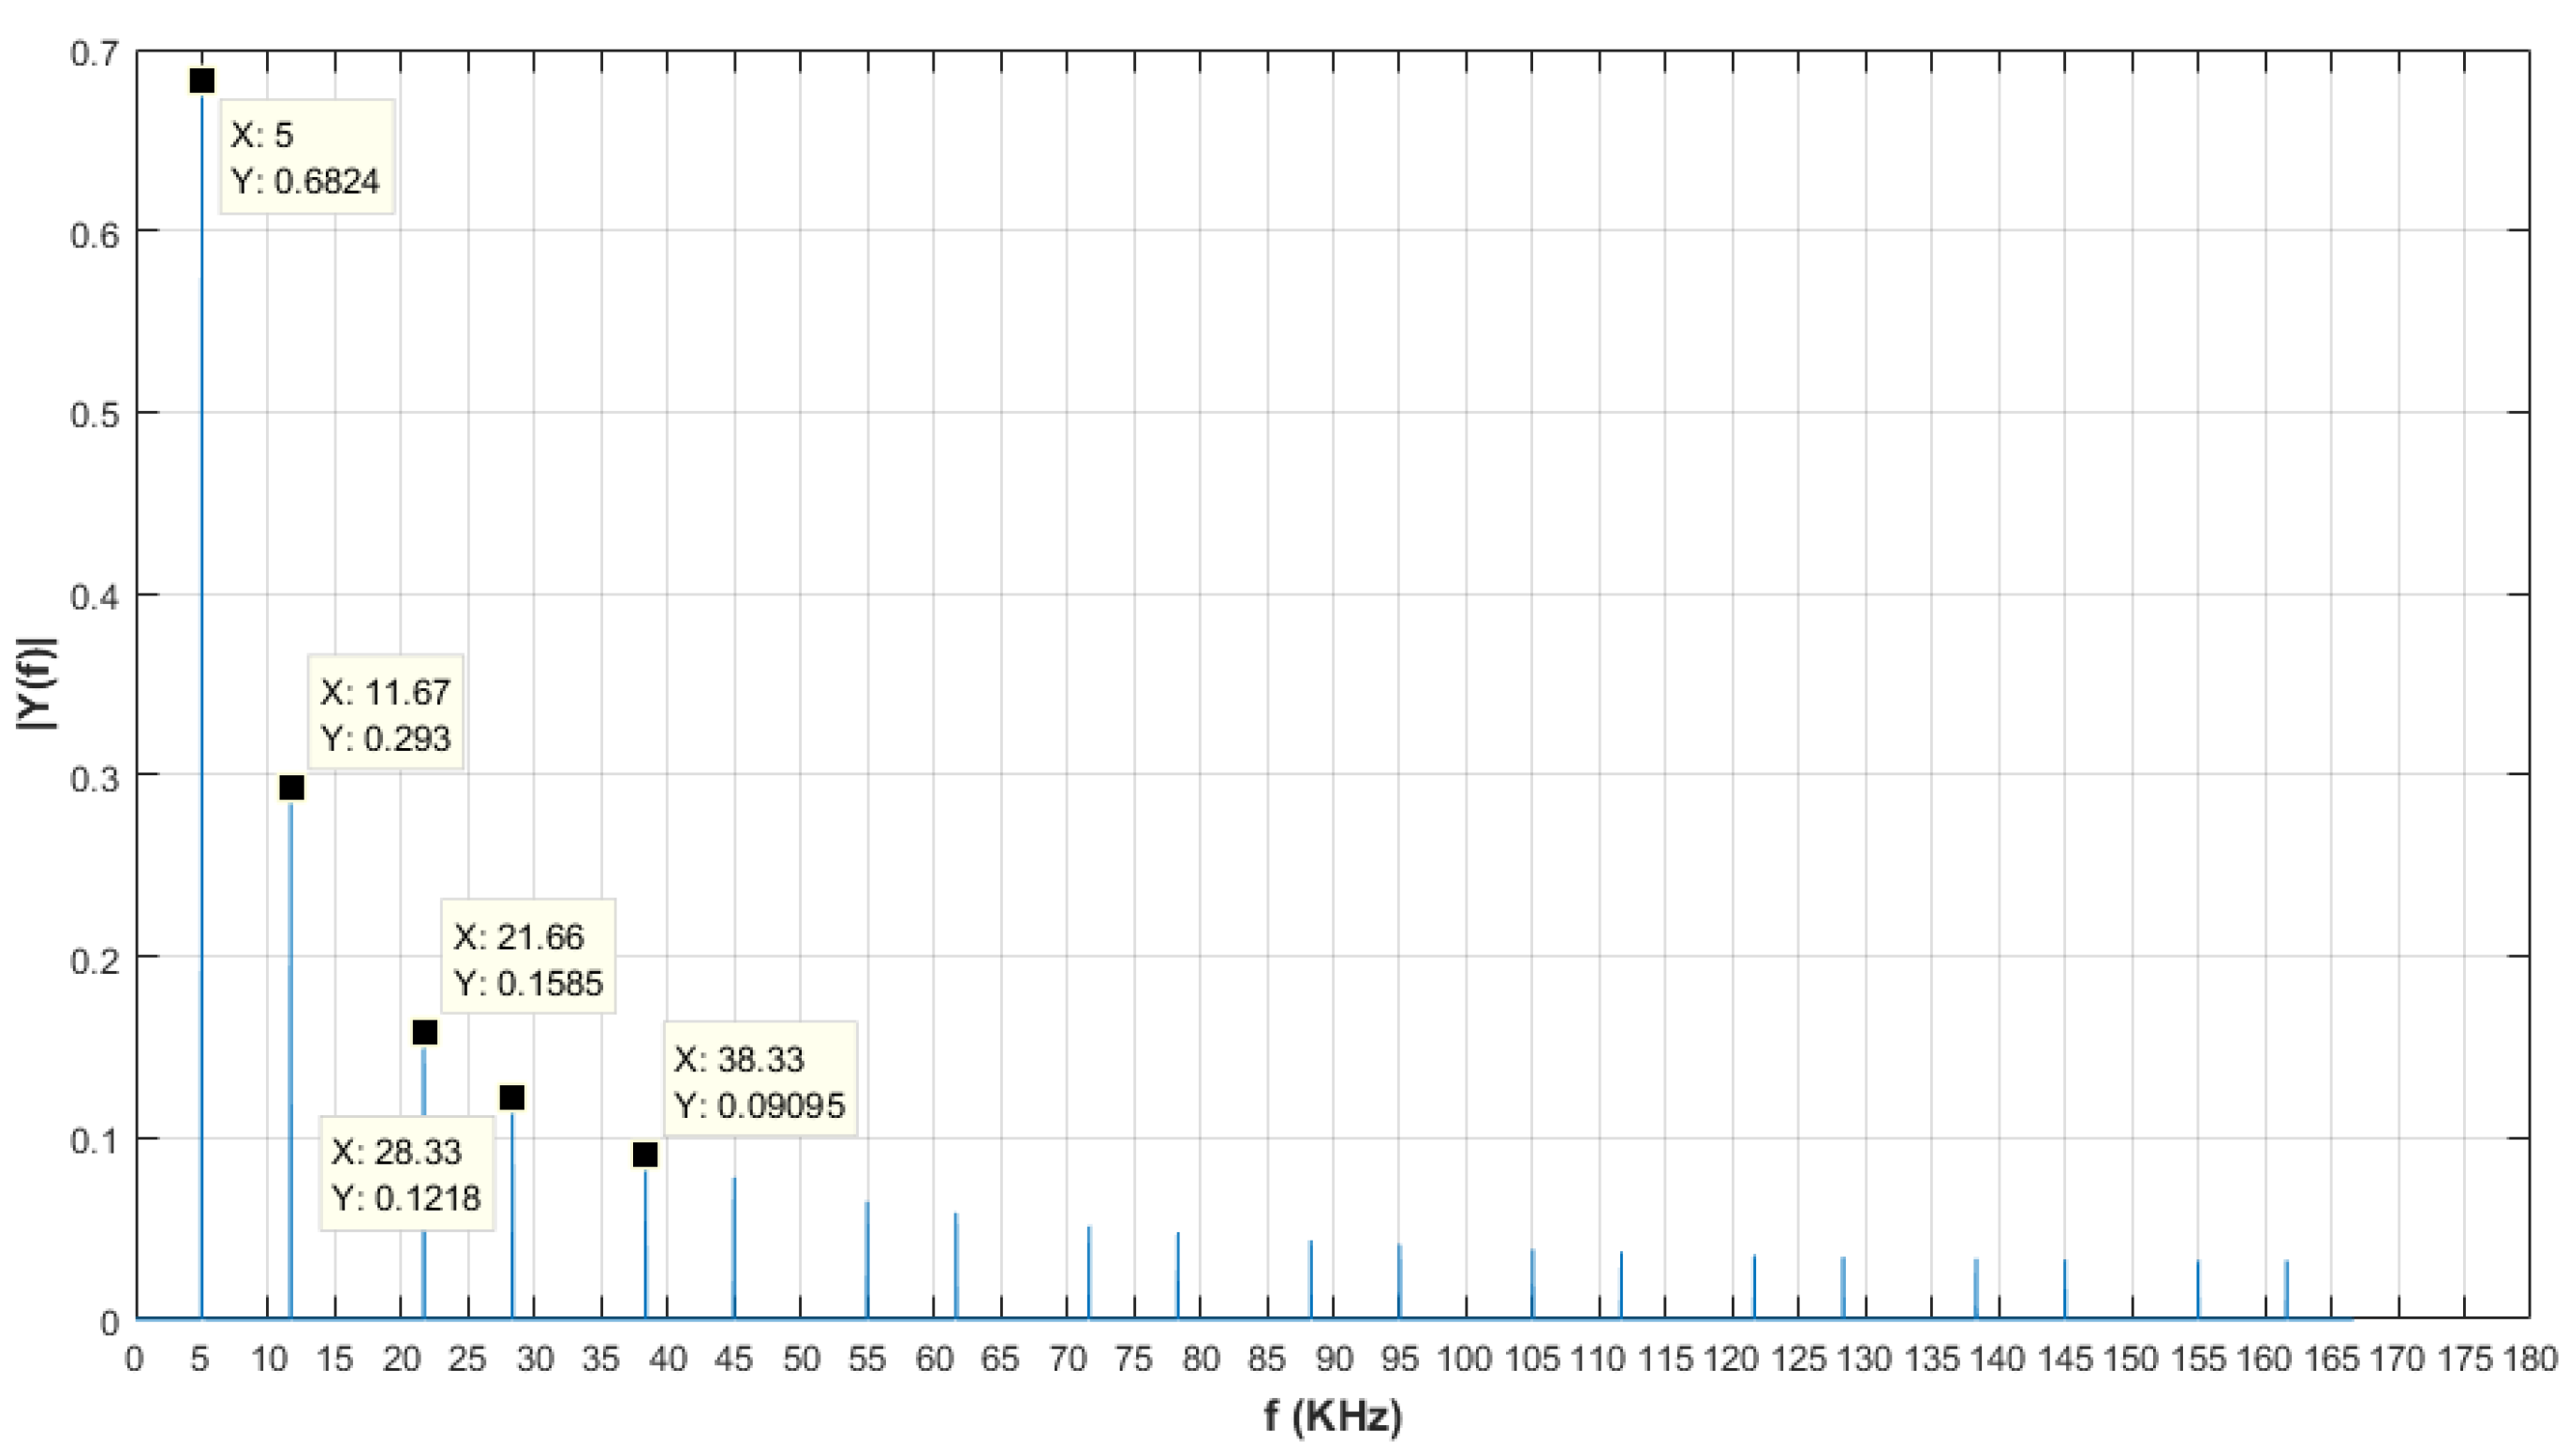
| fo (KHz) | fs (KHz) | n | f_out (KHz) | |
|---|---|---|---|---|
| 100 | 333.33 | 0 | 5 | |
| 100 | 333.33 | 1 | 11.66 | 21.66 |
| 100 | 333.33 | 2 | 28.33 | 38.33 |
| 100 | 333.33 | 3 | 44.99 | 54.99 |
| 100 | 333.33 | 4 | 61.66 | 71.66 |
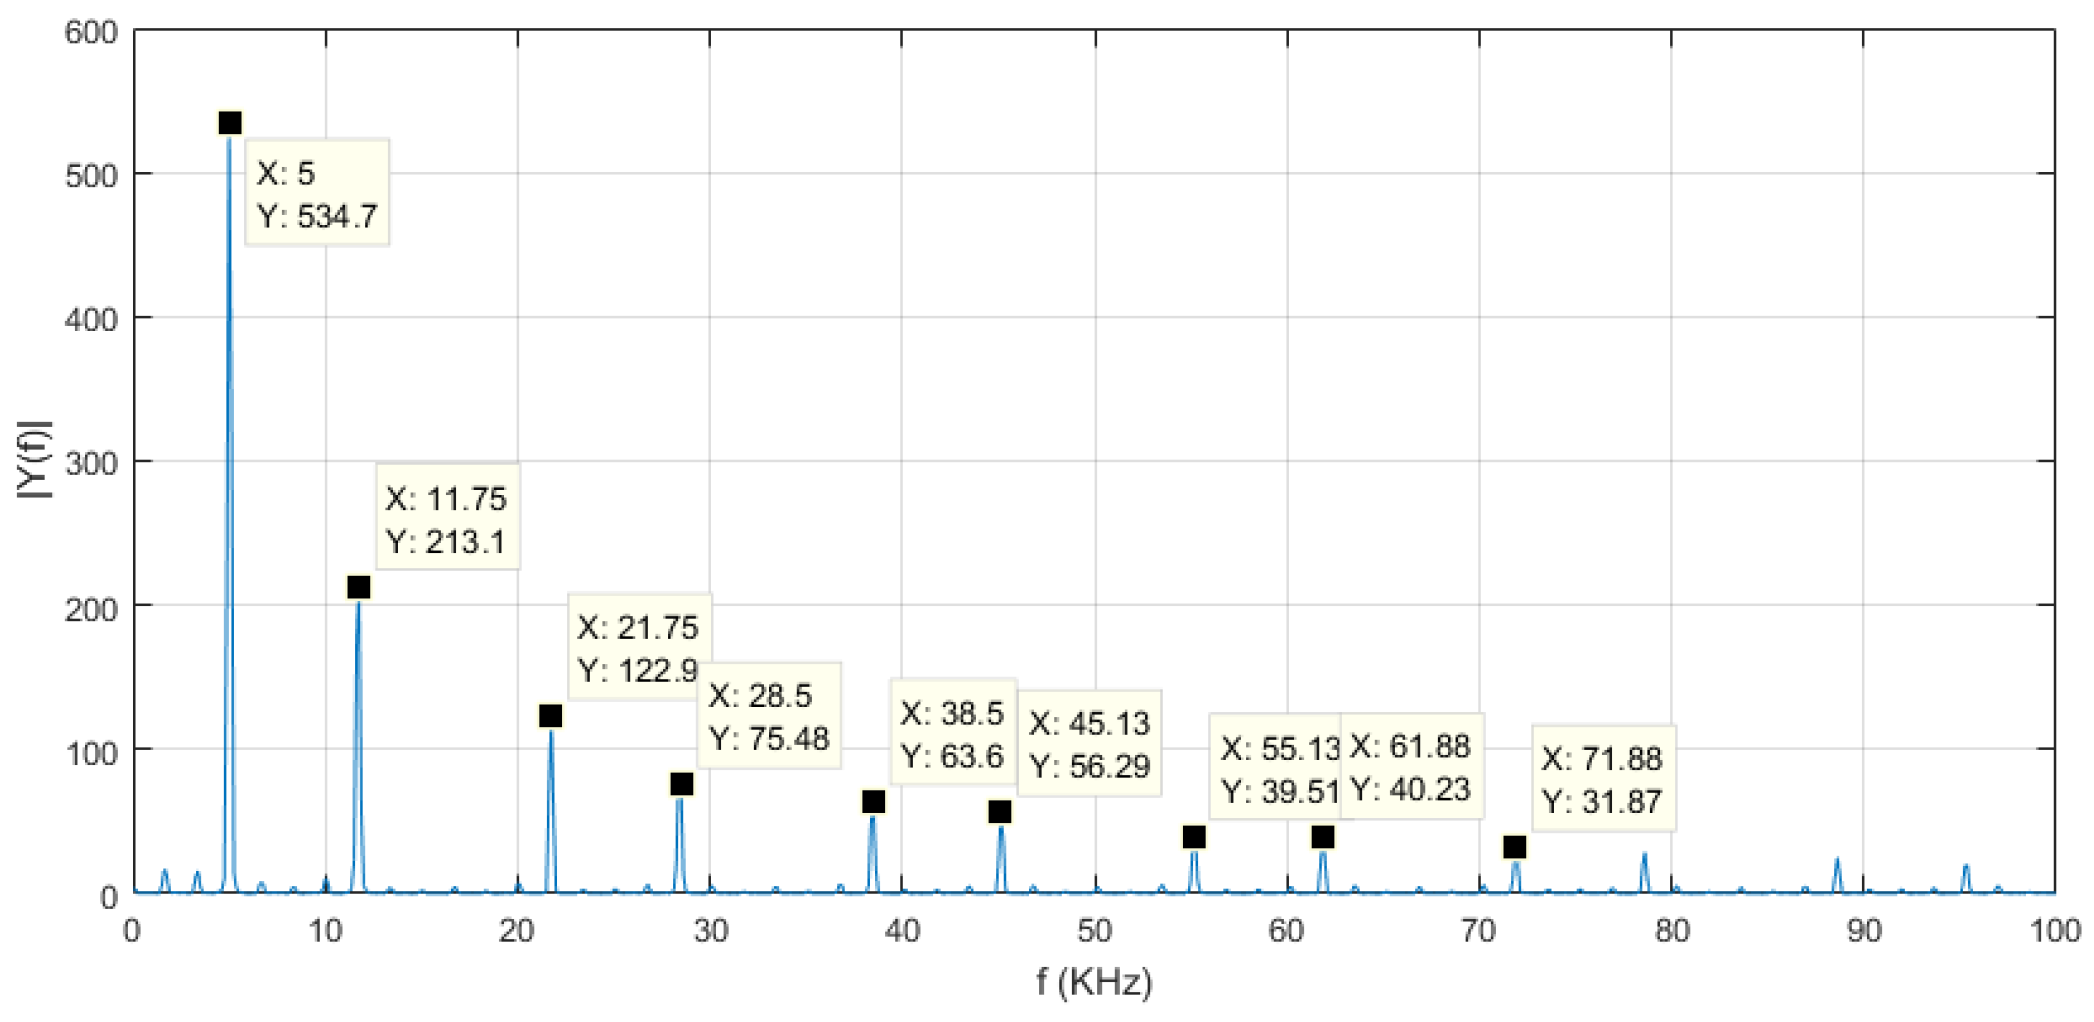
| fo (KHz) | fs (KHz) | n | f_out (KHz) | |
|---|---|---|---|---|
| 100 | 333.3 | 0 | 5 | |
| 100 | 333.3 | 1 | 11.7 | 21.7 |
| 100 | 333.3 | 2 | 38.3 | 45.1 |
| 100 | 333.3 | 3 | 55.1 | 61.8 |
Disclaimer/Publisher’s Note: The statements, opinions and data contained in all publications are solely those of the individual author(s) and contributor(s) and not of MDPI and/or the editor(s). MDPI and/or the editor(s) disclaim responsibility for any injury to people or property resulting from any ideas, methods, instructions or products referred to in the content. |
© 2023 by the authors. Licensee MDPI, Basel, Switzerland. This article is an open access article distributed under the terms and conditions of the Creative Commons Attribution (CC BY) license (https://creativecommons.org/licenses/by/4.0/).
Share and Cite
Rossi, M.; Frasca, M. Ultrasonic Signal Time-Expansion Using DAC Frequency Modulation. Vibration 2023, 6, 466-476. https://doi.org/10.3390/vibration6030029
Rossi M, Frasca M. Ultrasonic Signal Time-Expansion Using DAC Frequency Modulation. Vibration. 2023; 6(3):466-476. https://doi.org/10.3390/vibration6030029
Chicago/Turabian StyleRossi, Massimiliano, and Marco Frasca. 2023. "Ultrasonic Signal Time-Expansion Using DAC Frequency Modulation" Vibration 6, no. 3: 466-476. https://doi.org/10.3390/vibration6030029