1. Introduction
Recently, the lifespan of people has been getting longer, and more and more people have been becoming highly health-literate [
1]. If people with high health literacy take actions to improve their health, they can live longer than ever in good health conditions and work beyond the conventional time limit of job retirement. This trend of change in people’s working lives leads to an increase in individuals’ total working time. Similarly, workers using handheld power tools are likely to work longer beyond the job retirement age of 60 years old. Tool operators aged around 60–70 years, working in manufacturing, construction, heavy industries, etc., have usually used power tools for a few decades or more. Hence, the total operating time (TOT) of older workers using power tools has become longer than ever, and adverse health effects due to hand–arm vibration (HAV) exposure are increasingly accumulating in such workers’ hand–arm systems. Many older power-tool operators in various industries are thus at a high risk of hand–arm vibration syndrome (HAVS).
HAVS consists of adverse health effects in the peripheral vascular, peripheral neurological, and musculoskeletal systems in the hand–arm system [
2,
3]. Many HAVS patients show a complex combination of these symptoms [
4,
5]. Vibration-induced white finger (VWF)—one of the vascular components of HAVS, also known as Raynaud’s phenomenon—has been considered a typical symptom in HAVS patients [
6]. The appearance of VWF represents an increased occurrence of vasospasm in the digital capillaries. The risk assessment in the annex of ISO 5349-1 [
7] is based on the relation to the level of vibrational intensity, total exposure time, and the prevalence of VWF. Moreover, VWF has been one of the important criteria for recognition of industrial accident compensation for HAVS. As well as in other countries [
8], those who have occupationally developed VWF in Japan have been recognized without exception as having HAVS that is subject to industrial accident compensation. Previously, cases of workers who had not developed VWF but had shown other symptoms related to neurosensory disorders typically observed in HAVS patients were hard to recognize as being subject to industrial accident compensation.
Recently, industrial accident compensation cases without any diagnosis of Raynaud’s phenomenon have been increasingly recognized as HAVS, many of which include cases of workers exposed to HAV at a relatively low vibrational intensity for a long time of 30–40 years. Because of this, the author focused on potential HAVS patients exhibiting only neurological components. These potential patients did not show typical peripheral vascular symptoms of VWF but mainly complained of neurosensory symptoms in the fingers, such as hypoesthesia, numbness, tingling, and pain. Until the middle of 20th century, the neurosensory symptoms were regarded as precursors of the development of HAVS-related vascular disorders. A recent report that performed a systematic review and meta-analysis on hand–arm vibration and the risk of vascular and neurological diseases showed that neurosensory injury occurs with a threefold shorter latency than Raynaud’s phenomenon at equal exposures [
9]. This finding suggests that thermotactile and vibrotactile perceptions that are often used as monitoring indicators of neurosensory components can be effective in detecting potential HAV patients.
The author intends to establish a novel indicator related to vibrotactile perception that is a kind of physical quantity reflecting individual neurosensory characteristics at the fingertips and is not affected by environmental conditions or individual health status when vibrotactile perception is measured. A vibrotactile perception threshold (VPT) measured at the fingertips is one of the screening parameters often used to diagnose the development of HAVS [
10]. However, VPTs, often obtained by averaging pairs of ascending and descending thresholds, are sensitively affected by environmental conditions and individual health status when the VPT measurement is performed [
11]. Therefore, only VPTs much larger than ordinary ones have been used in conventional screening tests for HAVS as an indicator that detects patients with neurosensory damage to their fingers.
The aim of this study was to propose and validate a novel indicator that characterizes the potential effects of exposure to HAV and evaluates the increasing risk of neurological components of HAVS. The author focused on a quantity calculated from ascending and descending thresholds and residual shifts of VPTs observed at the fingertips in the recovery process after exposure to HAV. The findings obtained from this study can be used to establish a novel indicator of the development of neurosensory components appearing prior to the main symptom of HAVS, which can be useful for identifying potential HAVS patients and preventing them from developing HAVS.
2. Materials and Methods
2.1. Subjects
A total of 30 healthy male subjects participated in this study. All of the subjects were nonsmokers and reported no cardiovascular or neurological disorders in their hands. The subjects were classified into three groups: Group 1 (G1) consisted of 10 male subjects aged over 60 years with occupational exposure to HAV, Group 2 (G2) consisted of 10 male subjects aged over 60 years without exposure to HAV, and Group 3 (G3) consisted of 10 male subjects aged 20–30 years without exposure to HAV. None of the subjects in G2 or G3 had any prior history of regular use of handheld power tools in occupational or leisure activities.
The mean age of the subjects in G1 was 65.8 years (ranging from 63 to 71 years), their mean height was 170.0 cm (ranging from 166.0 to 177.8 cm), and their mean weight was 76.0 kg (ranging from 61.0 to 87.2 kg). The subjects in G2 were aged 66–75 years (mean age: 70.8 years), with a mean height of 164.1 cm (ranging from 156 to 172 cm) and a mean weight of 59.8 kg (ranging from 51.0 to 70.0 kg). The subjects in G3 were aged 20–24 years (mean age: 21.8 years), with a mean height of 174.1 cm (ranging from 168.8 to 182.3 cm) and a mean weight of 64.1 kg (ranging from 47.6 to 83.3 kg). Other anthropometric data on the subjects’ hands are summarized in
Table 1.
The subjects were requested to refrain from caffeine consumption for 4 h prior to and during the testing. All of the subjects underwent an explanation of the test procedure and gave their written informed consent to participate in this study. The experimental protocol was approved by the Research Ethics Board of the National Institute of Occupational Safety and Health, Japan (application number 2020N-1-17).
2.2. Apparatus
A vibrotactile perception meter (Type AU-06; Rion Inc., Tokyo, Japan) that satisfies the requirements specified in the international standard ISO 13091-1 (2021) [
12] was used in this study. The specifications of the vibrotactile perception meter are summarized in
Table 2. The diameter of the probe used in this vibrotactile perception meter is 4.0 mm, which yields a contact area at the fingertip of 4.0 ± 2.0 mm in diameter. The contact condition between the probe and the fingertip is classified into method B as specified in ISO 13091-1. The gap between the stimulating probe and its surroundings was 1.5 ± 0.6 mm.
Vibration perception measurements were performed at two test frequencies of 125 Hz and 31.5 Hz. The test frequencies of 125 and 31.5 Hz fall into the response range of FA II and FA I mechanoreceptors, respectively. The selection of the test frequencies was based on results obtained from previous experimental studies showing that daily shifts in fingertip VPTs measured at 125 Hz and 31.5 Hz are likely to be induced remarkably more than those at other frequencies [
13,
14,
15,
16]. Moreover these test frequencies have often been used in other studies, making the comparison of data obtained in this study with in the findings of other studies possible.
Vibrotactile perception was measured on the distal phalanx of the index finger of the right hand. Subjects were instructed to position the tip of the index finger of their right hand so that the center of the distal phalanx coincided with the center of the probe. The subjects were required to hold the response button in their left hand and instructed to press the response button as soon as they perceived a vibration sensation and to release the response button as soon as they did not perceive the vibration. Presentation of a test stimulus was based on the von Békésy algorithm, which automatically ascended or descended the magnitude of the test stimulus at 2.5 dB/s.
2.3. Experimental Condition
A vibrational signal was designed in the frequency range of 6.3 to 1250 Hz to form a pseudorandom vibrational signal segment where the power spectrum density (PSD) was constant at 1.0 (m/s
2)
2/Hz in this frequency range, corresponding to the frequency-weighted acceleration magnitude [
7] of 5.9 m/s
2 (r.m.s.). This vibrational signal segment was then reconstructed to form a rescaled signal segment, analogous to the former in terms of frequency contents, so that the weighted r.m.s. acceleration magnitude corresponded to 5.3 m/s
2. The spectra of pseudorandom vibrational signals used in this study are shown in
Figure 1.
The selection of vibrational acceleration magnitudes in this study was based on a previous report that surveyed the vibrational acceleration magnitudes of hand tools supplied in the domestic market. According to this report, several popular hand tools—including pneumatic impact wrenches, sanders, hammer drills, chainsaws, and so on—showed average weighted vibrational acceleration magnitudes falling between 5.0 and 6.0 m/s2.
Eighteen vibrational signal segments, which consisted of the same vibrational magnitudes (5.9 or 5.3 m/s2), were sequentially connected to construct two series of hand–arm vibration (HAV) test signals. The duration of each vibrational signal segment was 30 s, which was followed by a 5-second interval. Therefore, the subjects were intermittently exposed to each series of HAV, the total exposure time of which was 9 min. The signal sequence was designed to simulate the intermittent operation of a handheld tool such as can often be observed on manufacturing lines.
Prior to the experiments on VPT measurements, each subject was exposed to HAV by grasping an experimental handle fastened to a single-axis HAV test rig [
17]. The test rig was powered by an electrodynamic shaker (VE-100S; IMV Corporation, Osaka, Japan) aligned to vibrate horizontally, to which the experimental handle was mounted. The handle was vertically oriented, and its geometry was cylindrical, with a size of 40 mm in diameter and of 100 mm in grip length. The handle consisted of the handle base and the measuring cap, between which two piezoelectric single-axis force sensors (9212; Kistler Inc., Winterthur, Switzerland) were sandwiched on the handle’s centerline to measure the grip force. An accelerometer (356A12; PCB Piezotronics Inc., New York, NY, USA) was fixed to the center of the measuring cap to measure the vibrational acceleration at the handle in the fore–aft direction. The resonance frequency of the handle was beyond the range up to 1250 Hz. A force plate was secured on the floor to measure the reaction force acting horizontally between the subjects’ feet and the plate surface. This reaction force was balanced with the push force acting at the handle.
2.4. Experimental Procedure
The experiments were conducted at a room temperature controlled to 23 ± 2 °C. The subjects were required to wear earplugs (NRR31) to exclude the background noise of the laboratory, the main causes of which were the noise related to an air-conditioning unit in the laboratory and the noise related to the signal processing unit connected to a PC to control the vibrations. Prior to the experiment, the background noise level measured around the necks of the subjects using a sound level meter (Type 2250, Brüel & Kjær Inc., Virum, Denmark) was 80 dB(A). Thus, the noise level to which the subjects with the earplugs were exposed was expected to be less than 70 dB(A).
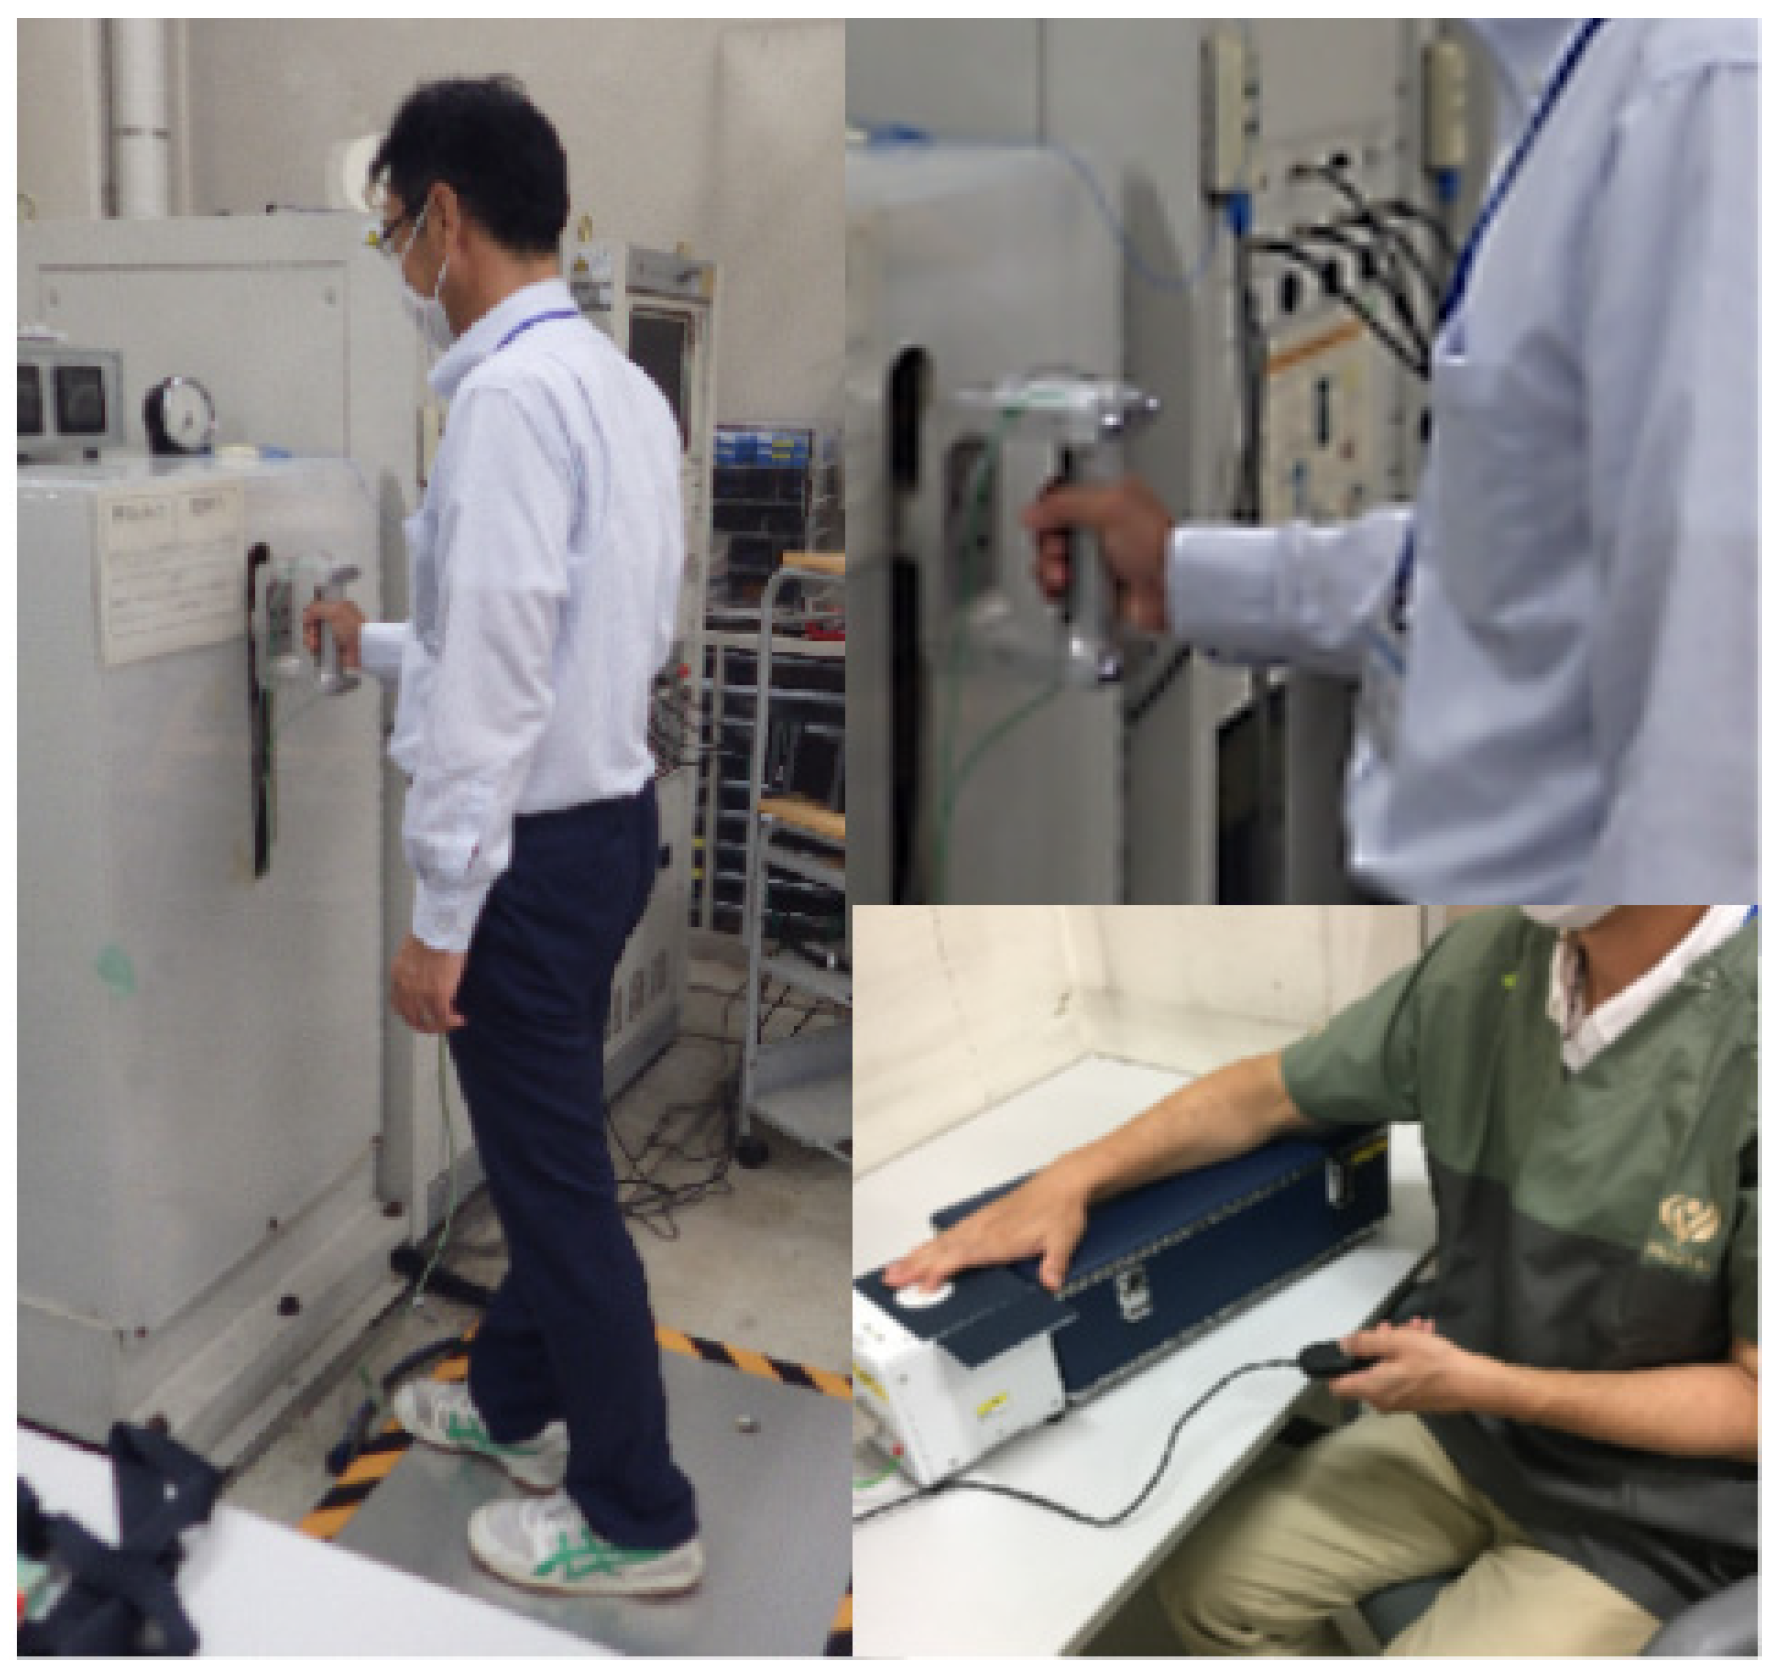
The posture condition applied to subjects in the HAV exposure task was based on the ISO 10819 test protocol [
18]. As shown in
Figure 2, the subjects were required to stand up straight in front of the shaker and then to grasp the experimental handle connected horizontally to the shaker shaft with their right hand. The subjects were also advised to keep their right forearm oriented horizontally and to maintain their elbow angle within 90 ± 10 degrees and their wrist angle between 0 and 40 degrees. Additionally, the upper arm was not allowed to touch the subject’s body. During 30 seconds of HAV exposure, the subjects were required to control their grip force within 30 ± 5 N and the feed force on the handle within 50 ± 8 N. At five-minute intervals in between HAV exposure segments, the subjects were allowed to release their grip on the handle and to relax their right hand and arm.
Immediately after the vibration exposure, the subjects were asked to sit on a chair with a backrest with their right forearm placed and relaxed on an arm fixture. Then, the subjects were advised to place the index finger of their right hand so that the center of the probe was located between the center of the fingerprint whorl and the distal corners of the fingernail. A set of VPT measurements was performed on the exposed index finger at test frequencies of 125 Hz and 31.5 Hz. The VPT measurements were conducted in descending order of frequency. The acute neurosensory response was continuously measured for the first 90 s immediately after the HAV exposure task, which was followed by 90 s of measurements every 5 min for 30 min. At every interval in a series of VPT measurements, the subjects were allowed to remove their index finger from the probe and to relax their finger.
2.5. Modeling of Vibrotactile Response to Vibrational Stimulus
The term vibrotactile perception threshold (VPT) has been defined as the skin surface acceleration level at which there is a 50% positive response rate for detecting a pure-tone oscillatory stimulus in the psychometric function according to ISO 13091-1 [
12]. However, the mechanical contact condition for measuring ascending thresholds is quite different from that for measuring descending thresholds. Descending thresholds are obtained when stimuli of successively descending vibrational intensity are applied to the skin of the fingertip until the stimulus is detected. In contrast, ascending thresholds are obtained when stimuli of successively increasing vibrational intensity are applied to the skin until the stimulus is detected. Therefore, the contact conditions between the fingertip and the tip of a vibrating indenter are quite different from one another. Averaging of data makes sense only when these data are measured under the same conditions. In this respect, conventional arithmetic averaging of three pairs of ascending and descending thresholds does not yield a 50% positive response rate based on psychophysical consideration.
In this study, the author proposes the hysteresis model shown in
Figure 3, forming a loop-like relationship between vibrotactile perception and vibrational stimuli. As indicated by the solid lines in
Figure 3, the subjective response represented by vibrotactile perception under an increasing vibrational stimulus differs from that under a decreasing vibrational stimulus, which results in different thresholds
Ta1 and
Td1 for the ascending and descending processes, respectively. Under another different condition, the subjective response changed differently, as shown by the dashed lines in
Figure 3, resulting in different ascending and descending thresholds
Ta2 and
Td2, respectively. Although ascending and descending thresholds are apparently affected by environmental conditions such as the ambient temperature and by acute effects of the physiological and biomechanical conditions of the fingertip, the difference between these thresholds denoted by VPTW may be less affected by the aforementioned conditions. The same analogy can be seen in elastic hysteresis observed in the stress–strain relationships of viscoelastic materials.
2.6. Data Analysis
VPTs were calculated from the arithmetic mean of three pairs of ascending and descending threshold values. In contrast, the arithmetic mean of three differences between ascending and descending threshold values was calculated and defined as the vibrotactile perception threshold width (VPTW):
where
is the
th ascending threshold at a test frequency of
, while
th descending threshold at a test frequency of
. The first peak–trough pair was excluded from the calculation of VPTs and VPTWs.
A temporary threshold shift (TTS) of a VPT at time t was calculated from the following equation:
where
t is the elapsed time after the cessation of exposure to HAV;
is a VPT value measured with a test frequency of
f prior to exposure to HAV, which corresponds to the baseline VPT peculiar to an individual subject; and
is a VPT value measured at time t for a test frequency of
f.
VPT recovery is modeled as a first-order system in this study [
19,
20]. The recovery of VPTs was evaluated by an exponential model [
21] given in the following equation:
where
is the temporal shift of VPT at time 0, and
is a time constant. Previously, several studies modeled TTS recovery changing linearly as a function of the logarithm of elapsed time [
15]. However, this modeling has a drawback in that the extrapolation of TTS recovery in the vicinity of time 0 results in infinity. The exponential model enables prediction of a TTS with a finite value in the vicinity of time 0.
2.7. Statistical Analysis
A univariate general linear model analysis of variance (ANOVA) for the experimental data was carried out to elucidate significant factors. All ANOVAs in this study were performed by using the statistical software SPSS (version 14.0). The results of the analysis were considered significant at a level of p < 0.05. Pursuant to the results of the ANOVA, multiple post hoc comparisons between VPTW data measured at different elapsed times were also carried out using Tukey’s method.
According to a preliminary ANOVA performed for the baseline TTSs, anthropometric data on subjects’ height, weight, and other parameters related to hand size did not significantly affect the baseline TTSs. Thus, these anthropometric terms were excluded from variables in the main ANOVA.
3. Results
Figure 4 shows the relationship between subjects’ age and steady-state VPTs measured at the tip of the right index finger at test frequencies of 125 Hz (
Figure 4a) and 31.5 Hz (
Figure 4b). In
Figure 4a,b, the 15th, 50th, and 85th percentile VPTs of healthy males, predicted as a function of age using data shown in annex A of ISO 13091-2 (2003) [
22], are shown by dotted, solid, and dashed lines, respectively. VPTs obtained at 125 Hz and at 31.5 Hz in G3 are distributed near the 50th percentile line. In contrast, VPTs at 125 Hz in G2 are distributed in a range up to the 50th percentile line. VPTs at 31.5 Hz in G1 belonged to the upper half of the percentile region.
The mean baseline VPTs preliminarily measured at the steady state prior to the HAV exposure experiment are summarized for each subject group in
Table 3. The main effects of age and exposure experience were observed at 125 Hz (
p < 0.05). The mean baseline VPT at 125 Hz in G1 was significantly larger than that at 125 Hz in G2 (
p < 0.05) and in G3 (
p < 0.05). The main effect of exposure experience was observed at 31.5 Hz (
p < 0.01). However no main effect of age was observed at 31.5 Hz (
p = 0.13). The mean baseline VPT at 31.5 Hz in G1 was significantly larger than that at 31.5 Hz in G2 (
p < 0.01) and in G3 (
p < 0.001). No significant difference in VPTs at 31.5 Hz was observed between G2 and G3 (
p = 0.20).
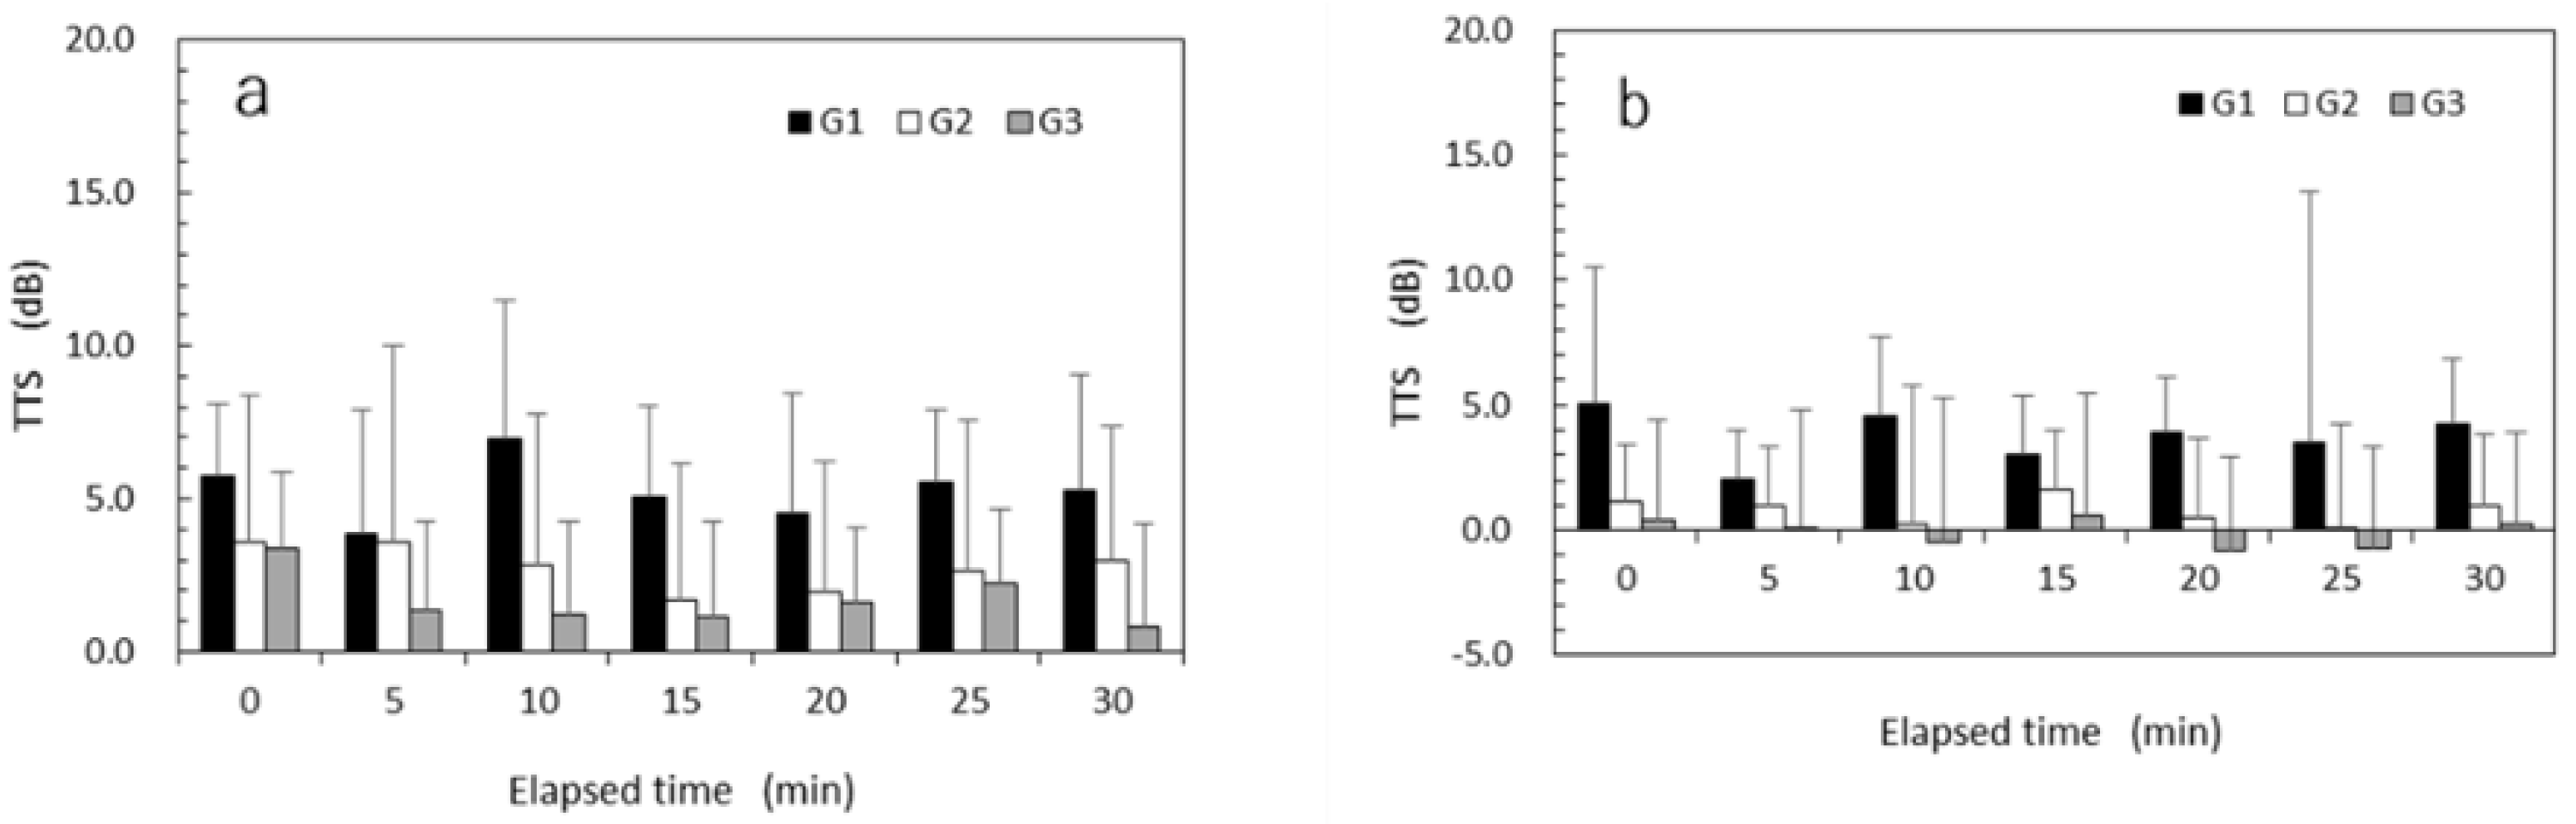
Figure 5a,b show the mean TTSs of vibrotactile perception measured every 5 min after exposure to high HAV at a VPT test frequency of 125 Hz and those after exposure to low HAV, respectively. TTS recovery was observed under both HAV exposure conditions in each group. TTSs of nearly zero were observed for the low-HAV condition in G3. The results of mixed-design ANOVAs performed for TTSs at 125 Hz are summarized in
Table 4. All of the main effects of vibrational intensity, exposure experience, time elapsed, and age were significant (
p < 0.05). Significant interaction effects were observed between vibrational intensity and age (
p < 0.05) and between vibrational intensity and exposure experience (
p < 0.05).
The mean TTSs of vibrotactile perception measured every 5 min after exposure to high HAV at a VPT test frequency of 31.5 Hz are shown in
Figure 6a, while those after exposure to low HAV are shown in
Figure 6b. TTS recovery after exposure to HAV was not observed in any of the subject groups. Regardless of the elapsed time, the mean TTSs for G2 and G3 were smaller than those for G1. Negative TTS values showing a lower TTS than the baseline were sometimes observed for the low-HAV condition in G3. The results of the mixed-design ANOVAs performed for TTSs at 31.5 Hz are summarized in
Table 5. The main effects of vibrational intensity, exposure experience, and age were significant (
p < 0.05). The main effect of time elapsed was not significant (
p = 0.39). No significant interaction effect was observed at a VPT test frequency of 31.5 Hz.
Table 6 summarizes sets of the time constant,
, and correlation coefficient (
r) calculated from regression analysis using Equation (3) on TTS recovery after exposure to high HAV for the three subject groups. A marked TTS recovery at 125 Hz was observed for each group (see
Figure 5). As a result, the correlation coefficients at 125 Hz for the three groups were relatively high, ranging from 0.78 to 0.88. In contrast, the TTS recovery at 31.5 Hz was not observed at first glance (see
Figure 6). Thus, the correlation coefficients for the three groups were far from 1.0.
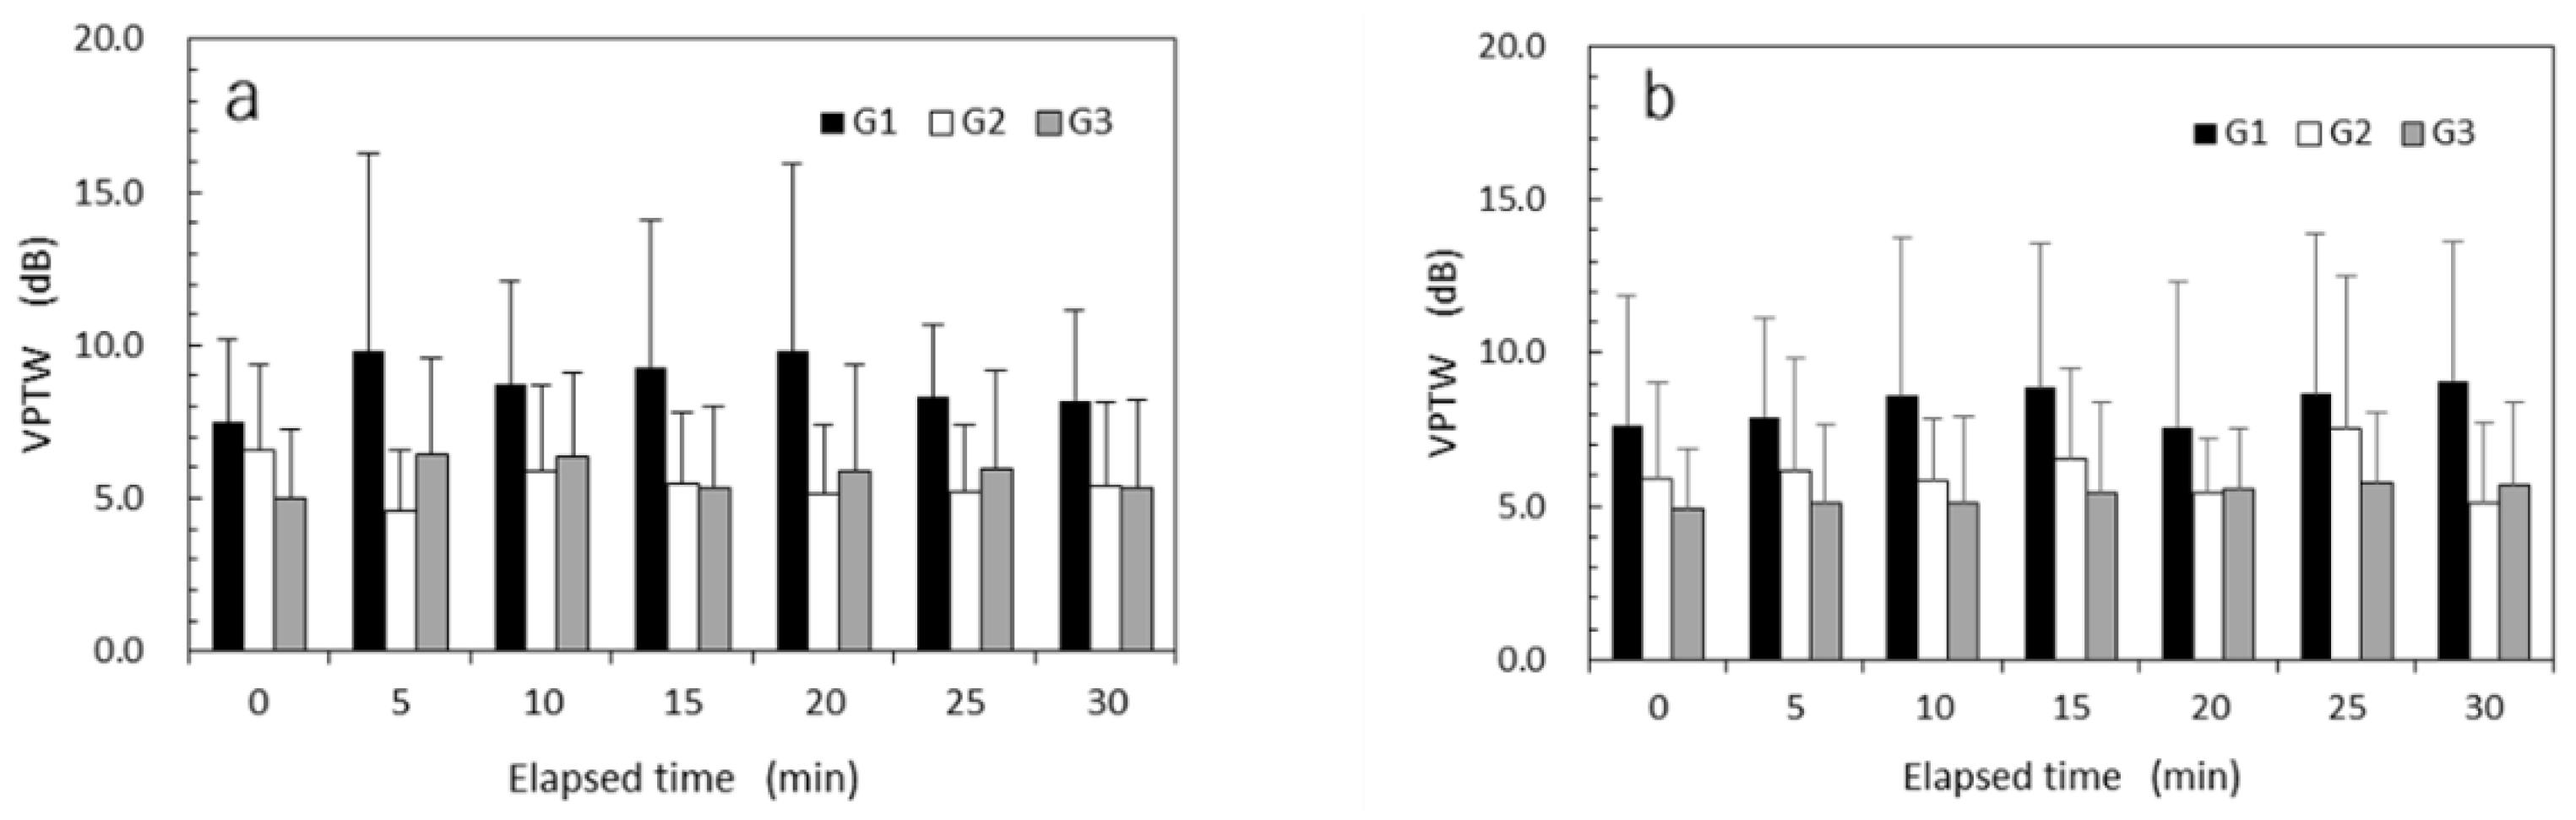
Mean VPTWs measured at every 5 minutes after exposure to high HAV at a VPT test frequency of 125 Hz are shown in
Figure 7a and those after exposure to low HAV in
Figure 7b. Mean VPTWs for G2 and G3 nearly unchanged over time after exposure to HAV. In contrast, mean VPTWs for G1 gradually increased over time after exposure to HAV. Mean VPTWs for G1 were always larger than those for G2 and G3.
Mixed-design ANOVAs were performed on the VPTWs using the variables age (young, old), exposure experience (exposed, non-exposed), vibrational intensity (high, low), and the repeated measure of elapsed time (every 5 min from just after exposure up to 30 min). According to the results of ANOVA performed for VPTWs at a test frequency of 125 Hz, as summarized in
Table 7, the main effect of exposure experience was significant (
p < 0.001). No significant main effect was observed for age (
p = 0.768) or time elapsed (
p = 0.073). In contrast, the main effect of vibrational intensity was nearly significant (
p = 0.059). A significant interaction effect was observed only between vibrational intensity and exposure experience (
p < 0.05).
The mean VPTWs measured every 5 min after exposure to high HAV at a VPT test frequency of 31.5 Hz are shown in
Figure 8a, while those measured after exposure to low HAV are shown in
Figure 8b. Regardless of the HAV exposure intensity, the mean VPTWs for G2 and G3 remained nearly unchanged over time after exposure to HAV. In contrast, the mean VPTWs for G1 fluctuated over time. The mean VPTWs for G1 were always larger than those for G2 and G3. According to the results of ANOVAs performed for VPTWs at a test frequency of 31.5 Hz, the main effect of exposure experience was significant (
p < 0.001). No significant main effect was observed for age (
p = 0.611), vibrational intensity (
p = 0.300), or time elapsed (
p = 0.793). No significant interaction effect was observed in any combination of factors.
4. Discussion
The results obtained in this study support the hypothesis that the VPTW is a kind of physical quantity that is independent of individual neurosensory characteristics at the fingertips. The VPTWs measured particularly for non-exposed subjects were almost invariant regardless of the time elapsed shortly after exposure to HAV, suggesting that VPTWs are free from acute effects of exposure to HAV (
Figure 6 and
Figure 7). Moreover, the VPTWs were not affected by age.
VPTWs can be a screening parameter that detects potential patients with only neurosensory components observed as early signs of HAVS. According to the results obtained in this study, the VPTWs of old subjects occupationally exposed to HAV were consistently larger than those of non-exposed old subjects, suggesting that VPTWs are affected by the long-term effects of exposure to HAV, e.g., occupational exposure by using handheld power tools. Moreover, the features of the VPTWs observed only for the exposed old subjects were such that the VPTWs at 125 Hz gradually increased with the increase in the time elapsed after exposure to HAV. A future study is needed to elucidate the reason(s) why the VPTWs at 125 Hz gradually increased with the increase in elapsed time. In any case, these two features observed for VPTWs in the old subjects who were occupationally exposed to HAV can help us in identifying potential patients with only neurosensory components as early symptoms of HAVS.
The baseline VPT measured at the fingertip is one of the screening parameters widely used to detect workers who have developed HAVS. However, the baseline VPT cannot be used to detect potential patients who only have neurosensory components of HAVS, known as an early symptom of HAVS. According to the results obtained in this study, the mean baseline VPTs of the three subject groups classified by the age and experience of occupational exposure to HAV tend to increase with increasing age and the amount of daily exposure to HAV. As shown in
Table 3, the main effects of age and exposure experience were observed for the mean baseline VPTs measured at 125 Hz (
p < 0.05). Moreover, the mean baseline VPT at 125 Hz in G1 (the old exposed group) was significantly larger than that at 125 Hz in G2 (the old non-exposed group) (
p < 0.05) and in G3 (the young non-exposed group) (
p < 0.05). However, the individual baseline VPTs were distributed in a wide range (see
Figure 4). This dispersion is affected by individual characteristics—such as neurosensory, physiological, and biomechanical characteristics, among others—which are also known to be influenced by environmental conditions represented by the finger skin temperature.
According to a preliminary ANOVA performed for the baseline VPTs for subjects in the three groups, anthropometric data on subjects’ height, weight, and other parameters related to hand size did not significantly affect the baseline VPTs. A previous study performed for workers occupationally exposed to organic solvents reported that height was positively associated with the baseline VPTs [
23]. In contrast, another previous study did not find a significant positive correlation between height and the baseline VPTs in a population exposed to lead [
24]. The inconsistency observed in the relationship between subjects’ height and baseline TTSs might be attributed to the difference in the average height of the subjects participating in these studies.
The TTS recovery at 125 Hz appears to follow a first-order model that can be characterized by a maximum amplitude of TTSm, a time constant τ, and a residual TTS at a certain elapsed time. In contrast, the correlation coefficients at 31.5 Hz were 0.51, 0.46, and 0.73 for G1, G2, and G3, respectively, showing low correlation coefficients compared to those at 125 Hz. TTSs and their recovery after exposure to HAV are influenced by the exposure amplitude and the test frequency. The results suggest that a set of parameters given in the prediction of a TTS recovery at 125 Hz after exposure to HAV are more useful than those at 31.5 Hz in evaluating the residual TTS after exposure to HAV. However, the recovery parameters obtained from a time-series change in TTSs varied significantly between the subjects and with their baseline VPTs. Thus, TTS recovery parameters at 125 Hz should be used in combination with an effective screening parameter for VPTWs to detect potential patients with only neurosensory components of HAVS.
A test frequency of 125 Hz is more suitable than 31.5 Hz for the measurement of vibrotactile perception at the fingertip. The frequency of vibration used in an HAV exposure task ranges from 10 Hz to 1.250 Hz, which covers the response range of FA II and FA I mechanoreceptors. Therefore, FA II and FA I mechanoreceptors embedded in the fingertip are inevitably affected by exposure to HAV, resulting in hypoesthesia and, hence, an increasing VPT at the fingertip. However, no TTS recovery was observed for VPTs measured at 31.5 Hz, while a TTS recovery was observed for VPTs at 125 Hz. This is probably related to the difference in the sensitivity of these two types of mechanoreceptors. A previous study reported that the most sensitive frequency in VPT measurements at the fingertip was 125 Hz [
25].
The limitation of predicting a TTS recovery using a curve-fitting technique with the first-order model is that the existence of negative values in TTS data causes poor agreement between predicted and measured TTSs, resulting in a rather low correlation coefficient. This is because the prediction model given in Equation (3) in this study is defined only in the positive domain of the response variable. The TTS of a vibrotactile perception observed after exposure to low HAV has been reported to be small and sometimes shows a negative value because of measurement errors and variation in a subject’s response.


