Article

Performance Evaluation of Cable Shaft Fireproof Sealing System in High-Rise Buildings: A Comparative Test Method

1
School of Electrical Engineering and Automation, Fuzhou University, Fuzhou 350108, China
2
Zhangzhou Power Supply Company, State Grid Fujian Electric Power Co., Ltd., Zhangzhou 363000, China
3
Shiyan Power Supply Company, State Grid Hubei Electric Power Co., Ltd., Shiyan 442012, China
*
Author to whom correspondence should be addressed.
Fire 2024, 7(3), 102; https://doi.org/10.3390/fire7030102
Submission received: 9 January 2024 / Revised: 25 February 2024 / Accepted: 14 March 2024 / Published: 21 March 2024
(This article belongs to the Special Issue Advances in Fire Prevention and Control for Power Grids)

Abstract

:
The effectiveness of fireproof sealing systems in preventing the spread of fire in high-rise building cable shafts relies on the properties of various sealing materials and the construction process. Therefore, a comprehensive evaluation is necessary. The authors of this paper propose a comparative test method based on an entity test platform for a performance evaluation of cable shaft fireproof sealing systems in high-rise buildings. The test platform measures changes in temperature, humidity, and smoke mass during fire tests to compare the performance of four sets of fireproof sealing systems in terms of thermal insulation, smoke sealing capacity, and overall integrity. In addition, a fire dynamics simulation (FDS) of fireproof sealing systems was carried out on the entity test platform, and the sealing failure process in the case of cracking in the fireproof sealing system was revealed. The simulation results for the temperature trends in the lower space align with the fire test results. Furthermore, as the gap size increases, the diffusion of smoke and flame accelerates. Consequently, the performance of cable shaft fireproof sealing systems depends not only on the sealing material but also on the construction process.

1. Introduction

With the development of a social economy, high-rise buildings and super high-rise buildings are increasing day by day, which inevitably increases the potential risk and danger of fire while effectively improving the land utilization rate [1,2]. In the construction of high-rise buildings, many pipes pass through the walls or floors of the building and leave holes or gaps, which provide favorable conditions for fire to spread. For example, the ‘chimney effect’ of the cable shaft will cause the rapid spread of fire and smoke, increasing the harm caused by fire and the difficulty of extinguishing fire [3,4]. A fireproof sealing system is an important way to block the spread of cable fire. The sealing principle is to use fireproof materials and cooperate with the corresponding construction technology to seal the holes left by the cables after passing through the floors [5]. Therefore, it is necessary to carry out a performance evaluation of the fireproof sealing system to verify its ability to block the spread of fire in the cable shaft of high-rise buildings.
Currently, various institutions at home and abroad have established standards regarding fireproof sealing materials, fireproof sealing measures, and fireproof sealing tests [6,7,8,9,10,11,12,13,14,15]. However, the performance of fireproof sealing systems is influenced by multiple complex factors. Evaluating the performance of a single fireproof sealing product alone does not provide a comprehensive assessment; an effective approach must be tailored to specific projects and conditions. In high-rise buildings, the cable shaft is often segmented into separate spaces via layer-by-layer or interlayer sealing to prevent the rapid spread of fire. Consequently, the initial stage of fire in many cable shafts involves combustion in confined spaces. There have been experimental and simulation studies on cable fire in confined spaces conducted to date:
  • Experimental studies on a cable fire in a confined space were conducted. Huang et al. [16] established a 1:1 real-scale test model of the utility tunnel. The internal temperature distribution during the fire process was measured, which indicated that the error between the predicted and test results was within 37%. Huang et al. [17,18] carried out a fire test inside the vertical cable bridge in both an open and closed space, revealed the temperature distribution law and trends in the process of cable combustion, and predicted the ceiling jet temperature. Martinka et al. [19] revealed the influence of cable spacing and the heat conductivity of cable support materials on the fire characteristics, and evaluated the fire risk based on the amount of heat, toxicity, and combustion products released by combustion. Li et al. [20] carried out a fire test inside the vertical cable bridge under three typical cable spacings, and the change process of the mass loss rate and flame length during a cable fire was recorded. The results showed that the cable spacing aggravated the cable combustion and accelerated the spread of fire. Gallo et al. [21] proposed a practical module for the cone calorimeter and evaluated the fire performance of multiple vertically mounted cables based on key properties such as peak heat release rate, fire growth rate, and flame spread. Meinier et al. [22] studied the fire behavior of two halogen-free, flame-retardant cables used in nuclear power plants using a cone calorimeter, focusing on the effects of external heat flux and cable spacing on cable fire spread. Magalie et al. [23] changed the cable parameters (sheath thickness and insulation quality) and test conditions (heat flux, cable number, and spacing), and used a cone calorimeter to test the fireproof performance of small halogen-free communication cables. Zavaleta et al. [24,25] carried out a fire test inside a cable bridge under open, closed, and ventilated conditions. The results showed that the heat release rate and mass loss rate of fire under closed and ventilated conditions were lower compared with those in an open space.
  • Simulation studies on a cable fire in a confined space were conducted. Li [26], Ma [27], and Bari et al. [28] established a fire dynamics simulation (FDS) model of the utility tunnel, and the smoke spread and heat transfer during the fire were discussed. Zhang et al. [29] explored the optimal closing time for the fireproof door and the extinguishing time of the fire by combining numerical simulation with a reduced-size test, which provided a relevant basis for extinguishing a cable fire in an underground utility tunnel. Plumecocq et al. [30] established a semi-empirical model of horizontal cable tray fires in a well-enclosed and mechanically ventilated enclosed environment. Liu et al. [31] established the FDS model according to the size of a real cable trench, and two fire environments, including smoldering and flaming combustion, were set up. The sensitivity, toxic gas mass concentration, and fire alarm sequence of different fire detectors have been discussed and analyzed. Kunsch [32] proposed a model to predict the smoke flow in tunnel fires, in which the fire is not only related to the heat release rate but also to the longitudinal wind speed of the tunnel. Matala et al. [33] studied cable tunnel fires via numerical simulation, focusing on the spread of fire along the power cable and the role of extinguishing fires via water in preventing cable faults. Roh et al. [34] studied the influence of ventilation rate on the fire heat release rate in tunnels using a 1/20 reduced-scale tunnel test platform. The results show that an increase in ventilation rate will promote an increase in the fire heat release rate. Blanchard et al. [35] used the numerical simulation method to study the heat loss process in a tunnel under the fire source power of 4 MW. Zeng et al. [36] discussed the feasibility of simulation in a large, confined space based on FDS software (version 2019) and studied the temperature rise and heat release rate.
In summary, most of the existing research on cable fires in a confined space has problems, such as the simple construction process of a fireproof sealing system, the few types of sealing material, and an insufficient recording of the data parameters. In addition, when evaluating the performance of a fireproof sealing system, only a single fireproof sealing product has usually been considered, rather than the whole sealing system.
To fill the above gaps, the authors of this paper first built an entity test platform with a comparative function to evaluate the performance of the whole cable shaft fireproof sealing system. Secondly, by comparing the thermal insulation, smoke sealing capacity, and integrity of the fireproof sealing system, the comprehensive performance of four sets of fireproof sealing systems, using different sealing materials and construction processes, was ranked. Finally, the FDS model of a cable shaft fireproof sealing system in a high-rise building with the same size as the entity test platform was established to reveal the sealing failure process in the case of cracking in a fireproof sealing system.

2. Materials and Methods

2.1. Entity Test Platform for a Performance Evaluation of a Cable Shaft Fireproof Sealing System in High-Rise Buildings

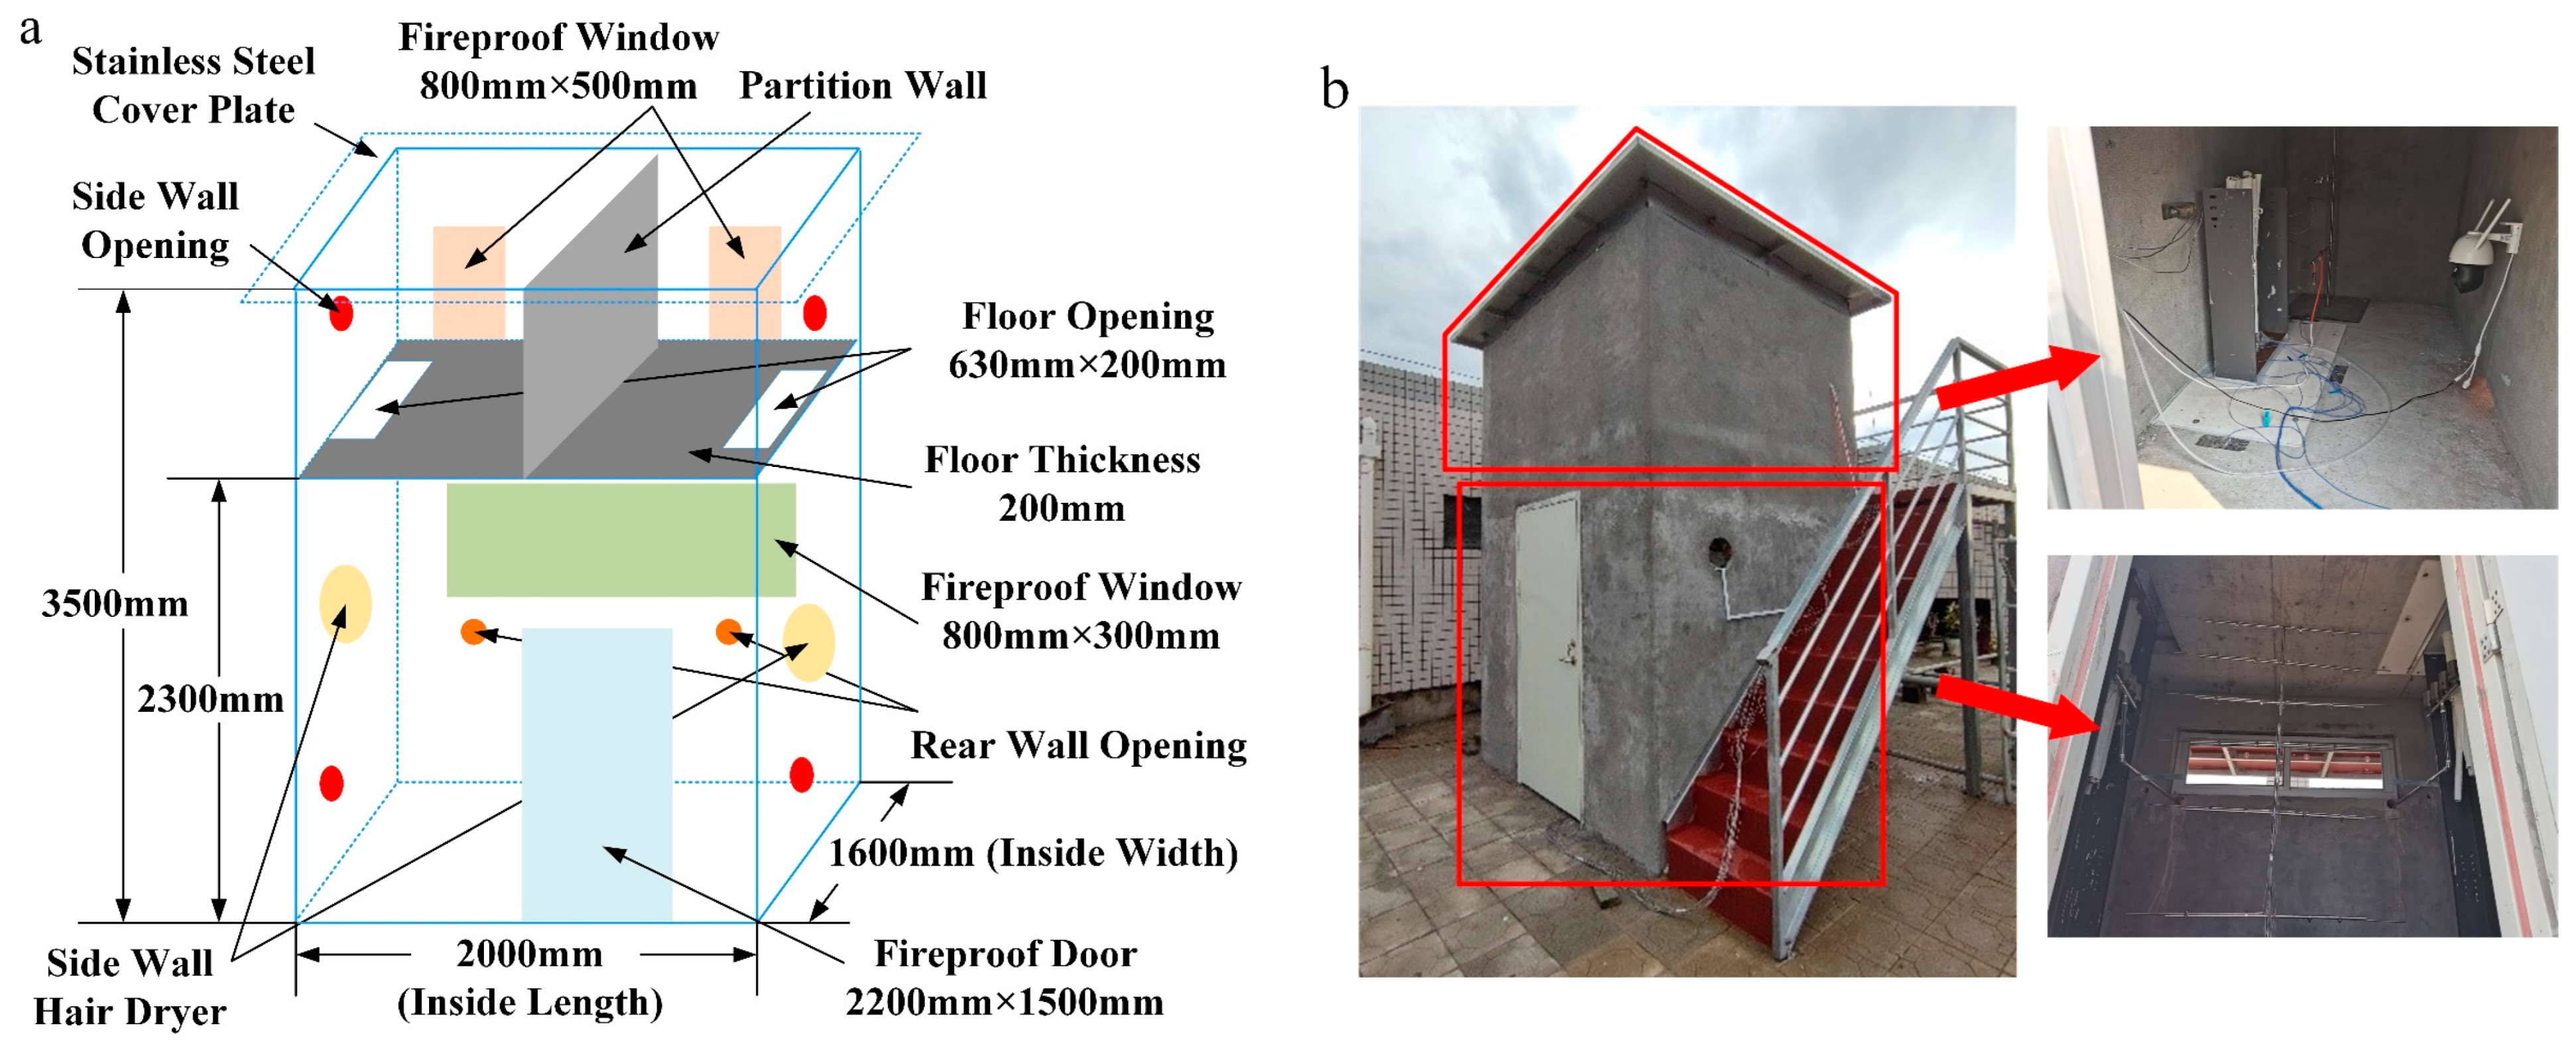
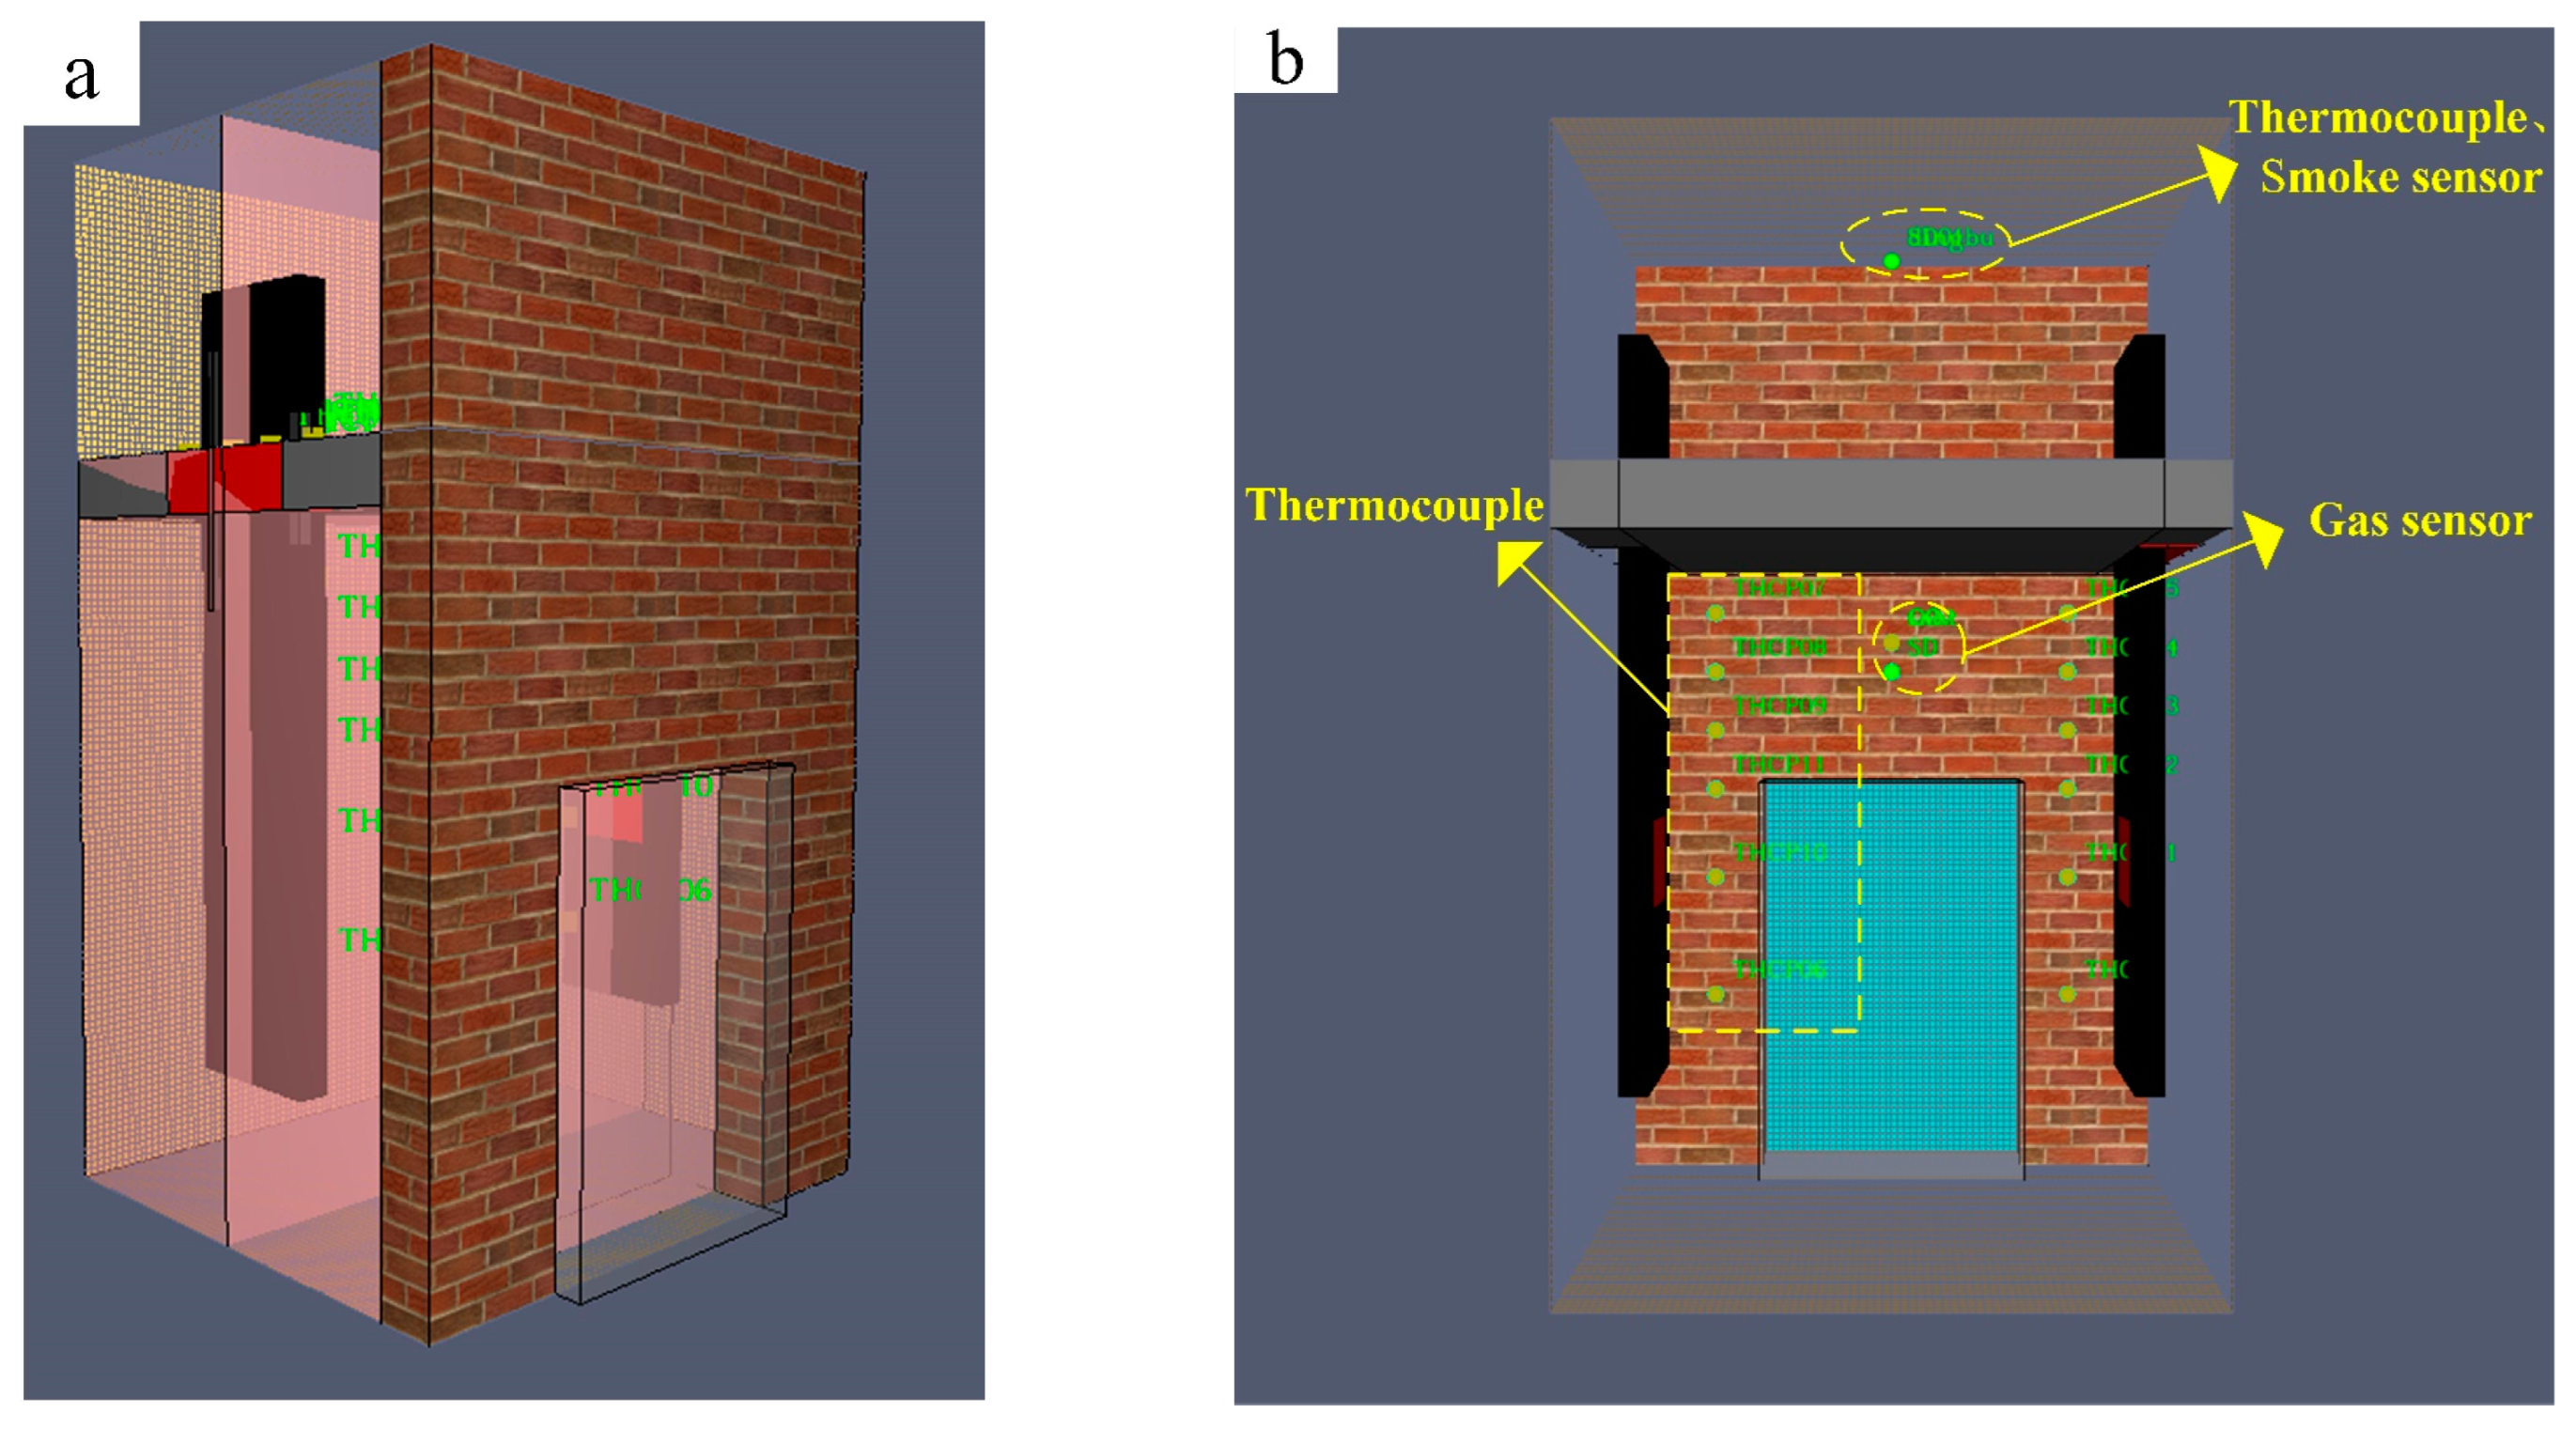
2.1.1. Platform Structure

The size of the entity test platform for a performance evaluation of a cable shaft fireproof sealing system in high-rise buildings was 2000 mm (length) × 1600 mm (width) × 3500 mm (height). The main structure was made of fireproof bricks, and the floor was a reinforced concrete structure. The entity test platform was divided into two layers. The lower space was equipped with a fireproof door of 2200 mm × 1500 mm for the access of test personnel. For the convenience of observation, an observation window made of double-layer refractory glass with a size of 800 mm × 300 mm was installed on the rear wall. Hairdryers were installed on the left and right side of the wall to provide oxygen for cable combustion and discharge exhaust gas. The wall was equipped with holes of different sizes to allow for sensor wires and gas spray lamps. There were holes of 630 mm × 200 mm on both sides of the floor to provide access to cables, cable bridges and fireproof sealing construction. The thickness of the partition wall was 200 mm. The partition wall was used to divide the upper space into two independent spaces, and observation windows made of double-layer refractory glass with a size of 800 mm × 500 mm were installed. The top of the upper space was covered with a stainless steel plate, and the main structure of the remaining surrounding walls was still made of fireproof bricks, so that the upper space was independent of the external environment. The schematic diagram and pictures of the entity test platform are shown in Figure 1.
The entity test platform was divided into upper and lower layers, as shown in Figure 1a, and the local internal space is shown in Figure 1b. The lower space was used to arrange cables, the thermocouple tree and liquefied petroleum gas (LPG) spray lamps. The cable was fixed on the cable bridge; the LPG spray lamp was connected to the LPG cylinder through a pipeline and fixed in the middle of the cable bridge. The upper space was used to arrange thermocouples, temperature–humidity sensors, smoke sensors and cameras. The surface-mounted device’s (SMD’s) thermocouple was arranged on the unexposed surface of the fireproof sealing system to monitor the temperature of the unexposed surface during the fire test. A set of temperature–humidity sensors were arranged in both independent spaces to monitor the temperature and humidity changes in the upper space. It is worth noting that the heat in the upper space will be lost through the non-insulating materials around it. To make the measured temperature data more accurate, the measurement points of the thermocouple and the temperature–humidity sensor should be close to the bottom of the upper space. The smoke was transported to the detection system through the hose to monitor the change in smoke concentration during the fire test. The camera was installed on the side wall to observe the state of the unexposed surface of the fireproof sealing system.
Pictures of the entity test platform before and after fireproof sealing are shown in Figure 2. As can be seen from Figure 2a, there was a large gap between the cable, the cable bridge, and the floor before fireproof sealing. In this case, any fire that occurred in the cable shaft could easily spread quickly. The original gap was sealed with fireproof materials to form the state shown in Figure 2b, which can effectively block the spread of fire in cable shaft.

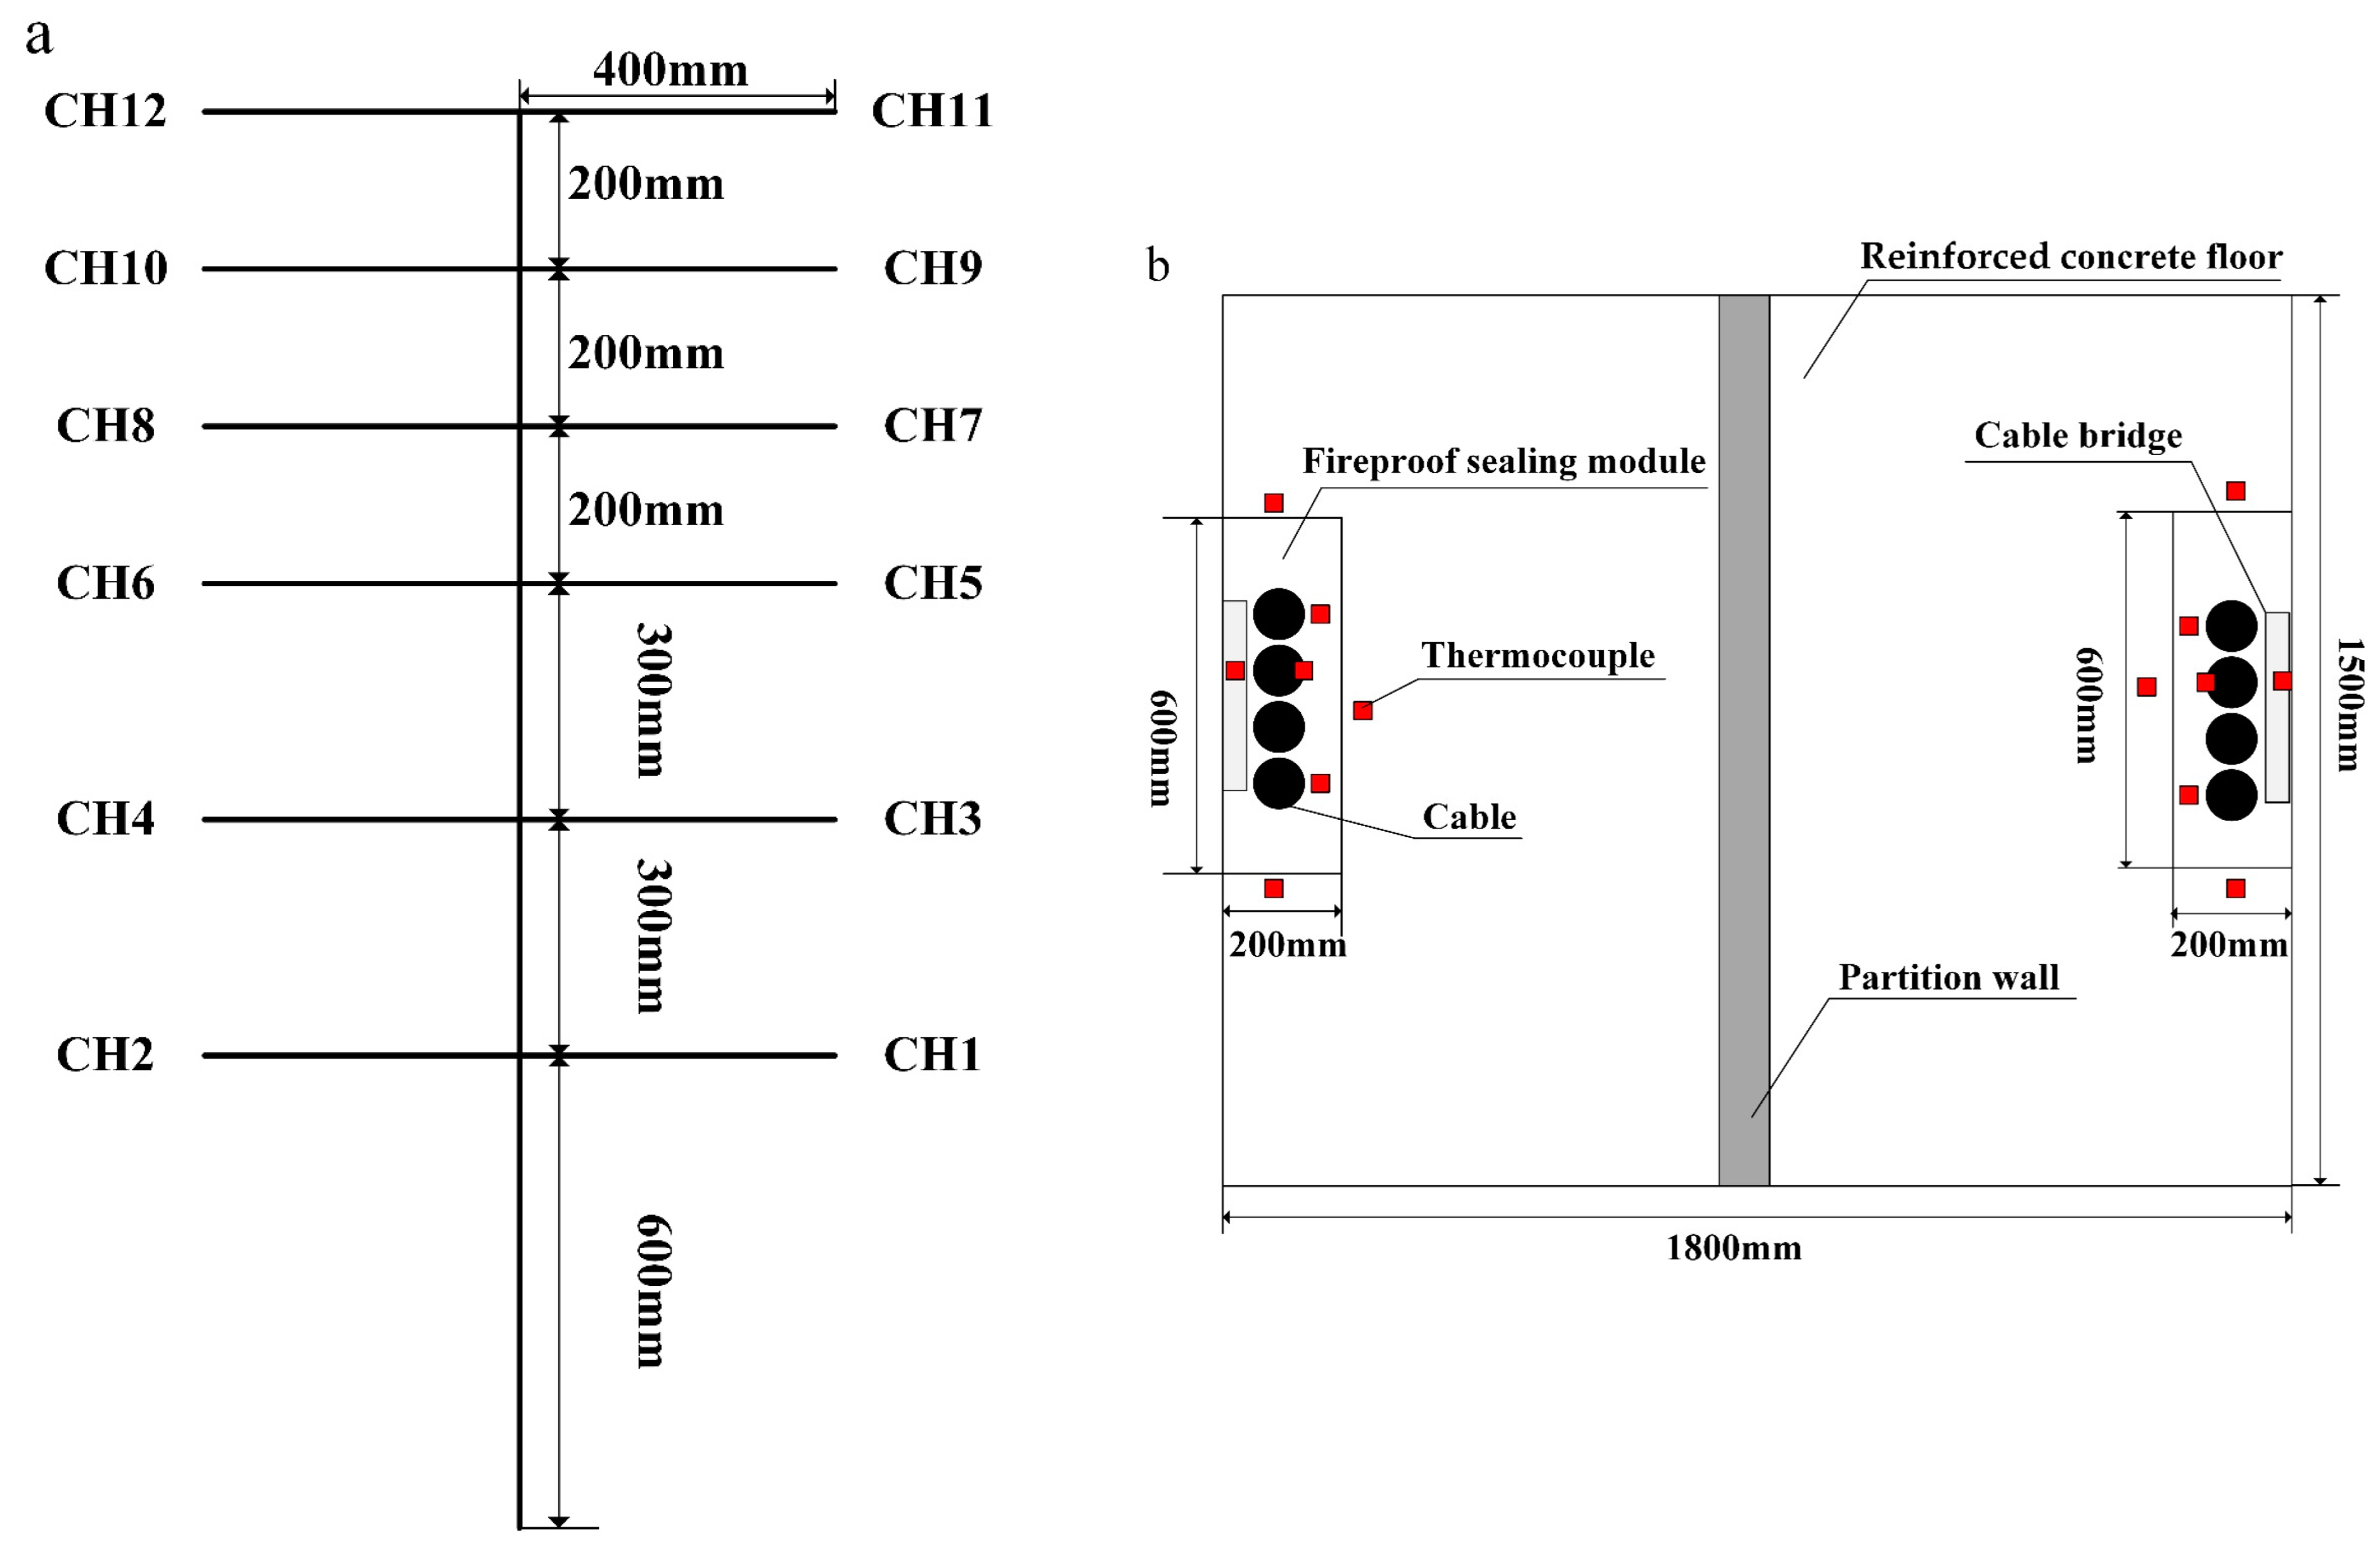
2.1.2. Measurement System

In this study, thermocouples, smoke sensors, and temperature–humidity sensors were used to record the changes in temperature, humidity, and smoke concentration during the fire test.
1.
Thermocouple
A total of 26 thermocouples were arranged, of which 12 thermocouples were K-type WRNK-191 (Shanghai Automation Instrumentation Co., Ltd., Shanghai, China) armored needle thermocouples, fixed on the thermocouple tree with stainless steel throat hoops. The thermocouple tree was placed in the lower space of the entity test platform, and the specific layout is shown in Figure 3a. The other 14 thermocouples were SMD Pt100 (Shenzhen Haodu Technology Group Co., Ltd., Shenzhen, China) thermocouples, pasted on the unexposed surface of the fireproof sealing system with aluminum foil paper. The specific distribution points are shown in Figure 3b. The thermocouple measurement data were recorded and stored by a 32-channel temperature patrol instrument.
The SMD thermocouple used the same layout scheme on the left and right sides of the fireproof sealing system. The layout rules are as follows: two thermocouples are arranged on the unexposed surface of the fireproof sealing module, 25 mm from the cable surface; a thermocouple is arranged on the surface of the cable, 25 mm from the unexposed surface of the fireproof sealing module (for the convenience of arrangement, the cable with the thickest wire diameter is selected); a thermocouple is arranged on the surface of the cable bridge, 25 mm from the unexposed surface of the fireproof sealing module; three thermocouples are arranged on the unexposed surface of the reinforced concrete floor frame, 25 mm from the edge of the fireproof sealing module.
2.
Smoke Sensor
The smoke sensor used in this study was JK-2000-M6 (Jinan Renzhi Measurement and Control Technology Co., Ltd., Jinan, China). In the fire test, the smoke sensor was used to monitor the change in smoke concentration in the upper two independent spaces. The smoke sensor has a range of 0~30 mg/m3 and a resolution of 0.01 mg/m3.
3.
Temperature–Humidity Sensor
The temperature–humidity sensor selected in this study was RS-WS-WIFI-6J (Jinan Renzhi Measurement and Control Technology Co., Ltd., Jinan, China), and a total of three temperature–humidity sensors were arranged in the fire test: one was used to monitor the temperature and humidity in the environment, and the other two were used to monitor the temperature and humidity changes in the upper two independent spaces.

2.1.3. Fire Source Design

The test used an LPG spray lamp as the fire source. The spray lamp was set in the middle of the cable, at a 45° angle from the cable. The cables on both sides contained an LPG spray lamp. Through the pressure-reducing valve, the outlet pressure of the LPG was controlled to 0.5 MPa to ensure that the flame sizes of the spray lamps on the left and right sides of the entity test platform were consistent. Using the various sensors arranged in Section 2.1.2, the changes in temperature, humidity, and smoke concentration that occurred during the fire test were measured.
In the fire test, LPG was used as fuel. The low calorific value of LPG is about 87.8~108.7 MJ/m3 or 45.1~45.9 MJ/kg. One bottle of LPG is 15 kg; the test time was 160 min; two bottles were used during the test. Therefore, the average power was 125.28~127.5 kW [37].

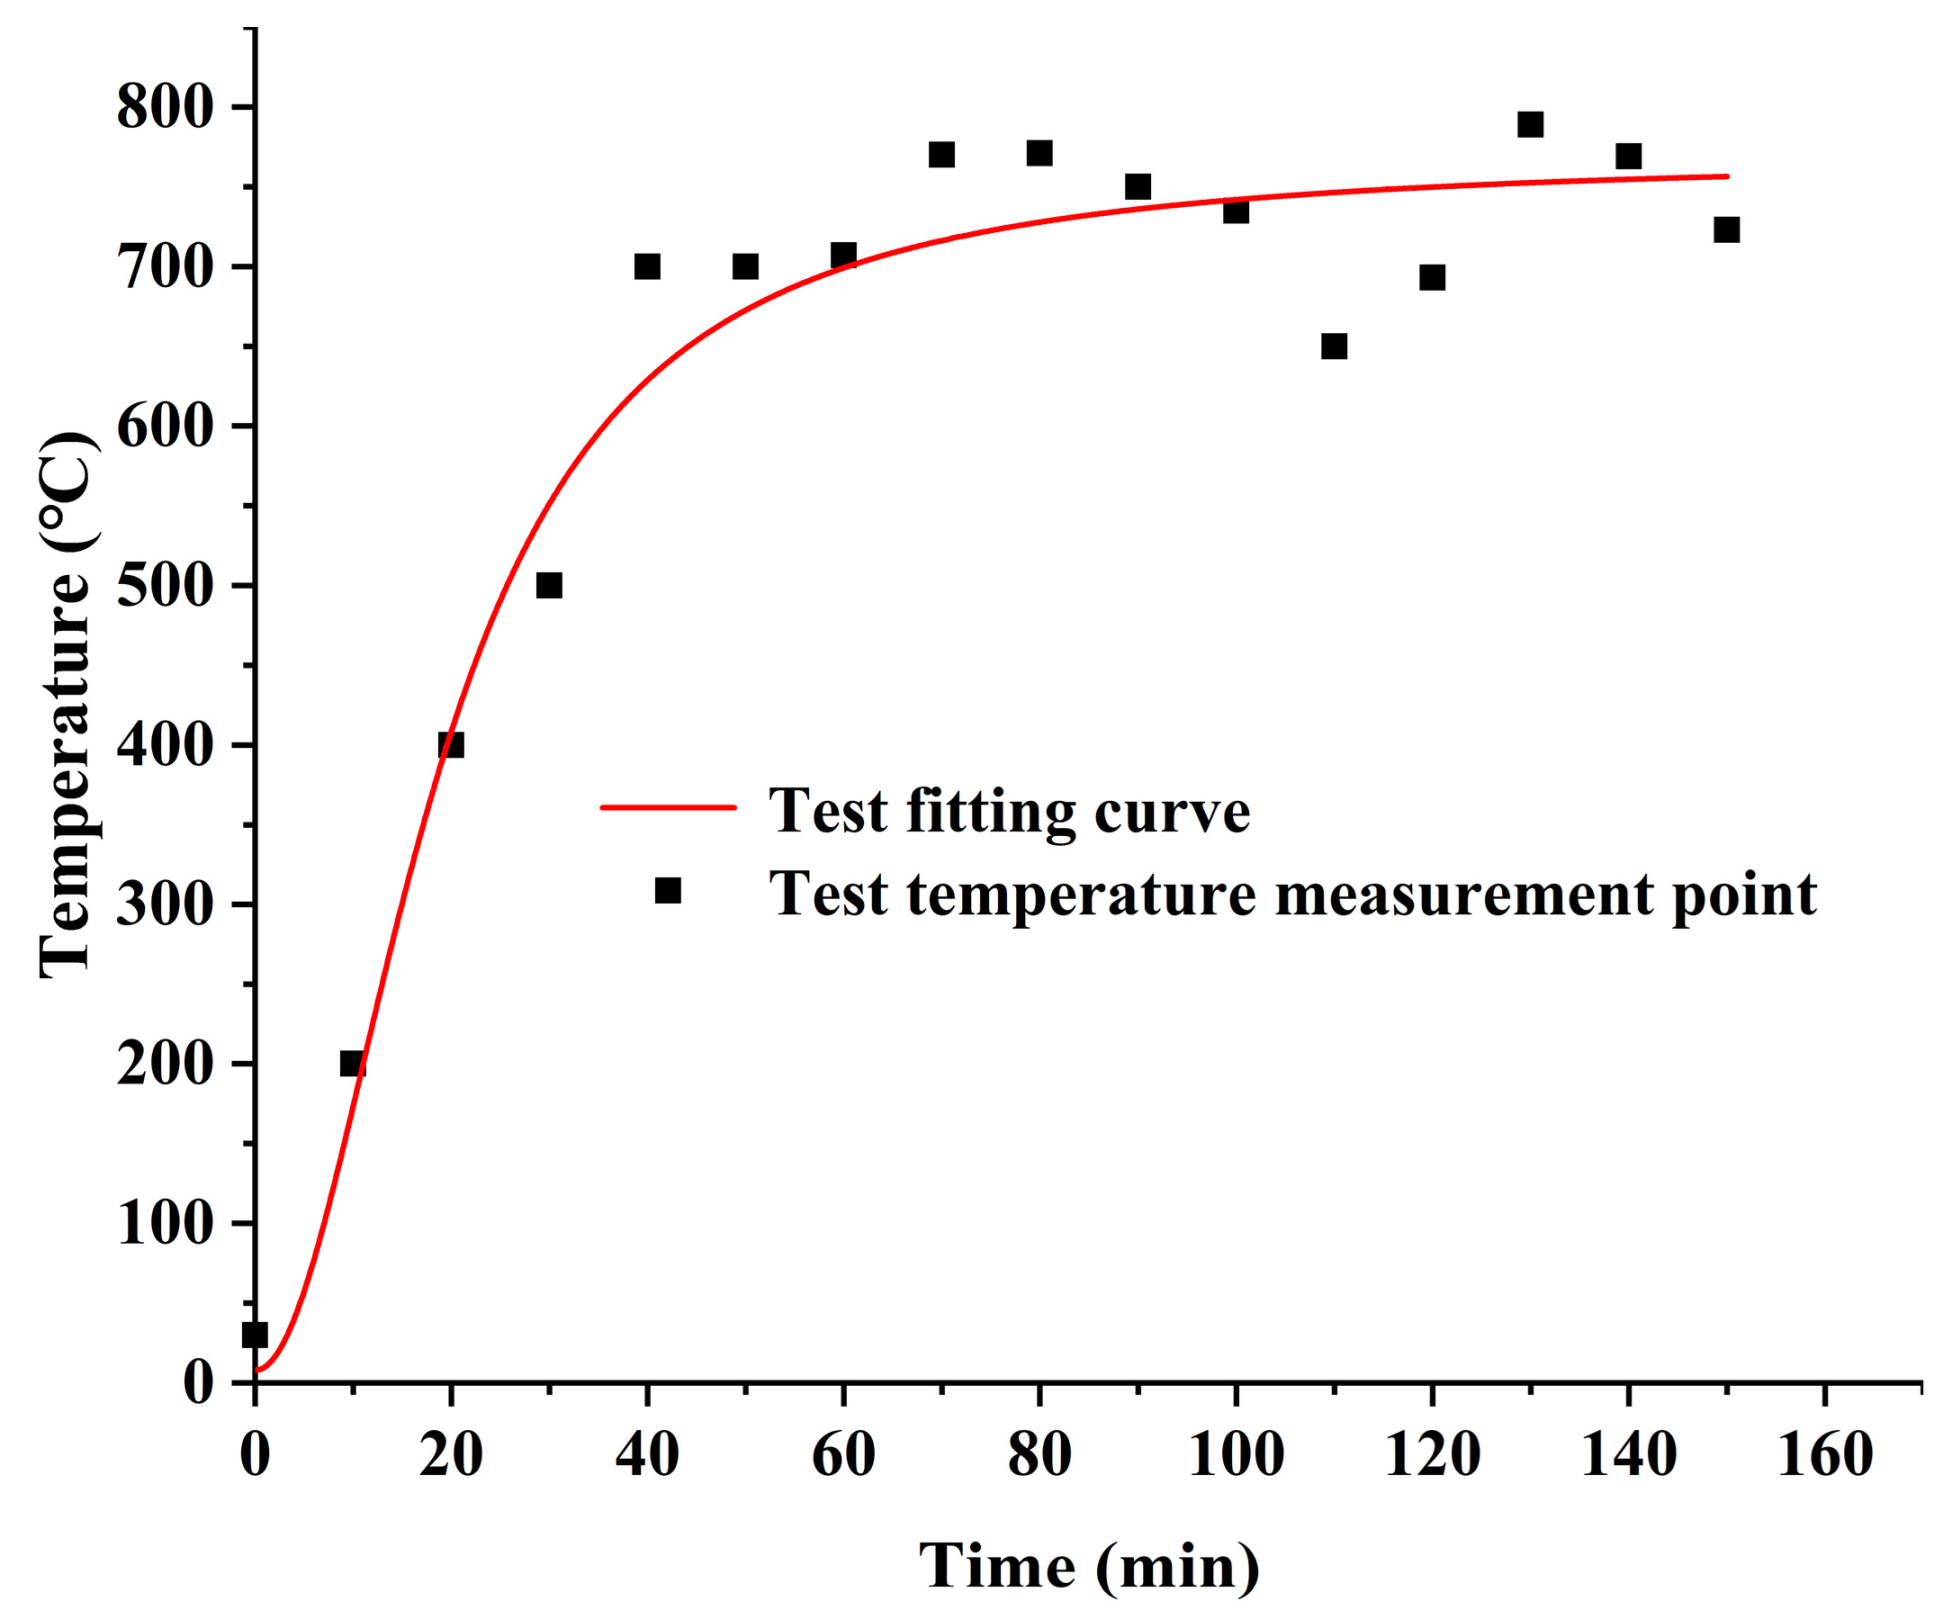
2.1.4. Heating Curve

The fire combustion process is recorded in Figure 4. Figure 4a is the non-fire stage; therefore, no flame and smoke can be observed. Figure 4b depicts 5 min after the start of the fire test. As can be seen, the smoke was aggravated, the temperature obviously increased, and the flame gradually began to spread to the upper layer of the platform via the cable. Figure 4c shows at 60 min after the start of the fire test. The smoke color is black and strong, the flame is in a flashover state, and the cable wiring is also burnt.
The purpose of the actual fireproof sealing system that was tested for a cable shaft penetration opening in high-rise buildings is to effectively detect the material properties, construction processes and overall performance. However, the existing standards only focus on the characteristics of a single fireproof sealing product, and theories regarding the overall performance detection of the fireproof sealing system, formed by the fireproof sealing material and construction process, are lacking.
In addition, according to GB/T 23864-2009 [7], a fire resistance test of the fireproof sealing system should be carried out in the test furnace. The test furnace has strict requirements for specimen installation, heating conditions, pressure conditions, temperature testing, and experimental observations. However, the overall volume of the actual cable shaft fireproof sealing system is too large for it to be placed in the test furnace, so it is necessary to redesign the fire resistance test to control the costs.
Due to the limitations of the test conditions, the authors of this paper finally decided to simulate the real combustion of a cable shaft in high-rise buildings using the entity test platform by controlling the LPG spray lamp according to the standard heating curve in GB/T 9978.1-2008 [8]. The flame temperature was measured using an infrared thermometer. The data points and the fitted heating curve are shown in Figure 5, and the analytical expression of the fitted heating curve is shown in Equation (1). The adjusted coefficient of determination (Adj. R-Square) is an important index to evaluate the fitting results, and its value range is [0, 1]. The larger the value, the better the fitting effect. In this study, after the establishment and comparison of multiple fitted heating curves, the four-parameter logistic curve with the best fitting effect was finally selected, and the value of Adj. R-Square is 0.96.
T = 768.4077 760.41715 1 + ( s 18.9265 ) 1.99634
where T is the flame temperature; s is the fire test time. Figure 5 shows that the temperature rise is high in the initial stage of the test but gradually slows down as the fire test continues and finally tends toward stability. The temperature after stabilization is maintained at about 800 °C. Compared with the standard heating curve, the trend in temperature rise is similar, but the initial temperature rise rate and the maximum temperature are a bit smaller. There are three possible reasons for this: first, the combustion of LPG requires a large amount of oxygen, and a large amount of cold air needs to be transported from the outside world, resulting in a lower temperature; second, the power of the LPG spray lamp is insufficient; third, both the fireproof door and the hole are not well sealed to the wall, and heat is naturally lost to the outside.

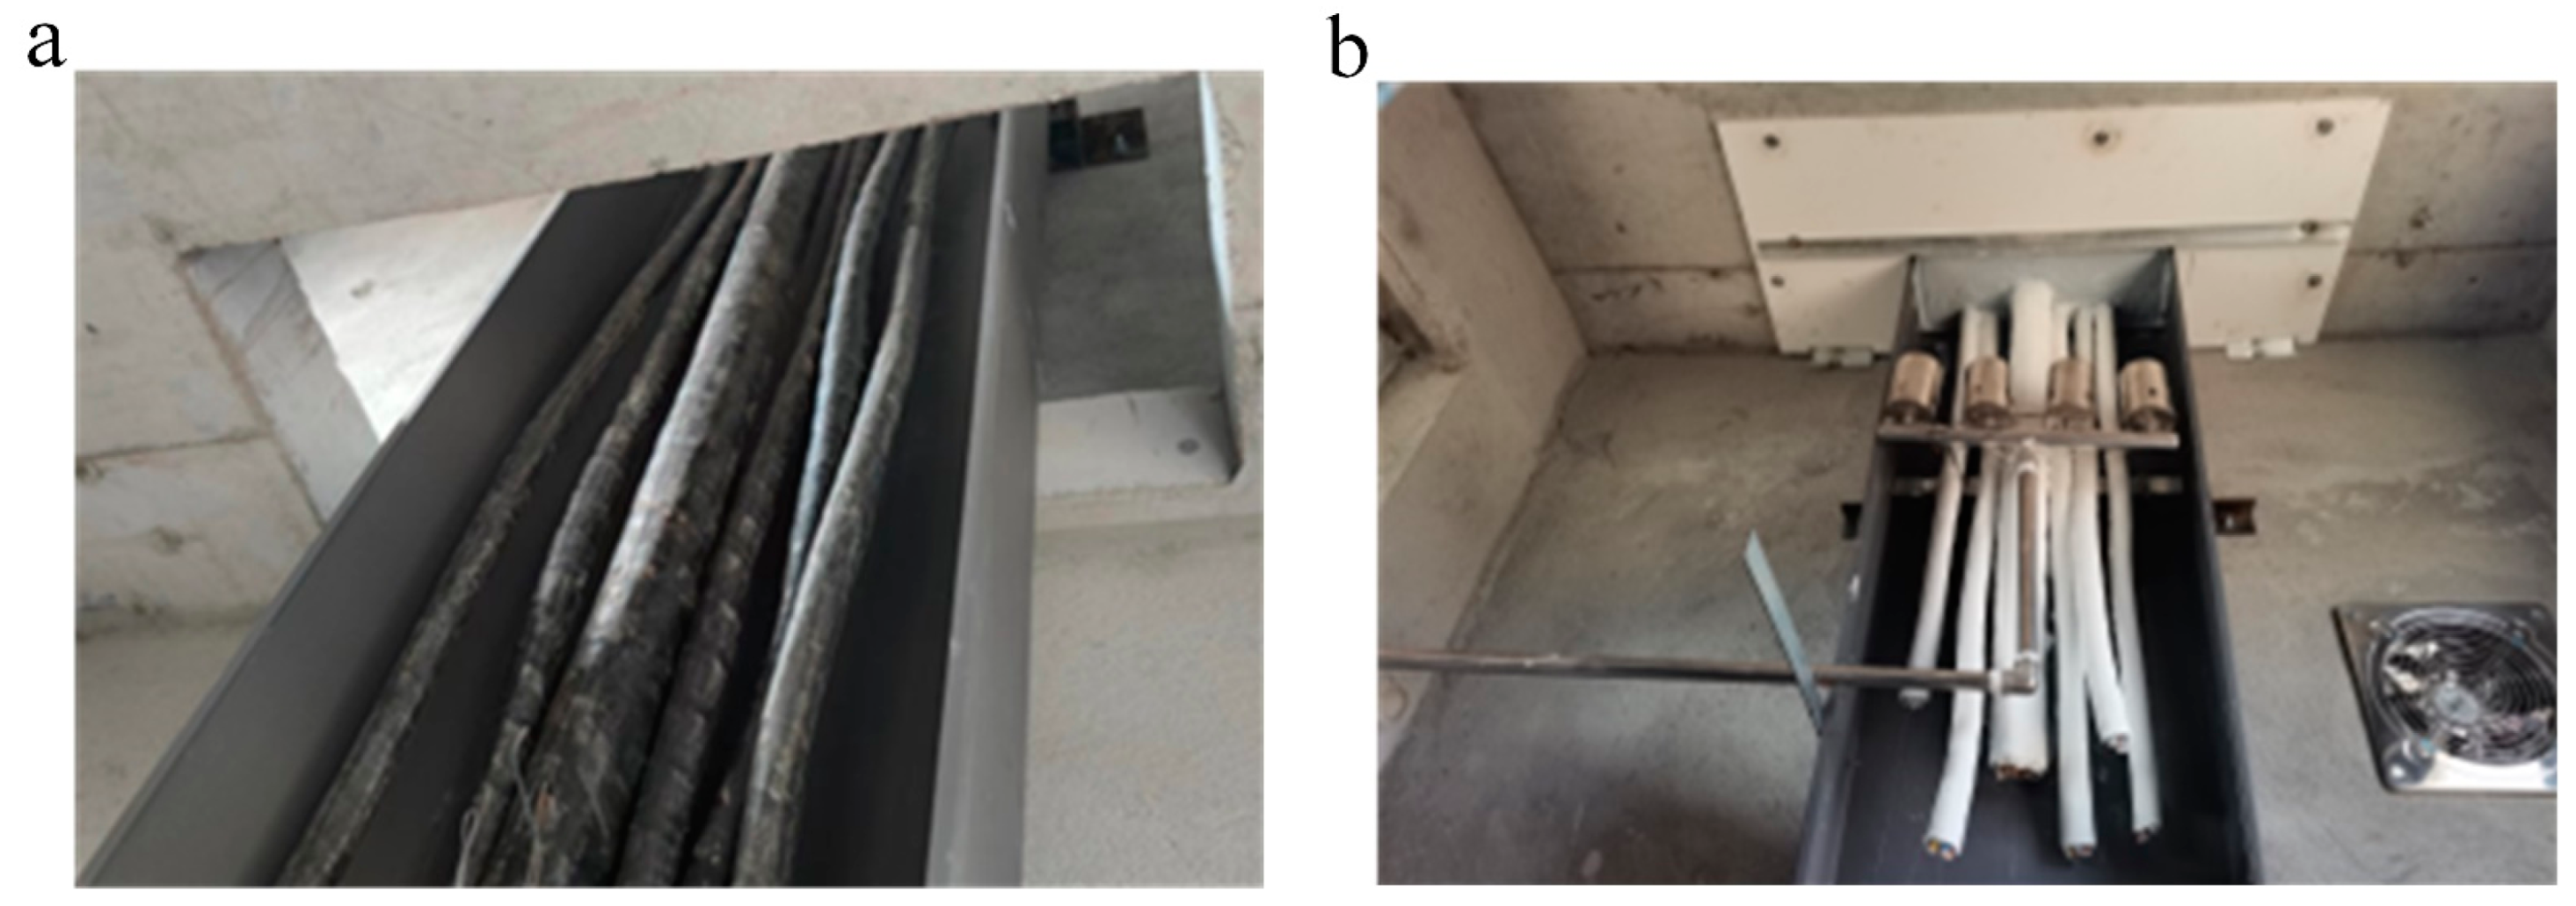
2.1.5. Fireproof Sealing System Design

As the test platform can be used to compare the performance of two sets of fireproof sealing systems, only two tests are required. The differences in the four fireproof sealing systems are reflected in both the sealing material and construction process, which are listed in Table 1. There are two kinds of construction processes, marked as I and II, respectively, which are elaborated as follows:
Construction process I: (1) cut the fireproof board according to the outline of the cable bundle and the size of the hole that is to be blocked; (2) establish the cable position and bind each cable with a fireproof tape; (3) plug non-solidified fireproof mud or solidified fireproof mud into all gaps; (4) brush the fireproof coating on both sides of the cable through the hole.
Construction process II: (1) the amount of fireproof board is calculated according to the sealing size, before the cable hole is cut and opened, and the cable well is covered after splicing; (2) the fireproof board surface is then stacked with a 120 mm thick fireproof packet and spread until level with the floor, which is then covered with a layer of fireproof board; (3) the gap between the fireproof board and the wall is sealed and smoothed with a flexible organic sealing material, and the surface is coated with an elastic fireproof sealant; (4) the gap between the cable bridge and the cable is sealed with flexible organic sealing material, and the surface is sealed with evenly applied intumescent fireproof sealant; (5) after the sealant is cured, a fireproof coating is applied to the cable on the upper and lower sides of the sealing layer.
Fireproof sealing systems A, C, and D adopt construction process I, and fireproof sealing system B adopts construction process II.

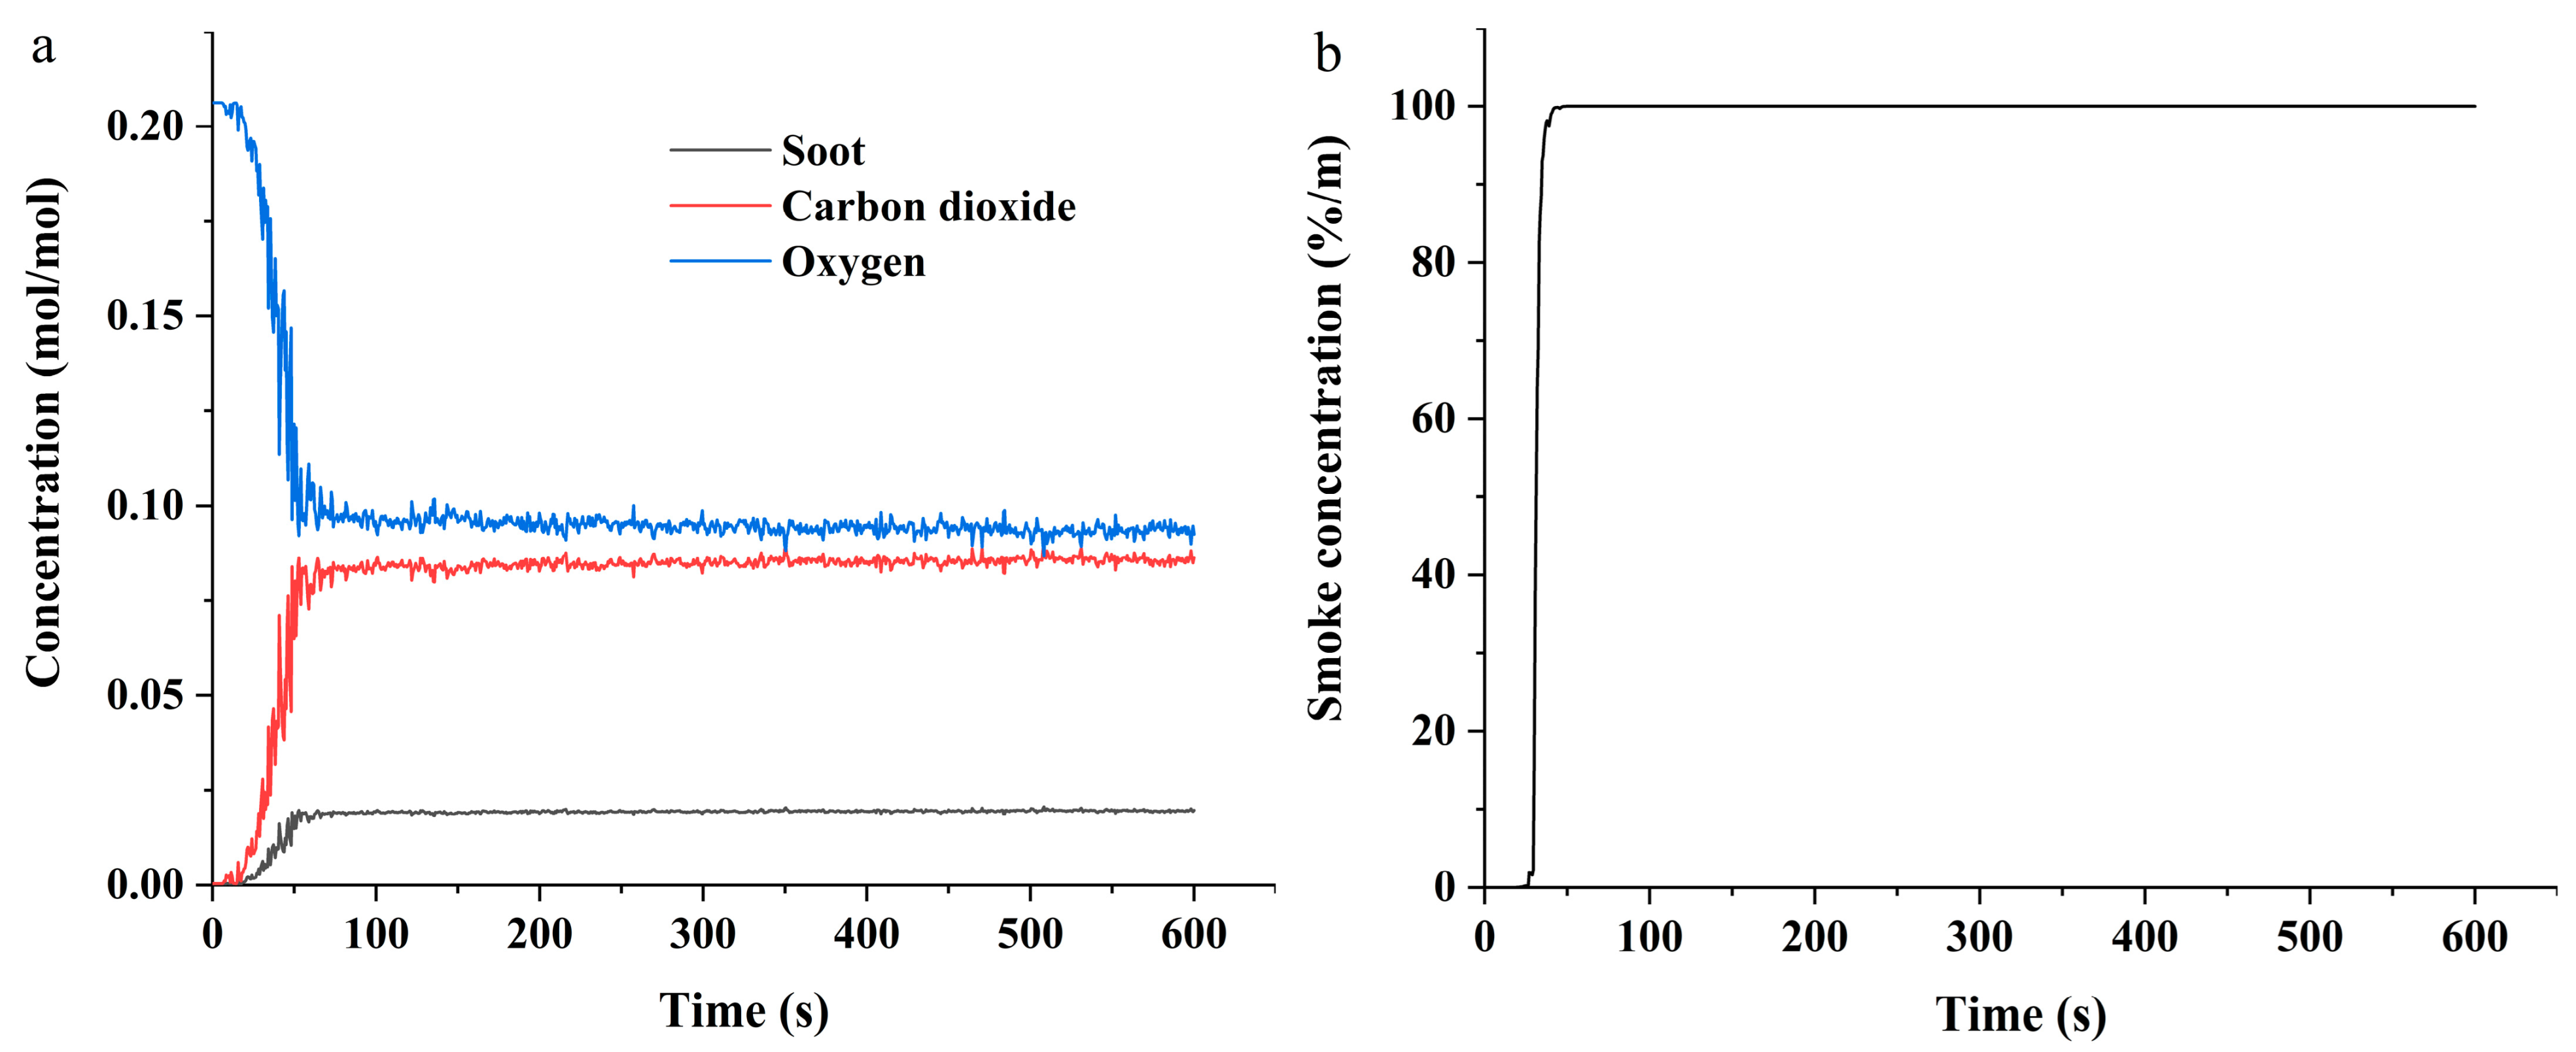
2.2. FDS of Cable Shaft Fireproof Sealing System in High-Rise Buildings

2.2.1. Theoretical Basis

The inside of the cable shaft is a relatively closed space, so the cable shaft fire was due to the combustion in the confined space. The main fuel, mass and heat exchanges occur during the combustion process of the cable sheath in the cable shaft. The main processes of heat exchange include heat conduction, convection, and radiation.
1.
Heat conduction
Warzoha et al. [38] proposed that when two objects come into contact, the heat will transfer from the high-temperature object to the low-temperature object. This process is called heat conduction. The heat conduction is most obvious on the solid medium and can be expressed by Equation (2) in the temperature field.
ρ h = ω S = k T z
where ρh is the heat flux density, which represents the heat transfer per unit area in unit time; S is the cross-sectional area of the cable; ω is the heat flow on area S; k is the thermal conductivity; T z is the temperature gradient along the z direction.
2.
Heat convection
Sheremet et al. [39], Wang et al. [40], and Mannix et al. [41] pointed out that heat convection is generated under the interaction of heat conduction and medium transport motion. During the development of the fire, natural convection and forced convection occur alternately, and the region of occurrence is generally between the wall and the hot air. The convective heat flux equation is as follows:
Q = l ( T g T w ) A w
where Q is the convective heat flux; l is the convective heat transfer coefficient; Tg is the gas temperature; Tw is the wall surface temperature; Aw is the contact area.
3.
Heat radiation
Ilyas et al. [42], Narayana et al. [43], and Abbas et al. [44] clarified that the radiation is electromagnetic radiation. When a high-temperature object is in fluid, the energy in the object can be released to the outside world in the form of electromagnetic radiation. The energy radiated by an object per unit area in unit time is radiation energy, which can be expressed as follows:
E = ε σ T h 4
where E is the radiant heat flux; ε is the emissivity; Th is the thermal temperature of the object surface: σ = 5.667 × 10⁻⁸ W/m2K4.
4.
FDS governing equations
Shao [45] pointed out that a series of Navier–Stokes equations in fluid dynamics are suitable for a low-speed and heat-driven fluid flow; therefore, the Large Eddy Simulation (LES) model can be used to deal with the flame and gas flow in a closed space. The governing equations are as follows:
Mass conservation equation:
ρ t + ( ρ u ) = 0
u = ( u , v , w )
Momentum conservation equation:
t ( ρ u ) + ( ρ u u ) + ρ = ρ g + τ
Component conservation equation:
t ( ρ Y i ) + ( ρ Y i u ) = ( ρ D i Y i ) + m i
Energy conservation equation:
t ( ρ h ) + ( ρ h u ) = d p d t + q q + Φ
where ρ is the component density; u is the velocity vector; t is the simulation time; p is the pressure; g is the gravity acceleration vector; τ is the viscous stress tensor; Yi is the mass fraction of component i; Di is the diffusion coefficient of component i; mi‴ is the generation rate or dissipation rate of component i per unit volume; h is the specific enthalpy; q‴ is the volumetric heat source; q is the radiation heat flux vector; Φ is the dissipation function.

2.2.2. Modeling Method

The model is constructed using the PyroSim software (version 2019). The size of the model is the same as that of the entity test platform, which is 2000 mm (length) × 1600 mm (width) × 3500 mm (height), as shown in Figure 6a. The correct mesh size is crucial for enhancing the accuracy of the simulation results of a cable shaft in an FDS. According to the characteristics of the fire source, the criterion of appropriate mesh size can be obtained using the criterion outlined in Equation (10).
D * = ( Q f ρ c T g ) 2 / 5
where D* is the characteristic diameter of the fire source, Qf is the heat release rate of fire, ρ is the ambient density, cp is the specific heat of air, T is the ambient temperature, and g is the acceleration of gravity. It was recommended that the appropriate mesh size should be in the range from D*/16 to D*/4 [46]. In this study, the mesh size was set as 25 mm × 25 mm × 25 mm, and the total number of meshes was 860,400. This is an effective guarantee of the accuracy of the simulation results. To reduce the amount of calculation that is required, the simulation model can be simplified as follows:
  • The structure of the power cable is relatively complex, including the outer sheath, insulation filling material, inner sheath, semiconductor shielding layer, and conductor layer from the outside to the inside. In a cable shaft fire, the actual combustion component is the sheath layer, and the simulation software cannot construct the arc-type model structure. Therefore, the cable is simplified as a long, strip, thin plate composed of only the sheath layer.
  • The actual entity test platform is more complex. During the construction of the simulation model, the cable bridge, observation window, fireproof door, and other components that have little influence on the simulation results are ignored.
  • In the fire test, an LPG spray lamp is used as the fire source. In the simulation, a burner with a fixed heat release rate, fixed on the cable surface, is used as the equivalent fire source.
1.
Material Parameter Setting
In the simulation, materials such as fireproof mud, concrete, fireproof brick, polyvinyl chloride, an epoxy resin board, and a magnesium oxide board were mainly used. The main material parameters included the density, specific heat capacity and thermal conductivity, as shown in Table 2.
2.
Sensor Setting
To detect the changes in various parameters inside the cable shaft during the fire process, several thermocouples and various gas sensors were set up in the simulation. The arrangement of the thermocouples in the lower space of cable shaft is the same as that in Figure 3a. The gas sensors (oxygen sensor, soot sensor, smoke sensor, carbon dioxide sensor) were arranged in coordinates of (1.0, 0.8, 1.9). Due to the limitation of the simulation software, a temperature change was not obtained in the unexposed surface of the fireproof sealing system, and the arrangement coordinates of the thermocouple and smoke sensor in the upper space of the cable shaft were (1.0, 0.8, 3.3). All sensor arrangements are shown in Figure 6b.
3.
Fire Source Setting
The fire source was placed on the surface of the long strip cable via a gas phase reaction. The chemical reaction product was polyurethane, and the fuel only contained C, O, H, and N. Section 2.1.3 shows that the average power of the LGP, used as fuel in the fire test, was 125.28 kW~127.5 kW. Therefore, the fire power was set to 125 kW in the simulation, and the corresponding heat release rate was 1388.89 kW/m2.
4.
Boundary conditions
In the simulation model, the initial temperature was set as 30 °C, the initial pressure was 101.33 kPa, and the relative humidity of air was 40%. The mass fraction of oxygen and carbon dioxide was 23.24% and 0.06%, respectively. In addition, the external surface of the fireproof door in the model was set as an open boundary condition; that is, the fireproof door was regarded as open to the atmosphere, the fluid from the inside of the model was able to flow out of the boundary, and the ambient air was also able to flow in. The remaining external surfaces in the model were all set as closed boundary conditions.

3. Results and Discussion

3.1. Performance Comparative Test of Cable Shaft Fireproof Sealing Systems in High-Rise Buildings

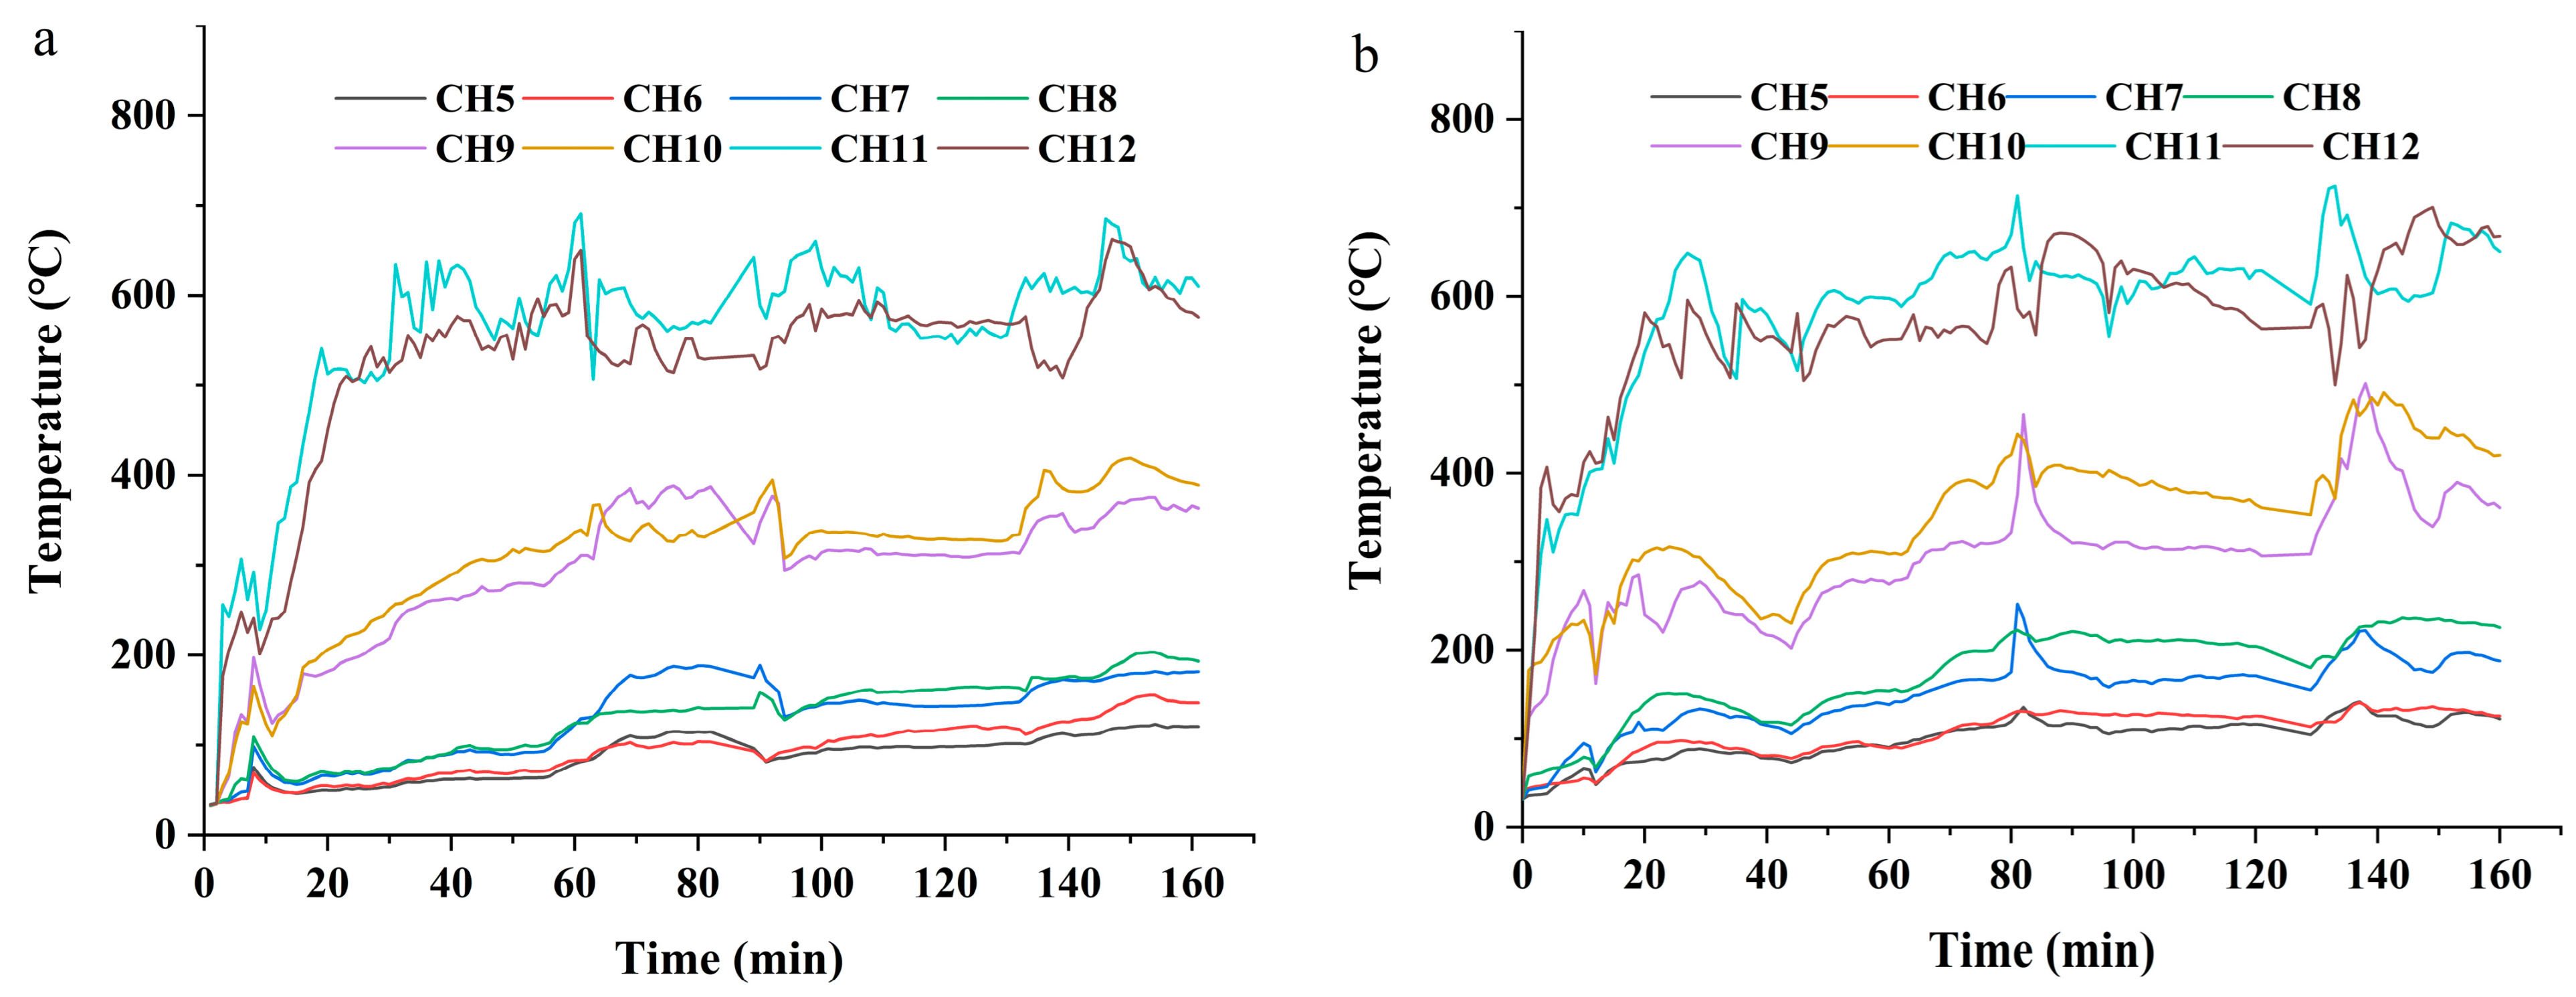
3.1.1. The Temperature Change in the Lower Space of the Entity Test Platform

The reinforced concrete floor divided the entity test platform into upper and lower layers. The thermocouple tree was placed in the lower space, and its plane was perpendicular to the plane where the cable was located. The K-type thermocouple temperature measurement point was 200 mm from the cable, which was used to measure the temperature change in the surrounding space when the cable was burned. In this test, a total of 12 K-type thermocouples were arranged and fixed on the thermocouple tree with stainless steel throat hoops. The thermocouples CH1–CH4 were arranged in the lower layer, as shown in Figure 3a; however, the fire source was in the middle of the cable. Therefore, the temperature change was not obvious, which is not shown in the temperature trend diagram.
The temperature trends of eight measurement points in the lower space of the entity test platform are shown in Figure 7. As can be seen, the temperatures measured by CH5 to CH12 first rapidly increased and then tended to be stable. In addition, the temperatures measured by the two thermocouples located on the same horizontal plane were basically the same. This shows that the rising temperature trends of the two tests of fireproof sealing systems conducted in the same test are essentially the same, which verifies the feasibility of using the pressure-reducing valve to control the flow rate of the LPG spray lamp on both sides.

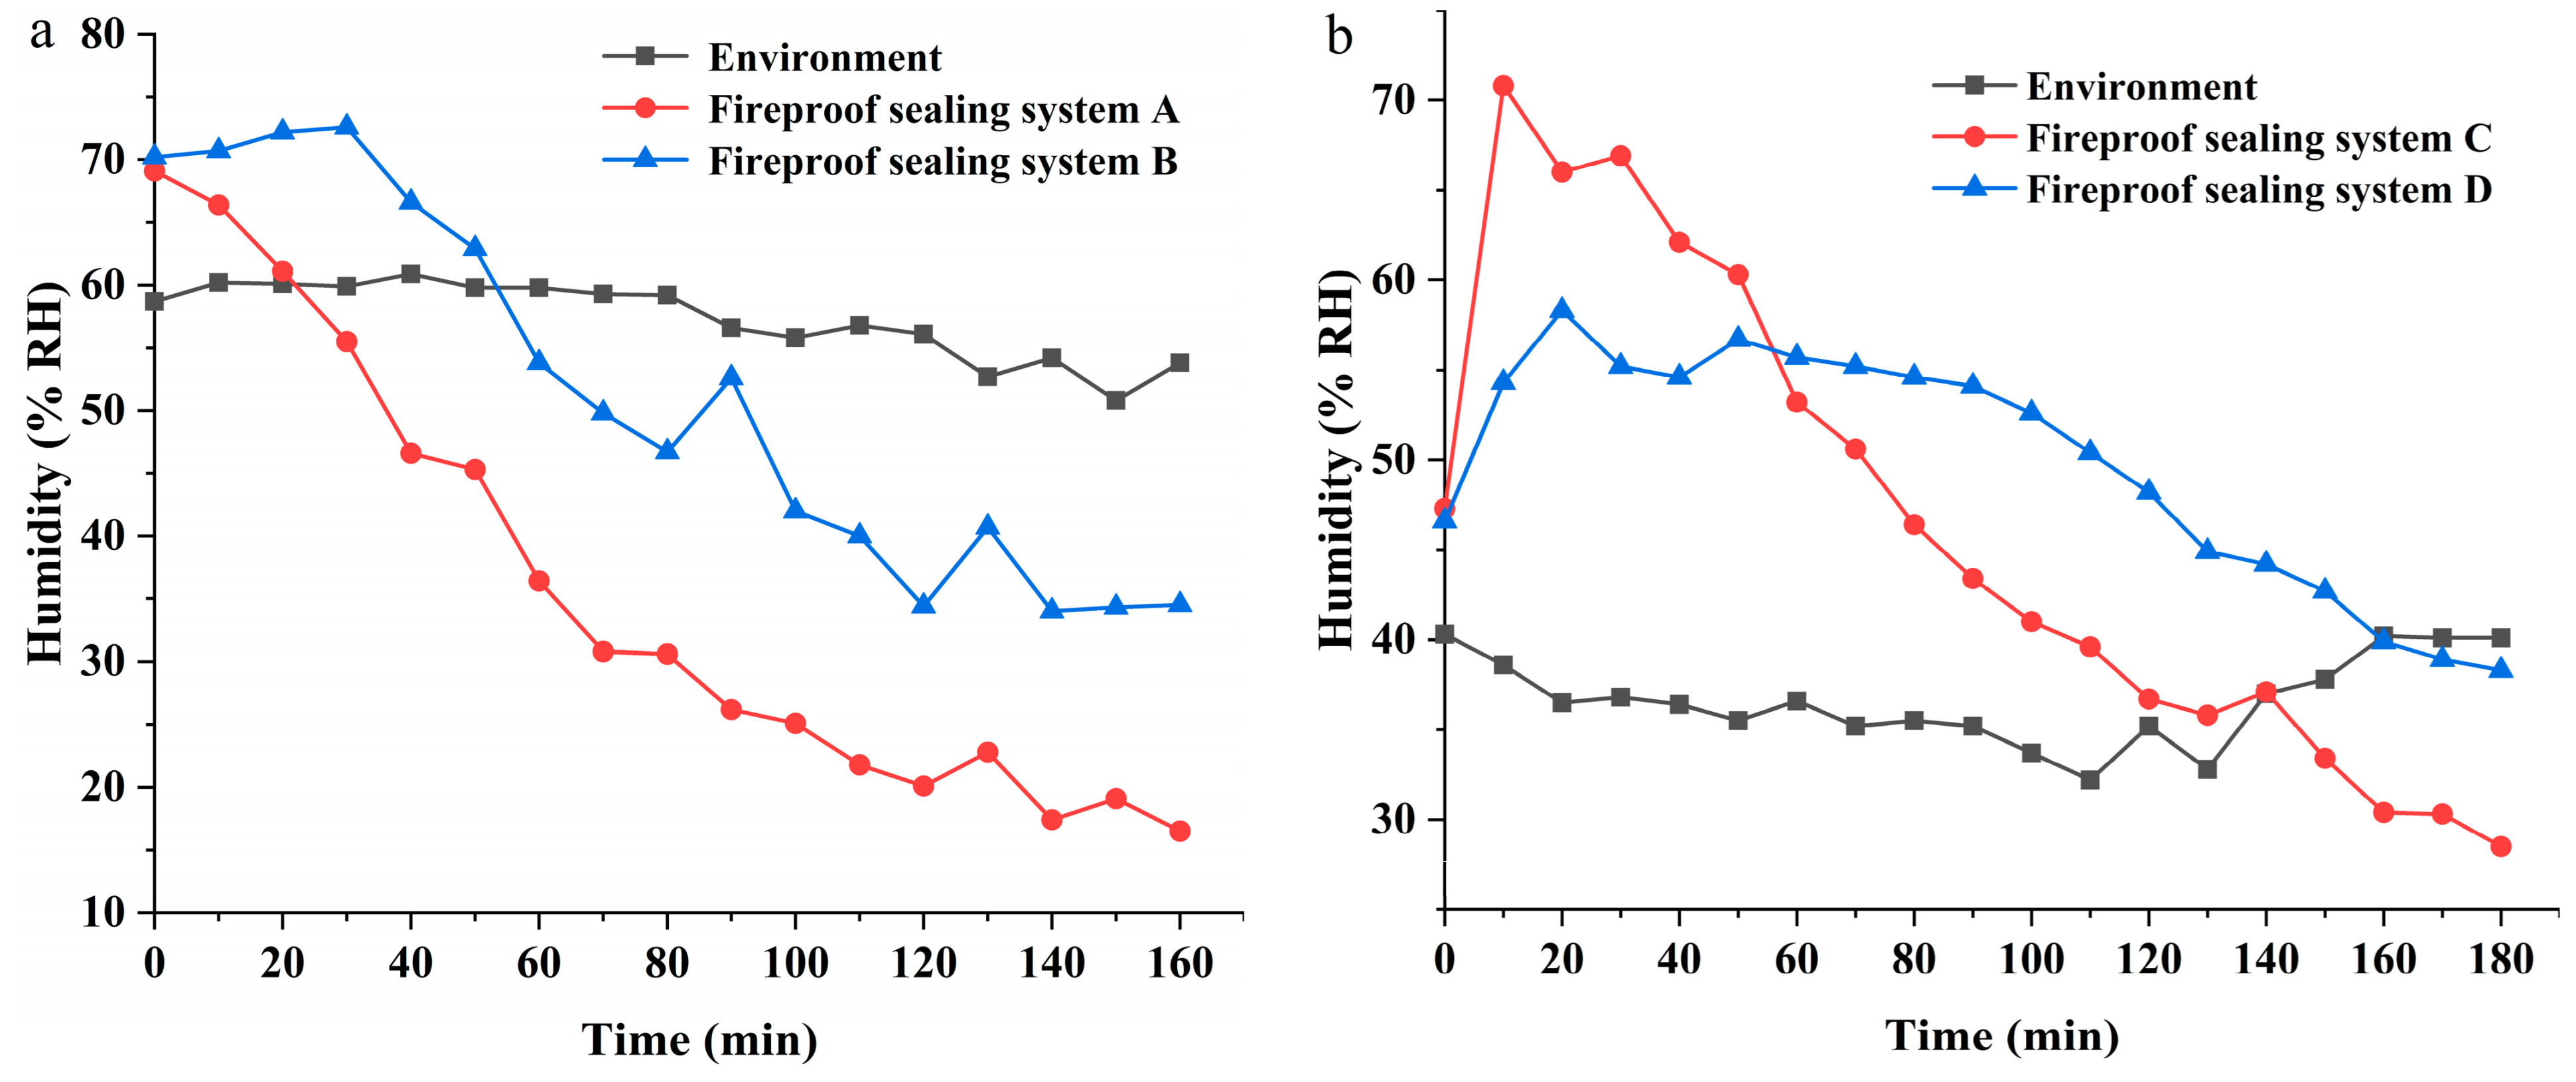
3.1.2. The Temperature and Humidity Changes in the Upper Space of the Entity Test Platform

The experimental results of temperature and humidity changes in the upper space of the entity test platform are shown in Figure 8 and Figure 9, respectively. As can be seen, the environmental temperature and humidity remain nearly constant. Nevertheless, the temperature in the upper space of the entity test platform increases and the humidity in the upper space of the entity test platform decreases over the course of the fire test. Humidity is defined as the percentage of water vapor present in the air compared to the maximum amount of water vapor where the air can hold at a specific temperature. As the temperature rises, the air’s capacity to hold water vapor also increases. In a closed space like the upper atmosphere, where the amount of water vapor is relatively constant, humidity decreases as temperature rises.
Due to the limitations of the test conditions, the fire source conditions are not accurately controlled, which may result in an inconsistent temperature and humidity distribution in the two different tests. Therefore, only two fireproof sealing systems were compared and analyzed in the same test. The temperature and humidity changes in the upper space of fireproof sealing system A were found to be significantly greater than those of fireproof sealing system B, which shows fireproof sealing system B has a better sealing performance than fireproof sealing system A. The reason for this is that fireproof sealing system A adopted a single-layer composite fireproof board, while fireproof sealing system B adopted an inorganic fireproof board–fireproof packet–inorganic fireproof board structure. Although the composite fireproof board adopted by fireproof sealing system A can absorb part of the heat when it expands, the single-layer composite fireproof board structure’s ability to block the heat diffusion is still weaker than that of the inorganic fireproof board–fireproof packet–inorganic fireproof board three-layer structure adopted by fireproof sealing system B. Similarly, fireproof sealing system D has a better sealing performance than fireproof sealing system C. The reason for this is that, although fireproof sealing systems C and D both use a double-layer organic fireproof board and the same construction process, the fireproof board used in fireproof sealing system D is thicker.

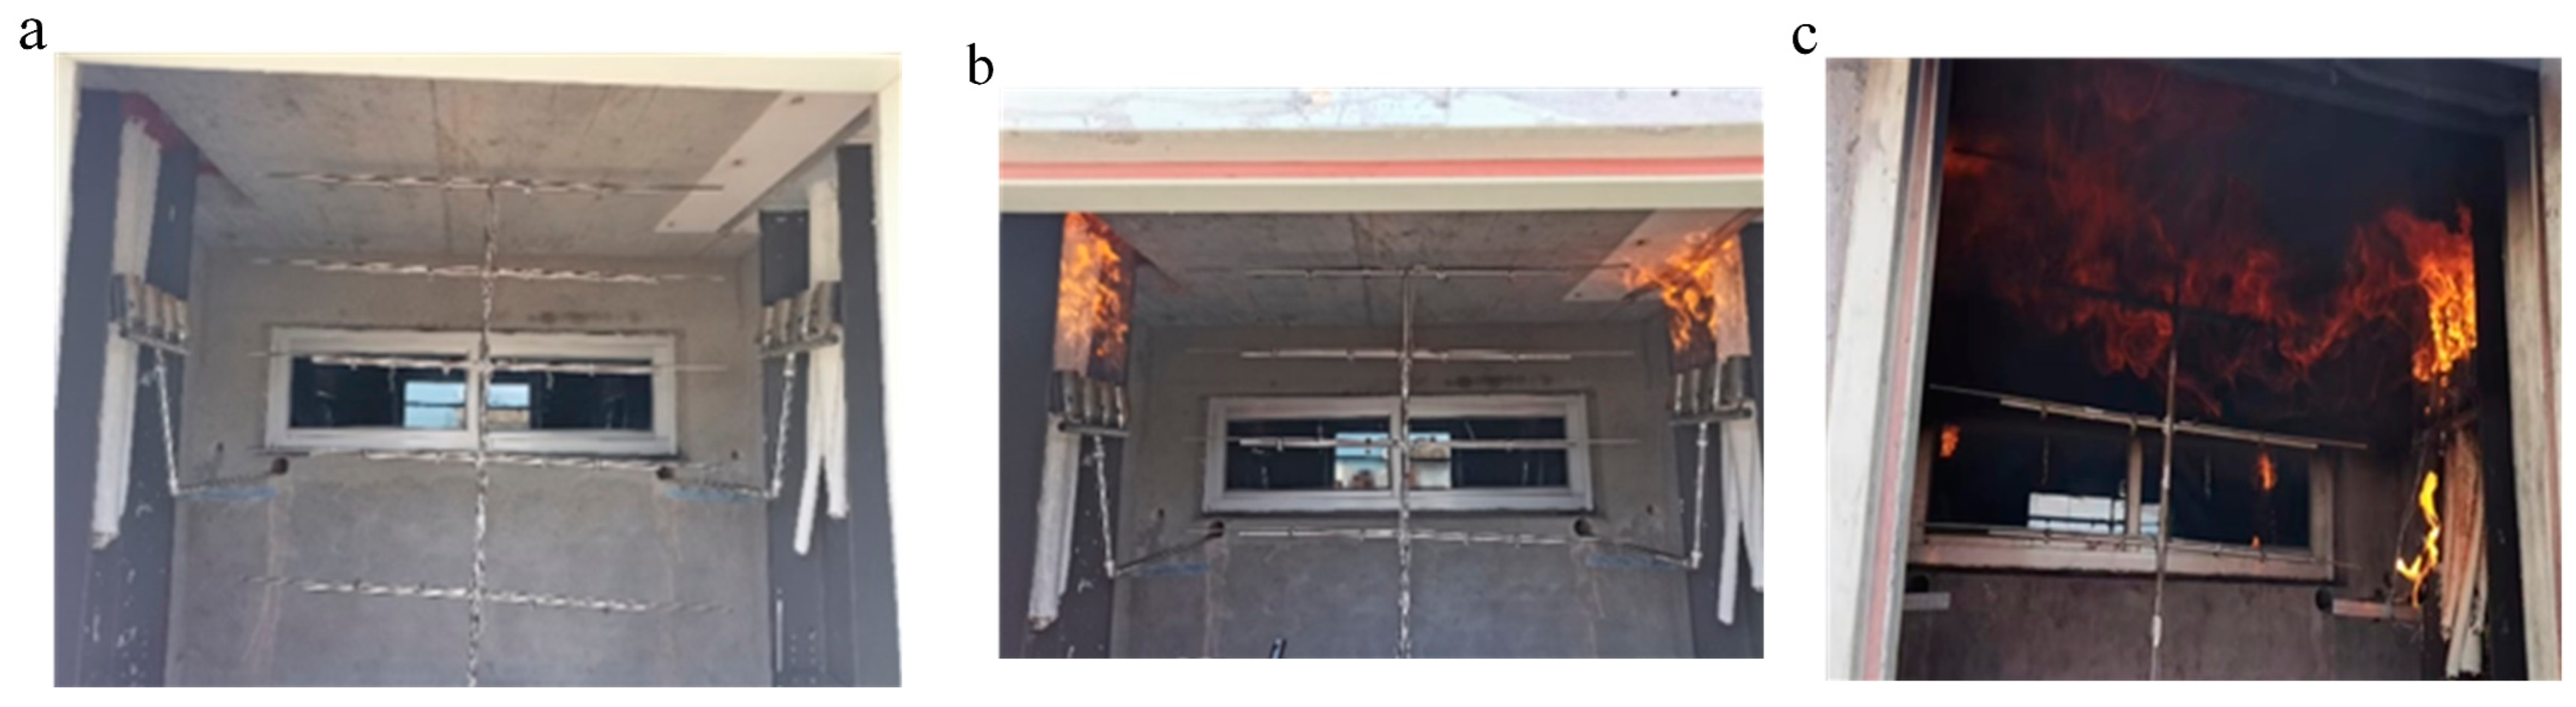
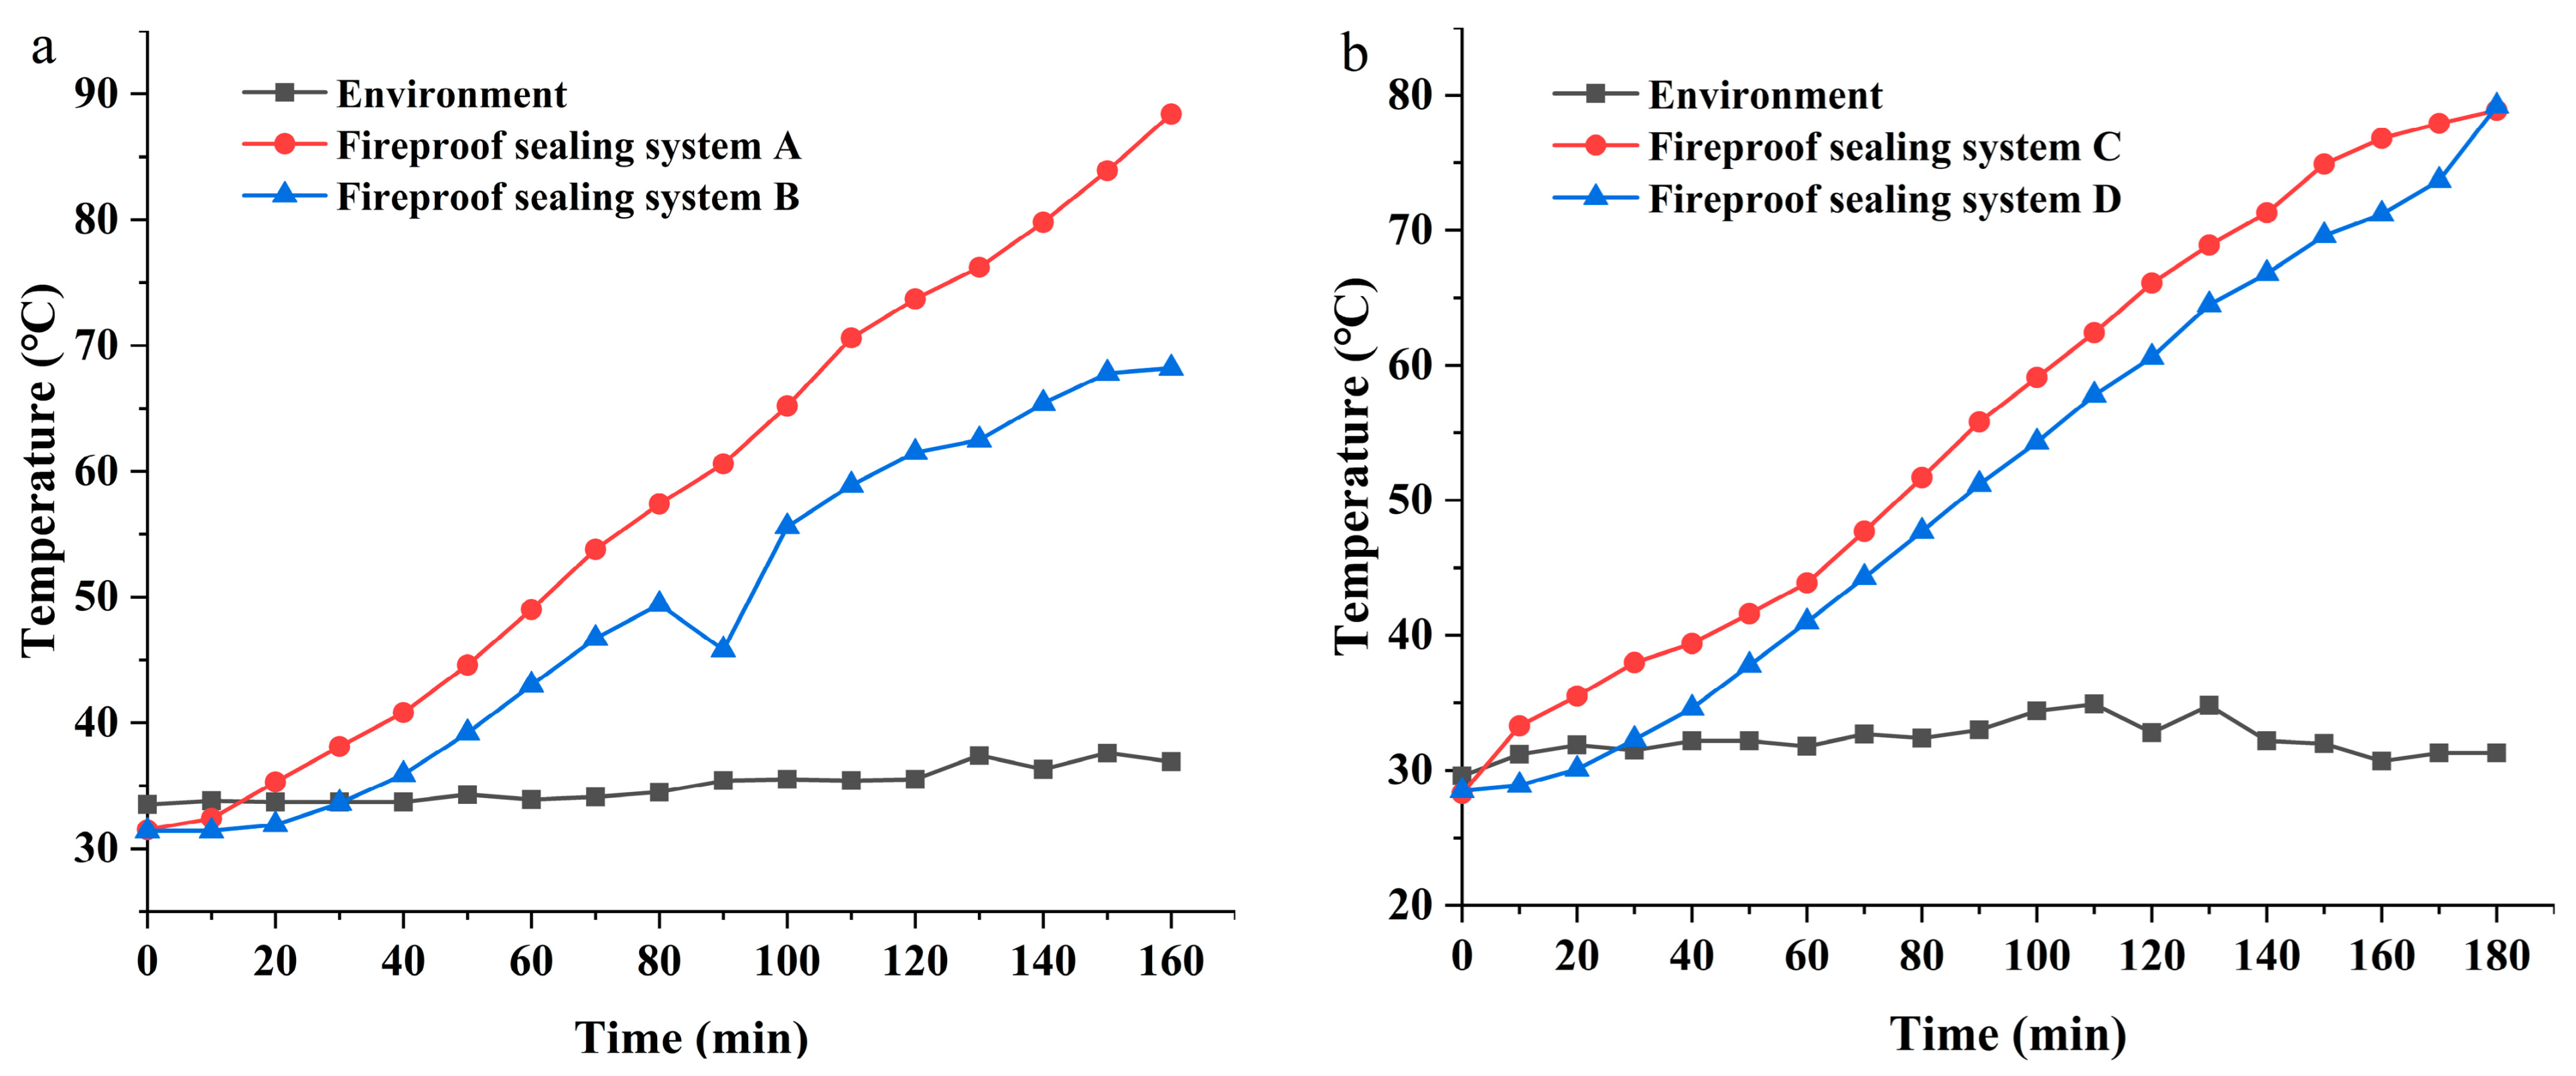
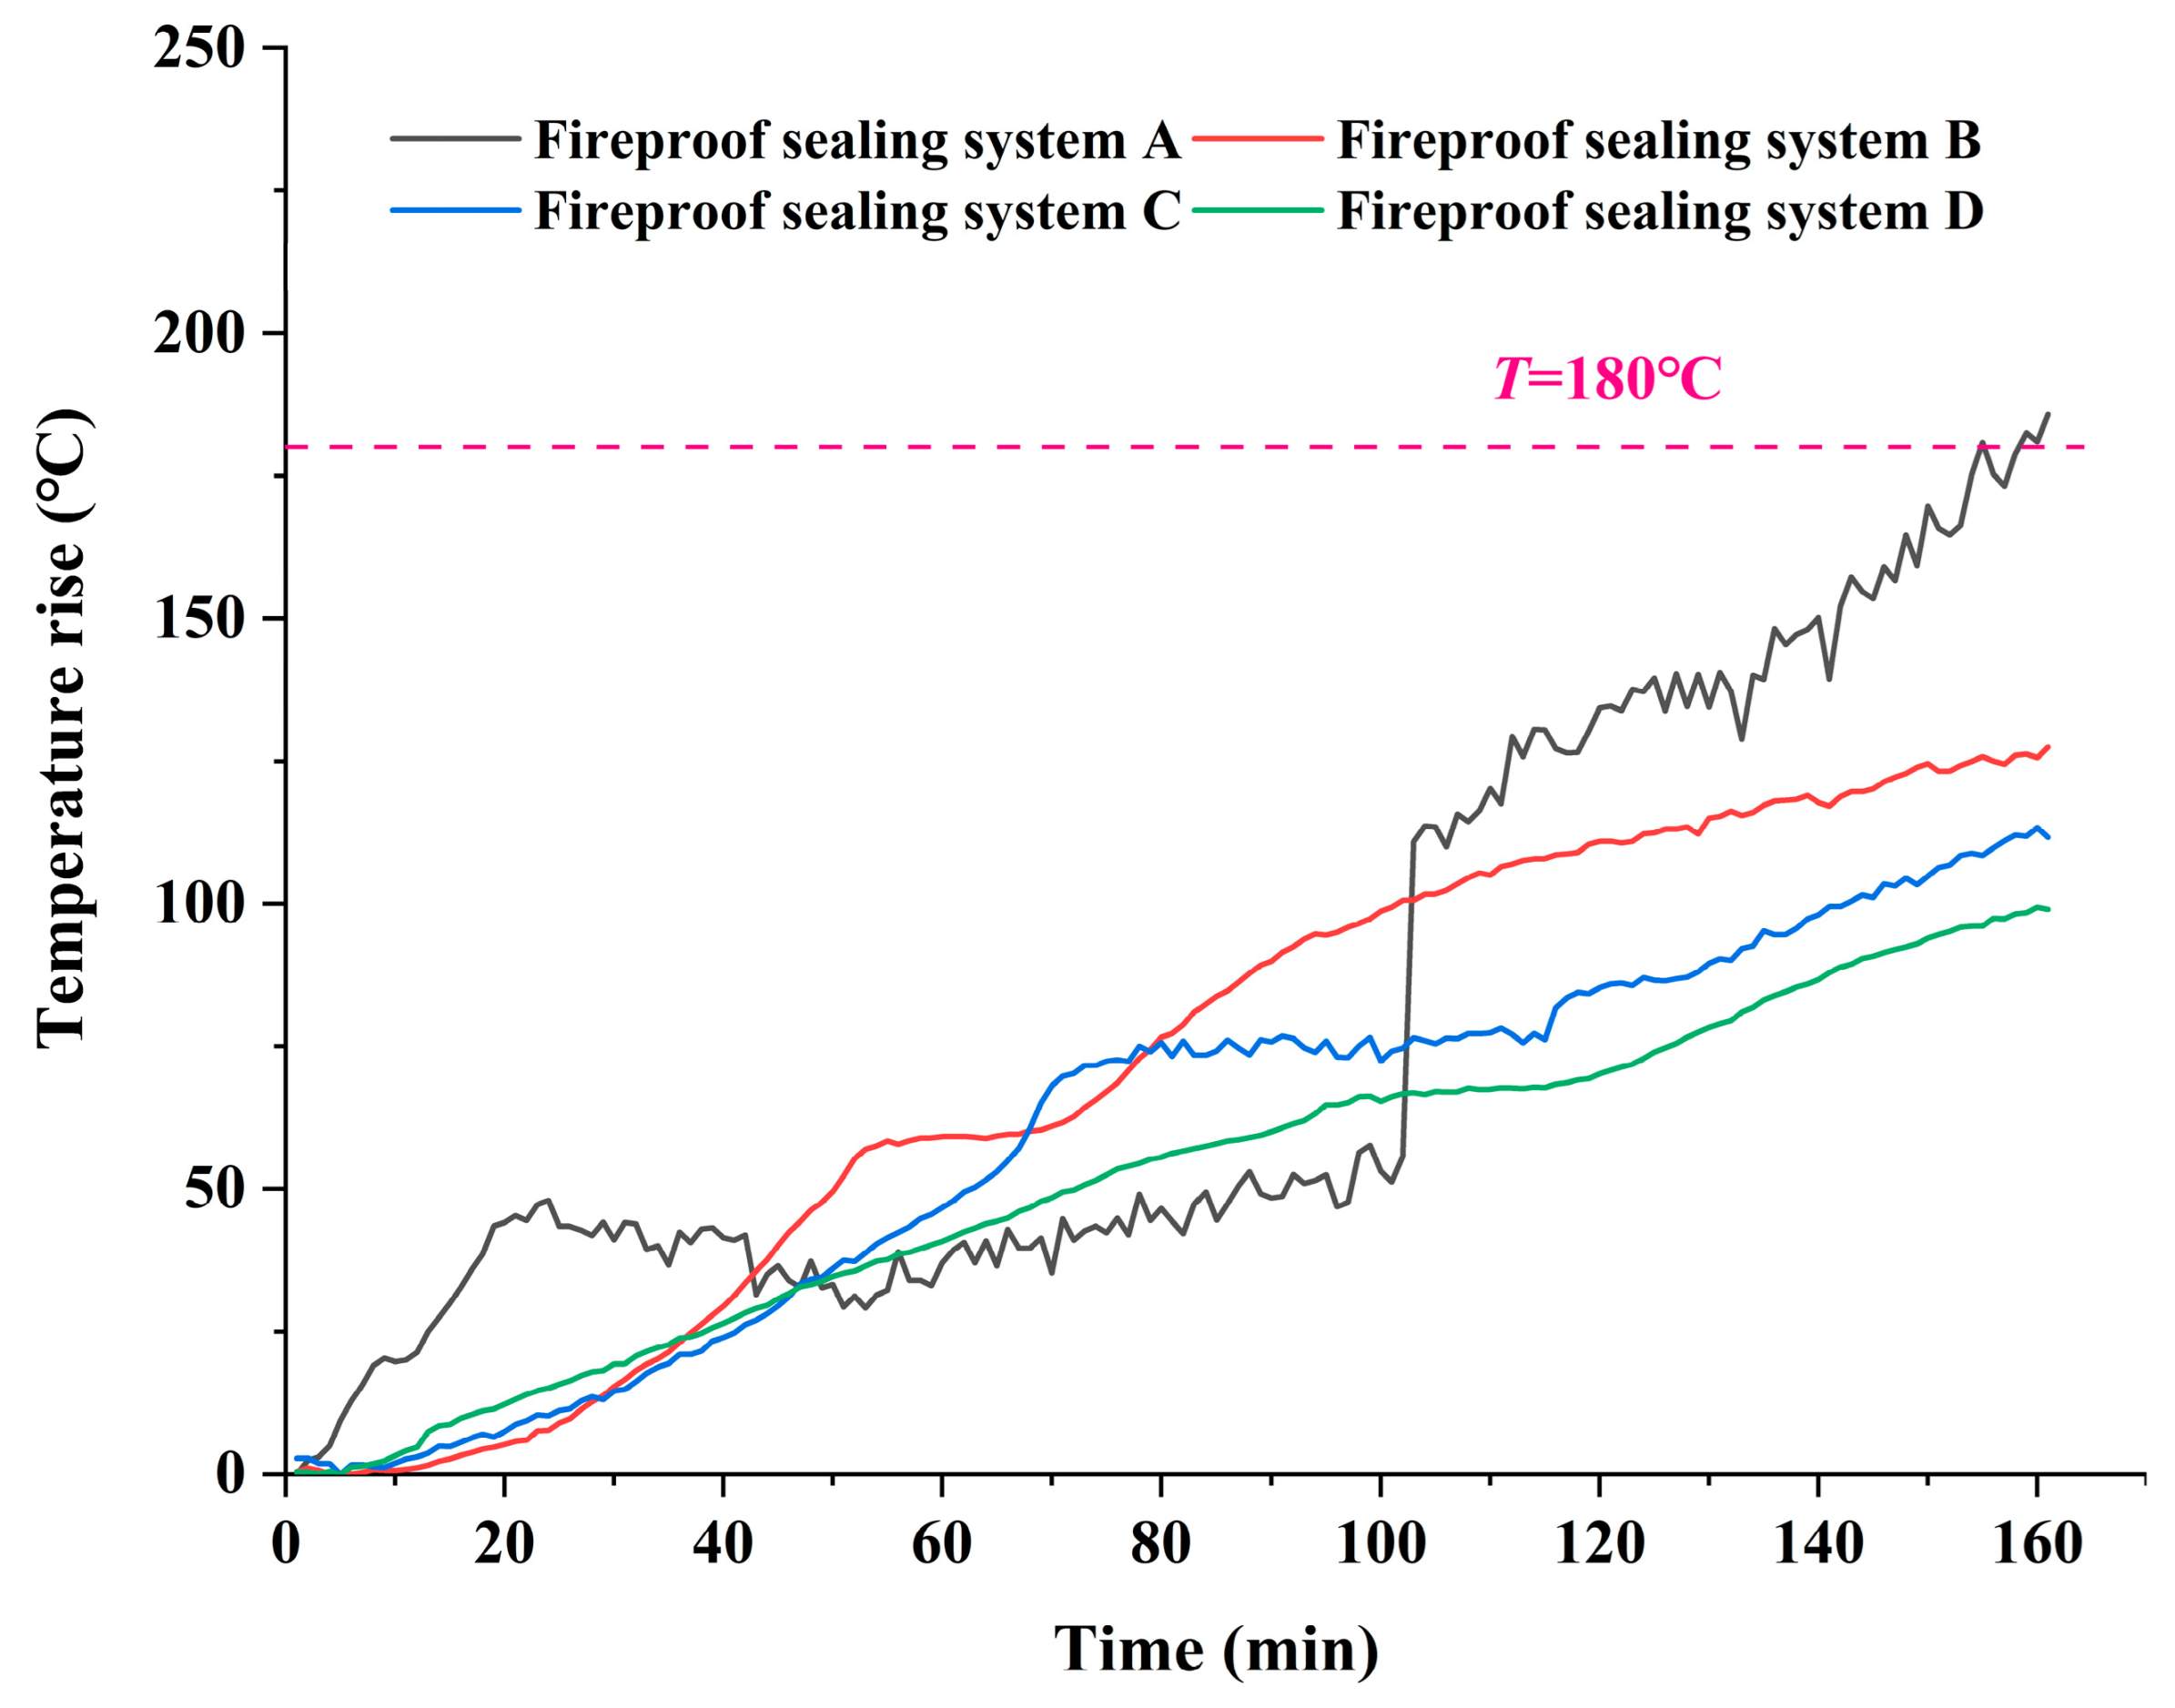
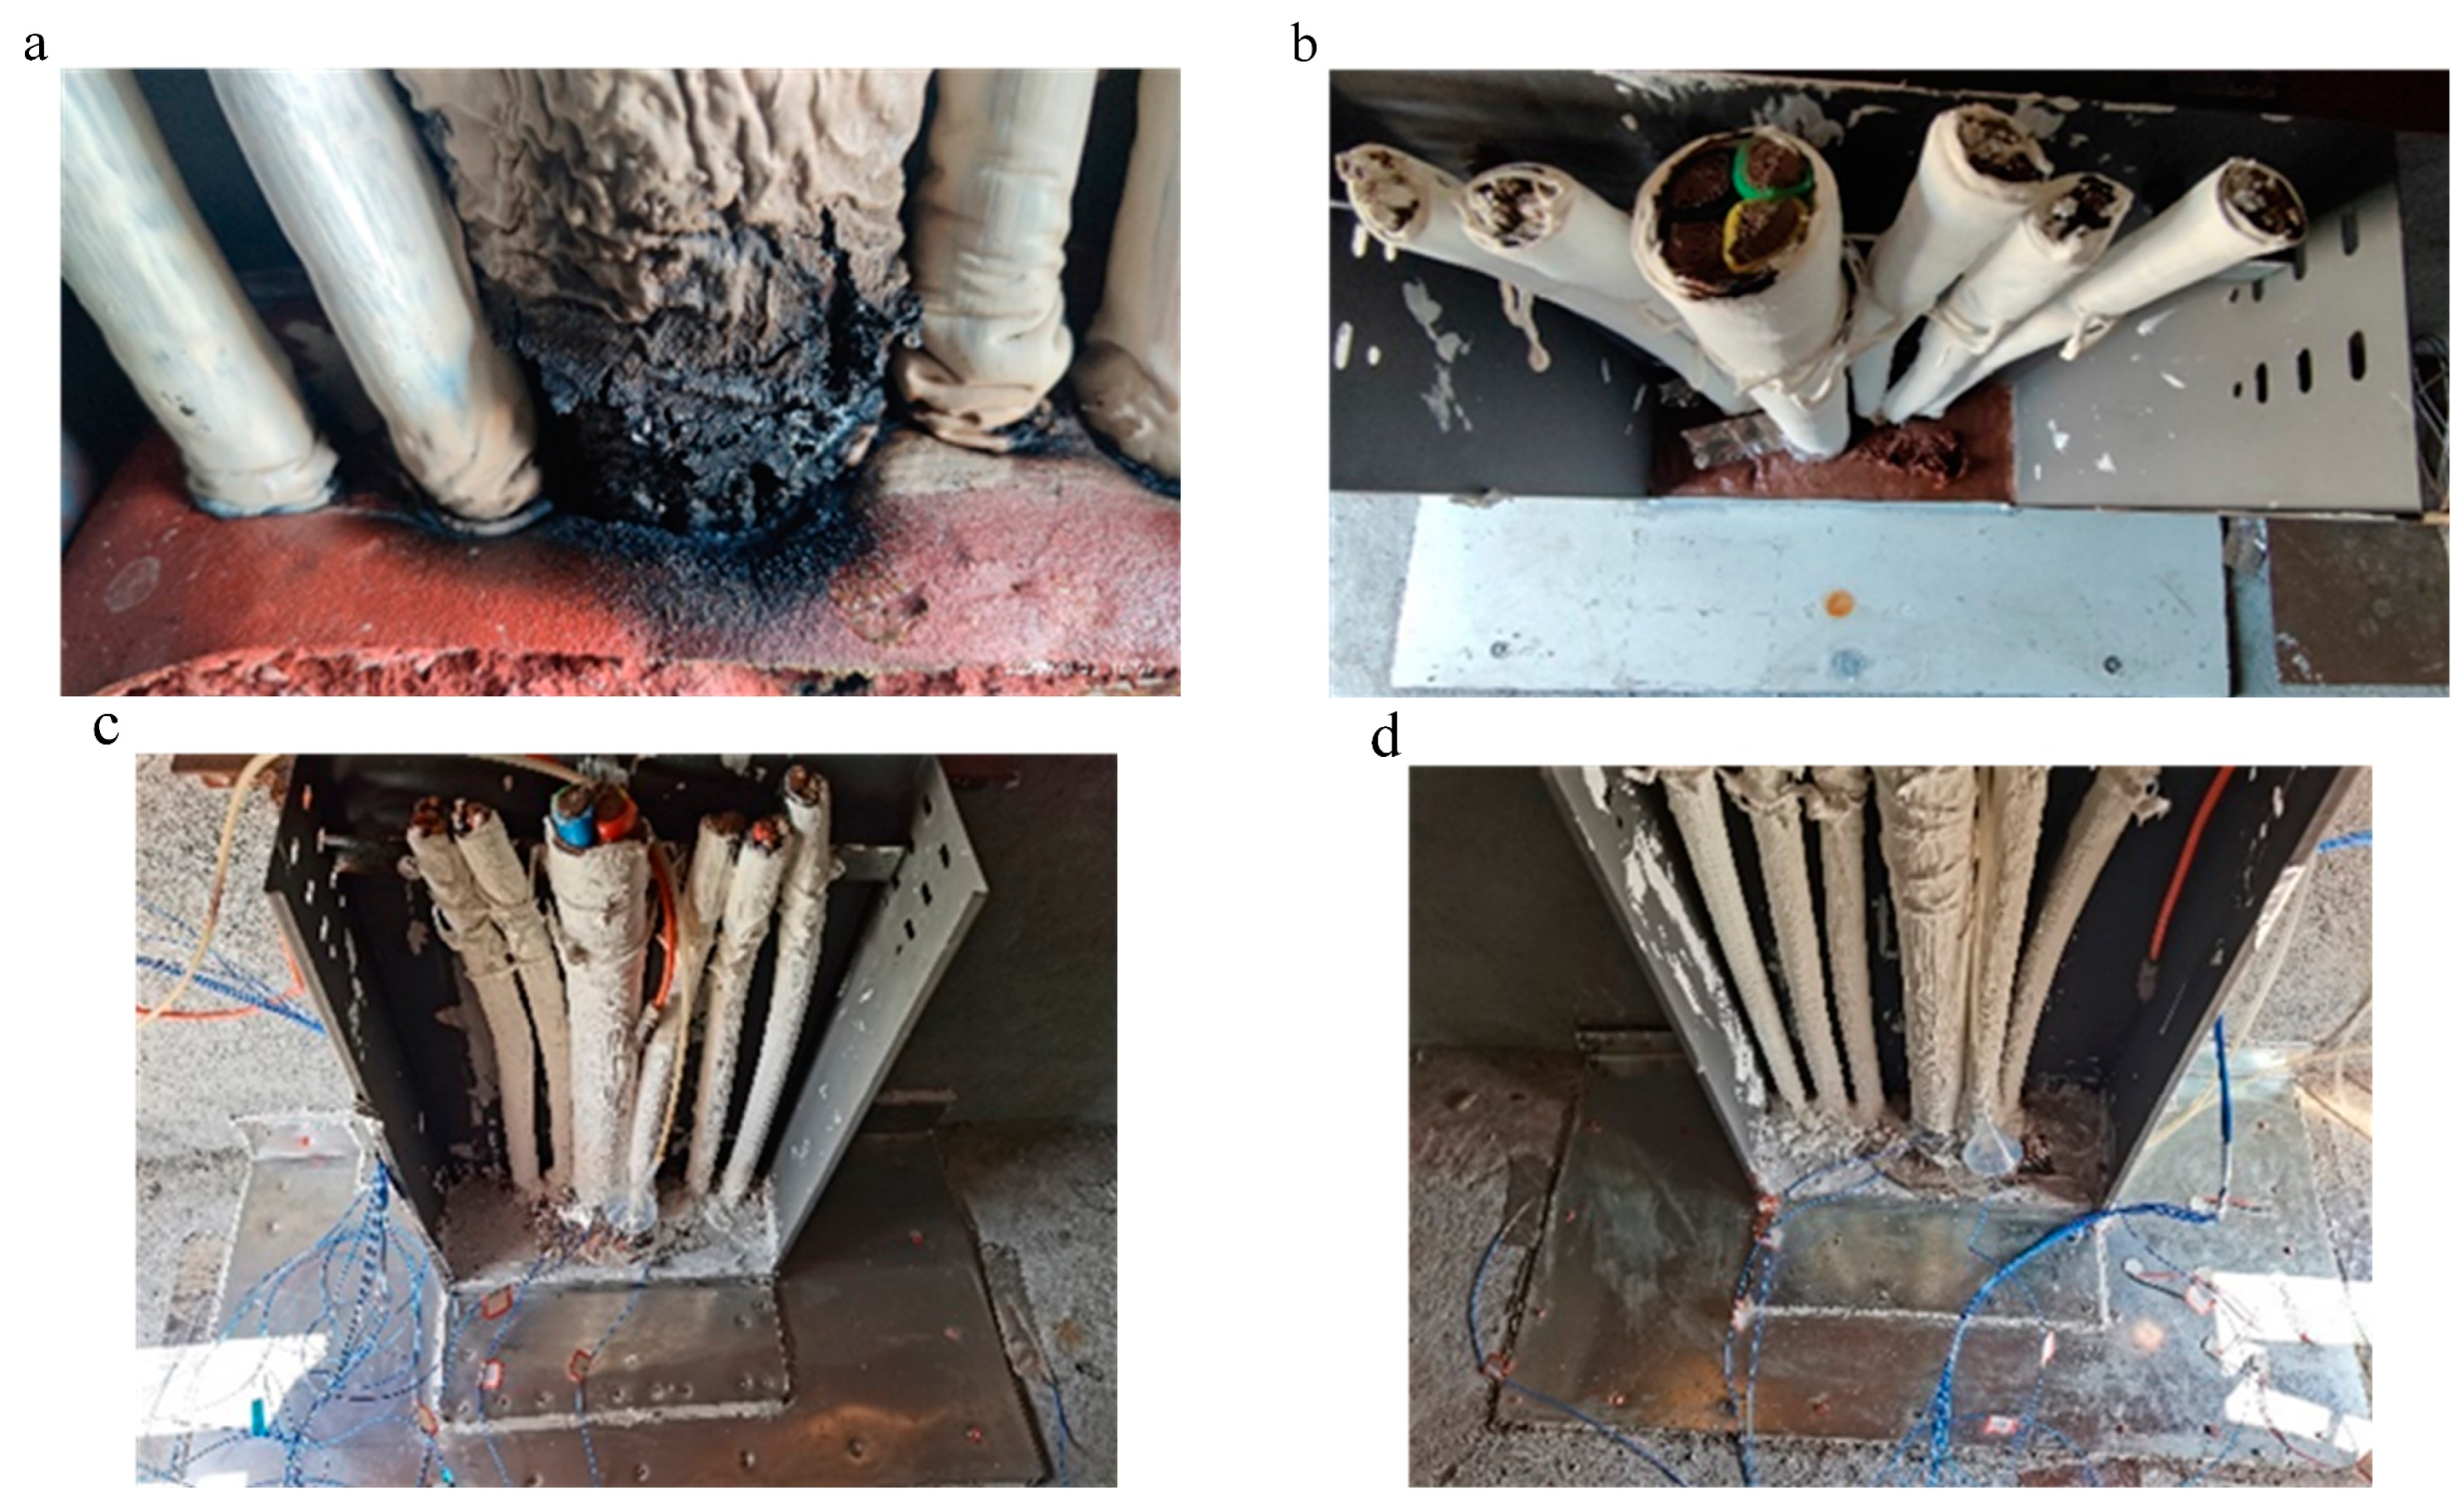
3.1.3. The Temperature Rise on the Unexposed Surface of the Fireproof Sealing System

Li [26] proposed that the temperature rise that occurs on the unexposed surface of the fireproof sealing system is an important indicator reflecting the performance of the fireproof sealing system. Figure 10 shows the temperature trend changes on the unexposed surface of four fireproof sealing systems, which recorded the highest temperature rise point of all the SMD thermocouples. It can be seen that the temperature rise rates of fireproof sealing systems B, C, and D are relatively consistent, while fireproof sealing system A has an obvious plateau period from 20 min to 100 min. This is because fireproof sealing system A adopts a single-layer fireproof board structure. Once the fireproof board is heated, it expands and forms a carbon layer, which has a much better thermal insulation ability than the original fireproof material. In contrast, fireproof sealing systems B, C and D are multi-layer structures. During the heating process, a large part of the heat is blocked or absorbed by the first layer’s board, so the heat transferred to the second layer’s board surface is more uniform. At about 100 min, the temperature of the unexposed surface of fireproof sealing system A rises sharply, indicating that the thermal insulation performance of the fireproof sealing system decreases sharply. At 160 min, the temperature rises on the unexposed surfaces of fireproof sealing systems A, B, C, and D are 185.78 °C, 127.49 °C, 116.63 °C, and 99 °C, respectively. According to the provisions of GB/T 23864-2009 [7], fireproof sealing system A’s thermal insulation performance decreased, while fireproof sealing systems B, C, and D did not show decreases in their thermal insulation performance.

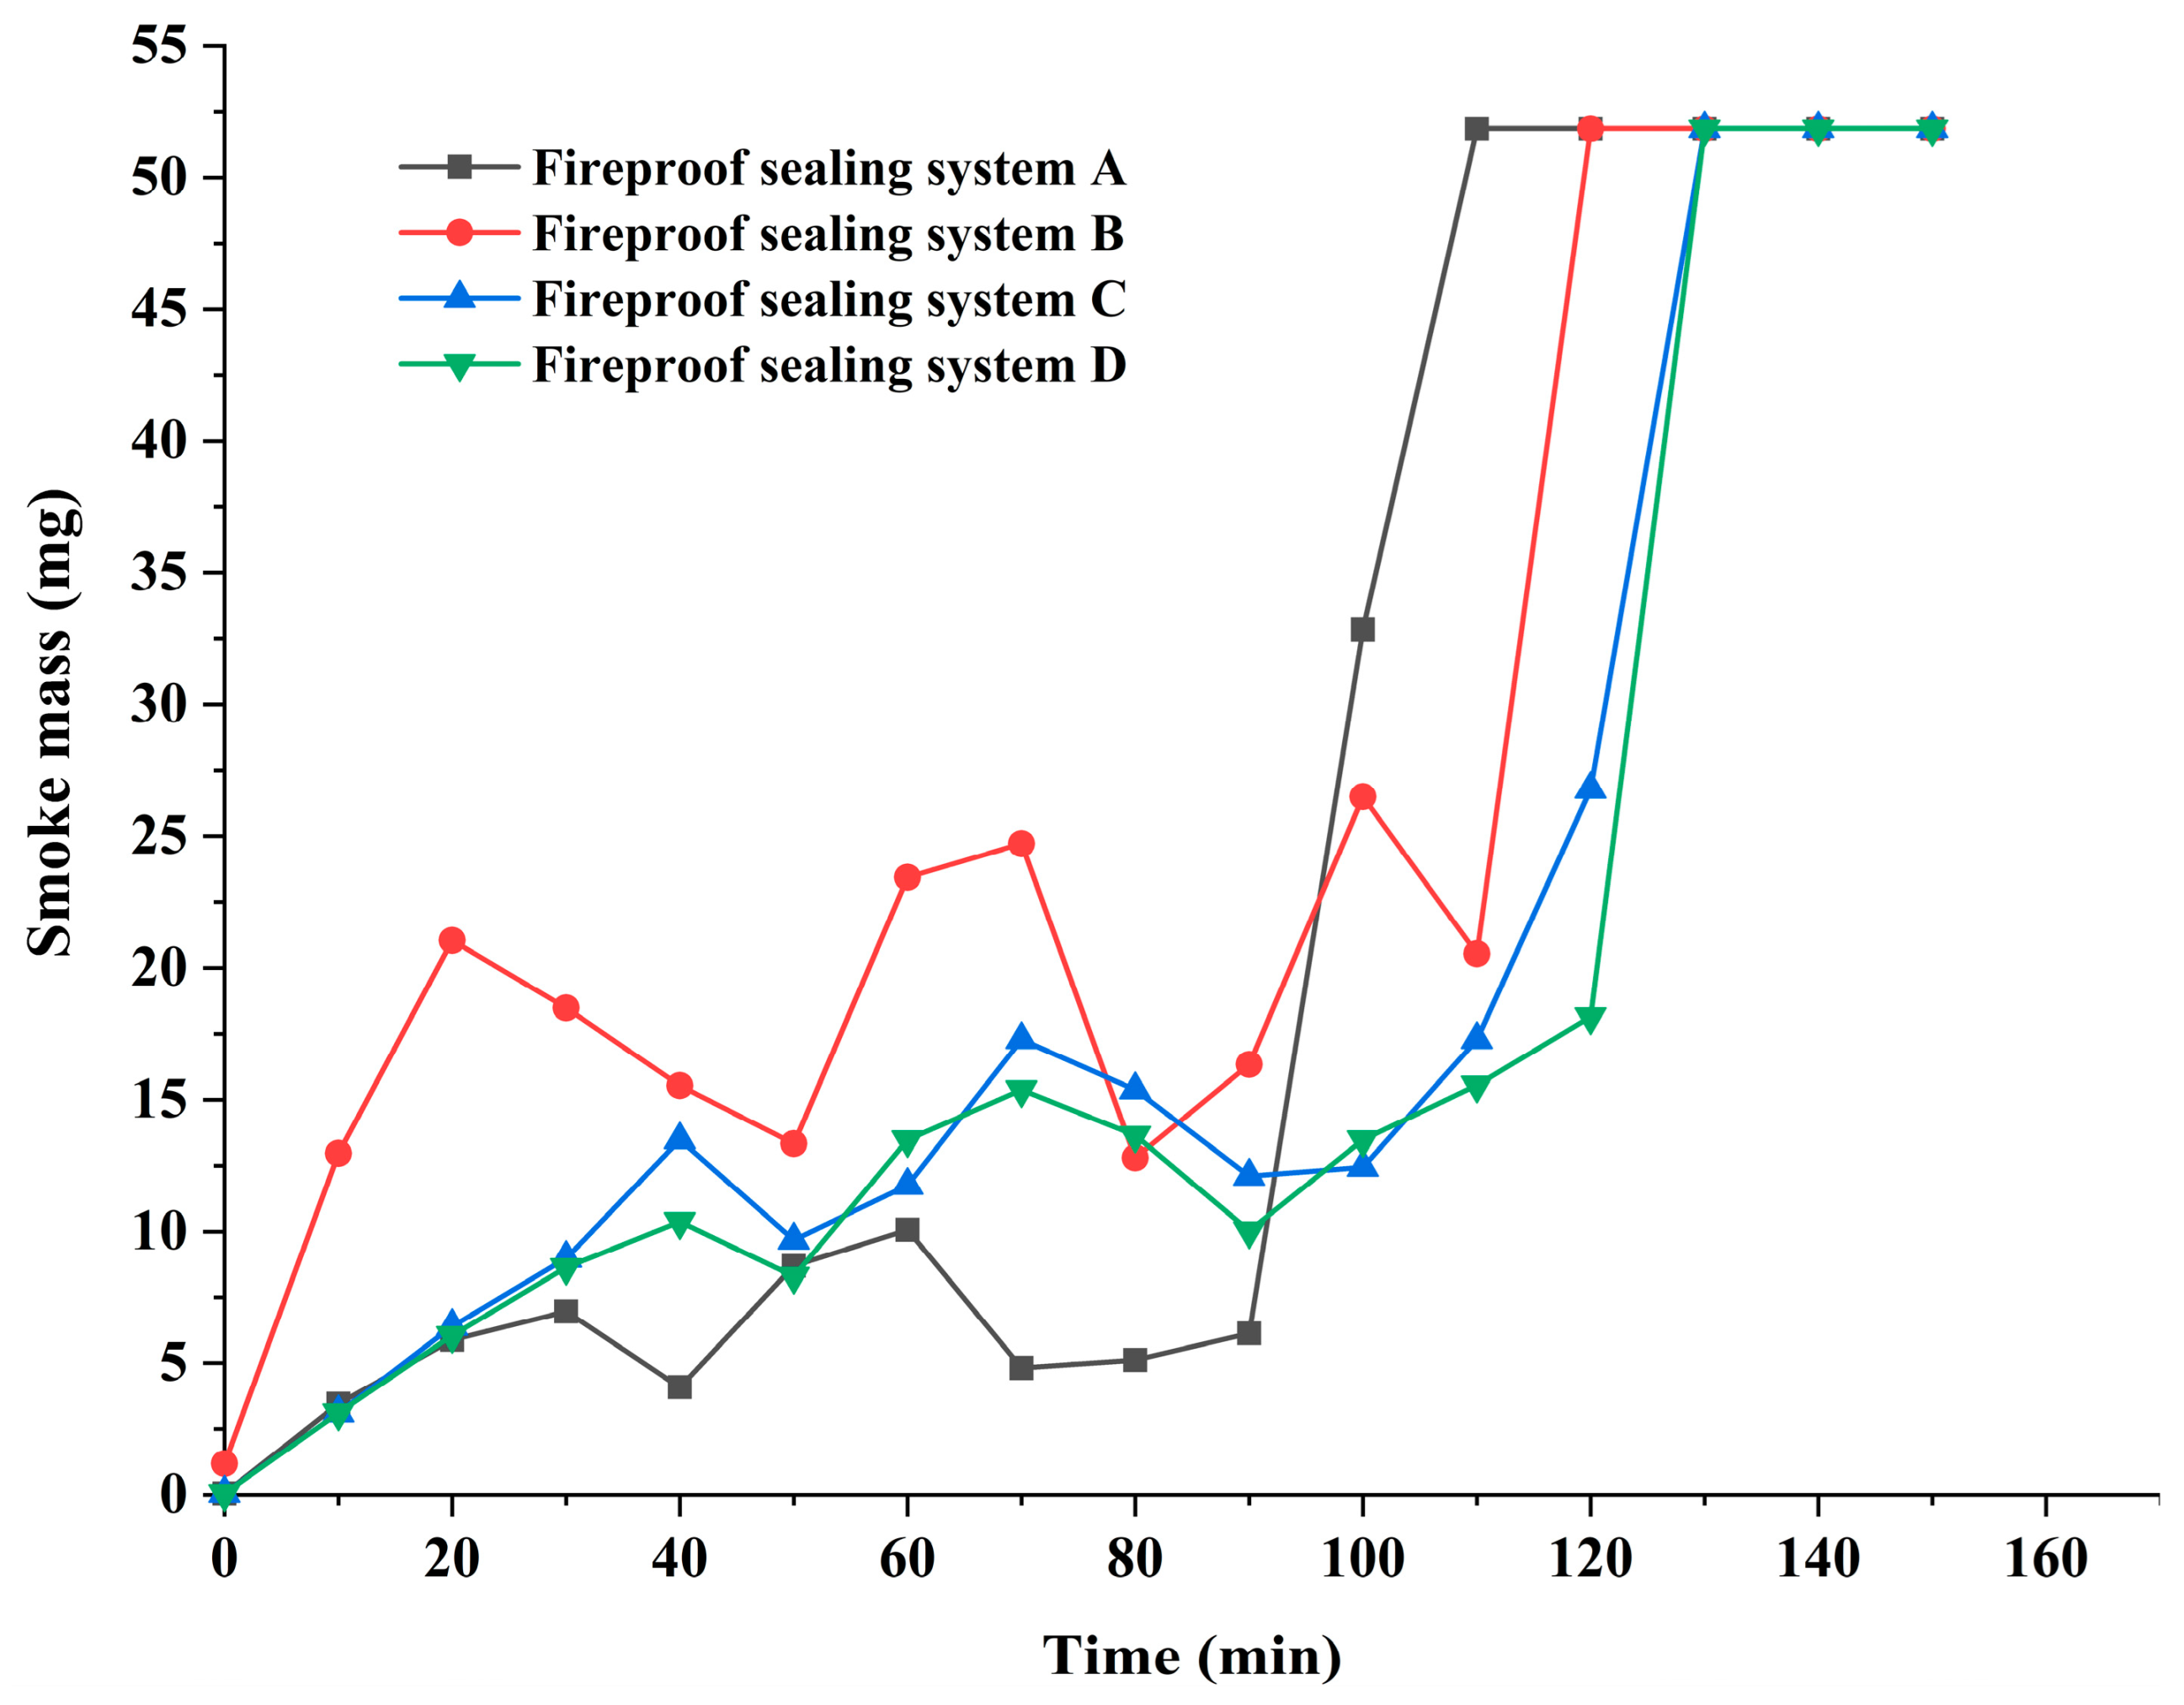
3.1.4. The Smoke Mass Change in the Upper Space of the Entity Test Platform

Li [47] pointed out that when a fire occurs in the cable shaft, if the smoke sealing capacity of the fireproof sealing system is poor, high-temperature flue gas will leak from the poorly sealed area, expanding the leakage point of flue gas, and this may become a channel allowing for fire spread. In this paper, flue gas is considered to be a mixture of gas and smoke. However, due to the limited resources, gas cannot be detected, and smoke can only be used as a medium for the detection of smoke sealing capacity.
Nam et al. [48] placed the through-penetration firestop assembly on top of an ASTM E-814 furnace covered by a smoke collection box; the smoke sealing capacity of the fireproof sealing material was evaluated according to the amount of smoke. Therefore, in this paper, the lower space of the cable shaft’s entity test platform is compared to the ASTM E-814 furnace, and the upper space is compared to the smoke collection box. The amount of smoke found in the upper space when a fire test is conducted on the entity test platform is collected by the smoke sensor, which is used as the basis for evaluating the smoke sealing capacity of the cable shaft fireproof sealing system. The worse the smoke sealing capacity of the fireproof sealing system, the greater the amount of smoke.
Figure 11 shows the smoke mass trends in the upper space of the fireproof sealing system during the fire test. Section 2.1.1 shows that the size of each independent space in the upper area of the cable shaft entity test platform is 900 mm (length) × 1600 mm (width) × 1200 mm (height). The smoke mass can be obtained via the concentration of smoke collected by the smoke sensor. It can be seen from Figure 10 that the smoke mass in the upper space of fireproof sealing system A remains at a low level in the first 90 min and then rises sharply, reaching the maximum range of the smoke sensor in 110 min. In contrast, the smoke mass of fireproof sealing systems B, C, and D reached the maximum range of smoke sensor in 120 min, 130 min, and 130 min, respectively.

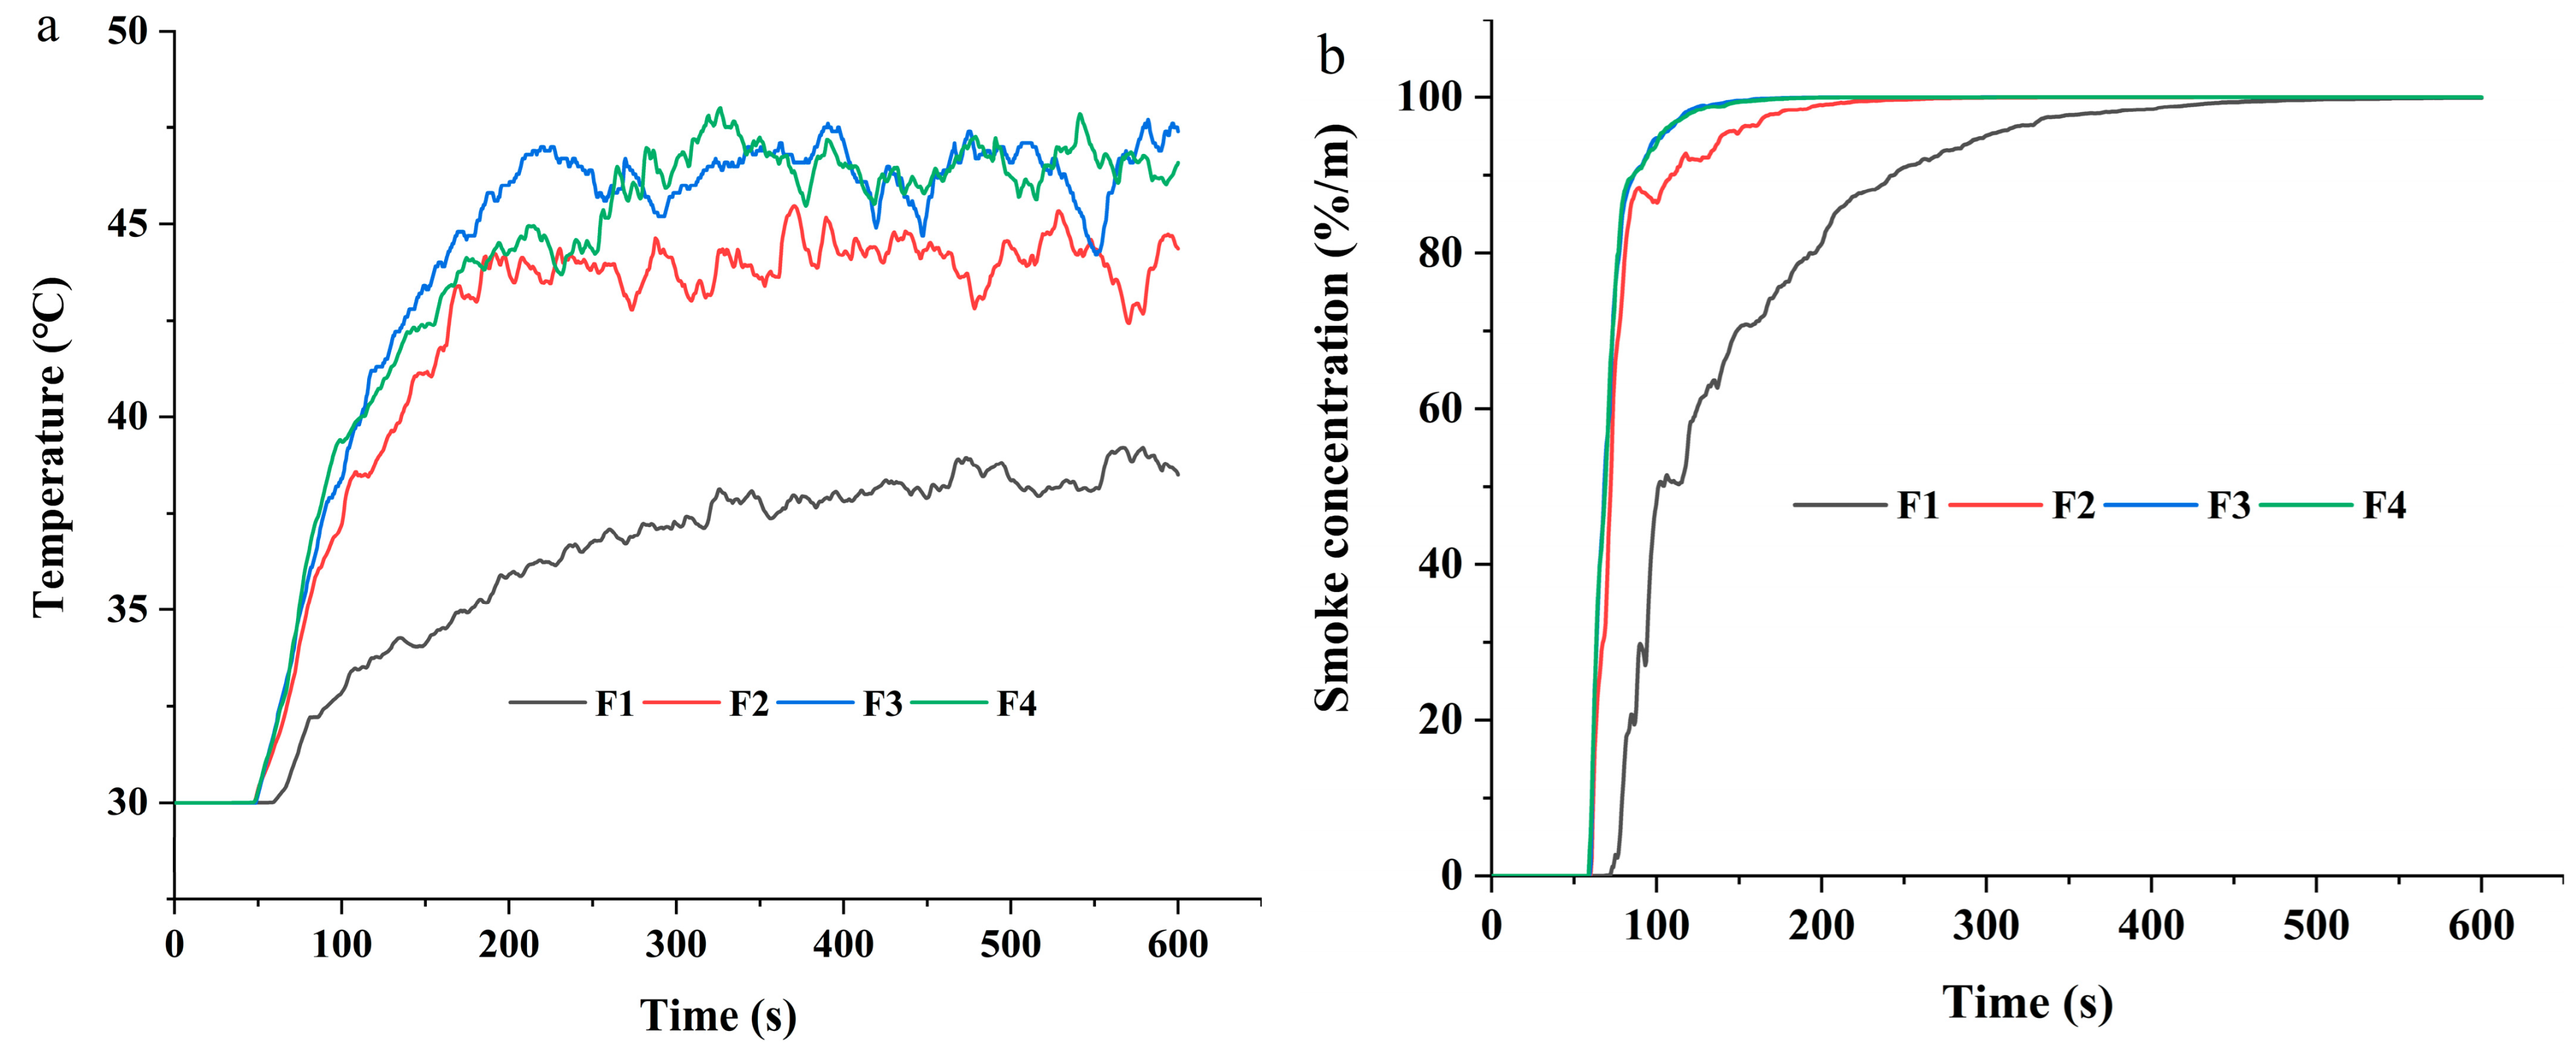
3.1.5. Performance Comparison

Combining the above experimental results of temperature, humidity, and smoke mass with the before and after test, the thermal insulation, smoke sealing capacity, and integrity of the four fireproof sealing systems are discussed to compare their comprehensive fireproof sealing performance.
1.
Thermal Insulation
The thermal insulation of a fireproof sealing system is indirectly reflected by the change in temperature and humidity in the upper space of the entity test platform. It is also directly reflected by the rise in temperature on the unexposed surface. In Section 3.1.2, under the premise of there being no obvious change in environmental temperature and humidity, the changes in temperature and humidity in the upper space of fireproof sealing system B are less than those obtained by fireproof sealing system A, and the change in temperature and humidity in the upper space of fireproof sealing system D is less than that of fireproof sealing system C. In Section 3.1.3, looking at the highest temperature rise curve of the unexposed surface of a fireproof sealing system, the temperature rise on the unexposed surface of fireproof sealing system A at 160 min reached 185.78 °C, which means that its thermal insulation capacity was lost. By contrast, the temperature rises obtained by fireproof sealing systems B, C, and D, are 127.49 °C, 116.63 °C, and 99 °C, respectively, which means their thermal insulation capacity was not lost. Therefore, the thermal insulation ranking of the four fireproof sealing systems is D > C > B > A.
2.
Smoke Sealing Capacity
The amount of smoke can be used to characterize the smoke sealing capacity of a fireproof sealing system. The better the smoke sealing capacity of the fireproof sealing system, the lower the amount of smoke in the upper space. From the analysis of the test results presented in Section 3.1.4, during the fire test, the smoke mass in the upper space of fireproof sealing system A reached the maximum range of the smoke sensor in 110 min. At this time, the smoke mass in the upper space of fireproof sealing systems B, C, and D was less than half that of fireproof sealing system A, and there were differences between them. Therefore, this paper presents the smoke sealing capacity ranking of the four fireproof sealing systems in the first 110 min as follows: D > C > B > A. However, due to the limitations to the range of the smoke sensor, the smoke sealing capacity of the four fireproof sealing systems could not be judged within 110 min~160 min of the fire test.
3.
Integrity of Fireproof Sealing System
The integrity of the fireproof sealing system can be observed by determining the state of the unexposed surface after the fire test, as shown in Figure 11. As can be seen from Figure 12a, after the fire test, the unexposed surface of fireproof sealing system A was deformed, and the part through which the cable passed was blackened by high-temperature smoke. In contrast, Figure 12b–d show that the unexposed surfaces of fireproof sealing systems B, C, and D were not deformed after the fire test, and were smooth as before; additionally, a high-temperature flue gas channel was not formed. It can be concluded that fireproof sealing system A loses its integrity after the fire test, while fireproof sealing systems B, C, and D remain intact. Therefore, the integrity ranking of the four fireproof sealing systems is B = C = D > A.
After combining the thermal insulation, the smoke sealing capacity, and the integrity of the fireproof sealing systems, the performance of the four sets of cable shaft fireproof sealing systems can be ranked as follows: D > C > B > A.

3.2. Discussion Based on FDS in Cable Shaft Fire

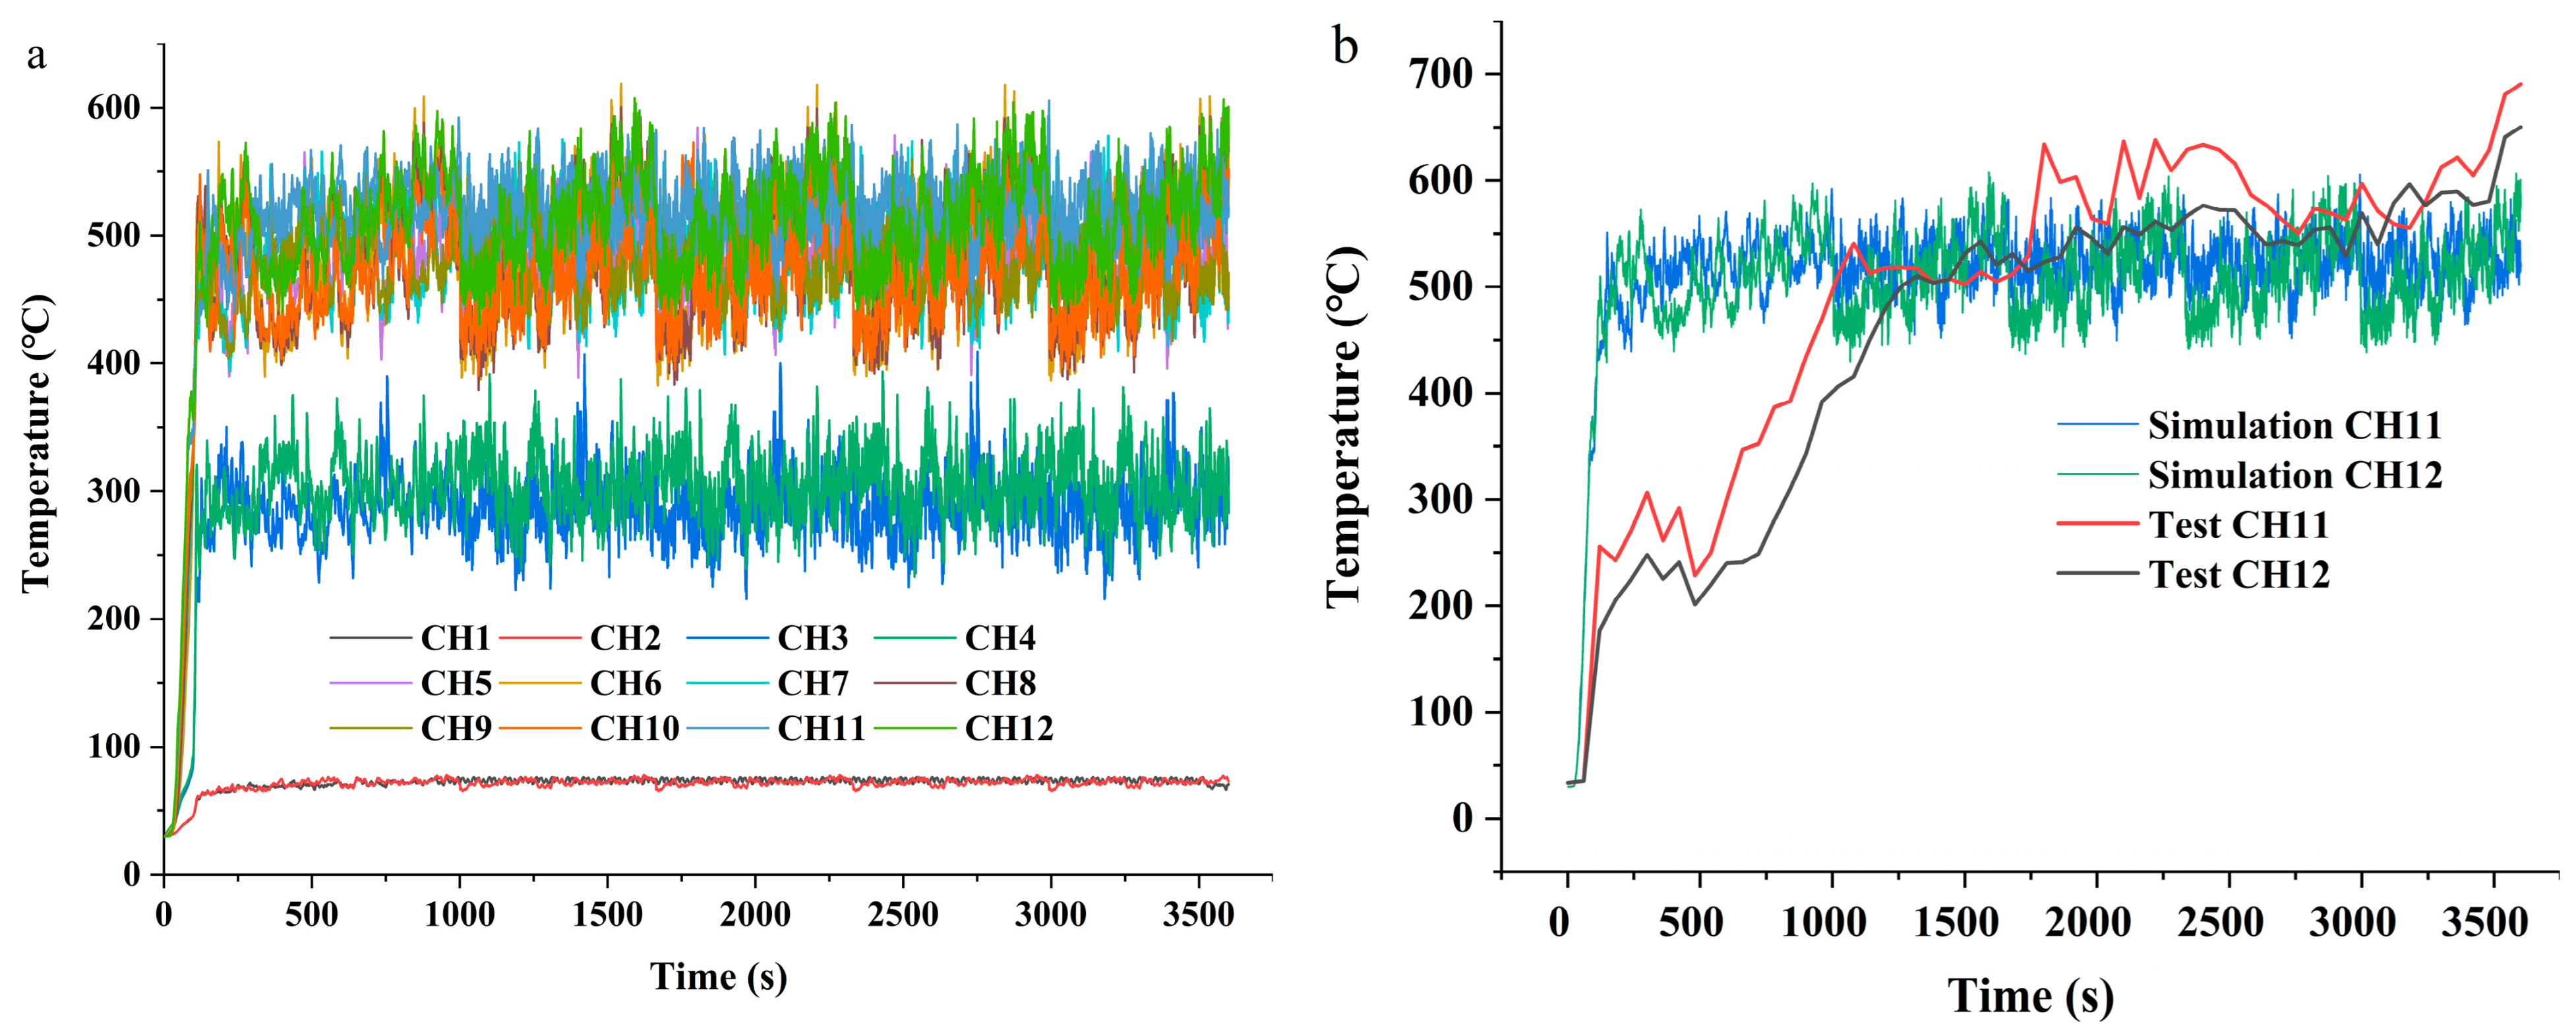
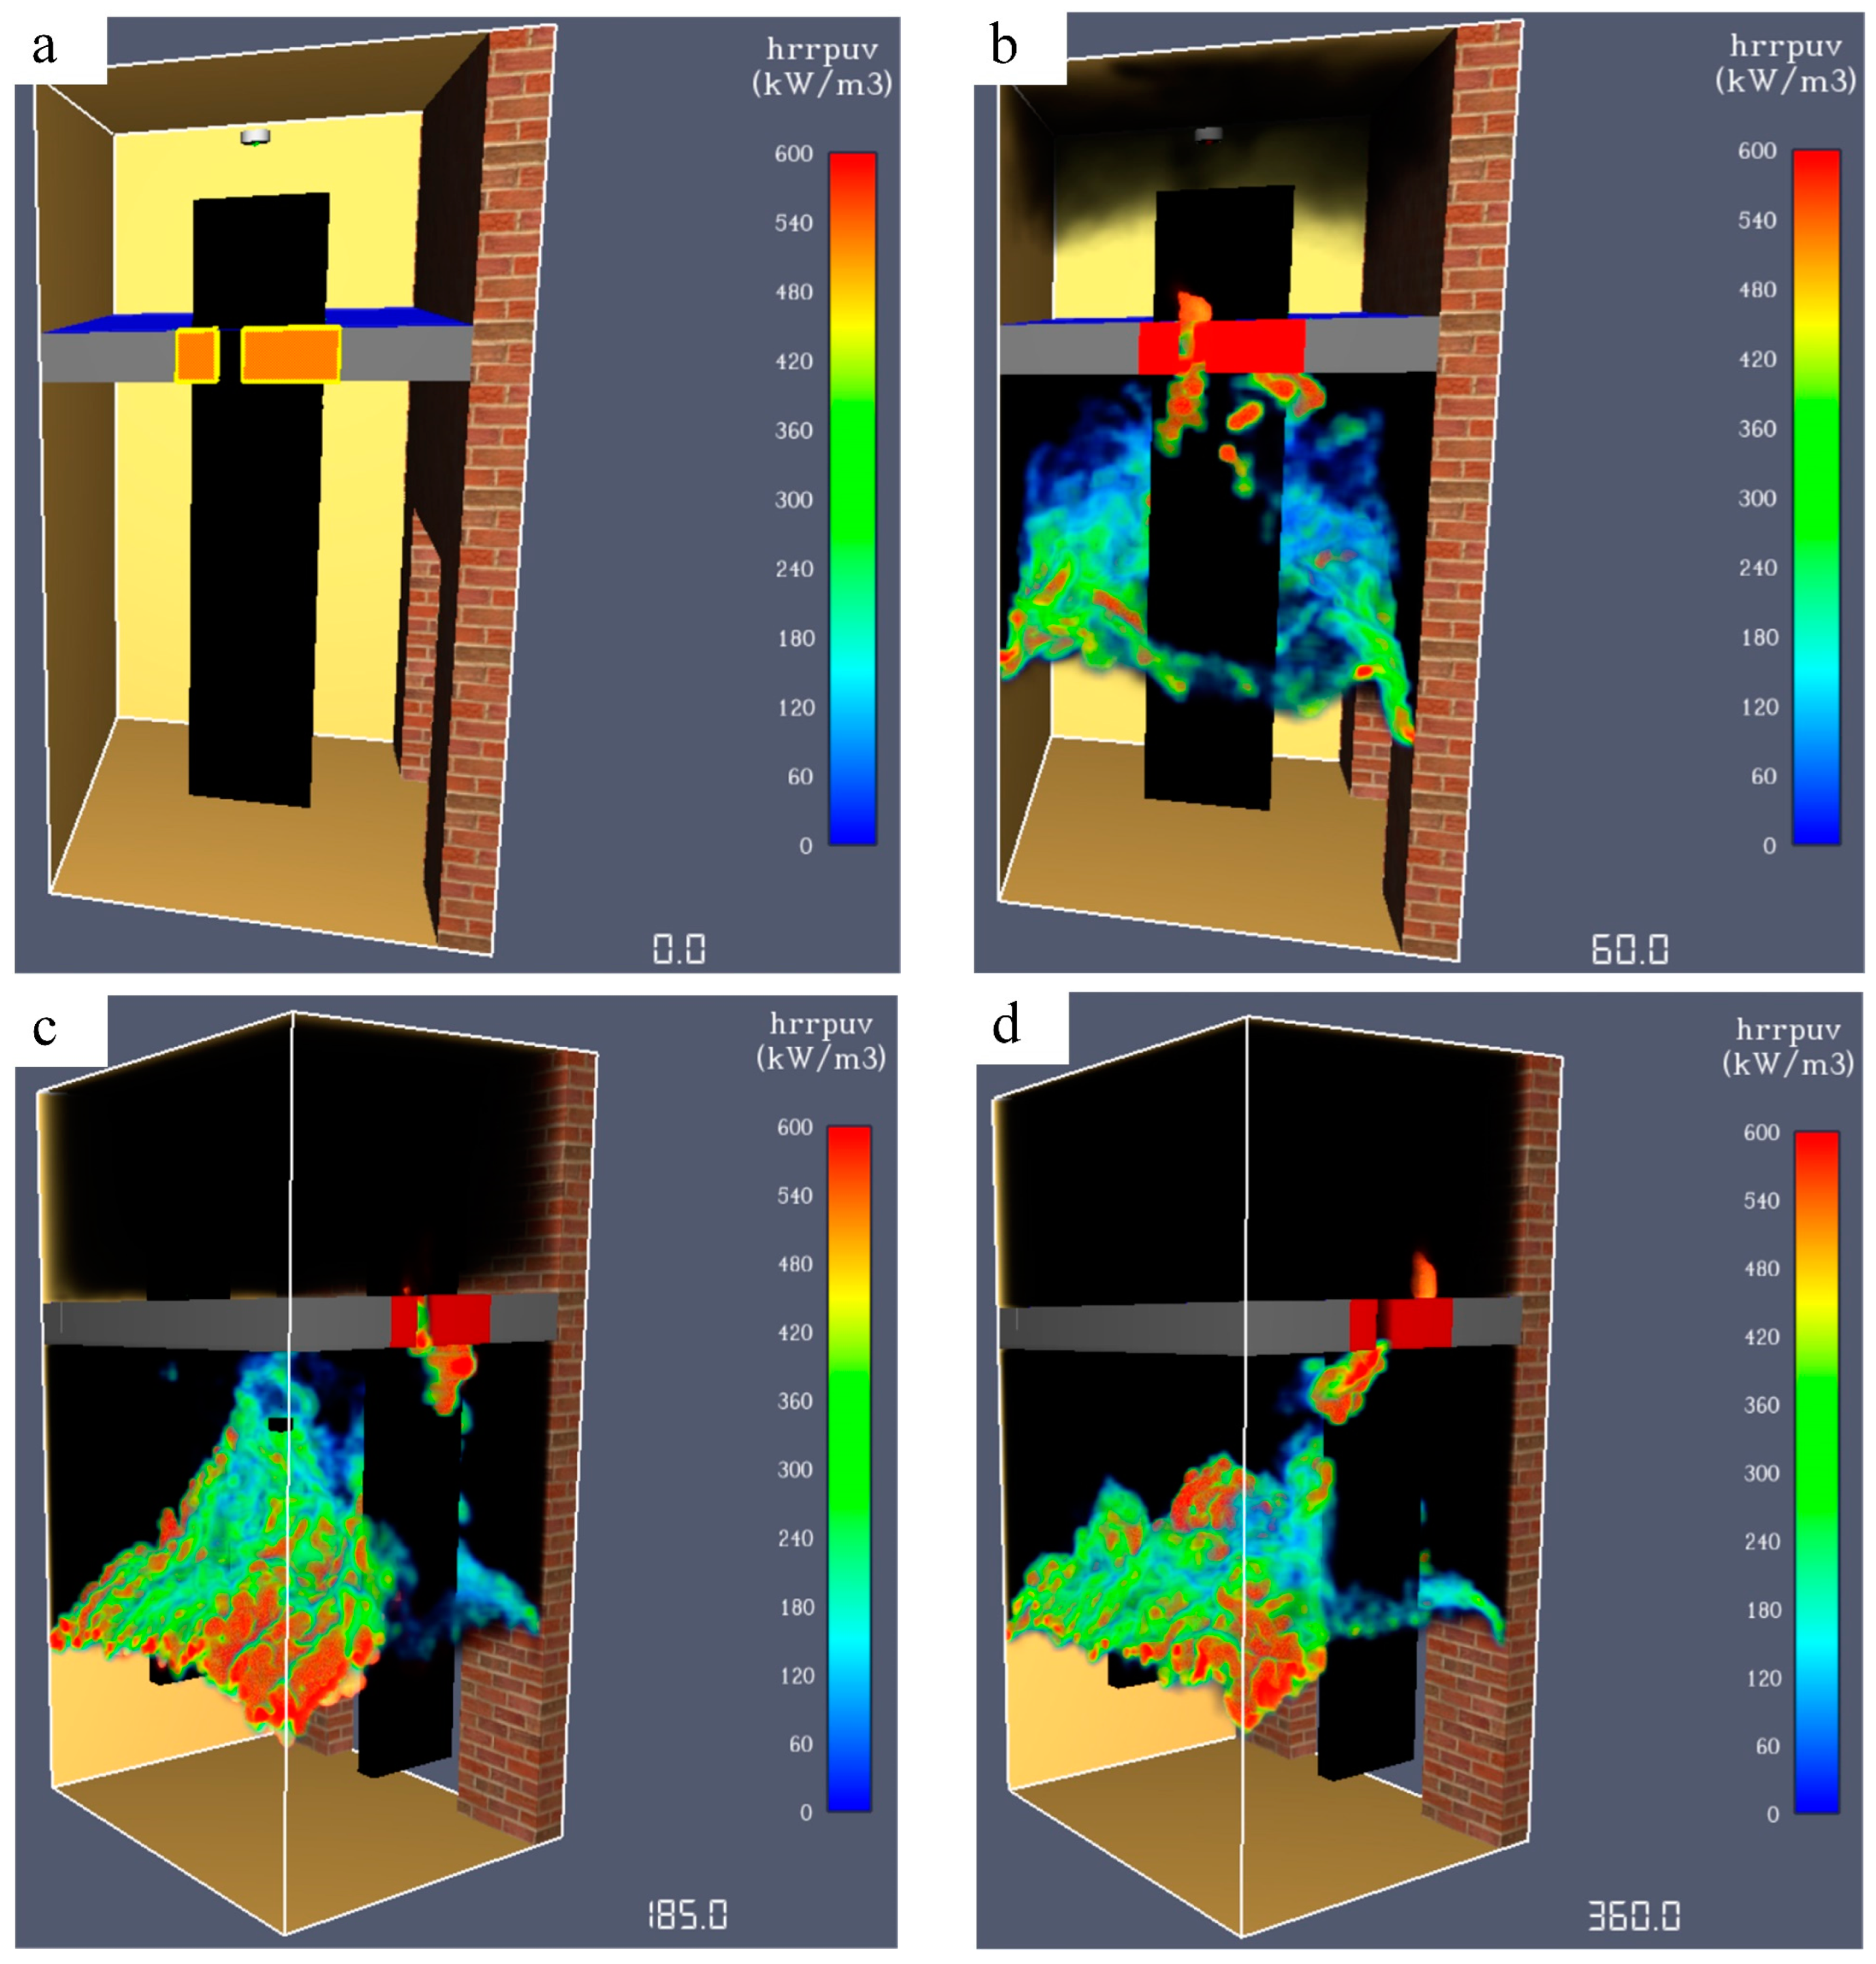
3.2.1. Comparison between Simulation and Experimental Results

The simulation results of the temperature trend in the lower space in the cable shaft and a comparison with the experimental results are shown in Figure 13. Due to the limited computing resources, the simulation only lasted 60 min. By comparing the simulation and experimental results, the following conclusions can be drawn:
  • The temperature trends of both the simulation and experimental results were stable after rapid heating; however, compared with the simulation results, the temperature change curve of the fire test results is more unstable and the heating rate is slower.
  • The temperature trend of the lower space obtained by simulation is similar to that obtained by fire test, but the temperature fluctuations obtained by the fire test are larger.
  • The temperatures of both the simulation and experimental results show a stratification phenomenon from bottom to top. This is because the fire source was arranged in the middle of the cable, and the flame spread upward during the combustion of the cable.
  • The simulation temperature remained stable after rapid heating. In order to further save on simulation time, the subsequent simulation was only taken in the first 10 min.
In the fire test, the change in gas concentration in the lower space was not collected due to the limitations of the experimental conditions. Therefore, the concentration trends of oxygen, carbon dioxide, soot, and smoke in the lower space during the fire’s progression were explored in the simulation; the simulation results are shown in Figure 14. As can be seen, the changes in oxygen concentration and carbon dioxide concentration show opposite trends. After a period of simulation, the concentration of the two kinds of gas tends to be stable. Additionally, the soot and smoke concentrations increase rapidly at the initial stage of the reaction, and no longer change after reaching the saturation concentrations.

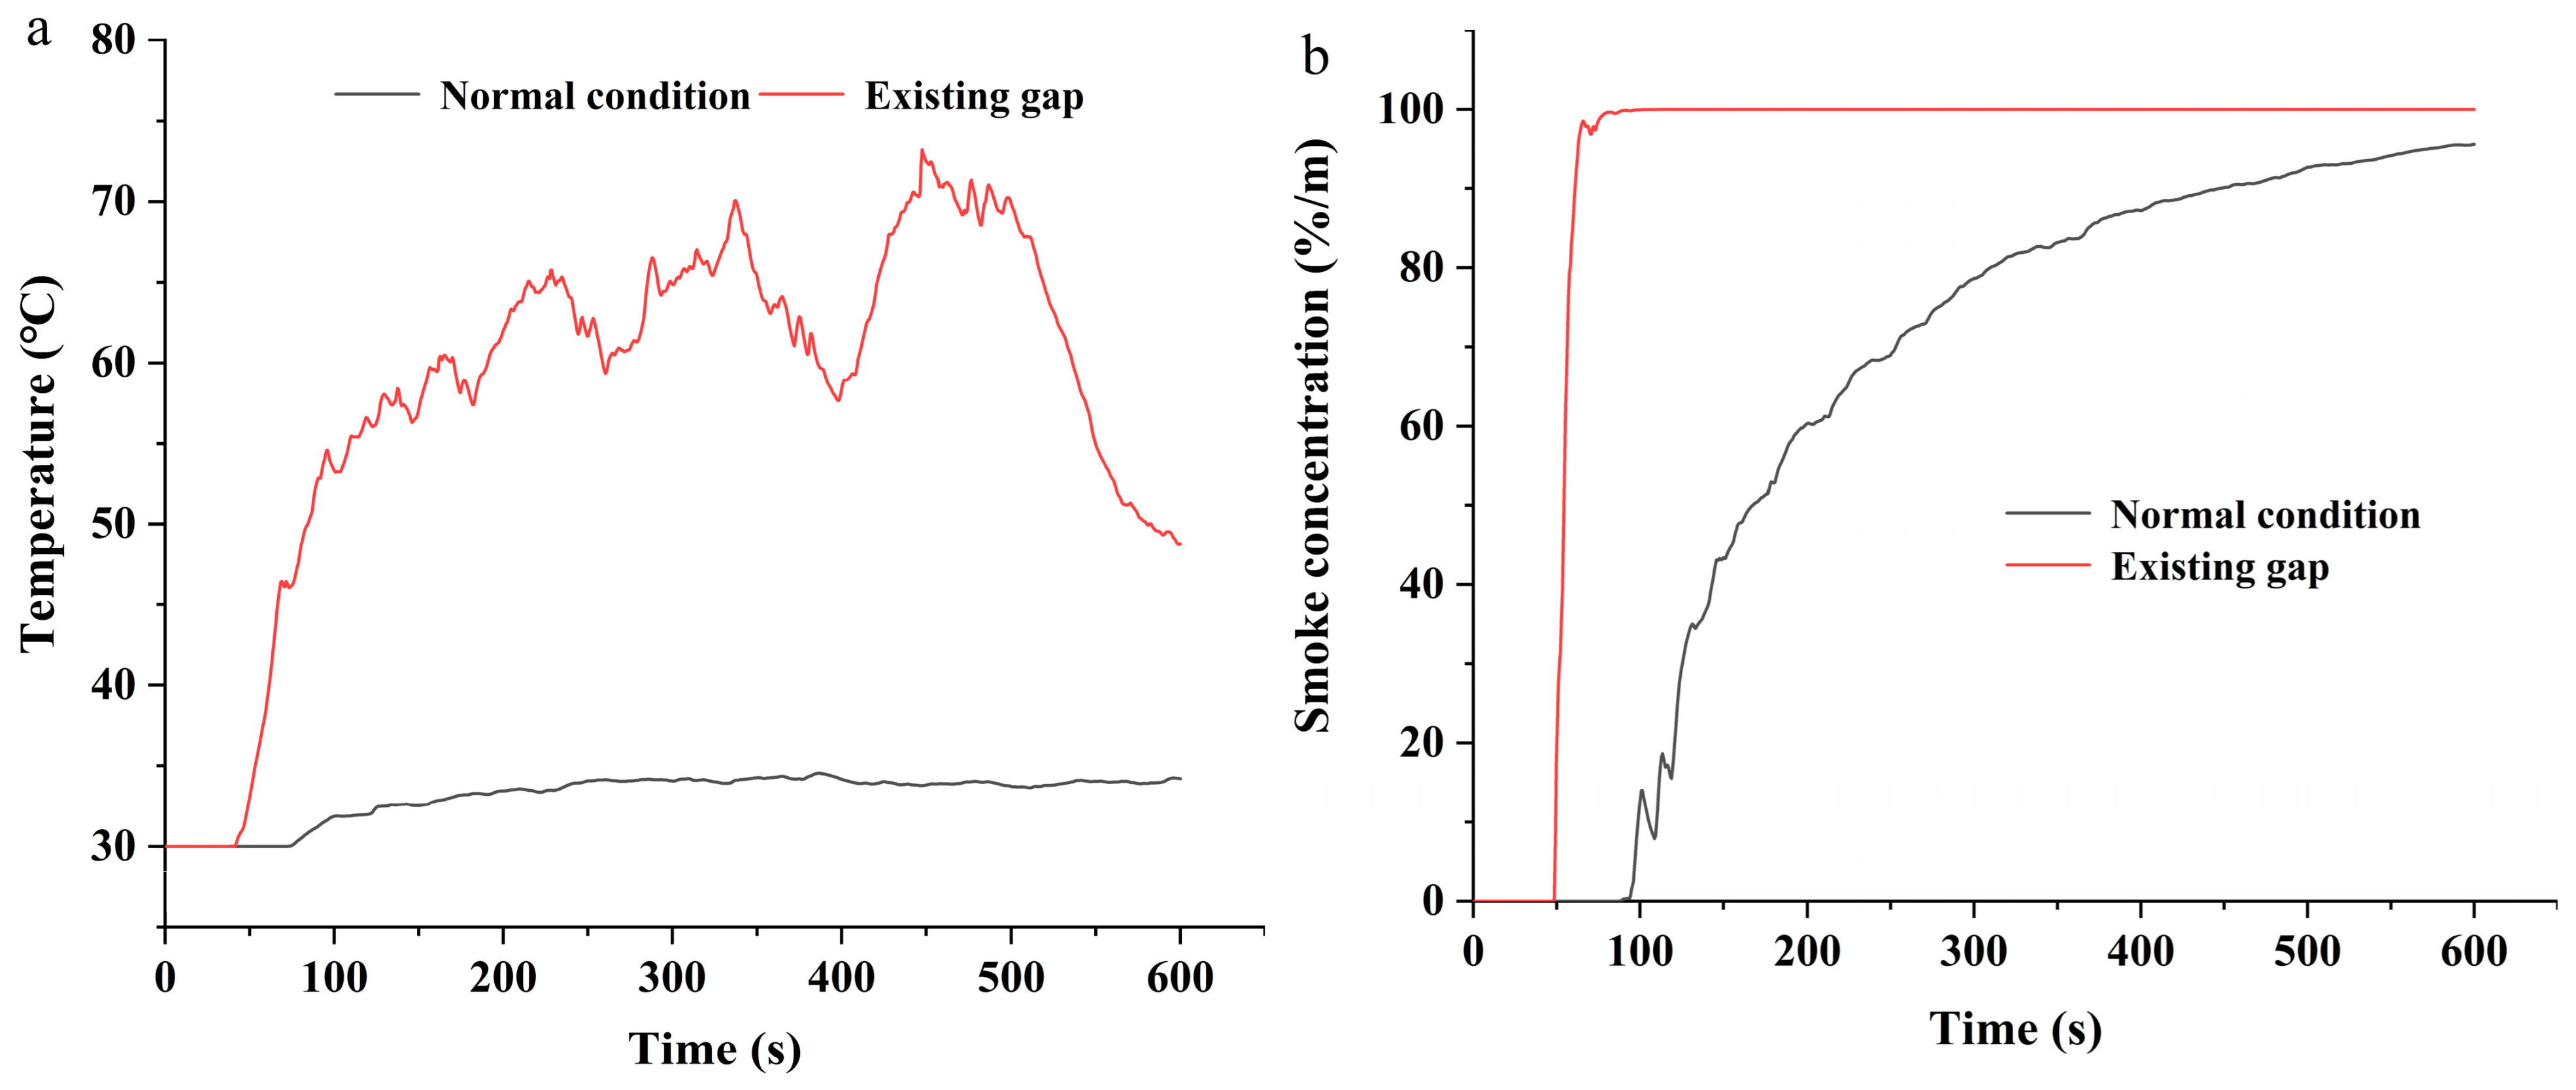
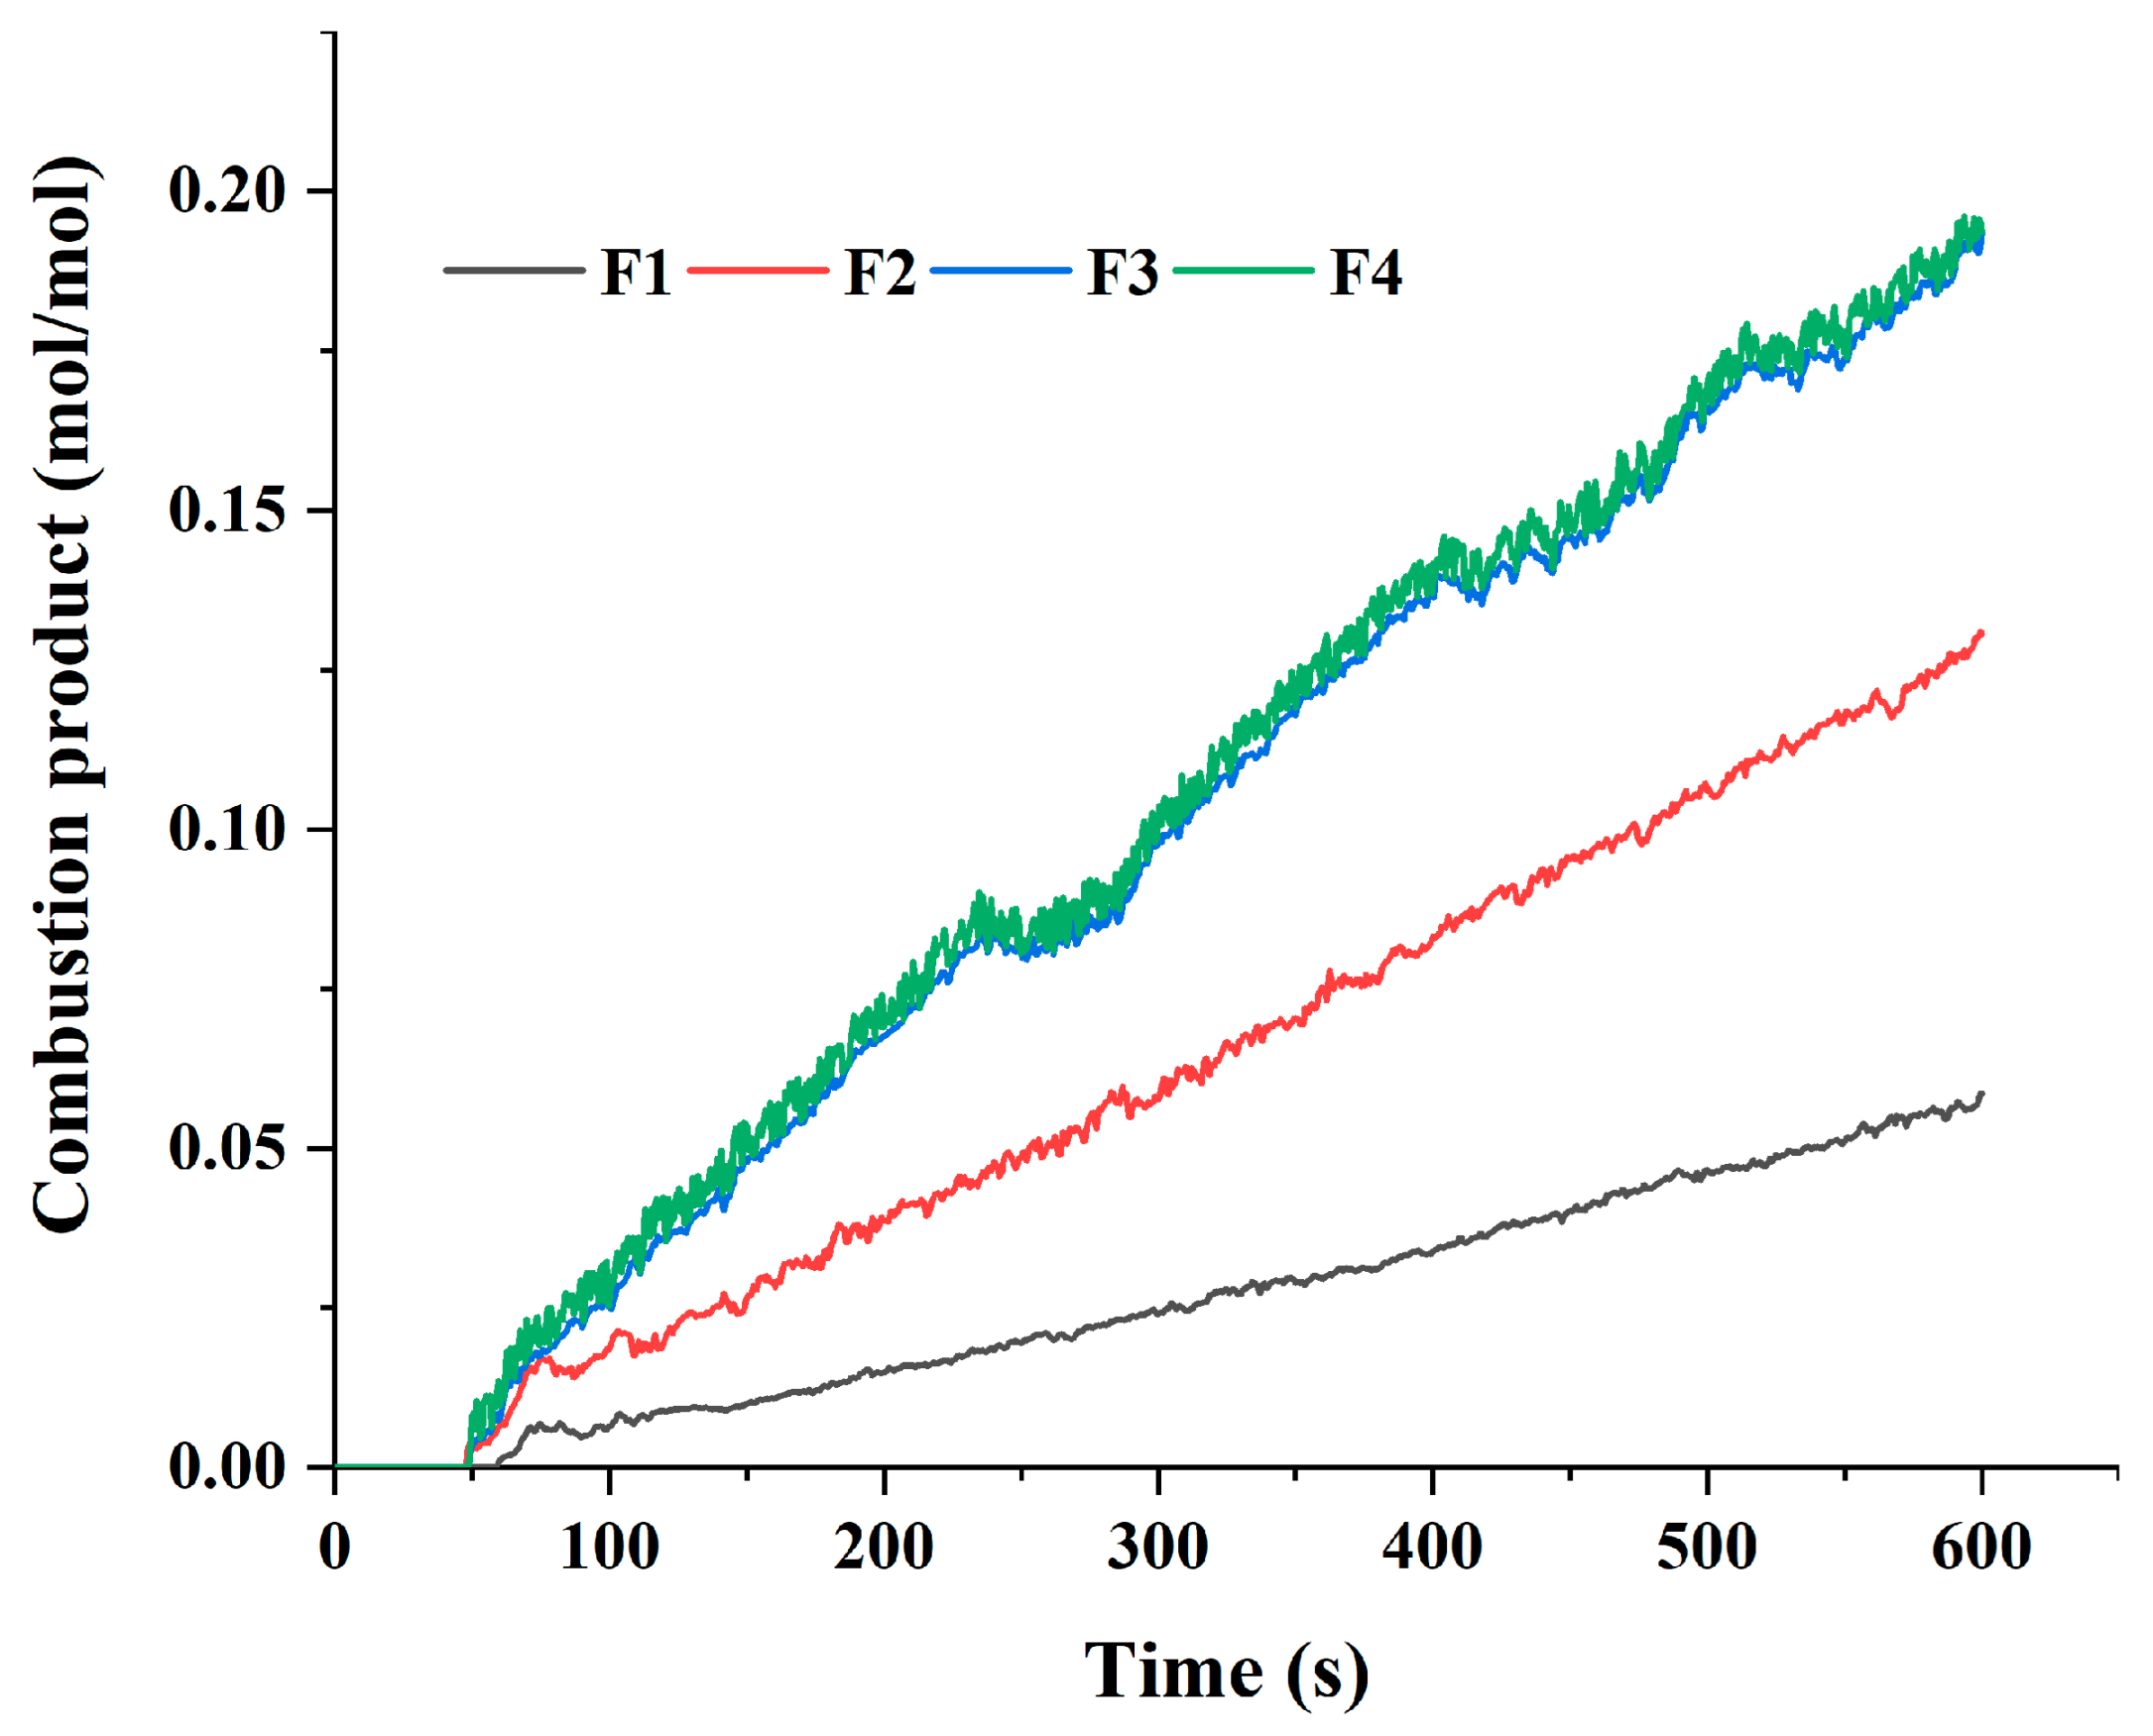
3.2.2. The Influence of Gap Size on Fire Spread

Due to the effect of environmental factors such as a high temperature and high humidity, the fireproof sealing system may crack after long-term operation. In the simulation, the influence of the gap on the temperature field distribution and smoke propagation during fires is discussed through a comparison with the fireproof sealing system under normal operating conditions. The simulation results are shown in Figure 15. As can be seen, under normal working conditions, the increase in temperature and smoke concentration in the space above the cable shaft fireproof sealing system is less than the results obtained when a gap is present. When a fire occurs in the cable shaft, the fireproof sealing system is one line of defense to slow down the spread of fire, and the existence of a gap provides a channel for the propagation of temperature and smoke, which reduces the fire-blocking ability of the cable shaft fireproof sealing system.
To further explore the effect of a fireproof sealing gap size on fire spread, four different gap sizes were set up, as follows: F1 (25 mm × 25 mm × 200 mm), F2 (50 mm × 50 mm × 200 mm), F3 (75 mm × 75 mm × 200 mm), and F4 (100 mm × 100 mm × 200 mm). The temperature and smoke concentration data during the simulation process were obtained using thermocouples and smoke sensors arranged in the upper space of the cable shaft, and the results are shown in Figure 16.
As shown in Figure 16a, as the gap size increases, the temperature of the upper space increases more rapidly. When the gap size increases from F1 to F2, the temperature increase is the most obvious. As the gap size continues to increase, the rising temperature trend slows down. As shown in Figure 16b, the upward trend of the smoke concentration in the upper space is the same as the temperature trend, and this large gap causes the smoke concentration to reach the saturation point more quickly.
During the fire process of the cable shaft, in addition to the heat release, a variety of products are also produced, such as hydrogen chloride, sulfur dioxide, and other gases that are extremely harmful to the body. The simulation results of a particular product concentration with different gap sizes are shown in Figure 17. It can be found that the product concentration increases with the increase in gap size. However, when the gap size increases from F3 to F4, the increase in the product concentration is not significant, which indicates that the effect of gap size approaches a saturation point.
Figure 18 shows the flame spread trend when the sealing gap size is F4. As can be seen, flame and smoke will eventually enter the upper space through the gaps between the fireproof sealing layer and the cable. The smoke volume occupies about half of the upper space at 60 s, and the whole space is filled at 185 s. When the time reaches 336 s, the cable in the whole upper space reaches a stage of fierce combustion. Therefore, in the design and construction of a cable shaft, ensuring that the sealing layer is bonded and wrapped without gaps can effectively reduce the risk of cable shaft fire.

4. Conclusions

In this study, an entity test platform was built to allow for a performance comparison of cable shaft fireproof sealing systems in high-rise buildings. By monitoring the temperature, humidity, and smoke mass trends during a fire test, the performance of four cable shaft fireproof sealing systems was compared and analyzed. Furthermore, an FDS of the fireproof sealing system was carried out on the entity test platform to reveal the process of sealing failure and explore the effect of gap size on the spread of fire in a cable shaft. The following conclusions are drawn:
  • The experimental results of the performance comparison show that fireproof sealing system A loses its thermal insulation at 160 min, and the system was shown to lose its integrity after the fire test via observations of the unexposed surface state. In contrast, the other three fireproof sealing systems did not lose their integrity and thermal insulation capacity throughout the test.
  • The smoke sealing capacity ranking of the four fireproof sealing systems in the first 110 min is D > C > B > A. An analysis of the thermal insulation, smoke sealing capacity, and integrity of the fireproof sealing systems shows that the performance of the four fireproof sealing systems can be ranked as D > C > B > A.
  • The simulation results of the temperature trend in the lower space conform with the fire test results. Furthermore, the simulation results show that the speed of fire spread increases with an increase in gap size.
  • The test and simulation results show that the performance of cable shaft fireproof sealing systems in high-rise buildings depends not only on the sealing material, but also on the construction process.
The results of this study can provide new research ideas for a performance comparison and a better understanding of the failure process of cable shaft fireproof sealing systems. In future research, the following two improvements can be considered: enriching the types of fireproof sealing system schemes, sensor categories, and fire source power control strategies used in the entity test platform will make the fire test results more scientific and reasonable; improving the fire source setting method in the numerical simulation of a cable shaft fire and increasing the number of fire sources, the fire situation can be considered in multiple locations and time intervals, resulting in simulation outcomes that better align with real-world engineering.

Author Contributions

Writing—original draft preparation, B.Z., Z.Z. and B.Q.; writing—review and editing, S.S.; visualization, X.L., X.X. and S.X.; supervision, B.Q. All authors have read and agreed to the published version of the manuscript.

Funding

This work was supported by the National Natural Science Foundation of China (no. 52207150).

Institutional Review Board Statement

Not applicable.

Informed Consent Statement

Not applicable.

Data Availability Statement

The data presented in this study are available upon request from the corresponding authors.

Conflicts of Interest

The authors declare no conflicts of interest.

References

  1. Ma, Q.; Guo, W. Discussion on the fire safety design of a high-rise building. Procedia Eng. 2012, 45, 685–689. [Google Scholar] [CrossRef]
  2. Si, G. China’s high-rise buildings fire. Fire Sci. Technol. 2010, 29, 863–870. [Google Scholar] [CrossRef]
  3. Chow, W. Numerical studies on recent large high-rise building fire. J. Archit. Eng. 1998, 4, 65–74. [Google Scholar] [CrossRef]
  4. Hong, S.; Lu, S.; Peng, L. Experimental study on perimeter fire barrier of a super-high building’s glass curtain wall. Fire Sci. Technol. 2018, 37, 605–608. [Google Scholar] [CrossRef]
  5. Yan, Z.; Hu, H.; Gao, L. Experimental research on fire-proof sealing material for a new kind of cable shaft. Eng. Constr. 2013, 45, 15–18. [Google Scholar] [CrossRef]
  6. GB/T 51410-2020; Technical Standard for Application of Firestop in Buildings. Ministry of Emergency Management of the People’s Republic of China; China Planning Press: Beijing, China, 2020.
  7. GB/T 23864-2009; Firestop Material. Standardization Administration of the People’s Republic of China; China Standard Press: Beijing, China, 2009.
  8. GB/T 9978.1-2008; Fire Resistance Tests-Elements of Building Construction—Part 1: General Requirements. Standardization Administration of the People’s Republic of China; China Standard Press: Beijing, China, 2008.
  9. DL/T 5707-2014; Construction Workmanship Guide for Cable Fireproof Sealing of Electrical Engineering. National Energy Administration; China Electric Power Press: Beijing, China, 2014.
  10. NB/T 20049-2011; Cable-Penetration Fire Stop Qualification Test. National Energy Administration; China Atomic Energy Press: Beijing, China, 2011.
  11. ASTM E814; Standard Test Method for Fire Tests of Penetration Fire Stopping Systems. ASTM International: West Conshohocken, PA, USA, 2023.
  12. ASTM E119; Standard Test Methods for Fire Tests of Building Construction and Materials. ASTM: West Conshohocken, PA, USA, 2012.
  13. National Fire Protection Association. NFPA 251, Standard Methods of Test of Fire Endurance of Building Construction and Materials, 2006th ed.; National Fire Protection Association: Quincy, MA, USA, 2006. [Google Scholar]
  14. EN 13501-1; Fire Classification of Construction Products and Building Elements—Part 1: Classification Using Test Data from Reaction to Fire Tests. European Committee for Standardization: Brussels, Belgium, 2018.
  15. EN 13501-2; Fire Classification of Construction Products and Building Elements—Part 2: Classification Using Data from Fire Resistance Tests, excluding Ventilation Services. European Committee for Standardization: Brussels, Belgium, 2023.
  16. Huang, P.; Qin, L.; Yu, L.; Chen, S.; Lin, Y.; Huang, L. Temperature field distribution of cable tray fire in utility tunnel. J. Fuzhou Univ. (Nat. Sci. Ed.) 2021, 49, 544–550. [Google Scholar] [CrossRef]
  17. Huang, X.; Zhu, H.; Peng, L.; Zheng, Z.; Zeng, W.; Cheng, C.; Chow, W. An improved model for estimating heat release rate in horizontal cable tray fires in open space. J. Fire Sci. 2018, 36, 275–290. [Google Scholar] [CrossRef]
  18. Huang, X.; Zhu, H.; Peng, L.; Zheng, Z.; Zeng, W.; Bi, K.; Cheng, C.; Chow, W. Thermal characteristics of vertically spreading cable fires in confined compartments. Fire Technol. 2019, 55, 1849–1875. [Google Scholar] [CrossRef]
  19. Martinka, J.; Rantuch, P.; Sulová, J.; Martinka, F. Assessing the fire risk of electrical cables using a cone calorimeter. J. Therm. Anal. Calorim. 2018, 135, 3069–3083. [Google Scholar] [CrossRef]
  20. Li, L.; Huang, X.; Bi, K.; Liu, X. An enhanced fire hazard assessment model and validation experiments for vertical cable trays. Nucl. Eng. Des. 2016, 301, 32–38. [Google Scholar] [CrossRef]
  21. Gallo, E.; Stocklein, W.; Klack, P.; Schartel, B. Assessing the reaction to fire of cables by a new bench-scale method. Fire Mater. 2017, 41, 768–778. [Google Scholar] [CrossRef]
  22. Meinier, R.; Sonnier, R.; Zavaleta, P.; Suard, S.; Ferry, L. Fire behavior of halogen-free flame retardant electrical cables with the cone calorimeter. J. Hazard. 2018, 342, 306–316. [Google Scholar] [CrossRef] [PubMed]
  23. Magalie, C.; Anne-Sophie, C.; Rodolphe, S.; Laurent, F.; Emmanuelle, G.; Christian, L. Fire behaviour of electrical cables in cone calorimeter: Influence of cables structure and layout. Fire Saf. Sci. 2018, 99, 12–21. [Google Scholar] [CrossRef]
  24. Zavaleta, P.; Audouin, L. Cable tray fire tests in a confined and mechanically ventilated facility. Fire Mater. 2018, 42, 28–43. [Google Scholar] [CrossRef]
  25. Zavaleta, P.; Hanouzet, R.; Beji, T. Improved assessment of fire spread over horizontal cable trays supported by video fire analysis. Fire Technol. 2019, 55, 233–255. [Google Scholar] [CrossRef]
  26. Li, W. Study on the Numerical Simulation of the Fire from the Integrated Pipe Trench Cable. Master’s Thesis, Capital University of Economics and Business, Beijing, China, 2012. [Google Scholar]
  27. Ma, W. Numerical Simulation of Cable Combustion Process in Urban Underground Utility Tunnel under Internal Heat Source. Master’s Thesis, Zhengzhou University, Zhengzhou, China, 2021. [Google Scholar]
  28. Bari, S.; Naser, J. Simulation of airflow and pollution levels caused by severe traffic jam in a road tunnel. Tunn. Undergr. Space Technol. 2010, 25, 70–77. [Google Scholar] [CrossRef]
  29. Zhang, Y.; He, L.; Ren, F.; Li, J. Experimental and simulation study on cable fire extinguishing by smothering in utility tunnel. J. Saf. Sci. Technol. 2023, 19, 173–179. [Google Scholar] [CrossRef]
  30. Plumecocq, W.; Audouin, L.; Zavaleta, P. Horizontal cable tray fire in a well-confined and mechanically ventilated enclosure using a two-zone model. Fire Mater. 2019, 43, 530–542. [Google Scholar] [CrossRef]
  31. Liu, G.; Hao, Y.; Li, G.; Li, G. Research on fire detection experiment and numerical simulation of cable trench in substation. Fire Sci. Technol. 2022, 41, 1683–1687. [Google Scholar] [CrossRef]
  32. Kunsch, J. Critical velocity and range of a fire-gas plume in a ventilated tunnel. Atmos. Environ. 1998, 33, 13–24. [Google Scholar] [CrossRef]
  33. Matala, A.; Hostikka, S. Probabilistic simulation of cable performance and water based protection in cable tunnel fires. Nucl. Eng. Des. 2011, 241, 5263–5274. [Google Scholar] [CrossRef]
  34. Roh, J.; Yang, S.; Ryou, H.; Yoon, M.; Jeong, Y. An experimental study on the effect of ventilation velocity on burning rate in tunnel fires—Heptane pool fire case. Build Environ. 2008, 43, 1225–1231. [Google Scholar] [CrossRef]
  35. Blanchard, E.; Boulet, P.; Desanghere, S.; Cesmat, E.; Meyrand, R.; Garo, J.; Vantelon, J. Experimental and numerical study of fire in a midscale test tunnel. Fire Saf. J. 2012, 47, 18–31. [Google Scholar] [CrossRef]
  36. Zeng, Q.; Wen, S.; Chen, F.; Zhu, G. Research on numerical simulation of large warehouse cable fire based on FDS. Guangdong Chem. Ind. 2021, 48, 64–68. [Google Scholar] [CrossRef]
  37. Wang, Y. Study on the Parameters and Process of Liquefied Petroleum Gas Mixed Air Mixed Gas. Master’s Thesis, Shandong University, Jinan, China, 2005. [Google Scholar]
  38. Warzoha, R.; Wilson, A.; Donovan, B.; Donmezer, N.; Hopkins, A.; Choi, S.; Pahinkar, D.; Shi, J.; Graham, S.; Tian, Z.; et al. Applications and impacts of nanoscale thermal transport in electronics packaging. J. Electron. Packag. 2021, 143, 020804. [Google Scholar] [CrossRef]
  39. Sheremet, M.; Rashidi, M. Thermal convection of nano-liquid in an electronic cabinet with finned heat sink and heat generating element. Alex. Eng. J. 2021, 60, 2769–2778. [Google Scholar] [CrossRef]
  40. Wang, Q.; Lohse, D.; Shishkina, O. Scaling in internally heated convection: A unifying theory. Geophys. Res. Lett. 2021, 48, e2020GL091198. [Google Scholar] [CrossRef]
  41. Mannix, P.; Mestel, A. Bistability and hysteresis of axisymmetric thermal convection between differentially rotating spheres. J. Fluid Mech. 2021, 911, A12. [Google Scholar] [CrossRef]
  42. Ilyas, H.; Ahmad, I.; Raja, M.; Shoaib, M. A novel design of Gaussian WaveNets for rotational hybrid nanofluidic flow over a stretching sheet involving thermal radiation. Int. Commun. Heat Mass Transf. 2021, 123, 105196. [Google Scholar] [CrossRef]
  43. Narayana, P.; Tarakaramu, N.; Sarojamma, G.; Animasaun, I. Numerical simulation of nonlinear thermal radiation on the 3D flow of a couple stress casson nanofluid due to a stretching sheet. J. Thermal Sci. Eng. Appl. 2020, 13, 021028. [Google Scholar] [CrossRef]
  44. Abbas, A.; Ashraf, M.; Chamkha, A. Combined effects of thermal radiation and thermophoretic motion on mixed convection boundary layer flow. Alex. Eng. J. 2021, 60, 3243–3252. [Google Scholar] [CrossRef]
  45. Shao, G. The Design of Simulation System for Tunnel Fire. Master’s Thesis, Shanghai Jiao Tong University, Shanghai, China, 2006. [Google Scholar]
  46. Xu, X.; Zhu, G.; Zhang, X.; Chai, G.; Chu, T. Numerical study on temperature distribution of tunnel structure in fires. Case Stud. Therm. Eng. 2021, 25, 100874. [Google Scholar] [CrossRef]
  47. Li, X. Study on the Law of Fire Spread in Cable Shaft and the Improvement Method of Fire Blocking. Master’s Thesis, Nanchang University, Nanchang, China, 2023. [Google Scholar]
  48. Nam, S.; Yee, G. Evaluating firestops as a smoke seal. Fire Technol. 2012, 48, 291–311. [Google Scholar] [CrossRef]
Figure 1. Entity test platform: (a) schematic diagram; (b) pictures.
Fire 07 00102 g001
Figure 2. Pictures of the entity test platform: (a) before fireproof sealing; (b) after fireproof sealing.
Fire 07 00102 g002
Figure 3. Arrangement of thermocouples: (a) thermocouple tree; (b) SMD thermocouples distribution on the unexposed surface of a fireproof sealing system.
Fire 07 00102 g003
Figure 4. Fire combustion process: (a) non-fire stage; (b) initial stage of fire; (c) intense stage of fire.
Fire 07 00102 g004
Figure 5. Heating curve of fire test.
Fire 07 00102 g005
Figure 6. Modeling method: (a) simulation model; (b) sensor location.
Fire 07 00102 g006
Figure 7. The temperature trend in the lower space of the entity test platform: (a) first test; (b) second test.
Fire 07 00102 g007
Figure 8. The temperature trend in the upper space of the entity test platform: (a) first test; (b) second test.
Fire 07 00102 g008
Figure 9. The humidity trend in the upper space of the entity test platform: (a) first test; (b) second test.
Fire 07 00102 g009
Figure 10. The temperature rises on the unexposed surface of different fireproof sealing systems.
Fire 07 00102 g010
Figure 11. The smoke mass trend in the upper space of the entity test platform.
Fire 07 00102 g011
Figure 12. State diagrams of the unexposed surface of fireproof sealing systems after fire test: (a) fireproof sealing A; (b) fireproof sealing B; (c) fireproof sealing C; (d) fireproof sealing D.
Fire 07 00102 g012
Figure 13. The temperature trend in the lower space: (a) simulation results; (b) comparison of the results of the simulation and test.
Fire 07 00102 g013
Figure 14. The concentration trends of soot, carbon dioxide, oxygen, and smoke in the lower space: (a) soot, carbon dioxide, and oxygen concentration; (b) smoke concentration.
Fire 07 00102 g014
Figure 15. The trends of temperature and smoke concentration in the upper space under normal and existing gap conditions: (a) temperature; (b) smoke concentration.
Fire 07 00102 g015
Figure 16. The trends of temperature and smoke concentration in the upper space under different gap sizes: (a) temperature; (b) smoke concentration.
Fire 07 00102 g016
Figure 17. The trends in combustion product concentration in the upper space with different gap sizes.
Fire 07 00102 g017
Figure 18. Flame spread trend under F4 size: (a) 0 s; (b) 60 s; (c) 185 s; (d) 336 s.
Fire 07 00102 g018
Table 1. Sealing materials of four sets of fireproof sealing systems.
Fireproof Sealing System NumberFireproof Sealing Material 1ModelMaterial Property 2
Combustion PerformanceFire
Resistance (h)
Apparent Density (kg/m3)CR (d)WOR (d)AAR (h)HHR (h)FTR (times)
AFBCS195+A141500732412015
FMMP+HB41800
FS1000NSHB31600
FTFS195+V-021200
FCFD2000V-02650
BFBSSSGB01A141500732412015
FMHYYFDHB41800
FSSSSTJ01HB31600
FTSSSBD01V-021200
FCSSSDL01V-02650
FPSSSZB01V-031000
CFBKC8001A231250732412015
FMKC7000HB31600
FSKC1002HB31650
FTKC77V-031300
FCKC2000V-02500
DFBKC8000A231250732412015
FMKC7000HB31600
FSKC1002HB31650
FTKC77V-031300
FCKC2000V-02500
1 FB = fireproof board; FM = fireproof mud; FS = fireproof sealant; FT = fireproof tape; FC = fireproof coating; FP = fireproof packet. 2 CR = corrosion resistance; WOR = water and oil resistance; AAR = acid and alkali resistance; HHR = heat and humidity resistance; FTR = freeze–thaw resistance.
Table 2. Material parameters.
Material TypeDensity (kg/m3)Specific Heat
Capacity (kJ/(kg∙K))
Heat Conductivity (W/(m∙K))
Fireproof Mud2000.01.500.08
Concrete2280.01.051.80
Fireproof Brick750.01.040.10
Polyvinyl Chloride1380.01.000.10
Epoxy Resin Board1600.01.022.58
Magnesium Oxide Board1000.01.350.11
Disclaimer/Publisher’s Note: The statements, opinions and data contained in all publications are solely those of the individual author(s) and contributor(s) and not of MDPI and/or the editor(s). MDPI and/or the editor(s) disclaim responsibility for any injury to people or property resulting from any ideas, methods, instructions or products referred to in the content.

