Article

Exploring Tree Density Increases after Fire Exclusion in the Northern Front Range and Great Plains, Colorado, USA

1
USDA Forest Service, Rocky Mountain Research Station, Rapid City, SD 57701, USA
2
USDA Forest Service, Rocky Mountain Research Station, Missoula, MT 59808, USA
3
USDA Forest Service, Rocky Mountain Research Station, Prescott, AZ 86303, USA
*
Author to whom correspondence should be addressed.
Fire 2024, 7(4), 103; https://doi.org/10.3390/fire7040103
Submission received: 29 January 2024 / Revised: 18 March 2024 / Accepted: 19 March 2024 / Published: 22 March 2024
(This article belongs to the Special Issue Effects of Fires on Forest Ecosystems)

Abstract

:
Since Euro-American settlement and associated fire exclusion, grasslands and open forests have converted to forests throughout the United States. Contributing to the weight of evidence, we determined if forestation also occurred in forests and grasslands of Colorado. Our study extent encompassed landscapes of the 0.5 million ha Arapaho and Roosevelt National Forests in the northern Front Range (eastern side) of the southern Rocky Mountains and the 1 million ha Weld County, which contains Pawnee National Grassland, in the Great Plains grasslands. We quantified tree composition, cover, and densities from historical (years 1863 to 1886) tree surveys, current surveys (2002 to 2011), and land cover (2016) to identify departures. In the Arapaho and Roosevelt, historical lack of tree presence and overall low tree densities suggested an open landscape, due to about 70% of 7134 survey points without two trees within 60 m. The treed landscape, which was not continuously forested, had density estimates of about 153 trees/ha. In contrast, the current landscape was 68% forested with high tree densities; fire-dependent pines decreased relative to subalpine fir (Abies lasiocarpa) increases. In Weld County, seven trees were surveyed historically, whereas currently, woody cover totaled 2555 ha. Uniquely applying historical surveys at landscape scales, we documented an open landscape in the northern Front Range, unlike previous research, and rare tree presence in the relatively understudied grasslands of Colorado. Forestation corresponded with changes in U.S. grasslands and forests following Euro-American settlement and associated fire exclusion.

1. Introduction

Globally, following European colonization and attendant land uses changes including fire exclusion, trees have increased in density within forests and expanded into grasslands and savannas, particularly through increases and expansion of fire-sensitive tree species [1,2,3,4,5]. Composition and structure of ecosystems throughout many regions of the United States historically were determined by fire history, likely stabilized by native large herbivores [5,6,7,8]. In the eastern U.S., historical accounts noted rapid tree growth as early as the year 1635 after European colonization [9]. According to historical accounts, trees began to expand into the Great Plains grasslands of central North America starting about 1860, trailing Euro-American settlement [10]. In the western U.S., numerous studies have established increased tree densities in historically open forests of ponderosa pine (Pinus ponderosa; [5,11,12]). Trees have continued to increase in density and diversity in wildlands since the 1800s.
In contrast to research that typically features montane and subalpine forests in the southern Rocky Mountains of north-central Colorado, presenting an overall forested landscape [13,14,15], historical assessments communicated an open landscape. The regional landscape was highly variable, yet generally featured timberless mountain grasslands with limited areas of dense tree growth, based on early assessments [16,17,18]. On the eastern side of the southern Rocky Mountains, known as the Front Range, lower elevation south-facing slopes were almost bare of tree cover, aside from scattered ponderosa pine, while the opposite northern slopes contained Douglas-fir (Pseudotsuga menziesii) and ponderosa pine [17]. At higher elevations (>3000 m), forest growth was most dense, but whereas the northern slopes were covered predominantly with Engelmann spruce (Picea engelmannii), the southern slopes contained low tree densities of spruce or high-elevation pine species, of which lodgepole pine was most abundant; subalpine fir (Abies lasiocarpa) was rare [17]. Quaking aspen (Populus tremuloides) occurred throughout most elevations, with no particular dominance, often in a suppressed shrub form [17,18]. At lower elevations, shrublands or brushlands occurred in the foothills and then in the Great Plains grasslands, cottonwood trees (Populus deltoides) bordered streams [13,17,19].
In the mountains of the western U.S., fire regimes varied along environmental gradients, with fire frequency decreasing in protected high-elevation locations, which influenced patterns of tree species and densities [12,15]. Historically, on the eastern side of the southern Rocky Mountains, Jack [17] stated that signs of fire were evident over about 75% of a 425,000 ha assessed extent, excepting some small areas at higher elevations where spruce occurred. Although rough topography reduces the size of fire compartments, fires spread 32 km in length with a width of 10 km in the mountains [17]. Fire frequency likely increased with human activities during the initial phase of Euro-American settlement, which was a common pattern [17,20]. Fire exclusion ensued after disruption of fuels and fire compartments due to land use changes associated with Euro-American settlement, along with active fire suppression [5,10,11].
Land use changed in the Front Range region about 1860, following rapid Euro-American settlement due to discovery of gold [13,20]. Subsequently, the combination of wagon roads, portable steam sawmills, railroads, and markets of local populations were in place for localized and selective harvesting [13,16,17,20]. Jack [17] estimated that by 1899, the most accessible, lower elevation sites within a day’s journey to local markets or railroad stations had been visited two or even three times to harvest large diameter (greater than 30 cm) ponderosa pine, Douglas-fir, and Engelmann spruce trees, albeit Engelmann spruce was located at less accessible, higher elevations.
In addition to changed disturbance through tree harvest and fire exclusion, overstocking by livestock and the extirpation of native large herbivores also occurred in the southern Rocky Mountains [13,17,20]. Jack [17] reported that pasturage had degraded due to supporting a greater number of cattle than warranted by the open forest conditions, which furnished herbaceous vegetation almost everywhere. The replacement of native herbivores by livestock, with overgrazing of herbaceous vegetation necessary for frequent surface fires, is a common component to changes associated with Euro-American settlement [11,12]. While less investigated than fire exclusion, native herbivory likely supported prevailing conditions [8].
To supplement the context from descriptive historical accounts of vegetation during Euro-American settlement, historical land surveys can provide quantitative data about tree composition and densities at landscape scales, while also systematically measuring the absence of trees at survey points. The General Land Office (GLO), created during 1812, developed and directed surveys that recorded tree species, diameter, distance, and bearing of two to four trees every 0.8 km [21]. If trees were not present within 60 m, surveyors typically set a stone, mound, or post to record the location. In the Front Range, surveys occurred during the years 1860 to 1883, during the forefront of Euro-American settlement. Using historical surveys, Williams and Baker [22] examined a 65,525 ha extent of the Front Range, isolating areas with ponderosa pine. They calculated mean densities of 217 trees/ha, with median values of 162 trees/ha. These tree densities generally represent open to closed woodlands [23]. Williams and Baker [24] documented that only 0.4% of surveyed lines encountered disturbances of logging, cultivated fields, homes, and mining, and concluded surveys represented the pre-Euro-American era with some overlap into Euro-American settlement in the Front Range.
Tree densities have increased throughout the United States, resulting in the loss of grasslands and open forests comprised of fire-adapted species. Fire exclusion, native herbivore extirpation, and overstory harvest were among the land use and disturbance changes in Colorado, and other regions, following Euro-American settlement. To quantify changes in tree density, presence, and composition for 1.5 million ha of Colorado following land use and disturbance changes associated with Euro-American settlement, we compared historical General Land Office surveys (years 1863 to 1886) to modern tree surveys of the USDA Forest Service Forest Inventory and Analysis (years 2002 to 2011; [25,26]) and the National Land Cover Database (year 2016; [27]). Our questions were the following: how have tree composition, density, and cover changed in the Arapaho and Roosevelt National Forests of the northern Front Range, and has tree presence increased in the grasslands of Weld County, where Pawnee National Grassland is located (Figure 1)? Applying a method that can discern tree presence throughout landscapes, this study quantifies historical ecosystems under fire conditions at landscape scales, unique research for this region, helping to establish baseline information for the research and management of Front Range ecosystems, specifically in response to wildfires, damaging insect outbreaks, and climate change, and for biodiversity support of open ecosystems [12,14,15,28]. Additionally, measured departures in tree densities and forestation in historical ecosystems will permit determination of correspondence, and the magnitude of correspondence, with forestation trends in other regions of the U.S. and globally, following European colonization.

2. Materials and Methods
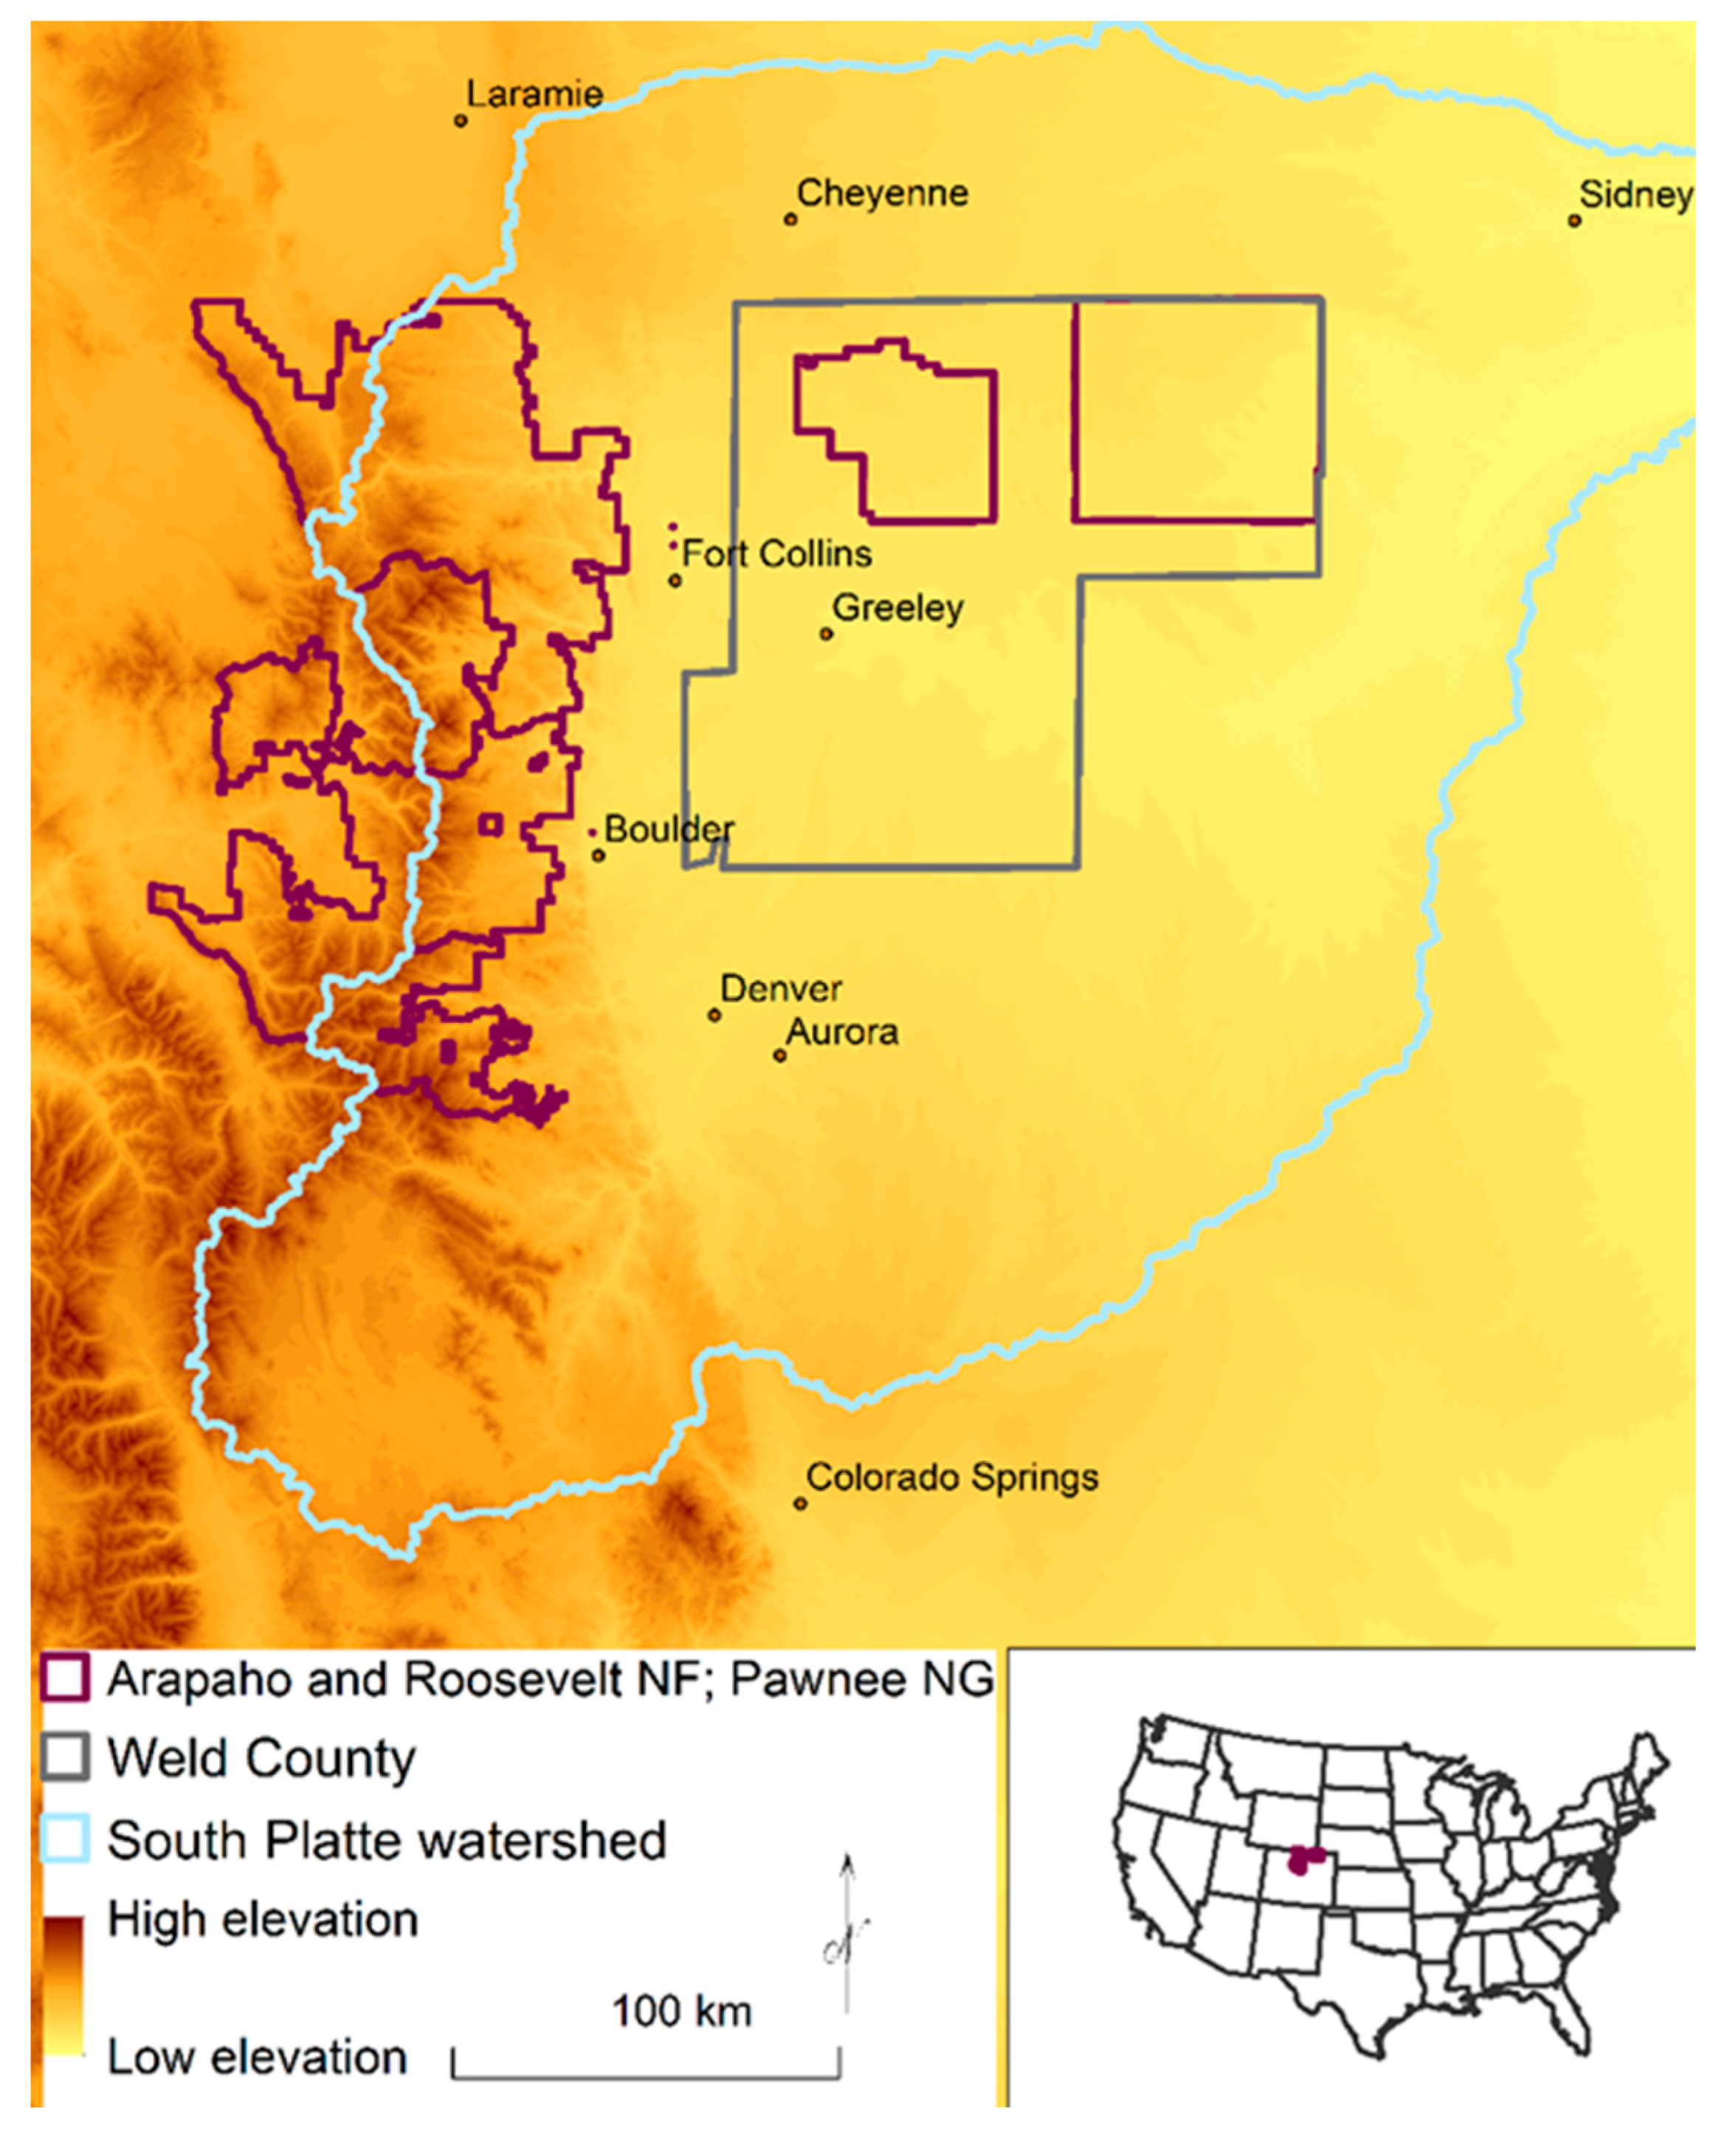
2.1. Setting

The Arapaho and Roosevelt National Forests cover 525,000 ha on the eastern side of the southern Rocky Mountains of north-central Colorado (Figure 1), where the Great Plains grasslands at 1550 m in elevation meet the Rocky Mountains, rising over 4300 m in elevation. As elevation increases, ecosystems transition from grasslands associated with the Great Plains to montane and subalpine forests, with alpine tundra occupying areas above tree line. The Arapaho and Roosevelt National Forests border the heavily populated Front Range urban corridor, which is interspersed with agricultural lands.
Pawnee National Grassland is administered together with the Arapaho and Roosevelt National Forests. However, Pawnee National Grassland is in the Great Plains, on the eastern side of the Front Range urban corridor. Pawnee National Grassland is approximately 80,000 ha and located in the South Platte River watershed and Weld County, which is 1,040,400 ha.

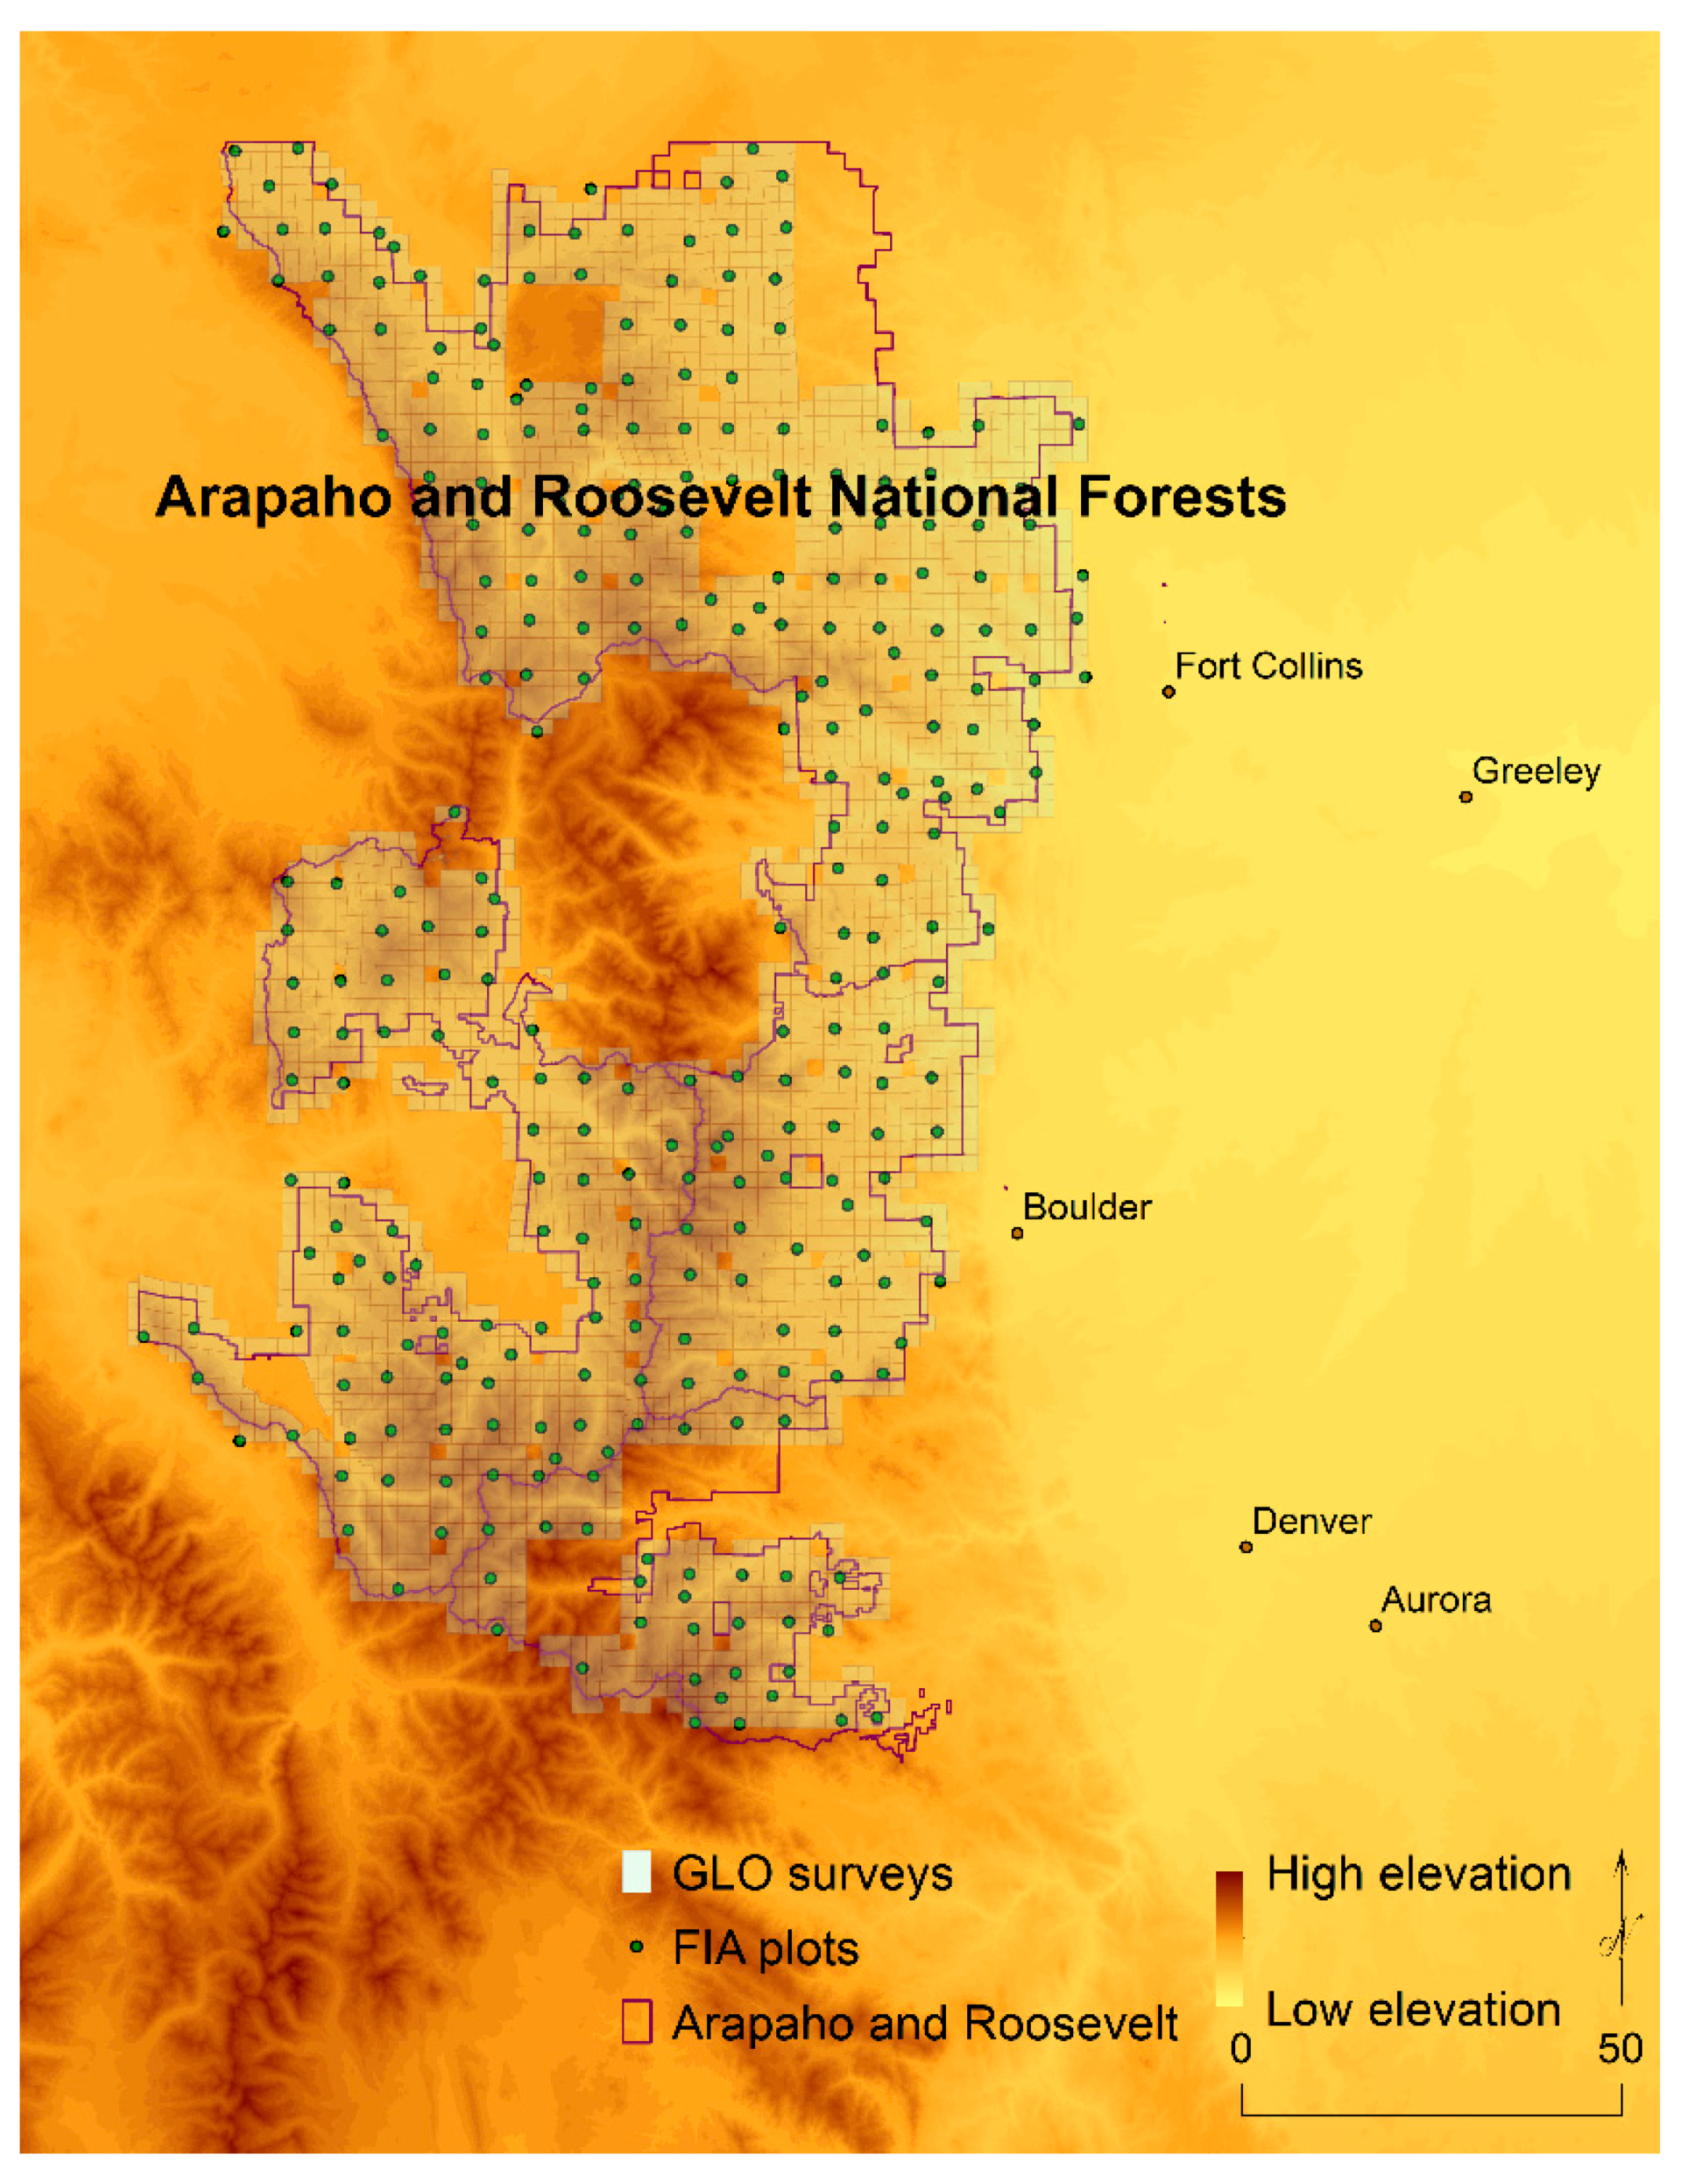
2.2. Trees Surveys and Composition for the Arapaho and Roosevelt National Forests

We transcribed 7134 survey points from 2890 sections of 111 townships that intersected with the Arapaho and Roosevelt National Forests (Figure 2) from scanned General Land Office notes [29]. The points, surveyed between 1867 to 1883, represented 4931 trees with diameter ≥ 12.7 cm at 1.37 m height. However, only 27% of survey points had two trees recorded within 60 m, which enables the potential to be in forested conditions but may represent survey points located outside of forests. Conversely, 4506 points (63%) had no trees recorded, due to distances to nearest trees exceeding 60 m, or tree densities consistent with grasslands. An additional 578 points (8%) had only one tree recorded, also indicating grasslands; some of these points specifically had notes that no other trees were near the point. The remainder of survey points (2%) were irregular, for example, with small tree diameters < 12.7 cm, which is inconsistent with surveyor instructions to select trees of moderate size, or survey points located at rocky outcrops or water bodies.
The USDA Forest Service Forest Inventory and Analysis has long-term forest plots situated about every 2500 ha across the country [25]. Each plot contains four 7.31 m radius subplots, arranged as a central subplot surrounded by three outer subplots. Plots typically are visited every five to ten years. We selected a complete cycle of surveys from the years 2002 to 2011, representing 8463 trees with diameter ≥12.7 cm at 1.37 m height. We located plots with coordinates within the extent of the available sections with GLO surveys. However, true plot coordinates are not available because of a privacy provision in the Food Security Act of 1985 [30]. Plot coordinates are within 1.6 km of true coordinates, with most plots within 0.8 km, and plot coordinates on private lands also are exchanged for up to 20% of plots.
We quantified composition, or percentage of all trees for each species or genera, and for points or plots below 2800 m and at 2800 m and above in elevation, an approximate threshold between montane forests that contain ponderosa pine and subalpine forests [28]. Surveyors overall did not differentiate species, but surveyors were likely to be able to differentiate among genera, given that few genera occur in this region and each has basic characteristics. We determined that spruces included Douglas-fir because Douglas spruce was in common use during this time interval [17].
We provided mean and maximum diameters for each species. The General Land Office records were not a complete census or a random sample; rather, surveyors selected trees of medium diameter that were sound, with few trees below diameter ≥12.7 cm at 1.37 m height [21]. Historical distribution of trees may have contained a greater percentage of larger trees, due to infrequent overstory disturbance relative to tree harvest following Euro-American settlement. Regarding smaller trees in modern surveys, trees <12.7 cm are also sampled differently, in microplots, for the FIA surveys [25], and we compared the truncated (≥12.7 cm) samples.

2.3. Historical Density and Cover for the Arapaho and Roosevelt National Forests

Surveyors did not always select the nearest tree, due to survey instructions and personal decisions [21,31,32]. When recorded trees were more distant than the nearest trees, density is underestimated [31,32]. Adjustments suggest the magnitude of bias, with the range of potential densities from unadjusted for surveyor bias to maximum adjustment. Likely across a landscape, and particularly in this region of scattered historical tree locations, more than the full range of densities occurred. This study extent contained 63% of survey points with no trees, where the surveyor set a stone as marker, and another 8% of survey points with only one tree recorded. We calculated an overall landscape density estimate based on survey points with no trees that had extremely low densities, at 1 tree/ha (i.e., the estimated density for distances of 60 m is about 1 tree/ha), which we averaged with the mean tree density of points with at least two trees, weighted by number of points.
We estimated tree density with the Morisita plotless estimator for two trees per point, applying an approach that has been validated by external data to match ecosystem classes and stocking charts, recognizing that a range of uncertainty is attached [23,33]. Due to few points with three or four trees, we removed the third and fourth trees to combine with points with two trees. We adjusted (decreased) the density for points with two trees [31]. We next produced low and high values based on corrections for potential clustered (‘groupy-clumpy’) and regular spatial patterning. We then adjusted (increased) the low and high values to account for surveyor bias. For bias adjustment, we determined the frequencies for quadrant location, quadrant configuration, and azimuth and corrected for non-random frequencies by finding the adjustment quotient from regression equations [32]. The moderate value was a simple mean of the clustered pattern low value and regular pattern high value, with adjustment for surveyor bias, but spatial patterning was expected to be clustered based on historical accounts. We calculated tree densities for all survey points and survey points with trees below 2800 m and at 2800 m and above in elevation; this elevation is an approximate threshold between montane forests that contain ponderosa pine and subalpine forests that burned rarely (200-year intervals) but severely [28].
Although historical survey points located every 0.8 km do not translate into continuous land cover, we attempted to indicate the location of historical forests. Surveys occurred along section lines, not within sections. We selected sections that had all survey points with ≥two trees, along the western and northern section lines. This may provide an indication of where trees were concentrated.

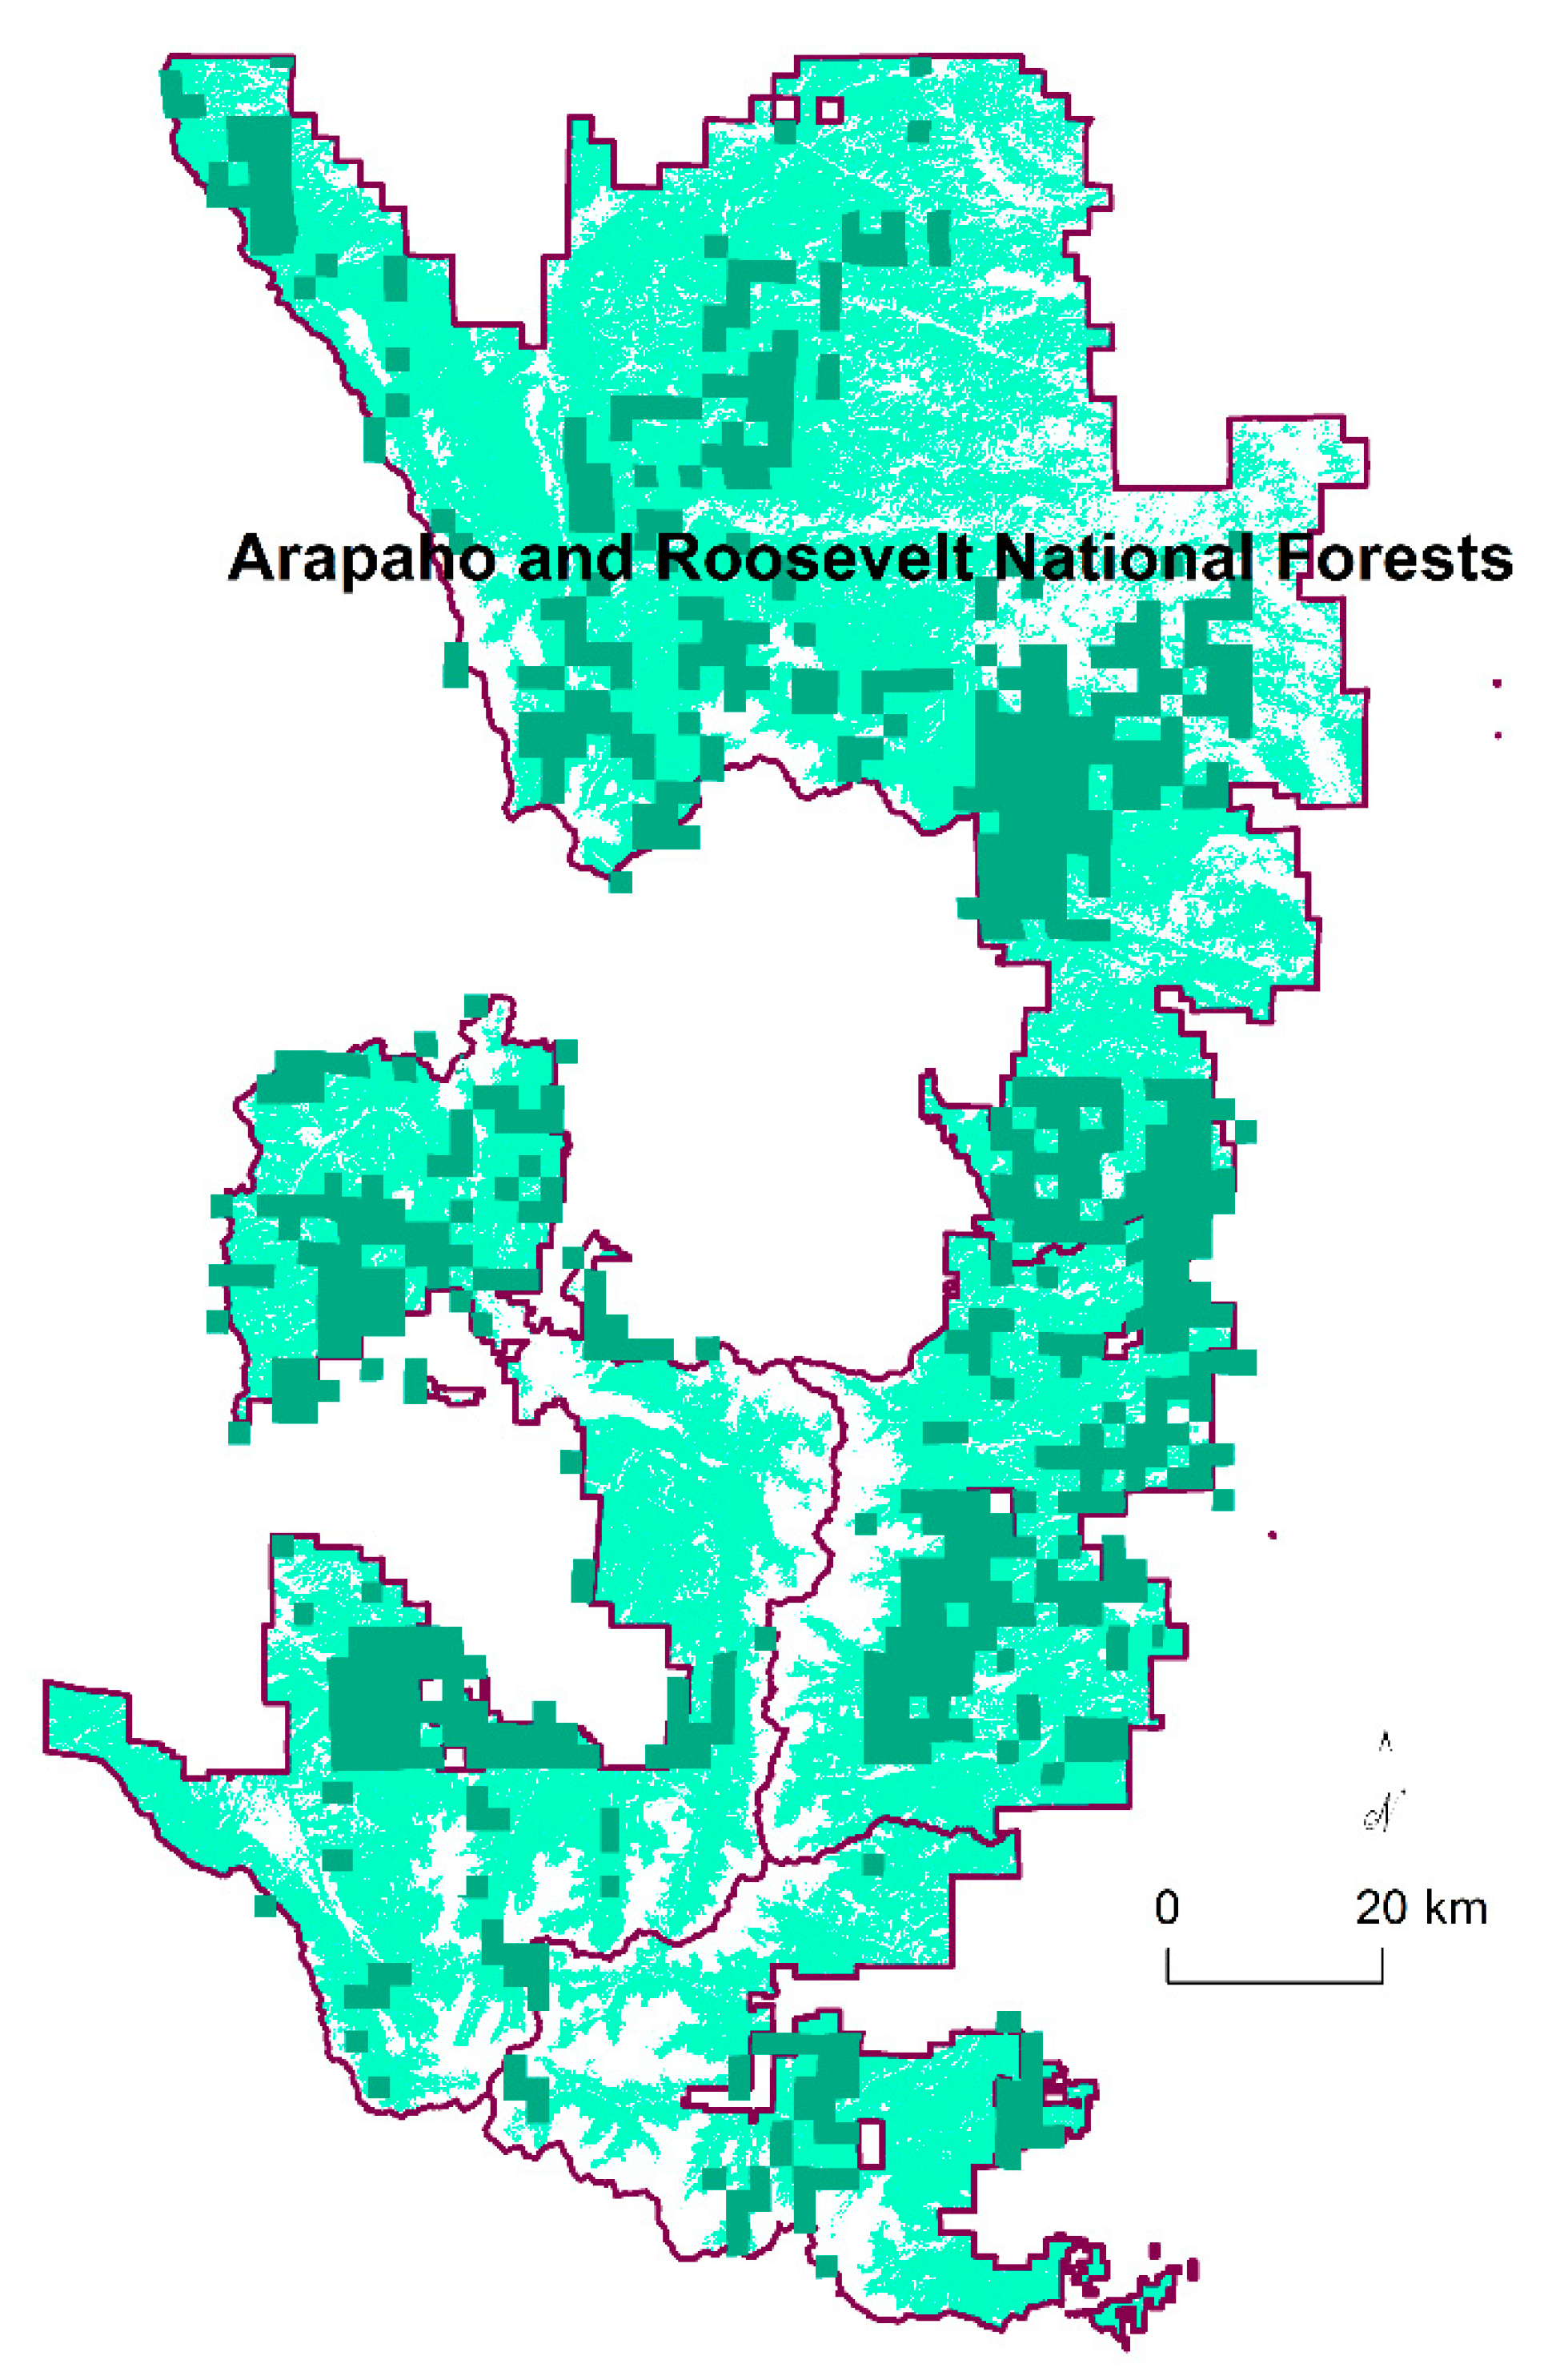
2.4. Current Density and Land Cover for the Arapaho and Roosevelt National Forests

We selected accessible plots with at least two trees and 100% forestland, which FIA defines as land with at least 10 percentage cover by live trees of any size, “including land that formerly had such tree cover and that will continue to have forest use”. We calculated the density for each plot by summing the tree expansion factor of 6.02, based on one tree representing the inverse of the plot area. Lastly, we determined the density mean for all plots, and for plots below 2800 m and at 2800 m and above in elevations.
The 7134 historical survey points convey that about 70% of survey points were not in forests and the 27% of survey points with ≥two trees were not necessarily in continuous forests but interrupted by non-forest land cover. The 304 FIA plots are classified as forest, whereas the survey points occur systematically regardless of land cover. Therefore, as an additional comparison, we also calculated current forested cover from the 2016 National Land Cover Database, excluding permanent water and developed lands [27].

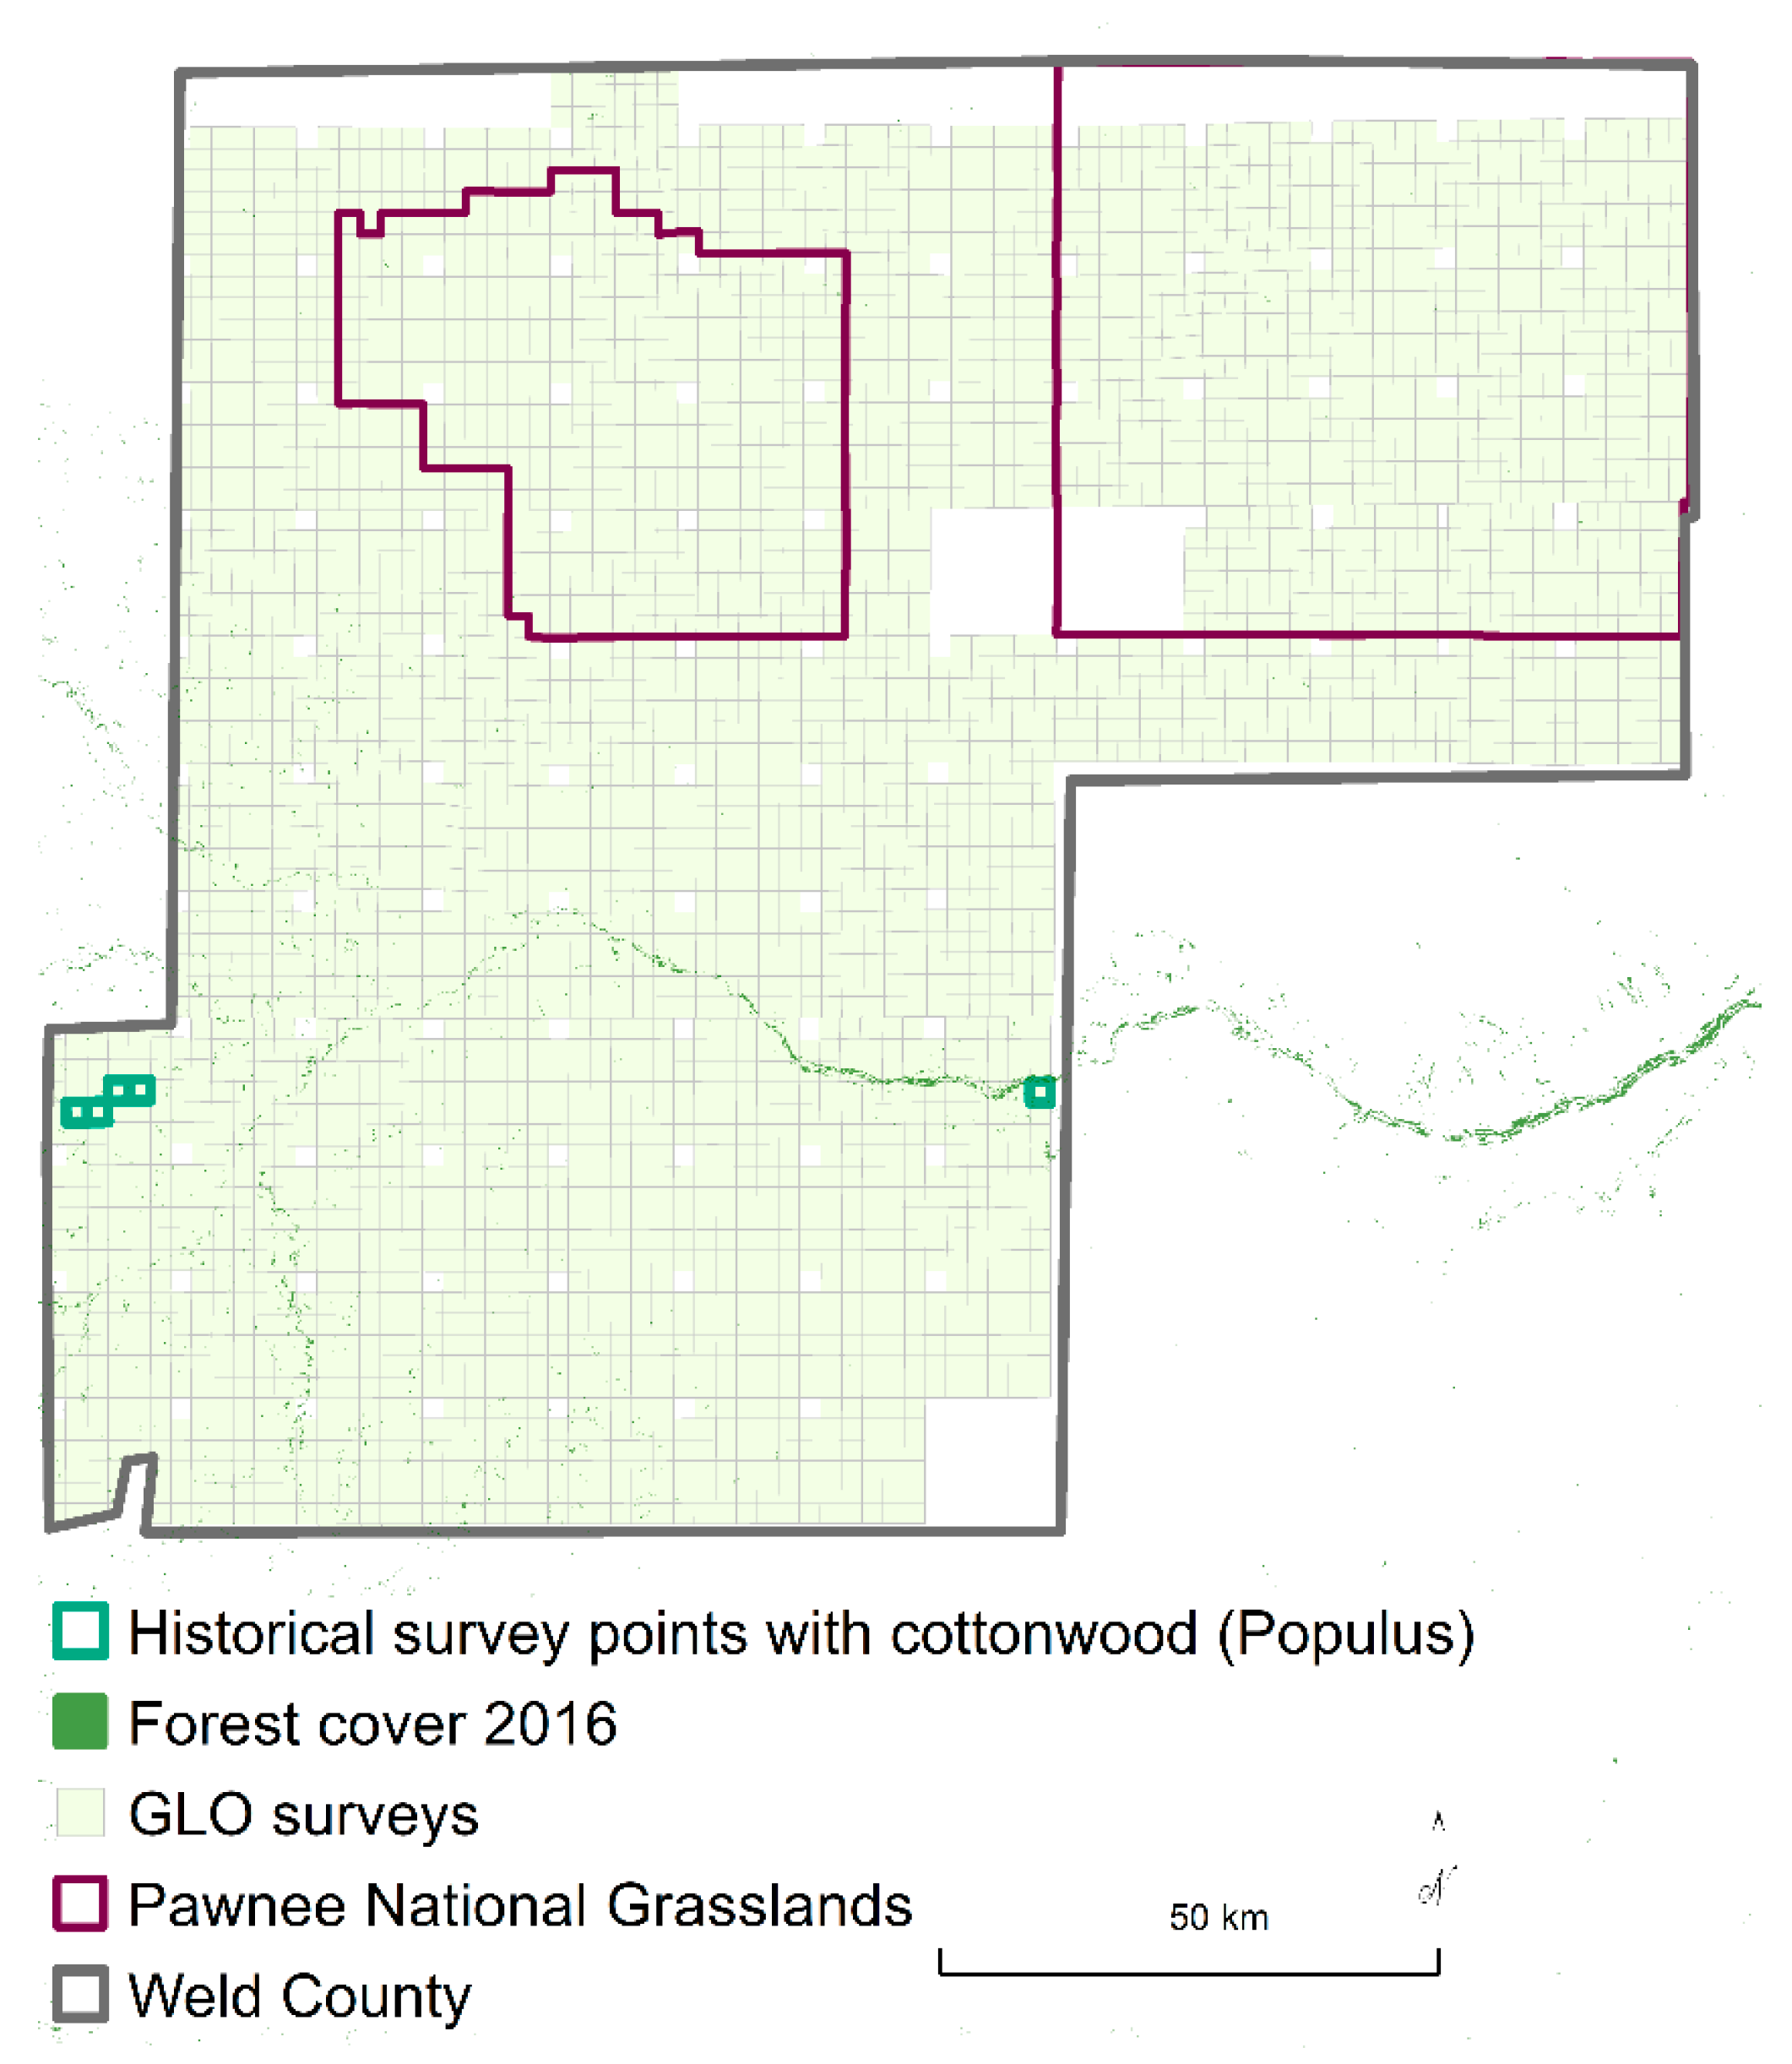
2.5. Historical Tree Presence and Current Forested Cover for Weld County

To assess Pawnee National Grassland and surroundings, we transcribed 9047 survey points from 3627 sections of 106 townships within Weld County from the GLO surveys (Figure 3). To compare historical tree presence to current land cover, we used the 2016 National Land Cover Database [27]. We determined the area of current forests and woody wetlands.

3. Results

3.1. Arapaho and Roosevelt National Forests

For composition, pines as a genera decreased over time from 72% to 58% of all trees, with concomitant increases in most non-pine species (Table 1). Subalpine fir specifically increased from 0.5% to 14% of all trees. Regarding diameters, pines and spruces were the only historical genera with relatively good sample sizes, and representative species in the genera were larger in diameter historically than currently.
The percentage of survey points without two trees within 60 m suggested the historical landscape was very open, as only 27% of 7134 survey points had two trees recorded within 60 m, permitting the potential to be in forested conditions. The overall landscape density for all survey points was 46 trees/ha, for the clustered tree pattern, ranging up to 57 trees/ha, expressing the larger extent of grasslands and mountain meadows compared to treed areas. The treed landscape density for the 27% of survey points that contained ≥ 2 trees revealed an open structure of woodlands (generally, open woodland densities ranging from 100 to 175 trees/ha with closed woodlands ranging from 175 trees/ha to 250 trees/ha; [23]). The mean density was 153 trees/ha for a clustered pattern, ranging up to 191 trees/ha for a regular pattern (Table 2).
Not all points with trees were likely to be in primarily forests, given the open landscape. Surveys occurred along section lines, which means that assignment to a specific section is not possible. Nevertheless, sections (to the east and south of section lines) that had all survey points with ≥two trees were distributed throughout the landscape, albeit in clusters (Figure 4).
In contrast, the current landscape was 68% forested, or 70% including woody wetlands (Figure 4). Current tree density was 522 trees/ha, about a tripling of density. These densities represented closed forests, which are comprised of high tree densities throughout the vertical profile.
Densities decreased spatially with elevation in both historical and current surveys. Below 2800 m, historical densities were 120 trees/ha, for a clustered pattern, where pine percentage was about 80% of all trees in these open woodlands, compared to current densities that were 429 trees/ha. At elevations ≥ 2800 m, historical densities were 187 trees/ha, for a clustered pattern, where pine percentage was 66% of all trees, and current densities were 602 trees/ha.

3.2. Weld County

Historically, two locations had a total of seven cottonwood trees, representing 0.05% of survey points with trees, along the South Platte River and tributaries (Figure 5). The rest of the survey points were marked with stones. Currently, Weld County had 2555 ha of tree and shrub coverage, of which most (2220 ha) was classified as woody wetlands and about 330 ha was classed as forest. About 235 ha was deciduous forest (i.e., cottonwood) and 100 ha was mixed and evergreen forest (e.g., Juniperus, Pinus).

4. Discussion

4.1. Key Findings

A sequence of land use changes has proceeded since Euro-American settlement, resulting in increased trees in grasslands and forests throughout the United States [5,7,10,12]. The historical (years 1867 to 1883) surveys for the Arapaho and Roosevelt National Forests, in the northern Front Range of the southern Rocky Mountains, indicated a very open landscape comprised of pines and “spruces” (i.e., Engelmann spruce and Douglas-fir) as the most abundant tree species. Historical assessments [16,17] corroborated the dominance of open ecosystems, in contrast to overall representation of the Front Range as forests by research [14,15]. We documented ecologically significant tree density increases, from woodlands to closed forests, and conversion from an open landscape to a forested landscape in the Arapaho and Roosevelt National Forests. Moreover, we detected the same progression to the east in the Great Plains grasslands. In Weld County, the site of Pawnee National Grassland, rare cottonwood presence became nearly continuous cover of diverse shrub and tree species along the South Platte River channel, albeit some shrub cover may have been present historically. Even though historical accounts and land surveys offer only a snapshot of a few decades for each region, results matched widely reported increases in tree densities, particularly of surface fire-sensitive tree species, throughout forests and afforestation of historical grasslands [1,2,3,4,5,7,10,11,12]. Compared to dense forests, open ecosystems generally contain a greater diversity of herbaceous species; support large herbivores, pollinators, and pollinator services; use less water; and have reduced risks of severe fires, damaging insect outbreaks, windfall, and die-offs due to drought, particularly exacerbated by climate change [7,12,14,15,28,34].
Although forestation following European settlement and land use change encompassing loss of understory disturbance is not unique to this landscape, the magnitude of departure is novel for a landscape generally considered forested. Research about historical structure and fire regimes in the Front Range typically frames the context within ponderosa pine and Douglas-fir montane forests or spruce–fir subalpine forests, partly due to methods that require sampling relict trees [12,35,36,37]. We uniquely applied historical surveys, collected during Euro-American settlement, which allowed determination of whether trees were present systematically at landscape scales. Historical survey points occurred regardless of landcover at the points. Even though 70% of 7134 survey point samples in open ecosystems may not translate to 70% continuous cover by open ecosystems, the surveys provided the distinctive perspective that the landscape had a preponderance of open locations relative to locations with trees, similar to historical assessments that characterized open landscapes in the southern Rocky Mountains. Frequent surface fires and native herbivory are two understory disturbances that uniquely can remove small diameter trees and maintain open conditions.
Fire exclusion, along with native herbivore extirpation, are mechanisms that allow for the survival of small diameter trees and eventual forestation, with densification within tree stands and afforestation of open ecosystems. Increased tree establishment generally initiated during 1860 to 1920, following Euro-American settlement and surface fire exclusion, after which continuous recruitment ensued [12]. Dominant, fire-dependent tree species increased first with eventual replacement by fire-sensitive tree species. While abundant lodgepole pine regeneration was reported as the first beneficiary of a switch from fire conditions to fire-free conditions, both Mason [38] and Bates [39] recognized that without continued fire, lodgepole pine would be replaced by Douglas-fir and Engelmann spruce. Relative replacement of ponderosa pine by Douglas-fir proceeded but planting of ponderosa pine occurred at low elevations in the foothills below montane forests [40]. Clearcuts favored aspen, allowing the release of suppressed aspen advance regeneration [40]. Currently, subalpine fir has increased relative to fire-dependent pine decreases.
While the historical proportion of severe fires in the southern Rocky Mountains is debated [41], the implication from this research is that frequent, low severity fire was the dominant fire regime based on the greater representation of open ecosystems than forests in the historical surveys and assessments. Severe fire behavior with long flame lengths in canopy trees requires abundant and continuous coarse tree fuels [42,43]. Otherwise, low severity fires that kill few or no canopy trees occur, with torching of individual or grouped trees [12,13,42]. The rarity of dense, continuous forests, depicted by Jack (1900) and the historical land surveys, indicated that continuous fuels from understory to canopy and canopy to canopy necessary to spread high severity fires would be limited to small extents, particularly high-elevation spruce stands on northern slopes [5,12]. Because fire is a contagious disturbance and adjacency was present between open conditions and isolated spruce stands, dense spruce stands were exposed to surface fires that swept up mountain slopes [19]. Indeed, Mason [38] described surface fires in relatively open lodgepole pine stands, which developed from limited regeneration. Open landscapes characterized by historical surveys and assessments particularly are not compatible with Sherrif et al. [37], who determined that the dominant historical fire regime of the northern Colorado Front Range was represented by forest stand structures affected by moderate-severity and high-severity fires. All approaches have error, but methods that require trees may not capture information representative of an overall landscape [13,44,45]. Reconstructed fire histories remain a contested topic [5,22,37,41].
We stress that this variably treed landscape was not comparable to a more continuously forested landscape, although estimated tree densities largely represented savannas after accounting for survey points without trees. Jack [17] documented extreme variability in historical tree densities and the consequent difficulty of measurement that would capture the landscape: “so that no section or even quarter section of living timber ground can be found giving a fairly uniform growth, it is impossible to give a close estimate of the amount of lumber remaining here without more time for examination and measurements than was available in the present exploration”. Brown et al. [11] found the same variable densities with clustered spatial patterns in reconstructed stand structure.

4.2. Open Landscapes to Forested Landscapes in the Arapaho and Roosevelt National Forests

The historical tree surveys in the Arapaho and Roosevelt National Forests aligned with historical assessments of open landscapes, as about 70% of the historical survey points were not within forests. According to historical accounts, the southern Rocky Mountains generally had limited forest coverage. For example, the landscape bordering the Arapaho and Roosevelt National Forests study extent to the south, on the eastern side of the southern Rocky Mountains, contained only a small area sufficiently covered with trees to be considered timberlands (i.e., in the precursor forest reserves for the Pike National Forest; [16,17]). Conversely, current landscapes were 68% forested, which may be the opposite of historical landscapes.
Similarly, Dickinson [36] estimated forest cover in the Front Range by reconstructing pre-Euro-American settlement forest cover from old trees, stumps and eroded coarse woody debris along transects. Tree cover increased from 57% historically to 83% over time, which was an increase of 25 percentage points. Dickinson [36] found loss of small (<50 m in length) rather than large openings. This contrasted with the land surveys and assessments that revealed a matrix of open ecosystems, but Dickinson [36] likely was reconstructing a more forested part of the Front Range, based on high current forested cover and historical tree remnants. Platt and Schoennagel [46] did not detect increased tree cover since 1938, which indicated that most forestation was completed within decades of Euro-American settlement.
Historically, the treed landscape, which was not continuously forested, had estimated densities of 153 trees/ha for survey points with trees (≥12.7 cm diameters) in clustered tree patterns that portrayed the landscape. These tree density values are less than the mean densities of 217 trees/ha, with median values of 162 trees/ha, for the Front Range calculated by Williams and Baker [22]. However, the northern extent of the Front Range, the location of the Arapaho and Roosevelt National Forests, was classified as a combination of non-forested and tree densities in the range of 20 to 89 trees/ha by Williams and Baker [22], which accords with the overall landscape density of 46 trees/ha, calculated as a weighted average of densities of points with and without trees. Battaglia et al. [12] used stand reconstructions (≥4 cm diameters for 170, 0.5-ha plots in montane ponderosa pine-dominated forests in Colorado and Wyoming) to calculate a mean density of 97 trees/ha in the lower montane zone and 163 trees/ha in the upper montane zone, which were divided at the 2300–2600 m threshold. These values generally concurred with our density estimates for clustered tree patterns of 120 trees/ha at elevations <2800 m, where montane forests of ponderosa pine (Pinus ponderosa) were dominant and pine percentage was about 80% of all trees in these open woodlands, and clustered tree patterns of 187 trees/ha at higher elevations, where spruce became more frequent relative to pine. Our results also agreed with Jack’s [17] assessment of the landscape immediately south of the Arapaho and Roosevelt National Forests: timberless landscapes containing predominantly open forests of ponderosa pine and Douglas-fir at lower elevations and lodgepole pine and Engelmann spruce at higher elevations, particularly dominant > 3000 m, with dense stands on protected northern slopes. Tree densities were kept lower in the past at all elevations, although particularly limited in open mountain valleys and foothill grasslands [17].
One potential inference based on 70% of historical survey points without two trees is that perhaps the forests already had been substantially clearcut and burned by severe fires before the survey interval of the years 1867 to 1883. However, pines and spruces (including Pseudotsuga menziesii), which were the only historical genera with relatively good sample sizes, had greater diameters historically than currently. Therefore, even if selective harvesting had occurred by the time of the land surveys, trees still were available to surveyors that were large relative to current trees. Where historical trees occurred, they were less felled by historical overstory disturbance than currently. Historically, high-grading, and not clear-cutting, occurred, because markets were very specific and it simply was not worth cutting, sawing, and hauling non-marketable trees a day or two, round-trip by horse and wagon, to the nearest shipping station or local market [17]. For example, sawmills only would accept large diameter logs, typically at least 30 cm, in part because the saw blades were thick and removed 25% of the timber [17]. Photographs illustrated that trees remained after cutting and fires as well [17], and Williams and Baker [24] documented that only 0.4% of surveyed lines had evidence of Euro-American disturbance.
Fire exclusion, perhaps combined with altered herbivory regimes, likely has allowed increased tree regeneration, resulting in denser forests and forestation of open ecosystems, particularly by fire-sensitive tree species. Pine percentage decreased, with the pines relying on fire disturbance to be competitive, whereas subalpine fir (Abies lasiocarpa) increased from minimal presence to 14% of all trees. Jack [17] noted that historically subalpine fir “nowhere occurs in sufficient numbers to be taken into commercial account.” Additionally, Battaglia et al. [12] determined greater tree increases in current forests at lower elevations than higher elevations, which our comparisons also indicated, although both low- and high-elevation forests have departed in structure despite less exposure to fire at higher elevations. These results may conflict with fire scar studies that show a lack of departure in fire histories for high-elevation forests in the Front Range [35,47].

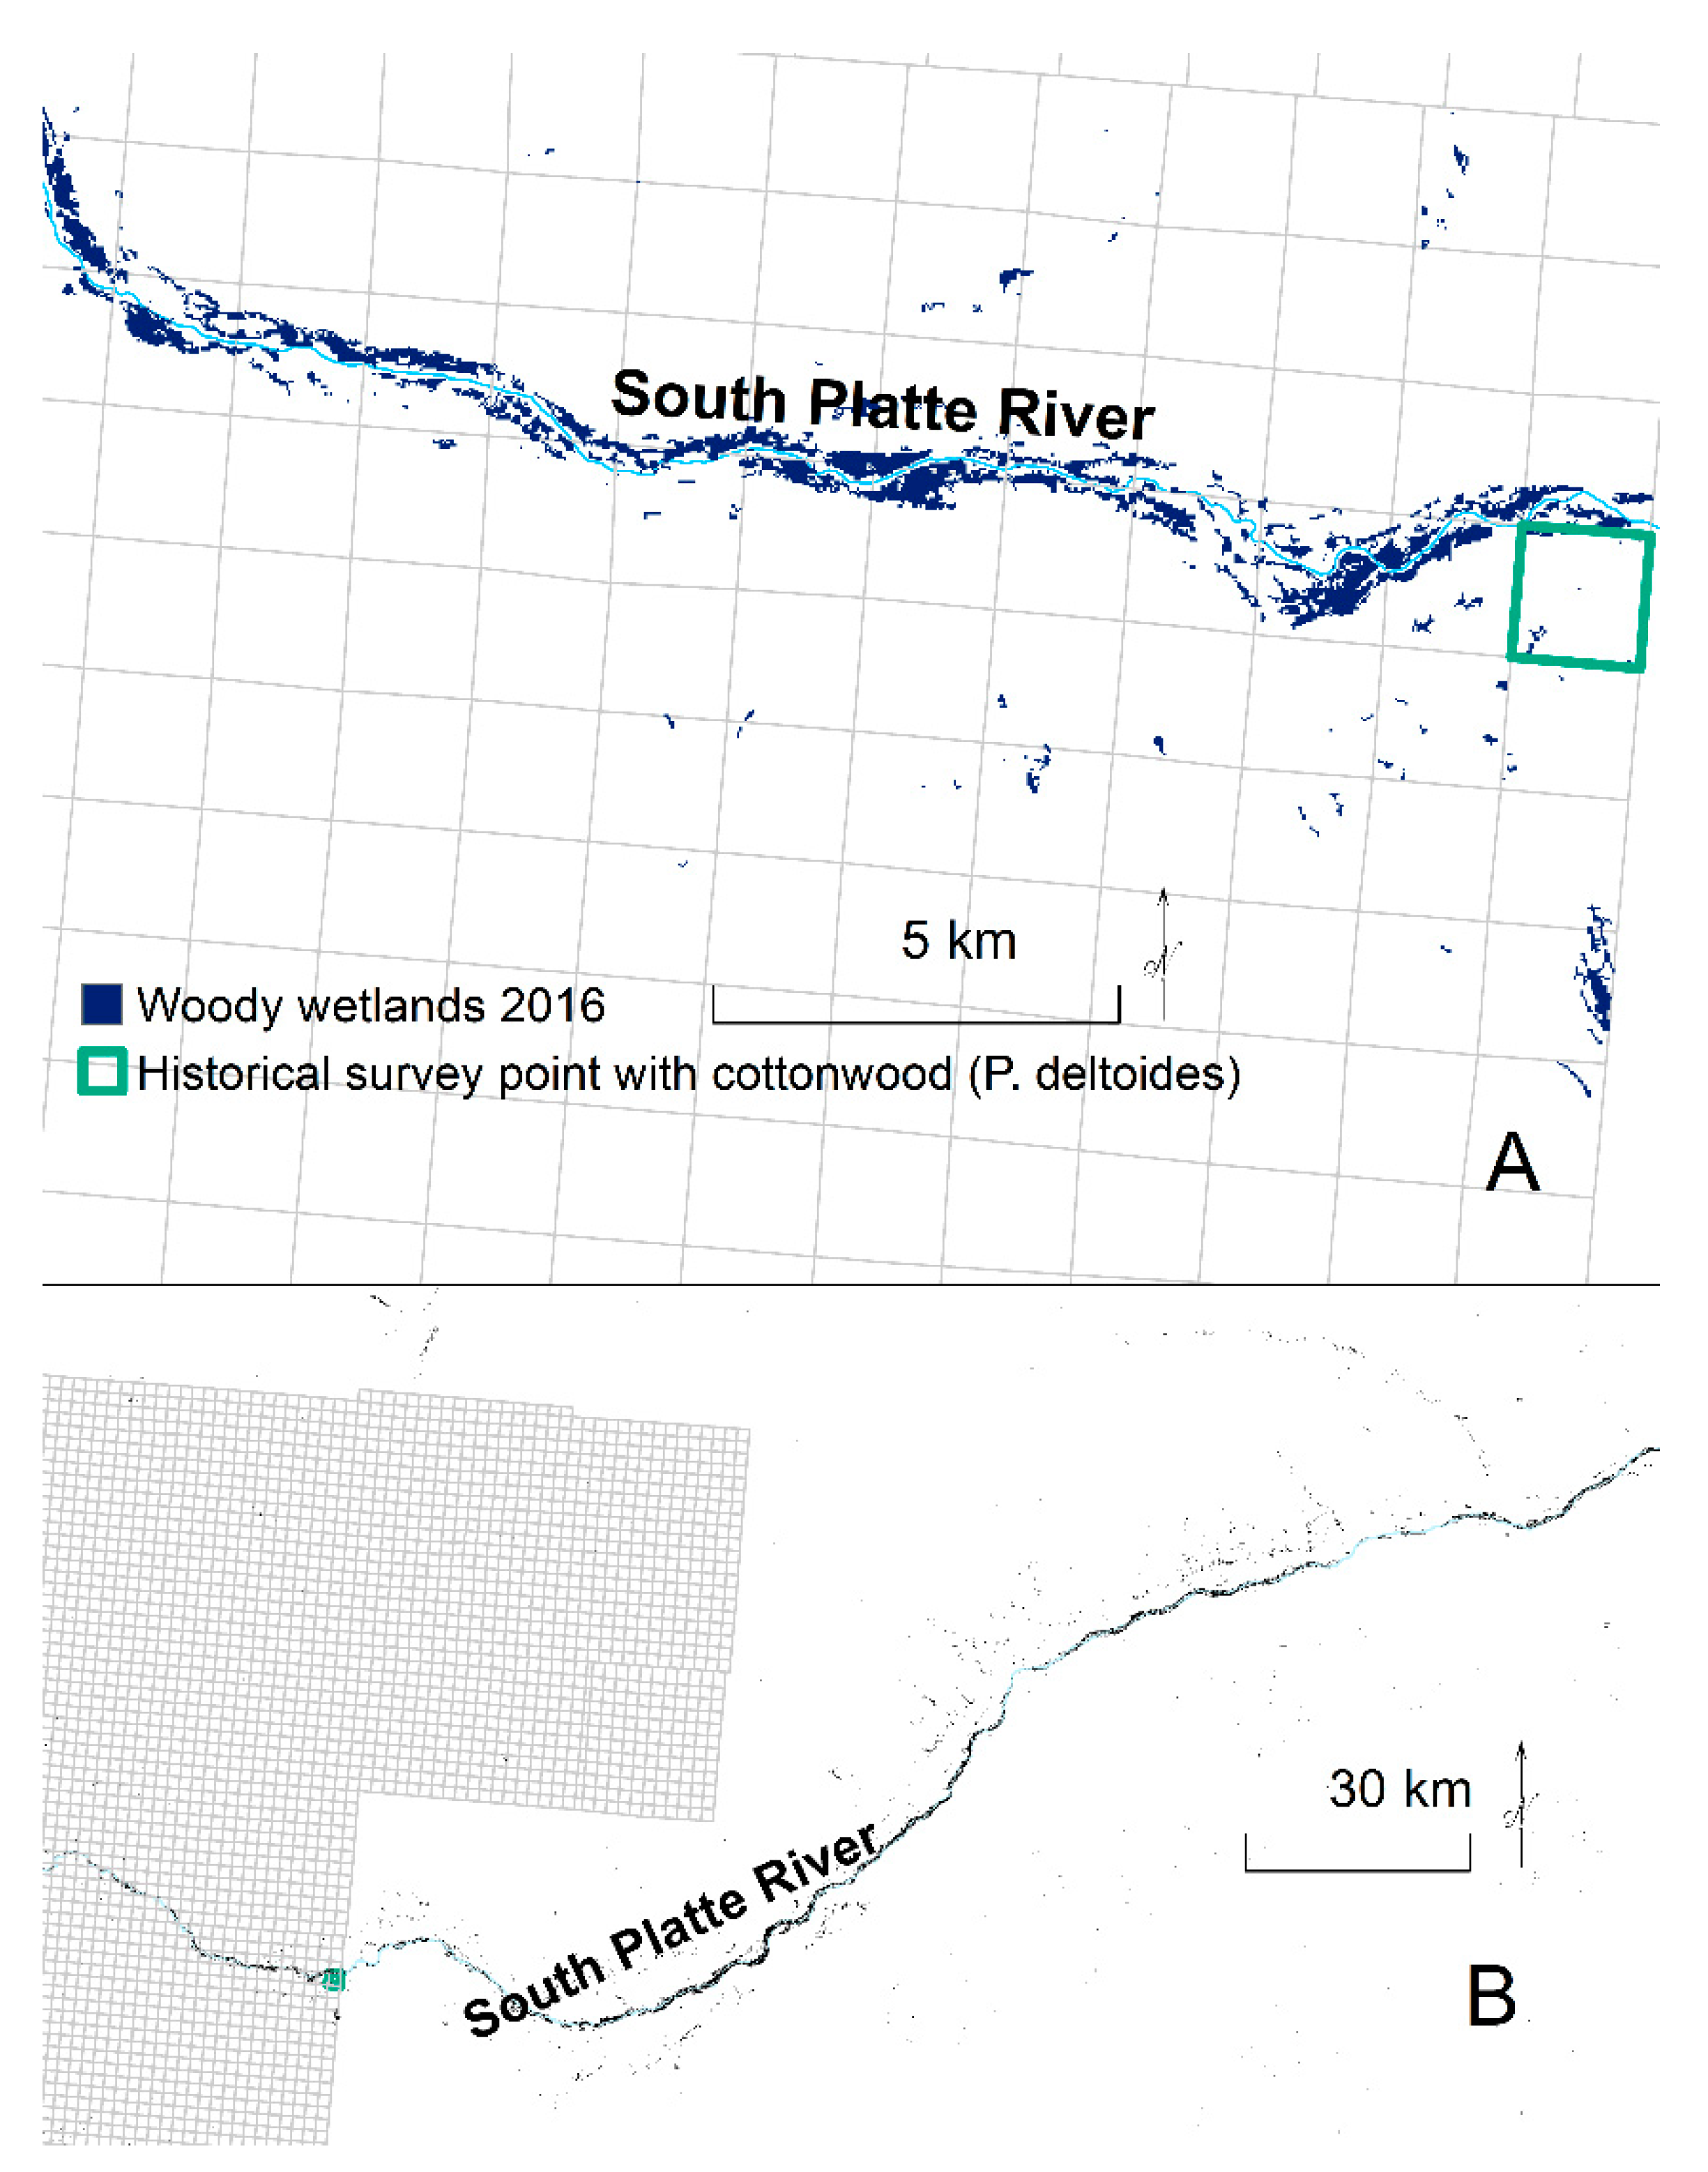
4.3. Lack of Trees to Tree Cover along Riparian Channels in Weld County

Equally, in the Great Plains grasslands, to the east of the Front Range in Weld County, rare cottonwood presence became nearly continuous cover of diverse shrub and tree species over time. Historically, seven cottonwood (P. deltoides) trees were surveyed in two locations, resulting in a total of 0.05% of survey points with trees, whereas currently, tree and shrub cover was nearly continuous along the same riparian channel, totaling 2555 ha in the county. Most of the cover was woody wetlands, but 330 ha were classed as forest: 235 ha were deciduous forest (i.e., cottonwood) and 100 ha were mixed and evergreen forest. Nonetheless, historical grasslands have remained grasslands, evidencing resistance to tree encroachment in the Great Plains.
No tree species other than cottonwood was recorded in the past, and seven recorded trees at two locations were more likely to represent two groves rather than 330 ha of total forest. In Colorado, two reports before the year 1850 each noted an isolated cottonwood grove along the South Platte River, the watershed for Pawnee National Grassland, and a reconstruction from historical surveys contained cottonwood 55 km from the headwaters of the West Bijou Creek, near the South Platte River [48,49]. However, the few trees in the Great Plains also made cottonwoods vulnerable to use by Euro-American settlers. Cottonwoods historically were present, and the characteristic tree species, along riparian networks throughout the Great Plains grasslands, albeit at variable densities [50].
Historical reconstructions are limited in the Great Plains. Further research on historical tree presence in the Great Plains may help clarify how typical these results are. In any event, cottonwoods are species of cultural value, providing vibrant fall colors, and an important resource for wildlife species such as pollinators [51]. Recently, cottonwood trees have been dying without replacement, due to altered hydrology in combination with other factors [52], which may represent a reset within the range of historical variation but reinitiation of establishment may require a specific combination of disturbance regimes.

5. Conclusions

Aligning with historical assessments, we quantified an open landscape in the northern Front Range of the southern Rocky Mountains and documented rare tree presence in the Great Plains grasslands of Colorado. Trees increased and expanded in both landscapes, concurring with a regional and global body of evidence about forestation in wildlands following European settlement. However, the magnitude of departure in the northern Front Range was greater than indicated by previous research that focused on forest stand information from relict trees and framing of the ecological context as montane ponderosa pine forests and subalpine spruce-fir forests. According to historical surveys and accounts, open ecosystems were proportionately dominant in the northern Front Range, with frequent surface fires that spread upslope to limit tree presence. The historical context presents baseline information for research and management of Front Range ecosystems, related to biodiversity, conditions, and varying responses by grasslands and forests to wildfires, insect outbreaks, and climate change.

Author Contributions

B.B.H. performed analysis, visualization, and writing. J.M.S. and P.D. performed investigation, data curation, and project administration. All authors have read and agreed to the published version of the manuscript.

Funding

This research received no external funding.

Institutional Review Board Statement

Not applicable.

Informed Consent Statement

Not applicable.

Data Availability Statement

Data are available at https://glorecords.blm.gov/ (accessed on 30 April 2021).

Acknowledgments

This research was supported by the USDA Forest Service, Rocky Mountain Research Station, and the FIA winter work program. The findings and conclusions in this publication are those of the authors and should not be construed to represent any official USDA or U.S. Government determination or policy.

Conflicts of Interest

The authors declare no conflicts of interest.

References

  1. Laris, P.; Wardell, D.A. Good, bad or ‘necessary evil’? Reinterpreting the colonial burning experiments in the savanna landscapes of West Africa. Geogr. J. 2006, 172, 271–290. [Google Scholar] [CrossRef]
  2. Gammage, B. Plain facts: Tasmania under aboriginal management. Landsc. Res. 2008, 33, 241–254. [Google Scholar] [CrossRef]
  3. Joshi, A.A.; Sankaran, M.; Ratnam, J. ‘Foresting’ the grassland: Historical management legacies in forest-grassland mosaics in southern India, and lessons for the conservation of tropical grassy biomes. Biol. Conserv. 2018, 224, 144–152. [Google Scholar] [CrossRef]
  4. Moura, L.C.; Scariot, A.O.; Schmidt, I.B.; Beatty, R.; Russell-Smith, J. The legacy of colonial fire management policies on traditional livelihoods and ecological sustainability in savannas: Impacts, consequences, new directions. J. Environ. Manag. 2019, 232, 600–606. [Google Scholar] [CrossRef] [PubMed]
  5. Hagmann, R.K.; Hessburg, P.F.; Prichard, S.J.; Povak, N.A.; Brown, P.M.; Fulé, P.Z.; Keane, R.E.; Knapp, E.E.; Lydersen, J.M.; Metlen, K.L.; et al. Evidence for widespread changes in the structure, composition, and fire regimes of western North American forests. Ecol. Appl. 2021, 31, e02431. [Google Scholar] [CrossRef] [PubMed]
  6. Sargent, C.S. Report on the Forests of North America (Exclusive of Mexico); US Government Printing Office: Washington, DC, USA, 1884.
  7. Bragg, D.C.; Hanberry, B.B.; Hutchinson, T.F.; Jack, S.B.; Kabrick, J.M. Silvicultural options for open forest management in eastern North America. For. Ecol. Manag. 2020, 474, 118383. [Google Scholar] [CrossRef]
  8. Hanberry, B.B.; Faison, E.K. Re-framing deer herbivory as a natural disturbance regime with ecological and socioeconomic outcomes in the eastern United States. Sci. Total Environ. 2023, 868, 161669. [Google Scholar] [CrossRef]
  9. Day, G.M. The Indian as an ecological factor in the northeastern forest. Ecology 1953, 34, 329–346. [Google Scholar] [CrossRef]
  10. Hanberry, B.B. Timing of tree density increases, influence of climate change, and a land use proxy for tree density increases in the eastern United States. Land 2021, 10, 1121. [Google Scholar] [CrossRef]
  11. Brown, P.M.; Battaglia, M.A.; Fornwalt, P.J.; Gannon, B.; Huckaby, L.S.; Julian, C.; Cheng, A.S. Historical (1860) forest structure in ponderosa pine forests of the northern Front Range, Colorado. Can. J. For. Res. 2015, 45, 1462–1473. [Google Scholar] [CrossRef]
  12. Battaglia, M.A.; Gannon, B.; Brown, P.M.; Fornwalt, P.J.; Cheng, A.S.; Huckaby, L.S. Changes in forest structure since 1860 in ponderosa pine dominated forests in the Colorado Wyoming Front Range, U.S.A. For. Ecol. Manag. 2018, 422, 147–160. [Google Scholar] [CrossRef]
  13. Veblen, T.T.; Donnegan, J.A. Historical Range of Variability of Forest Vegetation of the National Forests of the Colorado Front Range; USDA Forest Service, Rocky Mountain Region and the Colorado Forest Restoration Institute: Fort Collins, CO, USA, 2005.
  14. Dickinson, Y.L. Spatial Heterogeneity Subgroup of the Front Range Roundtable, 2014. Desirable Forest Structures for a Restored Front Range. Colorado Forest Restoration Institute, Colorado State University, Fort Collins, CO, USA. Available online: https://www.fs.usda.gov/rm/pubs_journals/2014/rmrs_2014_dickinson_y001.pdf (accessed on 21 January 2024).
  15. Rocca, M.E.; Brown, P.M.; MacDonald, L.H.; Carrico, C.M. Climate change impacts on fire regimes and key ecosystem services in Rocky Mountain forests. For. Ecol. Manag. 2014, 327, 290–305. [Google Scholar] [CrossRef]
  16. Ensign, E.T. Report on the Forest Conditions of the Rocky Mountains–Especially the State of Colorado, the Territories of Idaho, Montana, Wyoming, and New Mexico; Government Printing Office: Washington, DC, USA, 1888. [Google Scholar]
  17. Jack, J.G. Pikes Peak, Plum Creek, and South Platte Reserves. Pages 38–116 in Twentieth Annual Report of the United States Geological Survey, Part V; Government Printing Office: Washington, DC, USA, 1900.
  18. Sudworth, G.B. White River Plateau Timber Land Reserve. Pages 117–180 in Twentieth Annual Report of the United States Geological Survey, Part V; Government Printing Office: Washington, DC, USA, 1990.
  19. Hayden, F.V. Preliminary Field Report of the United States Geological Survey for Colorado and New Mexico; Government Printing Office: Washington, DC, USA, 1869.
  20. von Ahlefeldt, J.P.; Speas, C. Biophysical and Historical Aspects of Species and Ecosystems of the Medicine Bow National Forest; U.S. Department of Agriculture, Forest Service, Medicine Bow National Forest: Laramie, WY, USA, 1996. [Google Scholar]
  21. White, C.A. A History of the Rectangular Survey System; US Department of the Interior Bureau of Land Management: Washington, DC, USA, 1983. Available online: https://www.blm.gov//sites/blm.gov/files/histrect.pdf (accessed on 27 January 2024).
  22. Williams, M.A.; Baker, W.L. Spatially extensive reconstructions show variable-severity fire and heterogeneous structure in historical western United States dry forests. Glob. Ecol. Biogeogr. 2012, 21, 1042–1052. [Google Scholar] [CrossRef]
  23. Hanberry, B.B.; Jones-Farrand, D.T.; Kabrick, J.M. Historical open forest ecosystems in the Missouri Ozarks: Reconstruction and restoration targets. Ecol. Restor. 2014, 32, 407–416. [Google Scholar] [CrossRef]
  24. Williams, M.A.; Baker, W.L. Comparison of the higher-severity fire regime in historical (AD 1800s) and modern (AD 1984–2009) montane forests across 624,156 ha of the Colorado Front Range. Ecosystems 2012, 15, 832–847. [Google Scholar] [CrossRef]
  25. Bechtold, W.A.; Patterson, P.L. The Enhanced Forest Inventory Analysis Program–National Sampling Design Estimation Procedures; U.S. Department of Agriculture, Forest Service, Southern Research Station: Asheville, NC, USA, 2005.
  26. USDA Forest Service Forest Inventory and Analysis. FIA DataMart. 2021. Available online: https://apps.fs.usda.gov/fia/datamart/datamart.html (accessed on 27 January 2024).
  27. Homer, C.; Dewitz, J.; Jin, S.; Xian, G.; Costello, C.; Danielson, P.; Gass, L.; Funk, M.; Wickham, J.; Stehman, S. Conterminous United States land cover change patterns 2001–2016 from the 2016 national land cover database. ISPRS J. Photogramm. Remote Sens. 2020, 162, 184–199. [Google Scholar] [CrossRef]
  28. Rodman, K.C.; Veblen, T.T.; Saraceni, S.; Chapman, T.B. Wildfire activity and land use drove 20th-century changes in forest cover in the Colorado front range. Ecosphere 2019, 10, e02594. [Google Scholar] [CrossRef]
  29. Bureau of Land Management. 2021. Available online: https://glorecords.blm.gov/ (accessed on 30 April 2021).
  30. Woudenberg, S.W.; Conkling, B.L.; O’Connell, B.M.; LaPoint, E.B.; Turner, J.A.; Waddell, K.L. The Forest Inventory and Analysis Database: Database Description and Users Manual Version 4.0 for Phase 2; U.S. Department of Agriculture, Forest Service, Rocky Mountain Research Station: Fort Collins, CO, USA, 2010. [Google Scholar]
  31. Hanberry, B.B.; Fraver, S.; He, H.S.; Yang, J.; Dey, D.C.; Palik, B.J. Spatial pattern corrections and sample sizes for forest density estimates of historical tree surveys. Landsc. Ecol. 2011, 26, 59–68. [Google Scholar] [CrossRef]
  32. Hanberry, B.B.; Yang, J.; Kabrick, J.M.; He, H.S. Adjusting forest density estimates for surveyor bias in historical tree surveys. Am. Midl. Nat. 2012, 167, 285–306. [Google Scholar] [CrossRef]
  33. Morisita, M. A New Method for the Estimation of Density by the Spacing Method Applicable to Non-Randomly Distributed Populations. Physiology and Ecology 7 1957, 134–144. Translation by U.S. Department of Agriculture, Division of Range Management. Available online: http://people.hws.edu/mitchell/Morisita1957.pdf (accessed on 3 July 2023).
  34. Huntsinger, L.; McCaffrey, S. A forest for the trees: Forest management and the Yurok environment, 1850 to 1994. Am. Indian Cult. Res. J. 1995, 19, 155–192. [Google Scholar] [CrossRef]
  35. Sherriff, R.L.; Veblen, T.; Sibold, J. Fire history in high elevation subalpine forests in the Colorado Front Range. Ecoscience 2001, 8, 369–380. [Google Scholar] [CrossRef]
  36. Dickinson, Y. Landscape restoration of a forest with a historically mixed-severity fire regime: What was the historical landscape pattern of forest and openings? For. Ecol. Manag. 2014, 331, 264–271. [Google Scholar] [CrossRef]
  37. Sherriff, R.L.; Platt, R.V.; Veblen, T.T.; Schoennagel, T.L.; Gartner, M.H. Historical, observed, and modeled wildfire severity in montane forests of the Colorado Front Range. PLoS ONE 2014, 9, e106971. [Google Scholar] [CrossRef] [PubMed]
  38. Mason, D.T. The Life History of Lodgepole Pine in the Rocky Mountains (No. 154). US Department of Agriculture. 1915. Available online: https://www.biodiversitylibrary.org/page/41910430#page/3/mode/1up (accessed on 23 February 2024).
  39. Bates, C.G. The Production Extraction Germination of Lodgepole Pine Seed; U.S. Department of Agriculture: Washington, DC, USA, 1930.
  40. Bates, C.G. Some relations of plant ecology to silvicultural practice. Ecology 1926, 7, 469–480. [Google Scholar] [CrossRef]
  41. Baker, W.L.; Hanson, C.T.; Williams, M.A.; DellaSala, D.A. Countering omitted evidence of variable historical forests and fire regime in western USA dry forests: The low-severity-fire model rejected. Fire 2023, 6, 146. [Google Scholar] [CrossRef]
  42. Graves, H.S. Protection of forests from fire (No. 82). US Department of Agriculture, Forest Service. 1910. Available online: https://archive.org/details/protectionoffore82grav (accessed on 23 February 2024).
  43. Graham, R.T. Hayman Fire Case Study; U.S. Department of Agriculture, Forest Service, Rocky Mountain Research Station: Ogden, UT, USA, 2003. [Google Scholar]
  44. Allen, C.D.; Anderson, R.S.; Jass, R.B.; Toney, J.L.; Baisan, C.H. Paired charcoal and tree-ring records of high-frequency Holocene fire from two New Mexico bog sites. Int. J. Wildland Fire 2008, 17, 115–130. [Google Scholar] [CrossRef]
  45. Lafon, C.W.; Naito, A.T.; Grissino-Mayer, H.D.; Horn, S.P.; Waldrop, T.A. Fire History of the Appalachian Region: A Review and Synthesis; U.S. Department of Agriculture, Forest Service, Southern Research Station: Asheville, NC, USA, 2017.
  46. Platt, R.V.; Schoennagel, T. An object-oriented approach to assessing changes in tree cover in the Colorado Front Range 1938–1999. For. Ecol. Manag. 2009, 258, 1342–1349. [Google Scholar] [CrossRef]
  47. Sherriff, R.L.; Veblen, T.T. Ecological effects of changes in fire regimes in Pinus ponderosa ecosystems in the Colorado Front Range. J. Veg. Sci. 2006, 17, 705–718. [Google Scholar] [CrossRef]
  48. Lindauer, I.E. A comparison of the plant communities of the South Platte and Arkansas River drainages in eastern Colorado. Southwest. Nat. 1983, 28, 249–259. [Google Scholar] [CrossRef]
  49. Galatowitsch, S.M. Using the original land survey notes to reconstruct presettlement landscapes in the American West. Great Basin Nat. 1990, 50, 181–191. [Google Scholar]
  50. Kellogg, R.S. Forest Belts of Western Kansas and Nebraska; Government Printing Office: Washington, DC, USA, 1905.
  51. Pohl, G.R.; Schmidt, B.C.; Lafontaine, J.D.; Landry, J.F.; Anweiler, G.G.; Bird, C.D. Moths and butterflies of the Prairies Ecozone in Canada. Arthropods Can. Grassl. 2014, 4, 169–238. [Google Scholar]
  52. Lytle, D.A.; Merritt, D.M. Hydrologic regimes and riparian forests: A structured population model for cottonwood. Ecology 2004, 85, 2493–2503. [Google Scholar] [CrossRef]
Figure 1. The Arapaho and Roosevelt National Forests in the southern Rocky Mountains, Colorado and Pawnee National Grassland in Weld County, Colorado, which border the heavily populated Front Range urban corridor. This area is in the South Platte watershed.
Fire 07 00103 g001
Figure 2. The Arapaho and Roosevelt National Forests study extent is the area with available records of General Land Office tree surveys (green square sections). This extent contained the approximate locations of current Forest Inventory and Analysis plots (green points).
Fire 07 00103 g002
Figure 3. The Weld County study extent is the area with available records of General Land Office tree surveys, of which five sections contained survey points with seven cottonwood (Populus) trees, compared to current (2016) land cover of forested area.
Fire 07 00103 g003
Figure 4. Concentrated historical forest locations (dark green) compared to current (year 2016, light green) forest cover in the Arapaho and Roosevelt National Forests study extent.
Fire 07 00103 g004
Figure 5. Different extents that demonstrate that currently, continuous woody wetlands are adjacent to the section where one cottonwood tree was recorded historically (A) with continuous woody cover along the South Platte River (B).
Fire 07 00103 g005
Table 1. Composition and diameter of trees (diameters ≥ 12.7 cm at 1.37 m height) for historical (years 1867 to 1883) and current (years 2002 to 2011) surveys in the Arapaho and Roosevelt National Forests.
CompositionDiameter (cm)
Scientific NameCommon NameCount PercentMeanMax
Historical
Pinus ponderosa, Pinus contorta, Pinus flexilispine356572.327.3101.6
Picea engelmannii, Pseudotsuga menziesiispruce116023.527.388.9
Populus tremuloidesquaking aspen961.918.438.1
N/Aunidentified trees481.033.658.4
Populus deltoides, P. angustifoliacottonwood320.624.140.6
Abies lasiocarpafir260.526.150.8
Juniperus scopulorumRocky Mountain juniper80.219.130.5
Fraxinus pennsylvanicagreen ash10.015.215.2
Celtis occidentalishackberry10.033.033.0
Current
Pinus contortalodgepole pine397747.019.854.9
Picea engelmanniiEngelmann spruce134915.923.989.9
Abies lasiocarpasubalpine fir120014.220.160.7
Pinus ponderosaponderosa pine7258.624.758.7
Pseudotsuga menziesiiDouglas-fir5025.920.978.7
Populus tremuloidesquaking aspen3884.619.140.4
Pinus flexilislimber pine2162.623.653.8
Juniperus scopulorumRocky Mountain juniper921.121.549.3
Pinus aristataRocky Mountain bristlecone pine70.118.727.9
Picea pungensblue spruce50.136.056.4
Abies lasiocarpa var. arizonicacorkbark fir20.017.517.8
Table 2. Density (trees/ha; diameters ≥ 12.7 cm at 1.37 m height) from historical surveys, for all survey points with ≥2 trees and at two elevations and unadjusted and adjusted for surveyor bias, and density from all current surveys and two elevations in the Arapaho and Roosevelt National Forests.
SurveyDensity (Unadjusted)Clustered/LowMeanHigh
Historical, all points with trees159153172191
Historical, elevation < 2800 m127120135150
Historical, elevation ≥ 2800 m188187210234
Current 480522564
Current, elevation < 2800 m 373429484
Current, elevation ≥ 2800 m 543602660
Disclaimer/Publisher’s Note: The statements, opinions and data contained in all publications are solely those of the individual author(s) and contributor(s) and not of MDPI and/or the editor(s). MDPI and/or the editor(s) disclaim responsibility for any injury to people or property resulting from any ideas, methods, instructions or products referred to in the content.

