Article

An Experimental Analysis of a Nuclear-Grade Cable Based on Fire Combustion Characteristics and Pyrolysis Behavior

Nuclear and Radiation Safety Center, Ministry of Ecology and Environment of the People’s Republic of China, Beijing 102445, China
*
Author to whom correspondence should be addressed.
Fire 2024, 7(3), 101; https://doi.org/10.3390/fire7030101
Submission received: 18 July 2023 / Revised: 16 November 2023 / Accepted: 4 December 2023 / Published: 21 March 2024
(This article belongs to the Special Issue Advances in Industrial Fire and Urban Fire Research)

Abstract

:
Nuclear power fire protection is an important part of nuclear safety, and strengthening fire protection technology research is essential for improving nuclear safety and fire protection. The operating platform inside a containment structure is one important element in fire risk evaluation in nuclear power plants. In this paper, a combustible nuclear-grade cable in a fire scenario was firstly selected as the research object, and then the nuclear-grade cable was separately subjected to a combustion test as well as a thermogravimetric test in order to obtain the relevant thermal parameters, which provide more accurate data support for the establishment of a cable fire development and spread model. The nuclear-grade cable material data obtained from the test were compared with a civil PVC cable in order to conduct a specific analysis of the fire risk of nuclear-grade cables. This study shows that the effects of different heating rates and heating atmospheres on the thermal decomposition behavior of cable materials are meaningful and helpful in understanding whether the materials will undergo combustion processes at high temperatures and whether fire spread will occur.

1. Introduction

Among the many potential accidents that occur in nuclear power plants, the problems caused by fire are becoming increasingly more obvious. Fire and explosion accidents have a serious impact on the status of reactor evacuation, and cables have been the focus of attention in the field of nuclear safety and fire protection [1]. Nuclear power plants use a large number of cables, resulting in a high fire risk once the cables are ignited. Depending on the type of heap, the length of the cable used can be as long as 3000 km. Among the cables used in nuclear power plants, those that meet the requirements of the nuclear safety class are called cables within the NPP-containment. According to the provisions of the “General Requirements for Cables Within the NPP-containment for Nuclear Power Plants” (GB/T 22577-2008) [2], equipment within the NPP-containment serves to complete the reactor emergency shutdown, containment isolation, reactor core emergency cooling, and reactor and reactor plant residual heat dissipation, as well as prevent the release of radioactive substances to the surrounding environment. Nuclear class cables (i.e., cables within the NPP-containment) can be divided into power cables (including 0.6/1 kv, 6/10 kv), control cables, instrumentation cables, and compensation cables according to their uses. With the intelligent construction of nuclear power plants, new types of communication cables, optical fiber cables, and others are increasingly used [3].
At present, many nuclear power plants are entering into operation, and the threat of fire to nuclear safety is also receiving increasing attention. In fire hazard analysis, fire scene simulation analysis is an important component [4]. The accuracy of the simulation results depends on the establishment of the development and spread model of combustible fire. Therefore, when setting thermal parameters in a development and spread model of combustible fire, we should try to use real parameters obtained from an experiment [5].
In this paper, a combustible nuclear-grade cable within a fire scenario was firstly selected as the research object, and then the nuclear-grade cable was separately subjected to a combustion test as well as a thermogravimetric test in order to obtain relevant thermal parameters, which provide more accurate data support for the establishment of a cable fire development and spread model [6]. The nuclear-grade cable material data obtained from the test were compared with a civil PVC cable (the research object of the test in this paper is class K2 low-smoke, halogen-free, flame-retardant copper-core-crosslinked polyolefin-insulated crosslinked polyethylene-sheathed nuclear-grade cables, and the purpose of selecting civil PVC cables with typically good insulation, impact resistance, and fire resistance for comparison is to highlight the good combustion characteristics of nuclear-grade cables) in order to conduct a specific analysis of the fire risk of nuclear-grade cables [7].

2. Fire Test Analysis Model for Nuclear-Grade Cables

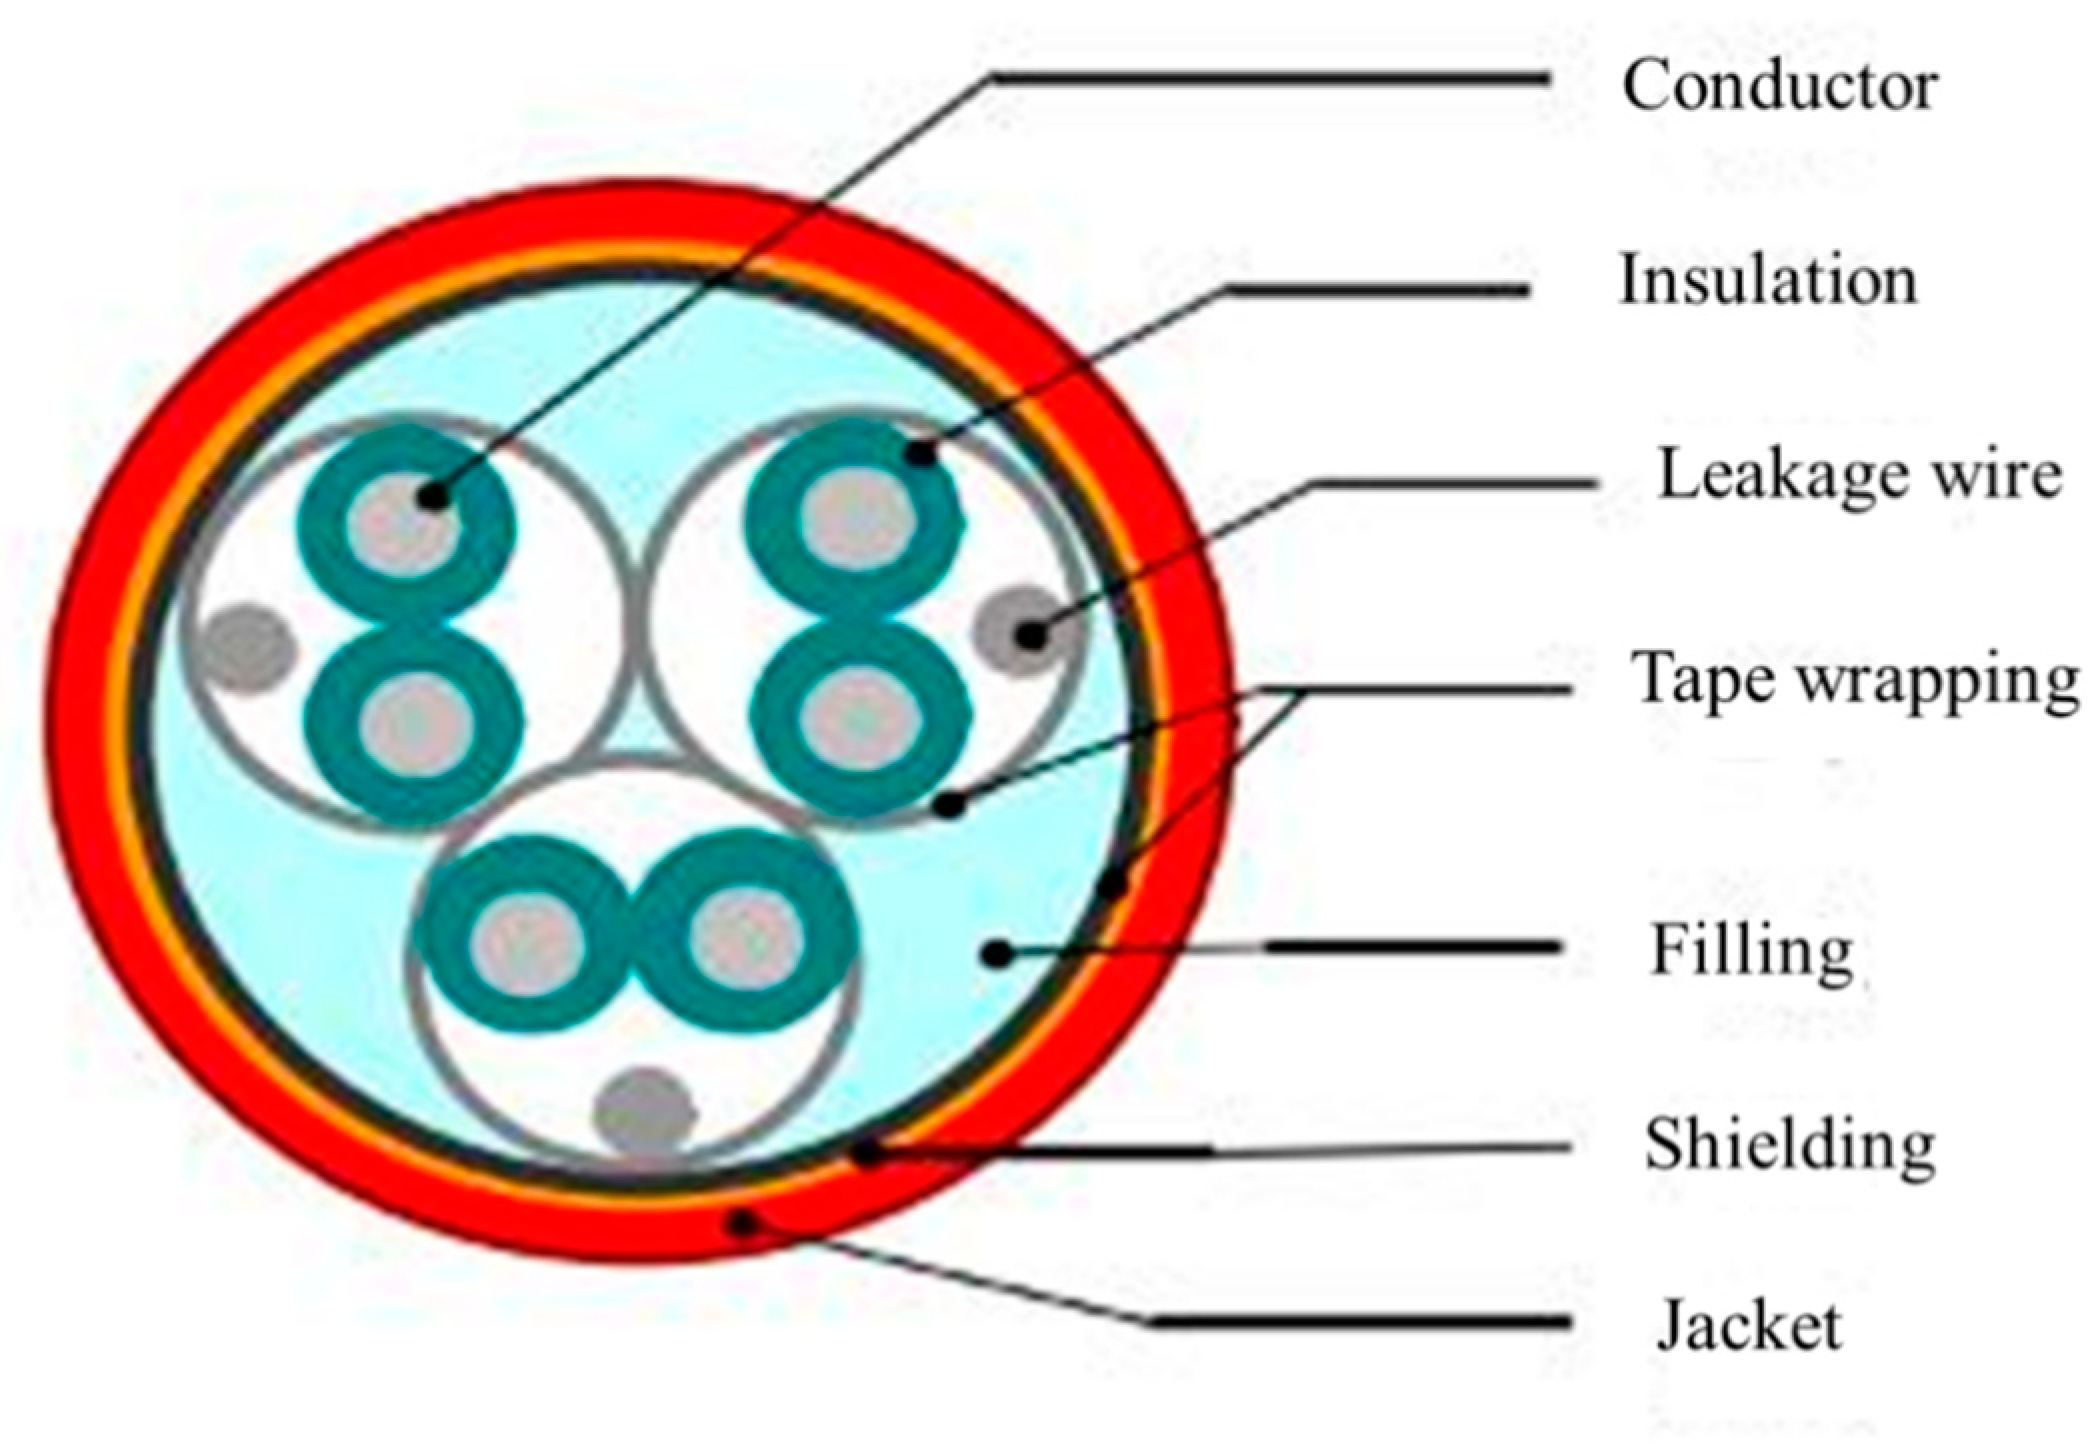
2.1. Structural Characteristics of Nuclear-Grade Cable Structures

Nuclear power cables are used in nuclear power plants for nuclear safety-related systems, including the following categories: medium-voltage and low-voltage power cables, control cables, and instrumentation cables [8].
Nuclear-grade cables are composed of conductors, insulation, shielding (in control cables and proprietary instrumentation cables), a filler, a sheath, and other parts. The components of each cable are different, but they inevitably include conductors, insulation, and a sheath.
Based on the actual needs of nuclear power operation, nuclear-grade control cables use copper conductor materials, while the cable core uses 2 to 37 cores and aluminum foil shielding or copper foil shielding; the nuclear-grade instrumentation cable core uses two to four cores and a copper wire braid shielding to adapt to the use of nuclear power instrumentation; and nuclear-grade low-voltage cables generally use a copper and aluminum conductor, with the number of cable cores being one to five and not containing a shielding layer. Compared to the first two categories, they are designed for less demanding use, and their structure can be seen in Figure 1.
The uses of nuclear-grade cables and civil cables are quite different, and the former requires higher durability and stability to meet the safety requirements of nuclear power operation.

2.2. Selection of Nuclear-Grade Cables

A design code for I&C and electrical systems (RCC-E), compiled by SNCTHE and AFCEN in France, divides nuclear-grade cables into K1, K2, and K3 according to their safety categories.
Among them, a K1 cable is installed in the containment, and will not lose its functional integrity under any circumstances. A K2 cable is installed in the containment, and will not lose its functional integrity during the normal operation of nuclear power plants in the event of an earthquake; as a cable installed outside the containment, a K3 cable will not lose its functional integrity during the normal operation of a nuclear power plant in the event of an earthquake.
The particularity of a nuclear-grade cable laying environment endows it with many properties that ordinary cables do not have. In addition to their low-smoke, halogen-free, and flame-retardant properties, nuclear-grade cables also need to have a certain degree of tolerance to the above-mentioned special environment due to the possible high temperature, high pressure, high humidity, γ-ray irradiation, mechanical traction, and other environmental factors. The structure of a nuclear-class cable is similar to that of ordinary cables. It is composed of conductors, insulation, shielding, a filler, wrap, and a sheath. On the inner wall of the cable is a crosslinked polyethylene insulation sheath, which is provided with a steel belt, which is provided with a filler layer, which is provided with copper wires, which are provided with a card block on one side. On both sides of the card block is a circular arc structure, and on the outer wall of it is a spring, which has a cushion. There is a low-smoke, halogen-free, flame-retardant layer on the outer wall of the cushion. The schematic diagram is shown in Figure 1.
In this paper, a K2 low-smoke, non-halogen, flame-retardant copper core-insulated XLPE-sheathed cable is selected as the research object.

2.3. Failure Criteria for Cables

As fire spreads, the temperature around the cable will also rise, resulting in cable failure. In Nureg/CR-6850, the criterion of cable failure is given, which is judged from two aspects: one is temperature, and the other is heat radiation flux. The critical values of cable failure are different because of the different thermal properties of cables. A K2 low-smoke, halogen-free, flame-retardant copper core-insulated XLPE-sheathed cable is a crosslinked cable with a conductor, insulation, shielding, a filler, and a sheath. The specific critical values are shown in Table 1.

3. Combustion Test for Nuclear-Grade Cables

3.1. Test Program and Samples

3.1.1. Selection of Test Apparatus and Thermal Radiation Flux

The test was performed using a Dual Cone calorimeter from FTT, UK with a thermal radiation flux ranging from 0 to 100 kW/m2.
During the development and spread of a fire, heat is transmitted mainly through thermal radiation. Generally speaking, the upper temperature range of indoor hot smoke when boom ignition occurs is 600 °C to 800 °C, and its equivalent heat radiation flux is 29 kW/m2 to 68 kW/m2. Therefore, four heat radiation fluxes of 30 kW/m2, 40 kW/m2, 50 kW/m2, and 60 kW/m2 are selected for this test.

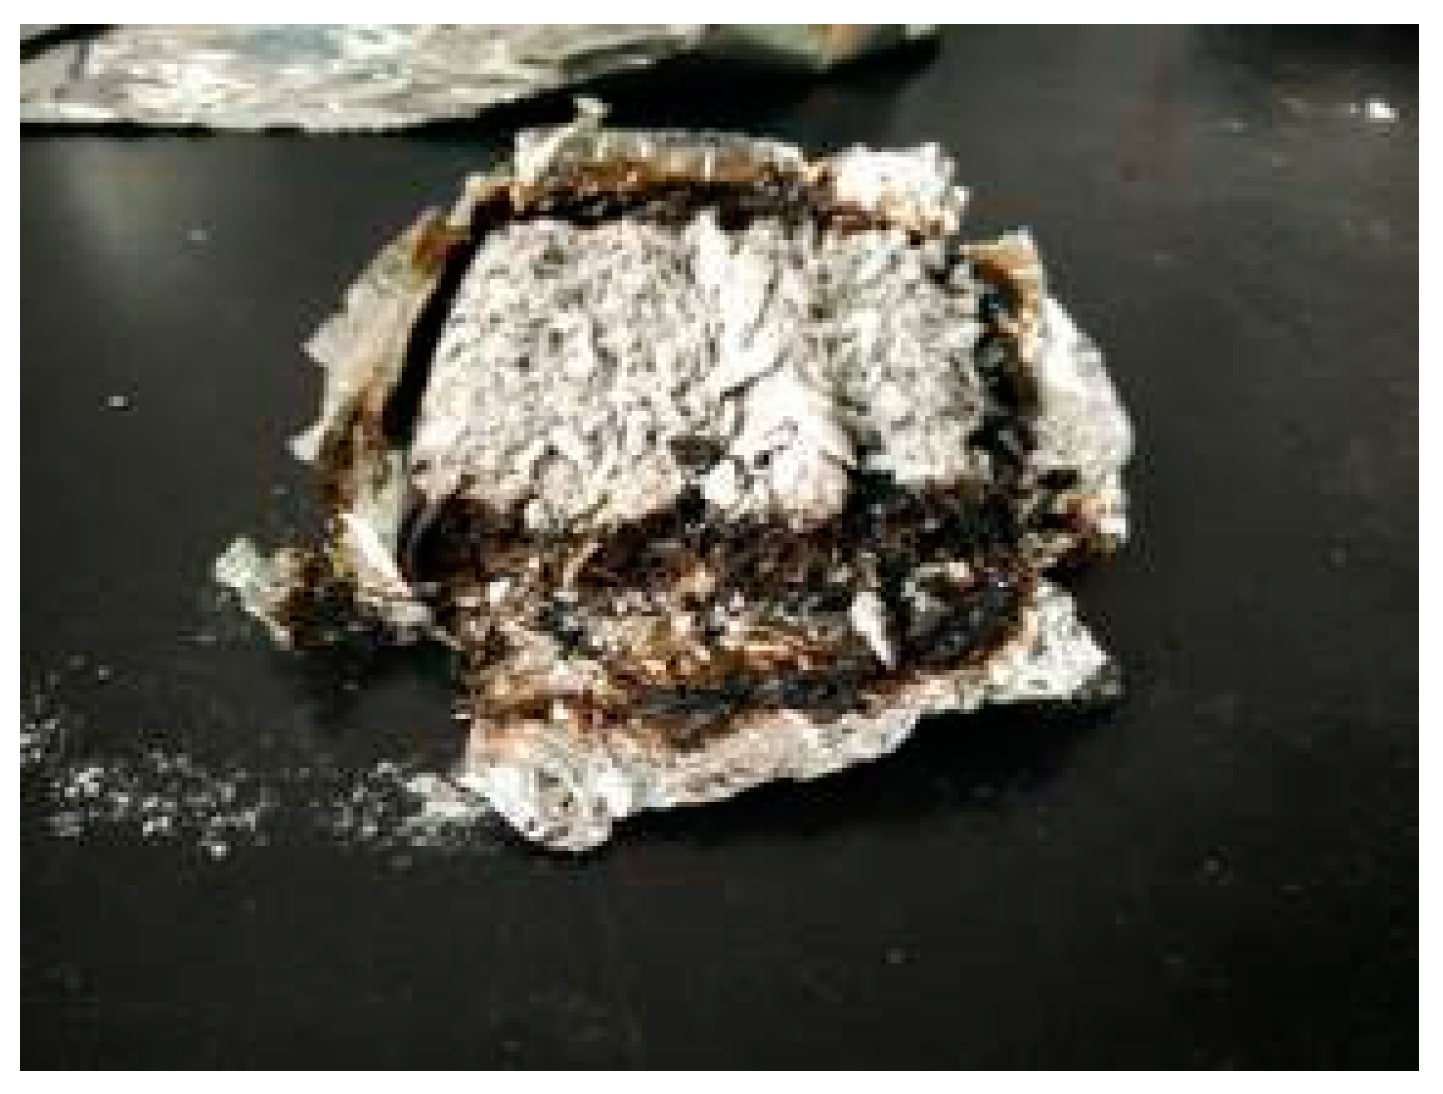
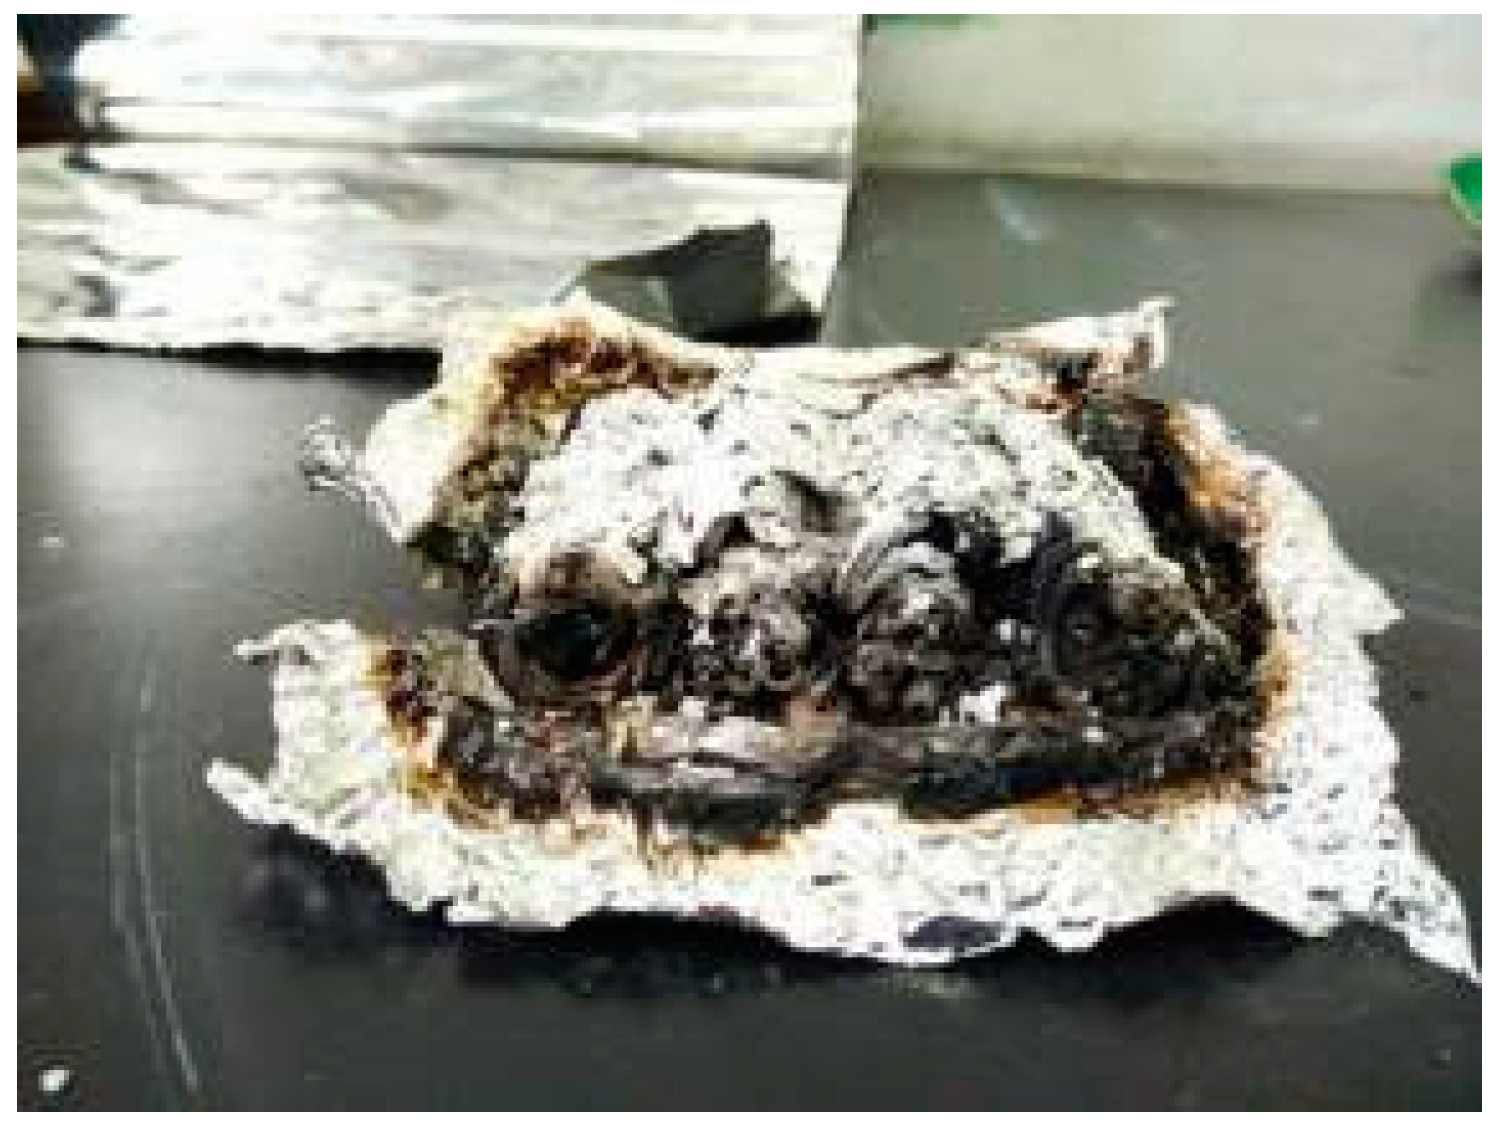
3.1.2. Preparation of Test Samples

In accordance with the sample preparation method specified in the ISO5660-2002 standard [9], the cable was first placed in an environment with a relative humidity of 55% and a temperature of 20 °C for 24 h before the test in order to reach equilibrium. The cable was cut into small sections of 100 mm in length, and the sections were placed side by side in order to reach a total width of 100 mm, i.e., arranged in a flat size of 100 mm × 100 mm, with the thickness being the actual thickness of the material. In order to minimize edge effects, the bottom and perimeter of the sample were wrapped with aluminum foil so that it was exposed on one side. Then, a piece of a mineral wool fiber blanket with a thickness of 13 mm, a density of 650 kg/m3, and large thermal resistance was placed at the bottom of the aluminum foil to reduce the heat loss from the non-heated surface. The test sample is shown in Figure 2.

3.2. Test Results and Discussion

Figure 3, Figure 4, Figure 5 and Figure 6 show the test samples remaining after the tests at heat radiation fluxes of 30 kW/m2, 40 kW/m2, 50 kW/m2, and 60 kW/m2, respectively.

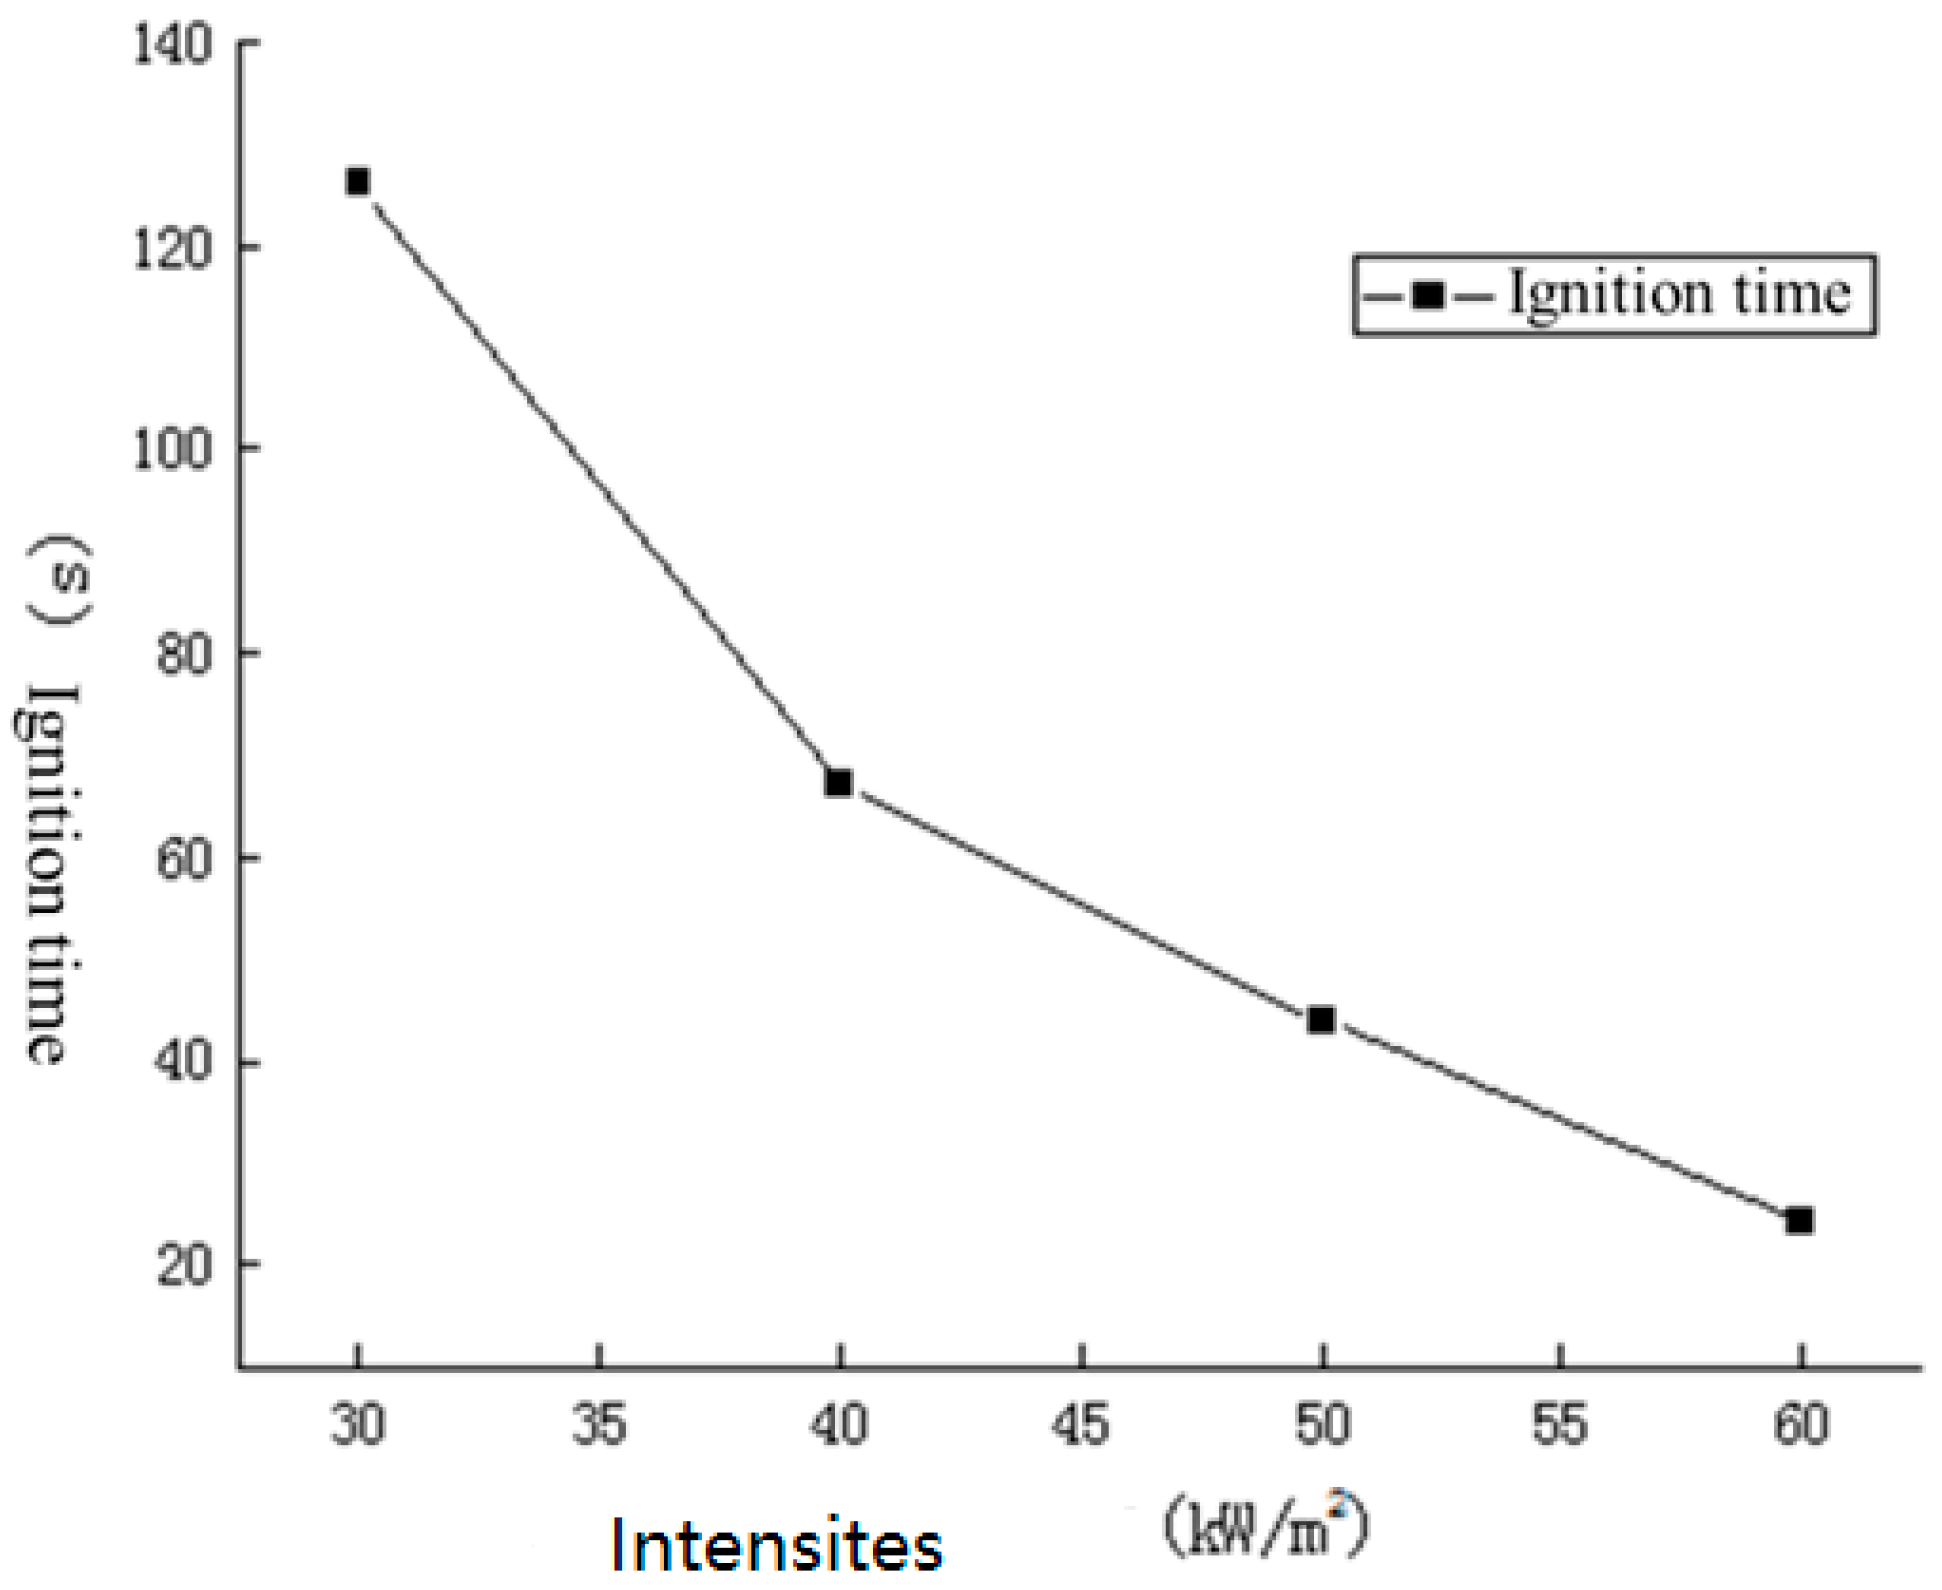
3.2.1. Ignition Time Analysis

Ignition time refers to the time elapsed between the sample being heated by the ignition source at a certain thermal radiation intensity and its ignition. The longer the ignition time, the less likely the material is to ignite under the conditions, and the less fire hazard the material has. Table 2 records the ignition times of cables at different thermal radiation intensities.
It can be seen from Figure 7 that the ignition times of the cables are closely related to the magnitude of the applied thermal radiation intensity. When the heat radiation intensity increased from 30 kW/m2 to 60 kW/m2, the ignition time decreased from 126 s to 24 s. This is mainly because a higher heat radiation intensity can result in a higher heating rate of the sample surface, which can shorten the time for the sample to reach the ignition point, improve the rate of combustible volatile production, and shorten the time it takes for the sample to reach the concentration conditions for ignition.

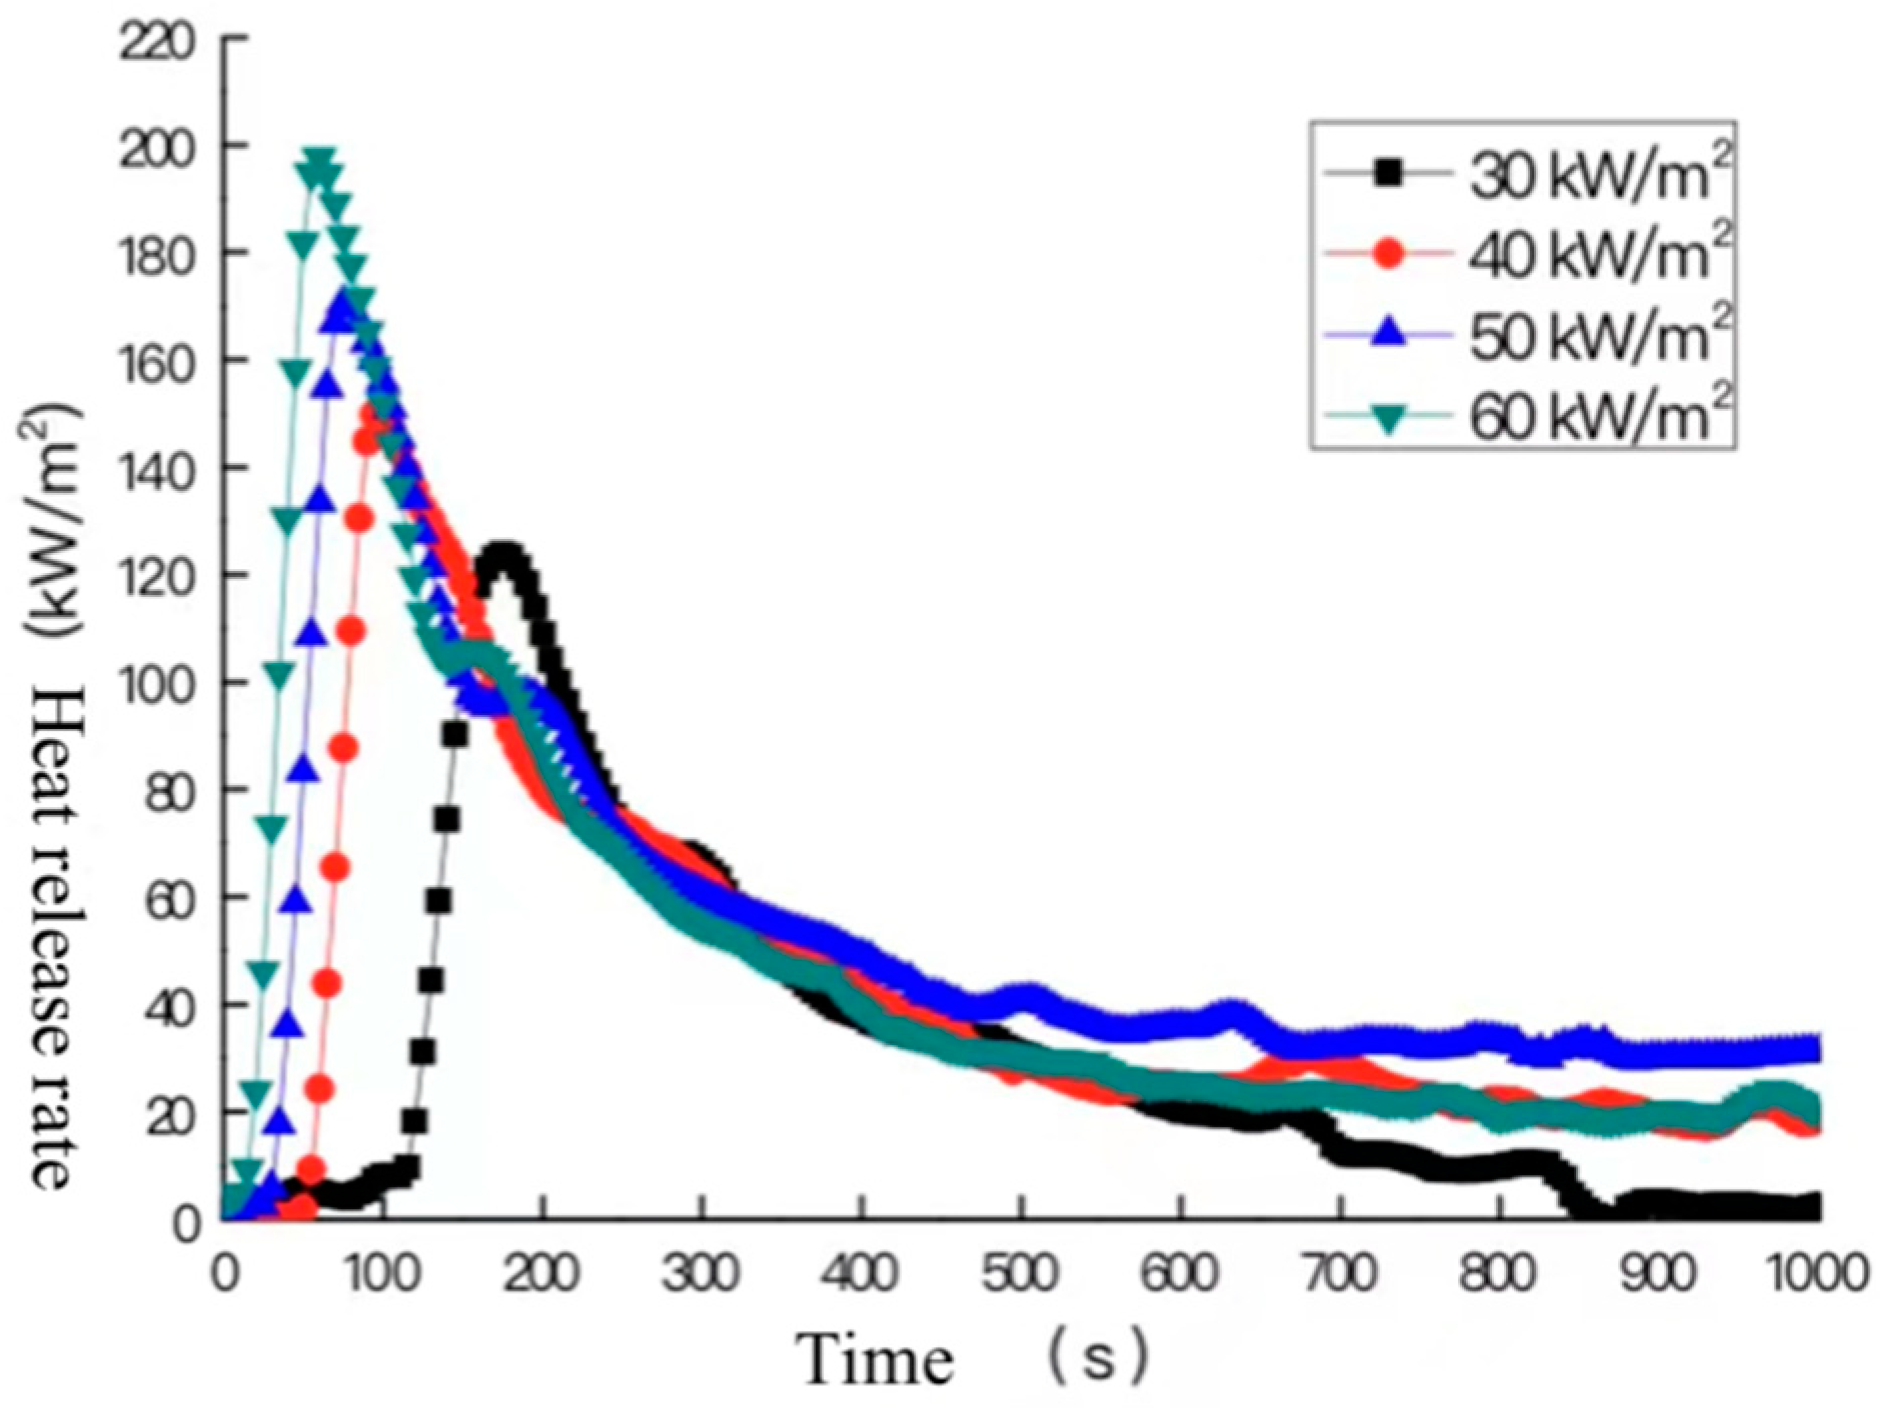
3.2.2. Heat Release Rate Analysis

The heat release rate refers to the heat that is released during the combustion of the material per unit time, which is one of the references for evaluating the combustion performance and fire risk of materials. In indoor fires, if the heat release rate of a material is high, the hot smoke from the ceiling and the surrounding walls will warm up faster, which will enhance the rate of heat transfer to the surrounding combustible materials. As a result, more combustible materials will burn, expanding the development and spread of fire and smoke. The heat release rate curves of the cable samples throughout the test were measured using a cone calorimeter, and the heat release rate curves of the cable samples at the heat radiation intensities of 30 kW/m2, 40 kW/m2, 50 kW/m2, and 60 kW/m2 are shown in Figure 8.
As can be seen from the figure, although the heat radiation intensities are different, the overall trends of the curve are similar. The heat release rate change process of the cable can be divided into four stages: The first stage is the accelerated growth stage, which features a rapid increase in the heat release rate after the sheath of the cable is ignited; to be specific, the heat release rate of the sample reaches the peak at 175 s, 100 s, 75 s, and 60 s, respectively, under the measured heat radiation intensity. The second stage is the fallback stage, in which the heat release rate gradually decreases from the peak, mainly because the cable sheath is a crosslinked polyolefin, which is a thermosetting material, and that continuously generates a charcoal layer on the surface during the combustion process. The charcoal layer inhibits the heat transfer to the interior of the material to a certain extent, thus reducing the production of pyrolysis combustible products. Therefore, the heat release rate gradually decreases. The third stage is the rebound stage, in which the heat release rate gradually increases again. This is because under the applied heat radiation intensity, the surface of the material generated by the carbon layer is gradually subjected to oxidation decomposition, thus beginning to become thin and crack. The heat begins to gradually go through the carbon layer to the unburned samples inside the material, which is quickly subjected to pyrolysis combustion; hence, the second peak of the heat release rate is formed. The greater the heat radiation intensity of the working condition, the more heat is transferred to the material inside, the more completely the material inside burns, and the higher the second peak is. The third stage is the decay stage, in which the heat release rate gradually decreases as the combustible material in the sample burns out.
The total heat release, peak heat release rate, and average heat release rate of the cable samples under different heat radiation intensities are summarized in Table 3.

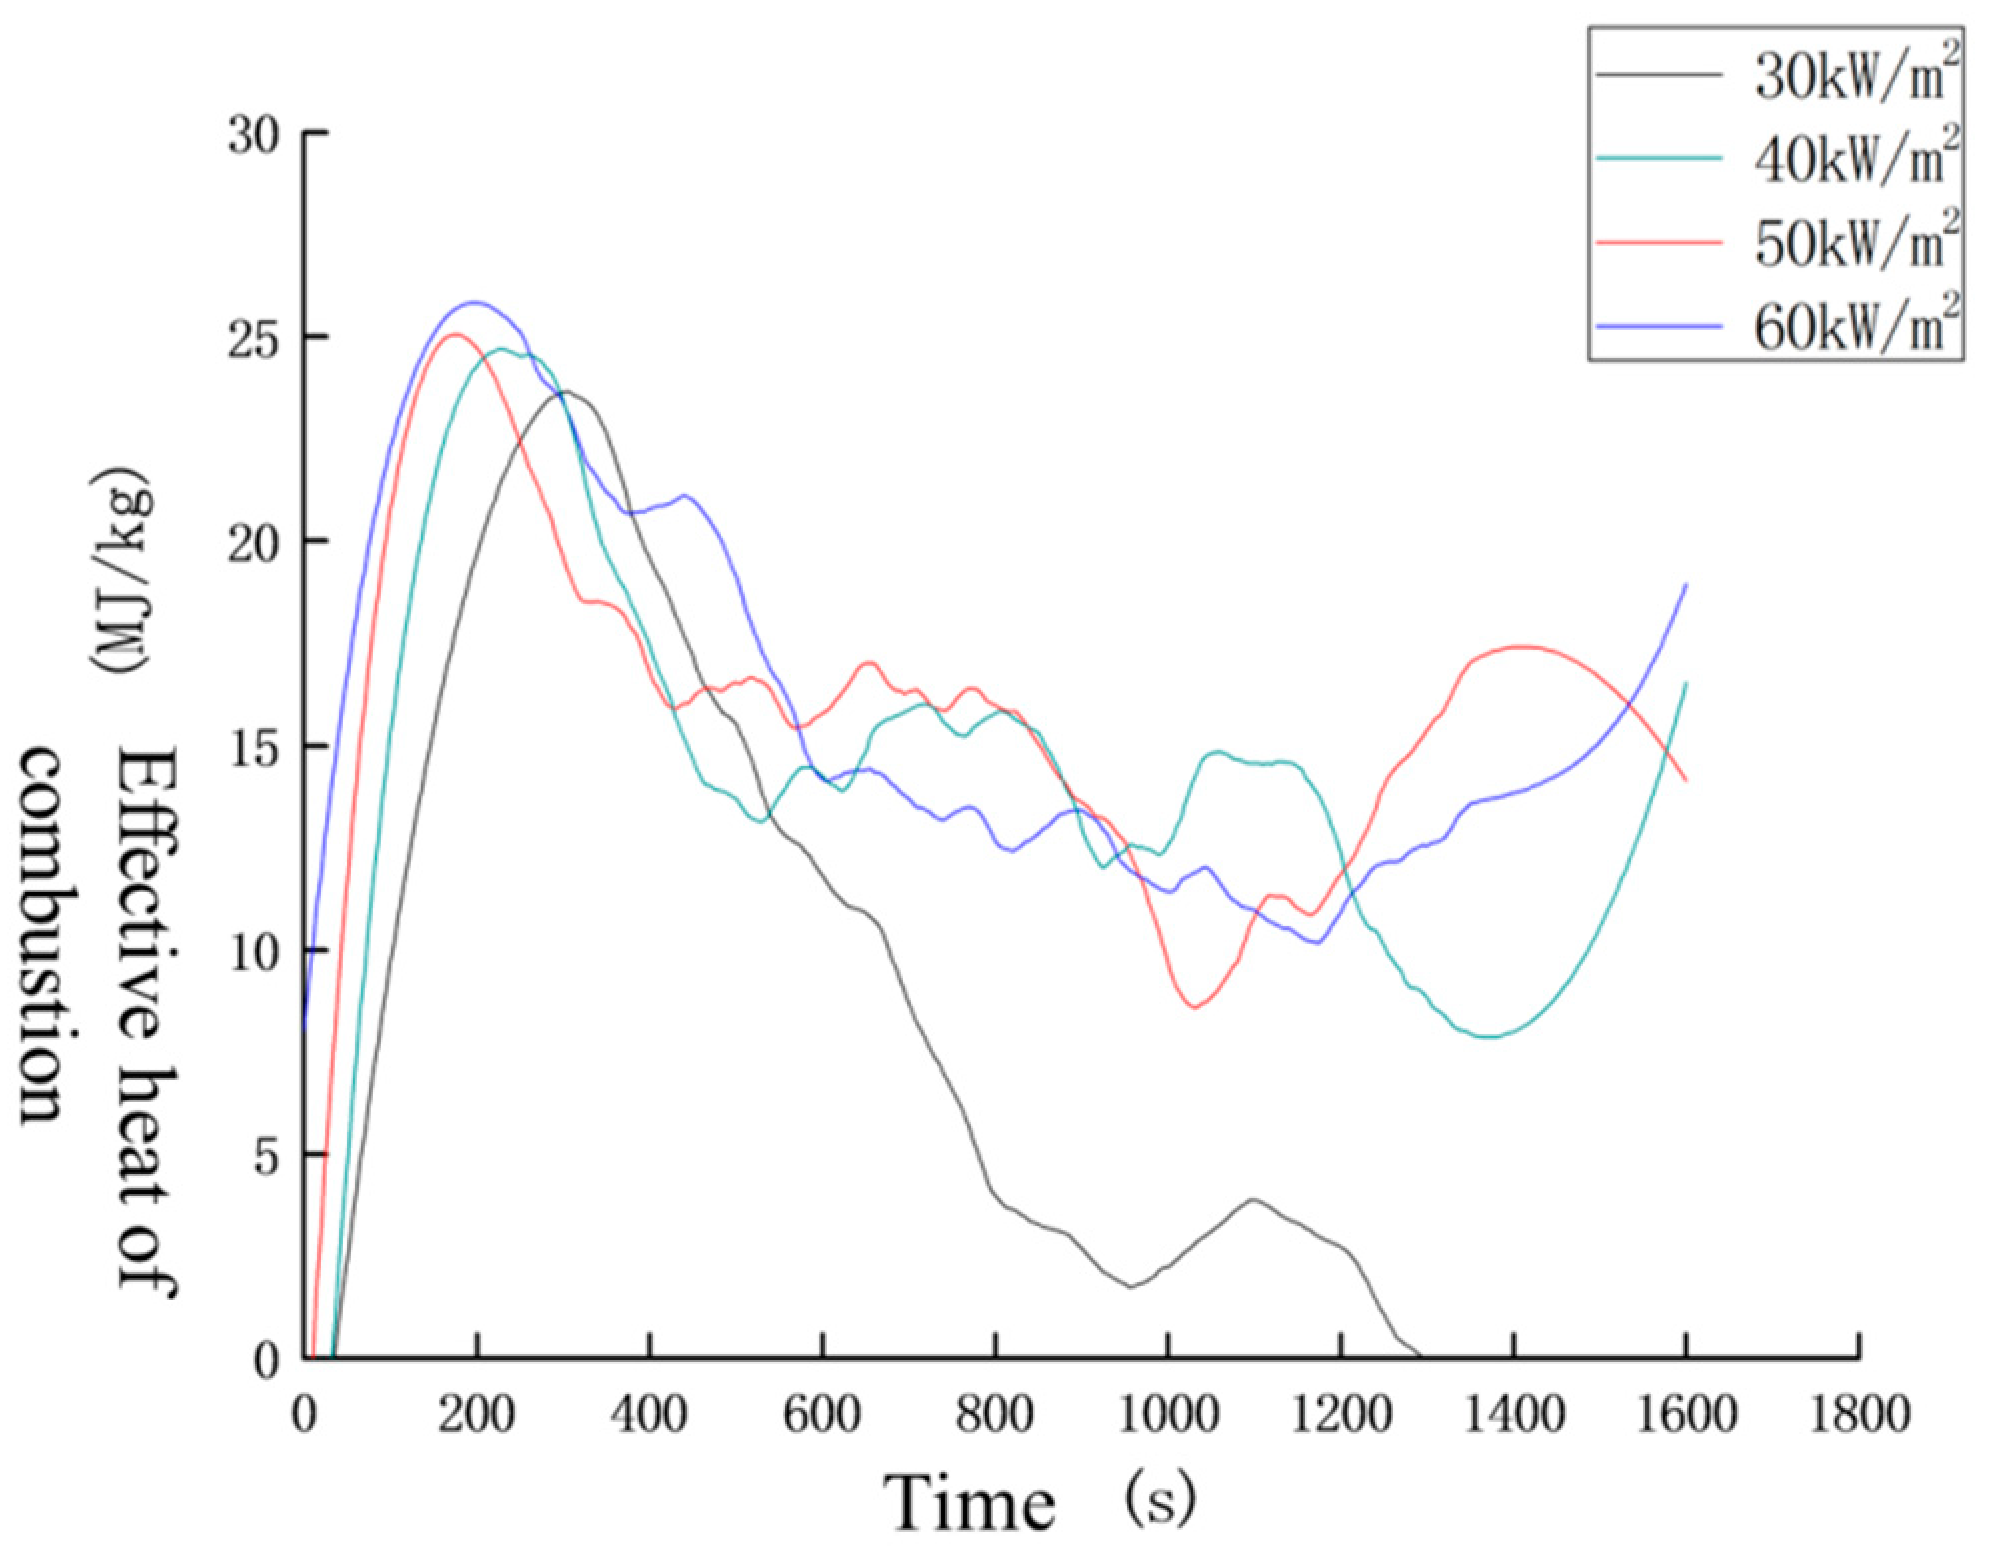
3.2.3. Analysis of the Effective Heat of Combustion

Heat is an important factor for the maintenance and diffusion of combustion. It boosts the temperature of the gaseous and solid products resulting from the decomposition of the material, which, in turn, causes the gas to expand and enhances the energy transferred by heat convection, heat conduction, and heat radiation.
Currently, the heat of combustion is divided into the theoretical heat of combustion and the effective heat of combustion. The theoretical heat of combustion refers to the amount of heat that can be released by the complete combustion of 1 mol of a material at a standard temperature for both the reactants and the products. The effective heat of combustion refers to the heat that is released from the combustion of the combustible part of the volatiles that decomposed in the combustion process. In an actual fire situation, materials usually cannot burn completely, and actual fire conditions also differ greatly from the standard environment. Therefore, the effective heat of combustion, rather than the theoretical heat of combustion, can better reflect the heat release of materials in an actual fire. If the effective heat of combustion of the cable from the test is considered in the computer simulation of the fire process, the reliability of the simulation can increase.
The effective combustion heat of the cable under different thermal radiation intensities is shown in Figure 9. From the figure, it can be seen that thermal radiation intensity has a more obvious effect on the effective combustion heat, and the greater the thermal radiation intensity, the higher the effective combustion heat. After analyzing and calculating, under the thermal radiation intensities of 30 kW/m2, 40 kW/m2, 50 kW/m2 and 60 kW/m2, the average effective heat of cable combustion is 9.56 MJ/kg, 10.82 MJ/kg, 13.02 MJ/kg, and 14.86 MJ/kg, respectively. It can be seen that the increasing intensity of thermal radiation leads to an increasing rate of heating of the cable sheath, with a consequent increase in the amount of heat released from the pyrolysis of the sheath, and hence an increase in the effective heat of combustion.

3.2.4. Fire Performance Index Analysis

The fire performance index refers to the ratio of ignition time to the peak heat release rate, and its expression is as follows:
F P I = T i g p k H R R
The fire performance index takes into account the ignition time and heat release rate and reflects the ability of materials to respond to heat. The lower the FPI, the less flame retardant the product is. Materials are more likely to catch fire and burn when they are in a thermal environment of sufficient strength. Table 4 gives the fire performance indices of cable samples at different heat radiation intensities.
As can be seen from the above table, a higher intensity of thermal radiation will result in a decrease in the fire performance index of the materials and an increase in fire hazard.

3.2.5. Evaluation of Cable Fire Hazard

In order to better evaluate the fire hazard of the nuclear-grade cable, which is the test object of this paper, the burning characteristics of the civil cable were selected for comparison at thermal radiation intensities of 30 kW/m2, 40 kW/m2, 50 kW/m2, and 60 kW/m2. A PVC cable is made of a conductor, insulation, shielding, a filler, and a sheath. Both cables were tested under the same thermal radiation intensity and with the same test sample preparation process, during which the cable was cut into sections with a length of 100 mm. The sections were placed side by side in order to reach a total width of 100 mm, i.e., they were arranged in a flat size of 100 mm × 100 mm, with the thickness being the actual thickness of the material. In order to minimize the edge effects, the bottom and perimeter of the sample were wrapped with aluminum foil so that it was exposed on one side.
Table 5 shows the total heat release, peak heat release rate, and average heat release rate of a PVC cable and nuclear-grade cable at different heat radiation intensities, respectively.
As can be seen from Table 5, the total heat release and average heat release rate of the PVC cable are much greater than those of the nuclear-grade cable, while the peak heat release rates of the two are more or less identical, with that of the nuclear-grade cable being slightly larger. A set of comparison tests was conducted using a cone calorimeter, and the corresponding peak differences in the heat release rates were 4.06 kW/m2, 33.4 kW/m2, 9.39 kW/m2, 9.17 kW/m2, and 9.17 kW/m2 at thermal radiation intensities of 30 kW/m2, 40 kW/m2, 50 kW/m2, and 60 kW/m2, respectively. This indicates that the fire hazard of PVC cables is much greater than that of nuclear-grade cables. At a thermal radiation intensity of 60 kW/m2, the total heat release rate difference is 117.56 kW/m2.
Table 6 shows the effective heat of combustion for the two cables at different heat radiation intensities, respectively.
As can be seen from Table 2, Table 3, Table 4 and Table 5, when the thermal radiation intensity values are 30 kW/m2 and 40 kW/m2, the effective heat of combustion of the PVC cable is slightly higher than that of the nuclear-grade cable. When the thermal radiation intensity values are 50 kW/m2 and 60 kW/m2, the effective heat of combustion of the nuclear-grade cable is slightly higher than that of the PVC cable. However, in general, the difference between the effective heat of combustion of the two cables is not huge.

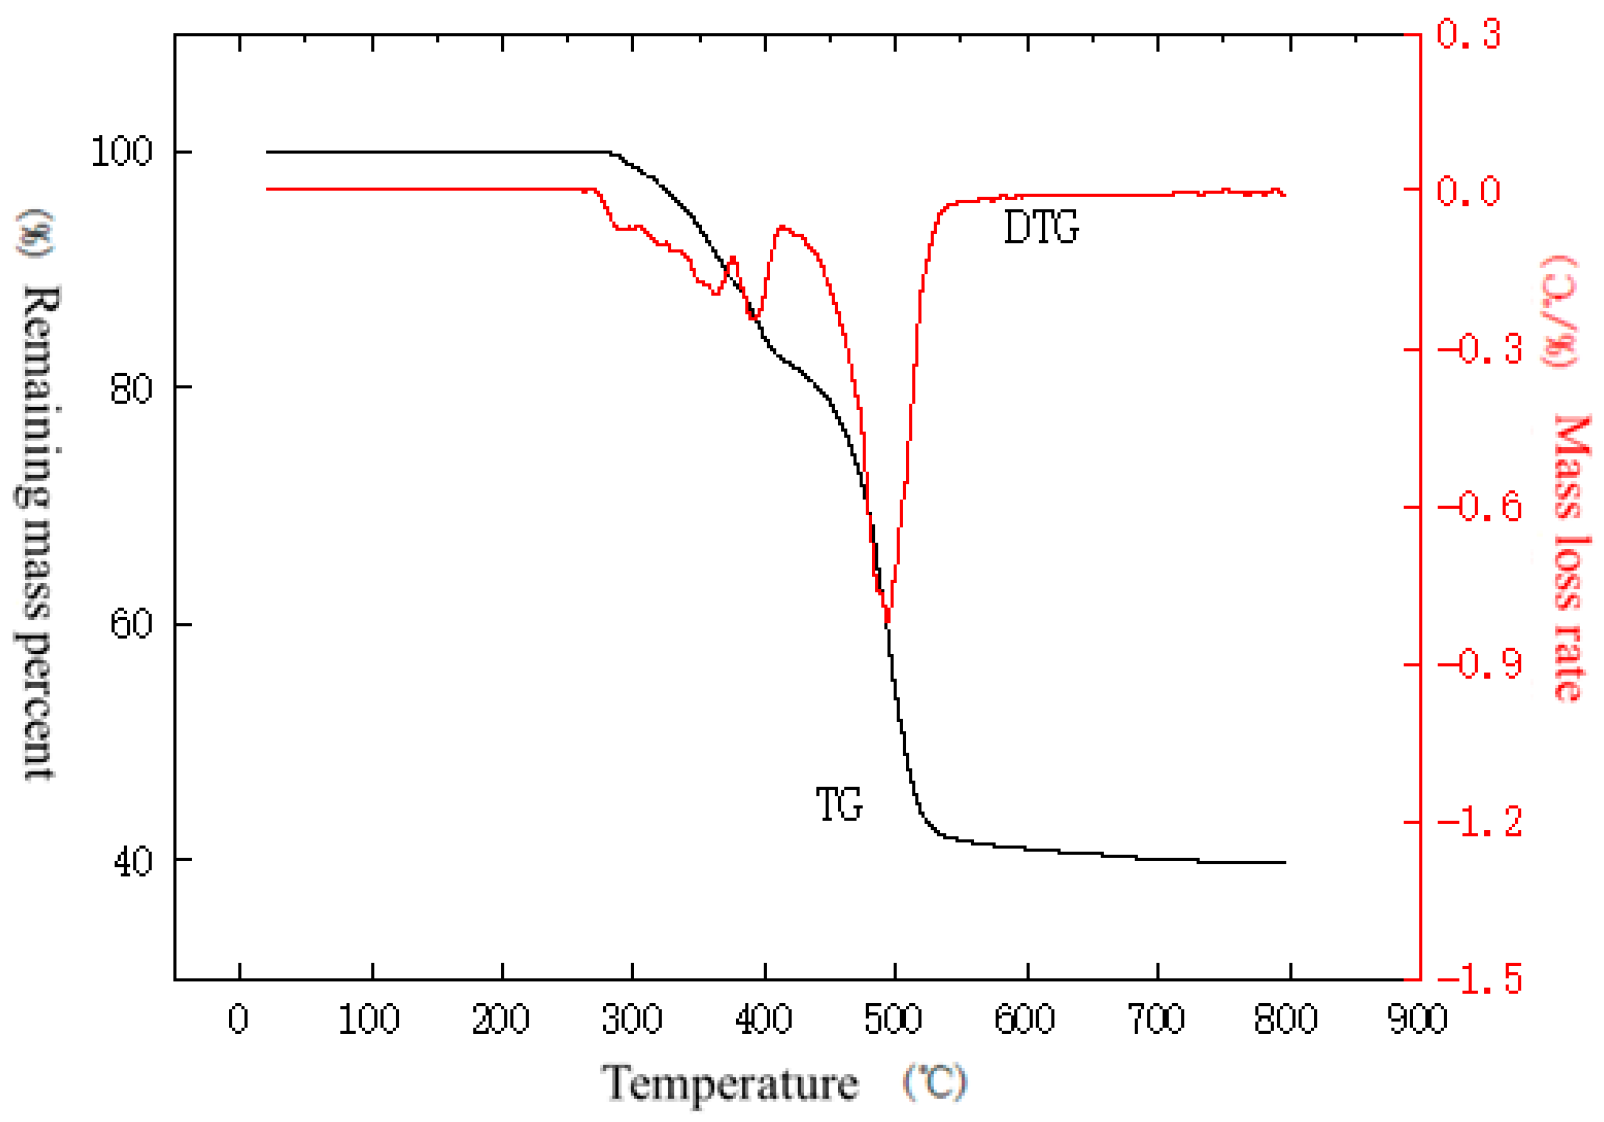
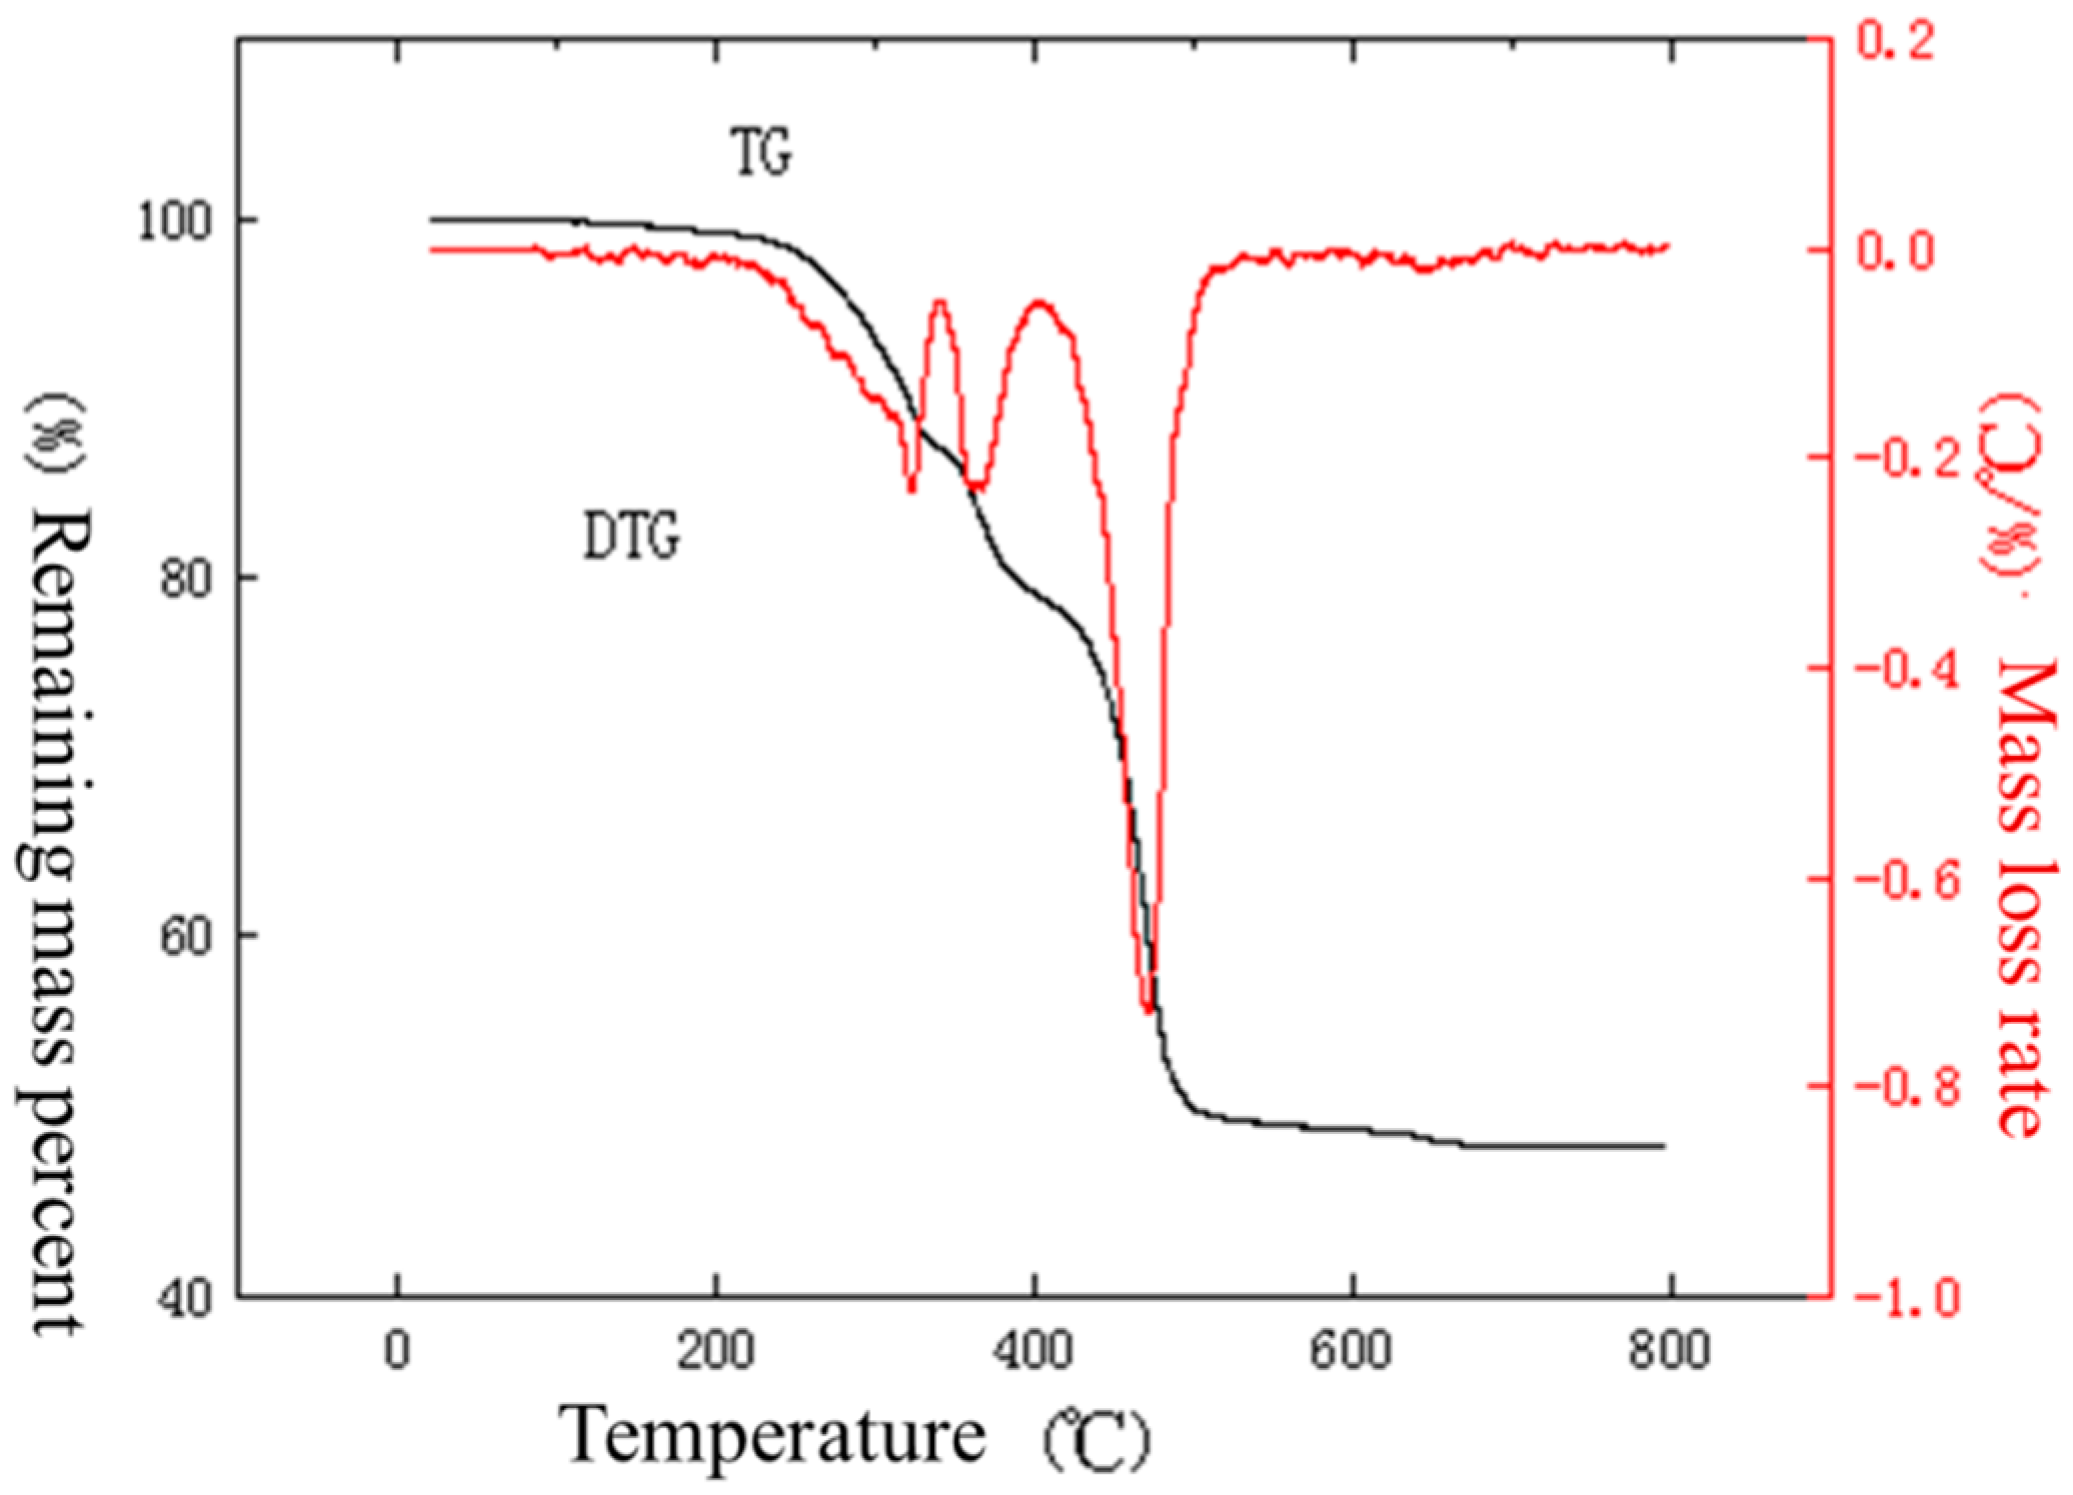
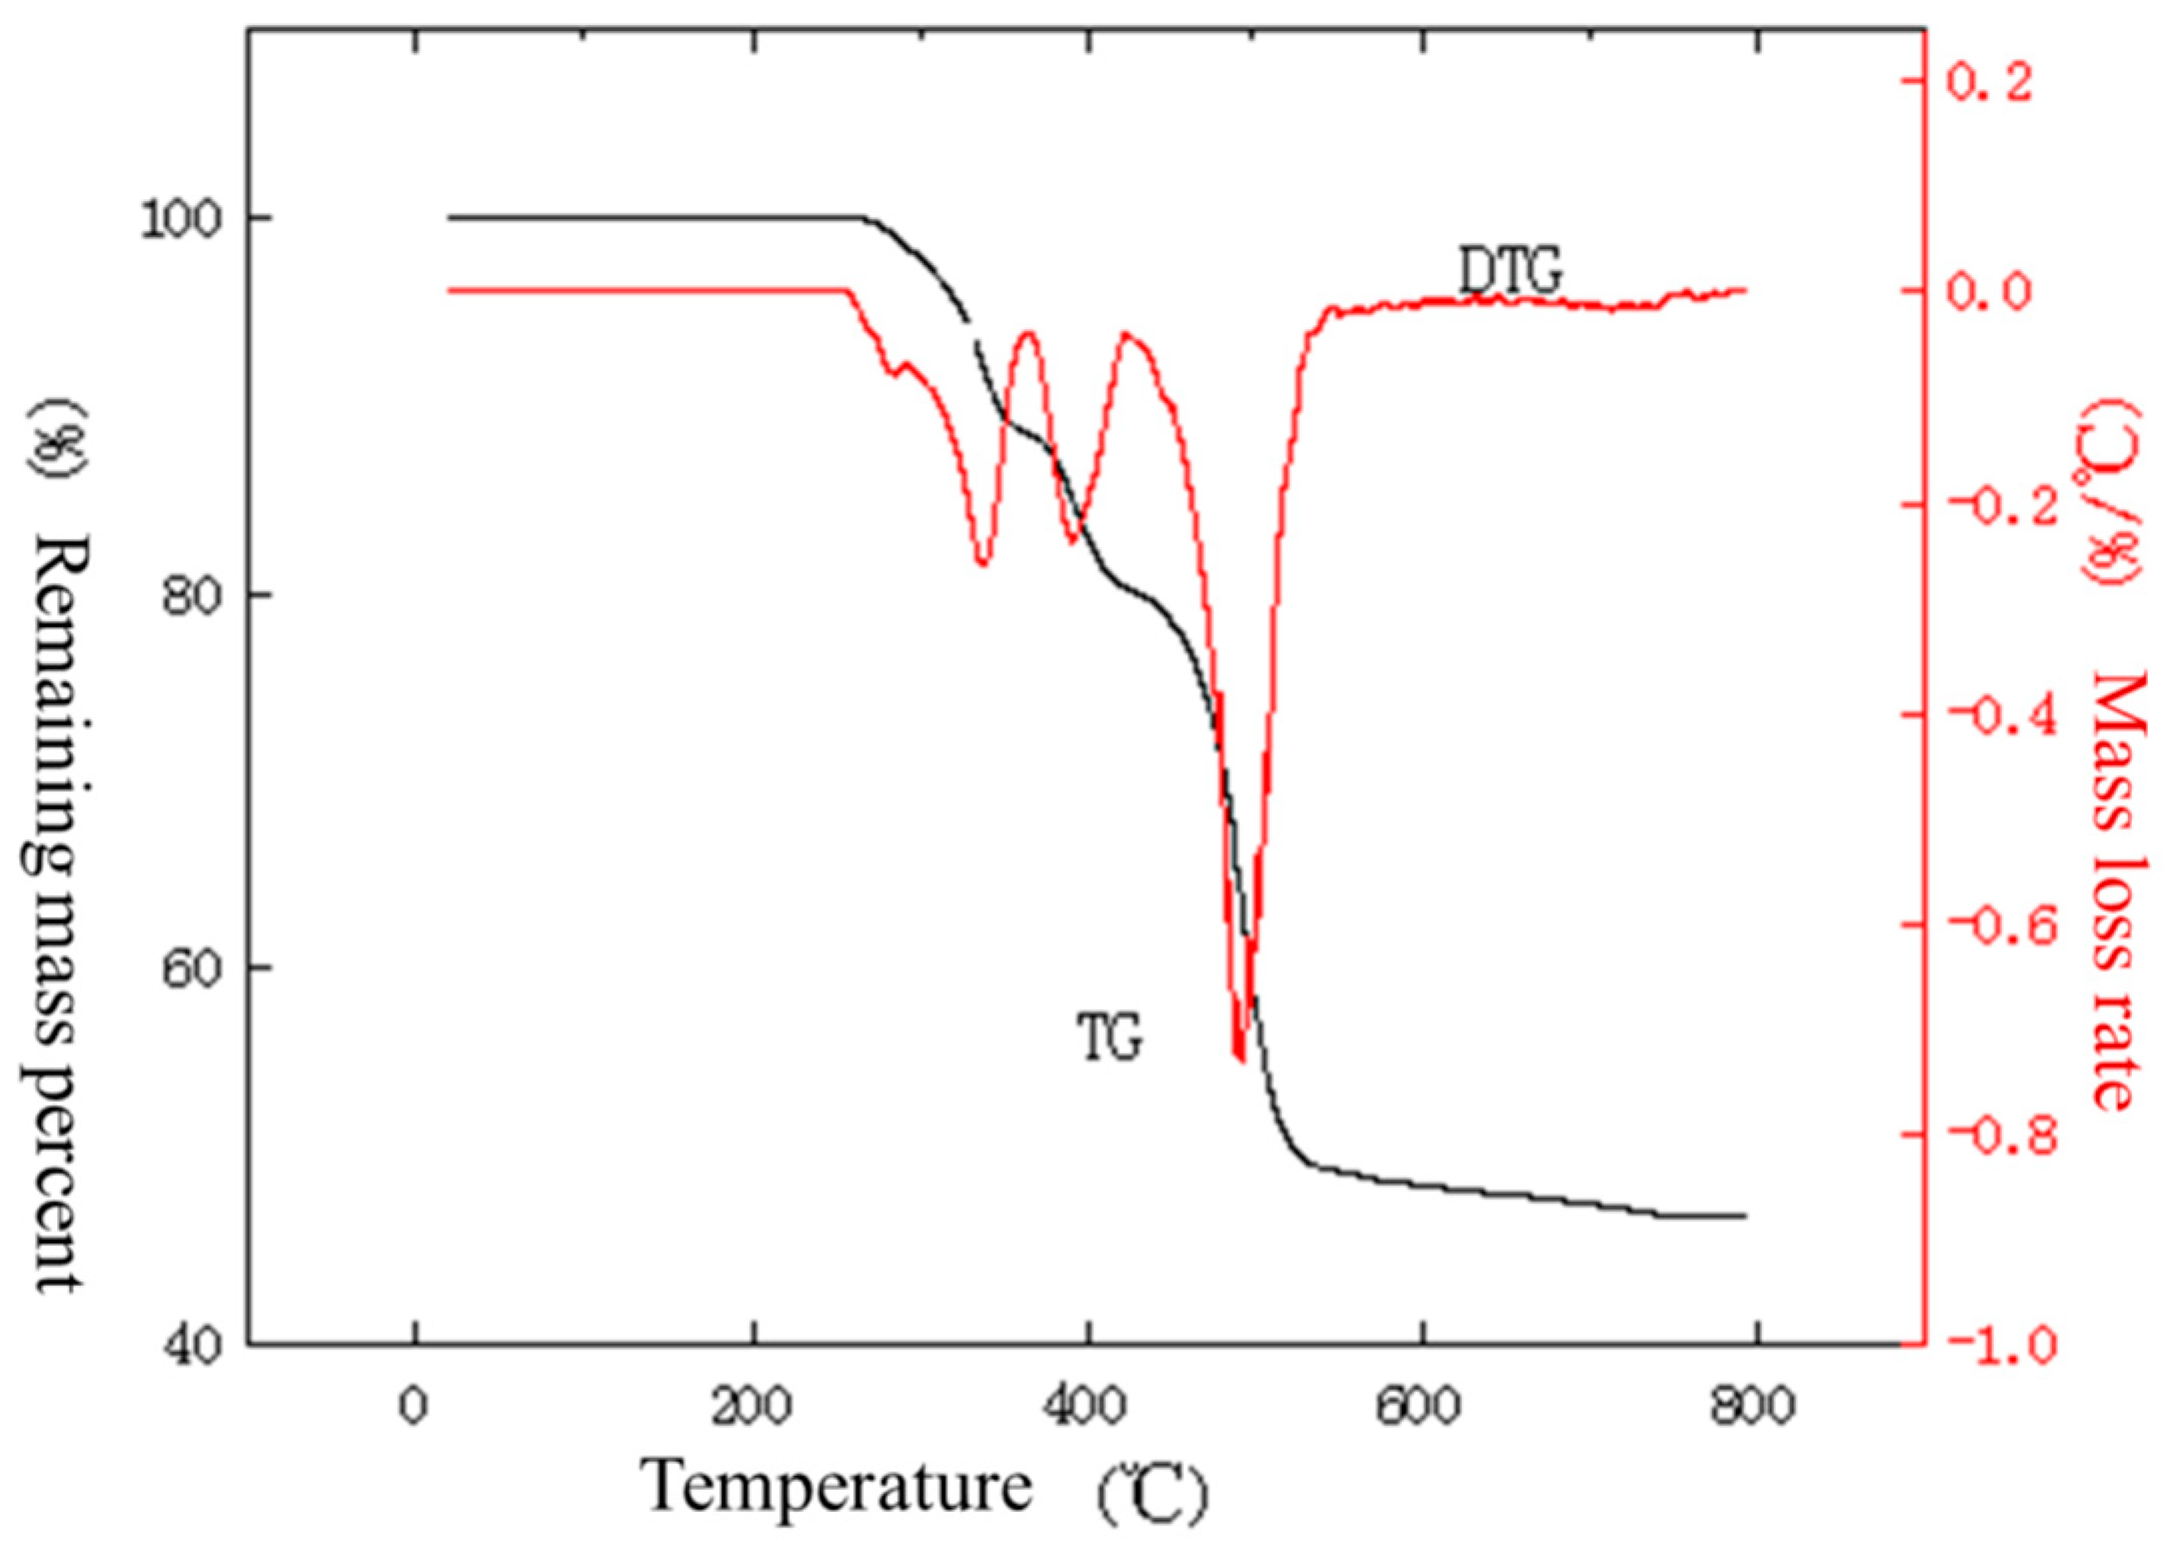
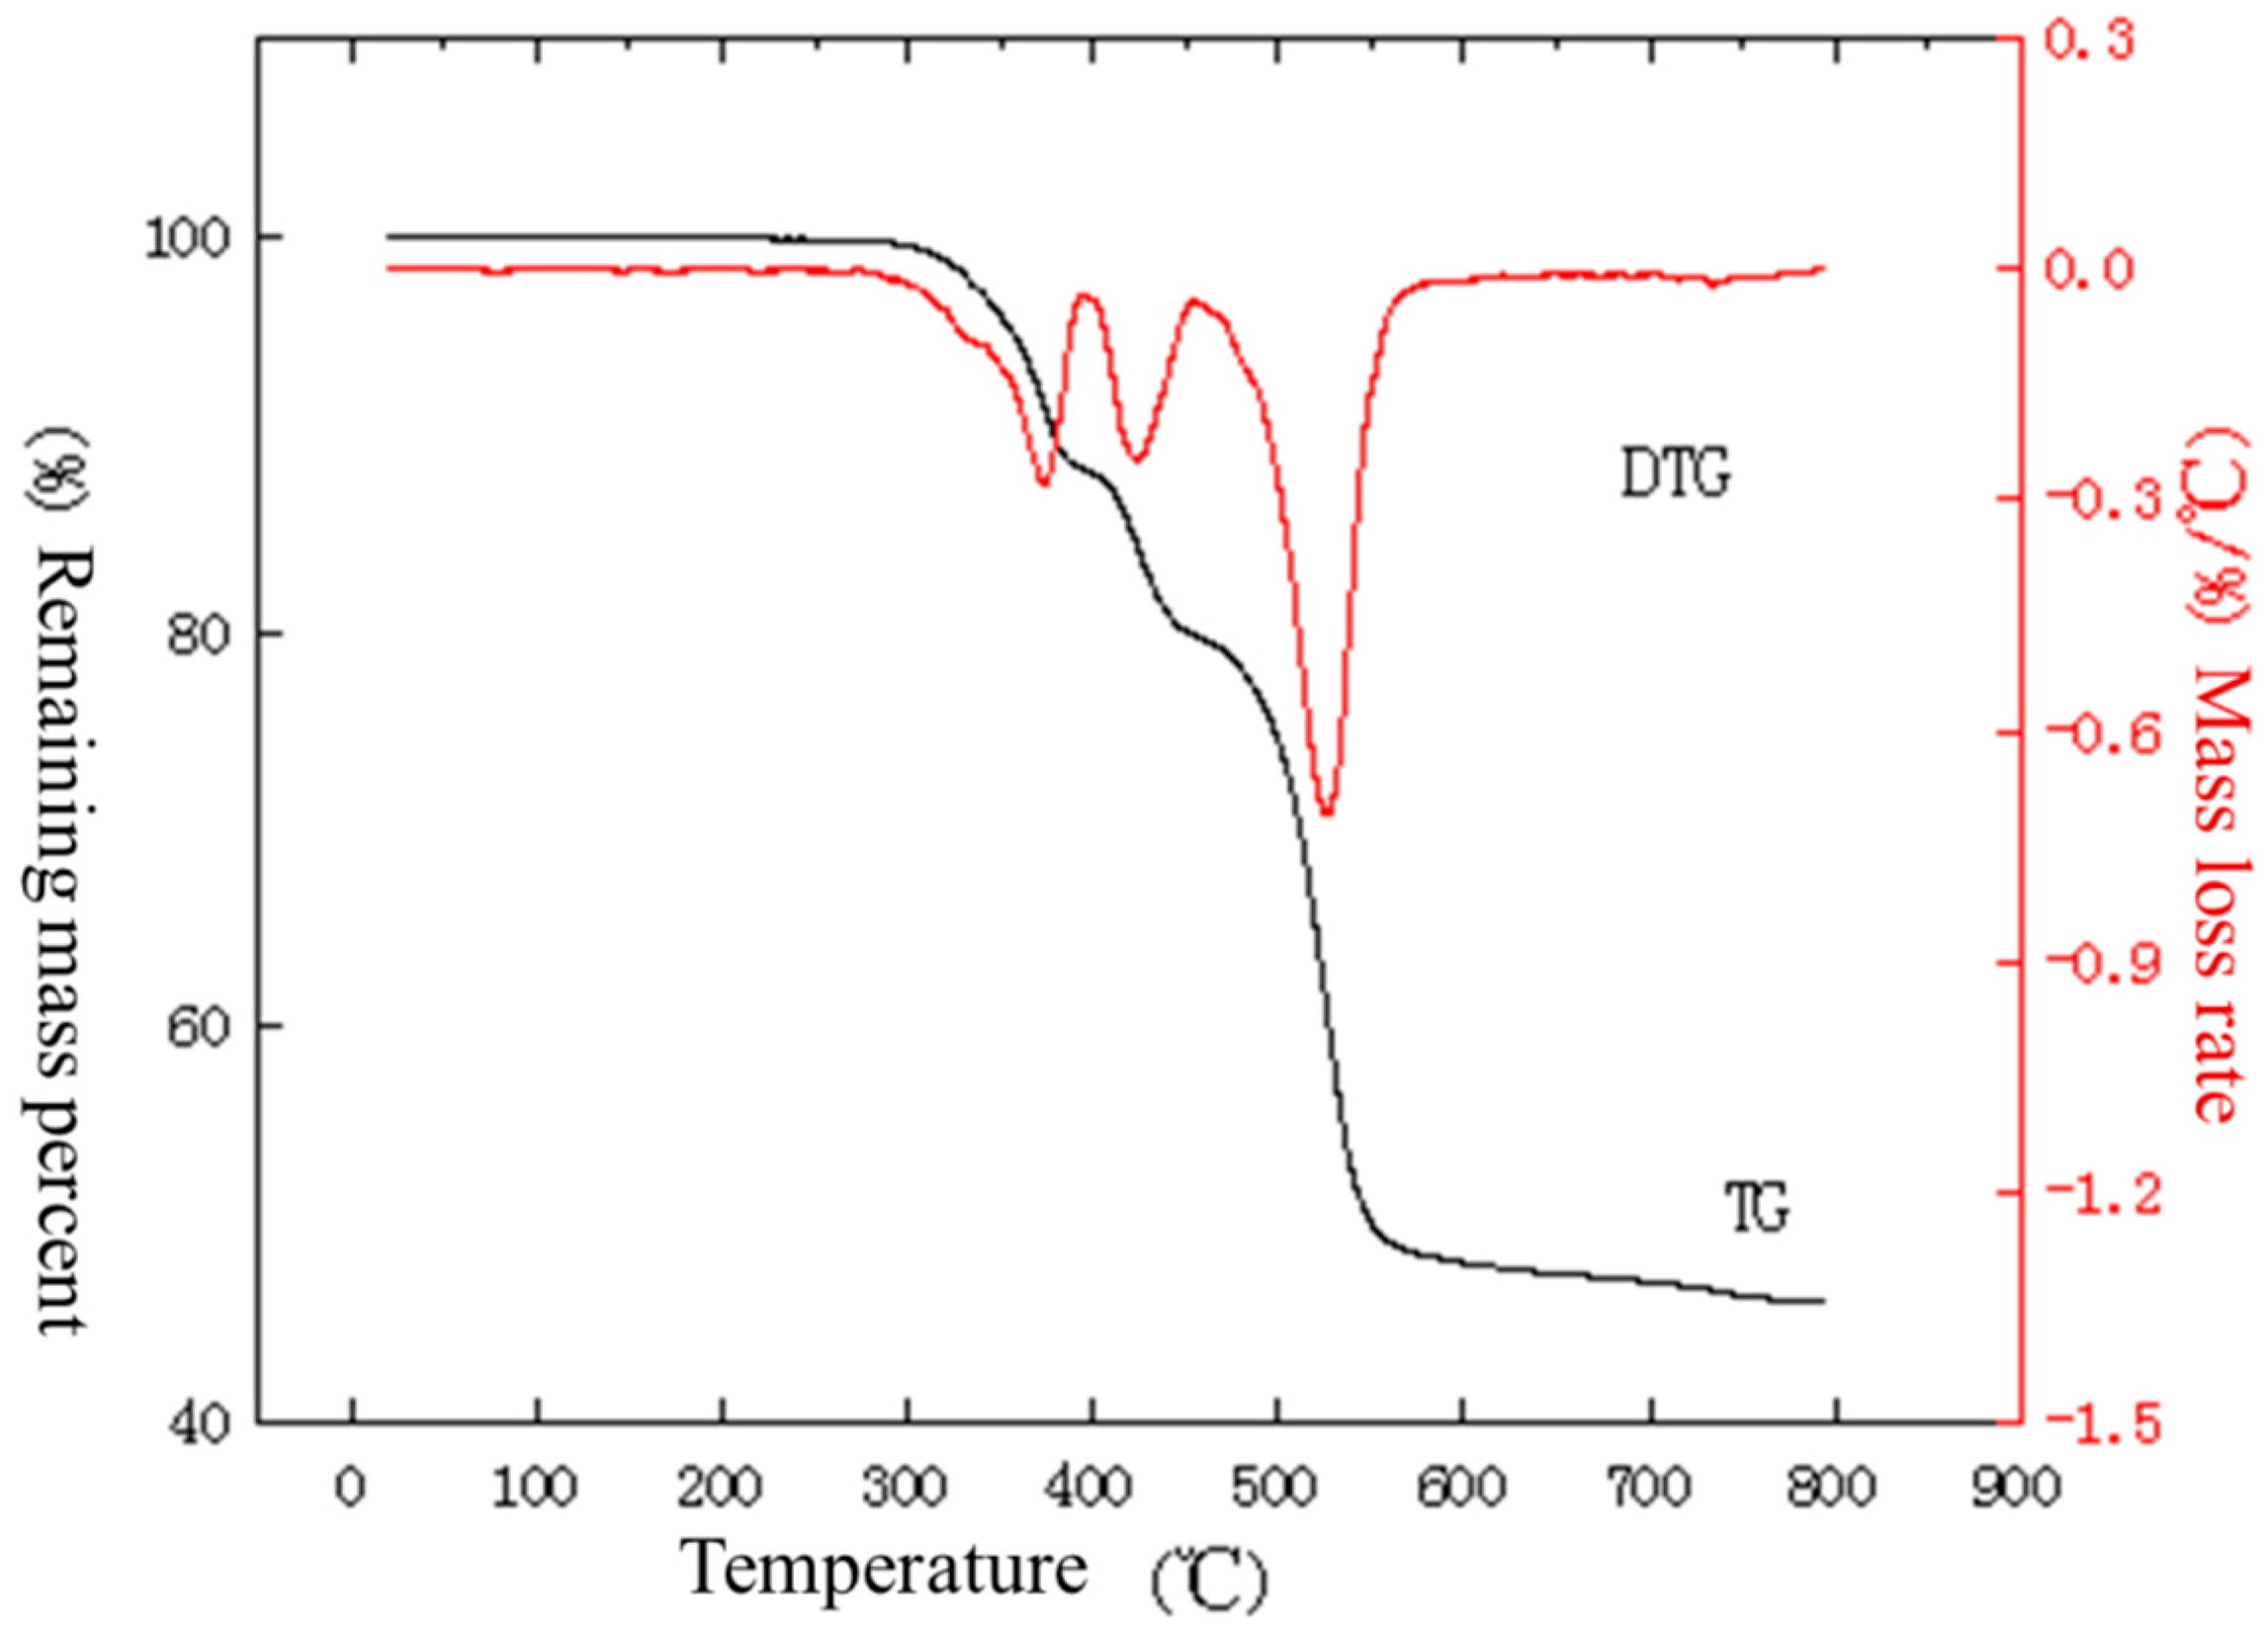
4. Nuclear-Grade Cable Pyrolysis Test Characterization

4.1. Test Protocol and Samples

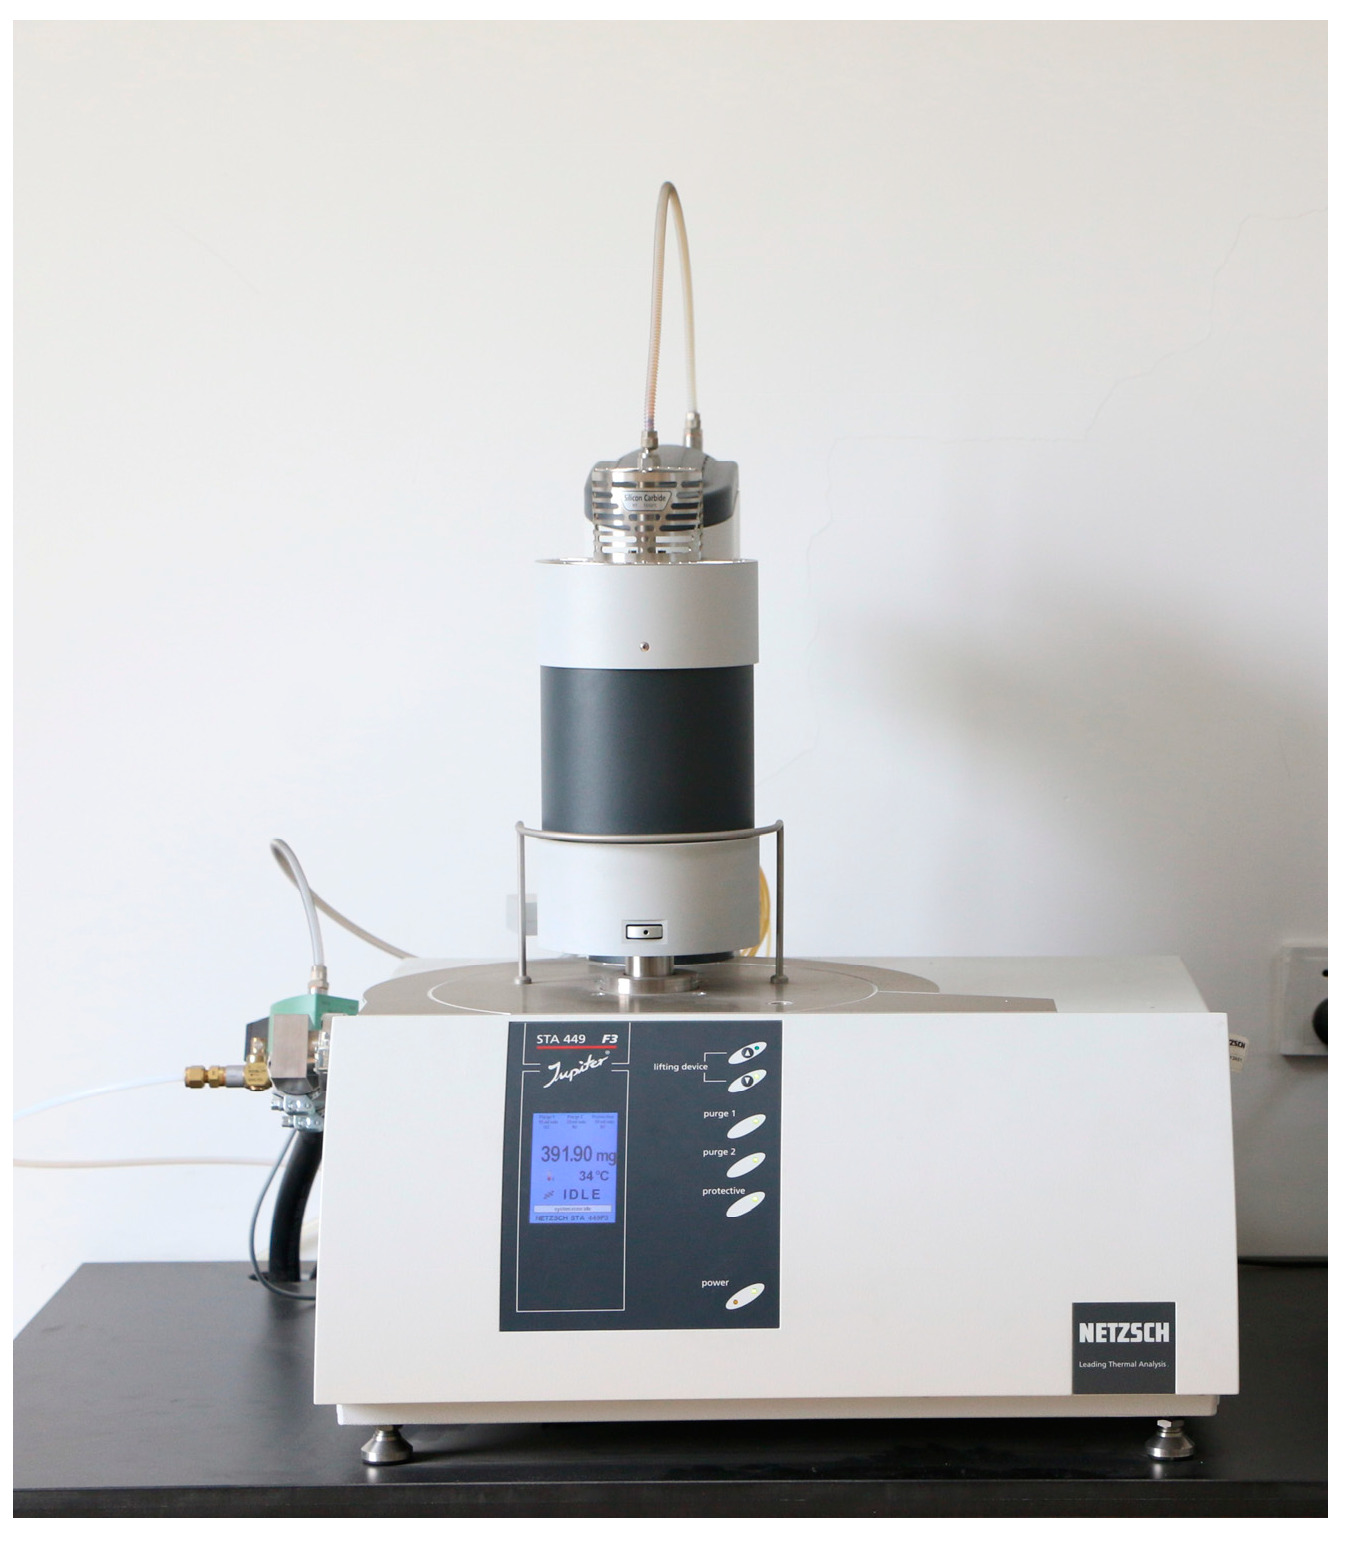
Test Instrumentation

An STA49 Jupiter thermogravimetric-differential scanning calorimetry (TG-DSC) coupled analyzer from NETZSCH, Germany was used for the study, where TG refers to the relationship between the mass of a substance and the change in temperature measured during the warming process. The principle is to place the sample on a balance, and then program the temperature increase and measure the change in the mass of the sample with temperature, and by combining the relevant theory, the possible physicochemical changes of the sample can be determined. Figure 10 shows the combined thermogravimetric-differential scanning calorimetry (TG-DSC) analyzer.

4.2. Test Protocol and Samples

Figure 11, Figure 12, Figure 13, Figure 14, Figure 15, Figure 16, Figure 17, Figure 18 and Figure 19 show the thermogravimetric-differential curves of the outer sheath, inner sheath, and insulation of the NPP cable under a nitrogen atmosphere at temperature increase rates of 10 °C/min, 40 °C/min, and 50 °C/min, respectively. The TG is the relationship between the mass of a substance measured during the warming process and the change in temperature. The maximum weight loss rate is the point of maximum mass loss during the pyrolysis of the sample, i.e., the peak of the DTG curve, and the temperature corresponding to the peak is the temperature at the weight loss peak. The maximum weight loss rate and the temperature at the weight loss peak reflect the subsequent combustion of the material on fire. The larger the value of the maximum weight loss rate, the lower the temperature at the weight loss peak, indicating that the material burns faster after a fire. The peak temperature is the temperature corresponding to the maximum point of mass loss in the pyrolysis process of the sample, i.e., the temperature at the point of the maximum weight loss rate on the DTG curve.
From the curves in Figure 11, it can be seen that the outer sheath gradually loses weight as the temperature in the analyzer rises. There is no significant change in the weight of the material within 200 °C, indicating that the material has good moisture resistance and does not show the evaporation of surface water molecules. The weight loss between 200 and 340 °C as well as between 340 and 400 °C may be due to the presence of many organic additives in the material, which generates volatilization or degradation. The weight loss between 400 and 677 °C may be due to the high-temperature decomposition of polyolefins, which generates a large number of small molecules such as ethylene and propylene. From Figure 12, it can be seen that the material starts to lose weight near 261 °C, and the first stage of weight loss is completed at 370 °C with a weight loss rate of 12.2%. As the temperature rises, weight loss continues. From the curves in Figure 13, it can be seen that the material starts to lose weight from about 271 °C, and the first stage of weight loss is completed at 374 °C with a weight loss rate of 10.8%. As the temperature rises, weight loss continues.
From the curves in Figure 14, it can be seen that the material starts to lose weight near 212 °C, and the first stage of weight loss is completed at 340 °C with a weight loss rate of 12.8%. As the temperature rises, weight loss continues. From the curves in Figure 15, it can be seen that the material starts to lose weight near 259 °C, and the first stage of weight loss is completed at 362 °C with a weight loss rate of 11.4%. As the temperature rises, weight loss continues. As can be seen from the curves in Figure 16, the material starts to lose weight near 280 °C, and the first stage of weight loss is completed by 395 °C with a weight loss rate of 11.9%. As the temperature rises, weight loss continues.
From the curves in Figure 17, it can be seen that the material starts to lose weight near 238 °C, and the weight loss is completed by 659 °C, with a weight loss rate of 56.1%. From the curve in Figure 18, it can be seen that the material starts to lose weight near 274 °C, and the weight loss is completed by the first stage at 671 °C, with a weight loss rate of 54.3%. As can be seen from the curves in Figure 19, the material starts to lose weight near 284 °C, and the weight loss is completed by 679 °C, with a weight loss rate of 55.2%. Among them, there is an insignificant weight loss peak in the DTG curve between 300 and 400 °C, which may be due to the process of breaking the C-Cl bond in the molecule and generating chlorine radicals, which, in turn, generates HCI as well as small amounts of alkylbenzene and cycloalkanes.

5. Conclusions

Thermal behavior occurs when a substance is heated at a temperature below the ignition point; combustion refers to the more violent reaction of a material to heat when the temperature is at or above the ignition point. The pyrolysis of combustible materials will produce volatile fuels, making the occurrence and spread of fire possible. Therefore, pyrolysis behavior has an important impact on the occurrence and spread of fire.
For a fire to develop, combustibles will first undergo pyrolysis. Different heating rates and heating atmospheres may lead to different pyrolysis mechanisms. Therefore, it is more meaningful to study the effect of the thermal decomposition behavior of cable materials under different heating rates and heating atmospheres, which helps us understand whether the material will undergo a combustion process at a high temperature and whether fire spread will occur.
In this paper, the pyrolysis behavior of nuclear-grade cable materials is investigated based on a thermogravimetric analysis and a differential thermal analysis to study the effects of different heating rates and different heating atmospheres on the pyrolysis behaviors of cable materials, thus providing data support for the refinement of cable fire parameters in nuclear power plants.
(1)
The conclusions from the nuclear-grade cable combustion test and the comparative analysis with a PVC cable are as follows:
  • The ignition time of the cable and the magnitude of the applied thermal radiation intensity is closely related to the intensity of thermal radiation. A higher heating rate of the sample surface shortens the time it takes to reach the ignition point. The longer the ignition time, the less likely the material is to ignite, and the less fire-hazardous the material is.
  • The intensities of thermal radiation are different, but the overall trends of the curves are similar, and the process of cable heat release rate change can be divided into four stages.
  • The greater the intensity of thermal radiation, the higher the effective heat of combustion.
  • Under the same test conditions and the same product parameters, the total heat release and the average heat release rate of the PVC cable are much higher than those of the nuclear-grade cable. In terms of the heat release rate peak, the two are closer, with that of the nuclear-grade cables being slightly higher, which suggests that the fire hazard of PVC cables is much greater than that of nuclear-grade cables.
(2)
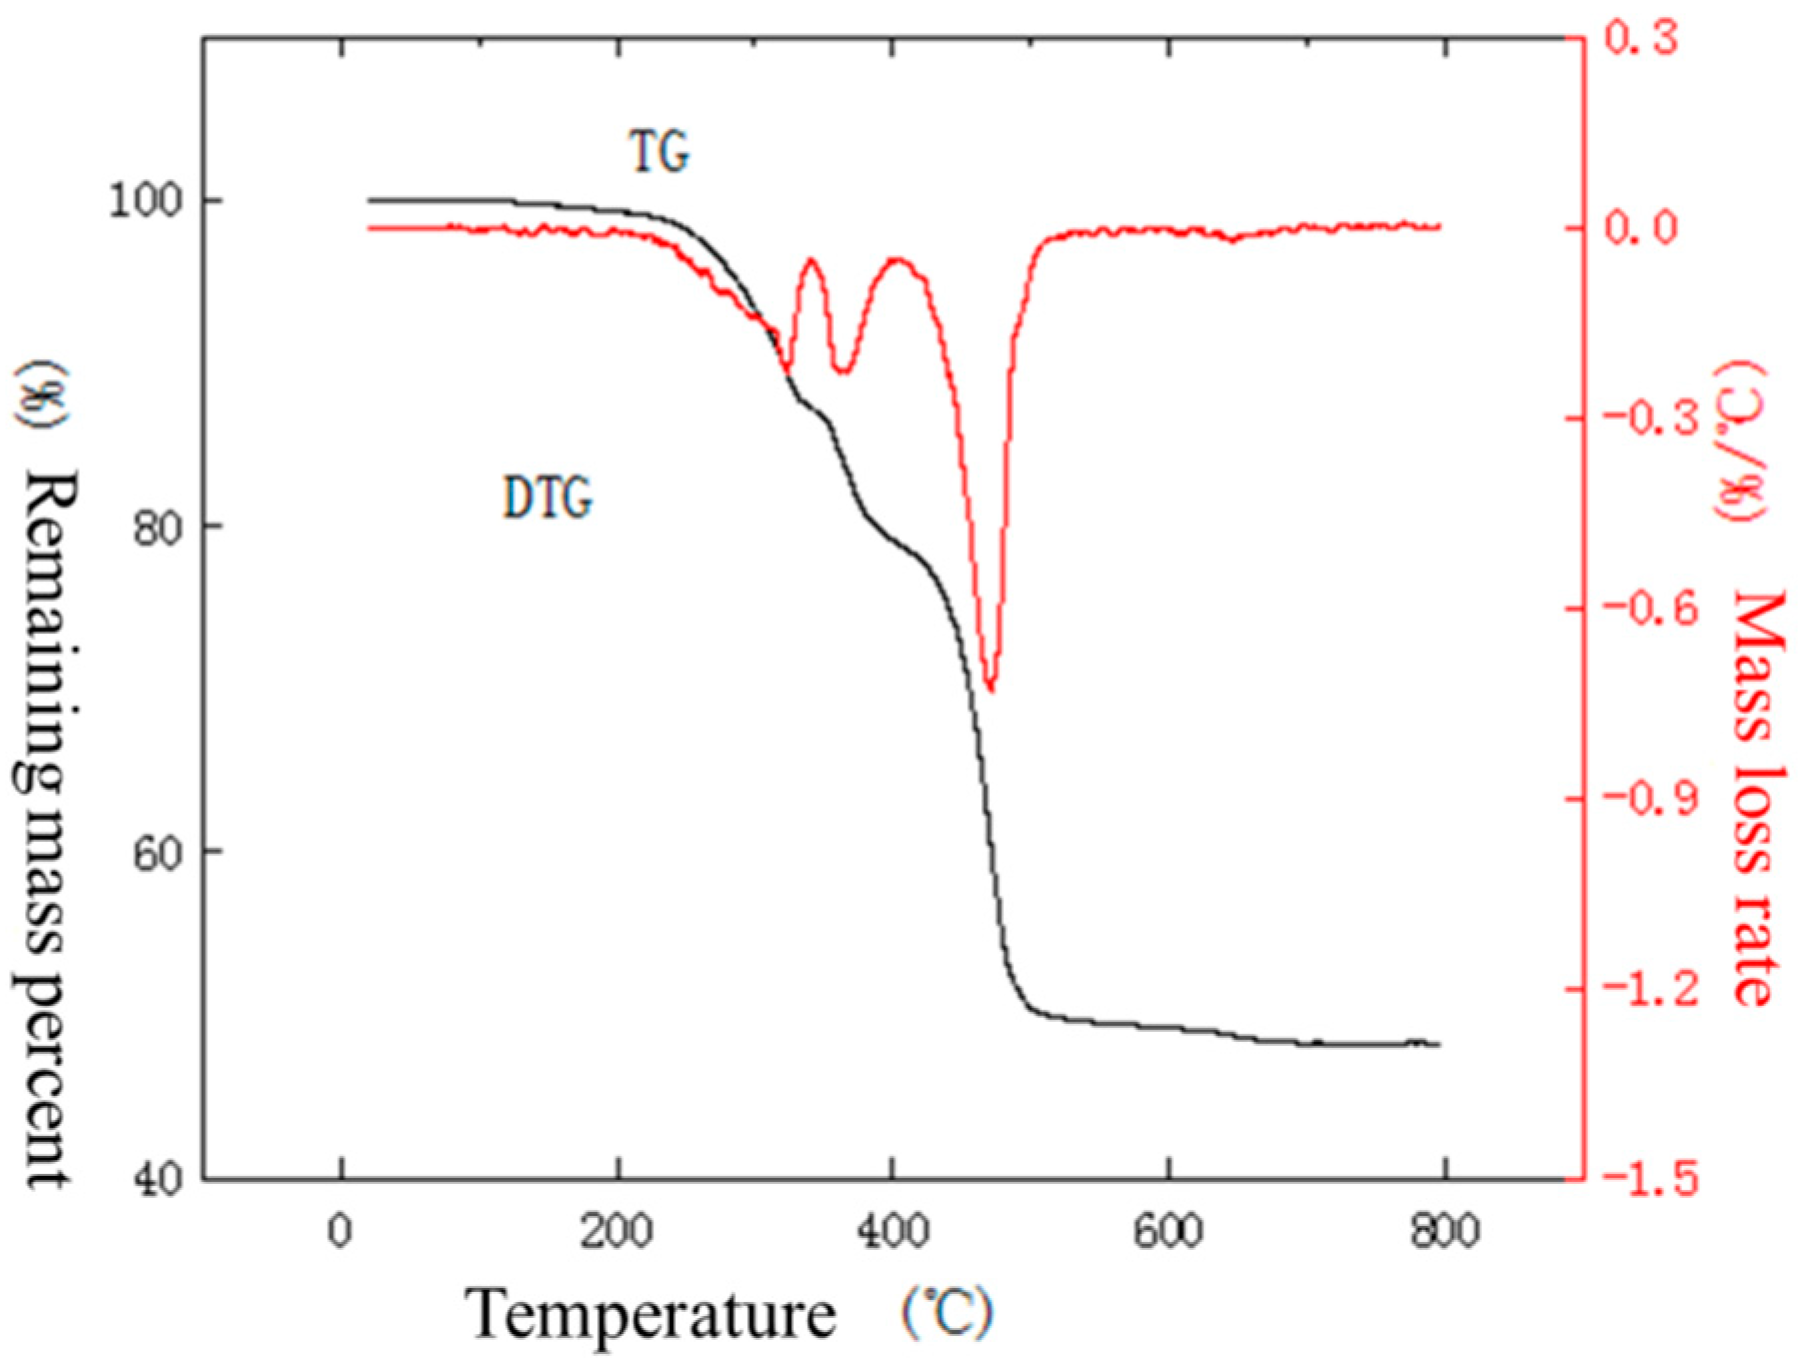
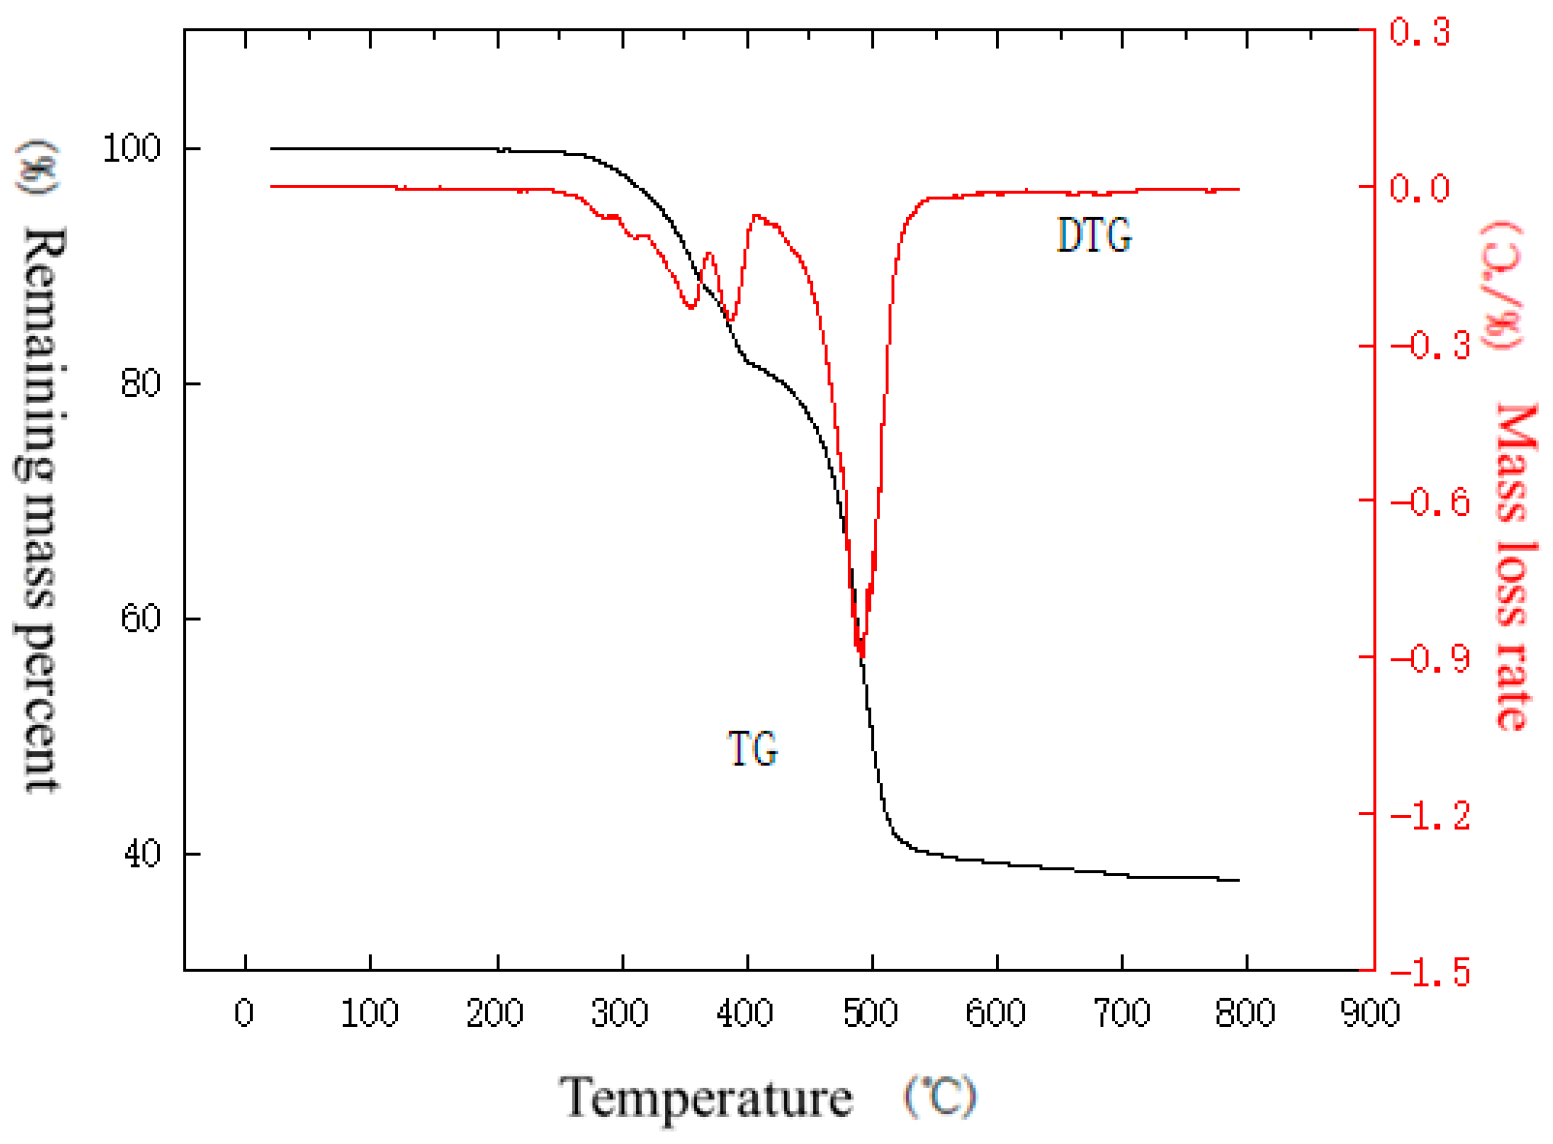
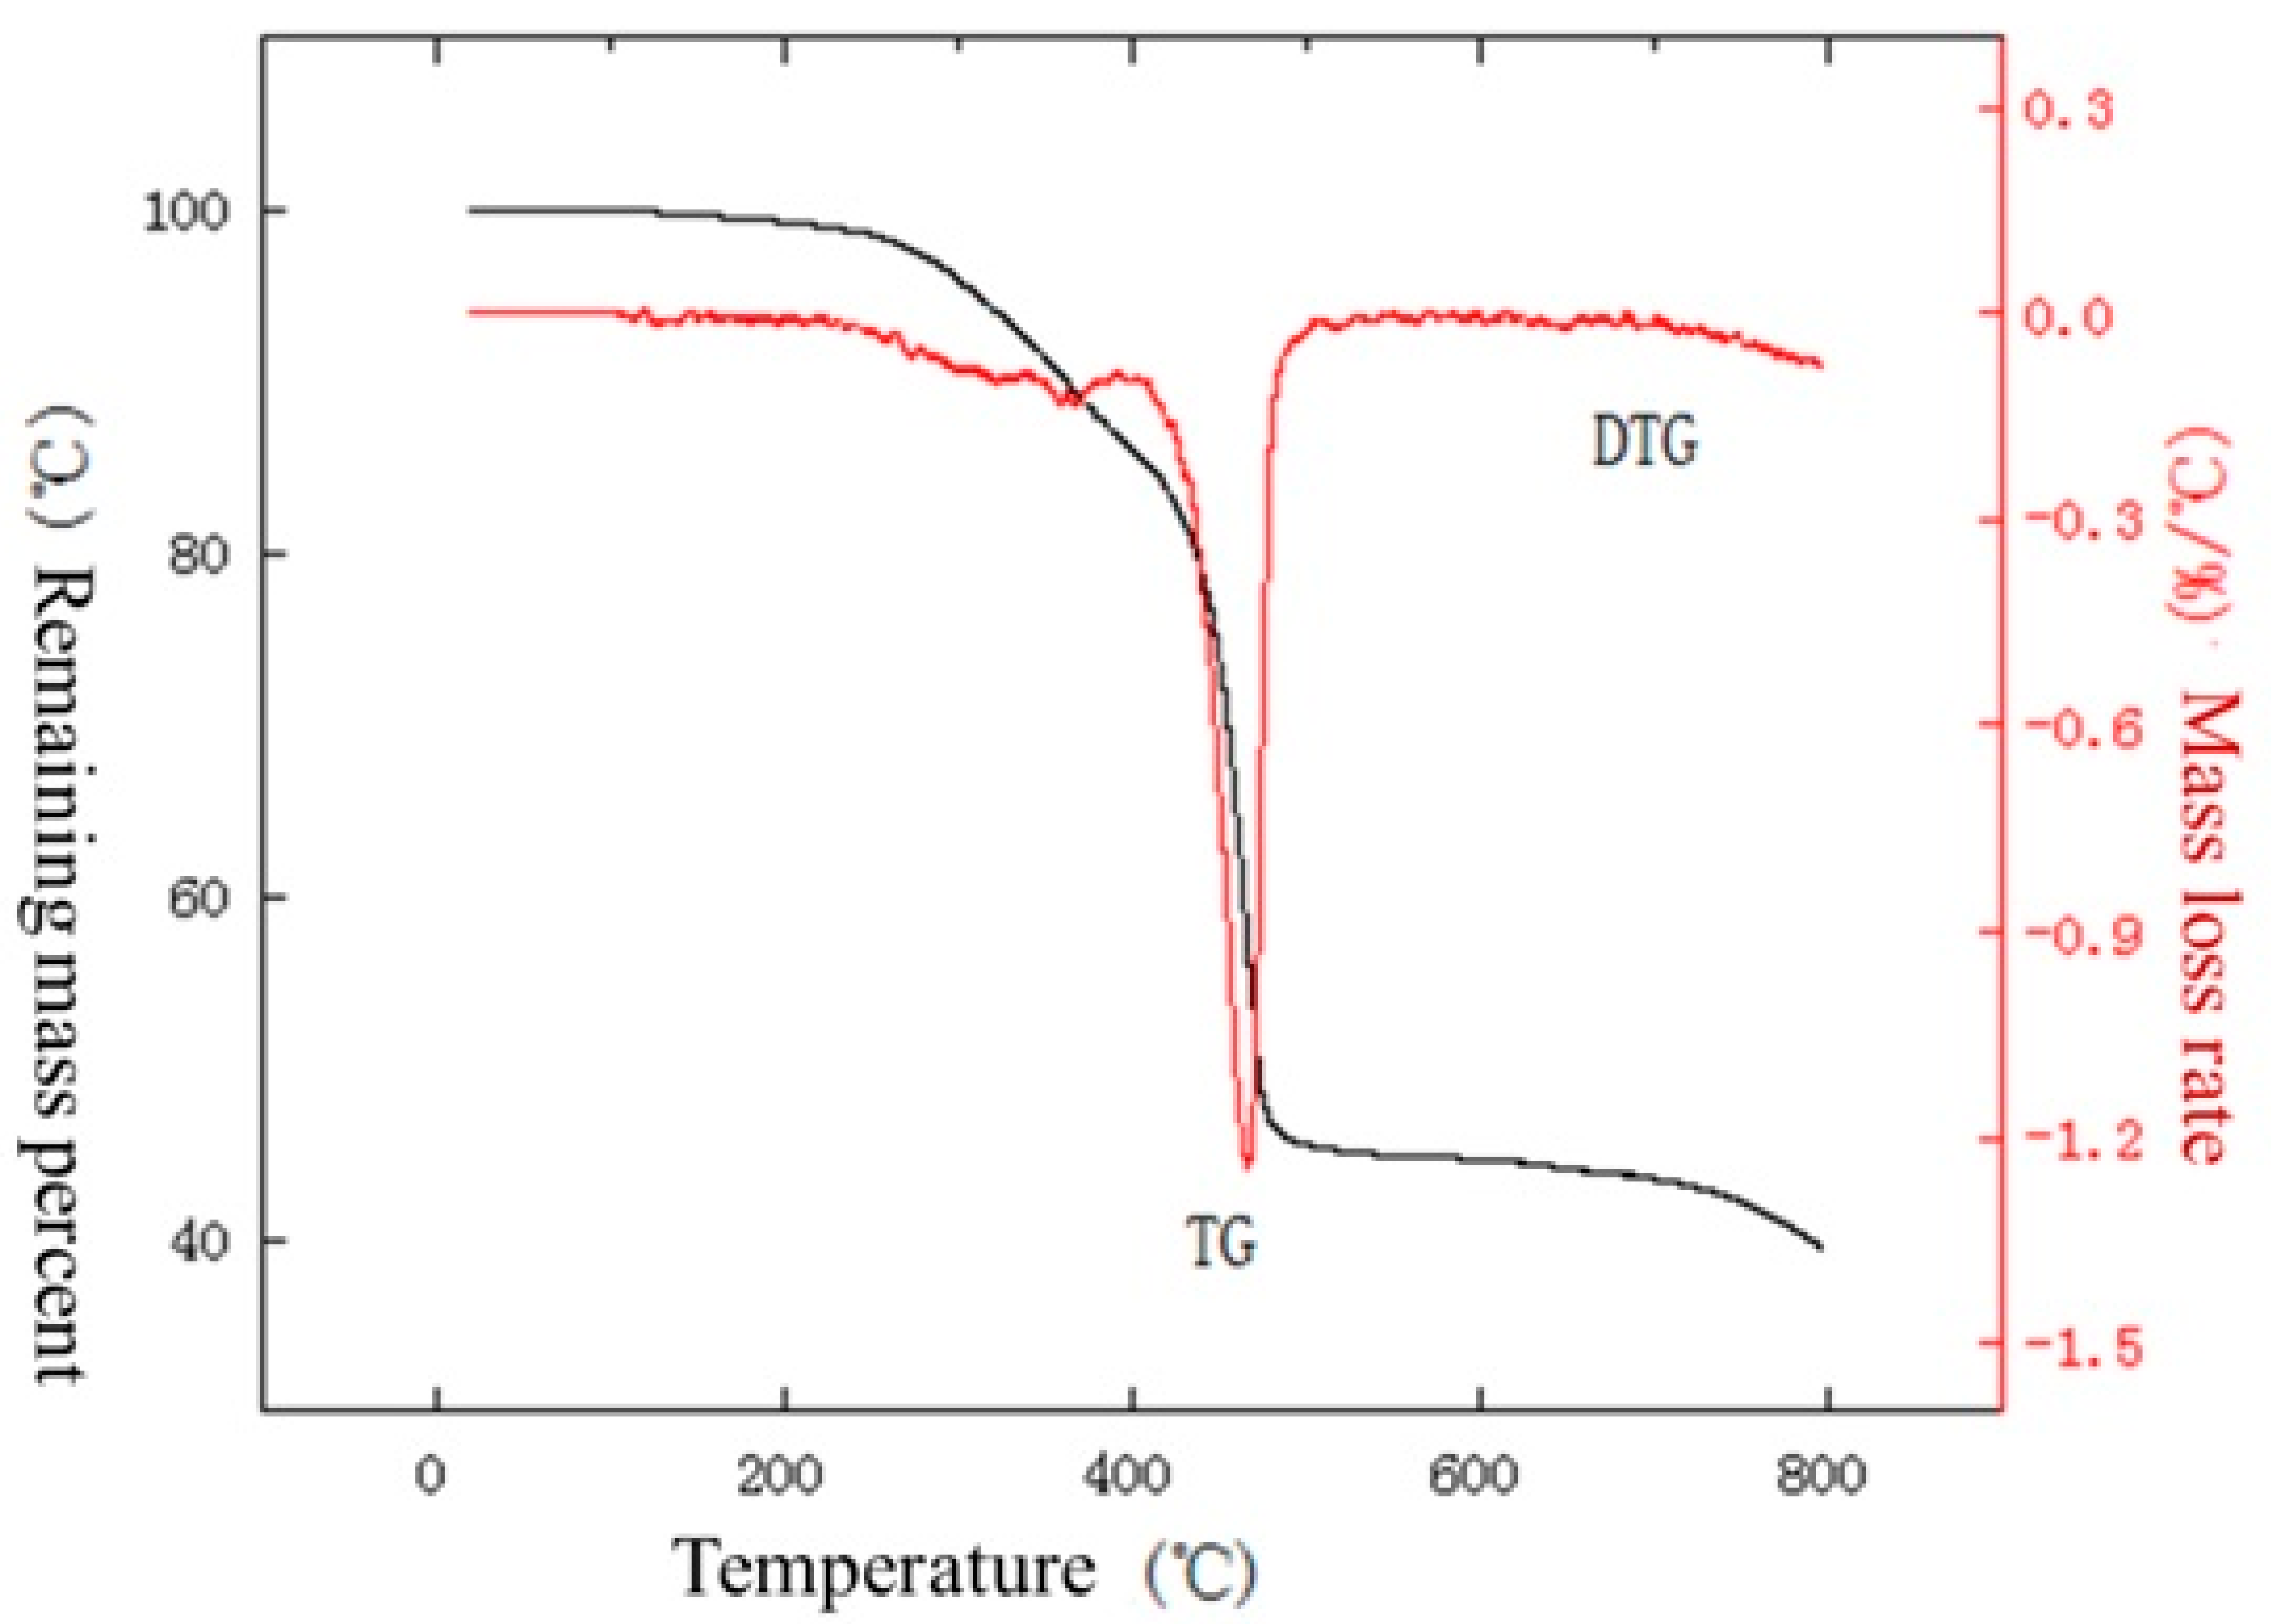
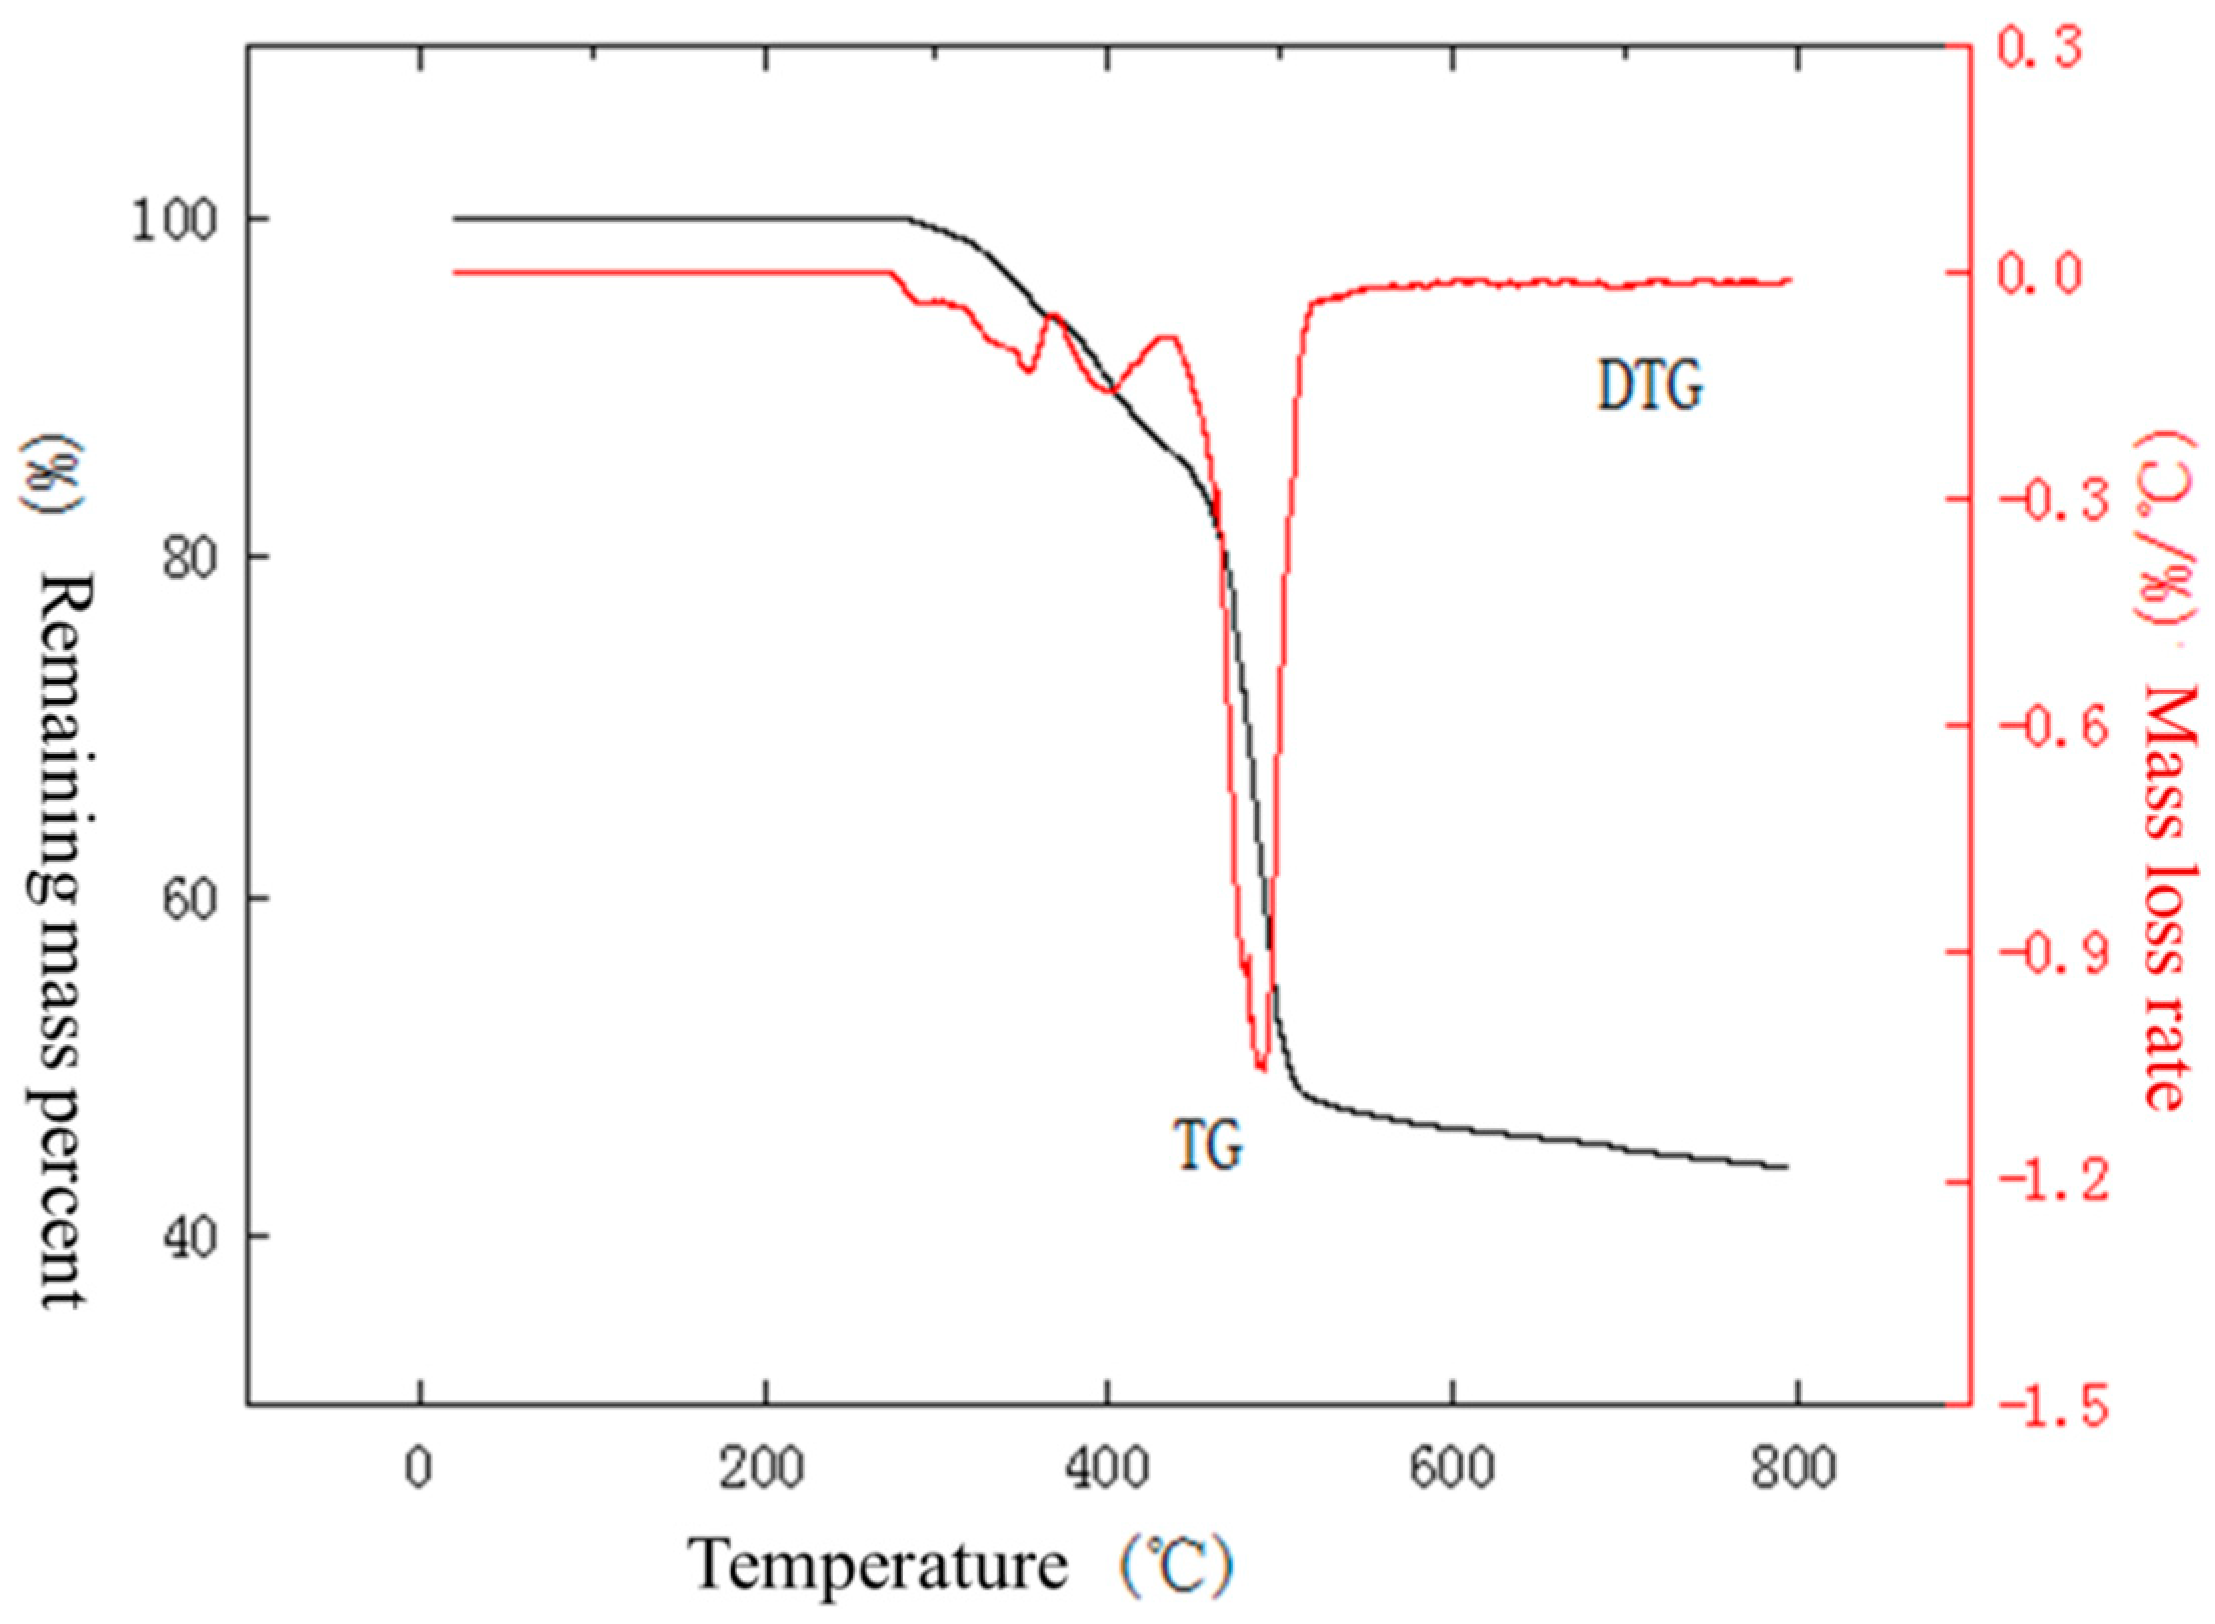
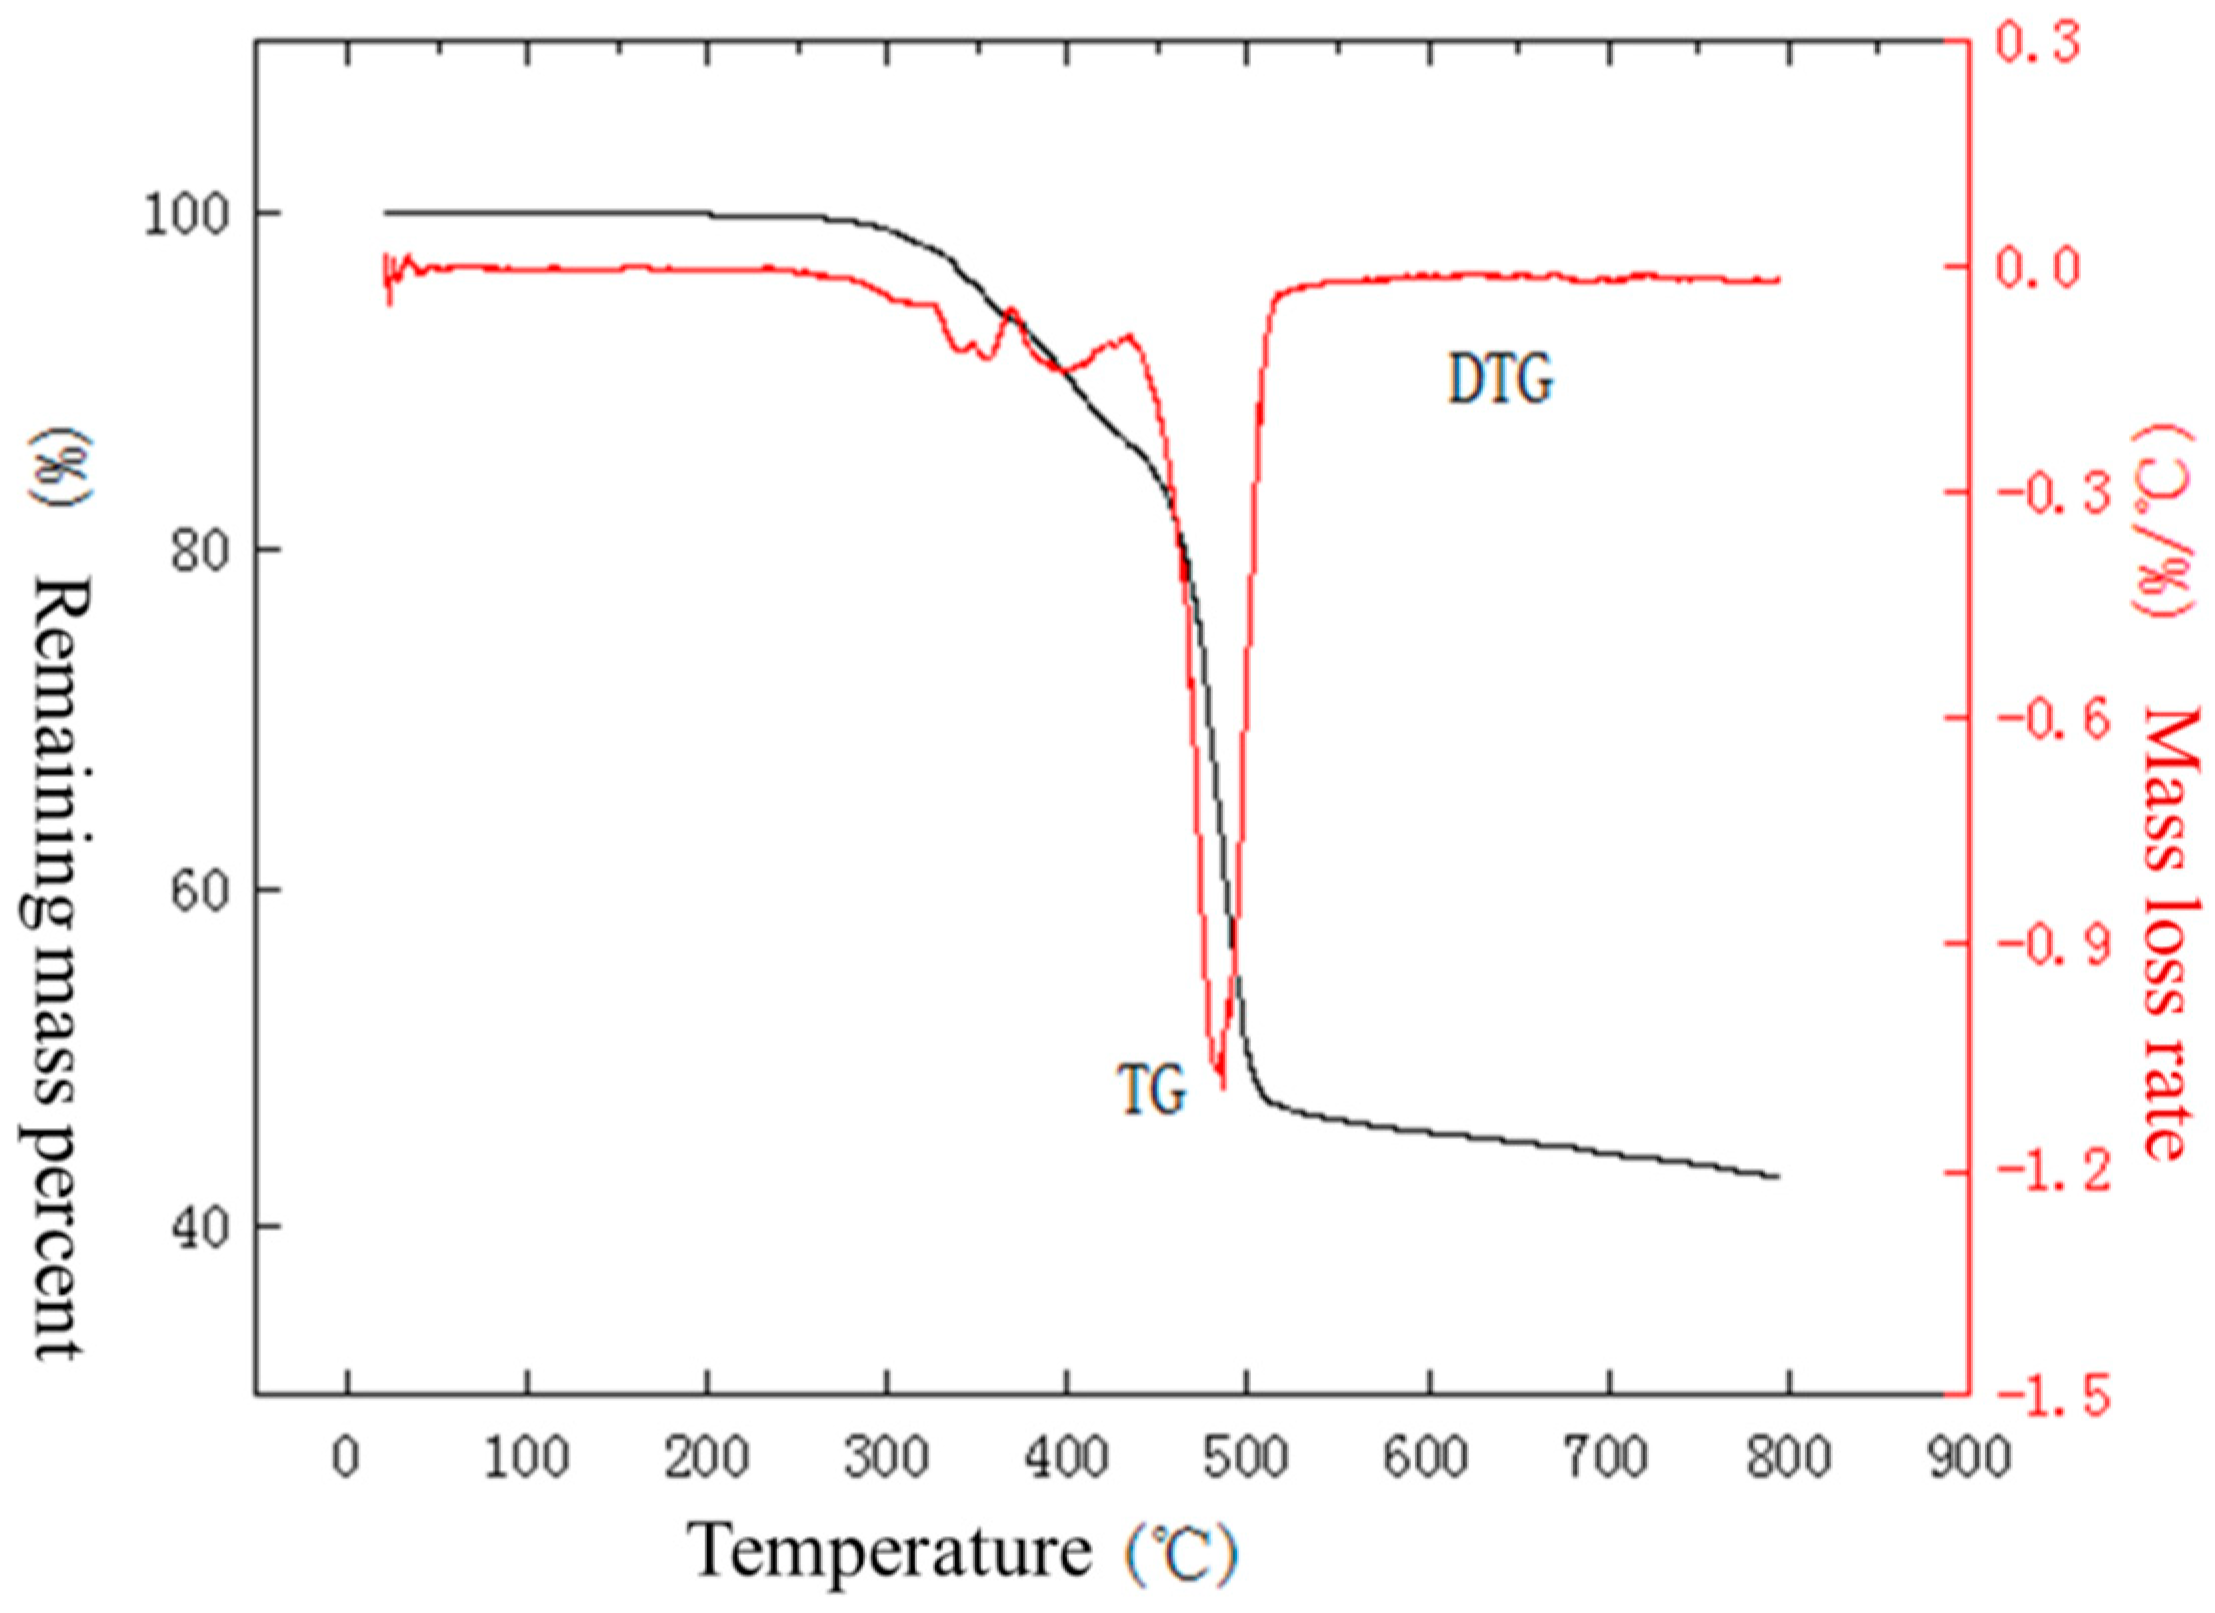
The conclusions from the nuclear-grade cable pyrolysis test are as follows:
The relationship between the mass of the substance measured during the heating process and the temperature change: The temperature change caused by the heat loss process of the sample can be detected to analyze the reaction of the heat-absorbing or exothermic effect.
Under a certain rate of heating, the pyrolysis of cables undergoes different stages as the temperature increases, which mainly include two heat loss stages. The first stage is primary pyrolysis, and the second stage comprises structural reorganization reactions, such as crystallization, tautomerization, crosslinking, and so on.
The pyrolysis mechanisms of polymers vary based on the heating atmospheres, and it is possible to proceed according to the cracking or thermo-oxidative decomposition course. The effect of the atmosphere on the pyrolysis properties are as follows:
The effect of the heating rate on pyrolysis is more complicated. On the one hand, an increased heating rate shortens the time the sample needs to reach the temperature required for pyrolysis. On the other hand, the increase in the heating rate makes the temperature difference between the outer and inner layers of the particles larger, so the pyrolysis products of the outer layer of the particles do not have enough time to diffuse. This may affect the internal pyrolysis. Therefore, the speed of sample pyrolysis depends on the primary and secondary relationship between these two opposite processes. As the rate of heating increases, both the thermal weight loss curve and the micro commercial weight loss curve move toward the high-temperature region. Under a low heating rate, the temperature distribution inside the sample particles is uniform, and the temperature difference between the ambient temperatures is small. Under a high heating rate, due to the certain geometry of the test, the heat received by the outer layer of the particles cannot be transferred to the inner layer in time, which results in the formation of a larger temperature difference between the two layers and the formation of a large temperature gradient. Compared with the low heating rate, it takes longer for the inner layer to reach a pyrolysis temperature under the high heating rate. Different heating rates have significant effects on the amount of pyrolysis residue, and the atmosphere also has an effect on the pyrolysis of the sample.
For PVC (chlorine-containing polymer) cables, their chloride will react with hydrogen and other gases in the air to form HCI and other gases, which will asphyxiate the inhaling personnel. As a kind of acid, HCI will cause damage to the electrical equipment and steel and other structures of the building, which will increase fire hazards, especially on the communication system and the control system. Therefore, nuclear-grade cable insulation materials need to be low-smoke, halogen-free, and flame-retardant. Therefore, enhancing the level of nuclear safety and fire safety is essential for the use of nuclear-grade cables and is an important part of nuclear safety.

Author Contributions

Conceptualization, Q.S.; methodology, J.Z.; validation, F.J.; formal analysis, W.S.; data curation, W.S.; writing—original draft preparation, Q.S.; writing—review and editing, F.J. All authors have read and agreed to the published version of the manuscript.

Funding

This research received no external funding.

Institutional Review Board Statement

Not applicable.

Informed Consent Statement

Not applicable.

Data Availability Statement

Data are contained within the article. If needed, please contact with corresponding author.

Acknowledgments

Many thanks go to Research on Key Technologies and Equipment Development for Radioactive Ventilation in Fuel Cycle Facilities for its unwavering support.

Conflicts of Interest

The authors declare no conflicts of interest.

References

  1. China National Nuclear Safety Administration. Safety Regulations for Nuclear Power Plant Design (HAF102); China National Nuclear Safety Administration: Beijing, China, 2004.
  2. GB/T22577-2008; Class 1E Cables for Nuclear Power Generating Stations General Requirements. The International Organization for Standardization: Geneva, Switzerland, 2008.
  3. Bucknor, M.D. Modeling of Electrical Cable Failure in a Dynamic Assessment of Fire Risk. Ph.D. Thesis, The Ohio State University, Columbus, OH, USA, 2013. [Google Scholar]
  4. EPRI; NRC-RES. EPRI/NRC-RES Fire PRA Methodology for Nuclear Power Facilities (NUREG/CR-6850); U.S. Nuclear Regulatory Commission & Electric Power Research Institute: Rockville, MD, USA; Palo Alto, CA, USA, 2005.
  5. Jee, M.-H.; Moon, C.-K.; Kim, H.-T. Performance-based fire fighting strategies for confined fire zones in nuclear power plants. Prog. Nucl. Energy 2013, 62, 16–25. [Google Scholar] [CrossRef]
  6. Organization for Economic Co-operation and Development (OECD); Nuclear Energy Agency (NEA); Committee on the Safety of Nuclear Installations (CSNI). OECD FIRE Database, Version: OECD FIRE DB 2014:2; OECD: Paris, France, 2016. [Google Scholar]
  7. Baranowsky, P.; Facemire, J. The Updated Fire Events Database: Description of Content and Fire Event Classification Guidance; Electric Power Research Institute: Palo Alto, CA, USA, 2013. [Google Scholar]
  8. Division of Fuel Cycle Safety and Safeguards. Standard Review Plan for the Review of an Application for a Mixed Oxide (MOX) Fuel Fabrication Facility (NUREG-1718); U.S. Nuclear Regulatory Commission: Washington, DC, USA, 2000.
  9. ISO 5660-1; Reaction-to-Fire Tests—Heat Release, Smoke Production and Mass Loss Rate—Part 1: Heat Release Rate (Cone Calorimeter Method. The International Organization for Standardization: Geneva, Switzerland, 2015.
Figure 1. Schematic diagram of a nuclear-class cable structure.
Fire 07 00101 g001
Figure 2. Test sample.
Fire 07 00101 g002
Figure 3. Remaining samples at heat radiation flux of 30 kW/m2.
Fire 07 00101 g003
Figure 4. Remaining samples at heat radiation flux of 40 kW/m2.
Fire 07 00101 g004
Figure 5. Remaining samples at heat radiation flux of 50 kW/m2.
Fire 07 00101 g005
Figure 6. Remaining samples at heat radiation flux of 60 kW/m2.
Fire 07 00101 g006
Figure 7. Ignition time under different thermal radiation intensities.
Fire 07 00101 g007
Figure 8. Heat release rates at different heat radiation intensities.
Fire 07 00101 g008
Figure 9. Effective heat of combustion under different heat radiation intensities.
Fire 07 00101 g009
Figure 10. Thermogravimetric-differential scanning calorimetry (TG-DSC) coupled analyzer.
Fire 07 00101 g010
Figure 11. TG–DTG curves of outer sheath under nitrogen atmosphere at a temperature increase rate of 10 °C/min.
Fire 07 00101 g011
Figure 12. TG–DTG curve of outer sheath under nitrogen atmosphere at a temperature increase rate of 40 °C/min.
Fire 07 00101 g012
Figure 13. TG–DTG curve of outer sheath under nitrogen atmosphere at a temperature increase rate of 50 °C/min.
Fire 07 00101 g013
Figure 14. TG–DTG curve of inner sheath under nitrogen atmosphere at a temperature increase rate of 10 °C/min.
Fire 07 00101 g014
Figure 15. TG–DTG curve of inner sheath under nitrogen atmosphere at a temperature increase rate of 40 °C/min.
Fire 07 00101 g015
Figure 16. TG–DTG curve of inner sheath under nitrogen atmosphere at a temperature increase rate of 50 °C/min.
Fire 07 00101 g016
Figure 17. TG–DTG curve of insulation sleeve under nitrogen atmosphere at a temperature increase rate of 10 °C/min.
Fire 07 00101 g017
Figure 18. TG–DTG curve of insulation sleeve under nitrogen atmosphere at a temperature increase rate of 40 °C/min.
Fire 07 00101 g018
Figure 19. TG–DTG curve of insulating sleeve under nitrogen atmosphere at a temperature increase rate of 50 °C/min.
Fire 07 00101 g019
Table 1. Cable failure determination criteria.
CableCable Temperature Critical Value Thermal Radiation Flux Critical Value
Thermoplastic205 °C6 kW/m2
Crosslinked330 °C11 kW/m2
Table 2. Ignition times of cables under different heat radiation intensities.
Cable SamplesThermal Radiation Intensity (kW/m2)
30405060
01126 s67 s44 s24 s
Table 3. Total heat release, peak heat release rate, and average heat release rate of sample cables under different heat radiation intensities.
Thermal Radiation Intensity (kW/m2)30405060
Total heat release (MJ/m2)31.5340.0946.4163.59
Peak heat release (kW/m2)123.89149.91170.51197.48
Average heat release rate (kW/m2)36.2337.6943.0153.24
Table 4. Fire performance indices of sample cables under different heat radiation intensities.
Thermal Radiation Intensity (kW/m2)30405060
Fire Performance Index1.020.450.260.12
Table 5. Total heat release, peak heat release rate, and average heat release rate of two kinds of cables under different heat radiation intensities.
Thermal Radiation
Intensity (kW/m2)
Total Heat Release
(kJ)
Peak Heat Release Rate
(kW/m2)
Average Heat Release Rate
(kW/m2)
PVC
Cable
Nuclear-Grade
Cable
PVC
Cable
Nuclear-Grade
Cable
PVC
Cable
Nuclear-Grade
Cable
30128.7231.53127.95123.8977.0636.23
40134.8840.09116.51149.9182.3737.69
50150.2046.41161.12170.51102.1243.01
60181.8563.59188.31197.48119.3753.24
Table 6. Effective heat of combustion of the two cables at different thermal radiation intensities.
Thermal Radiation Intensity (kW/m2)Effective Heat of Combustion (MJ/kg)
PVC CableNuclear-Grade Cable
309.859.56
4010.9710.82
5012.9213.02
6014.7814.86
Disclaimer/Publisher’s Note: The statements, opinions and data contained in all publications are solely those of the individual author(s) and contributor(s) and not of MDPI and/or the editor(s). MDPI and/or the editor(s) disclaim responsibility for any injury to people or property resulting from any ideas, methods, instructions or products referred to in the content.

