Article

Surface Radiative Forcing as a Climate-Change Indicator in North India due to the Combined Effects of Dust and Biomass Burning

1
Aryabhatta Research Institute of Observational Sciences, Nainital 263001, India
2
Institute for Environmental Research and Sustainable Development, National Observatory of Athens, 15236 Athens, Greece
3
Department of Chemical Engineering, University of Western Macedonia, 50100 Kozani, Greece
4
Centre for Advanced Research in Sciences, University of Dhaka, Dhaka 1000, Bangladesh
5
Nelson Institute Center for Sustainability and the Global Environment, University of Wisconsin–Madison, Madison, WI 53726, USA
6
Department of Chemistry, National Institute of Technology, Jamshedpur 831014, India
7
Center for Analytical Sciences, Kathmandu Institute of Applied Sciences, Kathmandu 44600, Nepal
8
Independent Researcher, Taoyuan City 320, Taiwan
*
Author to whom correspondence should be addressed.
Fire 2023, 6(9), 365; https://doi.org/10.3390/fire6090365
Submission received: 13 July 2023 / Revised: 4 September 2023 / Accepted: 15 September 2023 / Published: 19 September 2023
(This article belongs to the Special Issue Advances in Forest Fire Behaviour Modelling Using Remote Sensing)

Abstract

:
This study estimates the radiative forcing by biomass burning and dust aerosols over the Indian subcontinent, with emphasis on the Indo-Gangetic Plains (IGP) during the period from January 2021 to April 2021, based on multiple satellite and reanalysis datasets. In this respect, we used retrievals from the Moderate Resolution Spectroradiometer (MODIS) and the Cloud-Aerosol Lidar and Infrared Pathfinder Satellite Observation (CALIPSO) system, as well as reanalysis data from the Goddard Earth Observing System, version 5 (GEOS-5), the Modern-Era Retrospective analysis for Research and Applications, version 2 (MERRA-2), the Copernicus Atmosphere Monitoring Service (CAMS), and ERA-Interim. According to the MERRA-2 and the CAMS, the highest black carbon (BC) concentrations in January 2021 were 7–8 µg m−3, which were significantly lower than measurements performed in main cities along the IGP, such as Patiala, Delhi, and Kanpur. The meteorological data analysis accompanied by the CALIPSO lidar measurements showed that the vertical distribution of total attenuated backscatter (TAB) could reach altitudes of up to ~4–5 km and could be transported over the central Himalayan region. The spatial-averaged daily aerosol radiative forcing (ARF) values over the Indian subcontinent from January 2021 to April 2021 were found to range from −51.40 to −6.08 W m−2 (mean of −22.02 ± 9.19 W m−2), while on a monthly basis, the ARF values varied widely, from −146.24 to −1.63 W m−2 (mean of −45.56 ± 22.85 W m−2) over different parts of the study region. Furthermore, the spatial-averaged daily BC radiative forcing ranged from −2.23 to −0.35 (−1.01 ± 0.40 W m−2), while it varied from −15.29 to −0.31 W m−2 (−2.46 ± 2.32 W m−2) over different regions of southern Asia, indicating a rather small contribution to the total aerosol radiative effect and a large presence of highly scattering aerosols. Our findings highlight the importance of growing biomass burning, in light of recent climate change and the rapid decline in air quality over North India and the Indian Ocean.

1. Introduction

Biomass burning (BB) is one of the primary sources of the emission of carbonaceous aerosols (organic carbon [OC] and black carbon [BC]), air pollutants, and trace and greenhouse gases (carbon dioxide [CO2], methane [CH4], carbon monoxide [CO], etc.) into the Earth’s atmosphere. BB adversely impacts air quality, visibility, and the climate system [1,2,3,4,5,6,7,8]. Furthermore, aerosols emitted by biomass burning/forest fires may affect urban fog and haze conditions [9,10], as well as human health and mortality rates [11]. Potential toxic emissions, including carcinogenic polyaromatic hydrocarbons (e.g., benzo[a]pyrene, BaP), can cause severe pulmonary disorders such as asthma, obstructive pulmonary diseases, and other severe health situations [11,12,13]. Carbonaceous aerosols constitute a large fraction (~40–70%) of atmospheric aerosols in urban and rural environments [14], especially in South Asian countries, where open BB activity contributes ~65% to primary OC and ~40% to elemental carbon (EC), since the primary sources of OC are combustion processes [14,15,16]. In 2005 in India, Venkataraman et al. [17] estimated that biofuel combustion and open BB were the largest sources of OC (87%) and BC (75%) aerosols.
Moreover, due to progressive urbanization, industrialization, commercialization, large population density, and extensive land use changes, the southern and eastern Asian regions and, in particular, the northern part of India have faced great challenges with air pollution problems, experiencing a complex mixture of different aerosols [7,18,19]. The regions witness considerable amounts of biomass/wood burning throughout winter (December–February) [20] and heavy dust storms from West Asia and the Thar Desert during spring [21]. Based on high-temporal resolution measurements that were made in Delhi from June 2019 to July 2019, Shukla et al. [22] reported organics (28%), BC (17%), SO42− (10%), Cl− (5%), NH4+ (3.5%), and NO3− (2.5%) as the dominant aerosol chemical components. On the other hand, using columnar measurements of aerosols, another study identified urban-industrial (UI) sources, BB aerosols, and dust (DU) as the dominant sources in specific sites in the Indo-Gangetic Plains (IGP), including Karachi, Lahore, Jaipur, and Kanpur [23], while atmospheric mixing processes classified the aerosol types as polluted dust (PD) aerosols, polluted continental (PC) aerosols, black carbon-enriched (BCE) aerosols, and organic carbon-enriched (OCE) aerosols. That study also showed that absorbing aerosols were considered to be the most dominant [23]. The BCE and OCE aerosols were more frequent in the post-monsoon and winter seasons, whereas the PD aerosol was mostly present during the pre-monsoon and monsoon seasons.
According to the Intergovernmental Panel on Climate Change (IPCC), the radiative forcing from biomass aerosol is negative over most of the globe. Since the 1990s, aerosol research has been focused on the Indian subcontinent and its nearby seas, which have tropical and subtropical climates. These studies have revealed a significant negative surface aerosol radiative forcing (ARF) and high atmospheric heating, in comparison to top-of-the-atmosphere (TOA) forcing [16].
Water-soluble aerosols, as well as BB and dust aerosols, have the potential to act as cloud-condensation nuclei (CCNs) over northern India, thereby impacting the microphysical properties of clouds, atmospheric brown clouds, and the regional climate [16,24,25,26]. During recent decades, a significant increase in aerosol loading (fine anthropogenic aerosols) was observed in India, mainly in the northern region, which was attributed to rapid socio-economic development, urbanization, industrialization, open wildfire/biomass burning, biofuel consumption for heating and cooking, and energy demands [3,15,27,28,29,30,31,32,33], while the dust activity during the pre-monsoon season (March–May) was reduced [34,35,36].
Therefore, it is necessary to understand the aerosol radiative effects that are due to the combined contribution of dust and biomass burning, originating in many parts of the IGP, and their climate implications during winter and the pre-monsoon season, which may have a high effect on the onset, duration, and intensity of monsoons over the Indian subcontinent. In this study, multiple satellites and ground-based measurements were employed with the aim of assessing surface radiative forcing. The results may be utilized in climate models for future climate change projections over the region.
The impact of BB aerosols (as a major consideration) and dust (as a secondary consideration) on radiation over the Indian subcontinent from January 2021 to April 2021 was estimated. This period was selected due to large fire counts from agricultural burning and forest fires in northern India, the concurrent presence of pre-monsoon dust from the Thar Desert, and the clear dominance of carbonaceous aerosols (OC, BC) from fossil-fuel combustion and biofuel burning during winter. In Section 2, we discuss retrievals from different databases and the methodologies that were used for their analyses. Section 3 discusses the main results of our research. Section 4 provides the main findings of our research.

2. Datasets and Methodology

2.1. Datasets

2.1.1. Satellite Remote Sensing Data

The MODerate Resolution Imaging Spectroradiometer (MODIS) is one of the primary instruments onboard the Terra and Aqua polar-orbit satellites. In this study, Terra and Aqua MODIS combined dark target and deep blue AOD at 550 nm retrievals (collection 6.1; level 3 (1° × 1°)) were used over the Indian subcontinent during the period of January–April 2021. In addition to MODIS AOD, the MODIS and VIIRS fire counts and fire radiative power data were also used [37,38,39]. More details on the fire data sources can be found in previous work [40].
For the same studied period, the Cloud-Aerosol LiDAR and Infrared Pathfinder Satellite Observation (CALIPSO) level 1 attenuated backscatter profiles and the level 2 vertical feature mask (VFM) products, derived from the backscatter CALIPSO measurements, were studied. The latest version 4.21 of the standard VFM product, which provides the vertical profile information of aerosol subtypes, along with the location of each aerosol layer, was used [41,42]. The CALIPSO LiDAR profiles have a vertical and horizontal resolution of 30 and 333 m, respectively, and up to 8.2 km of atmospheric altitude [42]. The VFM additionally provides seven different aerosol subtypes in the troposphere, namely (i) dust, (ii) polluted dust, (iii) clean continental, (iv) polluted continental/smoke, (v) elevated smoke, (vi) clean marine, and (vii) dusty marine [41,43].

2.1.2. Reanalysis Data

The Modern-Era Retrospective Analysis for Research and Applications, Version 2 (MERRA-2) reanalysis datasets were complementarily used to investigate the contribution of dust, as well as other aerosol types like those from forest fires/biomass burning, in more detail over the Indian subcontinent. MERRA-2 is a NASA atmospheric reanalysis for the satellite era, which was produced with the Goddard Earth Observing System version 5 (GOES-5) model, along with the Atmospheric Data Assimilation System version 5.12.4. It provides three-dimensional data with a spatial resolution of 0.5° × 0.625° and consists of 72 hybrid-eta layers from surface to 0.01 hPa. MERRA-2 provides 3 h global data of different aerosol species such as sulfate, BC, OC, dust, and sea salt, and more technical details can be found in several studies [27,44,45,46,47,48]. The near-surface particulate matter with aerodynamic diameter < 2.5 μm (PM2.5) was calculated over India from different aerosol species using Equation (1) [47,49,50,51,52]. At the same time, MERRA-2 provided the mass concentrations of various components, and hence, Equations (1) and (2) describe the processing chain of the PM2.5 mass concentrations and vertical distributions calculation.
P M 2.5 = 1.375 × S O 4 + 1.6 × O C + B C + D u s t 2.5 + S S 2.5
where the SO4, OC, BC, Dust2.5, and SS2.5 are the surface mass concentrations of sulfate, organic carbon, black carbon, dust and sea salt at a diameter of less than 2.5 µm, respectively, as obtained from the MERRA-2 dataset. In the present analysis, the conversion factors of 1.375 for SO4 [53] and 1.6 for OC [54] were used in order to reconstruct the mass concentrations of (NH4)2SO4 (inorganic ions) and organic matter (OM), respectively. More technical details regarding the conversion factors are provided in the Appendix. Apart from PM2.5 surface concentrations, MERRA-2 reanalysis also provides the vertical distribution of PM2.5 mass, which facilitated the sea salt and dust mass concentrations separation over five bins as per the size of the aerosol. The vertical distribution of PM2.5 is estimated using Equation (2), as follows [46,55,56].
P M 2.5 = 1.375 × S O 4 + 1.6 × O C P H I L I C + O C P H O B I C + B C P H I L I C + B C P H O B I C + D u s t 1 + D u s t 2 × 0.38 + S S 1 + S S 2 + S S 3 × 0.83 × A I R D E N S
where PHILIC and PHOBIC represent hydrophilic and hydrophobic components of organic and black carbon, respectively, while the subscripts for dust and sea salt aerosols represent the corresponding size bins [46]. The aerosol species vertical-profile information was provided via a mass mixing ratio, which, multiplied by air density (AIRDENS), results in the PM2.5 concentration. To investigate the atmospheric dynamics during the study period, the horizontal wind data from the MERRA-2 reanalysis were used.

2.1.3. CAMS Data

The Copernicus Atmosphere Monitoring Service (CAMS) is implemented by the European Center for Medium-Range Weather Forecasts (ECMWF) under the Copernicus program, which provides modeled aerosol and air quality information related to air pollution and health, solar energy, and greenhouse gases, along with climate forcing over the globe. The CAMS AOD re-analysis uses five different aerosol species, such as sea salt, dust, organic matter, black carbon, and sulfate, while further details can be found in several studies [57,58]. The spatial resolution of CAMS reanalysis data is 0.4° × 0.4° (spatial resolution of CAMS forecasts), and the temporal resolution is 3 h [40,59].

2.2. Methodology

To simulate the gridded global horizontal irradiance (GHI) under the aerosol-laden atmosphere over India, the libRadtran RTM [60,61] was used. GHI is the total amount of radiation reaching a horizontal surface and is strongly attenuated by BB and dust aerosols [28,39,40]. In this study, a rapid mode of RTM simulations based on the pre-calculated lookup tables developed by Kosmopoulos et al. [62] was used, similarly to several studies [40,63,64,65]. In order to run the radiative transfer model (RTM) simulations on an hourly basis for the assessment of the radiative forcing by aerosols over the Indian subcontinent during January–April 2021, the 3 h values of CAMS were kept constant within the 3 h time interval. The main input parameters for the RTM simulations were as follows: AOD550, solar zenith angle (SZA), single scattering albedo, total columnar ozone (TOC), Ångström exponent (AE), and columnar water vapor (WV), which were obtained from MERRA-2 and CAMS datasets. The SZA was taken from an in-house astronomical model, while a constant value of AE = 1.4 and TOC = 350 DU were used [63,64,65]. The output of RTM is the GHI that can be applied for the surface radiative forcing estimation via Equations (3) and (4).
A e r o s o l   R a d i a t i v e   F o r c i n g S u r f a c e = G H I A e r o s o l G H I N o   A e r o s o l s
B C   R a d i a t i v e   F o r c i n g S u r f a c e = G H I B C G H I N o   B C  

3. Results and Discussion
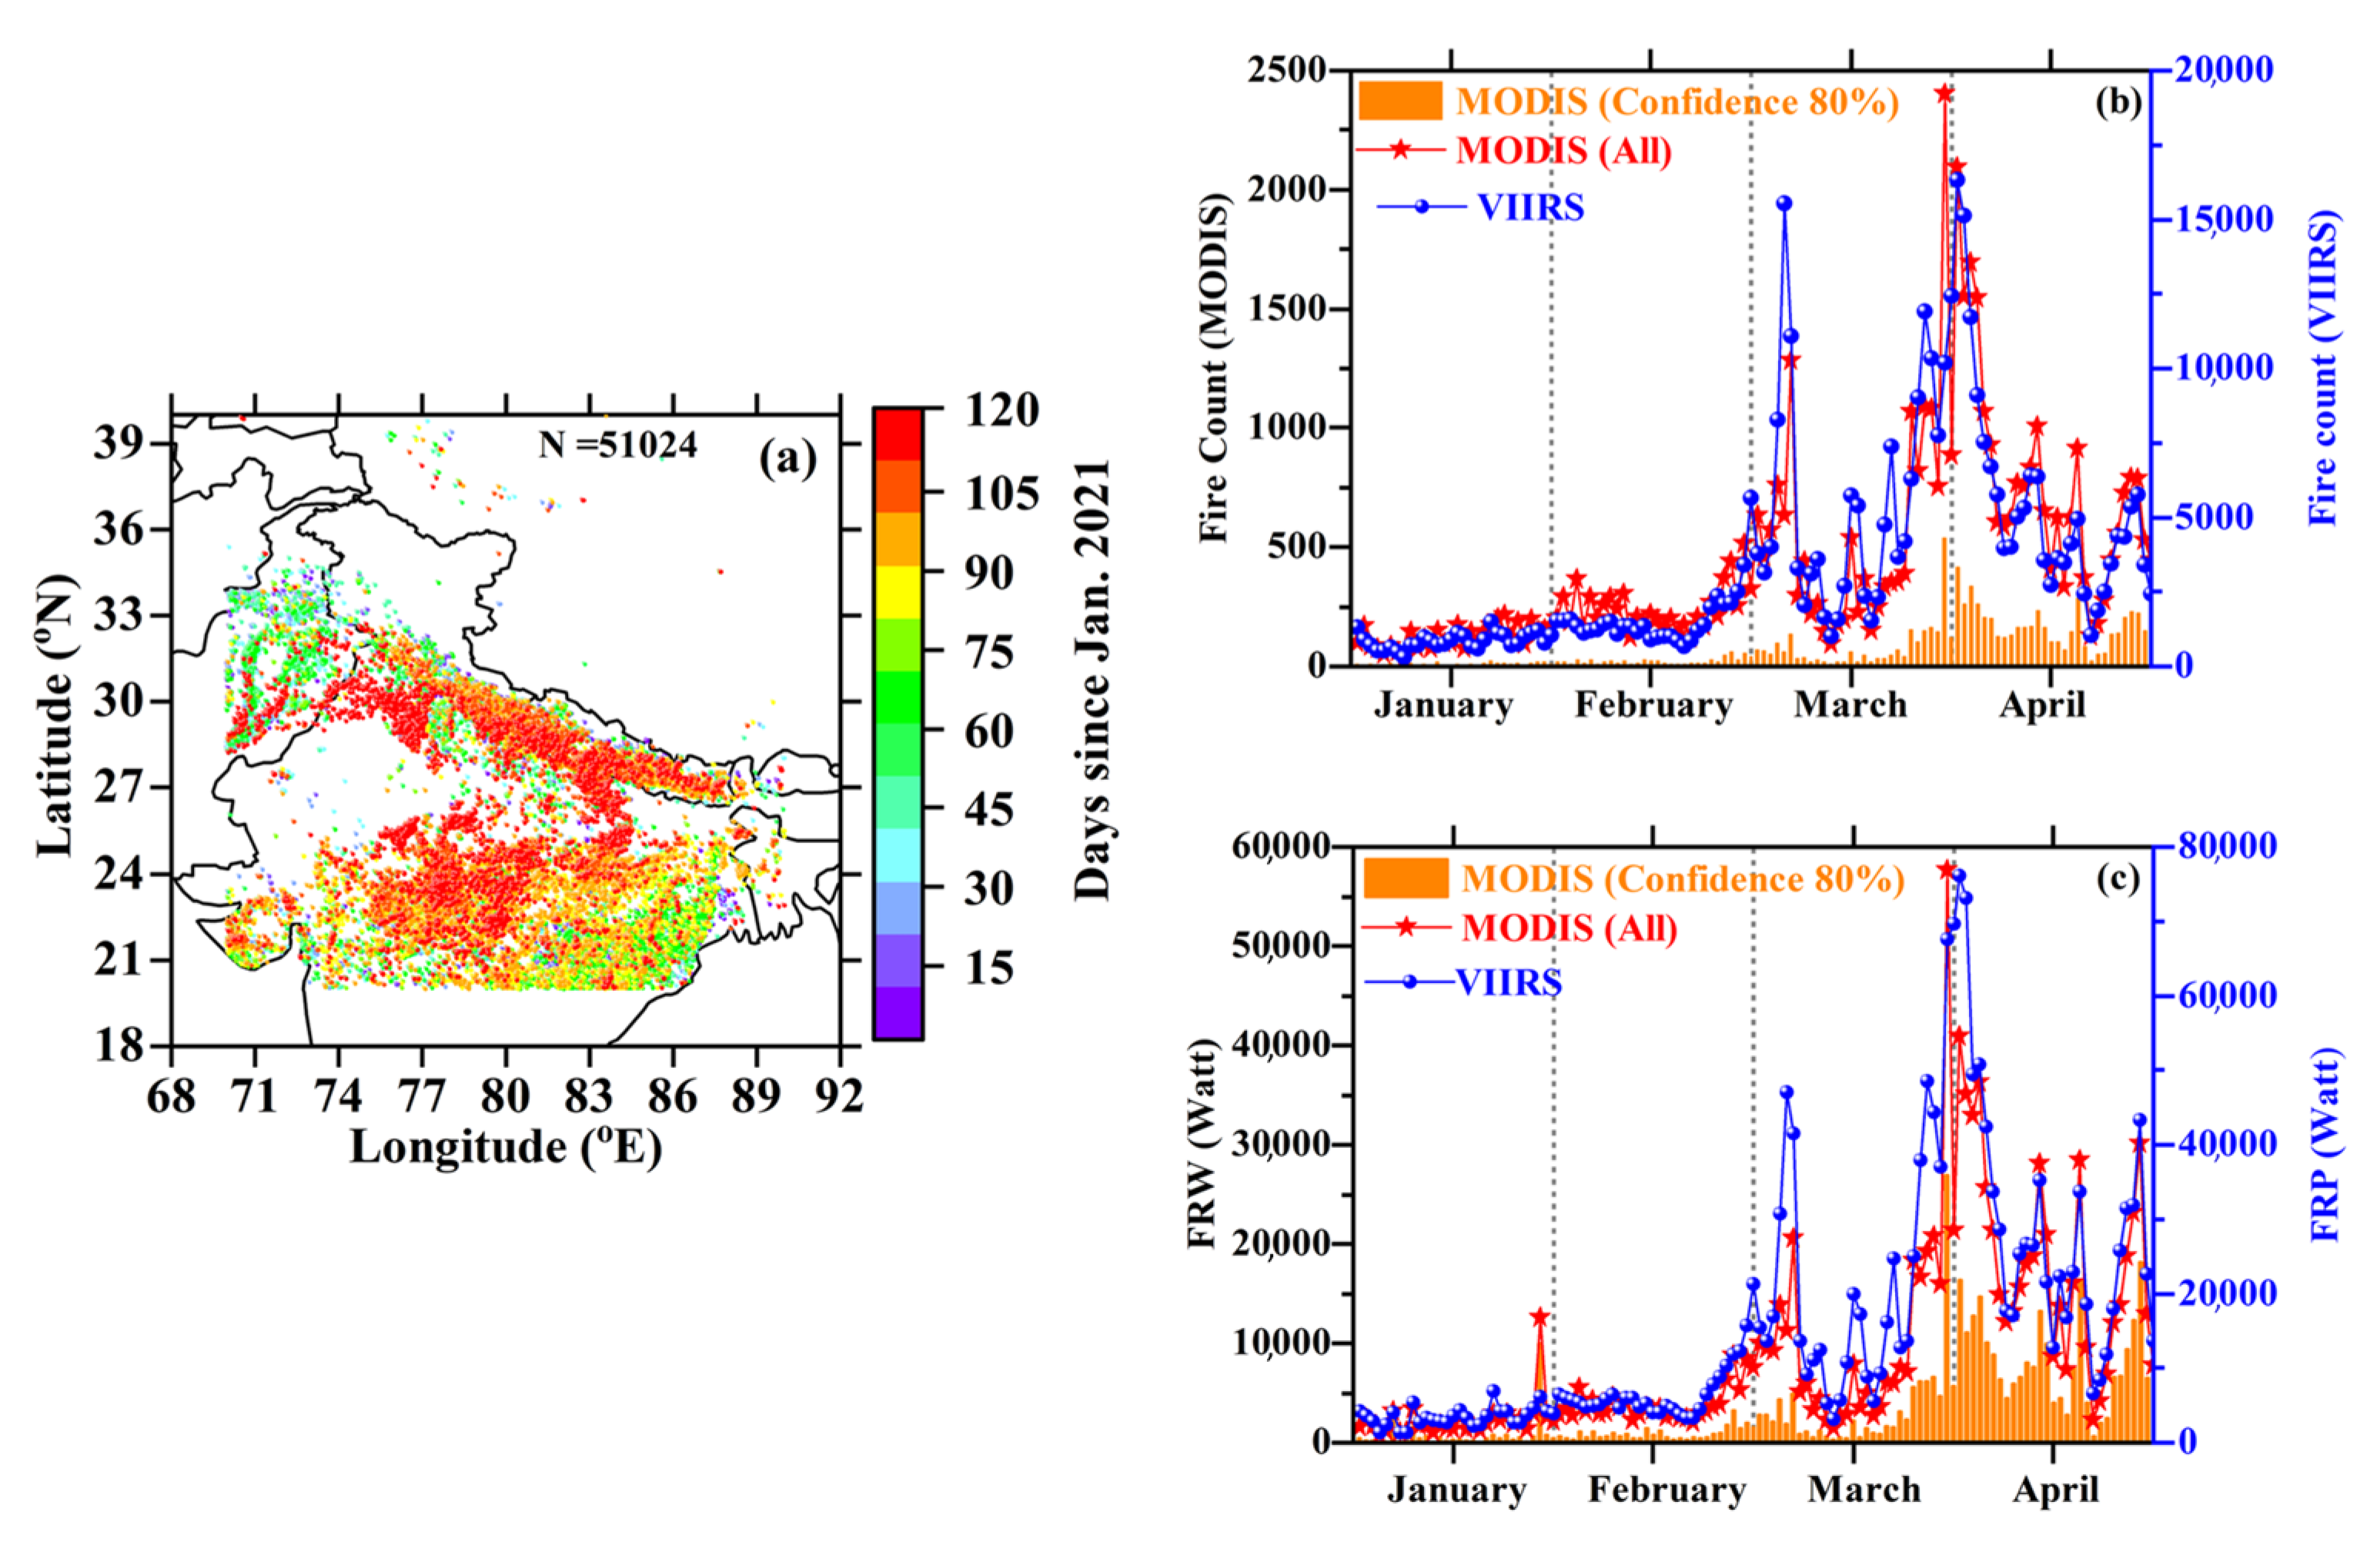
3.1. Fire Counts

The spatial distribution of all thermal anomalies (i.e., fire counts in red dots) over the northern Indian subcontinent detected by Terra and Aqua MODIS from January to April 2021 is presented in Figure 1a. The details of fire activity (forest wildfires and agricultural burning) were already presented and discussed in a previous study [40], and hence, a brief description is given here. The northern part of India usually experiences many forest fires/agricultural burning events during March–June, as well as during the October–November months [2,3,20,34,40]. The color bar shows the day when the fire was detected during January to April 2021, with a total of 51,024 fire counts detected over the region, the majority of which occurred in the Indo-Gangetic Himalayan region and central India in April (days 90–120). The India State of Forest Report (ISFR, 2021) shows that the number of forest fires in Uttarakhand State during November 2020–June 2021 were 28.3 times higher than in the same period of the previous year (i.e., November 2019–June 2020), indicating that pre-monsoon of 2021 was an abnormally high fire-affected period for the Himalayan region. Furthermore, based on ISFR, the total number of 345,989 fire counts recorded over the Indian subcontinent from November 2020 to June 2021 was ~2.7 times more than the respective fire counts of the previous year (November 2019 to June 2020). In addition, the time-series analysis of MODIS and S-NPP VIIRS fire counts and fire radiative power are plotted in Figure 1b and Figure 1c, respectively. Both MODIS and VIIRS fire counts, as well as fire radiative power, increased gradually from mid-February and peaked in April. The fire radiative power also exhibits a variation similar to that of fire counts, with a strong correlation between them (R2 = 0.90). Khanal et al. [46] reported a slightly higher correlation (R2 = 0.96) between fire counts and fire radiative power from 15 October–15 November 2020. The current analysis showed a significant effect of fire events (i.e., forest or agricultural fires) over northern India and the Himalayan foothills during mid-March–April 2021 [7,66], which significantly affect aerosol loading over the region, the formation of atmospheric brown clouds, and haze conditions and significantly attenuated levels of GHI [67,68,69].

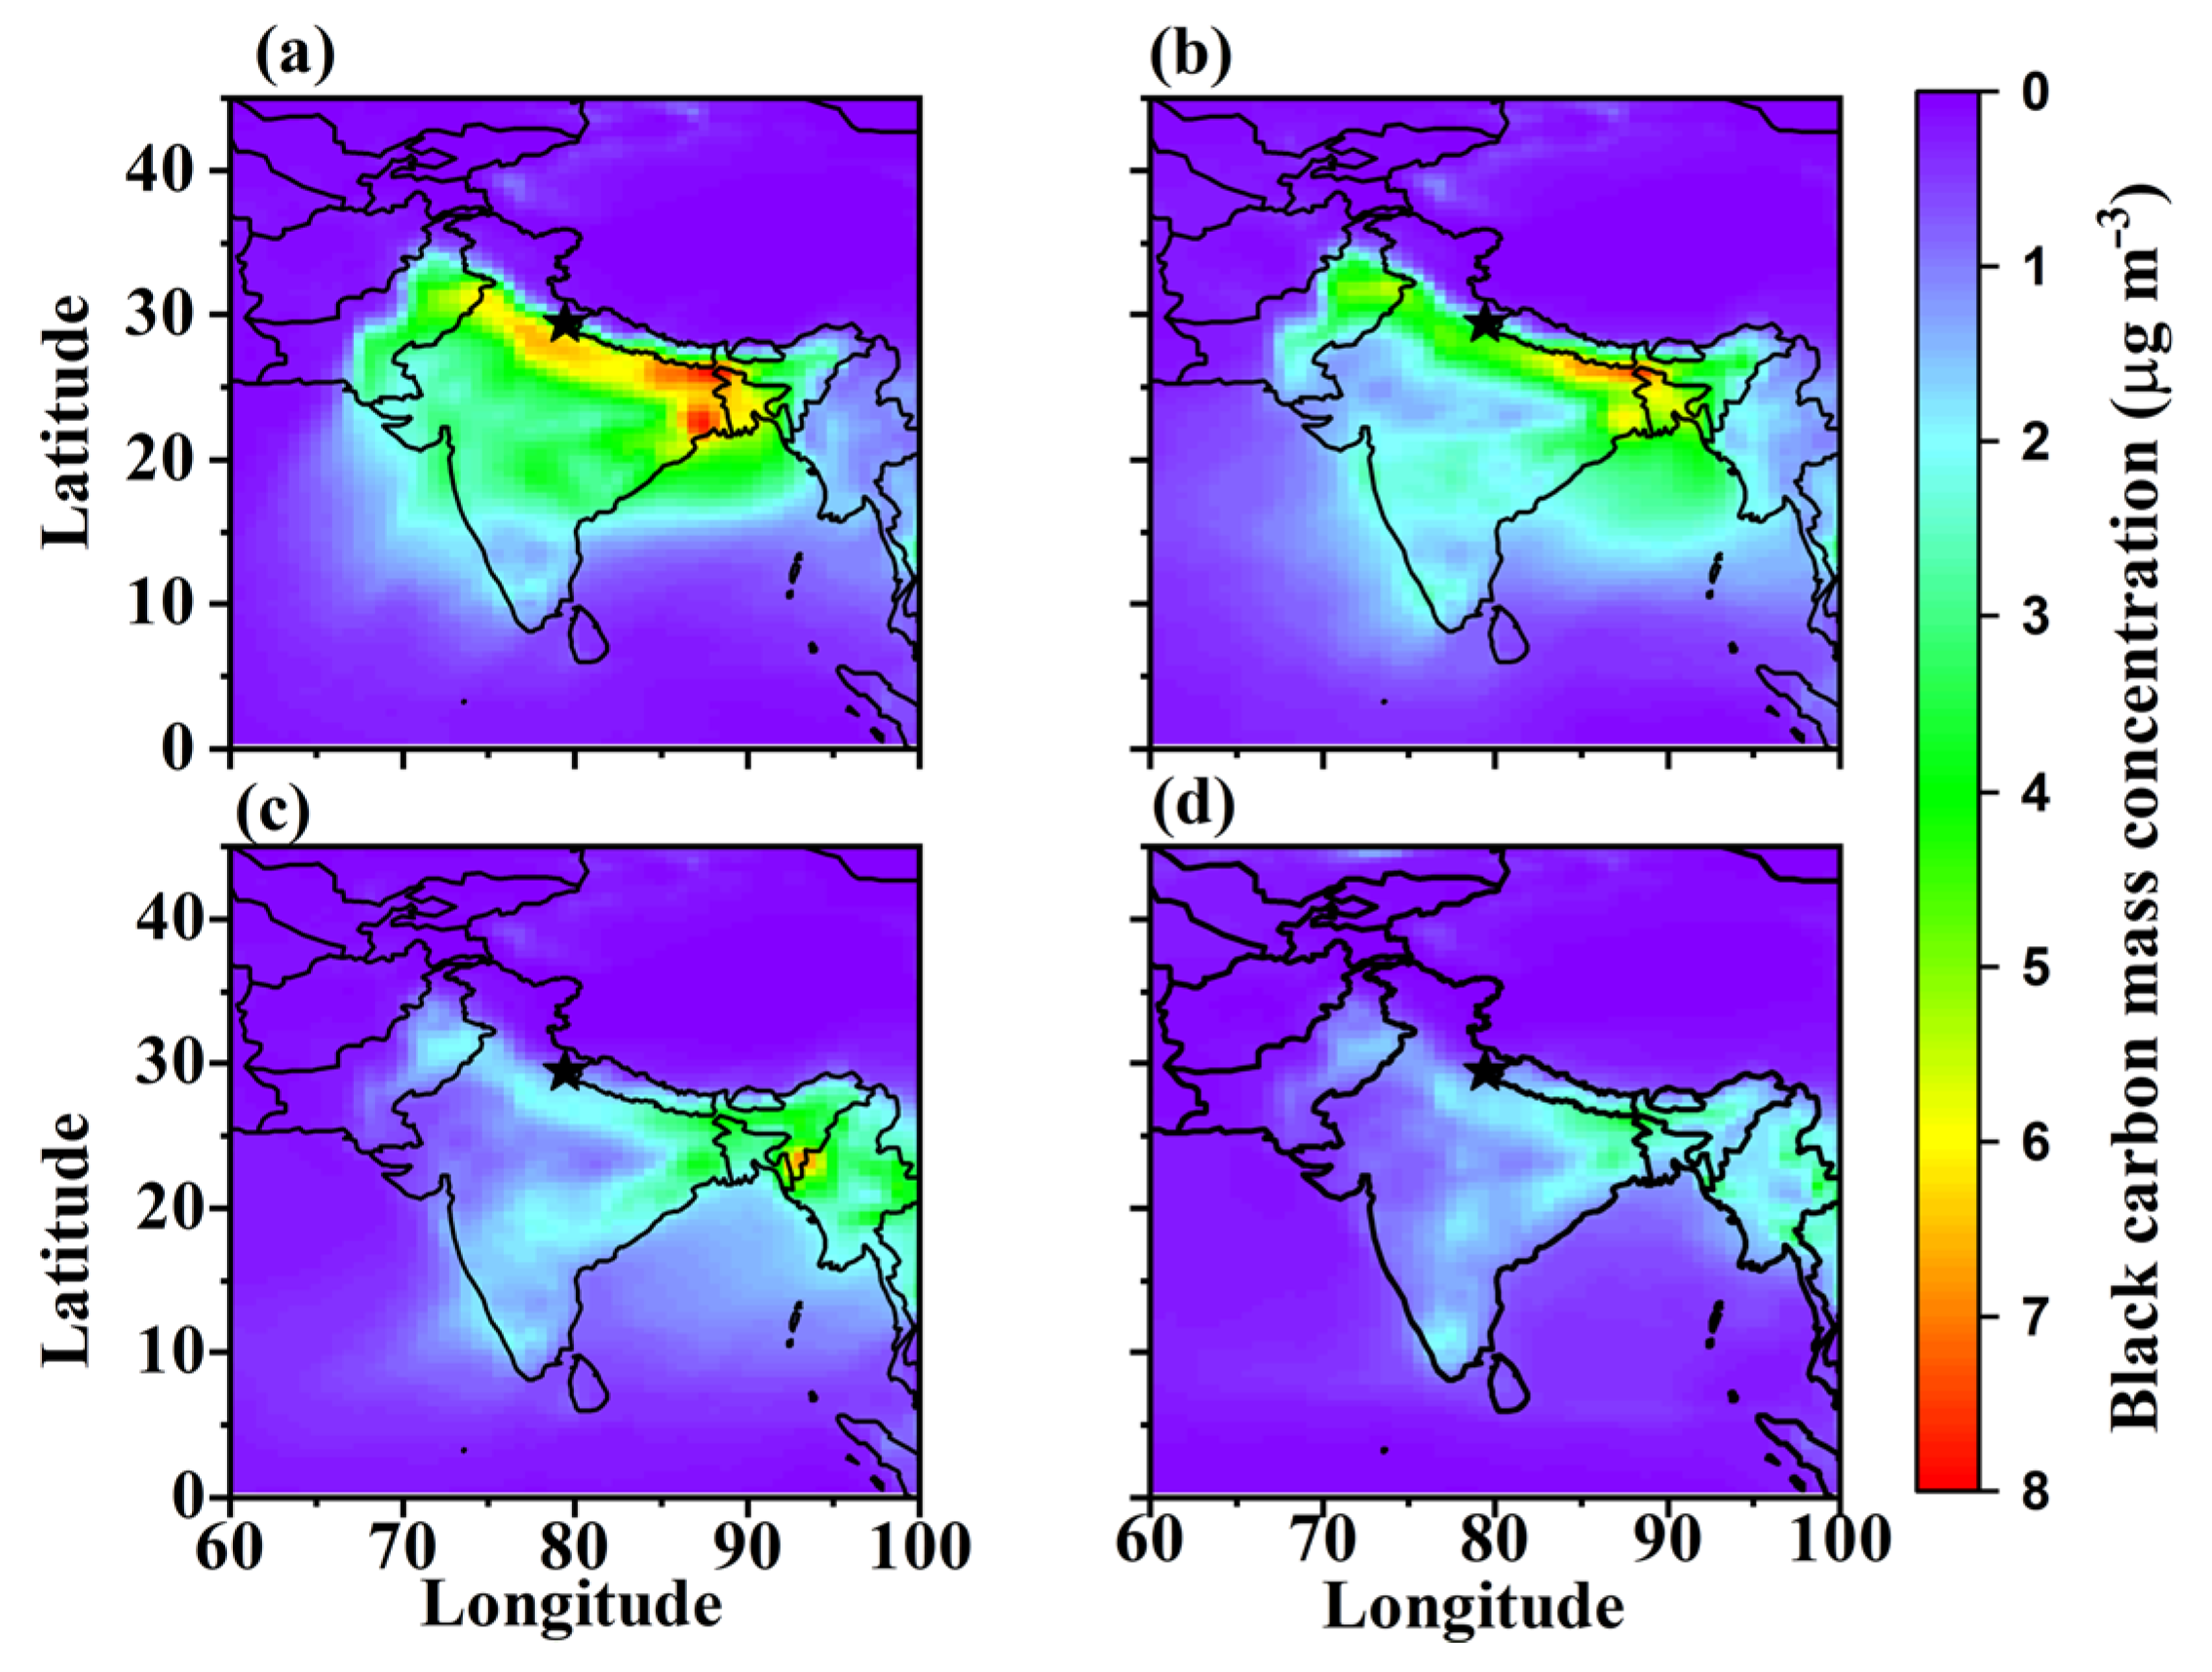
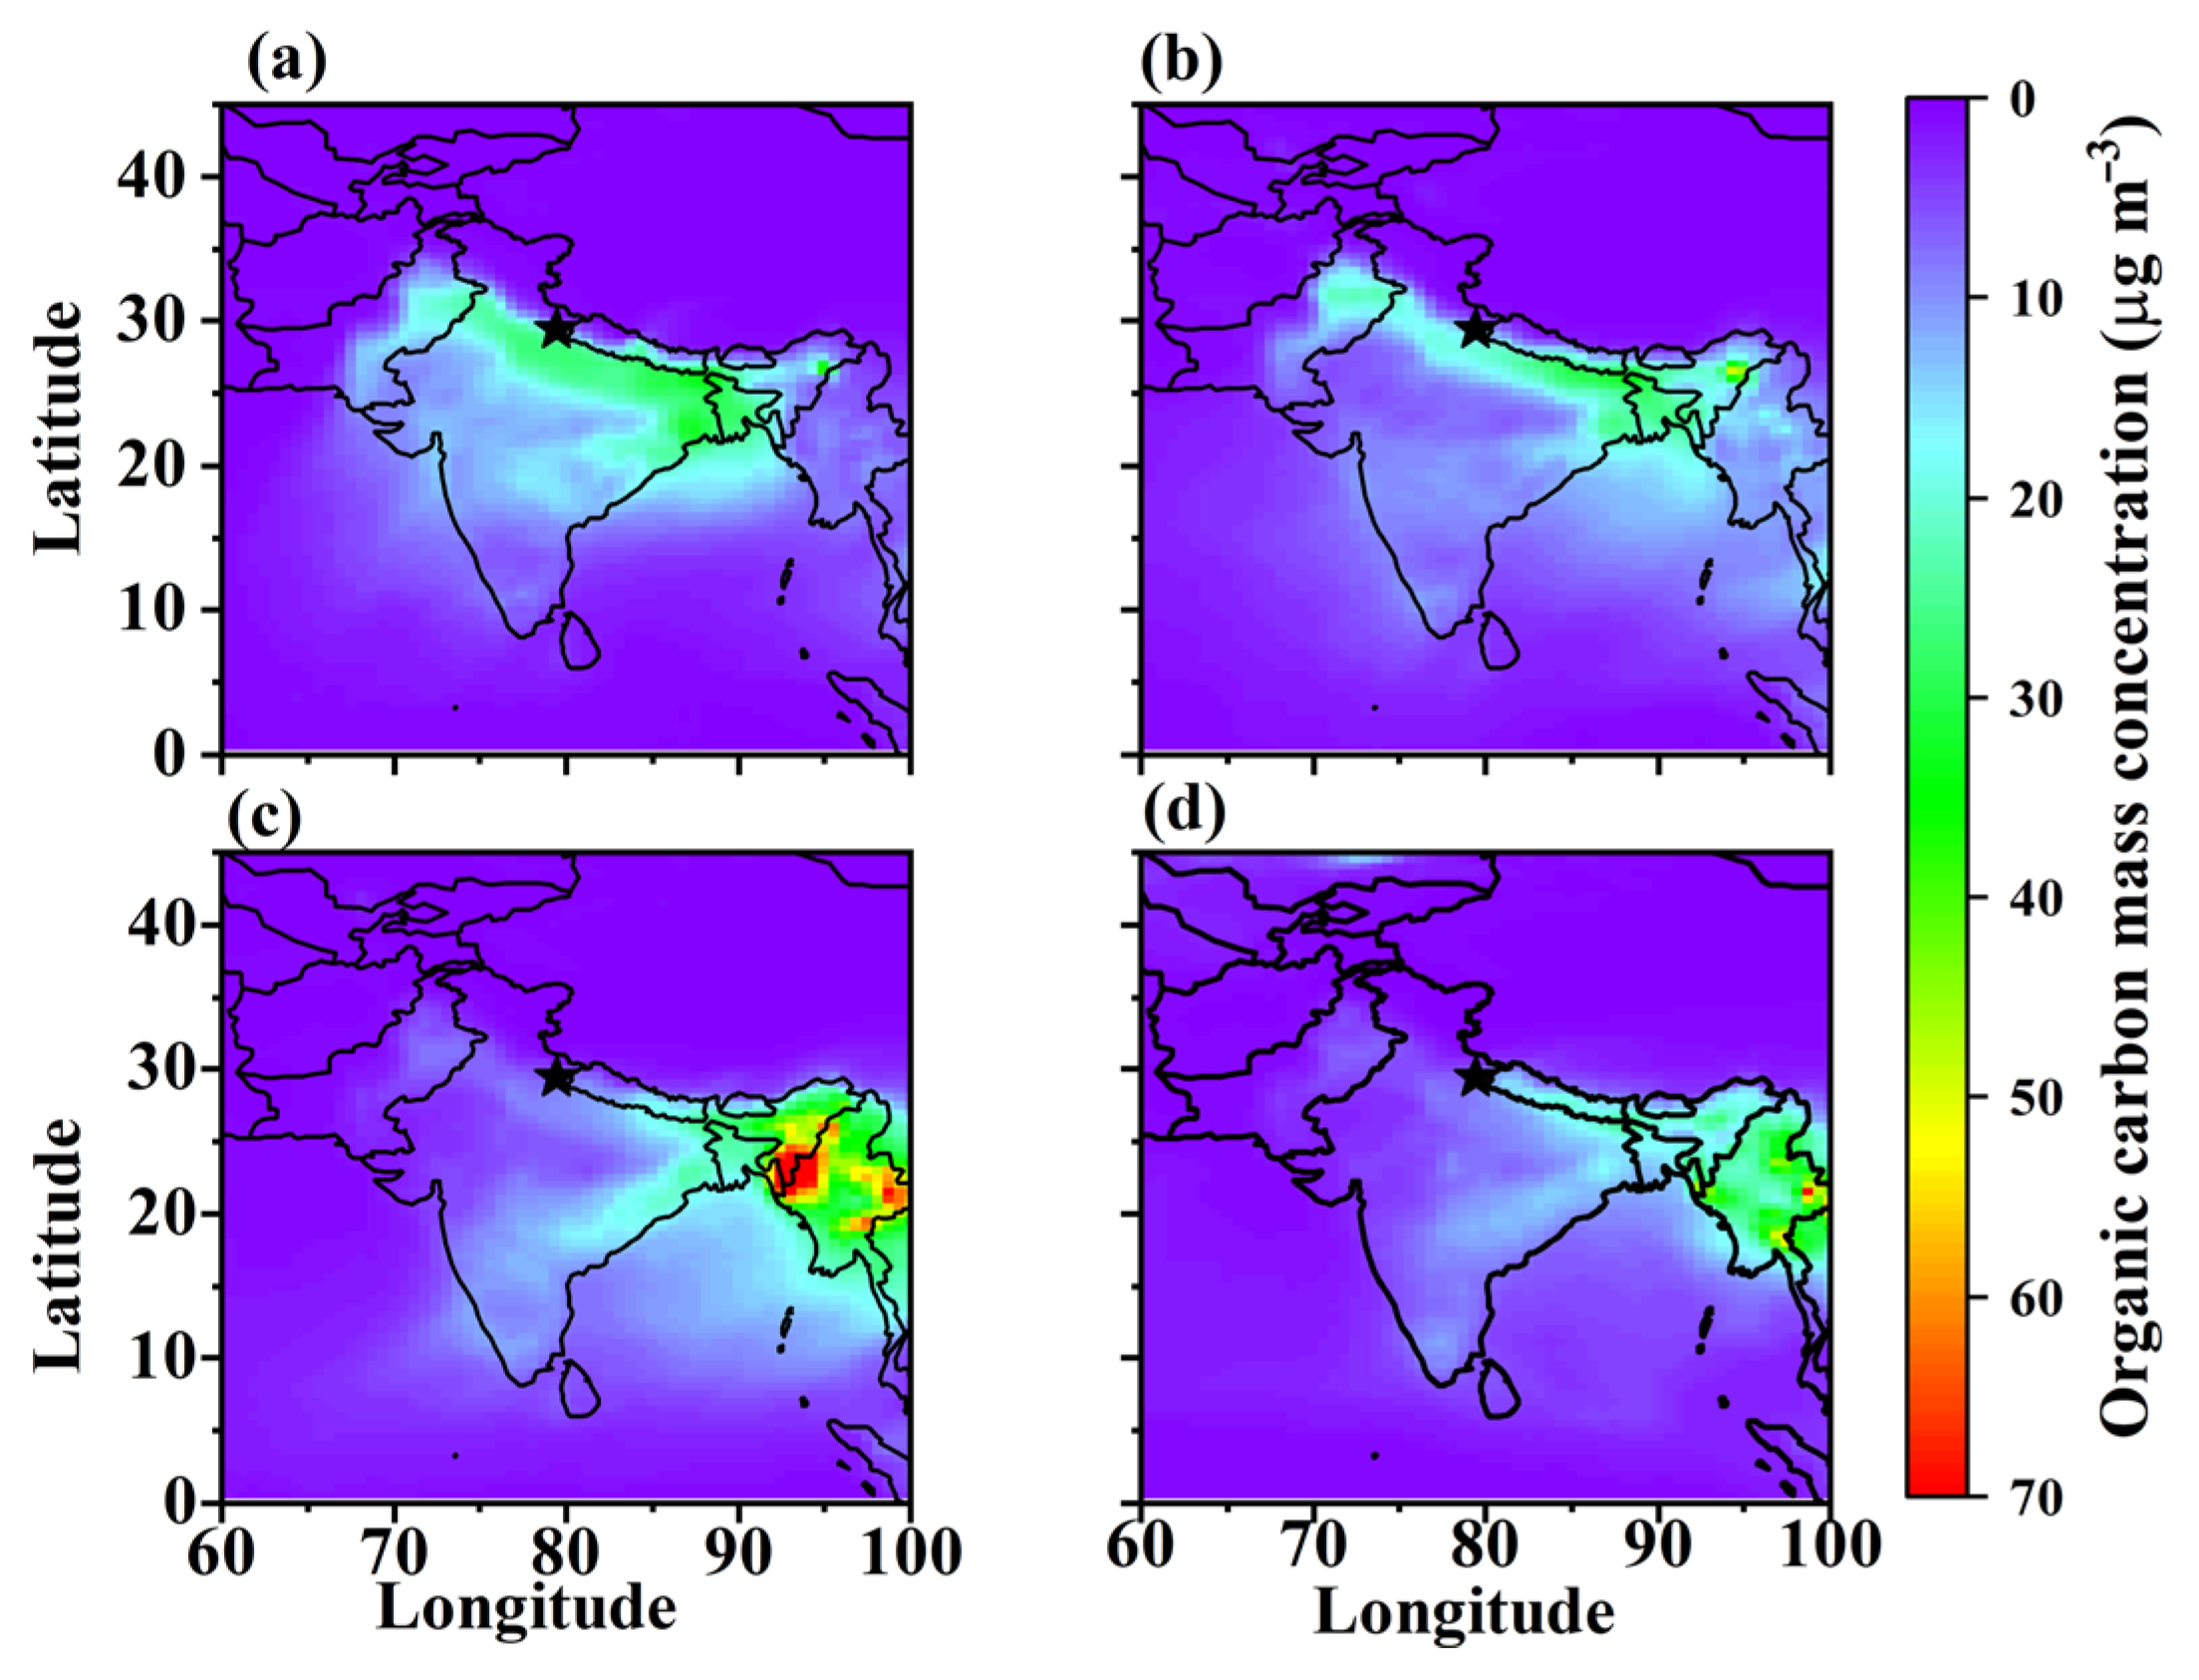
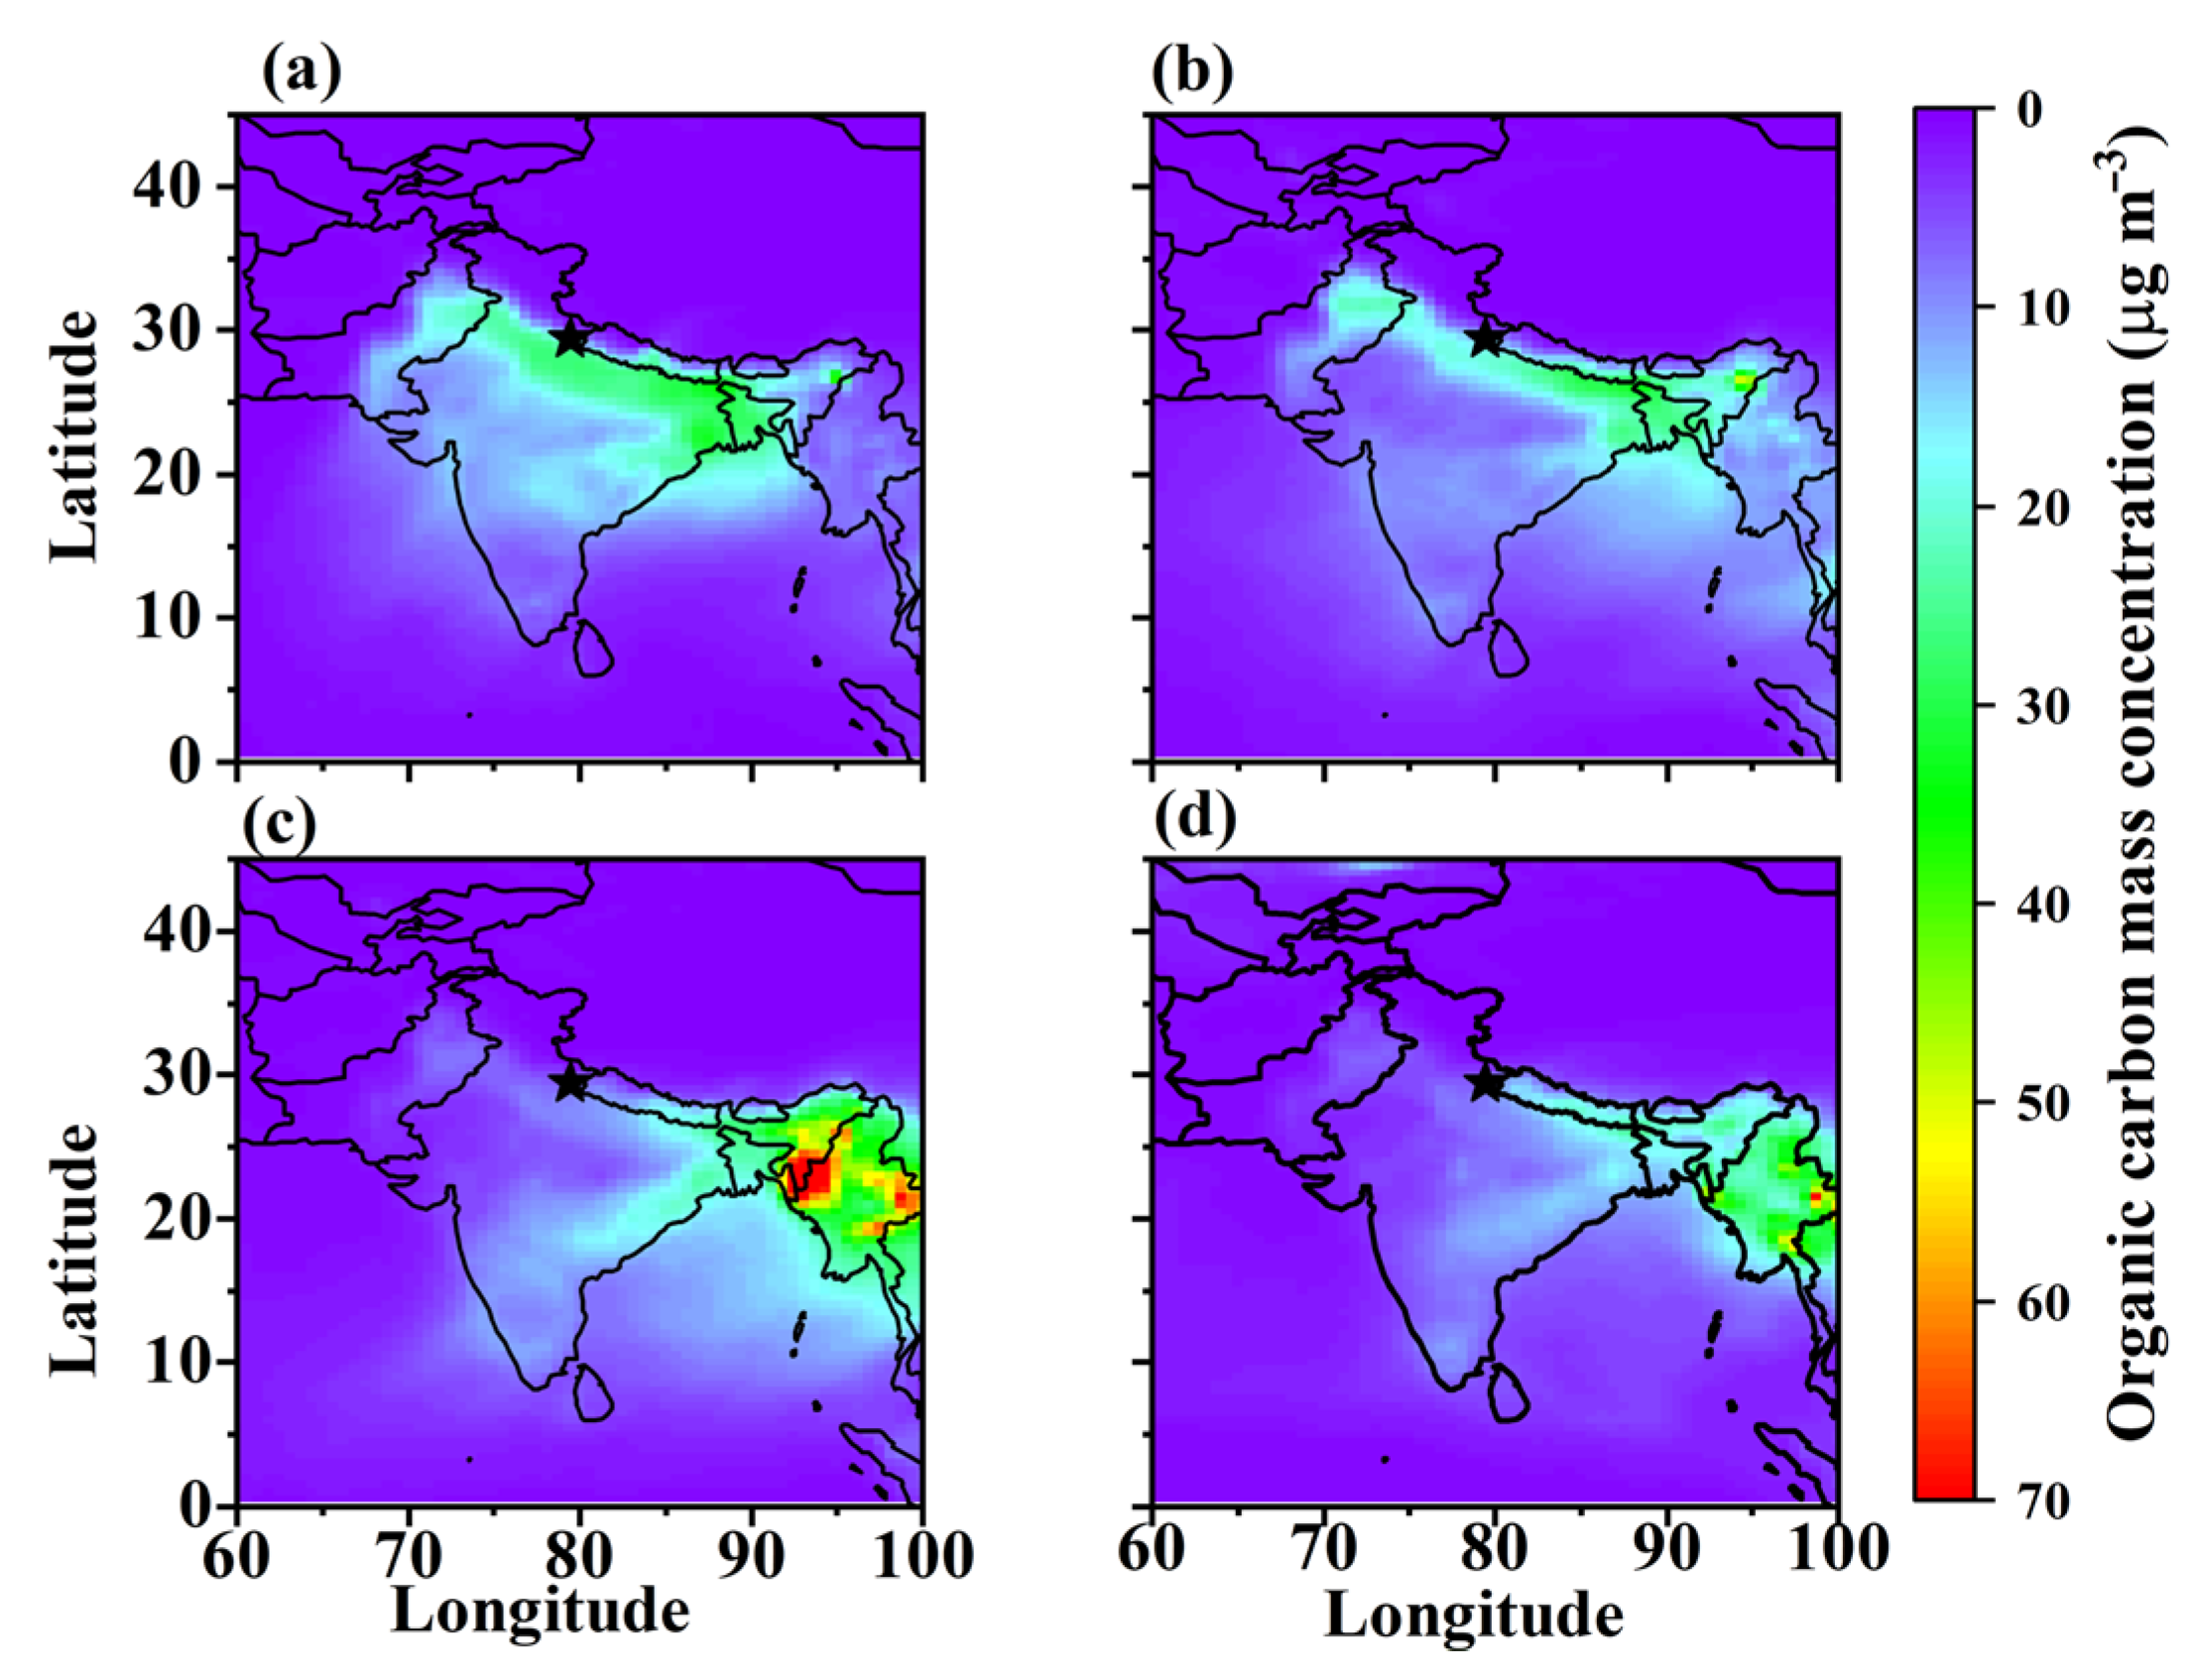
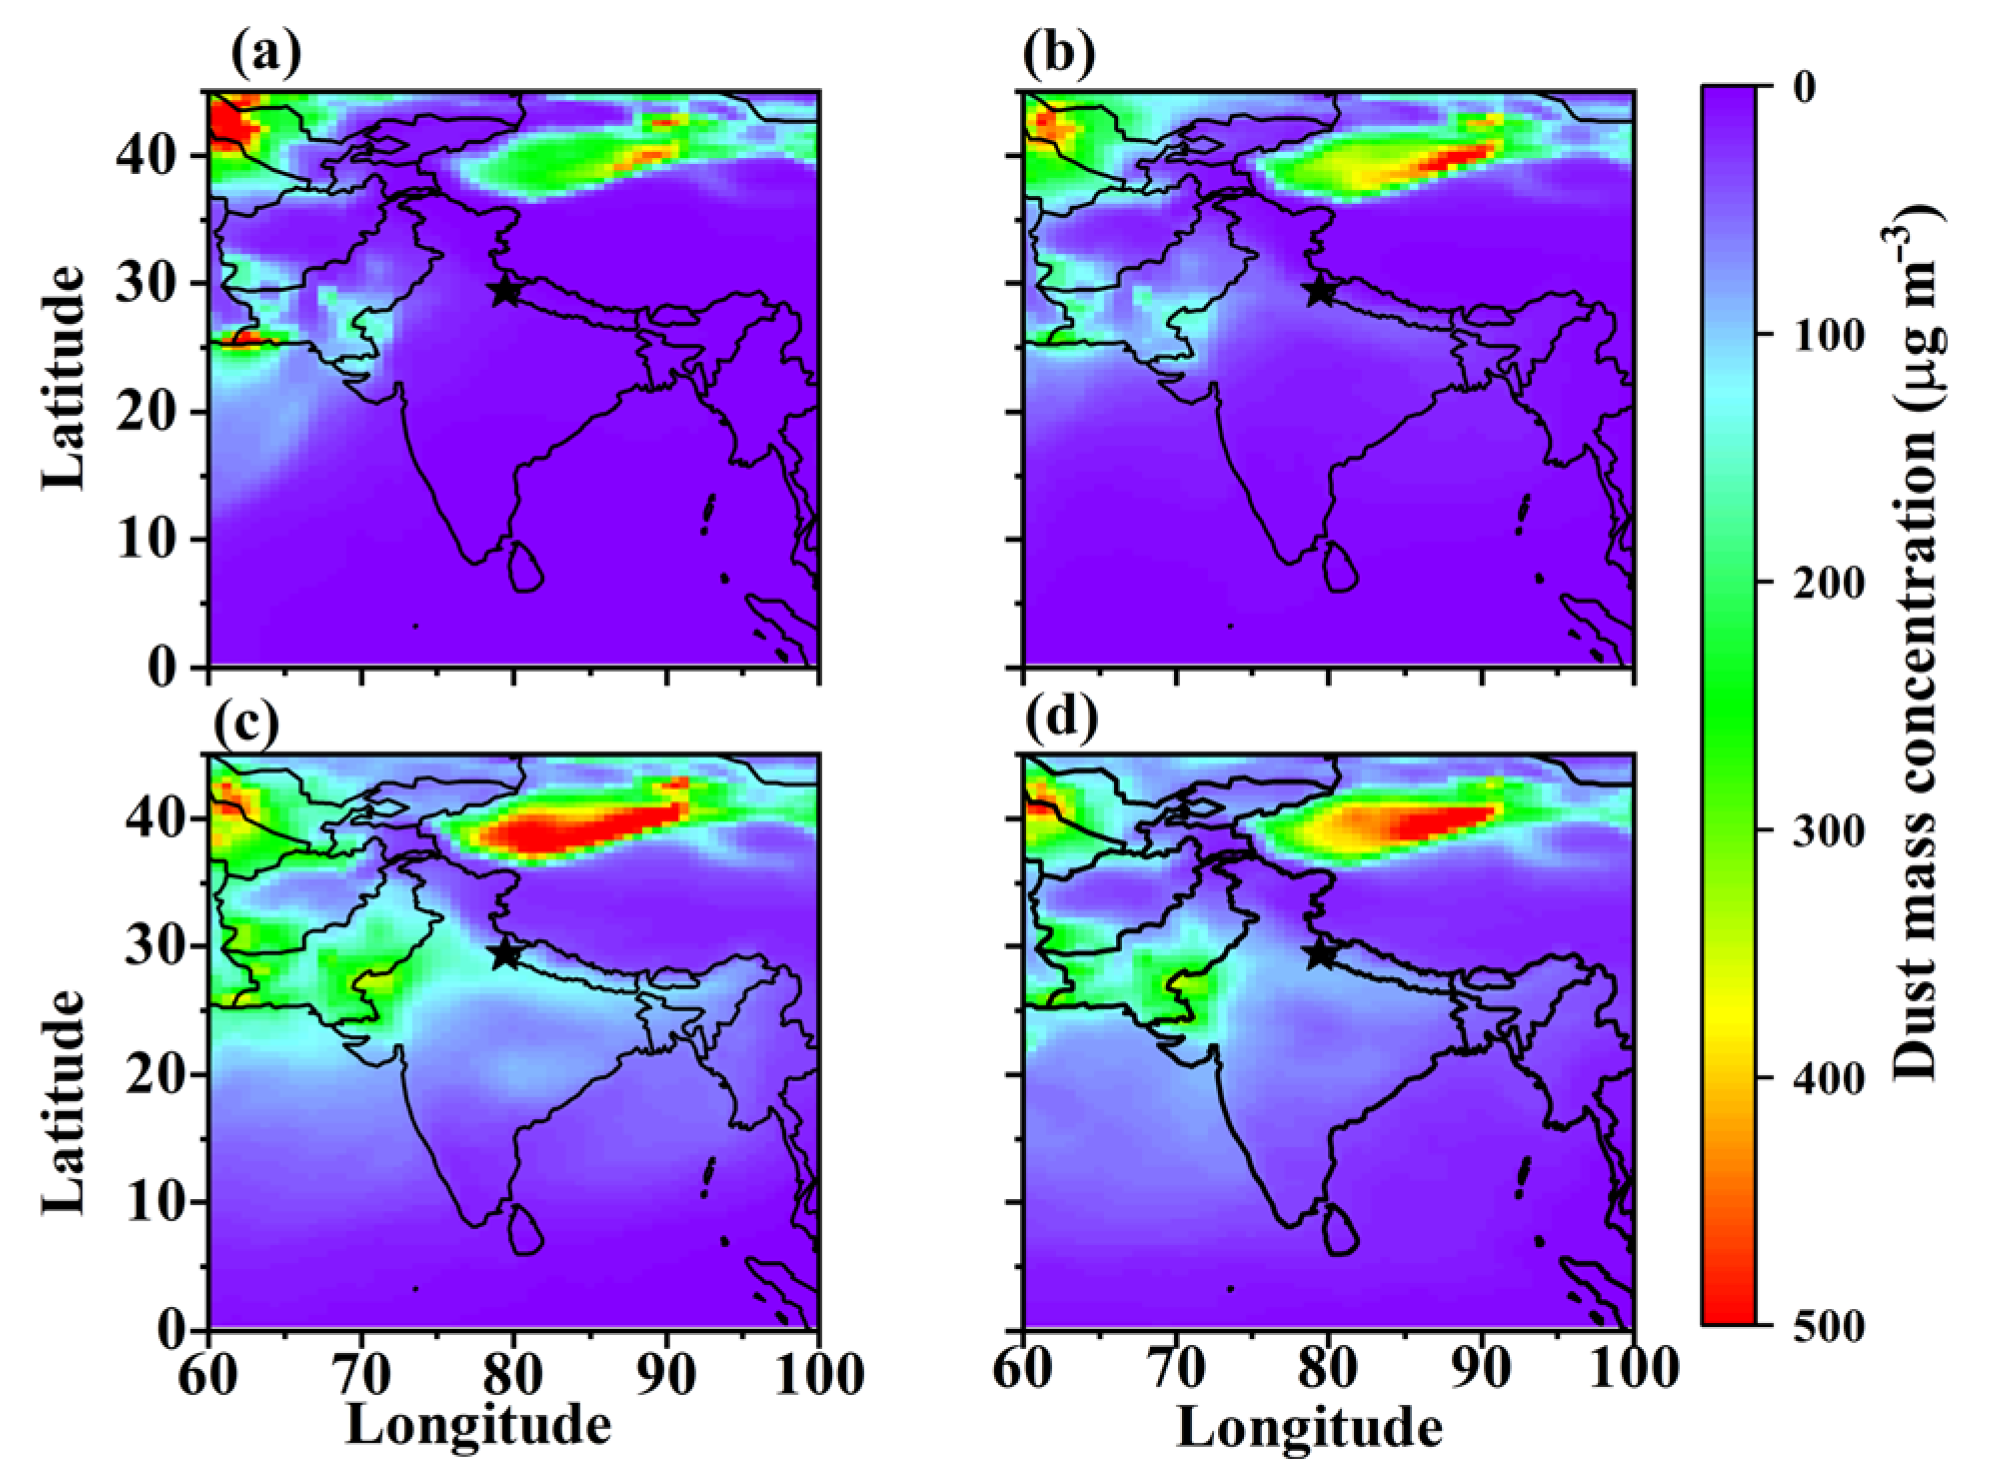
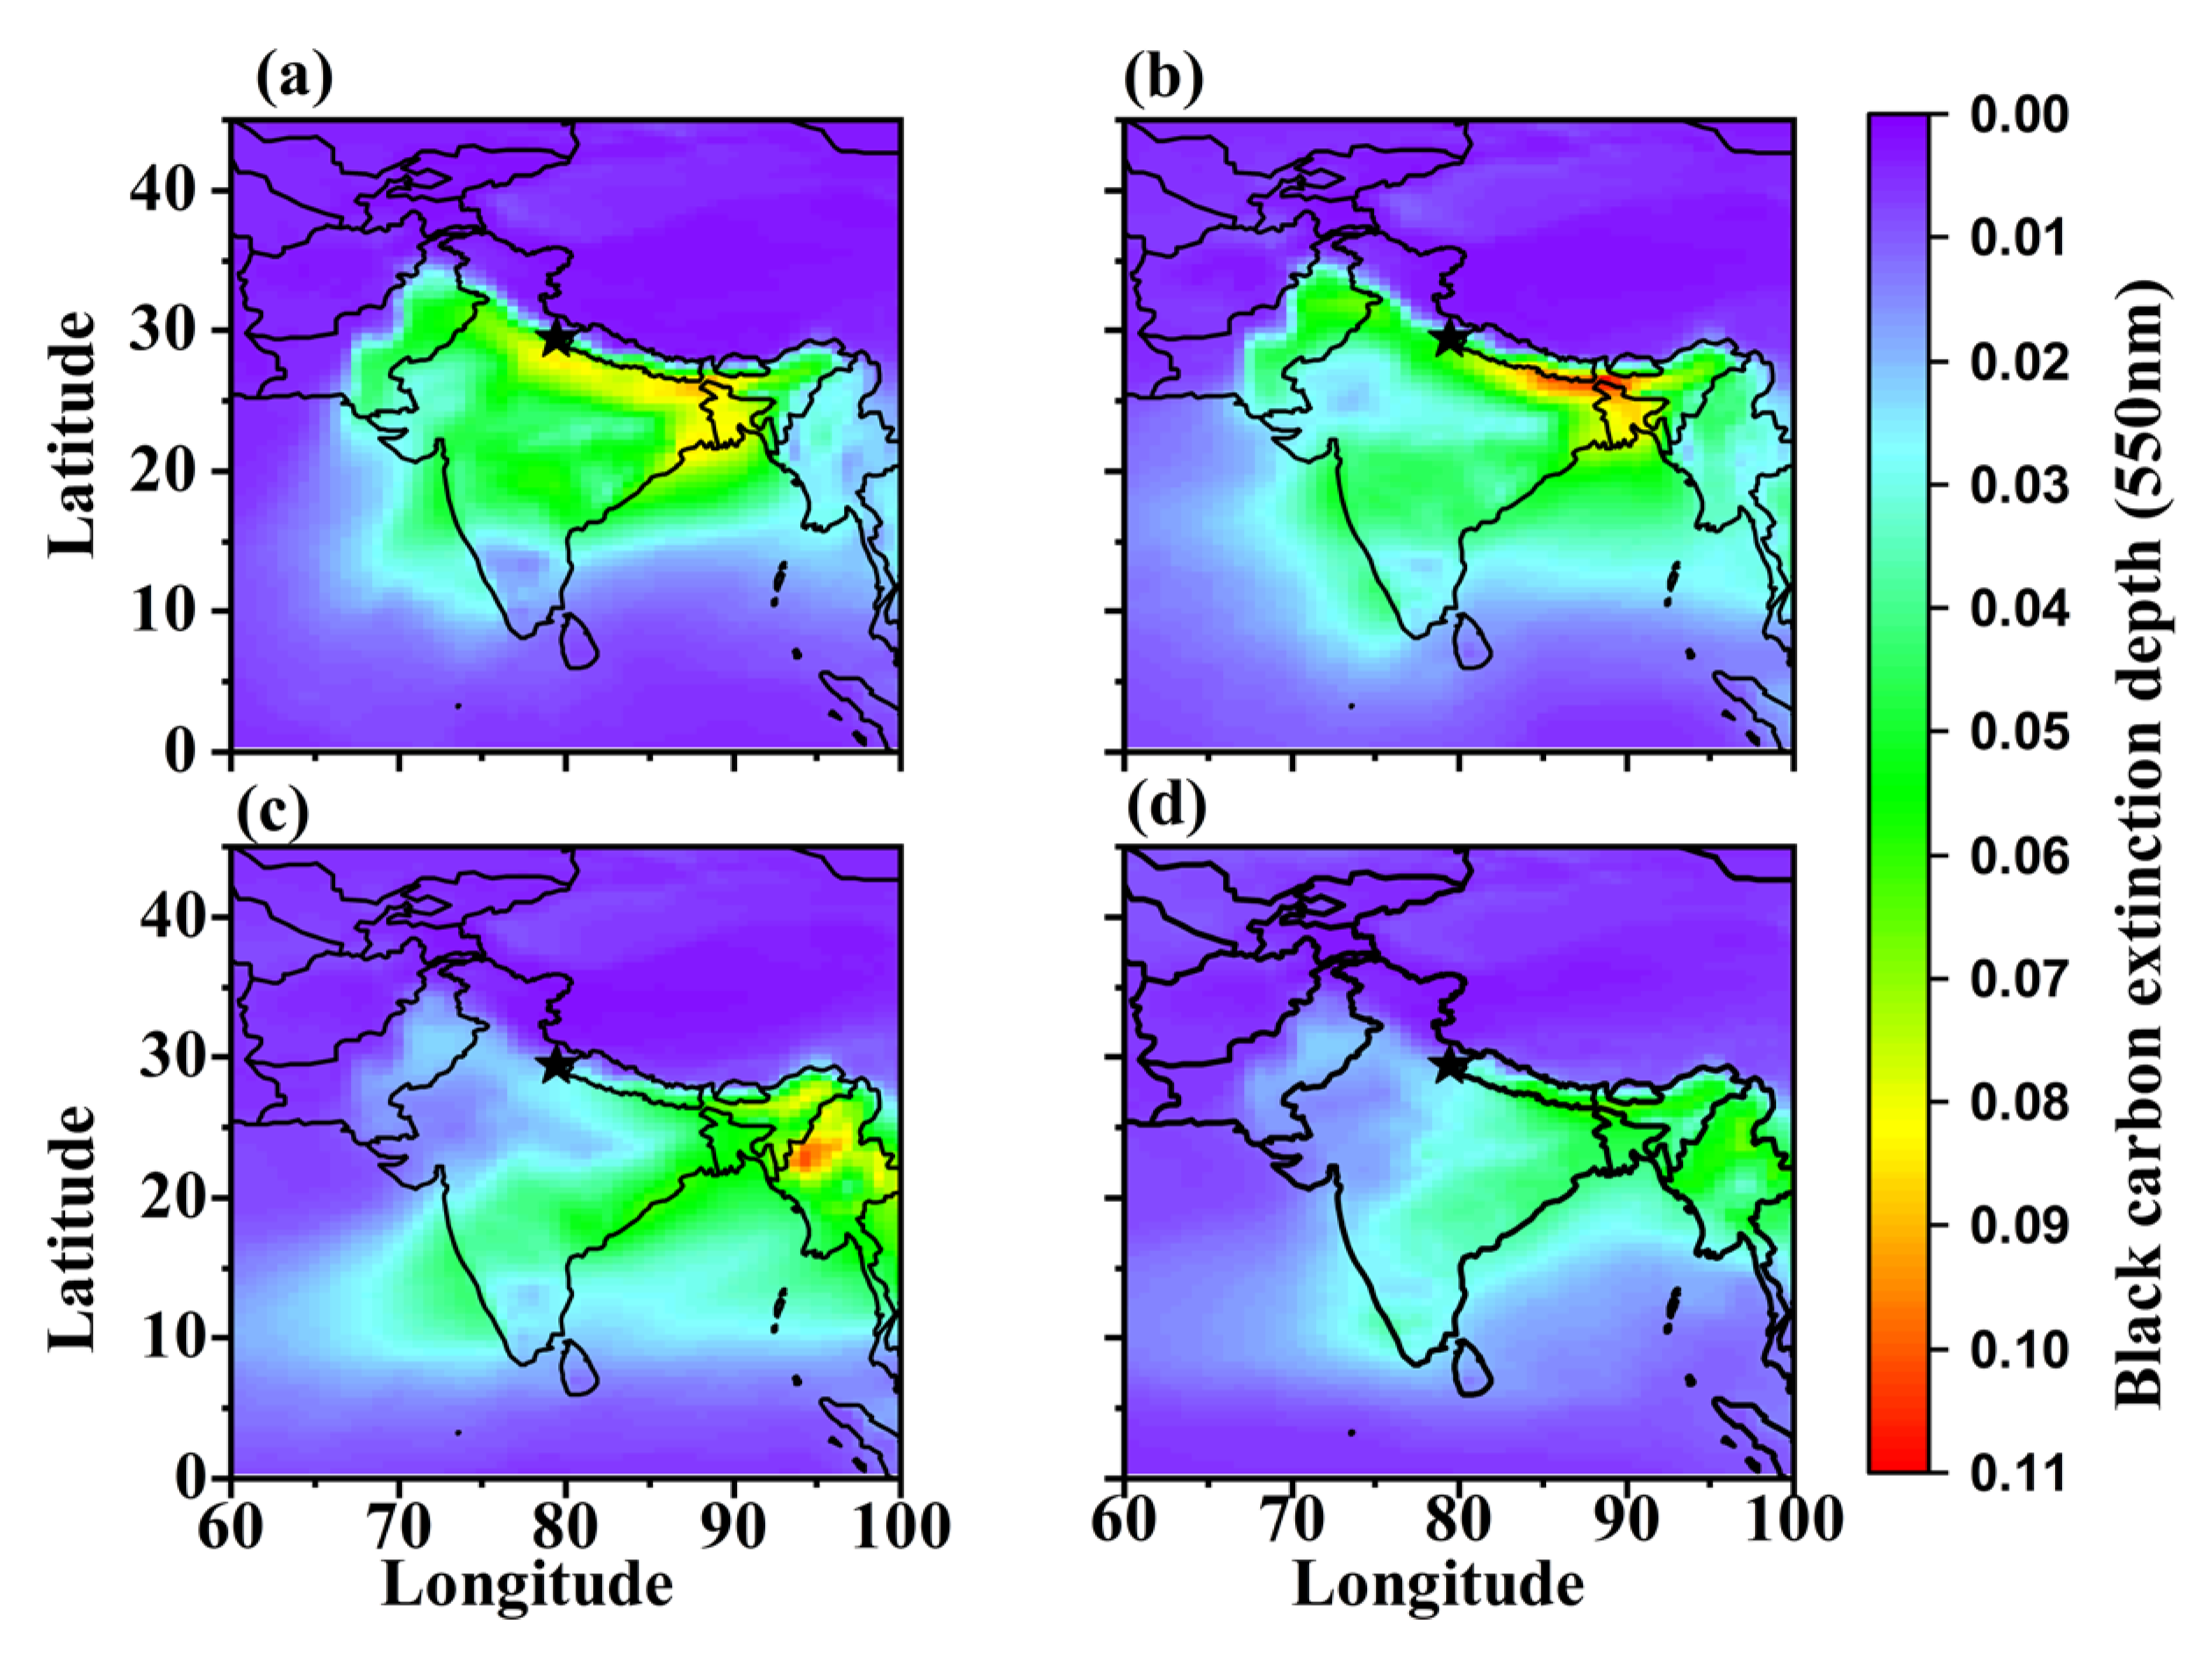
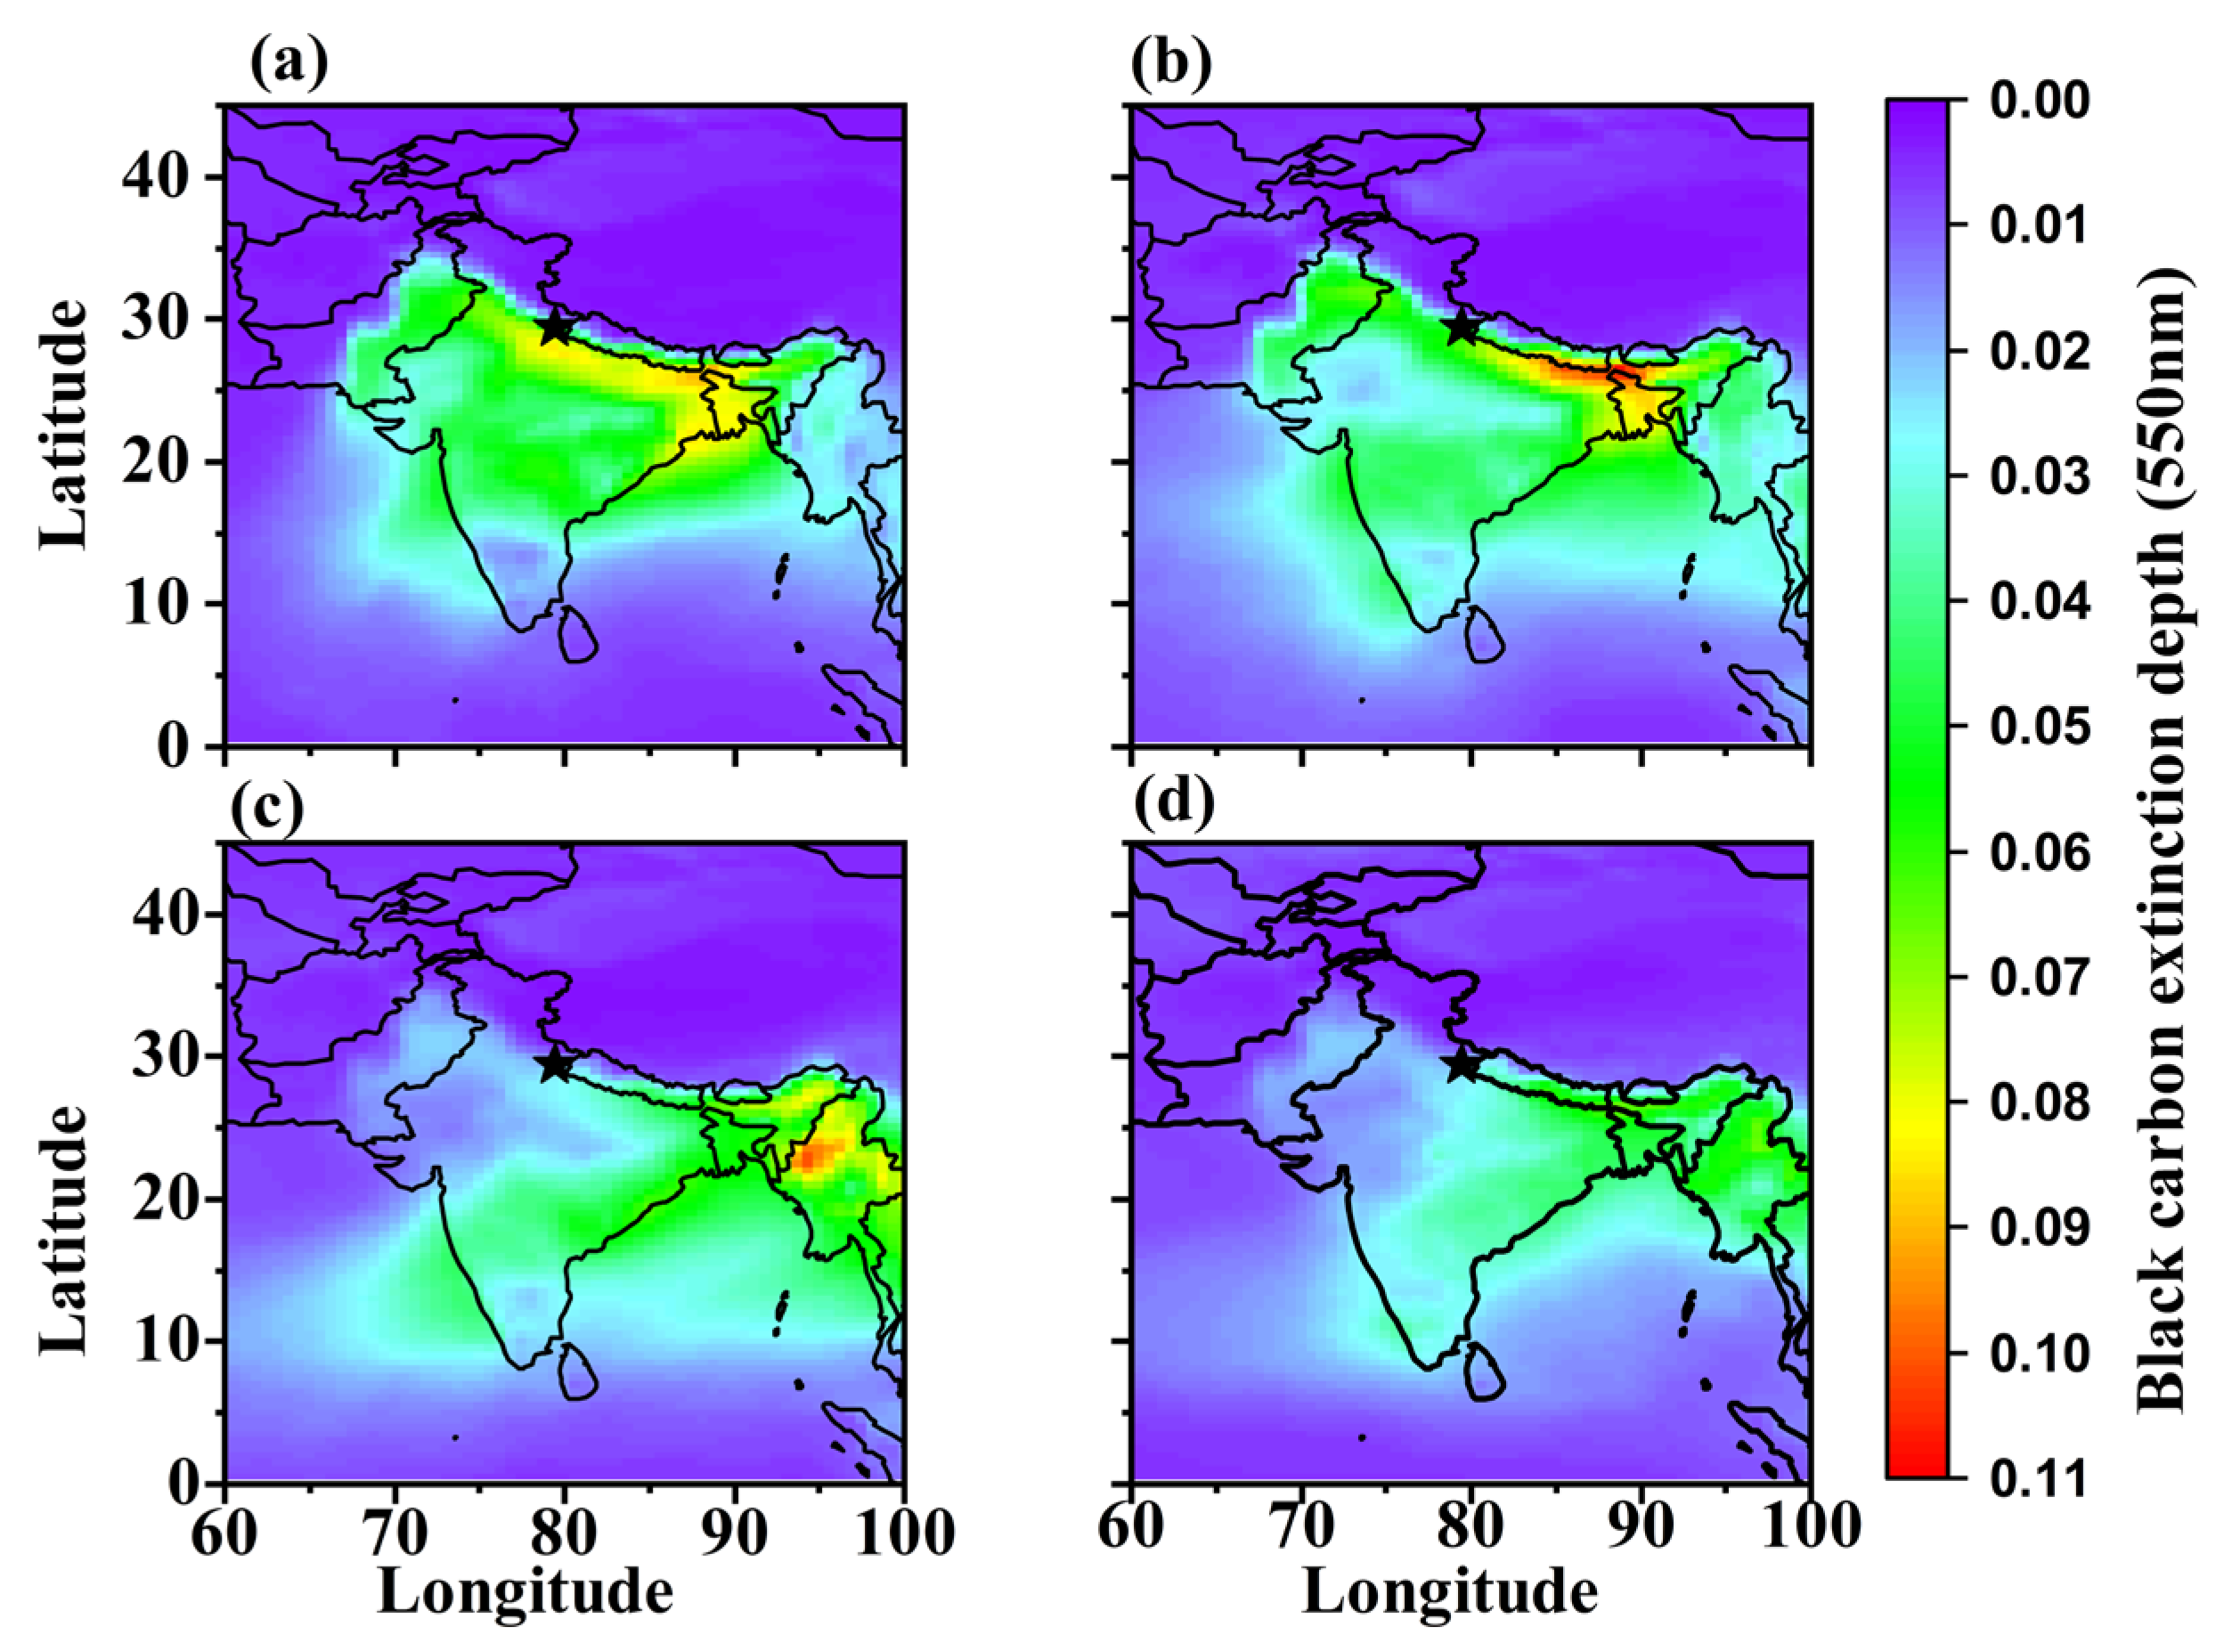
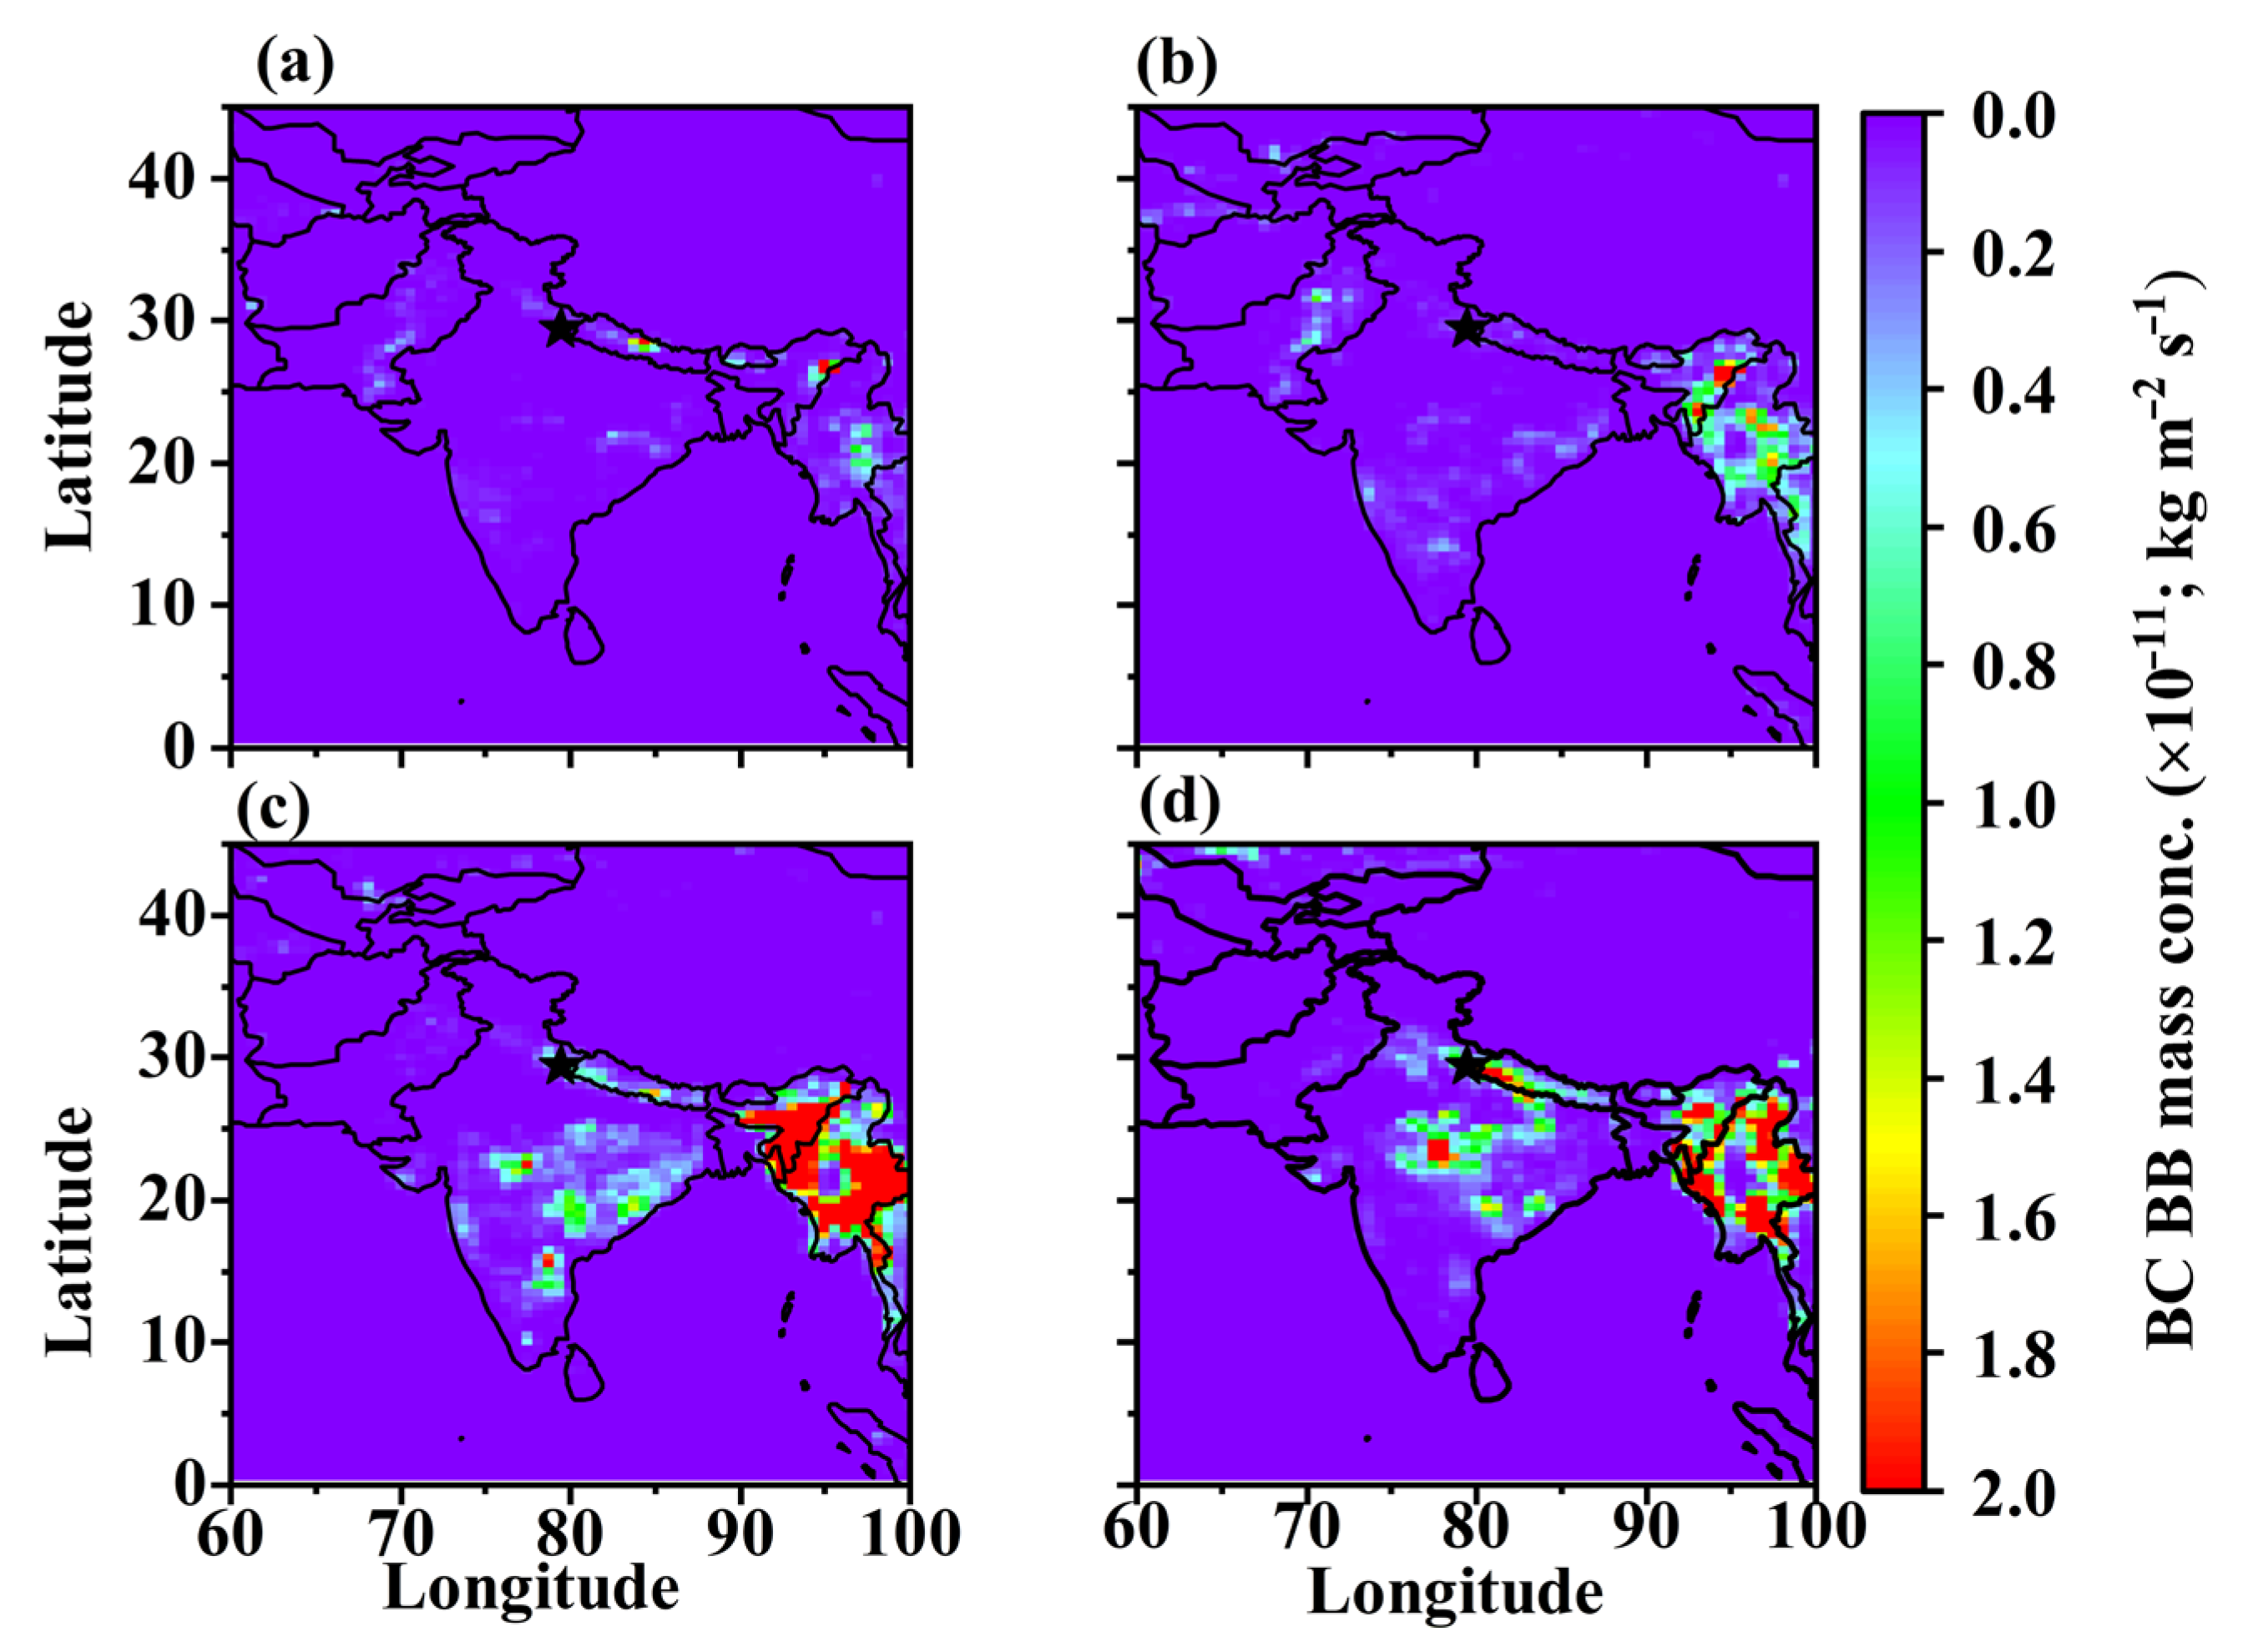
3.2. Spatial-Temporal Variation in Carbonaceous Aerosols and Dust

The monthly variation in BC mass concentration (µg m−3) from MERRA-2 reanalysis over the Indian subcontinent is shown in Figure 2. The BC mass concentrations maximize during January, especially over the central and eastern parts of the IGP due to burning of fossil fuels in traffic and industrial sectors, as well as extensive biomass burning for domestic heating [70,71,72]. In January, a significant BC outflow is also observed over the northern part of the Bay of Bengal due to carbonaceous-pollution outflows [73,74,75,76], as well as over central India. In the following months, the spatial distribution of the BC mass is similar but with progressively decreasing values due to higher dilution within a deeper mixing layer in spring and the absence of combustion processes for heating purposes [27,77,78] (Figure 2). The highest BC concentrations in January (7–8 µg m−3) according to MERRA-2 (CAMS) are much lower than measurements at major urban centers in the IGP, like Patiala [79], Delhi and Kanpur [80]. Apart from the high emission rates, the enhanced winter BC concentrations over the Gangetic-Himalayan region are favored by several other factors such as the lower mixing-layer height, limited dispersion of pollutants due to calm winds, and temperature inversions [81]. BC concentrations are also high along the Indus Valley in Pakistan, as well as in Bangladesh due to high emission rates from the sectors of traffic, industry, biomass burning and the IGP pollution outflows [77]. Rising temperatures and increasing wind speed subsequently cause a reduction in pollutants, especially after February, so that the regional BC loading is consequently reduced due to dispersion. However, the extensive agricultural burning along with forest fires in Myanmar and northern Thailand during March–April are also responsible for the formation of the well-known “Asian Brown Cloud”, a cloud consisting of large amounts of aerosols produced from burning of biomass and fuels [18,28], and it contributes to the increase in BC concentrations in these regions.
Figure A1 (Appendix A) shows the monthly mean variation in BC extinction optical depth at 550 nm over the Indian subcontinent. The BC extinction coefficient is a measure of the solar radiation attenuated due to BC in the atmospheric column and plays a major role in the BC radiative forcing. The spatial and temporal distribution of the BC extinction optical depth is similar to that of BC mass concentration, since BC is mostly confined in the lower boundary layer over the IGP [82]. Furthermore, Ramachandran et al. [83] showed that BC clearly dominates the aerosol absorption over the IGP and the Himalayan region, thus constituting an important climatic factor. The BC concentration and extinction AOD are mostly due to anthropogenic activities over the IGP, the rest of India, and the northern part of the Indus basin (around Lahore) (Figure A2), while the increased levels over northern Indochina in March–April are attributed to agricultural BB-emitted BC (Figure A3). This is also supported by the surface OC spatial distribution over the region (Figure 3), with maximum OC concentrations over northern Myanmar in March due to BB combustion emissions. Although OC has many sources, natural and anthropogenic, it can be also considered as a byproduct of secondary organic aerosol (SOA) formation [84,85,86], the major source of which in south and southeast Asia is mostly BB [28,87], contributing significantly to radiative forcing through the brown carbon absorption in the UV and near-vis spectrum [88,89,90,91,92,93]. In January, domestic heating is at its maximum, including coal consumption and open BB, which has contributed more to OC mass concentration, while the low temperatures favor the condensation of volatile organic compounds (VOCs), thus increasing the OC levels [94,95]. On the other hand, the spatial distribution of sulfur dioxide (SO2) revealed hotspot areas over the major urban agglomerations in India and along the densely populated and highly polluted IGP (Figure 4). Increased SO2 levels are also shown over certain locations due to emissions from coal-fired power plants [96]. The highest SO2 concentrations in January may be attributed to a shallower mixing layer and lower dispersion of pollutants, while sulfate aerosols, as an oxidation product of precursor SO2, may contribute significantly to total AOD and radiative forcing during wintertime, as it is considered the main scattering aerosol type over the IGP [97]. Similar results for higher NO2, SO2, and PM2.5 concentrations in January were also reported by Bilal et al. [59] in Pakistan.
Apart from BB, desert dust is another major source of air pollution in south Asia during the spring (i.e., pre-monsoon) period. The dust mass concentration from MERRA-2 retrievals shows maxima over the desert areas of Taklimakan, as expected (however, this is out of our area of interest), over the Thar Desert and surrounding areas in NW India and along the IGP in March and April (Figure 5), when dust activity starts increasing [98]. Although dust contributes substantially to aerosol loading and types over the IGP during pre-monsoon, it also presents high inter-annual variability with intense dust storms in certain cases [21,99,100]. However, during wintertime, dust contribution is limited around the Thar Desert [36,101].

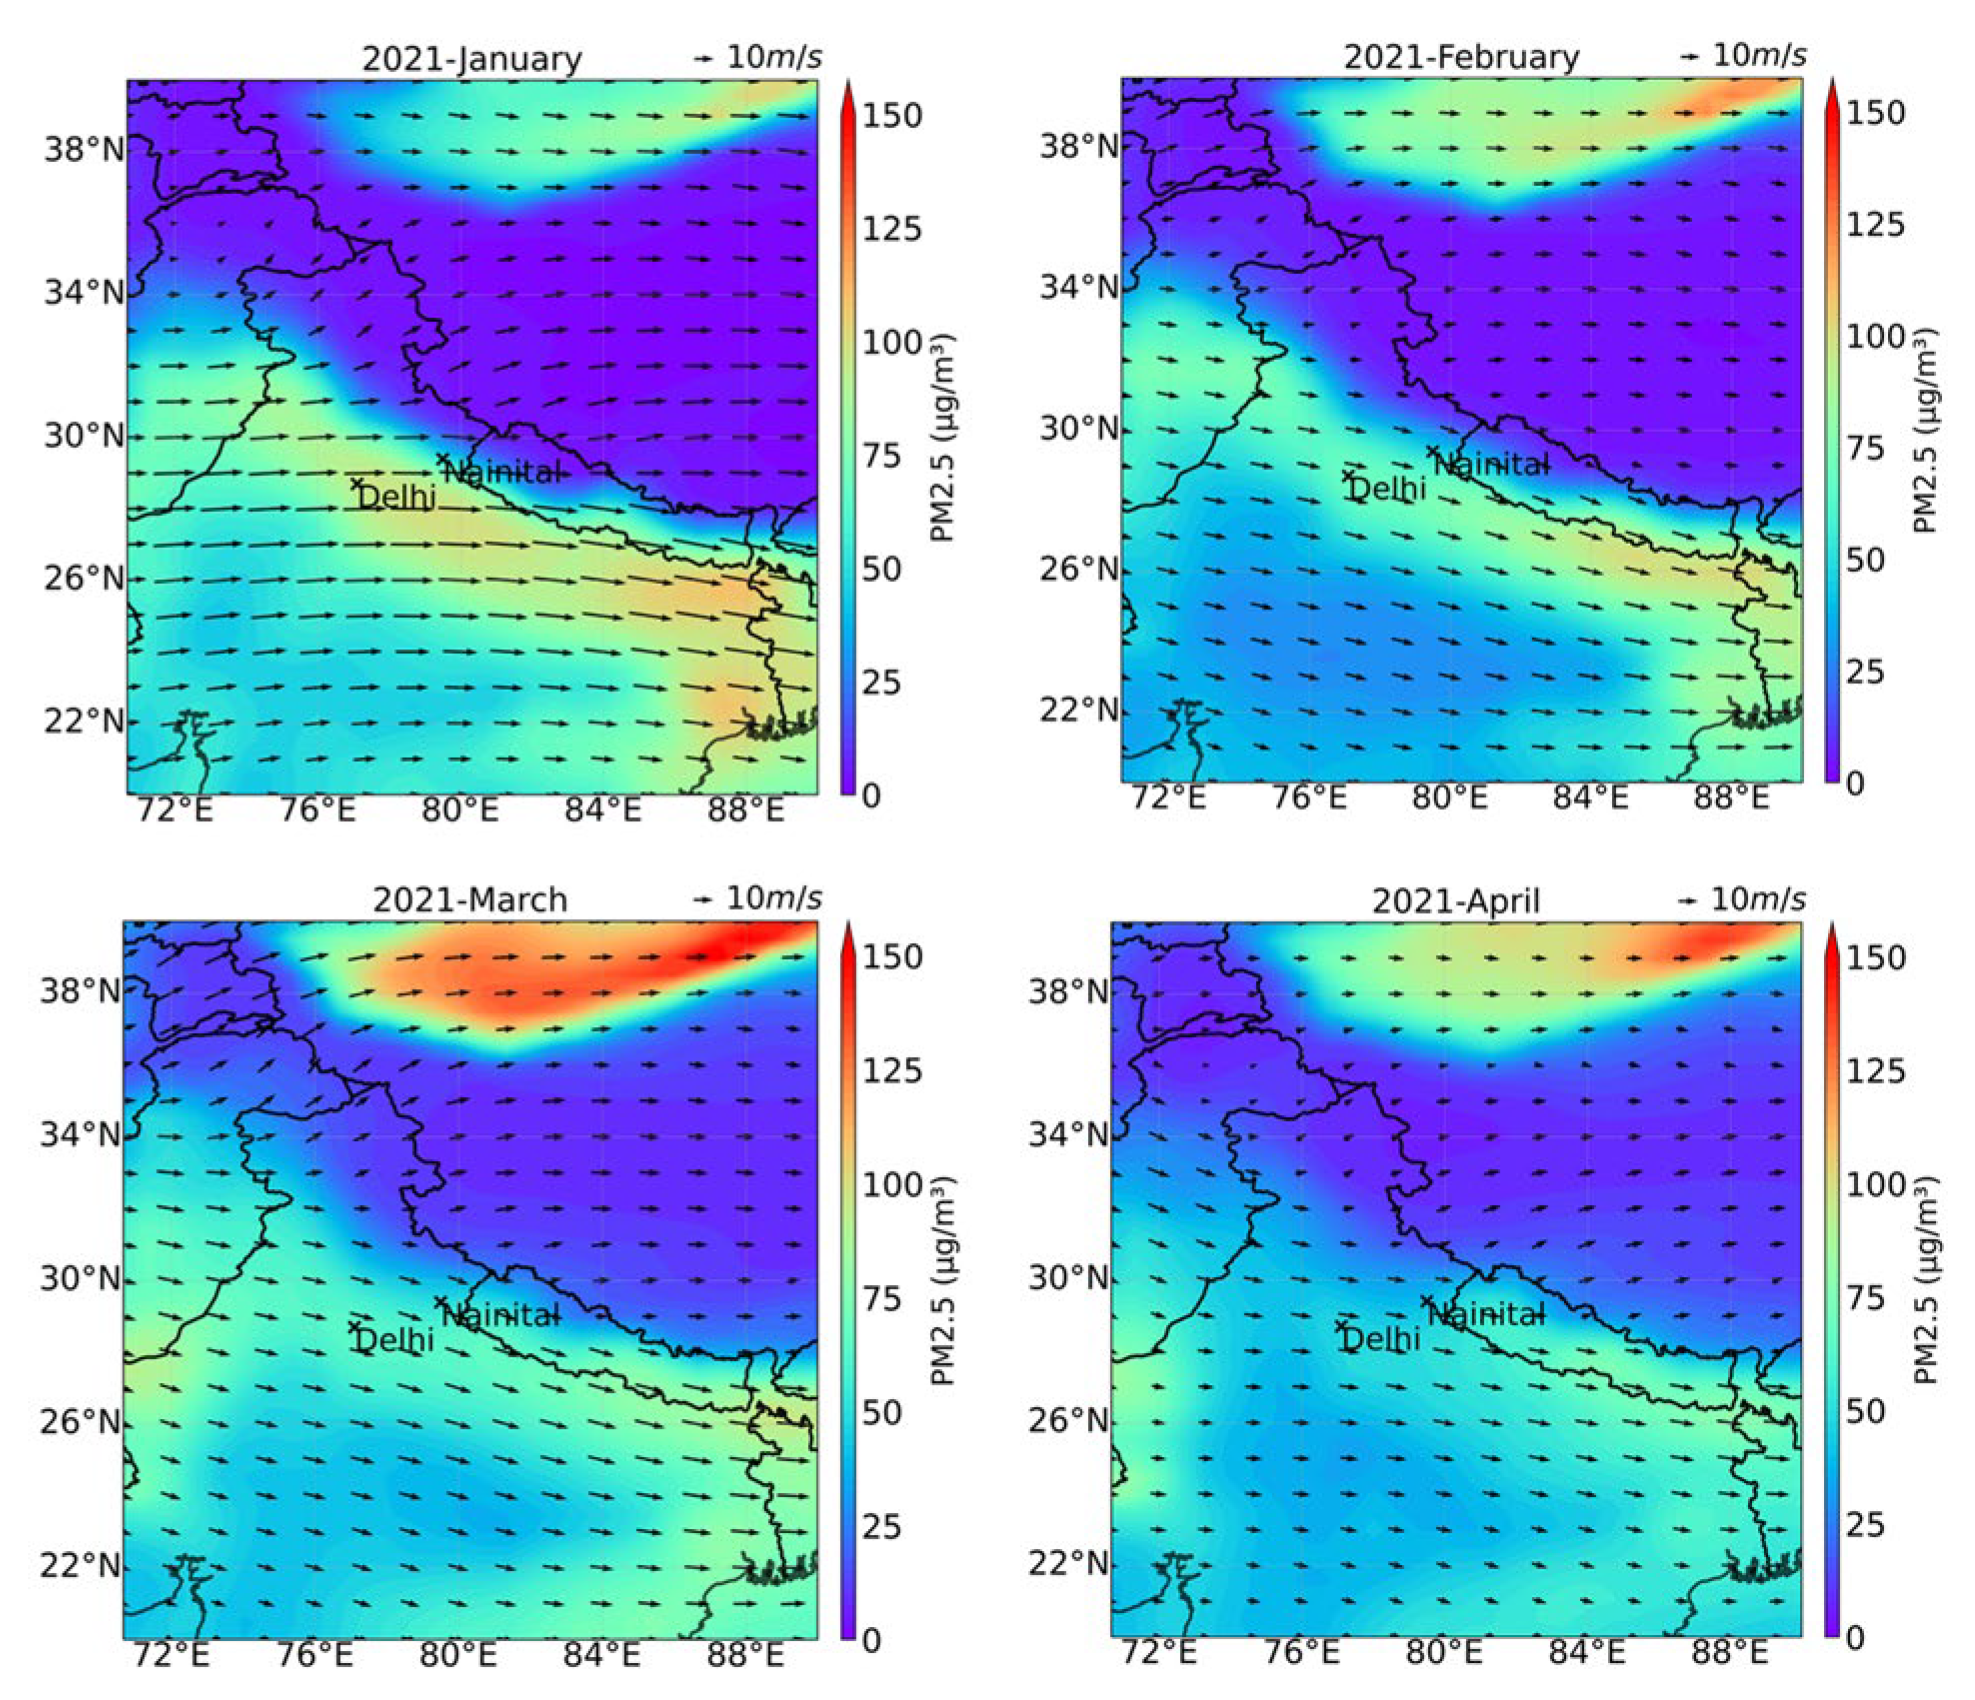
3.3. Surface Distribution of PM2.5

Figure 6 shows the monthly variation in the surface-level mass concentration of PM2.5 in the study period, along with the superimposed wind speed and direction at 500 hPa (wind vectors). The spatial distribution of the estimated PM2.5 concentrations shows an increase along the central-eastern IGP during January as the main axis of the pollution outflow [67,75,76,82], supported by the dominant northwestern flow. The enhanced PM2.5 concentrations, which were mainly composed of carbonaceous aerosols during wintertime, progressively decreased along the central-eastern IGP from February to April, while a slight increase in PM2.5 levels was detected over the Thar Desert in the west. Over the Himalayan range and Tibetan Plateau, the estimated PM2.5 levels were minimum, while maximum values due to dust effect were noticed over the Taklimakan Desert. In general, the current PM2.5 estimations, based on MERRA-2 datasets and the approximation in Equation (1), were lower than the measured PM2.5 concentrations over urban and rural areas in IGP, while such an underestimation was also observed over other urban environments [47,51].

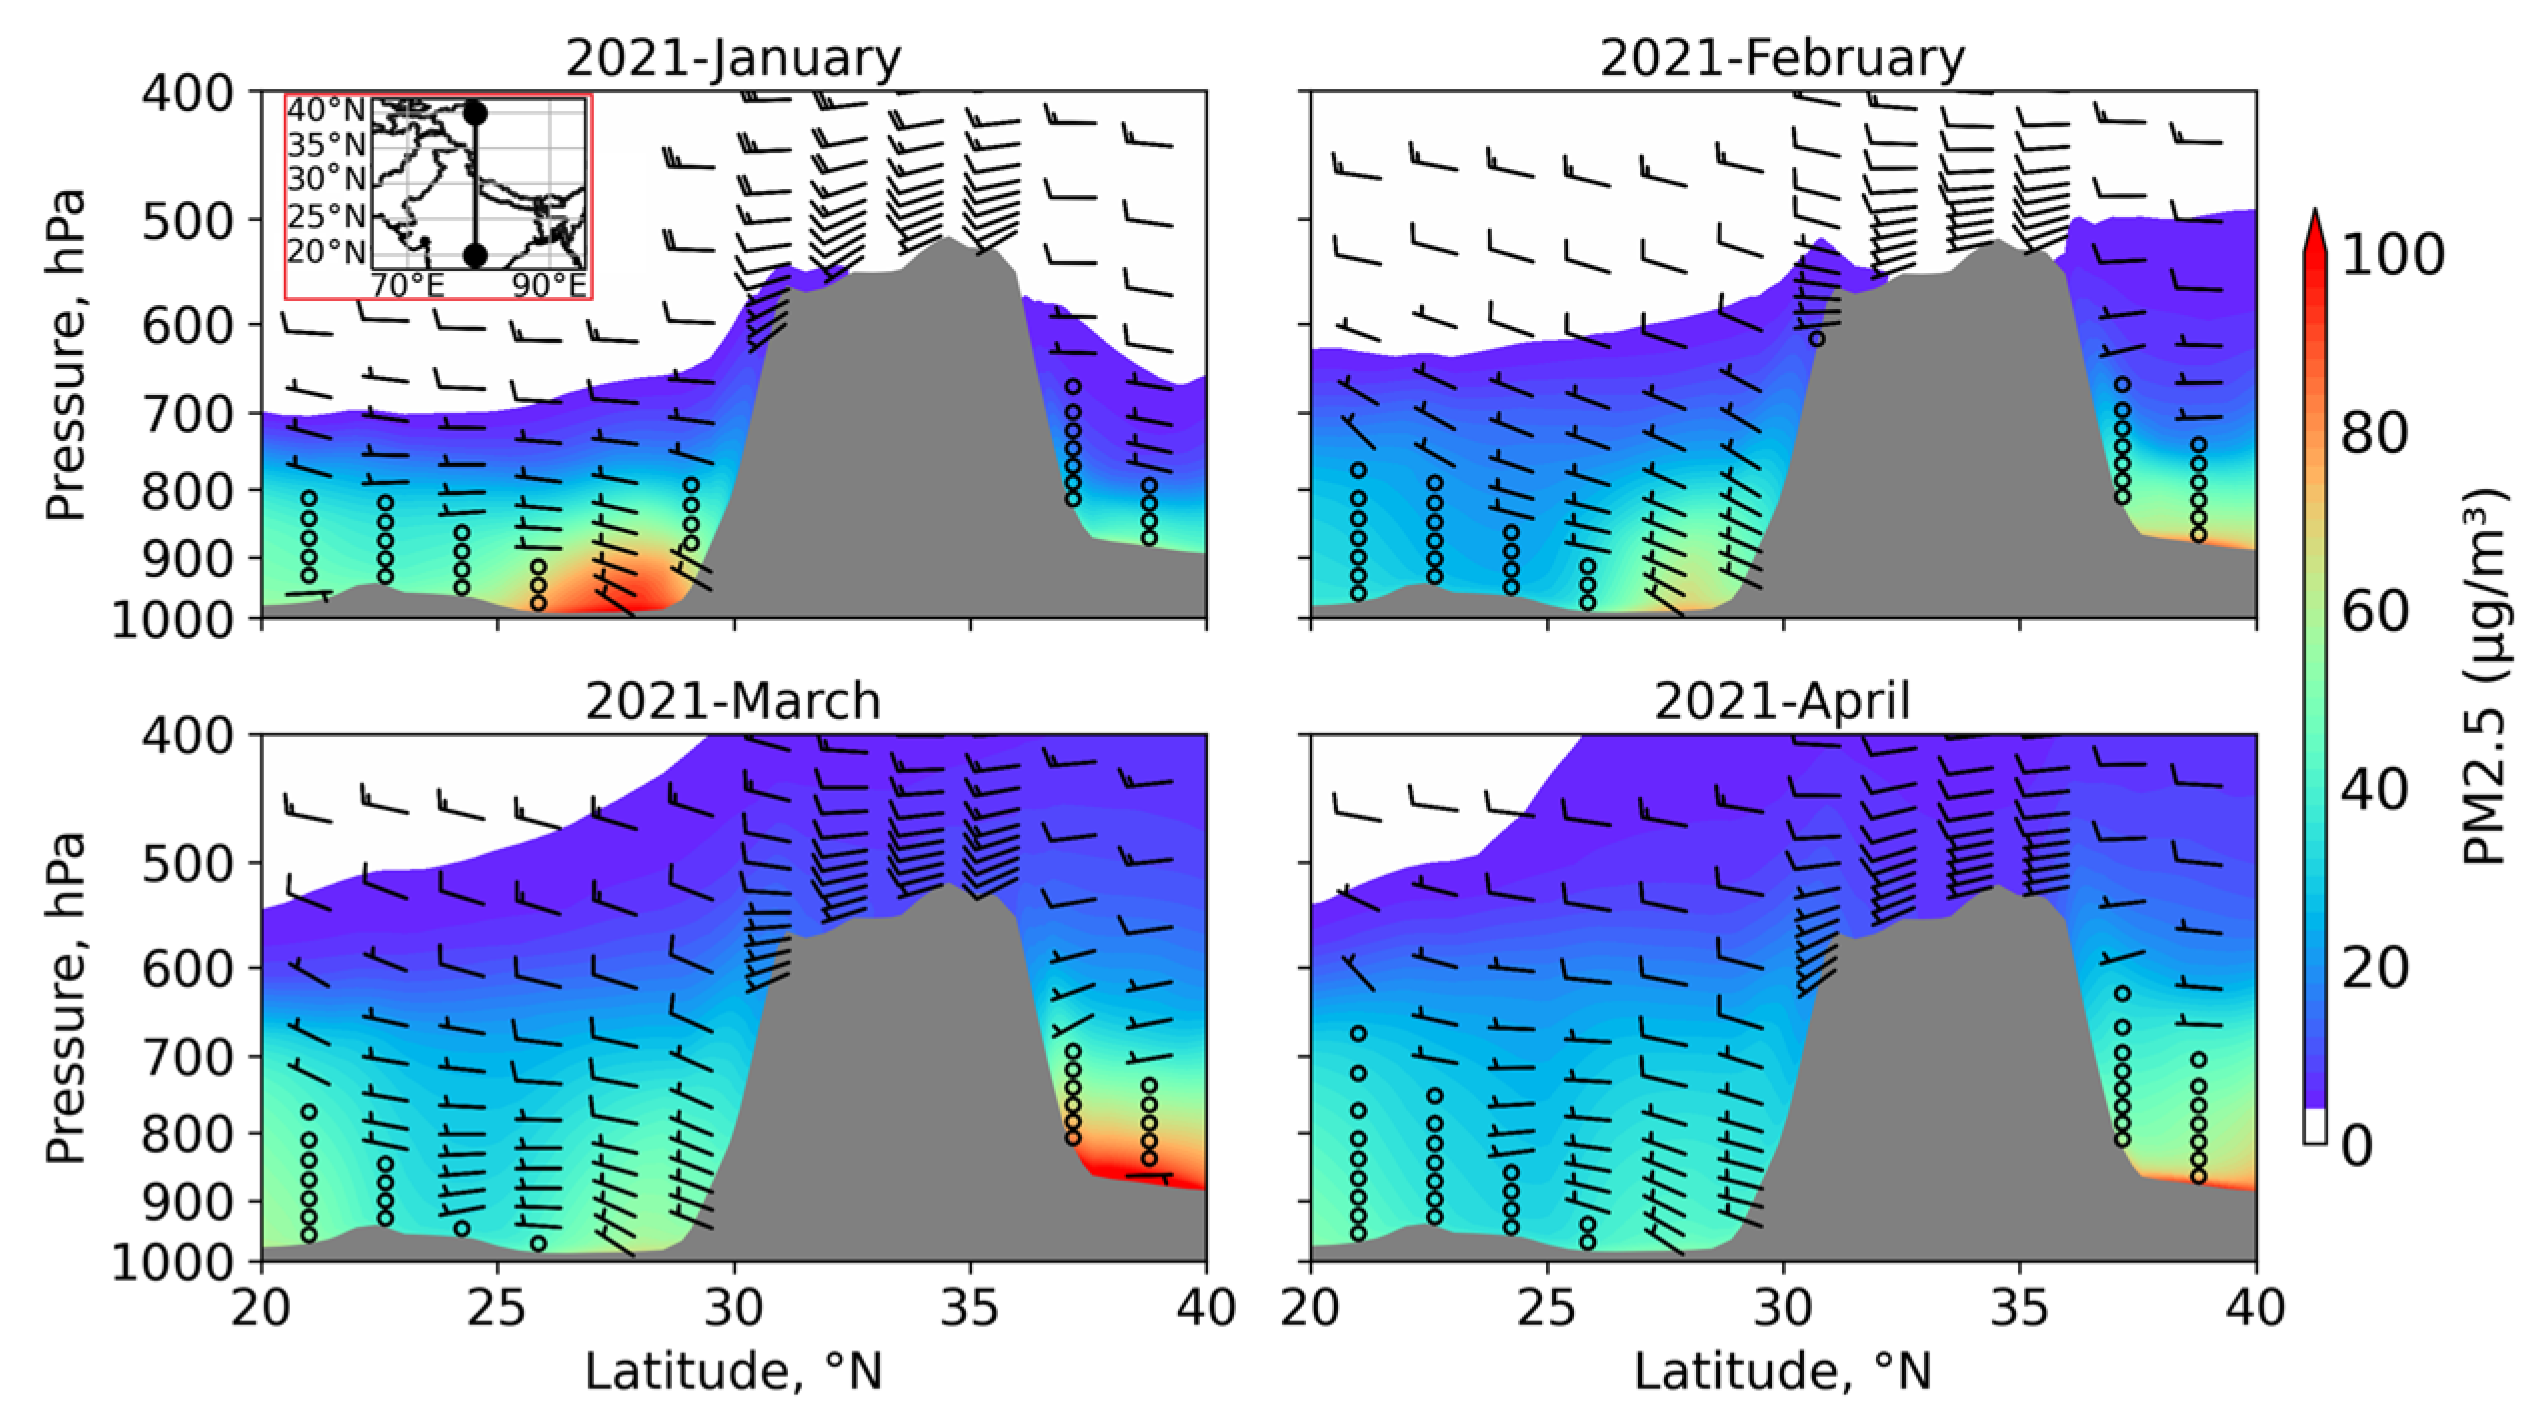
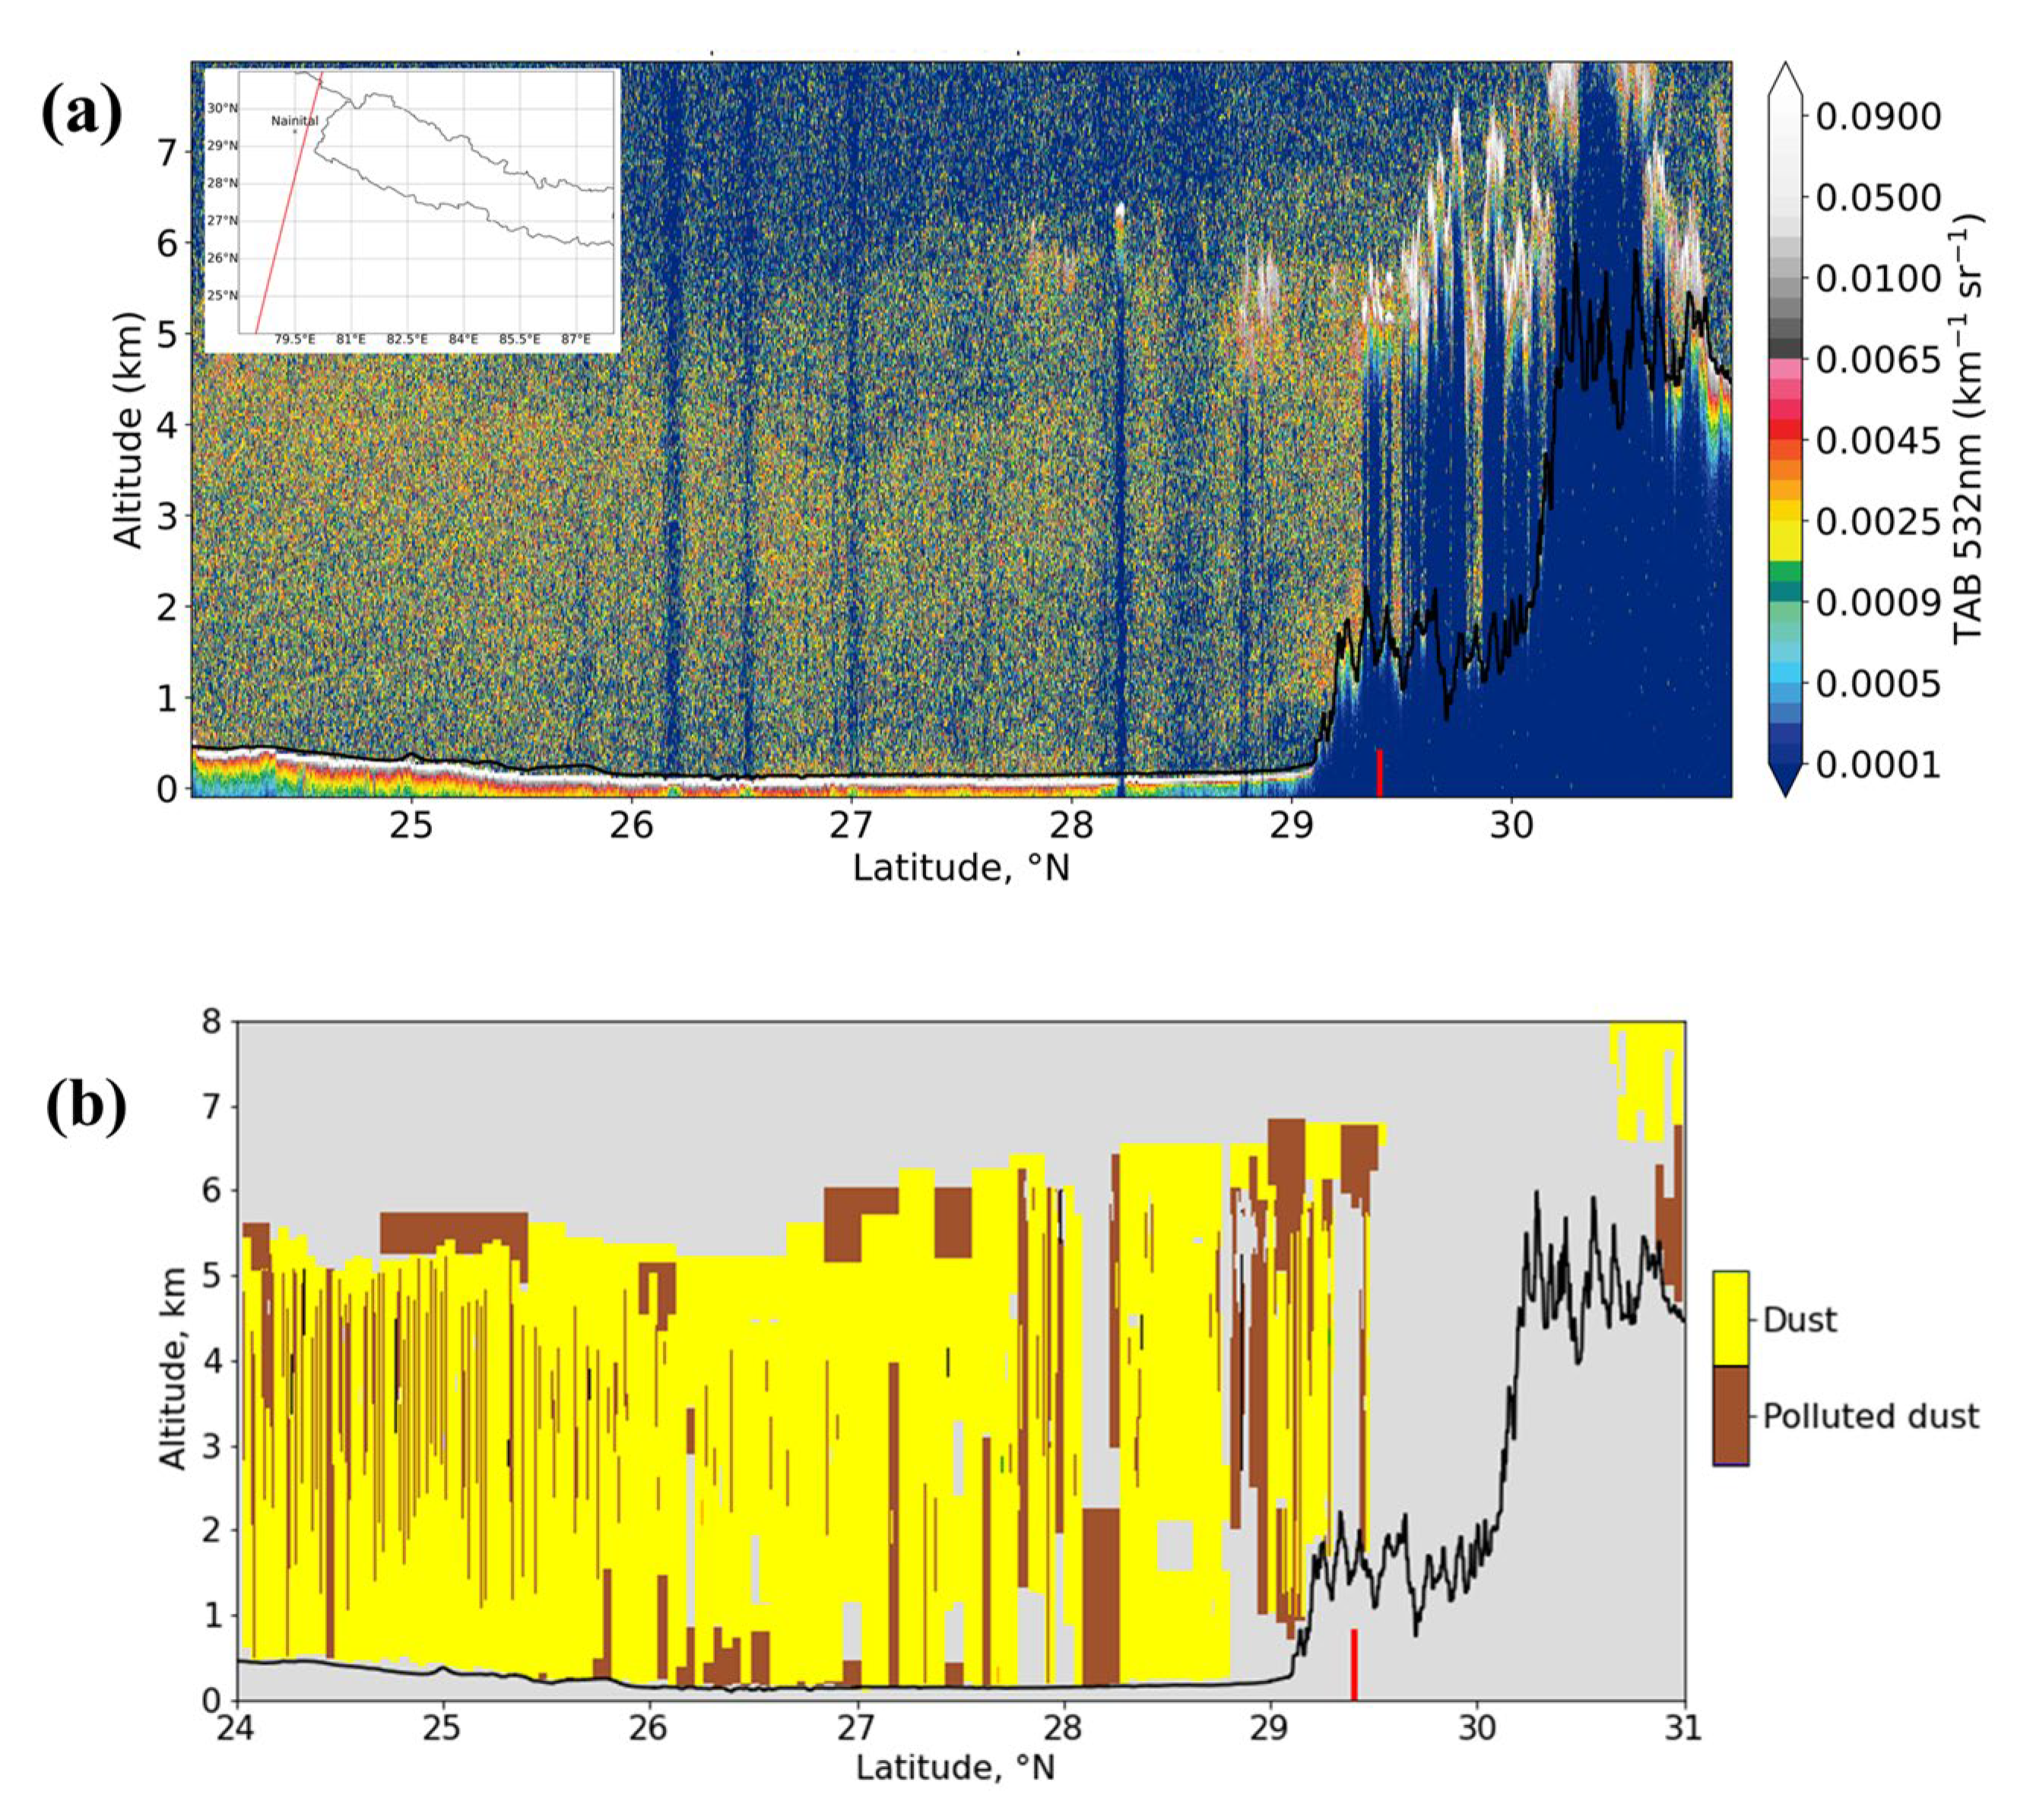
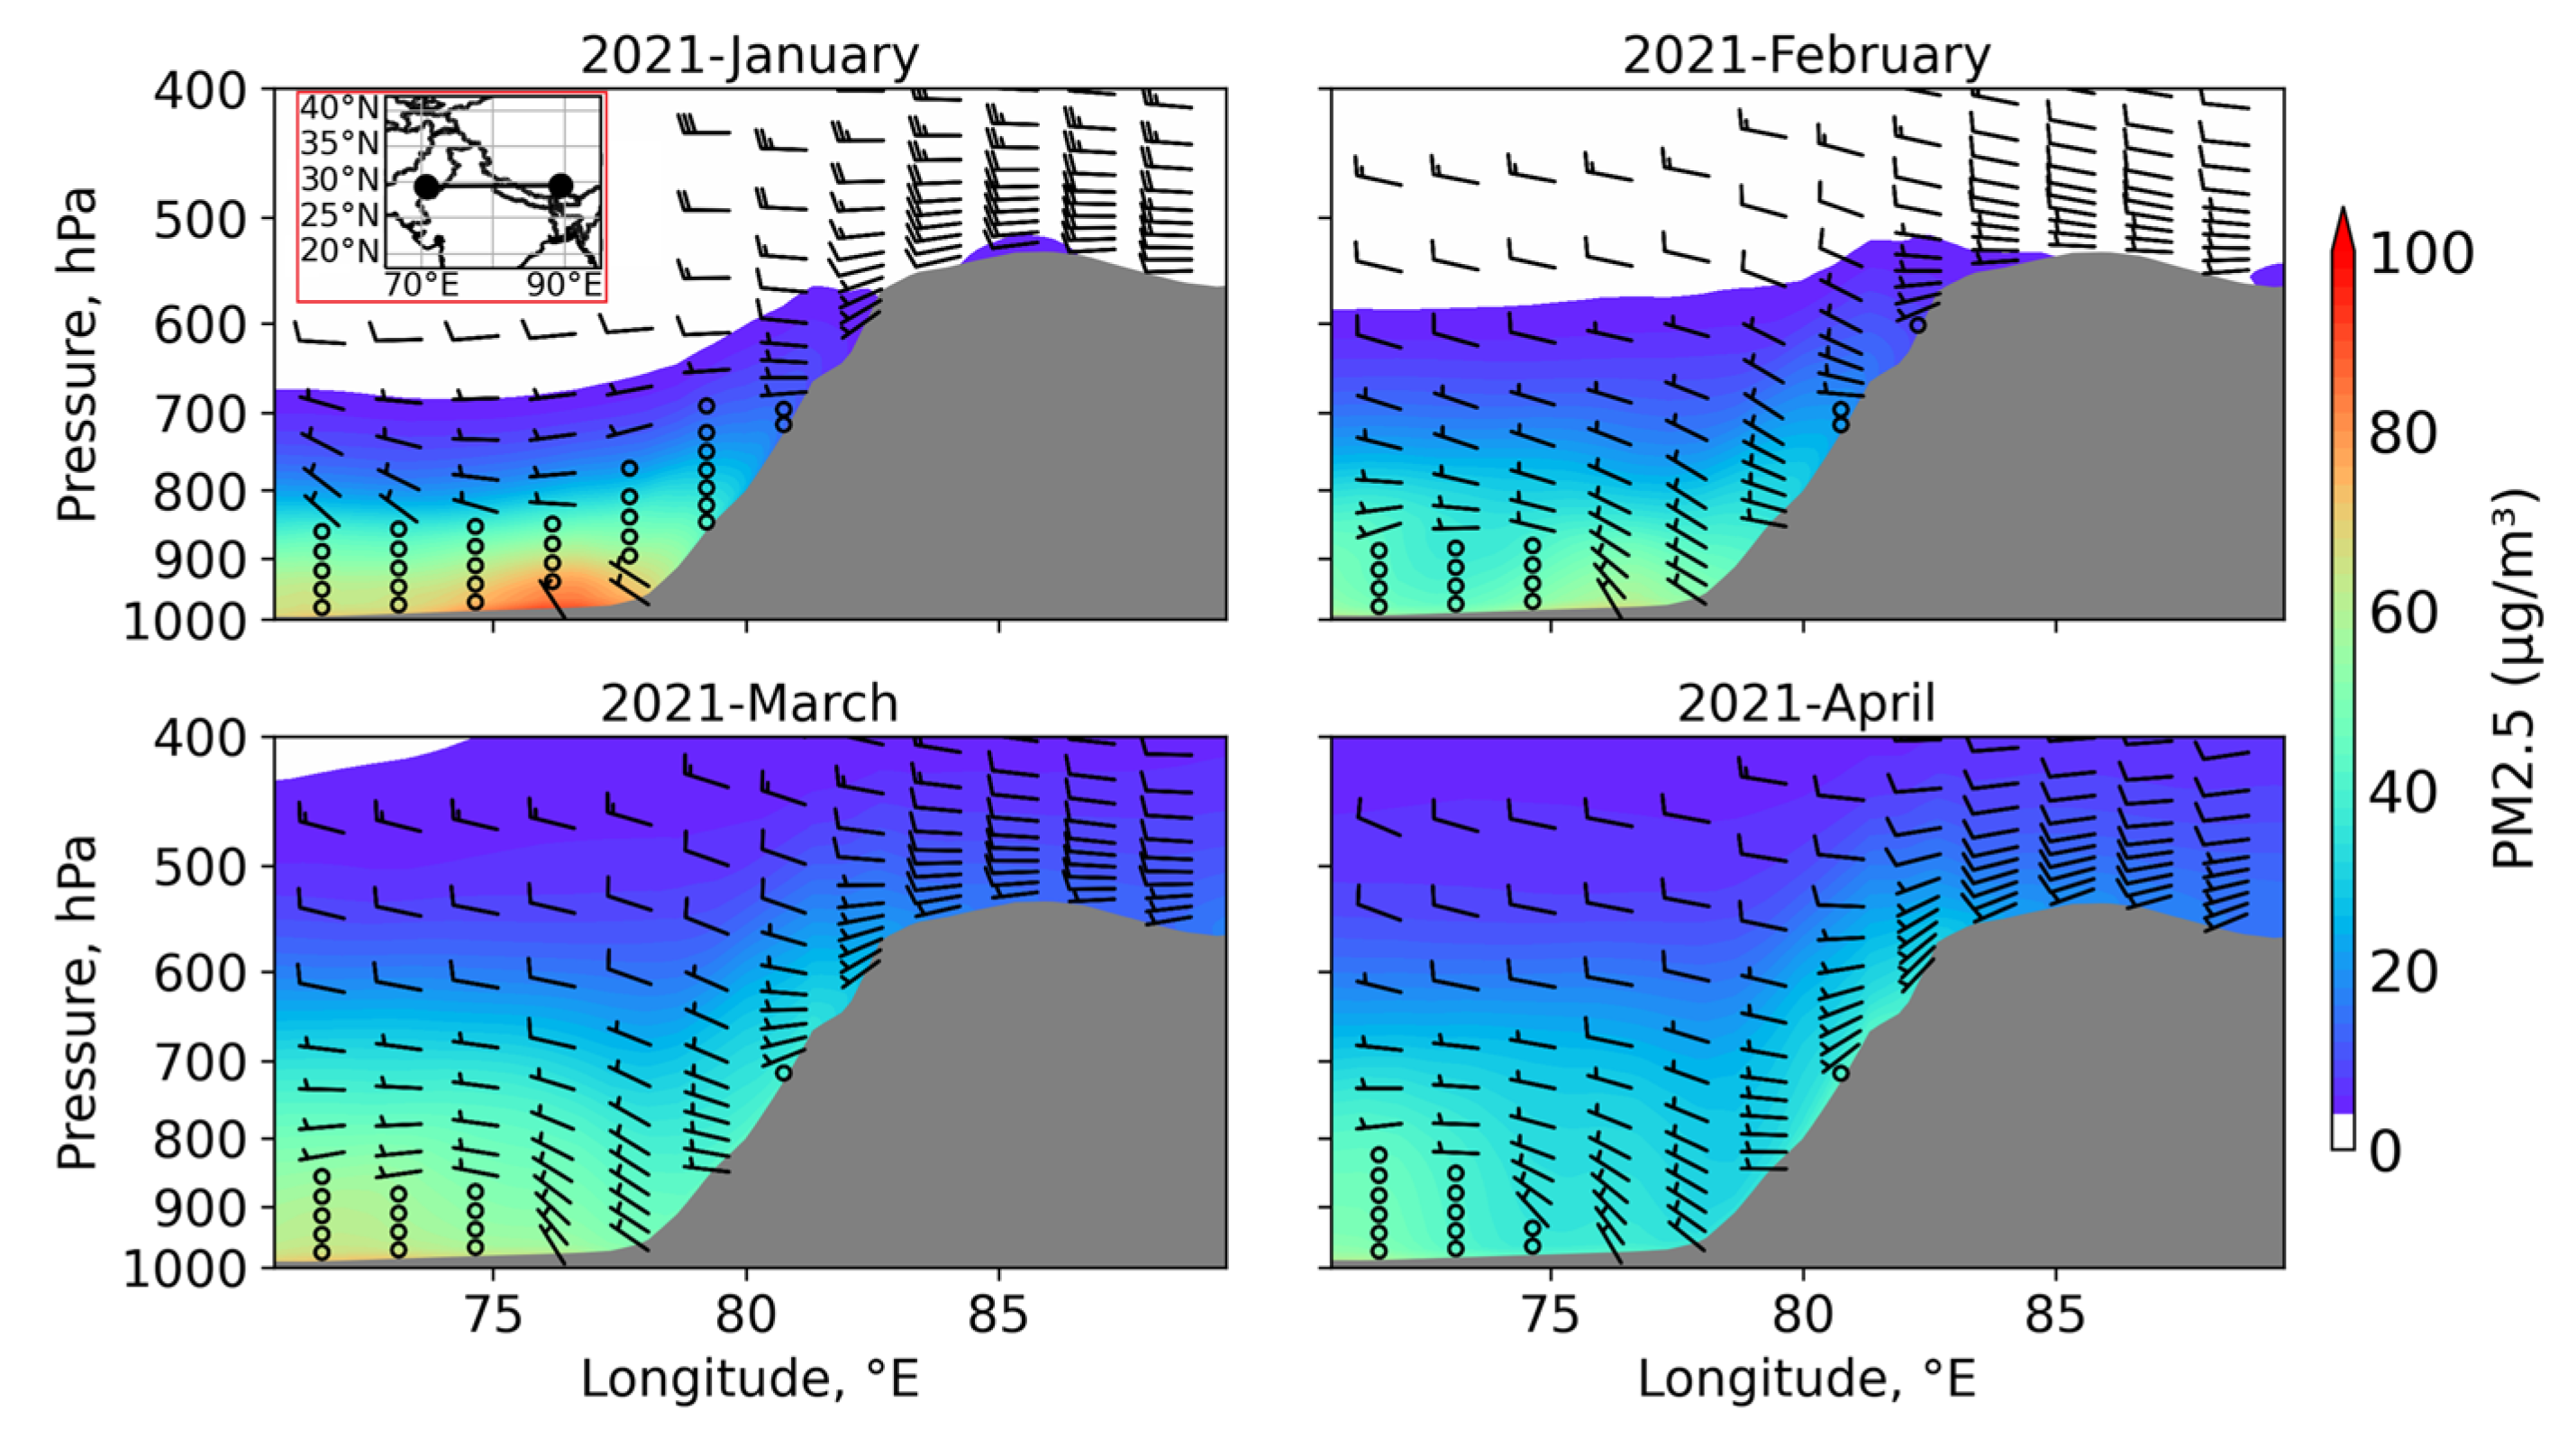
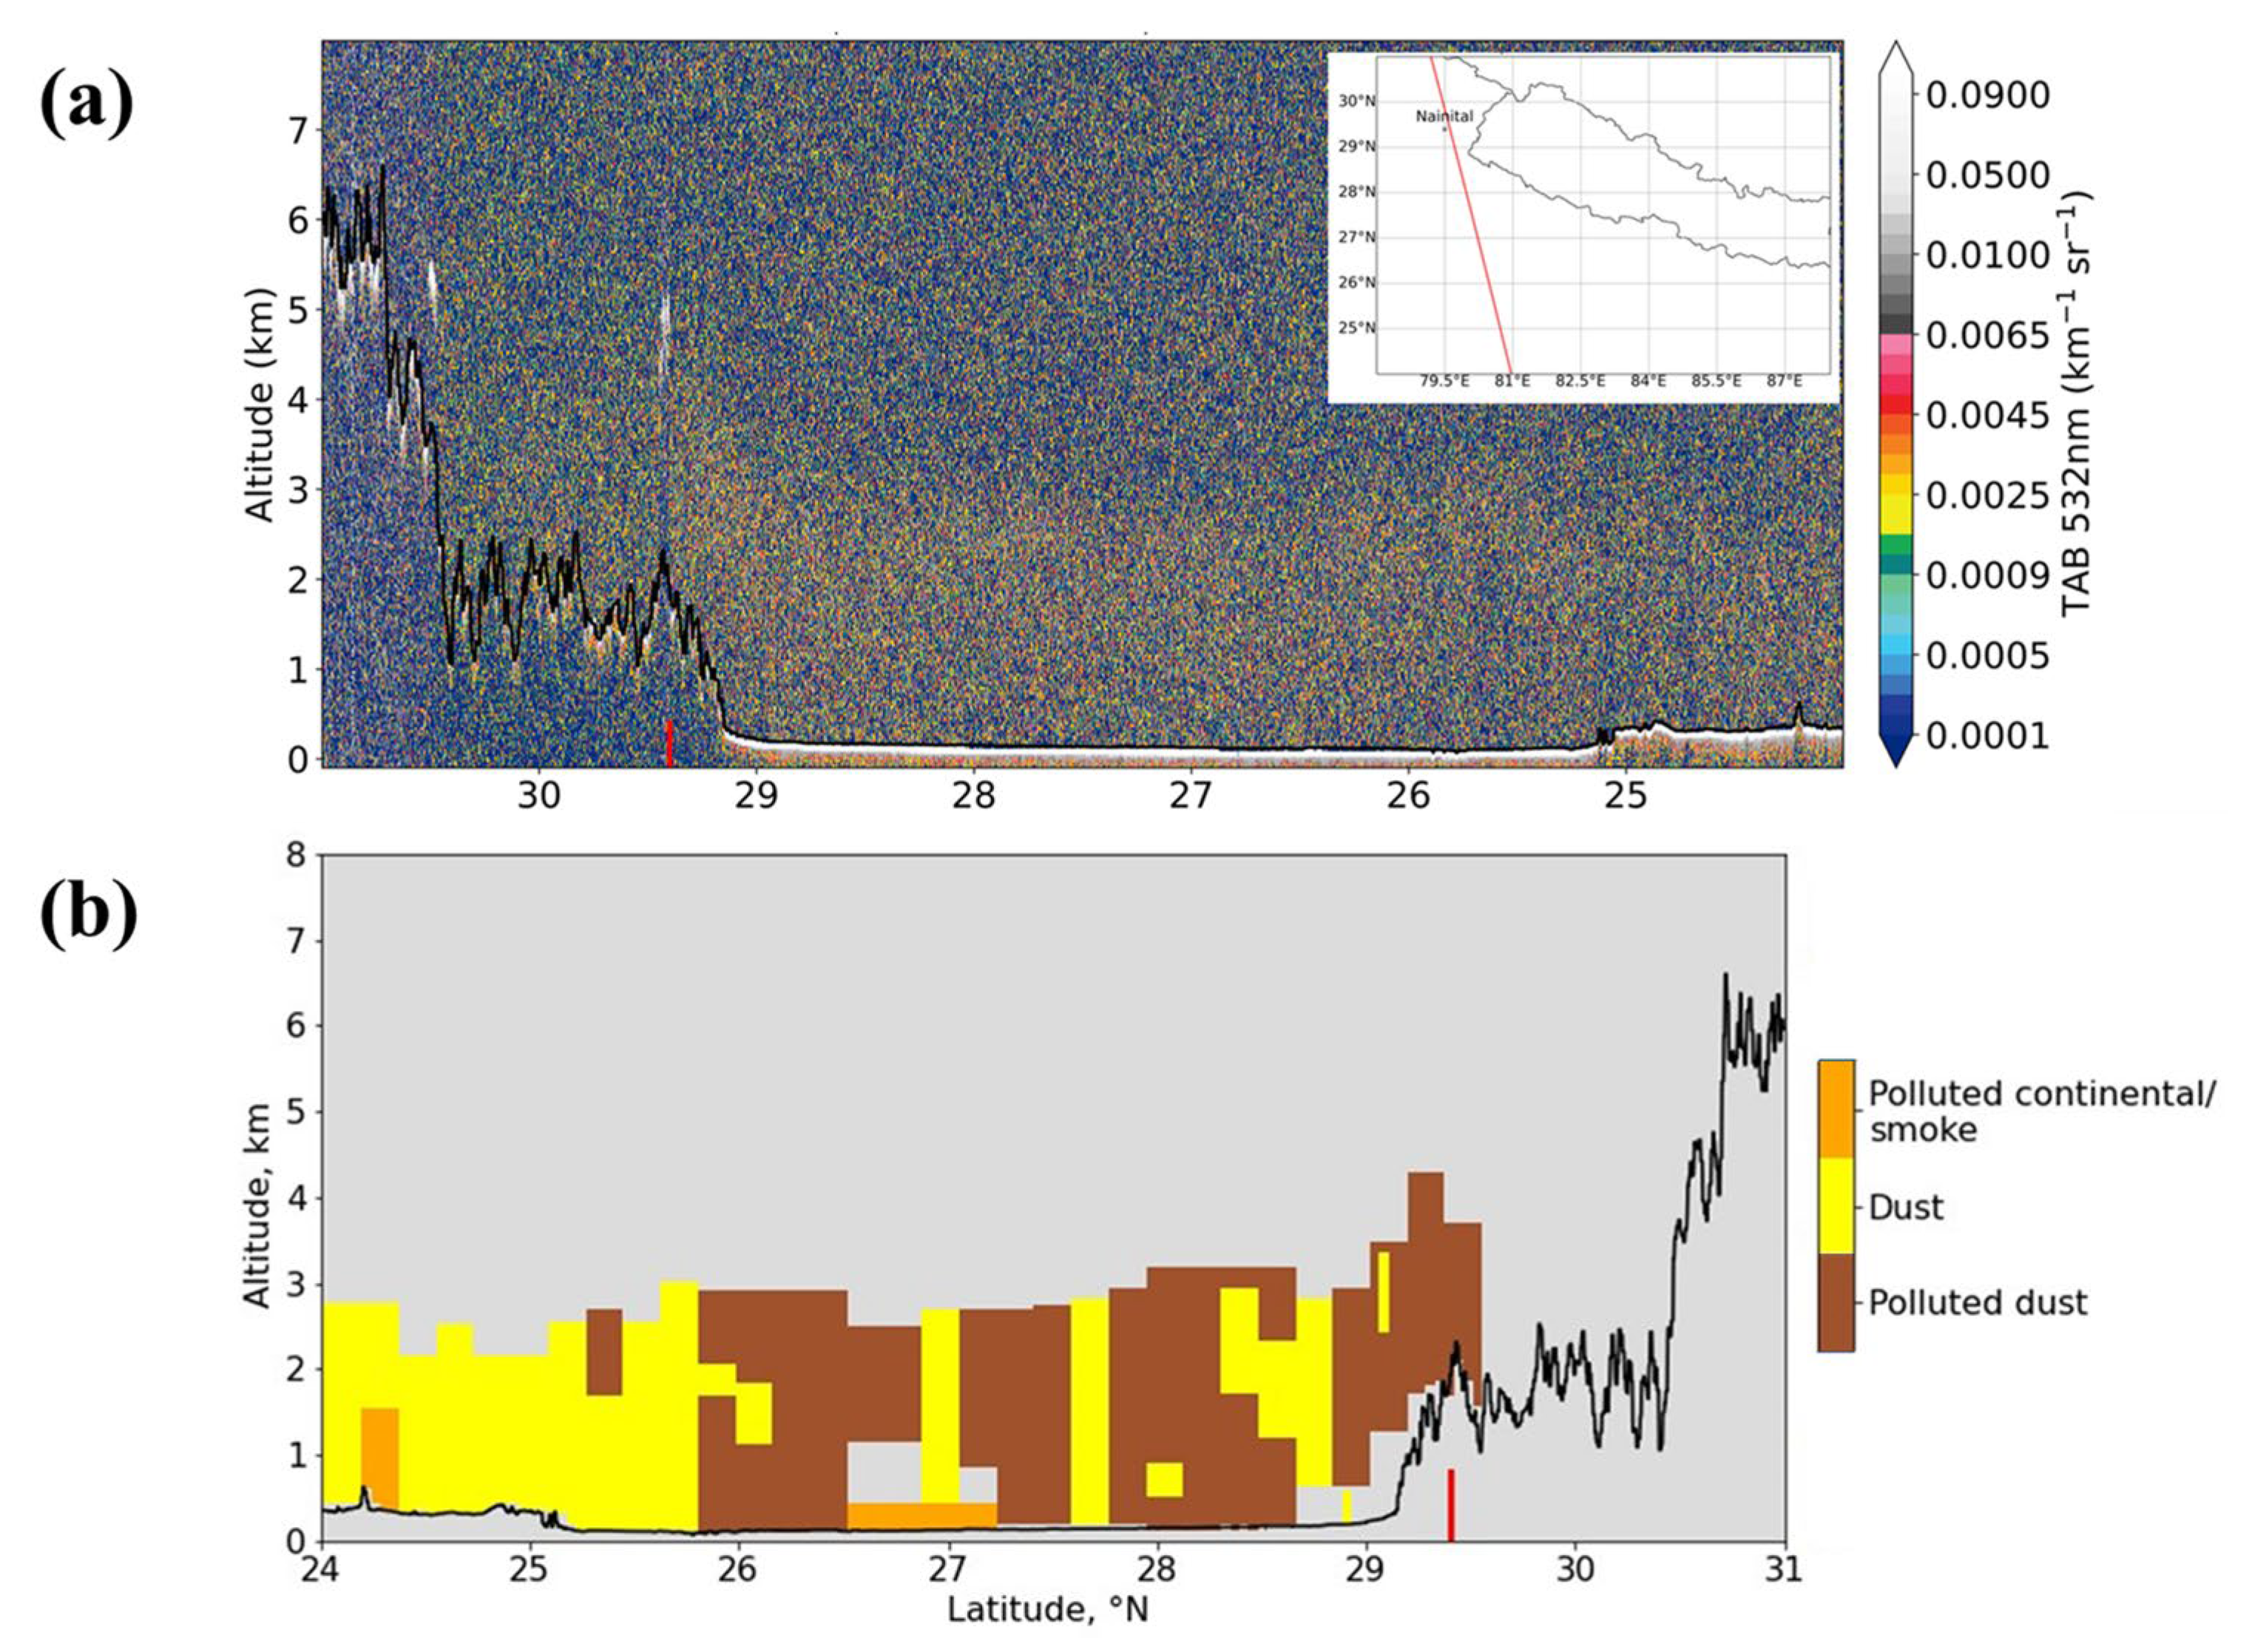
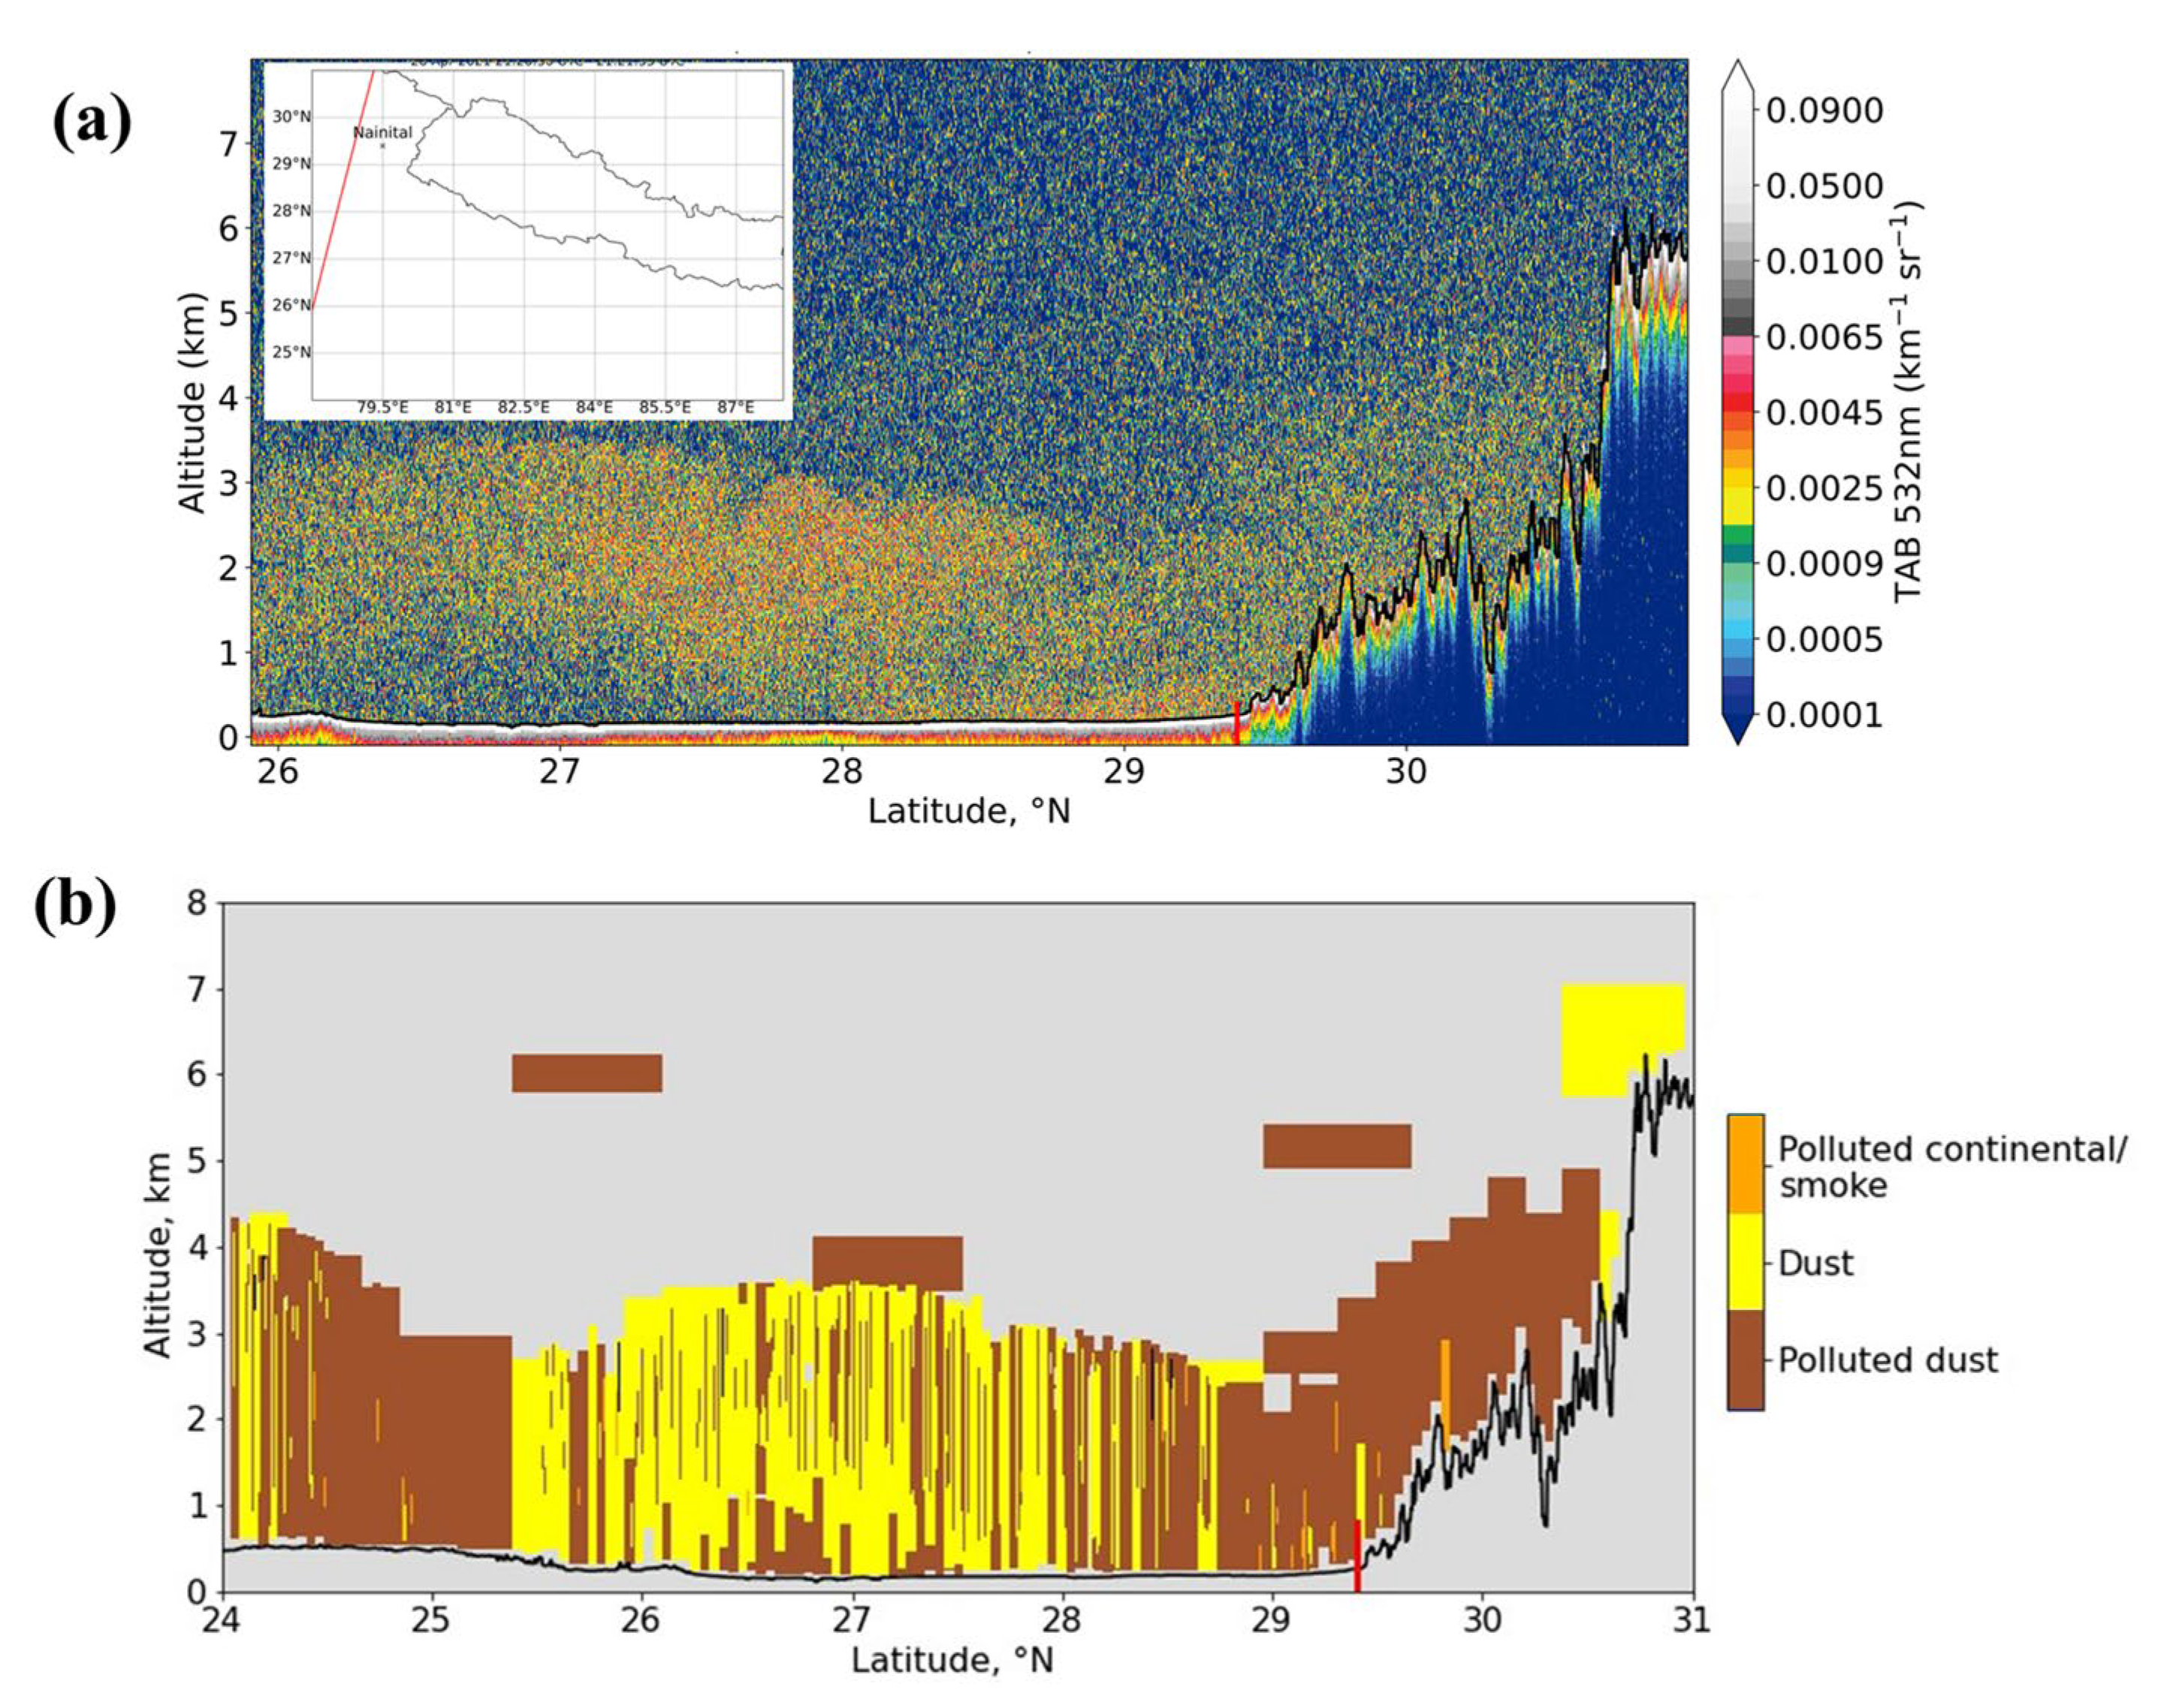
3.4. Vertical Distribution of PM2.5

In addition to the spatial variation in the surface PM2.5 mass concentration, the vertical distribution of PM2.5 was analyzed, using the monthly averaged MERRA-2 data from January to April 2021. For this, a cross-section of the IGP and Central Gangetic Himalayan region over northern India was examined, passing through a high-altitude remote location at Nainital, at a constant longitude of 79.5° E, from 20° N to 40° N, as shown in Figure 7. The PM2.5 concentrations are shown by the color-filled contours and further, the horizontal wind barbs are also plotted (Figure 7). The gray-shaded region shows the surface elevation. The PM2.5 concentration accumulated at lower altitudes close to the Himalayan foothills, as the MERRA-2 reanalysis data were well-aligned with the hybrid sigma levels. The high PM2.5 levels over the IGP region in January, mostly confined below 900 hPa, were gradually decreasing in the following months, while increased PM2.5 due to dust is shown over the Tibetan Plateau in April. The vertical distribution of PM2.5 over the IGP is well-aligned with the average monthly boundary layer heights. Srivastava et al. [102] showed that the boundary layer heights over the IGP gradually increase from around 400 m in January to around 1500 m in April. The shallower boundary layer in January implies that PM2.5 is concentrated close to the source regions and near the surface. With the increase in boundary layer height in spring, aerosols disperse to higher altitudes and can uplift up to the Himalayan range [66], leading to lower concentrations near the surface. Figure A4 shows the cross-section of PM2.5 and horizontal wind through Nainital, along a constant latitude of 29.4° N between 70° E and 90° E.
The vertical distribution of air pollution was also investigated with the CALIPSO LiDAR observations, which provide the vertical distribution of total attenuated backscatter (TAB) during the CALIPSO nighttime overpass on 5 April 2021 (Figure 8). The high LiDAR backscatter values at an altitude of 4–5 km clearly indicate a thick layer of aerosols over the central Himalayan region, as well as over the IGP (Figure 8a). The CALIPSO measurements also show that the polluted dust along with polluted continental/smoke and dust aerosols constitute the major aerosol types over the Central Himalayan and IGP region (Figure 8b). These results are quite like those from previous studies, which showed that dust, polluted dust, and polluted continental smoke lie between 2–5 km altitude [21,34,84,103]. Figure 5A and Figure 6A are like Figure 8, but they show the vertical distribution of TAB and aerosol types for 25 and 26 April 2021.

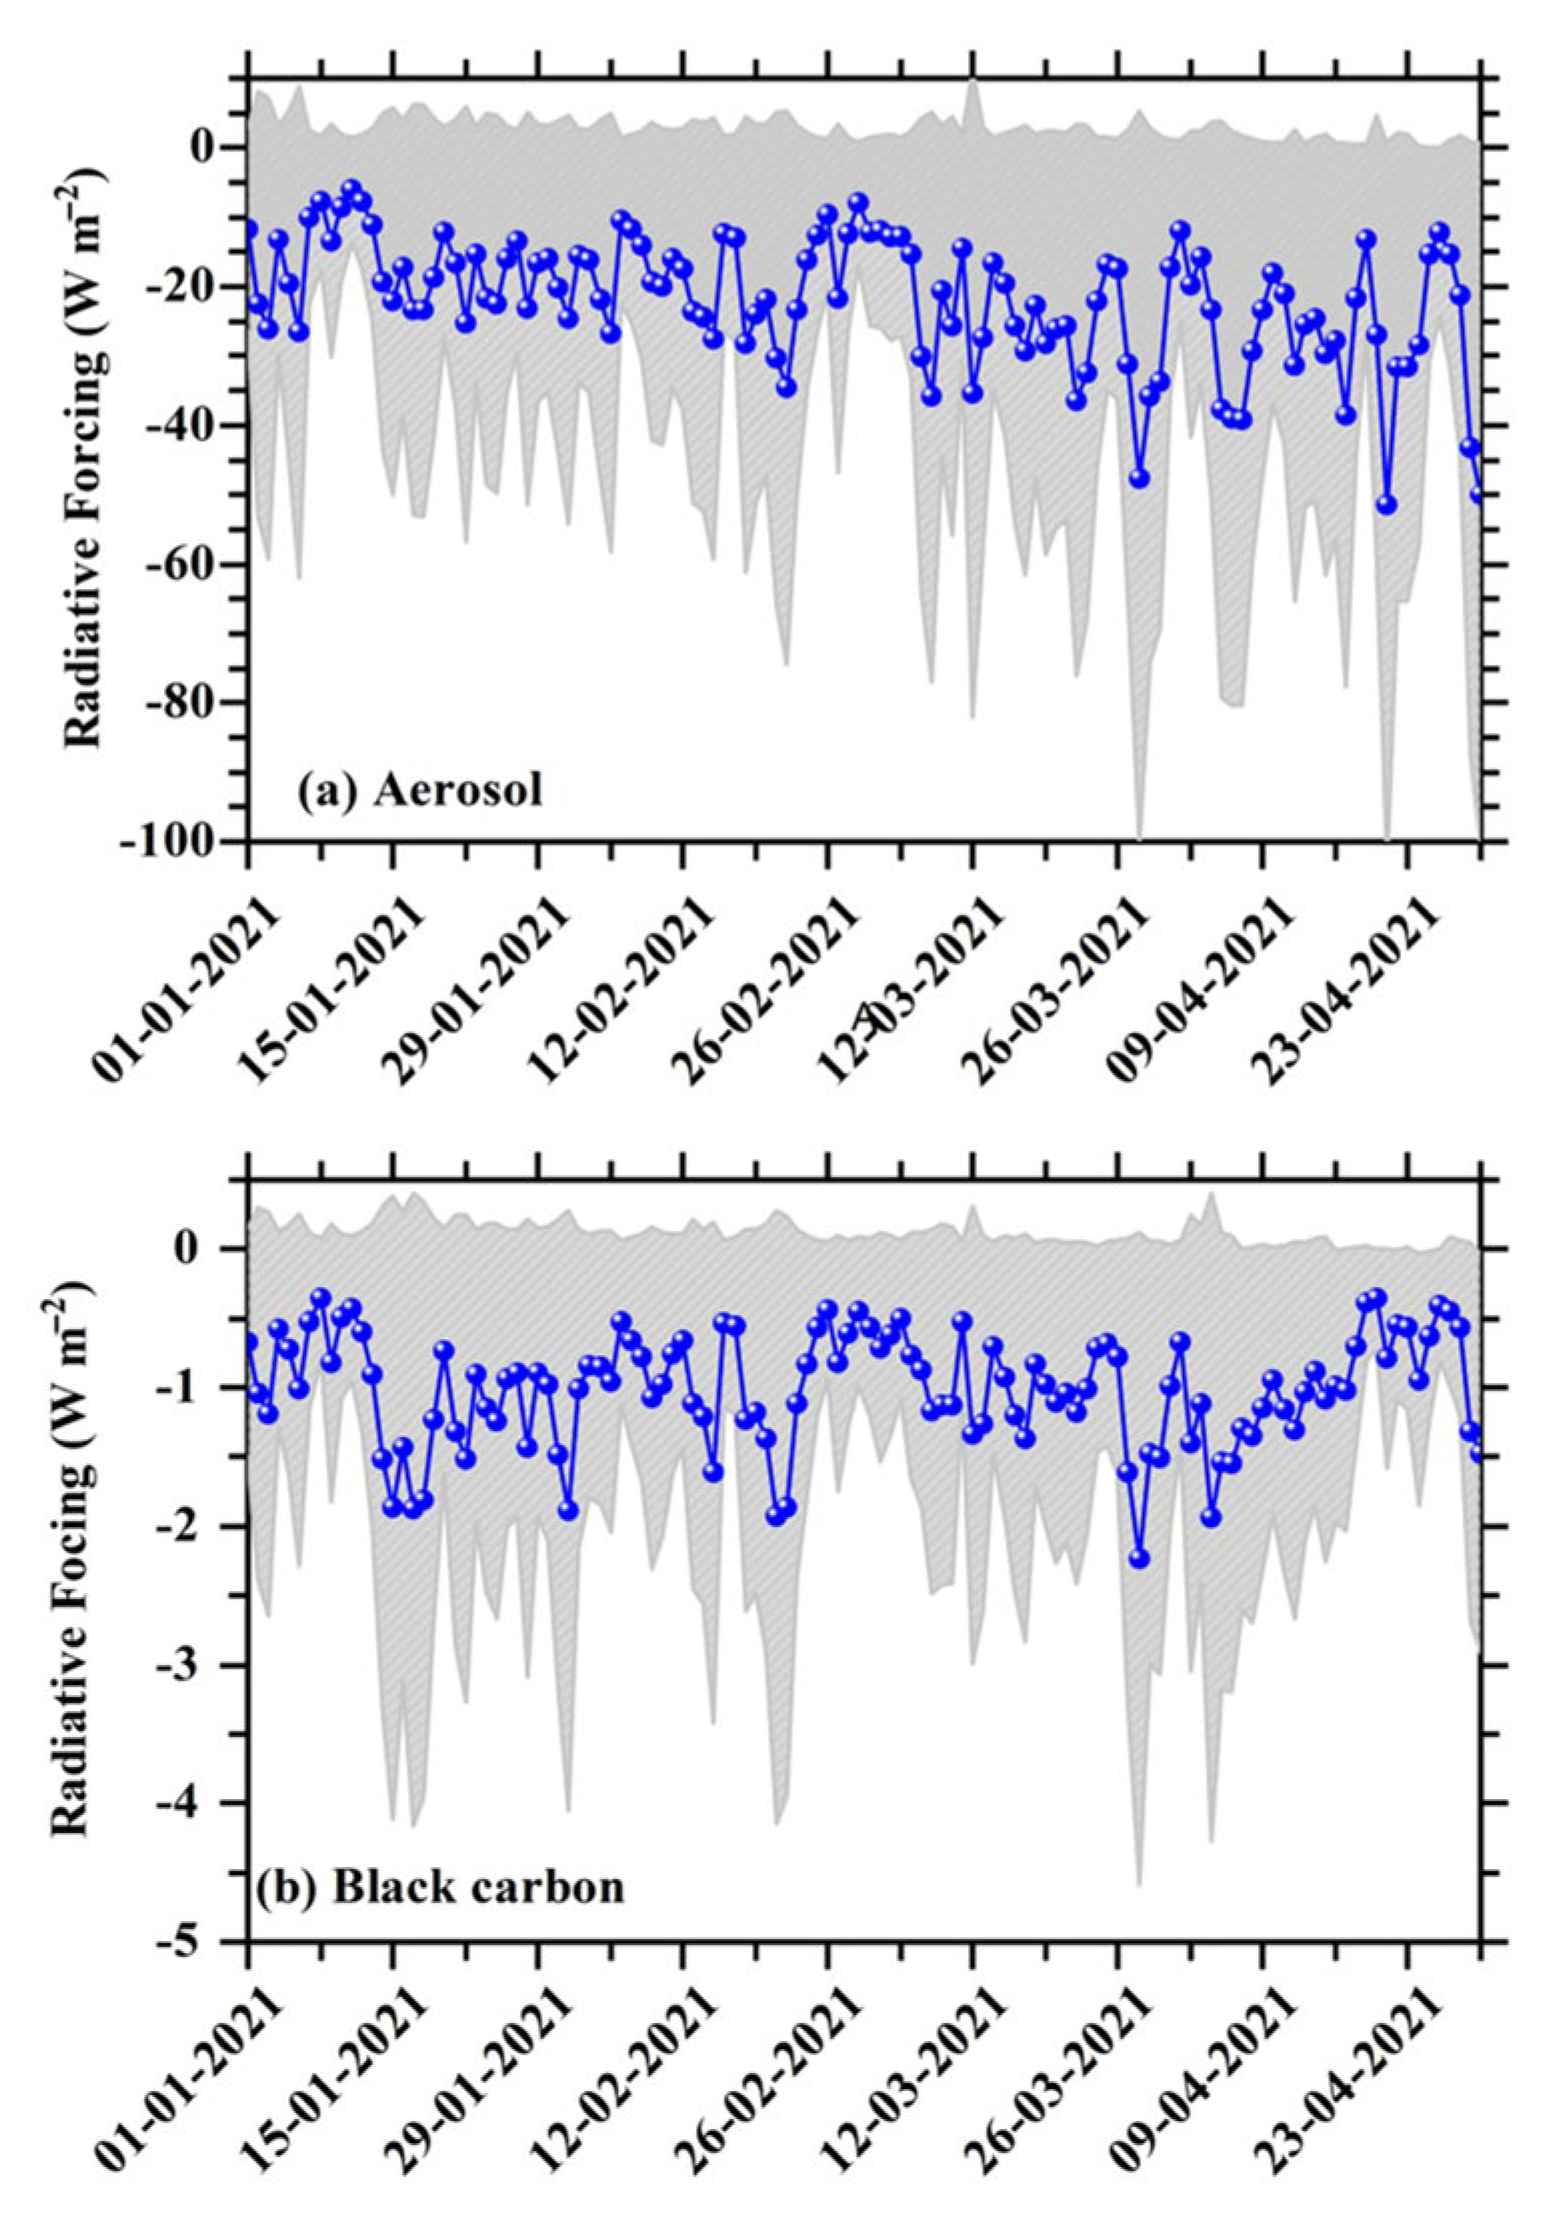
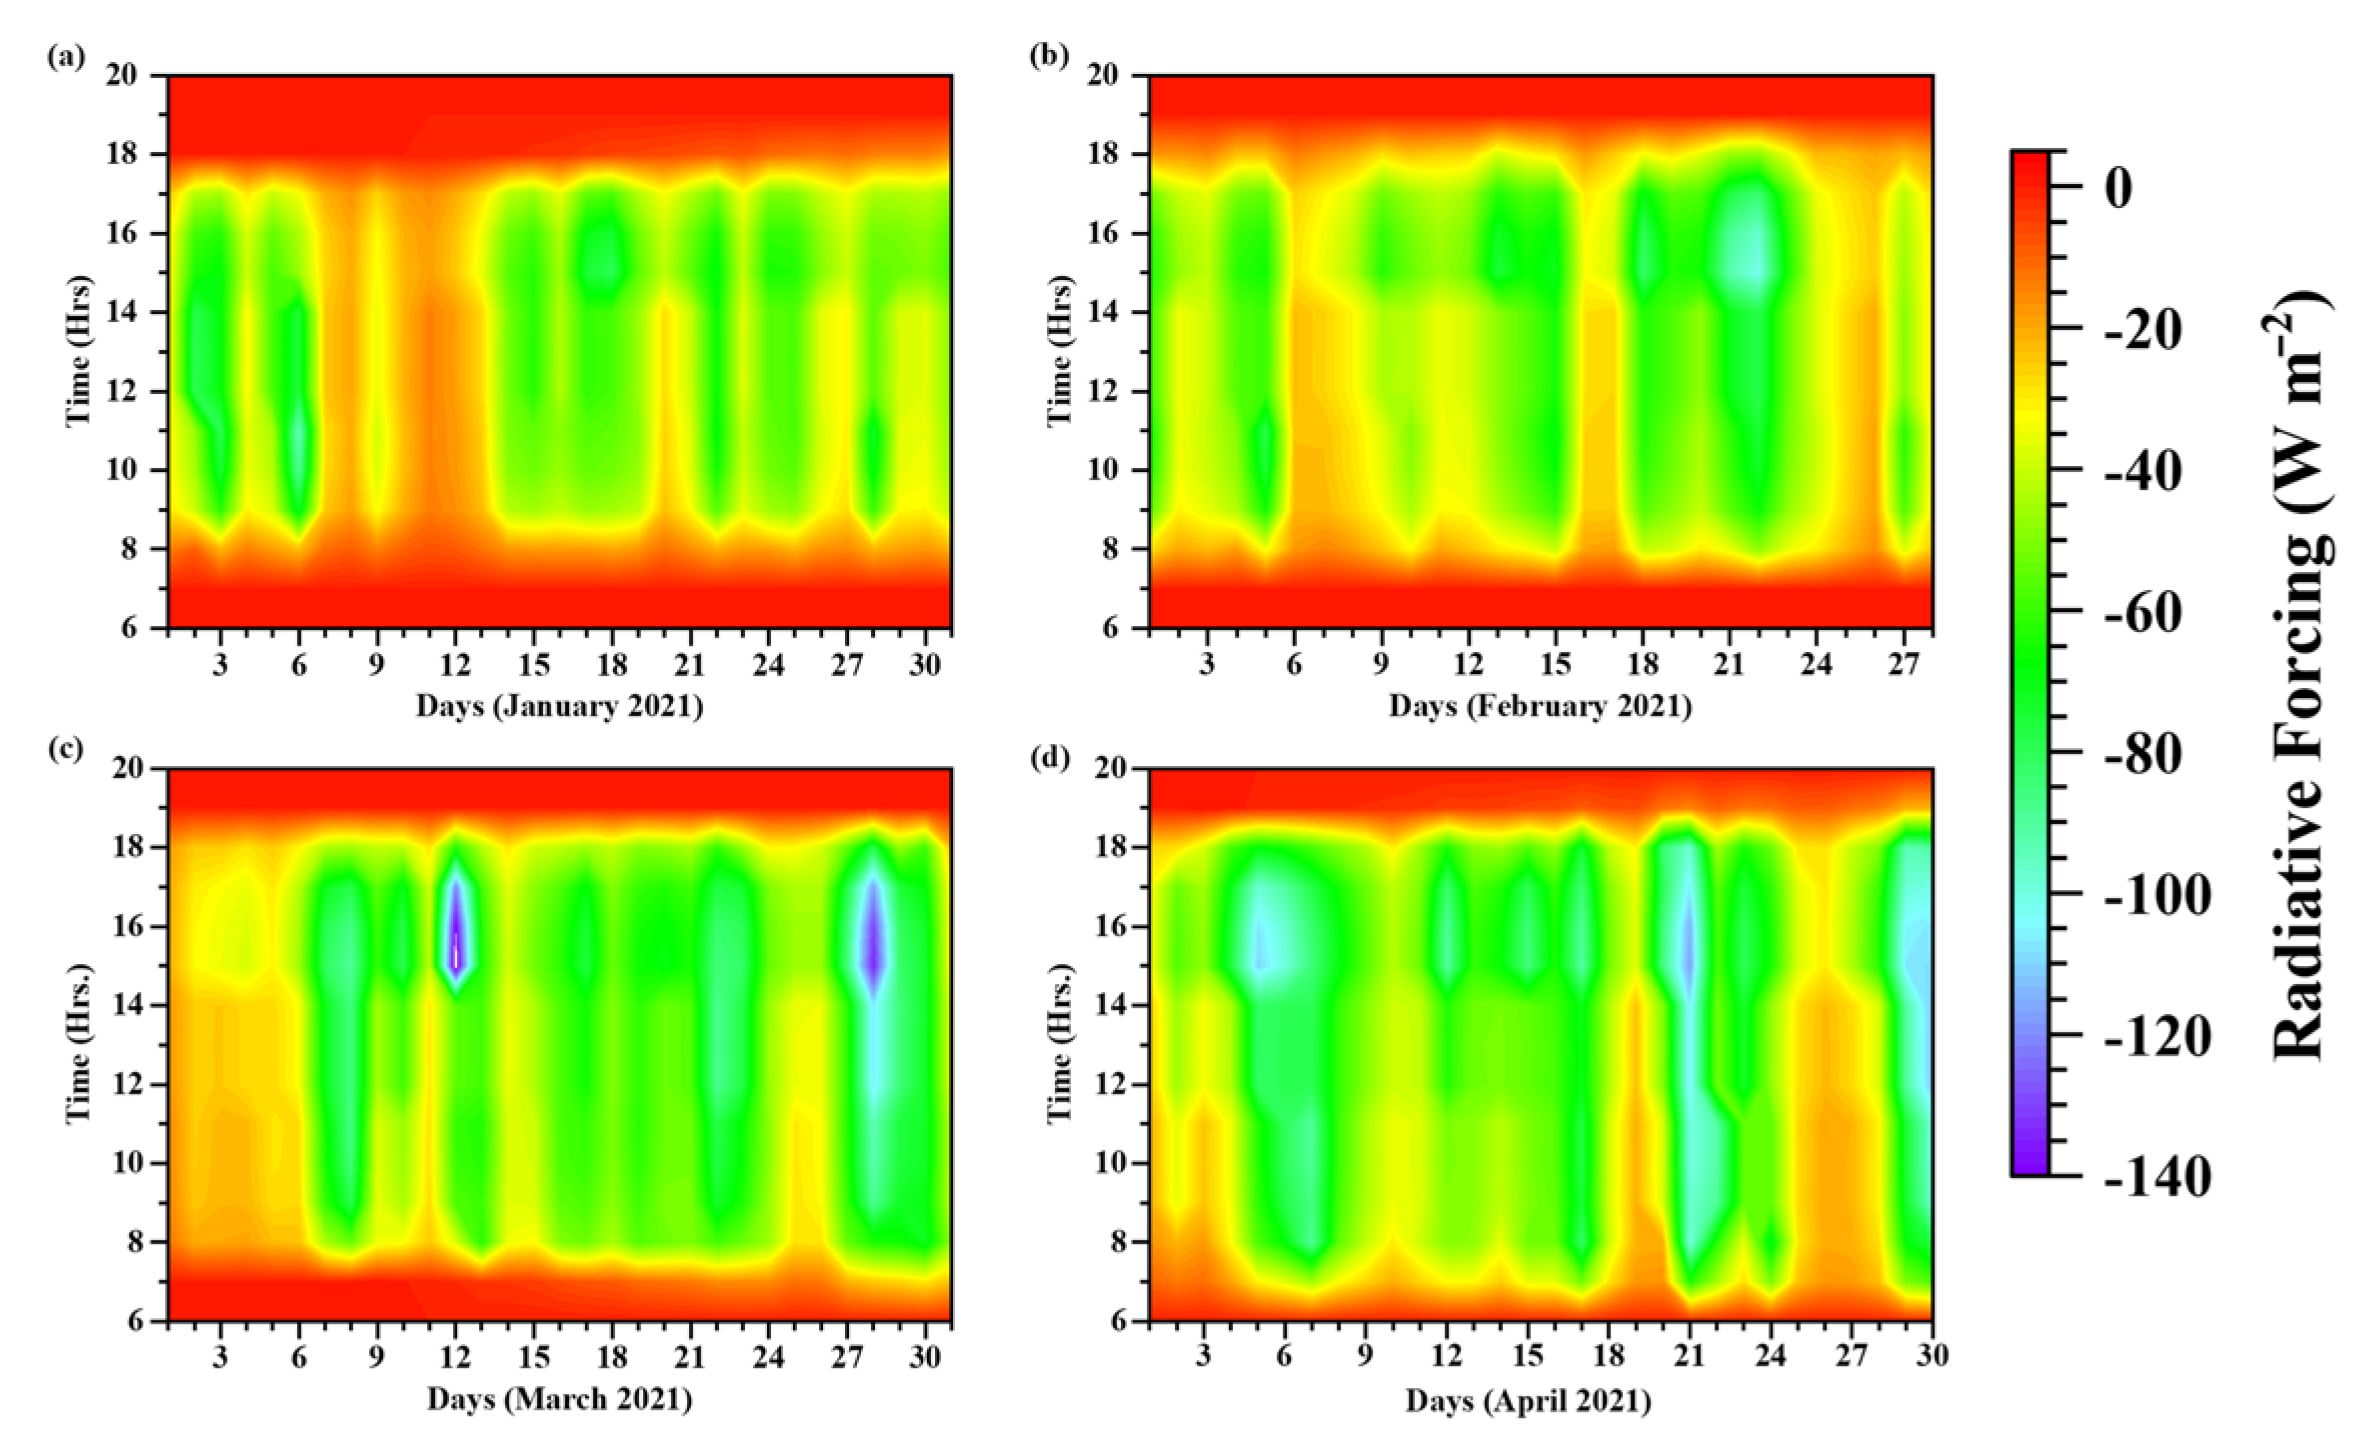
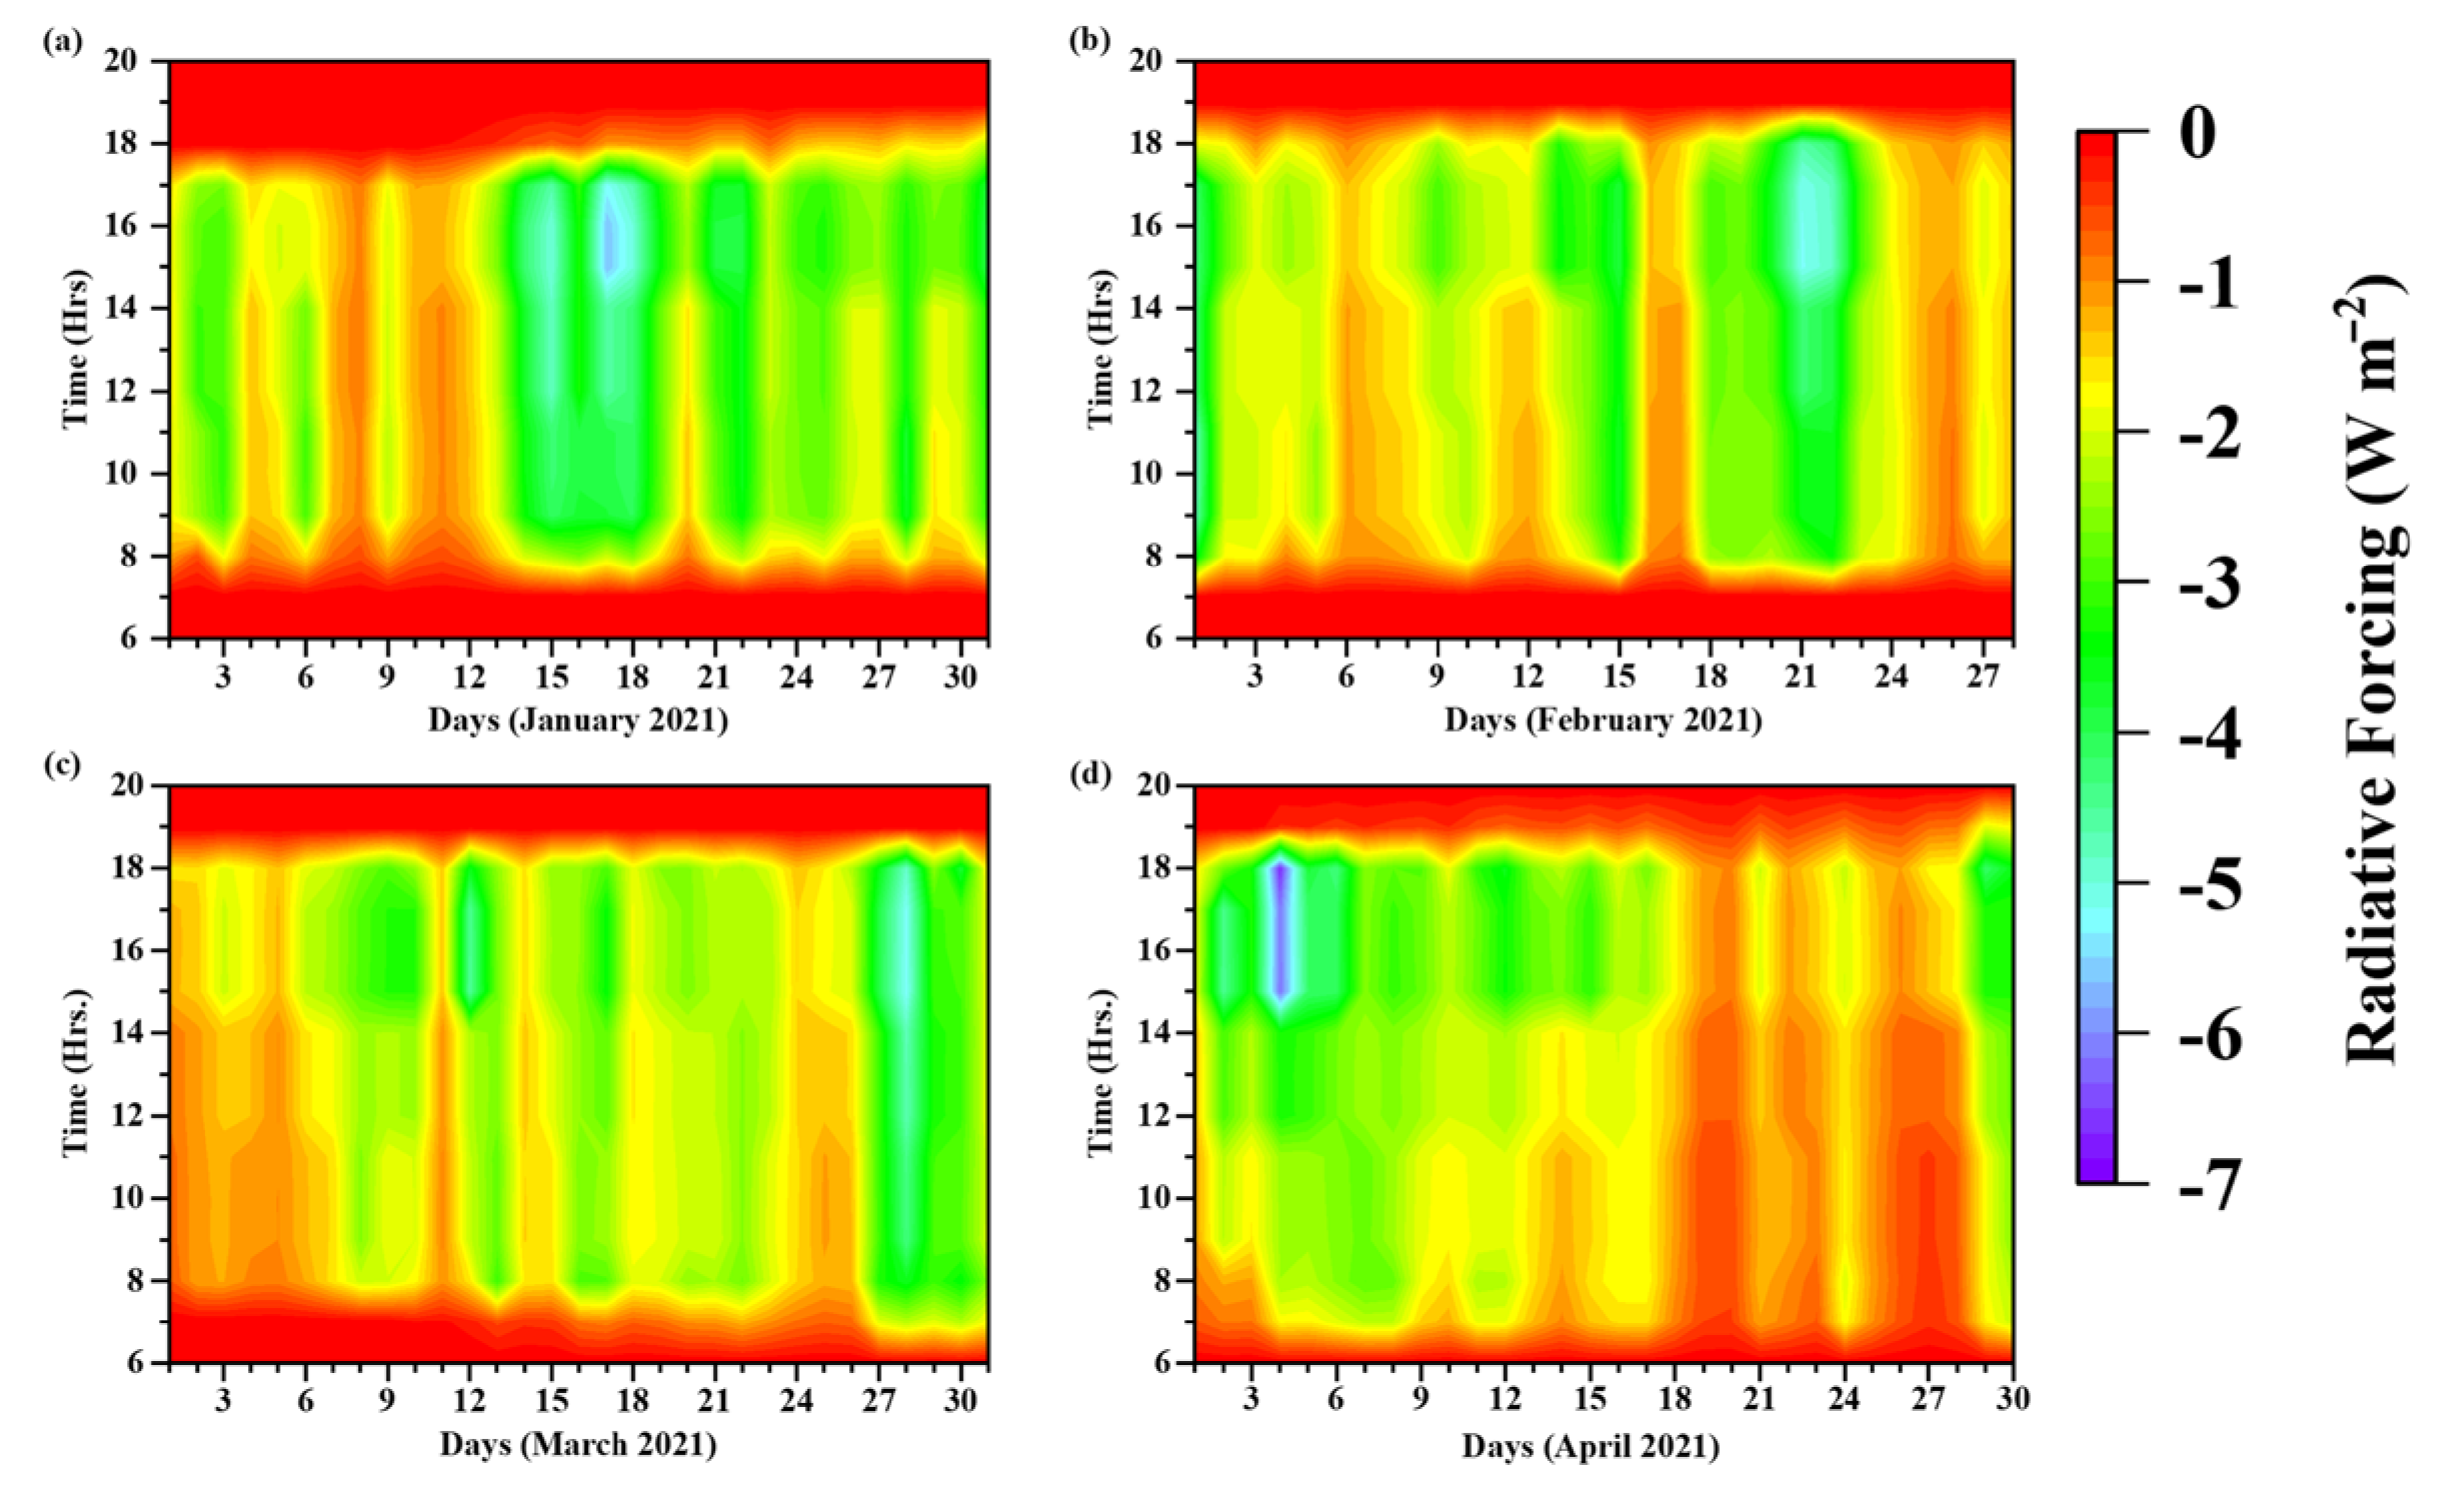
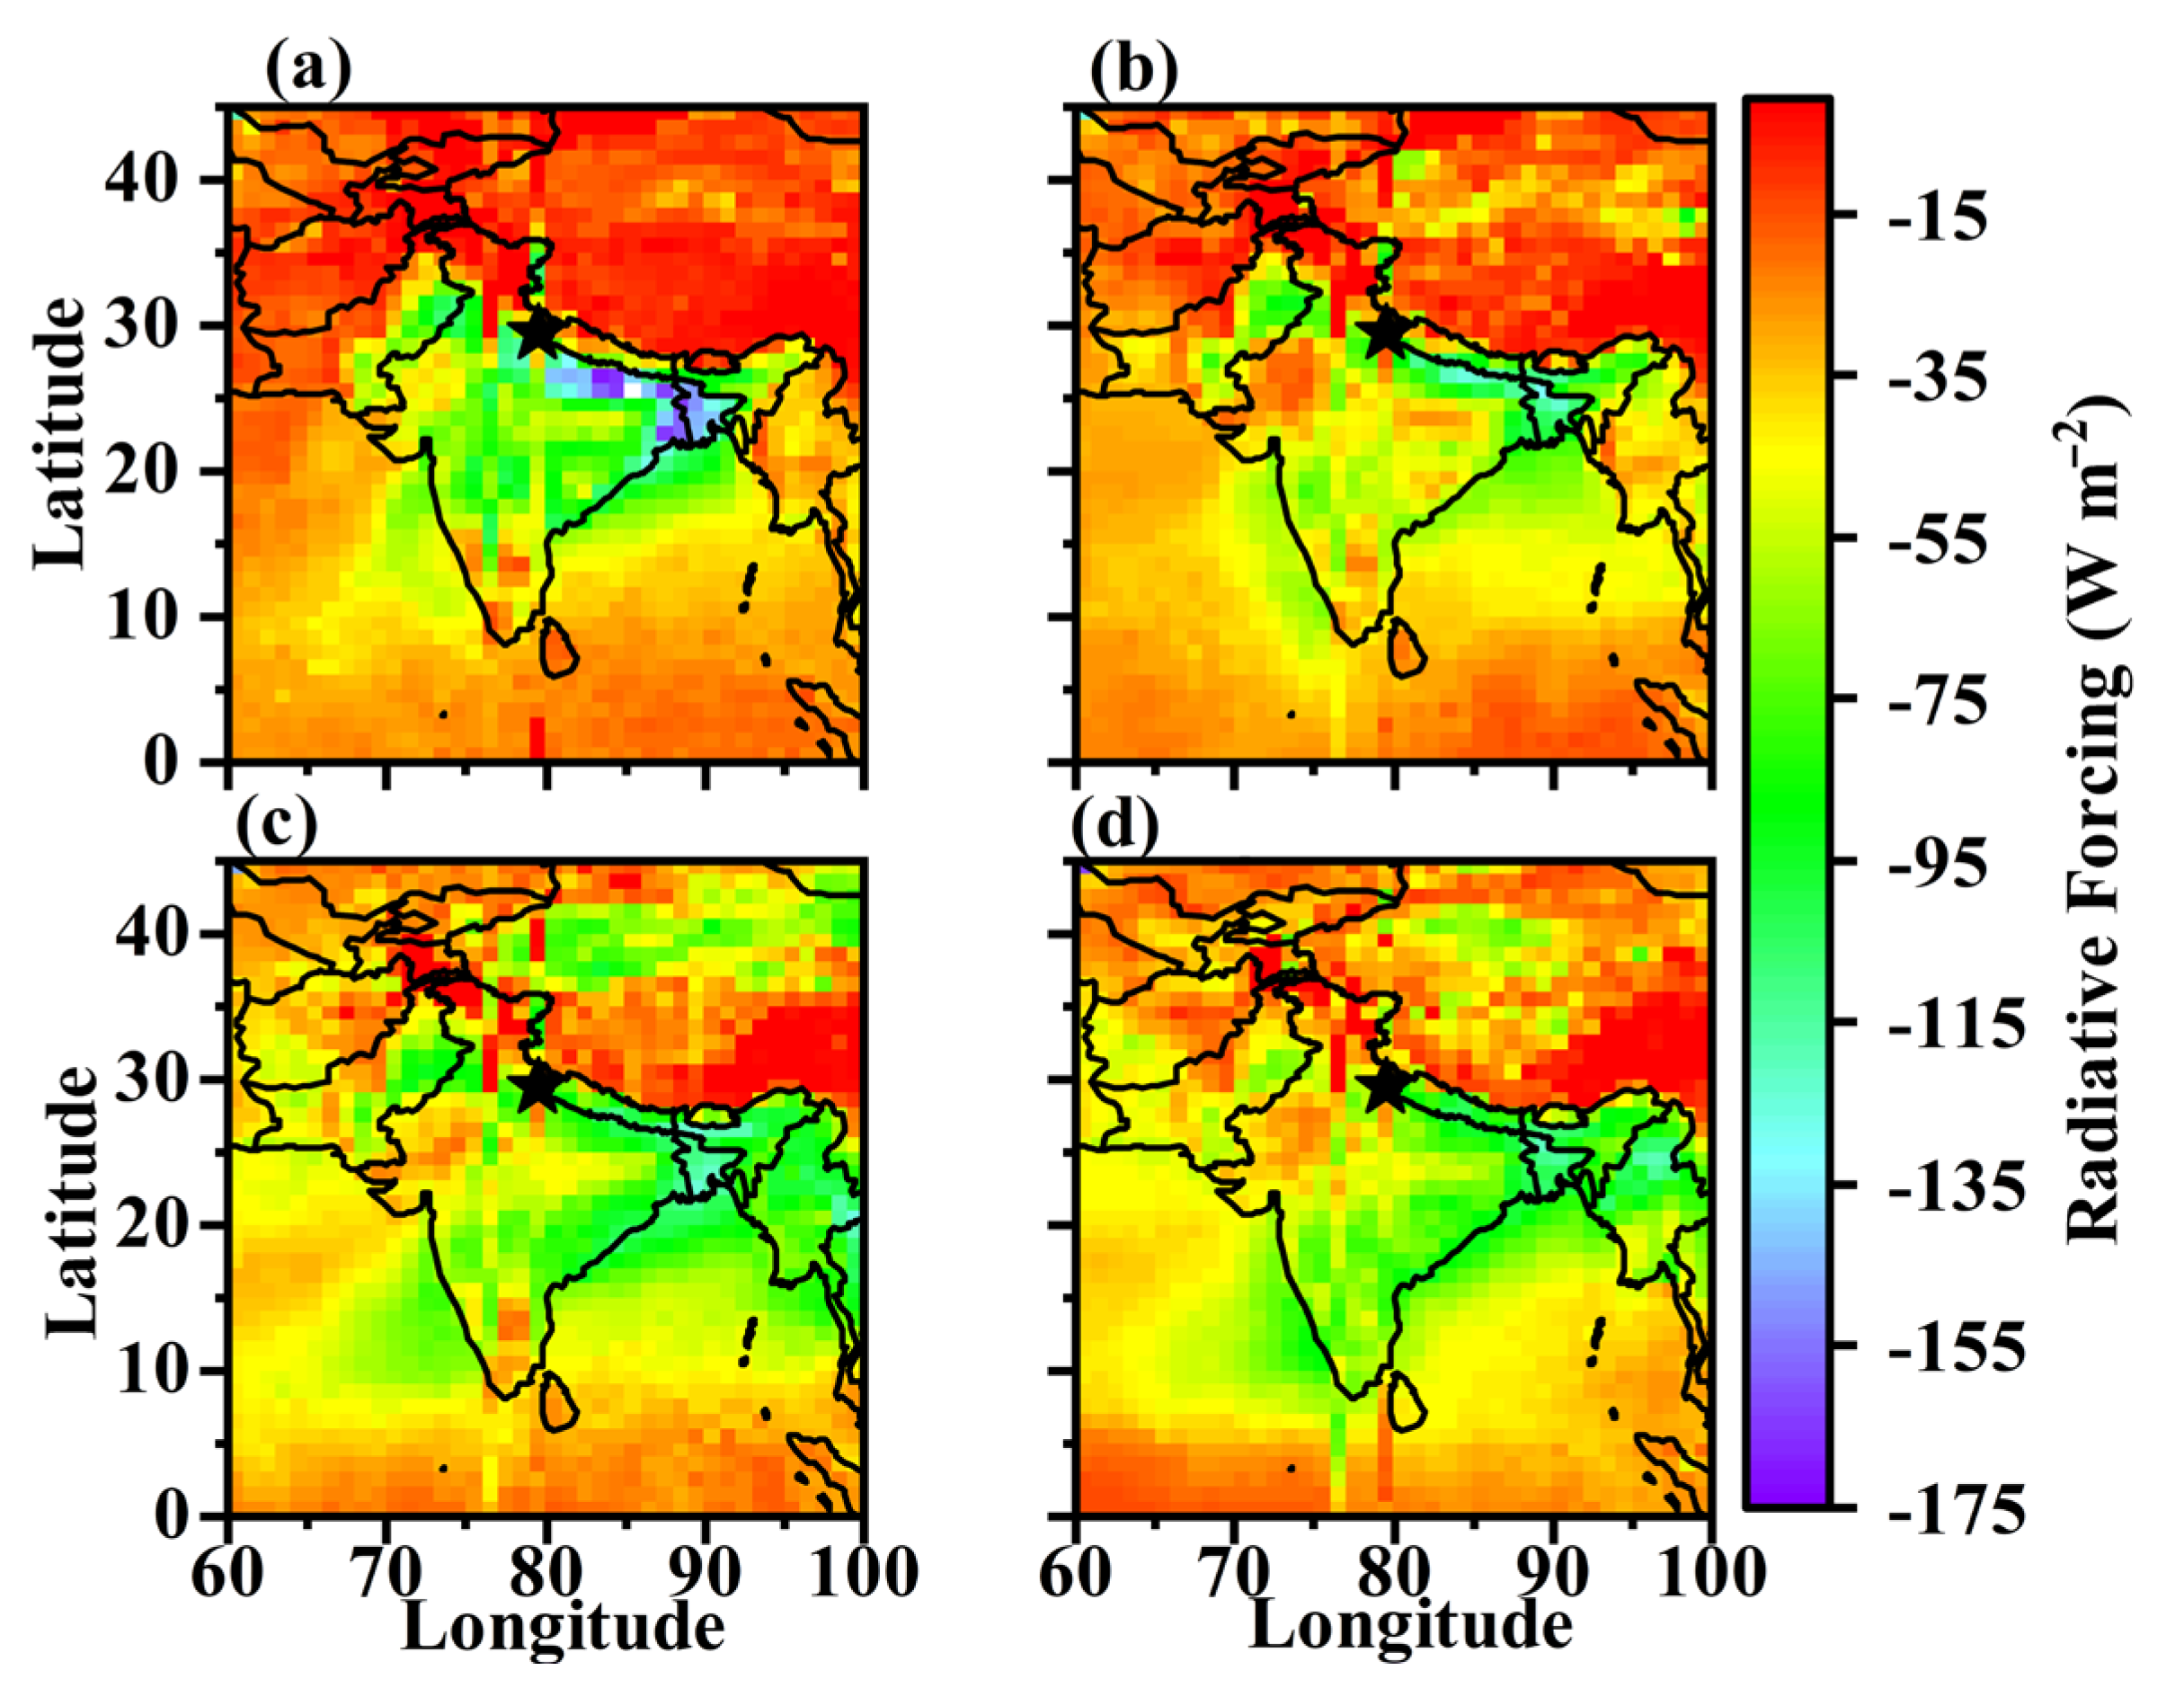
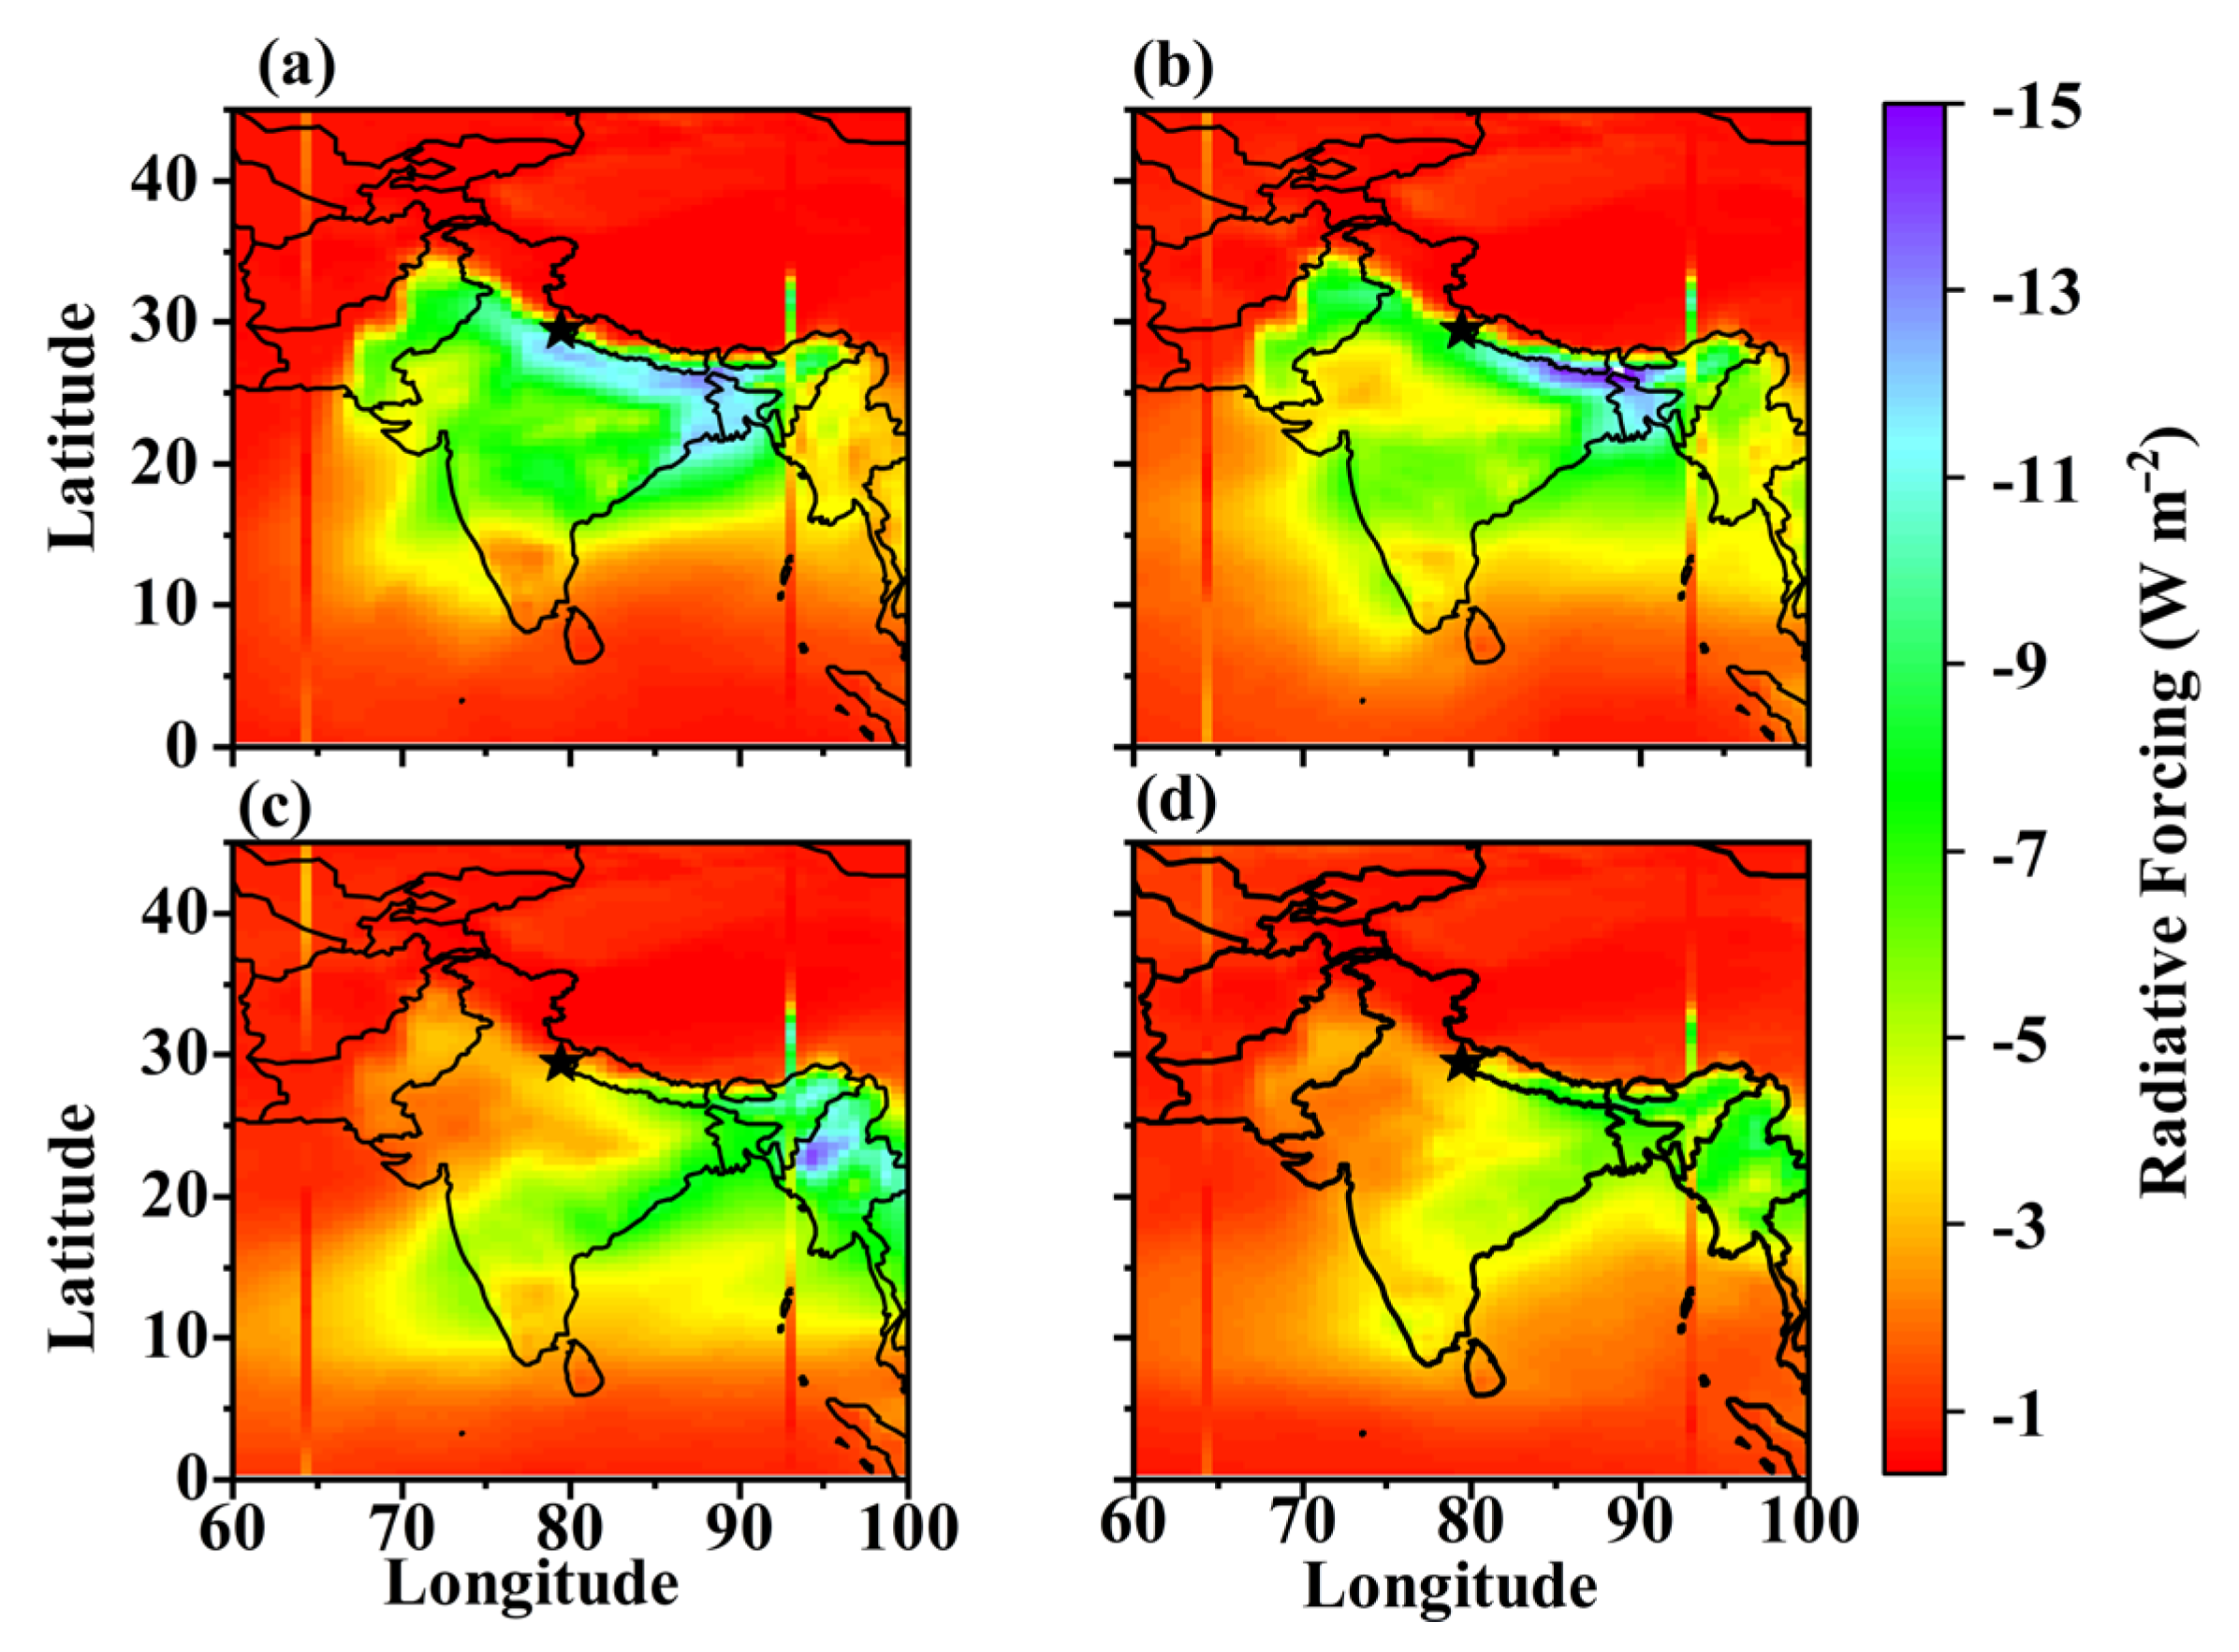
3.5. Surface Radiative Forcing

The daily variations in surface radiative forcing (RF) for total aerosols and BC over a high-altitude remote site (Nainital) in the central Himalayan region, from January to April 2021, are illustrated in Figure 9, showing appreciable variations in month-to-month patterns. The values of aerosol RF levels decreased slightly from January and fluctuated gently from February to April, while the BC RF remained mostly steady throughout the study period, with some significant gaps (negative RF corresponding to enhanced BC absorption) in certain periods during the middle of January, middle of February, by the end of March and during the beginning of April (Figure 9). The changes in the RF of BC are mainly influenced by local emissions and are considerably lower (−1.01 ± 0.40 W m−2) than the radiative effect of total aerosols. Since the primary source of energy production and consumption in India is coal, the high rates of usage of coal are primarily responsible for the high BC emissions, along with the stable atmospheric conditions in winter. Figure 10 shows the diurnal variation in surface aerosol radiative forcing for January (Figure 10a), February (Figure 10b), March (Figure 10c) and April (Figure 10d) of the year 2021. The average surface aerosol radiative forcing is about −45.56 ± 22.85 W m−2. Although the corresponding dataset is limited from 06:00 to 20:00 local time (daylight), an appreciable diurnal variation can be observed during all months of the period under consideration. In a general atmospheric context, the scattering aerosols comprise the bulk of the total aerosol load, which causes an increase in scattering of solar radiation, and thereby, a noticeable negative trend of surface aerosol radiative forcing during the day of all months (see Figure 10). Furthermore, since the entire region is being engulfed by strong biomass burning (and domestic heating) during the year, a considerable positive appreciation of surface ARF can be observed, especially during episodic days. So, on certain days characterized as aerosol episodes, the ARF values can be significantly lower at specific time intervals, even reaching −100 W m−2 or even less, due to highly increased aerosol loading. It is speculated that the aerosol episodes, which contribute to the large negative surface ARF values, are mostly composed of scattering aerosol types, as these days and hours are not coincident with BC RF episodes (Figure 11). Conversely, on other days, the surface ARF values could be significantly higher (less negative), indicating less aerosol impact. It should be noted that the much lower ARF values close to sunrise and sunset hours are due to astronomical effects (very high SZA values) that increase the uncertainty in RF estimates and do not represent lower AODs.
Figure 11 illustrates the diurnal variation in BC radiative forcing on a monthly basis from January to April 2021. As previously explained, domestic heating in conjunction with BB exacerbates the radiative potential during January, while on specific days in March and April, characterized by more negative BC RF values, the enhanced BC levels were mostly attributed to wheat residue burning in NW India and to Himalayan forest. Although several similar episodes occurred throughout the study period, the most intense events took place in January and on certain days in April, characterized by more negative hourly BC RF values of −5 to −7 W m−2 (Figure 11). The daily mean surface radiative forcing by BC during January–April 2021 was found to range from −2.23 to −0.35 W m−2 (mean of −1.01 ± 0.40 W m−2).
Figure 12 shows the monthly mean radiative forcing by aerosols over the Indian subcontinent. In January, significantly larger negative values of aerosol forcing compared to the other months are observed, primarily due to enhanced aerosol loading in this month, especially over the central and eastern parts of the IGP, reaching even −150 W m−2, as well as over the northern Bay of Bengal and eastern Arabian Sea, due to south Asian continental pollution outflows [29]. In February, the ARF values are less negative over the IGP and central India due to lower aerosol loading, while in March and April, large negative ARF values of the order of −90 to −100 W m−2 are observed over the northern part of the southeast Asian region, due to extensive agricultural fires [7]. At the same time, the ARF values over the Thar Desert are less negative, while rather negligible radiative forcing is observed over the Tibetan Plateau (Figure 12). On the other hand, the increased dust presence over the Arabian Sea in April enhances the aerosol impact on solar radiation, thus leading to more negative ARF values compared to winter months.
Apart from the increased aerosol emissions over north India during wintertime, the lower temperatures facilitate less convection and confinement of aerosols close to the surface, thus contributing to the formation of a dense aerosol layer, which highly attenuates the GHI levels [23,39,81]. Consequently, increasing temperatures in spring lead to higher aerosol convection within the boundary layer, thus reducing the ARF, apart from cases with significant amounts of elevated dust that significantly scatter the solar radiation and enhance the radiative impact.
Figure 13 shows the monthly averaged spatial distribution of the BC-related radiative forcing over the Indian subcontinent from January to April 2021. The monthly mean BC RF ranged from −15.29 W m−2 (over the eastern IGP in January) to −0.31 W m−2 (over areas relatively free from BC aerosols), exhibiting a spatial-averaged mean value of −2.46 ± 2.32 W m−2. The strongest surface BC forcing is detected over central-eastern India and throughout the IGP region during January, while in February, the spatial pattern remains rather similar, but with lower (less negative) BC RF values over IGP, the Thar Desert and central India. In March and April, the most intense radiative impact of BC is shifted toward the east, along the eastern Indian coast, the northern Bay of Bengal, and the southeast Asian region due to increased BB emissions in Myanmar and Thailand [28]. Over these areas, BC RF is about 13–18% of the total ARF, while over the eastern IGP in winter, this fraction is slightly lower (9–14%).
The presented results revealed a large radiative effect of aerosols and BC over the south Asian region that is a major regulatory factor for the regional climate, monsoon circulation, atmospheric dynamics, and thermodynamics, as well as for the cryosphere, biosphere, and the Himalayan ecosystems [98,103,104].

4. Summary and Conclusions

The current work studied the surface aerosol radiative forcing (ARF) using satellite-based and reanalysis data, along with radiative transfer model simulations over the Indian subcontinent, from January to April 2021, when BB and dust aerosols dominate. The fast mode of RTM simulations based on previously derived lookup tables was employed in this work in order to facilitate the process of such high computationally demanding approaches (i.e., >5 million simulations in total). AOD550, solar zenith angle (SZA), single scattering albedo, total columnar ozone (TOC), Ångström exponent, and columnar water vapor were the primary input parameters for the RTM simulations so as to realistically represent the atmospheric conditions and the subsequent effect on solar radiation levels during the studied period.
The results showed a large spatio-temporal variability in the aerosol loading, as well as in the dominant aerosol types over the Indian subcontinent, which highly affected the aerosol properties and radiative effects. During wintertime, the northern part of India (IGP) exhibited much larger aerosol loading, mainly consisting of BC and organic aerosols from fossil fuel and biofuel combustion. As the spring progressed, the dust became dominant over the NW part of India, as well as over the arid regions of southwest Asia, while over southeast Asia, extensive agricultural burning highly increased the carbonaceous aerosol concentrations. In addition, Himalayan forest fires and burning of wheat residue over the IGP also contributed to the springtime aerosol burden. The regional meteorological and boundary-layer dynamics also played an important role in the accumulation or dispersion of aerosols and pollutants, as well as in their vertical profiles, which were also examined via combined CALIPSO and MERRA-2 datasets.
The spatial distribution of the monthly mean ARF values over the Indian subcontinent showed notable spatial heterogeneities, with more negative ARF values (surface cooling) along the central-eastern IGP during January, due to high carbonaceous aerosol loading. Furthermore, more negative ARF values were detected over southeast Asia during March and April (agricultural burning), as well as over the Thar Desert due to dust effect. The ARF values ranged widely from −146.24 to −1.63 W m−2, with a mean of −45.56 ± 22.85 W m−2, over different parts of the study region. On the other hand, the spatial-averaged ARF values ranged from −51.40 to −6.08 W m−2 from January to April 2021. In addition, the mean BC radiative forcing ranged from −2.23 to −0.35 (mean of −1.01 ± 0.40 W m−2), averaged over the spatial domain. The spatial variation in the BC radiative forcing over the Indian subcontinent presented values from −15.29 W m−2 over the central-eastern IGP in January to −0.31 W m−2 over regions with the lowest BC concentrations, while the mean BC radiative forcing over the studied domain was estimated to be −2.46 ± 2.32 W m−2.

Author Contributions

U.C.D.: conceptualization, methodology, data analysis and plotting, writing original draft, revised. P.G.K.: conceptualization, methodology, discussion, editing, reviewing the manuscript. E.B.: writing original draft, editing. D.G.K.: editing, revision and reviewing. M.N.H.: writing, reviewing. M.F.K.: reviewing, revision. M.B. and B.A.: reviewing, revision. S.K.: data analysis, plotting. P.M.: data analysis, plotting. All authors have read and agreed to the published version of the manuscript.

Funding

This research received no external funding.

Data Availability Statement

Data will be made available upon request.

Acknowledgments

We acknowledge the use of data and/or imagery from NASA’s Fire Information for Resource Management System (FIRMS) (https://earthdata.nasa.gov/firms, accessed on 1 April 2022), part of NASA’s Earth Observing System Data and Information System (EOSDIS). Thank you to the CAMS (which is managed by the ECMRWF on behalf of the European Commission as a part of the Copernicus Programme) re-analysis for providing the data used in this study. Further, we thank the CALIPSO LiDAR science team members for managing and providing the data used in the present study. P.G.K. acknowledges the EU-funded CiROCCO project under Grant Agreement No. 101086497 and the ClimSA Programme, which is an initiative funded by the European Union and implemented by the Organization of African, Caribbean, and Pacific States (OACPS).

Conflicts of Interest

All of the authors declare that they have no known competing financial interests or personal relationships that could have appeared to influence the work presented in this paper.

Appendix A

Regarding conversion factors in Equation (1), since MERRA-2 gives the mass of the sulfate ion, it is multiplied by a factor of 1.375 to obtain the mass of the sulfate aerosol, which is assumed to be ammonium sulfate. Particulate organic matter (POM) is estimated from the modeled OC multiplied by a factor (molecular weight per carbon weight ratio) that considers contributions from other elements associated with the organic matter, like oxygen, nitrogen, etc. This factor varies spatially and temporally, with values between 1.2 and 2.6 [105]. A constant value of 1.6 is applied in our calculations, similarly to other studies [54]. About the conversion factors in Equation (2). For dust and sea salt, which are resolved into five size bins in the model, only particles smaller than 2.5 μm in diameter were considered in the PM2.5 calculations. The following table [55] shows that the size bins do not have a cut-off at a diameter of 2.5 μm. Therefore, the contribution from the second dust size bin is multiplied by 0.38, and the contribution from the third sea-salt size bin is multiplied by 0.83 to obtain the contribution from particle sizes up to 2.5 μm only.
Table A1. Diameter ranges (µm) of dust and sea salt bins used in MERRA-2 [55].
Size Bin12345
MERRA-2 dust0.2–2.02.0–3.63.6–6.06.0–12.012.0–20.0
MERRA-2 sea salt0.06–0.20.2–1.01.0–3.03.0–10.010.0–20.0
Figure A1. Monthly variation in black carbon extinction optical depth at 550 nm over the Indian subcontinent from January to April 2021 (ad).
Fire 06 00365 g0a1
Figure A2. Monthly variation in black carbon due to anthropogenic activities over the Indian subcontinent from January to April 2021 (ad).
Fire 06 00365 g0a2
Figure A3. Monthly variation in black carbon due to biomass burning over the Indian subcontinent from January to April 2021 (ad).
Fire 06 00365 g0a3
Figure A4. The vertical cross-section (in pressure coordinates) of monthly mean PM2.5 concentrations and horizontal wind (wind barbs; in m s−1) based on MERRA-2 reanalysis data from January to April 2021. The cross-section is along a line of constant latitude at 29.4° N between longitude 70° E and 90° E and passes over Nainital (shown in the inset plot) of the first panel. The gray-shaded area of each panel shows the surface.
Fire 06 00365 g0a4
Figure A5. Total attenuated backscatter coefficient at 532 nm from the CALIPSO LiDAR measurements during the night-time overpass on 25 April 2021. The inset figure shows the track of the CALIPSO pass (a). Vertical distribution of aerosol subtypes, which are depicted with different colors from the LiDAR measurements (b). The black line indicates the surface. The red thick vertical line on the x-axis shows the location of Nainital, a remote site in the central Himalayan region.
Fire 06 00365 g0a5
Figure A6. Total attenuated backscatter coefficient at 532 nm from the CALIPSO LiDAR measurements during the night-time overpass on 26 April 2021. The inset figure shows the track of the CALIPSO pass (a). Vertical distribution of aerosol subtypes, which are depicted with different colors from the LiDAR measurements (b). The black line indicates the surface. The red thick vertical line on the x-axis shows the location of Nainital, a remote site in the central Himalayan region.
Fire 06 00365 g0a6

References

  1. Bikkina, S.; Sarin, M. Brown carbon in the continental outflow to the North Indian Ocean. Environ. Sci. Process. Impacts 2019, 21, 970–987. [Google Scholar] [CrossRef] [PubMed]
  2. Jethva, H.; Chand, D.; Torres, O.; Gupta, P.; Lyapustin, A.; Patadia, F. Agricultural burning and air quality over northern india: A synergistic analysis using nasa’s a-train satellite data and ground measurements. Aerosol Air Qual. Res. 2018, 18, 1756–1773. [Google Scholar] [CrossRef]
  3. Jethva, H.; Torres, O.; Field, R.D.; Lyapustin, A.; Gautam, R.; Kayetha, V. Connecting Crop Productivity, Residue Fires, and Air Quality over Northern India. Sci. Rep. 2019, 9, 16594. [Google Scholar] [CrossRef]
  4. Pani, S.K.; Wang, S.H.; Lin, N.H.; Chantara, S.; Lee, C.T.; Thepnuan, D. Black carbon over an urban atmosphere in northern peninsular Southeast Asia: Characteristics, source apportionment, and associated health risks. Environ. Pollut. 2020, 259, 113871. [Google Scholar] [CrossRef] [PubMed]
  5. Saxena, P.; Sonwani, S.; Srivastava, A.; Jain, M.; Srivastava, A.; Bharti, A.; Rangra, D.; Mongia, N.; Tejan, S.; Bhardwaj, S. Impact of crop residue burning in Haryana on the air quality of Delhi, India. Heliyon 2021, 7, e06973. [Google Scholar] [CrossRef] [PubMed]
  6. Singh, A.; Satish, R.V.; Rastogi, N. Characteristics and sources of fine organic aerosol over a big semi-arid urban city of western India using HR-ToF-AMS. Atmos. Environ. 2019, 208, 103–112. [Google Scholar] [CrossRef]
  7. Vadrevu, K.P.; Lasko, K.; Giglio, L.; Schroeder, W.; Biswas, S.; Justice, C. Trends in Vegetation fires in South and Southeast Asian Countries. Sci. Rep. 2019, 9, 7422. [Google Scholar] [CrossRef]
  8. Van Leeuwen, T.T.; Van Der Werf, G.R. Spatial and temporal variability in the ratio of trace gases emitted from biomass burning. Atmos. Chem. Phys. 2011, 11, 3611–3629. [Google Scholar] [CrossRef]
  9. Wang, Y.; Lu, C.; Niu, S.; Lv, J.; Jia, X.; Xu, X.; Xue, Y.; Zhu, L.; Yan, S. Diverse Dispersion Effects and Parameterization of Relative Dispersion in Urban Fog in Eastern China. J. Geophys. Res. Atmos. 2023, 128, e2022JD037514. [Google Scholar] [CrossRef]
  10. Yin, L.; Wang, L.; Huang, W.; Tian, J.; Liu, S.; Yang, B.; Zheng, W. Haze Grading Using the Convolutional Neural Networks. Atmosphere 2022, 13, 522. [Google Scholar] [CrossRef]
  11. Johnston, F.H.; Henderson, S.B.; Chen, Y.; Randerson, J.T.; Marlier, M.; DeFries, R.S.; Kinney, P.; Bowman, D.M.J.S.; Brauer, M. Estimated global mortality attributable to smoke from landscape fires. Environ. Health Perspect. 2012, 120, 695–701. [Google Scholar] [CrossRef] [PubMed]
  12. Garra, P.; Maschowski, C.; Liaud, C.; Dieterlen, A.; Trouvé, G.; Le Calvé, S.; Jaffrezo, J.L.; Leyssens, G.; Schönnenbeck, C.; Kohler, S.; et al. Fluorescence Microscopy Analysis of Particulate Matter from Biomass Burning: Polyaromatic Hydrocarbons as Main Contributors. Aerosol Sci. Technol. 2015, 49, 1160–1169. [Google Scholar] [CrossRef]
  13. Kaivosoja, T.; Jalava, P.I.; Lamberg, H.; Virén, A.; Tapanainen, M.; Torvela, T.; Tapper, U.; Sippula, O.; Tissari, J.; Hillamo, R.; et al. Comparison of emissions and toxicological properties of fine particles from wood and oil boilers in small (20-25 kW) and medium (5-10 MW) scale. Atmos. Environ. 2013, 77, 193–201. [Google Scholar] [CrossRef]
  14. Bond, T.C.; Doherty, S.J.; Fahey, D.W.; Forster, P.M.; Berntsen, T.; Deangelo, B.J.; Flanner, M.G.; Ghan, S.; Kärcher, B.; Koch, D.; et al. Bounding the role of black carbon in the climate system: A scientific assessment. J. Geophys. Res. Atmos. 2013, 118, 5380–5552. [Google Scholar] [CrossRef]
  15. Dumka, U.C.; Kaskaoutis, D.G.; Tiwari, S.; Safai, P.D.; Attri, S.D.; Soni, V.K.; Singh, N.; Mihalopoulos, N. Assessment of biomass burning and fossil fuel contribution to black carbon concentrations in Delhi during winter. Atmos. Environ. 2018, 194, 93–109. [Google Scholar] [CrossRef]
  16. Ramanathan, V.; Carmichael, G. Global and regional climate changes due to black carbon. Nat. Geosci. 2008, 1, 221–227. [Google Scholar] [CrossRef]
  17. Venkataraman, C.; Habib, G.; Eiguren-Fernandez, A.; Miguel, A.H.; Friedlander, S.K. Residential biofuels in South Asia: Carbonaceous aerosol emissions and climate impacts. Science 2005, 307, 1454–1456. [Google Scholar] [CrossRef]
  18. Pani, S.K.; Lin, N.H.; Chantara, S.; Wang, S.H.; Khamkaew, C.; Prapamontol, T.; Janjai, S. Radiative response of biomass-burning aerosols over an urban atmosphere in northern peninsular Southeast Asia. Sci. Total Environ. 2018, 633, 892–911. [Google Scholar] [CrossRef]
  19. Ban, Y.; Liu, X.; Yin, Z.; Li, X.; Yin, L.; Zheng, W. Effect of urbanization on aerosol optical depth over Beijing: Land use and surface temperature analysis. Urban Clim. 2023, 51, 101655. [Google Scholar] [CrossRef]
  20. Kumar, R.; Naja, M.; Satheesh, S.K.; Ojha, N.; Joshi, H.; Sarangi, T.; Pant, P.; Dumka, U.C.; Hegde, P.; Venkataramani, S. Influences of the springtime northern Indian biomass burning over the central Himalayas. J. Geophys. Res. Atmos. 2011, 116, 1–14. [Google Scholar] [CrossRef]
  21. Dumka, U.C.; Kaskaoutis, D.G.; Francis, D.; Chaboureau, J.P.; Rashki, A.; Tiwari, S.; Singh, S.; Liakakou, E.; Mihalopoulos, N. The Role of the Intertropical Discontinuity Region and the Heat Low in Dust Emission and Transport Over the Thar Desert, India: A Premonsoon Case Study. J. Geophys. Res. Atmos. 2019, 124, 13197–13219. [Google Scholar] [CrossRef]
  22. Shukla, A.K.; Lalchandani, V.; Bhattu, D.; Dave, J.S.; Rai, P.; Thamban, N.M.; Mishra, S.; Gaddamidi, S.; Tripathi, N.; Vats, P.; et al. Real-time quantification and source apportionment of fine particulate matter including organics and elements in Delhi during summertime. Atmos. Environ. 2021, 261, 118598. [Google Scholar] [CrossRef]
  23. Tiwari, S.; Srivastava, A.K.; Singh, A.K.; Singh, S. Identification of aerosol types over Indo-Gangetic Basin: Implications to optical properties and associated radiative forcing. Environ. Sci. Pollut. Res. 2015, 22, 12246–12260. [Google Scholar] [CrossRef] [PubMed]
  24. Nair Jayachandran, V.; Nair Suresh Babu, S.; Vaishya, A.; Gogoi, M.M.; Nair, V.S.; Krishnakumari Satheesh, S.; Krishna Moorthy, K. Altitude profiles of cloud condensation nuclei characteristics across the Indo-Gangetic Plain prior to the onset of the Indian summer monsoon. Atmos. Chem. Phys. 2020, 20, 561–576. [Google Scholar] [CrossRef]
  25. Sarkar, A.; Panda, J.; Kant, S.; Mukherjee, A. Influence of smoke aerosols on low-level clouds over the Indian region during winter. Atmos. Res. 2022, 278, 106358. [Google Scholar] [CrossRef]
  26. Spracklen, D.V.; Carslaw, K.S.; Pöschl, U.; Rap, A.; Forster, P.M. Global cloud condensation nuclei influenced by carbonaceous combustion aerosol. Atmos. Chem. Phys. 2011, 11, 9067–9087. [Google Scholar] [CrossRef]
  27. Dumka, U.C.; Kaskaoutis, D.G.; Devara, P.C.S.; Kumar, R.; Kumar, S.; Tiwari, S.; Gerasopoulos, E.; Mihalopoulos, N. Year-long variability of the fossil fuel and wood burning black carbon components at a rural site in southern Delhi outskirts. Atmos. Res. 2019, 216, 11–25. [Google Scholar] [CrossRef]
  28. Kalita, G.; Kunchala, R.K.; Fadnavis, S.; Kaskaoutis, D.G. Long term variability of carbonaceous aerosols over Southeast Asia via reanalysis: Association with changes in vegetation cover and biomass burning. Atmos. Res. 2020, 245, 105064. [Google Scholar] [CrossRef]
  29. Lawrence, M.G.; Lelieveld, J. Atmospheric pollutant outflow from southern Asia: A review. Atmos. Chem. Phys. 2010, 10, 11017–11096. [Google Scholar] [CrossRef]
  30. Lu, Z.; Zhang, Q.; Streets, D.G. Sulfur dioxide and primary carbonaceous aerosol emissions in China and India, 1996–2010. Atmos. Chem. Phys. 2011, 11, 9839–9864. [Google Scholar] [CrossRef]
  31. Ojha, N.; Sharma, A.; Kumar, M.; Girach, I.; Ansari, T.U.; Sharma, S.K.; Singh, N.; Pozzer, A.; Gunthe, S.S. On the widespread enhancement in fine particulate matter across the Indo-Gangetic Plain towards winter. Sci. Rep. 2020, 10, 5862. [Google Scholar] [CrossRef] [PubMed]
  32. Pani, S.K.; Chantara, S.; Khamkaew, C.; Lee, C.T.; Lin, N.H. Biomass burning in the northern peninsular Southeast Asia: Aerosol chemical profile and potential exposure. Atmos. Res. 2019, 224, 180–195. [Google Scholar] [CrossRef]
  33. Thomas, A.; Sarangi, C.; Kanawade, V.P. Recent Increase in Winter Hazy Days over Central India and the Arabian Sea. Sci. Rep. 2019, 9, 1–10. [Google Scholar] [CrossRef] [PubMed]
  34. Kaskaoutis, D.G.; Kumar, S.; Sharma, D.; Singh, R.P.; Kharol, S.K.; Sharma, M.; Singh, A.K.; Singh, S.; Singh, A.; Singh, D. Effects of crop residue burning on aerosol properties, plume characteristics, and long-range transport over northern India. J. Geophys. Res. 2014, 119, 5424–5444. [Google Scholar] [CrossRef]
  35. Lakshmi, N.B.; Babu, S.S.; Nair, V.S. Recent Regime Shifts in Mineral Dust Trends over South Asia from Long-Term CALIPSO Observations. IEEE Trans. Geosci. Remote Sens. 2019, 57, 4485–4489. [Google Scholar] [CrossRef]
  36. Pandey, S.K.; Vinoj, V.; Landu, K.; Babu, S.S. Declining pre-monsoon dust loading over South Asia: Signature of a changing regional climate. Sci. Rep. 2017, 7, 16062. [Google Scholar] [CrossRef]
  37. Giglio, L.; Descloitres, J.; Justice, C.O.; Kaufman, Y.J. An enhanced contextual fire detection algorithm for MODIS. Remote Sens. Environ. 2003, 87, 273–282. [Google Scholar] [CrossRef]
  38. Giglio, L.; Schroeder, W.; Justice, C.O. The collection 6 MODIS active fire detection algorithm and fire products. Remote Sens. Environ. 2016, 178, 31–41. [Google Scholar] [CrossRef]
  39. Ningombam, S.S.; Dumka, U.C.; Srivastava, A.K.; Song, H.J. Optical and physical properties of aerosols during active fire events occurring in the Indo-Gangetic Plains: Implications for aerosol radiative forcing. Atmos. Environ. 2020, 223, 117225. [Google Scholar] [CrossRef]
  40. Dumka, U.C.; Kosmopoulos, P.G.; Patel, P.N. Can Forest Fires Be an Important Factor in the Reduction in Solar Power Production in India? Remote Sens. 2022, 14, 549. [Google Scholar] [CrossRef]
  41. Omar, A.H.; Winker, D.M.; Vaughan, M.A.; Hu, Y.; Trepte, C.R.; Ferrare, R.A.; Lee, K.P.; Hostetler, C.A.; Kittaka, C.; Rogers, R.; et al. The CALIPSO Automated Aerosol Classification and Lidar Ratio Selection Algorithm. J. Atmos. Ocean. Technol. 2009, 26, 1994–2014. [Google Scholar] [CrossRef]
  42. Winker, D.M.; Hunt, W.H.; McGill, M.J. Initial performance assessment of CALIOP. Geophys. Res. Lett. 2007, 34, L19803. [Google Scholar] [CrossRef]
  43. Kim, M.H.; Omar, A.H.; Tackett, J.L.; Vaughan, M.A.; Winker, D.M.; Trepte, C.R.; Hu, Y.; Liu, Z.; Poole, L.R.; Pitts, M.C.; et al. The CALIPSO version 4 automated aerosol classification and lidar ratio selection algorithm. Atmos. Meas. Tech. 2018, 11, 6107–6135. [Google Scholar] [CrossRef] [PubMed]
  44. Buchard, V.; Randles, C.A.; da Silva, A.M.; Darmenov, A.; Colarco, P.R.; Govindaraju, R.; Ferrare, R.; Hair, J.; Beyersdorf, A.J.; Ziemba, L.D.; et al. The MERRA-2 Aerosol Reanalysis, 1980 Onward. Part II: Evaluation and Case Studies. J. Clim. 2017, 30, 6851–6872. [Google Scholar] [CrossRef] [PubMed]
  45. Gelaro, R.; McCarty, W.; Suárez, M.J.; Todling, R.; Molod, A.; Takacs, L.; Randles, C.A.; Darmenov, A.; Bosilovich, M.G.; Reichle, R.; et al. The modern-era retrospective analysis for research and applications, version 2 (MERRA-2). J. Clim. 2017, 30, 5419–5454. [Google Scholar] [CrossRef]
  46. Khanal, S.; Pokhrel, R.P.; Pokharel, B.; Becker, S.; Giri, B.; Adhikari, L.; LaPlante, M.D. An episode of transboundary air pollution in the central Himalayas during agricultural residue burning season in North India. Atmos. Pollut. Res. 2022, 13, 101270. [Google Scholar] [CrossRef]
  47. Navinya, C.D.; Vinoj, V.; Pandey, S.K. Evaluation of pm2.5 surface concentrations simulated by nasa’s merra version 2 aerosol reanalysis over india and its relation to the air quality index. Aerosol Air Qual. Res. 2020, 20, 1329–1339. [Google Scholar] [CrossRef]
  48. Randles, C.A.; da Silva, A.M.; Buchard, V.; Colarco, P.R.; Darmenov, A.; Govindaraju, R.; Smirnov, A.; Holben, B.; Ferrare, R.; Hair, J.; et al. The MERRA-2 aerosol reanalysis, 1980 onward. Part I: System description and data assimilation evaluation. J. Clim. 2017, 30, 6823–6850. [Google Scholar] [CrossRef] [PubMed]
  49. Becker, S.; Sapkota, R.P.; Pokharel, B.; Adhikari, L.; Pokhrel, R.P.; Khanal, S.; Giri, B. Particulate matter variability in Kathmandu based on in-situ measurements, remote sensing, and reanalysis data. Atmos. Res. 2021, 258, 105623. [Google Scholar] [CrossRef]
  50. Buchard, V.; da Silva, A.M.; Randles, C.A.; Colarco, P.; Ferrare, R.; Hair, J.; Hostetler, C.; Tackett, J.; Winker, D. Evaluation of the surface PM2.5 in Version 1 of the NASA MERRA Aerosol Reanalysis over the United States. Atmos. Environ. 2016, 125, 100–111. [Google Scholar] [CrossRef]
  51. He, L.; Lin, A.; Chen, X.; Zhou, H.; Zhou, Z.; He, P. Assessment of MERRA-2 Surface PM2.5 over the Yangtze River Basin: Ground-based verification, spatiotemporal distribution and meteorological dependence. Remote Sens. 2019, 11, 460. [Google Scholar] [CrossRef]
  52. Khatri, P.; Hayasaka, T.; Holben, B.; Tripathi, S.N.; Misra, P.; Patra, P.K.; Hayashida, S.; Dumka, U.C. Aerosol Loading and Radiation Budget Perturbations in Densely Populated and Highly Polluted Indo-Gangetic Plain by COVID-19: Influences on Cloud Properties and Air Temperature. Geophys. Res. Lett. 2021, 48, e2021GL093796. [Google Scholar] [CrossRef] [PubMed]
  53. Chow, J.C.; Lowenthal, D.H.; Chen, L.W.A.; Wang, X.; Watson, J.G. Mass reconstruction methods for PM2.5: A review. Air Qual. Atmos. Health 2015, 8, 243–263. [Google Scholar] [CrossRef] [PubMed]
  54. Hand, J.L.; Schichtel, B.A.; Malm, W.C.; Frank, N.H. Spatial and temporal trends in PM2.5 organic and elemental carbon across the United States. Adv. Meteorol. 2013, 2013, 367674. [Google Scholar] [CrossRef]
  55. Ukhov, A.; Mostamandi, S.; Da Silva, A.; Flemming, J.; Alshehri, Y.; Shevchenko, I.; Stenchikov, G. Assessment of natural and anthropogenic aerosol air pollution in the Middle East using MERRA-2, CAMS data assimilation products, and high-resolution WRF-Chem model simulations. Atmos. Chem. Phys. 2020, 20, 9281–9310. [Google Scholar] [CrossRef]
  56. Ukhov, A.; Mostamandi, S.; Krotkov, N.; Flemming, J.; da Silva, A.; Li, C.; Fioletov, V.; McLinden, C.; Anisimov, A.; Alshehri, Y.M.; et al. Study of SO2 Pollution in the Middle East Using MERRA-2, CAMS Data Assimilation Products, and High-Resolution WRF-Chem Simulations. J. Geophys. Res. Atmos. 2020, 125, e2019JD031993. [Google Scholar] [CrossRef]
  57. Inness, A.; Ades, M.; Agustí-Panareda, A.; Barr, J.; Benedictow, A.; Blechschmidt, A.M.; Jose Dominguez, J.; Engelen, R.; Eskes, H.; Flemming, J.; et al. The CAMS reanalysis of atmospheric composition. Atmos. Chem. Phys. 2019, 19, 3515–3556. [Google Scholar] [CrossRef]
  58. Morcrette, J.J.; Boucher, O.; Jones, L.; Salmond, D.; Bechtold, P.; Beljaars, A.; Benedetti, A.; Bonet, A.; Kaiser, J.W.; Razinger, M.; et al. Aerosol analysis and forecast in the european centre for medium-range weather forecasts integrated forecast system: Forward modeling. J. Geophys. Res. Atmos. 2009, 114, 1–17. [Google Scholar] [CrossRef]
  59. Bilal, M.; Mhawish, A.; Nichol, J.E.; Qiu, Z.; Nazeer, M.; Ali, M.A.; de Leeuw, G.; Levy, R.C.; Wang, Y.; Chen, Y.; et al. Air pollution scenario over Pakistan: Characterization and ranking of extremely polluted cities using long-term concentrations of aerosols and trace gases. Remote Sens. Environ. 2021, 264, 112617. [Google Scholar] [CrossRef]
  60. Emde, C.; Buras-Schnell, R.; Kylling, A.; Mayer, B.; Gasteiger, J.; Hamann, U.; Kylling, J.; Richter, B.; Pause, C.; Dowling, T.; et al. The libRadtran software package for radiative transfer calculations (version 2.0.1). Geosci. Model Dev. 2016, 9, 1647–1672. [Google Scholar] [CrossRef]
  61. Mayer, B.; Kylling, A. Technical note: The libRadtran software package for radiative transfer calculations—Description and examples of use. Atmos. Chem. Phys. 2005, 5, 1855–1877. [Google Scholar] [CrossRef]
  62. Kosmopoulos, P.G.; Kazadzis, S.; Taylor, M.; Raptis, P.I.; Keramitsoglou, I.; Kiranoudis, C.; Bais, A.F. Assessment of surface solar irradiance derived from real-time modelling techniques and verification with ground-based measurements. Atmos. Meas. Tech. 2018, 11, 907–924. [Google Scholar] [CrossRef]
  63. Dumka, U.C.; Kosmopoulos, P.G.; Ningombam, S.S.; Masoom, A. Impact of Aerosol and Cloud on the Solar Energy Potential over the Central Gangetic Himalayan Region. Remote Sens. 2021, 13, 3248. [Google Scholar] [CrossRef]
  64. Masoom, A.; Kosmopoulos, P.; Bansal, A.; Kazadzis, S. Solar energy estimations in india using remote sensing technologies and validation with sun photometers in urban areas. Remote Sens. 2020, 12, 254. [Google Scholar] [CrossRef]
  65. Masoom, A.; Kosmopoulos, P.; Kashyap, Y.; Kumar, S.; Bansal, A. Rooftop photovoltaic energy production management in india using earth-observation data and modeling techniques. Remote Sens. 2020, 12, 1921. [Google Scholar] [CrossRef]
  66. Wani, M.A.; Mishra, A.K.; Sharma, S.; Mayer, I.A.; Ahmad, M. Source profiling of air pollution and its association with acute respiratory infections in the Himalayan-bound region of India. Environ. Sci. Pollut. Res. 2021, 28, 68600–68614. [Google Scholar] [CrossRef]
  67. Mhawish, A.; Sarangi, C.; Babu, P.; Kumar, M.; Bilal, M.; Qiu, Z. Remote Sensing of Environment Observational evidence of elevated smoke layers during crop residue burning season over Delhi: Potential implications on associated heterogeneous PM 2.5 enhancements. Remote Sens. Environ. 2022, 280, 113167. [Google Scholar] [CrossRef]
  68. Chen, J.; Liu, Z.; Yin, Z.; Liu, X.; Li, X.; Yin, L.; Zheng, W. Predict the effect of meteorological factors on haze using BP neural network. Urban Clim. 2023, 51, 101630. [Google Scholar] [CrossRef]
  69. Yin, L.; Wang, L.; Huang, W.; Liu, S.; Yang, B.; Zheng, W. Spatiotemporal Analysis of Haze in Beijing Based on the Multi-Convolution Model. Atmosphere 2021, 12, 1408. [Google Scholar] [CrossRef]
  70. Dumka, U.C.; Tiwari, S.; Kaskaoutis, D.G.; Hopke, P.K.; Singh, J.; Srivastava, A.K.; Bisht, D.S.; Attri, S.D.; Tyagi, S.; Misra, A.; et al. Assessment of PM2.5 chemical compositions in Delhi: Primary vs secondary emissions and contribution to light extinction coefficient and visibility degradation. J. Atmos. Chem. 2017, 74, 423–450. [Google Scholar] [CrossRef]
  71. Rana, A.; Dey, S.; Rawat, P.; Mukherjee, A.; Mao, J.; Jia, S.; Khillare, P.S.; Yadav, A.K.; Sarkar, S. Optical properties of aerosol brown carbon (BrC) in the eastern Indo-Gangetic Plain. Sci. Total Environ. 2020, 716, 137102. [Google Scholar] [CrossRef]
  72. Rana, A.; Jia, S.; Sarkar, S. Black carbon aerosol in India: A comprehensive review of current status and future prospects. Atmos. Res. 2019, 218, 207–230. [Google Scholar] [CrossRef]
  73. Bikkina, P.; Bikkina, S.; Kawamura, K.; Sudheer, A.K.; Mahesh, G.; Kumar, S.K. Evidence for brown carbon absorption over the Bay of Bengal during the southwest monsoon season: A possible oceanic source. Environ. Sci. Process. Impacts 2020, 22, 1743–1758. [Google Scholar] [CrossRef]
  74. Dey, S.; Choudhary, R.K.; Upadhyay, A.; Dash, S.K. Aerosol-modulated heat stress in the present and future climate of India. Environ. Res. Lett. 2021, 16, 124022. [Google Scholar] [CrossRef]
  75. Srinivas, B.; Sarin, M.M. Brown carbon in atmospheric outflow from the Indo-Gangetic Plain: Mass absorption efficiency and temporal variability. Atmos. Environ. 2014, 89, 835–843. [Google Scholar] [CrossRef]
  76. Srinivas, B.; Sarin, M.M. PM2.5, EC and OC in atmospheric outflow from the Indo-Gangetic Plain: Temporal variability and aerosol organic carbon-to-organic mass conversion factor. Sci. Total Environ. 2014, 487, 196–205. [Google Scholar] [CrossRef]
  77. Barman, N.; Haque, M.A.; Rahman, A.K.M.F.; Khalequzzaman, M.; Mashreky, S.R. Association of biomass fuel smoke exposure and hypertension among rural women of Bangladesh: A cross-sectional study. Indian J. Public Health 2019, 63, 258–260. [Google Scholar] [CrossRef] [PubMed]
  78. Vaishya, A.; Singh, P.; Rastogi, S.; Babu, S.S. Aerosol black carbon quantification in the central Indo-Gangetic Plain: Seasonal heterogeneity and source apportionment. Atmos. Res. 2017, 185, 13–21. [Google Scholar] [CrossRef]
  79. Srinivas, B.; Rastogi, N.; Sarin, M.M.; Singh, A.; Singh, D. Mass absorption efficiency of light absorbing organic aerosols from source region of paddy-residue burning emissions in the Indo-Gangetic Plain. Atmos. Environ. 2016, 125, 360–370. [Google Scholar] [CrossRef]
  80. Ahmad, H. Library Software Awareness: A Survey of OPAC vs Card Catalogue in IIT Delhi, IIT Kanpur, and Kashmir University. DESIDOC J. Libr. Inf. Technol. 2014, 34. [Google Scholar] [CrossRef]
  81. Bhat, M.A.; Romshoo, S.A.; Beig, G. Aerosol black carbon at an urban site-Srinagar, Northwestern Himalaya, India: Seasonality, sources, meteorology and radiative forcing. Atmos. Environ. 2017, 165, 336–348. [Google Scholar] [CrossRef]
  82. Vinjamuri, K.S.; Mhawish, A.; Banerjee, T.; Sorek-Hamer, M.; Broday, D.M.; Mall, R.K.; Latif, M.T. Vertical distribution of smoke aerosols over upper Indo-Gangetic Plain. Environ. Pollut. 2020, 257, 113377. [Google Scholar] [CrossRef] [PubMed]
  83. Ramachandran, S.; Rupakheti, M.; Lawrence, M.G. Black carbon dominates the aerosol absorption over the Indo-Gangetic Plain and the Himalayan foothills. Environ. Int. 2020, 142, 105814. [Google Scholar] [CrossRef] [PubMed]
  84. Kanakidou, M.; Seinfeld, J.H.; Pandis, S.N.; Barnes, I.; Dentener, F.J.; Facchini, M.C.; Van Dingenen, R.; Ervens, B.; Nenes, A.; Nielsen, C.J.; et al. Organic aerosol and global climate modelling: A review. Atmos. Chem. Phys. 2005, 5, 1053–1123. [Google Scholar] [CrossRef]
  85. Satish, R.; Rastogi, N.; Singh, A.; Singh, D. Change in characteristics of water-soluble and water-insoluble brown carbon aerosols during a large-scale biomass burning. Environ. Sci. Pollut. Res. 2020, 27, 33339–33350. [Google Scholar] [CrossRef]
  86. Shamjad, P.M.; Satish, R.V.; Thamban, N.M.; Rastogi, N.; Tripathi, S.N. Absorbing Refractive Index and Direct Radiative Forcing of Atmospheric Brown Carbon over Gangetic Plain. ACS Earth Space Chem. 2018, 2, 31–37. [Google Scholar] [CrossRef]
  87. Singh, P.; Sarawade, P.; Adhikary, B. Carbonaceous aerosol from open burning and its impact on regional weather in South Asia. Aerosol Air Qual. Res. 2020, 20, 419–431. [Google Scholar] [CrossRef]
  88. Bosch, C.; Andersson, A.; Kirillova, E.N.; Budhavant, K.; Tiwari, S.; Praveen, P.S.; Russell, L.M.; Beres, N.D.; Ramanathan, V.; Gustafsson, Ö. Source-diagnostic dual-isotope composition and optical properties of water-soluble organic carbon and elemental carbon in the South Asian outflow intercepted over the Indian Ocean. J. Geophys. Res. 2014, 119, 11743–11759. [Google Scholar] [CrossRef]
  89. Choudhary, V.; Rajput, P.; Gupta, T. Absorption properties and forcing efficiency of light-absorbing water-soluble organic aerosols: Seasonal and spatial variability. Environ. Pollut. 2021, 272, 115932. [Google Scholar] [CrossRef]
  90. Choudhary, V.; Singh, G.K.; Gupta, T.; Paul, D. Absorption and radiative characteristics of brown carbon aerosols during crop residue burning in the source region of Indo-Gangetic Plain. Atmos. Res. 2021, 249, 105285. [Google Scholar] [CrossRef]
  91. Choudhary, V.; Rajput, P.; Singh, D.K.; Singh, A.K.; Gupta, T. Light absorption characteristics of brown carbon during foggy and non-foggy episodes over the Indo-Gangetic Plain. Atmos. Pollut. Res. 2018, 9, 494–501. [Google Scholar] [CrossRef]
  92. Kirillova, E.N.; Andersson, A.; Tiwari, S.; Srivastava, A.K.; Bisht, D.S.; Gustafsson, Ö. Water-soluble organic carbon aerosols during a full New Delhi winter: Isotope-based source apportionment and optical properties. J. Geophys. Res. 2014, 119, 3476–3485. [Google Scholar] [CrossRef]
  93. Kirillova, E.N.; Marinoni, A.; Bonasoni, P.; Vuillermoz, E.; Facchini, M.C.; Fuzzi, S.; Decesari, S. Light absorption properties of brown carbon in the high Himalayas. J. Geophys. Res. 2016, 121, 9621–9639. [Google Scholar] [CrossRef]
  94. Talukdar, S.; Tripathi, S.N.; Lalchandani, V.; Rupakheti, M.; Bhowmik, H.S.; Shukla, A.K.; Murari, V.; Sahu, R.; Jain, V.; Tripathi, N.; et al. Air pollution in new delhi during late winter: An overview of a group of campaign studies focusing on composition and sources. Atmosphere 2021, 12, 1432. [Google Scholar] [CrossRef]
  95. Tobler, A.; Bhattu, D.; Canonaco, F.; Lalchandani, V.; Shukla, A.; Thamban, N.M.; Mishra, S.; Srivastava, A.K.; Bisht, D.S.; Tiwari, S.; et al. Chemical characterization of PM2.5 and source apportionment of organic aerosol in New Delhi, India. Sci. Total Environ. 2020, 745, 140924. [Google Scholar] [CrossRef] [PubMed]
  96. Singh, R.P.; Kumar, S.; Singh, A.K. Elevated black carbon concentrations and atmospheric pollution around singrauli coal-fired thermal power plants (India) using ground and satellite data. Int. J. Environ. Res. Public Health 2018, 15, 2472. [Google Scholar] [CrossRef]
  97. Srivastava, A.K.; Mehrotra, B.J.; Singh, A.; Singh, V.; Bisht, D.S.; Tiwari, S.; Srivastava, M.K. Implications of different aerosol species to direct radiative forcing and atmospheric heating rate. Atmos. Environ. 2020, 241, 117820. [Google Scholar] [CrossRef]
  98. Gautam, R.; Hsu, N.C.; Kafatos, M. Annales Geophysicae Aerosol and rainfall variability over the Indian monsoon region: Distributions, trends and coupling. Sci. Technol. 2009, 27, 3691–3703. [Google Scholar]
  99. Chakravarty, K.; Vincent, V.; Vellore, R.; Srivastava, A.K.; Rastogi, A.; Soni, V.K. Revisiting Andhi in northern India: A case study of severe dust-storm over the urban megacity of New Delhi. Urban Clim. 2021, 37, 100825. [Google Scholar] [CrossRef]
  100. Singh, A.; Srivastava, A.K.; Pathak, V.; Shukla, A.K. Quantifying the impact of biomass burning and dust storm activities on aerosol characteristics over the Indo-Gangetic Basin. Atmos. Environ. 2022, 270, 118893. [Google Scholar] [CrossRef]
  101. Moorthy, K.K.; Babu, S.S.; Satheesh, S.K.; Srinivasan, J.; Dutt, C.B.S. Dust absorption over the “Great Indian Desert” inferred using ground-based and satellite remote sensing. J. Geophys. Res. Atmos. 2007, 112, 1–10. [Google Scholar] [CrossRef]
  102. Srivastava, S.; Kumar, M.; Singh, R.S.; Rai, B.N.; Mall, R.K.; Banerjee, T. Long-term observation of black carbon aerosols at an urban location over the central Indo-Gangetic Plain, South Asia. Atmosfera 2019, 32, 95–113. [Google Scholar] [CrossRef]
  103. Wang, X.; Wang, T.; Xu, J.; Shen, Z.; Yang, Y.; Chen, A.; Piao, S. Enhanced habitat loss of the Himalayan endemic flora driven by warming-forced upslope tree expansion. Nat. Ecol. Evol. 2022, 6, 890–899. [Google Scholar] [CrossRef]
  104. Wang, T.; Han, Y.; Huang, J.; Sun, M.; Jian, B.; Huang, Z.; Yan, H. Climatology of dust-forced radiative heating over the Tibetan Plateau and its surroundings. J. Geophys. Res. 2020, 125, e2020JD032942. [Google Scholar] [CrossRef]
  105. Malm, W.C.; Schichtel, B.A.; Pitchford, M.L. Uncertainties in PM2.5 gravimetric and speciation measurements and what we can learn from them. J. Air Waste Manag. Assoc. 2011, 61, 1131–1149. [Google Scholar] [CrossRef] [PubMed]
Figure 1. Location of pixel-wise MODIS fire counts in the northern Indian region (a); time series plot of MODIS and VIIRS fire counts (b); as well as fire radiative power (c) from January to April 2021.
Fire 06 00365 g001
Figure 2. Monthly variation in black carbon mass concentration from January to April 2021 (ad) obtained from MERRA-2 reanalysis. The star symbol corresponds to the Naitital station.
Fire 06 00365 g002
Figure 3. Spatial distribution of the monthly mean surface organic carbon mass concentration from January to April 2021 (ad), obtained from MERRA-2 reanalysis.
Fire 06 00365 g003
Figure 4. Spatial distribution of the monthly mean surface SO2 mass concentration over the Indian subcontinent from January to April 2021 (ad), obtained from MERRA-2 reanalysis.
Fire 06 00365 g004
Figure 5. Spatial distribution of the monthly mean surface dust concentration over the Indian subcontinent from January to April 2021 (ad), obtained from MERRA-2 reanalysis.
Fire 06 00365 g005
Figure 6. Monthly mean of surface PM2.5 (color plots) and 500 hPa wind (wind vectors) over the northern Indian region based on the MERRA-2 reanalysis data for January to April 2021. The wind vector of 10 m s−1 is shown at the top of each panel for reference.
Fire 06 00365 g006
Figure 7. The vertical cross-section (in pressure coordinates) of monthly mean PM2.5 (in color plots) and horizontal wind (wind barbs; in m s−1) based on the MERRA-2 reanalysis data from January to April 2021. The cross-section is along a line of constant longitude at 79.5° E between latitude 20° N and 40° N and passes over Nainital (shown in the inset plot) of the first panel. The gray-shaded region of each panel shows the surface.
Fire 06 00365 g007
Figure 8. Total attenuated backscatter coefficient at 532 nm from the CALIPSO LiDAR measurements during the night-time overpass on 5 April 2021. The inset figure shows the track of the CALIPSO pass (a). The vertical distribution of aerosol subtypes, which are depicted with different colors, from the LiDAR measurements (b). The black line indicates the surface. The red thick vertical line on the x-axis shows the location of Nainital, a remote site in the central Himalayan region.
Fire 06 00365 g008
Figure 9. Daily variation in aerosol (a) and black carbon (b) radiative forcing spatially averaged over the Indian subcontinent during January–April 2021. The gray-shaded area is the standard deviation.
Fire 06 00365 g009
Figure 10. Daily diurnal contour plot of the aerosol radiative forcing from January to April 2021 (ad).
Fire 06 00365 g010
Figure 11. Daily diurnal contour plot of BC radiative forcing from January to April 2021 (ad).
Fire 06 00365 g011
Figure 12. Monthly variation in aerosol radiative forcing over the Indian subcontinent during January–April 2021 (ad). The star symbol corresponds to the Nainital station.
Fire 06 00365 g012
Figure 13. Monthly variation in BC radiative forcing over the Indian subcontinent during January–April 2021 (ad).
Fire 06 00365 g013
Disclaimer/Publisher’s Note: The statements, opinions and data contained in all publications are solely those of the individual author(s) and contributor(s) and not of MDPI and/or the editor(s). MDPI and/or the editor(s) disclaim responsibility for any injury to people or property resulting from any ideas, methods, instructions or products referred to in the content.

