
Numerical Simulation of Downward Flame Propagation in Discontinuous Region of Solid Fuel
by
Yeming Zhu
1,
Shengfeng Luo
2,*,
Yanli Zhao
3,
Yiping Zeng
4,
Guohua Wu
4,
Ruichao Wei
5,* and
Shutang Sun
1 1
Department of Nuclear Emergency and Nuclear Safety, China Institute for Radiation Protection, Taiyuan 030006, China
2
Department of Mechanics and Aerospace Engineering, Southern University of Science and Technology, Shenzhen 518055, China
3
College of Urban Construction and Safety Engineering, Shanghai Institute of Technology, Shanghai 200093, China
4
Shenzhen Huahui Information Technology Research Co., Ltd., Shenzhen 518052, China
5
The New Energy Automotive Technology Research Institute, Shenzhen Polytechnic, Shenzhen 518055, China
*
Authors to whom correspondence should be addressed.
Fire 2023, 6(5), 207; https://doi.org/10.3390/fire6050207
Submission received: 7 April 2023
/
Revised: 11 May 2023
/
Accepted: 14 May 2023
/
Published: 17 May 2023
(This article belongs to the Special Issue Fire Numerical Simulation)
Abstract
:This paper presents a numerical model that investigates the characteristics of flow, heat, and mass transfer on downward flame propagation in the discontinuous region of solid fuel. Simulations were carried out for various discontinuous distances to analyze the morphology of the flame front and the competition between the “jump” of flame spread and heat transfer from the flame to the unburned area. The results demonstrate that there is a “jump” in the flame propagation in the discontinuous zone, with the flame front exhibiting a defined “acute angle” that undergoes a process from large to small during the flame spreading in the discontinuous area and deflects towards the discontinuous area of the material. The temperature in the discontinuous zone reaches a peak, and the average flame spread rate initially increases and then decreases with the increase of discontinuity distance until the flame spread stops. The study provides valuable insights into the growth and development of fires involving discretely distributed combustible materials.
1. Introduction
Flame propagation on solid fuels is a significant topic in combustion and fire research and has implications for fire safety and risk assessment [1,2]. Predictions of fire growth and spread rely heavily on the understanding of fire spread mechanisms on solid fuels. A number of researchers, including Wichman [2], Fernandez-Pello [2,3,4,5,6,7], Tolejko [8], T’ien [8,9], and Dl Blasi [10,11], have made contributions to the study of counterflow fire spread on solid fuels. These researchers have simplified heat transfer and flow models in the flame spread process and studied the effect of parameters such as the Lewis number and wind speed on the flame spread. Through experimental and numerical simulations, they aim to elucidate the mechanisms of temperature and concentration evolution in the gas and solid phases of the flame spread process. The combustion and flame spread conditions in real fire scenarios are highly variable, and the spread of fire on solid materials is influenced by multiple factors, including the thermal properties of the material, its dimensions, and environmental conditions. For instance, Rangwala [12] conducted combustion and flame spread experiments of PMMA plates under varying oxygen and wind speeds, using heat and mass transfer theoretical analysis to determine the mass transfer B-number and develop a pyrolysis model for the material. Jiang [13] investigated the impact of sample width and thickness on the horizontal flame spread of PMMA and proposed a modified flame spread rate prediction model. Huang [14] studied the flame spread and flame extinction characteristics of Expanded Polystyrene (EPS) through small-scale experiments and analyzed the effects of density, thickness, and angle on flame spread. The results indicated that the competition mechanism between the flame spread rate and the length of the preheating zone was the primary cause of extinction. Zhang [15] conducted research on the acceleration characteristics of flame spread in relation to specimen placement angle, and the results showed that the flame spread rate, mass loss rate, and flame area increased with increasing placement angle.
The spatial arrangement of fuels may also have an impact on flame propagation; combustible materials in fire scenes are often composed of numerous discrete or non-homogeneous fuels. It implies the importance of research on flame spread in these configurations for predicting fire growth. Youfei [16] investigated the flame spread of metal-faced EPS foam and found that the overall combustion performance was effectively suppressed by the metal panel cover. Muallemi [17,18] developed a numerical model to study the fire spread in porous media. In an experimental study of Watanabe [18], flame spread on a horizontal porous combustible filter paper was observed, and the results showed that the probability of flame passing through a slit was contingent on whether the slit length exceeded the preheating length, the flame spread rate decreasing as the slit length increased. Gollner [19] investigated the flame spread on a vertical matchstick array with experimental and numerical analysis and found that the flame spread rate was dependent on the matchstick spacing, and the flame spread rate increased with the matchstick spacing. Jiang [20] investigated the control mechanism of flame spread in an array of wooden pegs with different spacings through both experimental and theoretical analysis and found that the flame could spread vertically in all spacings, but horizontal flame spread would not continue in the case of a too-large gap. Luo [21] studied countercurrent flame spread over a discrete fuel bed using a numerical model, giving an overall relationship between countercurrent flame spread and gap size.
The study of flame propagation in discontinuous materials is crucial for understanding the growth and development of fires involving combustible materials that are not continuous. The process of spreading flame and igniting its adjacent fuel can also be regarded as the spread of flame on discontinuous materials. There are several experimental studies about the flame spread over discretely distributed combustible materials [1,22,23]. There are some simplified numerical simulations of the flame spread of discontinuous materials [21] to determine the flame spread rate. However, there is a lack of flame morphology and flow characteristics in the near discontinuous zone, which is important for understanding the fire spreading in the discontinuous zone of material.
In this paper, we present a numerical model that investigates the complex dynamics of flame propagation in solid fuel with discontinuities, which is a novel and challenging problem in the field of fire safety. Our work contributes to the understanding of heat and mass transfer, flow, and reaction, which are critical factors for fire safety. Specifically, we verified our model against previous experimental data to demonstrate its accuracy. Unlike previous studies, we focused on investigating the heat and mass transfer processes and gas flow characteristics of the flame front as it passes through the discontinuous zone. By analyzing the competition mechanism of flame “jumping” and heat transfer, we developed an explanation for the relationship between flame spread rate and discontinuity length. These findings provide a valuable framework for predicting and controlling fires involving discontinuously distributed combustible materials, which are ubiquitous in real-world scenarios. Our study’s uniqueness lies in its investigation of flame propagation in a system that is representative of real-world conditions. Therefore, this research can contribute to the development of a more efficient and accurate model for fire safety, which is of significant societal and economic importance.
2. Numerical Model
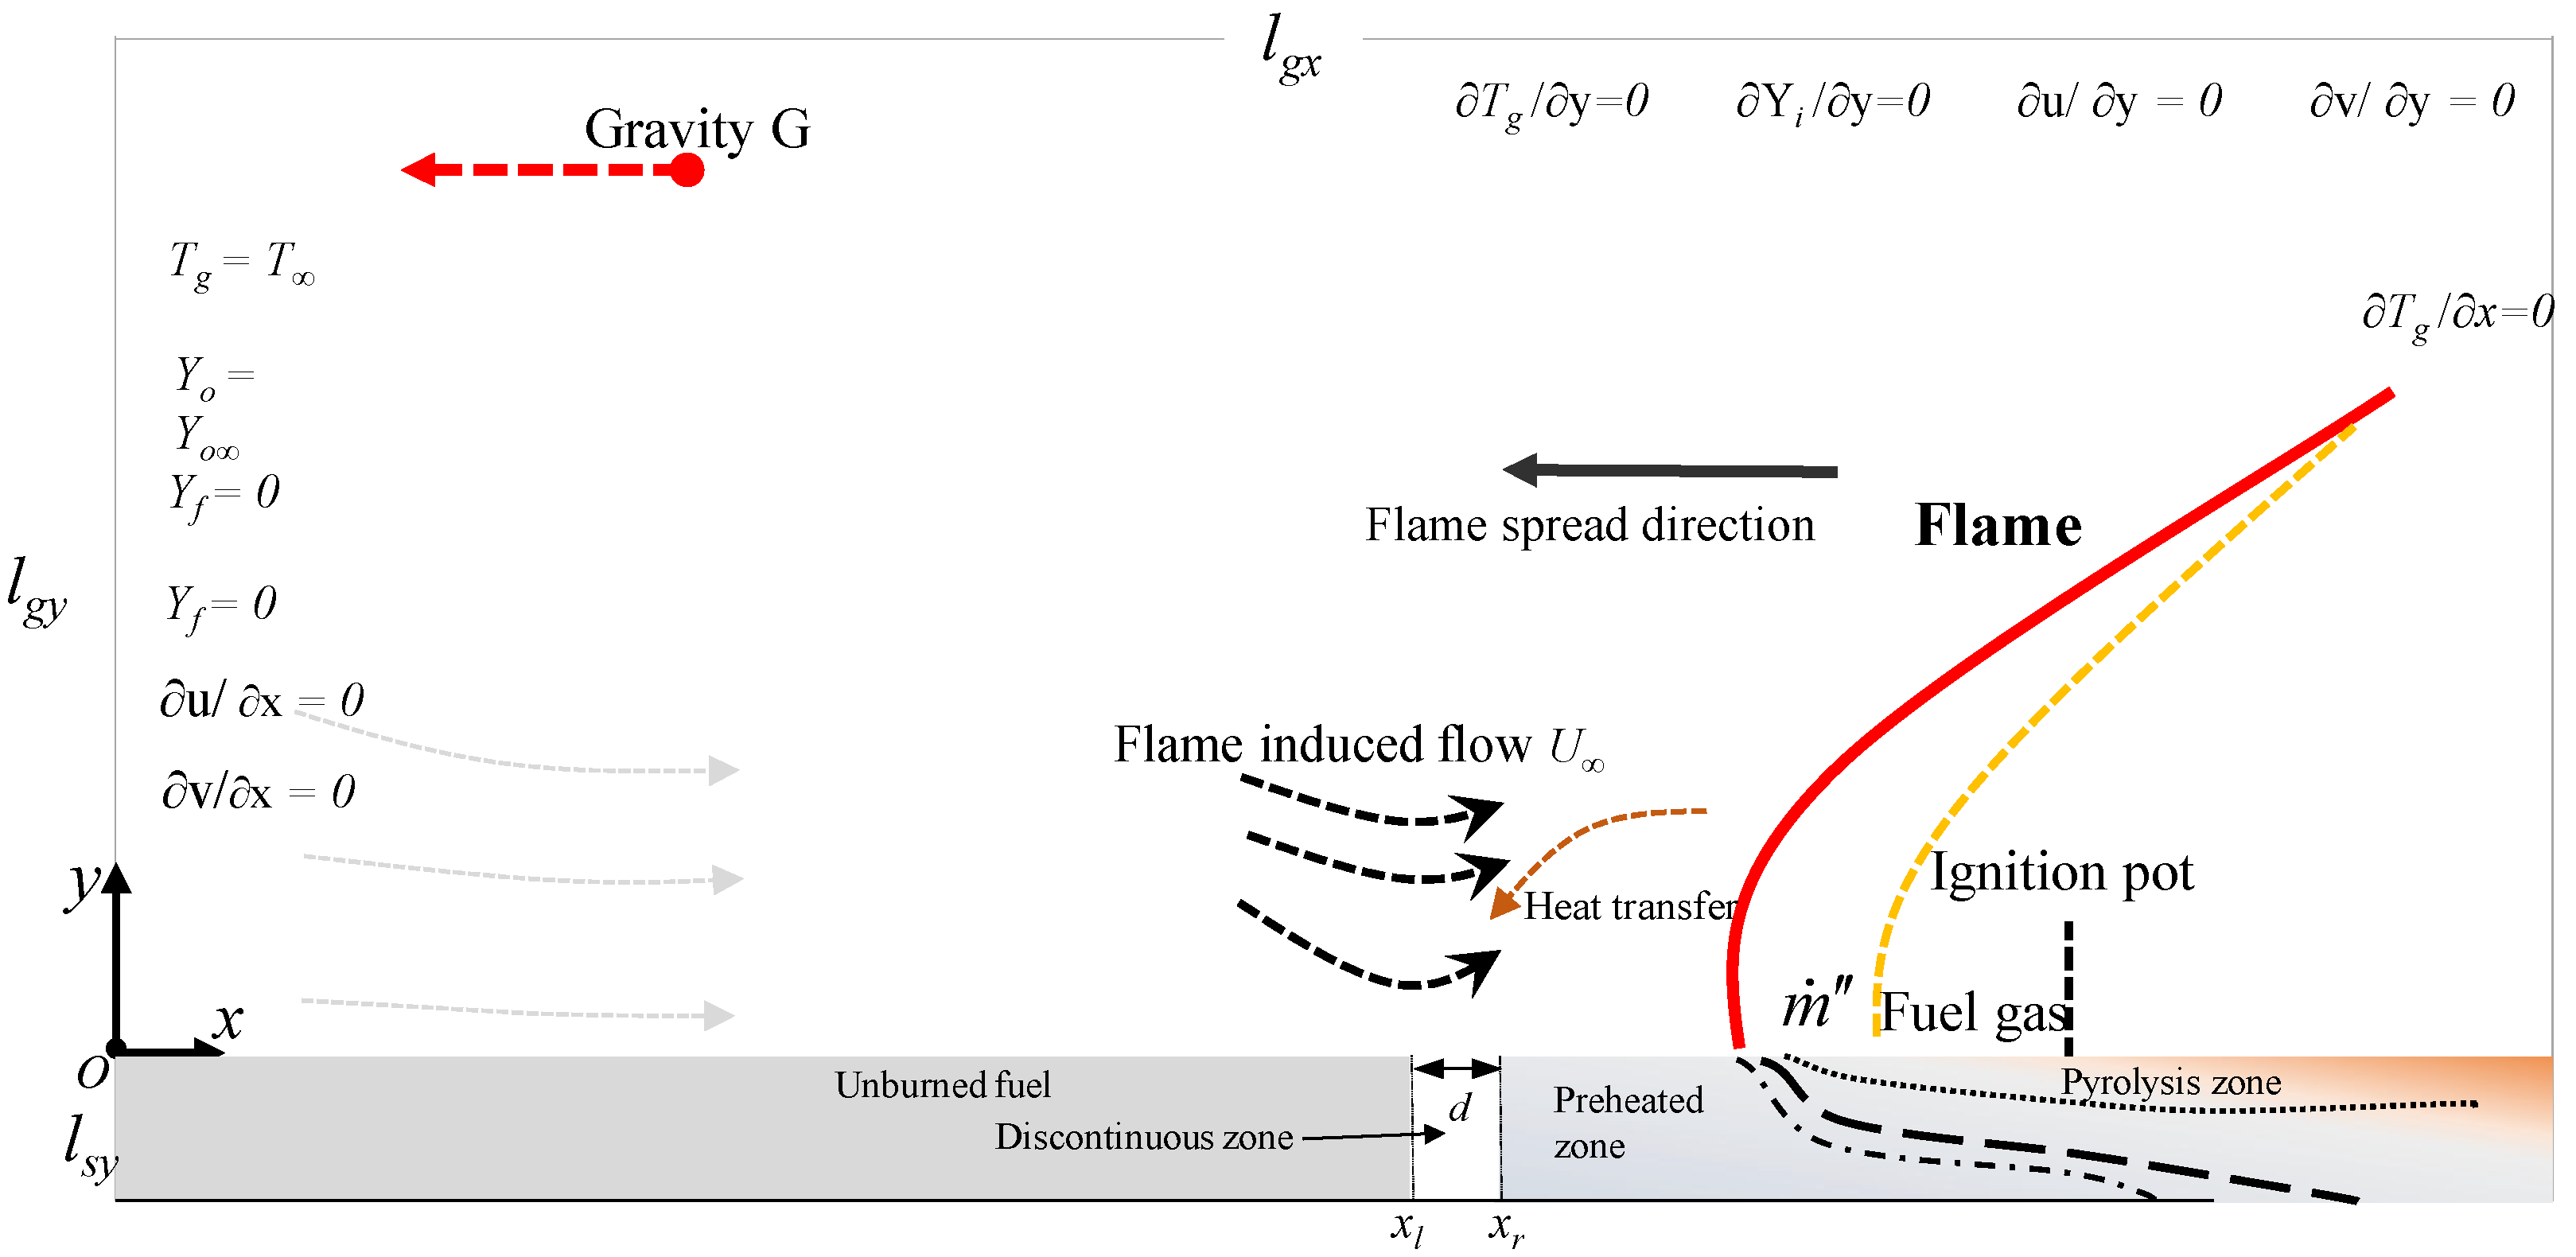
A schematic illustration of the flame spread model with a discontinuity on the material surface is depicted in Figure 1. The material is separated into two parts by the discontinuous zone with a length of d. The right side of the material is initially ignited by an external heat source, letting the flame cross the discontinuous zone through a gas-phase heat transfer and reach the left side of the material. A coordinate system is established with the left end of the material surface serving as the origin, with the x-axis parallel to the material surface and the y-axis perpendicular to the material surface. The gas-phase region is represented by y > 0, the material region by y < 0, and the interface between the gas and solid phases by y = 0. The range of x-coordinates of the discontinuous zone is xl ~ xr, where xl and xr represent the left and right boundaries of the discontinuous region, respectively, |xl − xr| = d. The model takes into account the buoyant plume effect of the flame, with gravity G considered in the negative x-direction. The length of the computational domain is lgx = 0.06 m, the height of the gas-phase region is lgy = 0.0133 m, and the thickness of the solid phase is lsy = 0.0027 m.
2.1. Solid-Phase Heat Transfer Model
The heat transfer model in the solid phase during material combustion and fire spread takes into account both heat conduction from the solid and heat absorption through material pyrolysis. This process can be represented by the solid-phase energy equation.
where T represents the temperature in the solid phase here. ρ, Cp, and ks are the material density, specific heat capacity, and heat conductivity coefficient, respectively. qc is the heat absorbed per unit mass of fuel by pyrolysis. wc indicates the reaction rate of pyrolysis of the material. In this paper, the interval distance of the discontinuous zone is small, and the flow heat transfer in the interval area is temporarily disregarded. The heat transfer process is simplified to the heat transfer of air, and the form of its temperature equation is similar to that of Equation (1), and the thermal physical parameters of Equation (1) need to be changed to the corresponding parameters of air.
Assuming that solid-phase pyrolysis can be approximated as a single-step first-order reaction, the pyrolysis reaction rate wc can be expressed as
where Ac is the exponential factor of the pyrolysis reaction, Ec is the activation energy of the pyrolysis reaction, and R is the gas constant.
The pyrolysis reaction of materials, on the one hand, produces combustible gas for gas-phase combustion; on the other hand, it causes the loss of solid materials and makes the surface of materials deform and shrink due to fuel consumption. According to previous studies [24,25] on this issue, the model is somewhat simplified here to describe the consumption process through the continuous variation of the solid density, i.e., the variation of the material density with time can be expressed as .
2.2. Gas-Phase Heat Transfer and Component Diffusion Model
The reaction between the combustible gases generated by pyrolysis and the oxygen in the incoming air, the reaction generates heat to increase the temperature of the gas, and the heat transfer from the hot gas to the fuel cause the solid to pyrolyze to maintain a continuous fuel for the material. This process is accompanied by the diffusion and convection of combustible gases and oxygen components, chemical reactions, and energy transfer processes. The rate of reaction of oxygen with combustible gases is approximated by the Arrhenius formula. For downward flame spread, due to the small radiation angle coefficient of the flame on the unburned area, the thermal radiation effect of the flame on the unburned solid can be approximately ignored [26].
The component diffusion equation for pyrolysis of combustible gases and oxygen can be expressed as [26]
Gas phase energy equation
where T represents the temperature in the solid gas phase here. Yi represents the mass fraction of fuel or oxygen, i = f represents fuel, and i = o represents oxygen. μi is the chemical equivalence ratio of oxygen to fuel for the gas-phase chemical reaction, ρg is the gas density, kg is the heat conduction diffusion coefficient. qgwg means the source term induced by the gas reaction. qg is the heat of combustion in the gas phase. wg is the rate of chemical reaction of fuel gas with oxygen, which can be approximated by the Arrhenius formula. Assuming the gas-phase reaction to be a single-step second-order irreversible reaction, the gas-phase chemical reaction rate is
where Ag is the exponential factor for the gas phase reaction, and Eg is the activation energy for the gas phase reaction.
The gas-phase velocity field (u, v) in Equations (3) and (4) is controlled by the gas flow equation. Some previous surface flame spread models usually approximate the flow of the gas phase as Oseen flow [10,25,27,28]. The solution process can be simplified by not coupling the velocity field and energy field. In the configuration considered in this work, gas-phase flow and heat transfer should be affected by the discontinuous zone, so the gas-phase flow is determined using the NS equation.
2.3. Gas-Phase Flow Model
In this paper, we consider the downward flame spread of a discontinuous solid fuel with external airflow caused by natural convection induced by a flame [26,28,29,30]. The velocity field is described by Navier Stokes (NS) equation.
where u and v are the velocity components in the x-direction parallel to the material surface and in the y-direction perpendicular to the material, respectively, μ is the air viscosity coefficient, and ρ∞ is the ambient gas density. The flow model in this paper is an incompressible flow equation at low Mach numbers, but considering the buoyancy plume caused by the gas density changing with temperature. The density in this paper is given by [31].
2.4. Boundary Conditions
The solid and gas phase models and boundary conditions are designed to address the issue of flame spread behavior in solid fuel after ignition. These computational models include both the gas and solid phases, which must be solved simultaneously to accurately capture the burning process. The solid phase model is primarily utilized to solve for the solid temperature field and obtain the pyrolysis rate of the solid fuel. The gas fuel generated by the pyrolysis reaction is then fed into the gas zone for combustion. Therefore, the boundary conditions serve to connect the solid and gas phase models and ensure their accurate and effective communication during the simulation.
(1) Boundary conditions at the interface between the gas phase and the solid phase
At the lower boundary of the gas phase, the combustible gases from the pyrolysis of the solid diffuse into the gas phase. The heat transfer at the lower boundary includes gas and solid heat transfer and radiation from the solid surface to the environment. The temperature and components boundary conditions at the gas-solid interface are [26]
where ε is the surface emission coefficient, and σ is the radiation constant. is the mass flow rate of combustible gas from the pyrolytic volatilization of the solid at the lower boundary of the gas phase. ks is the heat conduction coefficient of solid fuel. y = 0+ means the value at the interface on the gas side, and y = 0- means the value at the interface on the solid side. Due to the existence of a discontinuous zone in the solid material, the mass flow rate of combustible gas is zero in the discontinuous interval.
Assuming that all the combustible gas generated by solid pyrolysis diffuses into the gas phase through the upper boundary of the solid, the mass flow rate along the lower boundary of the gas phase can be expressed as , where lsy represents the material thickness. In practice, however, the combustible gas generated by the solid material does not immediately reach the material surface and may remain inside the solid, so the actual flow rate of combustible gas into the lower boundary of the gas phase is smaller. The mass flow rate of combustible gas at the lower boundary of the gas phase is corrected by a permeability coefficient (Ke) in the range of 0 to 1 so that the final result of is [28]
where wc is the reaction rate in solid fuel, as presented in Equation (2).
(2) Boundary conditions of the discontinuous zone in solid
The heat transfer process in the discontinuous area is simplified to the heat transfer of air. Keeping the same temperature and heat flow rate at the interface between the discontinuous zone and the combustible fuel, the corresponding boundary conditions can be deduced as
where x = xl− and x = xl+ mean the value on the left and right side of the xl interface, respectively, and x = xr− and x = xr+ mean the value on the left and right side of the xr interface, respectively.
(3) Other boundary conditions for the computational zone
The oxygen concentration in the left boundary of the gas phase is fixed and is the same as the oxygen concentration in the incoming air since the incoming oxygen enters the control region from the left boundary of the gas phase. The fuel gas concentration at the left boundary of the gas phase is set to 0. The temperatures of both the gas and solid phases at the left boundary are fixed at the ambient temperature. The other boundary of oxygen, combustible gas composition, and temperature equation are set as zero gradient boundary conditions.
2.5. Solving Method and Parameters
The physical parameters of PMMA [32] are used in the numerical model. The above partial differential equations are solved using a finite difference algorithm with a uniform orthogonal grid of 0.1 mm × 0.1 mm. The number of grids in the y-direction for the solid phase is 27 (corresponding to a thickness of 2.7 mm), the number of grids in the y-direction for the gas phase is 134, and the gas phase and the solid phase share the same grid size in the x-direction. The time step Δt is 0.2 × 10⁻⁴ s. The program flow for solving the process of solid fire propagation has been introduced and explained in detail in previous literature [26,28]. The NS equations for gas-phase flow are solved by the PISO algorithm. We set the convergence criterion for the pressure and velocity fields to 1 × 10⁻⁶ and 1 × 10⁻⁴, respectively. The algorithm terminates the PISO loop if the residual values of pressure and velocity fall below these limits. The diffusion term is in second-order central difference form, and the gas-phase flow term is in the upwind form of the fully implicit discretization method. The nonlinear chemical reaction source term in the equation is replaced by the value of the previous iteration at the same time step. The temperature gradient at the upper boundary of the solid phase is obtained according to the temperature gradient at the lower boundary of the gas phase, and then the solid-phase temperature equation is solved. After obtaining the solid-phase pyrolysis rate, the mass flow rate of the gas-phase combustible gas is then calculated for the lower boundary, and the gas-phase concentration equation is solved. The temperature of the upper boundary of the solid phase is substituted into the lower boundary of the gas phase, and the gas phase temperature equation is solved. After the above steps are iterated in the same time step, the gas-phase temperature field, concentration field, and solid-phase temperature field all reach the convergence condition, and then the solution process of the next moment proceeds. The model solutions in this paper are implemented with C++ code, and the computing computer configuration is Intel i7 2.6 GHz CPU, 32 GB RAM.
In this paper, simulations of downward flame spread were performed for discontinuous zone lengths d of 0, 0.5, 1.0, 1.5, and 2.0 mm, respectively, with a material thickness of 2.7 mm. where d = 0 mm represents a common continuous material for model validation. To realize the material ignition to stable flame spread process, a large external heat flow W/m2 needs to be set on the material surface to provide the initial ignition energy. The ignition source is set in the range of x = ~45–48 mm on the material surface, and the material is judged to have been ignited when the heat flow from the gas phase to the solid material surface at the location of the ignition source is greater than the heat flow applied by the ignition source, and the initial ignition source will be removed after successful ignition.
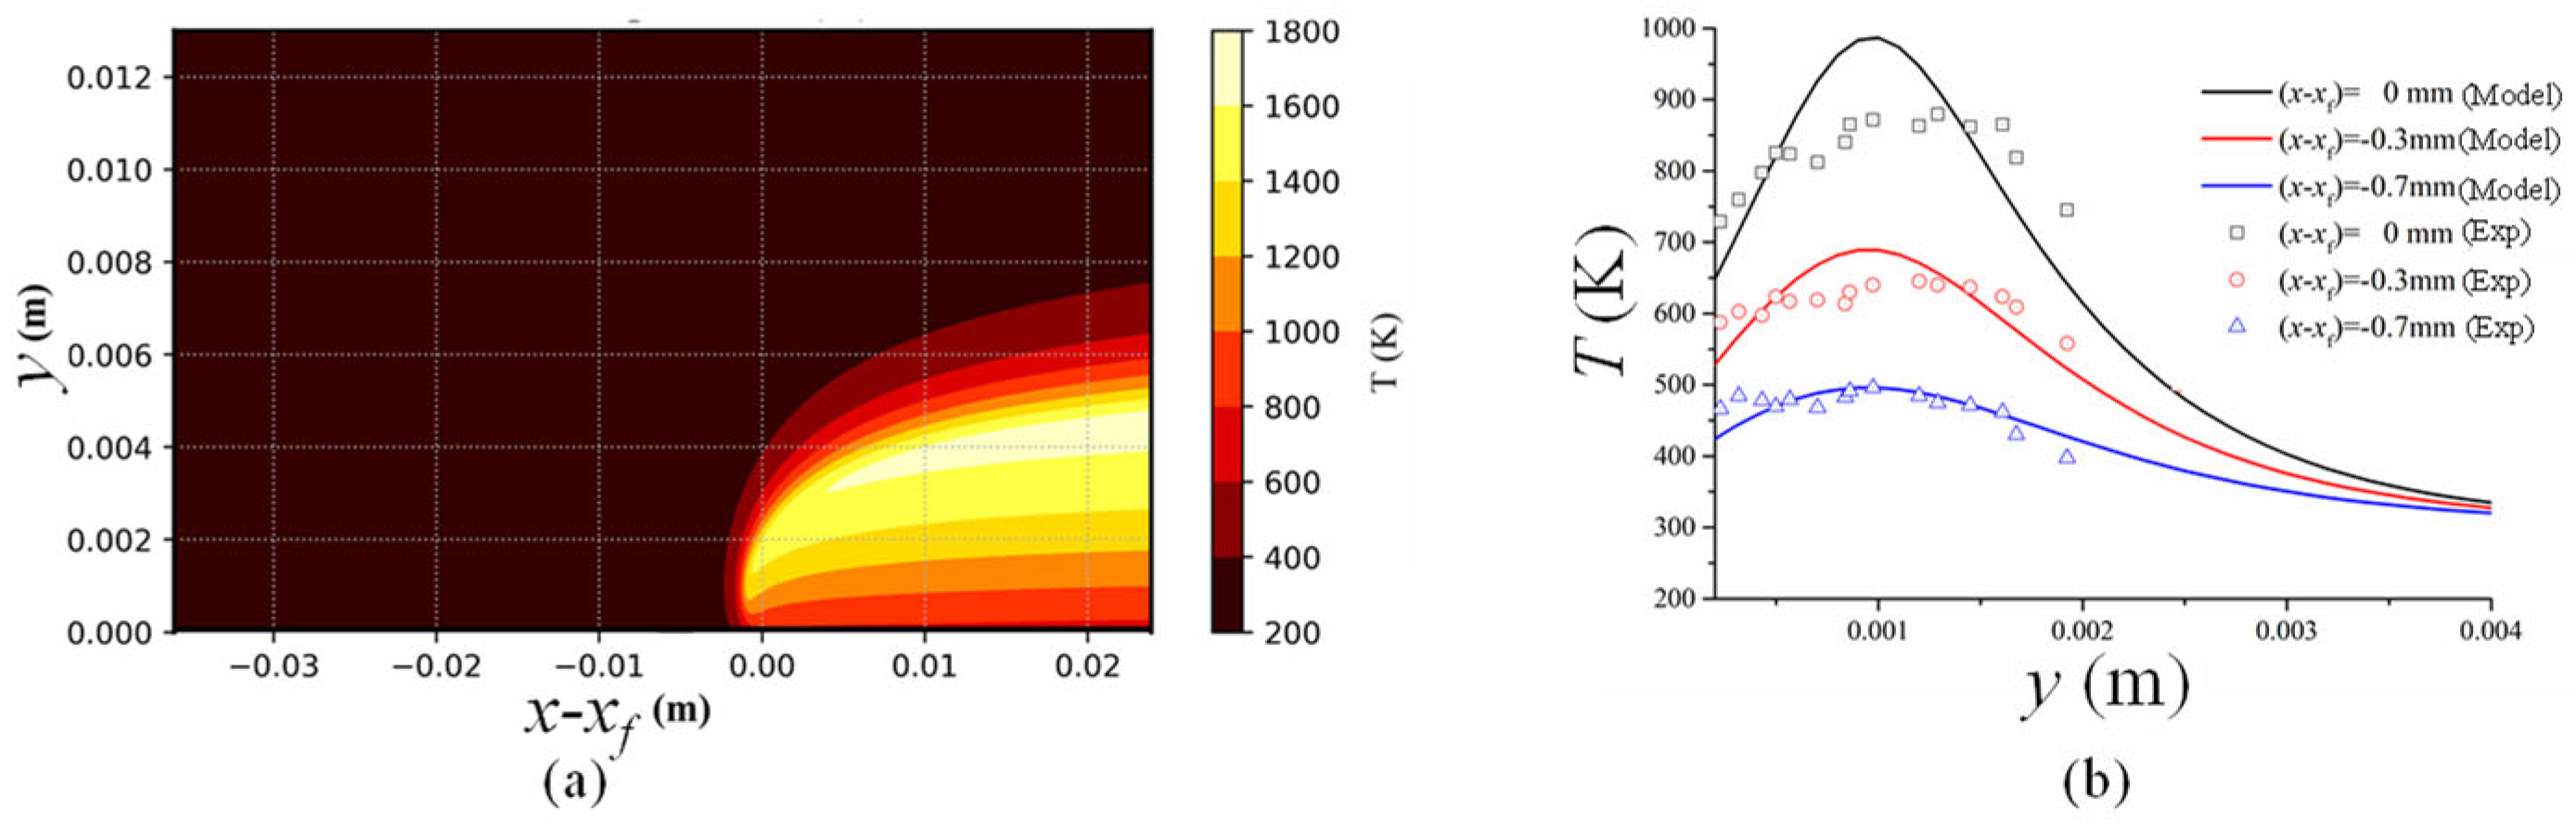
The numerical calculation of the downward flame spread of a continuous material with a thickness of 2.7 mm, which corresponds to the calculation results of the model in this paper in the case of d = 0, is carried out first. Fernandez-Pello [7] conducted an experimental study on the downward fire spread of PMMA. The comparison of the predicted gas-phase temperature field for stable flame spread with the previous experimental results is given in Figure 2, respectively. The (x − xf) = 0 in the x-axis represents the flame front position, and the flame front position xf in this paper is defined as the horizontal coordinate corresponding to the maximum temperature gradient in the direction perpendicular to the material surface.
As shown in Figure 2a, under the influence of the induced buoyancy flow, the gas diffusing from the solid phase reacts with the oxygen in the incoming gas and releases heat, forming the flame temperature field. Figure 2b shows the temperature distribution along the y direction at different distances from the flame front measured by the Fernandez-Pello experiment and the results of the model in this paper. It can be seen that the results of this paper can generally simulate the characteristics of the temperature field.
3. Results and Discussion
3.1. Temperature Field in Discontinuous Region
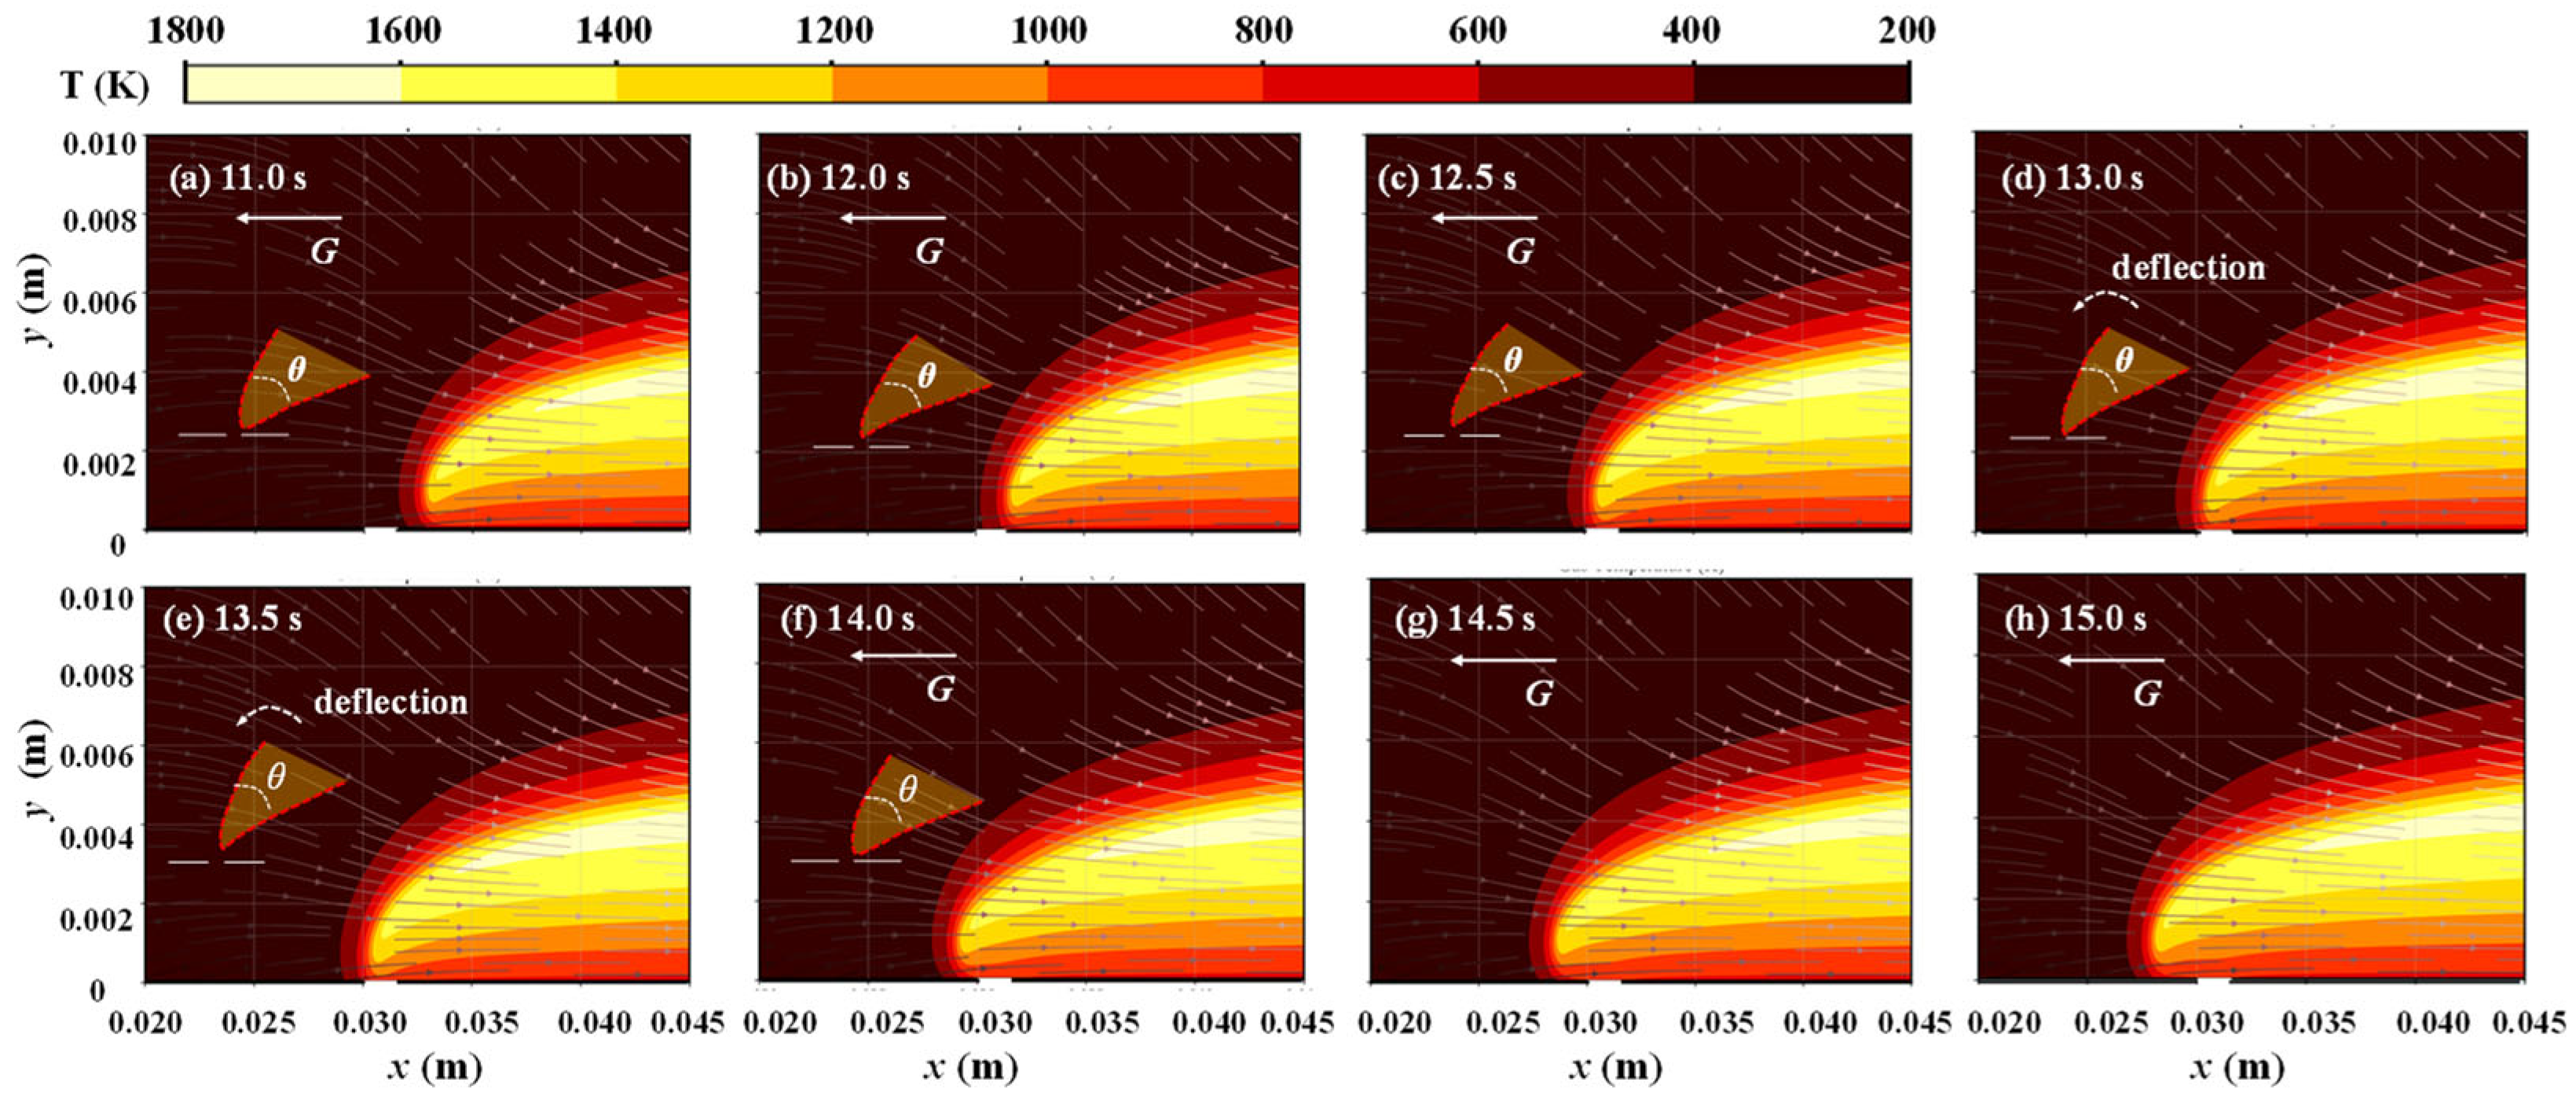
The evolution of the gas-phase temperature during flame spread near the discontinuous zone is given in Figure 3, and the flow field of the gas-phase is also given. The blank area on the x-axis in Figure 3 represents the discontinuous region, and the length of the discontinuous region of the material in Figure 3 is 1.5 mm, and the coordinate range is 0.03 to 0.0315 m. The calculation area in our study is described in detail in Section 2, and the results for the entire area are presented in Section 2.5. In Figure 3, we enlarged the temperature field and streamline characteristics near the discontinuous region in order to provide a more detailed view of the behavior in that area. The flame spreads from the position before the discontinuous zone to the discontinuous zone and finally passes through the discontinuous zone. Driven by the flame buoyancy, the airflow flows from the external environment to the flame region.
As in Figure 3, in order to quantitatively describe the flame front morphology, the high-temperature zone of the flame is defined as the region where T > 1200 K. In this paper, a morphological “acute angle” θ is used to characterize the morphology of the gas-phase high-temperature zone of the flame front. As shown in Figure 3a–c, before the flame spreads to the intermittent zone, the high-temperature zone formed by the flame front has a larger “acute angle”. When the flame spreads to the boundary position of the discontinuous zone (i.e., at 0.0315 m in the horizontal coordinate), the “acute angle” of the flame front gradually becomes smaller, which is due to the reduction of pyrolysis gas in the discontinuous zone, so that the gas-phase combustion reaction rate decreases. As in Figure 3c,d, when the flame spreads to the discontinuous zone, the flame front high-temperature zone morphology “acute angle” deflects to the negative y direction and points to the discontinuous zone of the material. When the flame front crosses the discrete interval, as shown in Figure 3e,f, the direction of the “acute angle” returns to the normal flame spreading state. Due to the influence of the discontinuous zone, the temperature field behind the flame front appears to be somewhat disturbed.
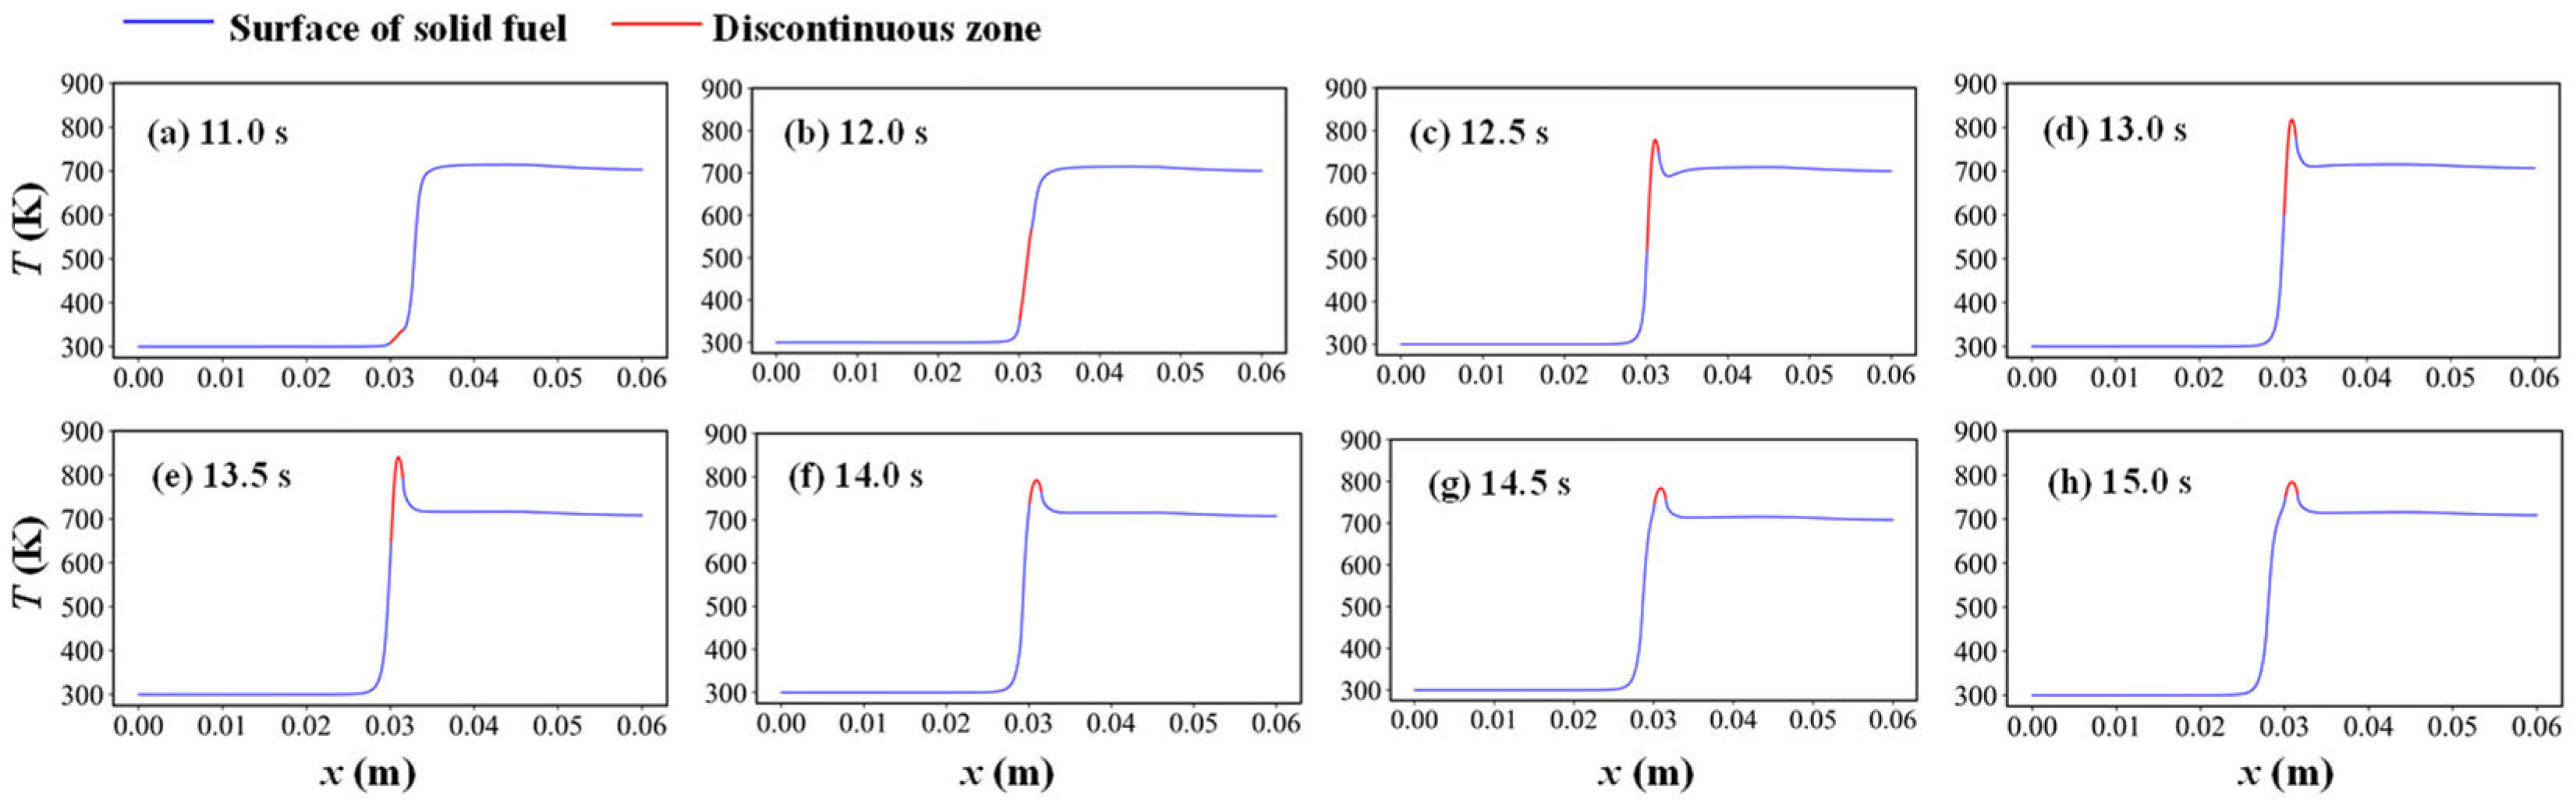
The surface temperature profiles during flame spread near the discontinuous zone are given in Figure 4, where the red segments in the curves represent the temperatures in the discontinuous zone. Figure 4a,b show the surface temperature profiles before the flame spreads to the discontinuous zone, Figure 4c,d show the surface temperature profiles when the flame spreads to the discontinuous zone, and Figure 4e,f show the surface temperature profiles of the material when the flame front crosses the discontinuous zone. It can be seen that the surface temperature of the discontinuous zone is significantly larger than the surface temperature along the combustible material. During the flame spread, the heat released in the gas-phase combustion reaction is transferred to the solid fuel, which is heated and pyrolyzed, releasing combustible fuel gas to provide the gas-phase reaction, so the temperature of the gas phase is usually higher than that of the solid material. For the discontinuous fuel considered in this paper, as described in the previous model, the thermal material properties of the discontinuous zone are the same as those of the gas phase zone, and the temperature difference between the discontinuous zone and the vicinity of the lower gas boundary should be relatively flat, i.e., the discontinuous zone is still a continuation of the gas phase zone. Therefore, there is a peak temperature in the discontinuous area of the fuel, which is higher than the temperature of the fuel surface and close to the gas temperature near the material surface. At the boundary between the discontinuous zone and the left fuel, heat will be transferred from the high temperature in the discontinuous zone to the PMMA fuel, thus accelerating the ignition process of fuel on the left side and causing a “jump” in the flame spread, as will be explained in detail in Section 3.3 of this paper.
3.2. Gas-Phase Reaction during Flame Spread in Discontinuous Region
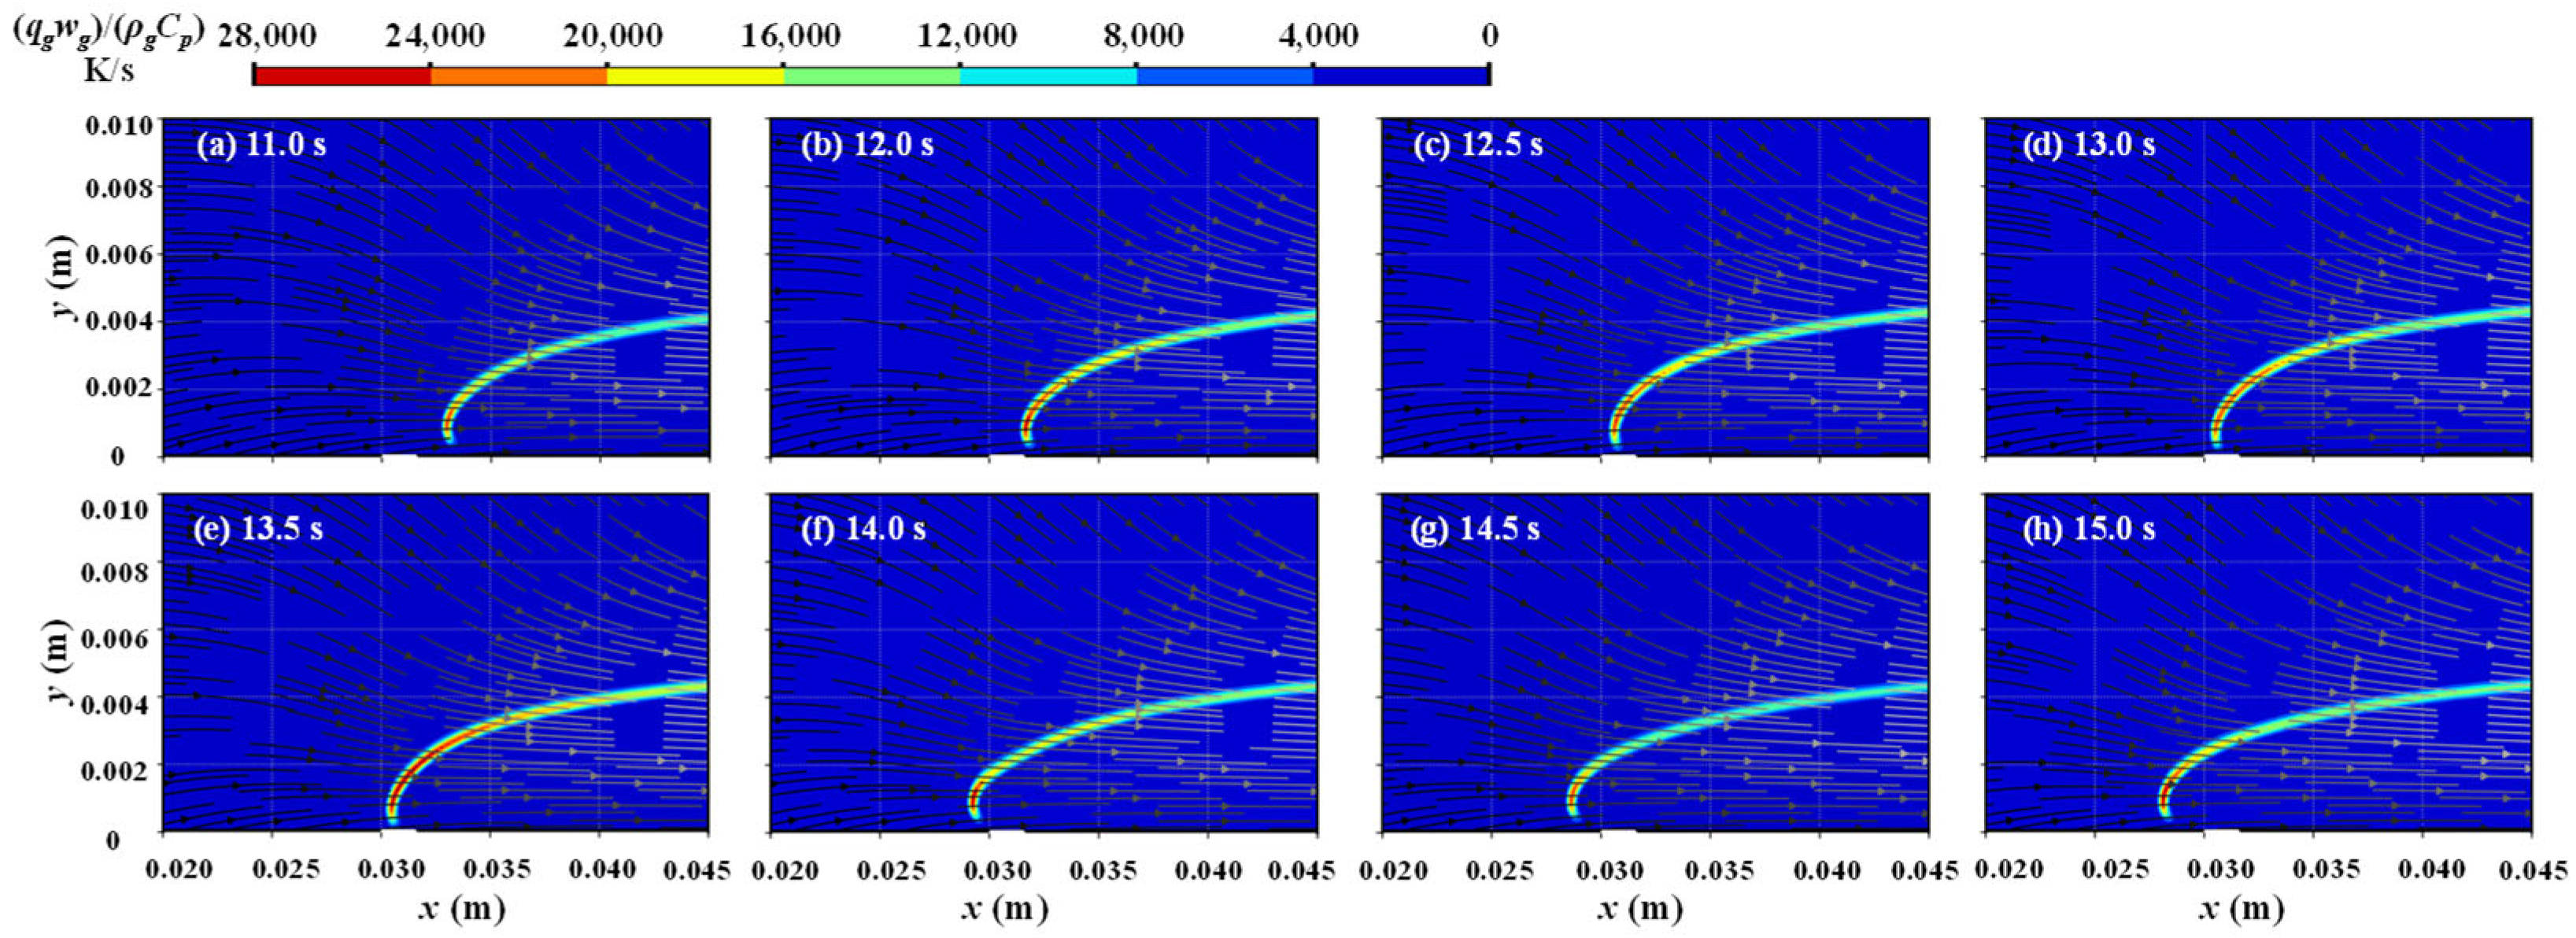
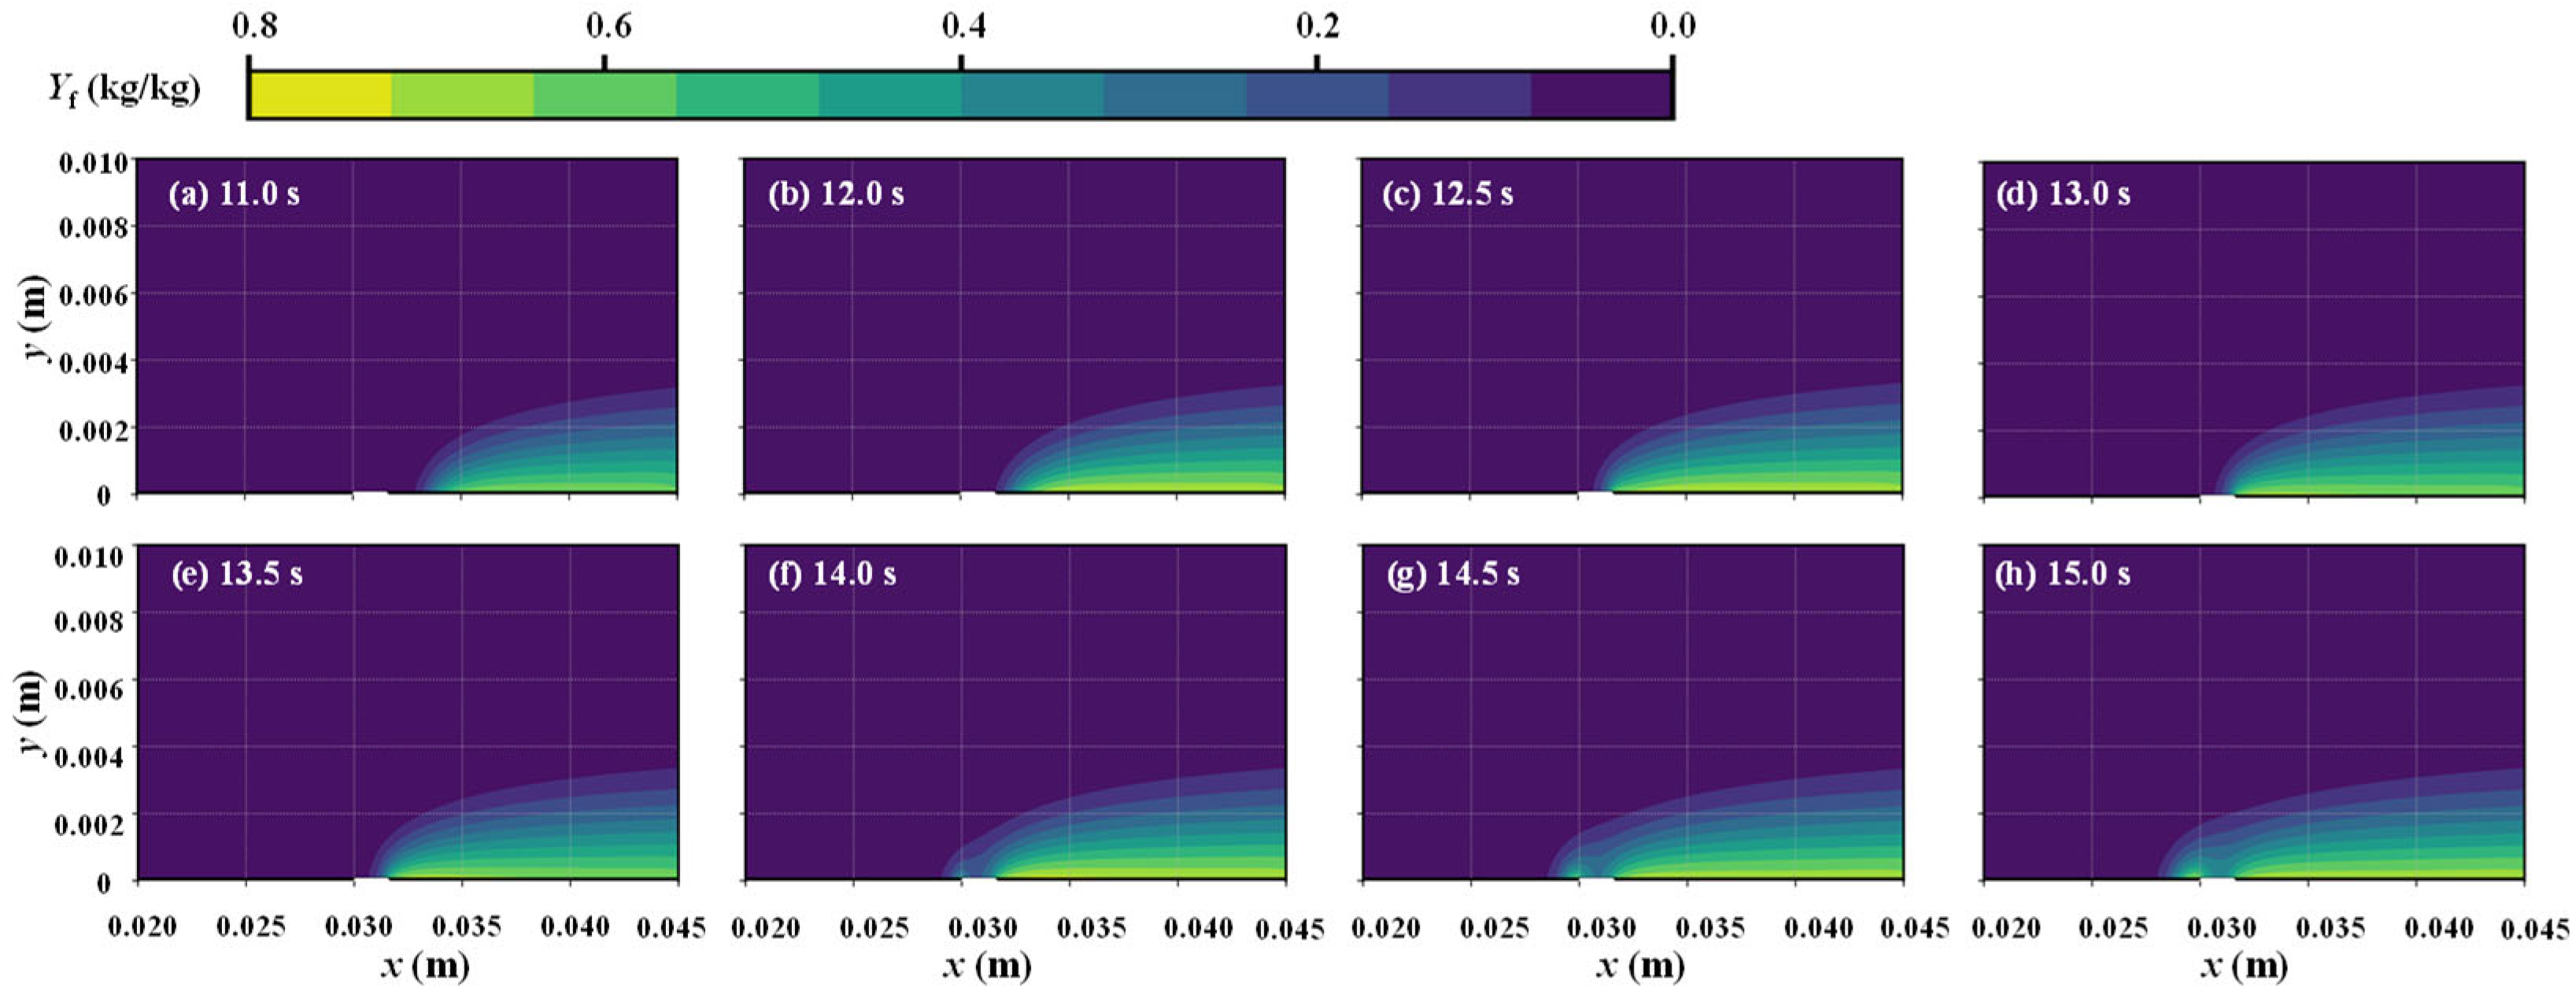
Figure 5 gives the gas-phase reaction source terms and the streamline of the gas flow during flame spread near a discontinuous region. The gas-phase reaction in Equation (5) is denoted as (qgwg)/(ρgCp) in K/s in this paper. The gas-phase combustible gas concentration distribution is given in Figure 6. As shown in Figure 5a,b, the reaction source term in the gas phase zone extends from the material surface to downstream away from the material before the flame spreads to the discontinuous zone, which can be approximated as the flame standing distance curve. A previous study [33] shows that the flame standoff distance curve can be approximated as a power function. Figure 5c,d corresponds to the gas-phase reaction field within the discontinuous zone.
Since the flammable gas cannot be produced in the discontinuous zone, as shown in the flammable gas concentration fields in Figure 6c–e, the flammable gas concentration near the discontinuous zone is significantly lower than that in the surface area of the flammable material, and therefore the source term of the gas-phase reaction shows a transient decrease, which is also the cause of the temperature decrease of the flame front in Figure 3. When the flame crosses the discontinuous zone, as shown in Figure 5e,f, the flame morphology gradually reverts.
3.3. Analysis of Flame Spread in Discontinuous Region
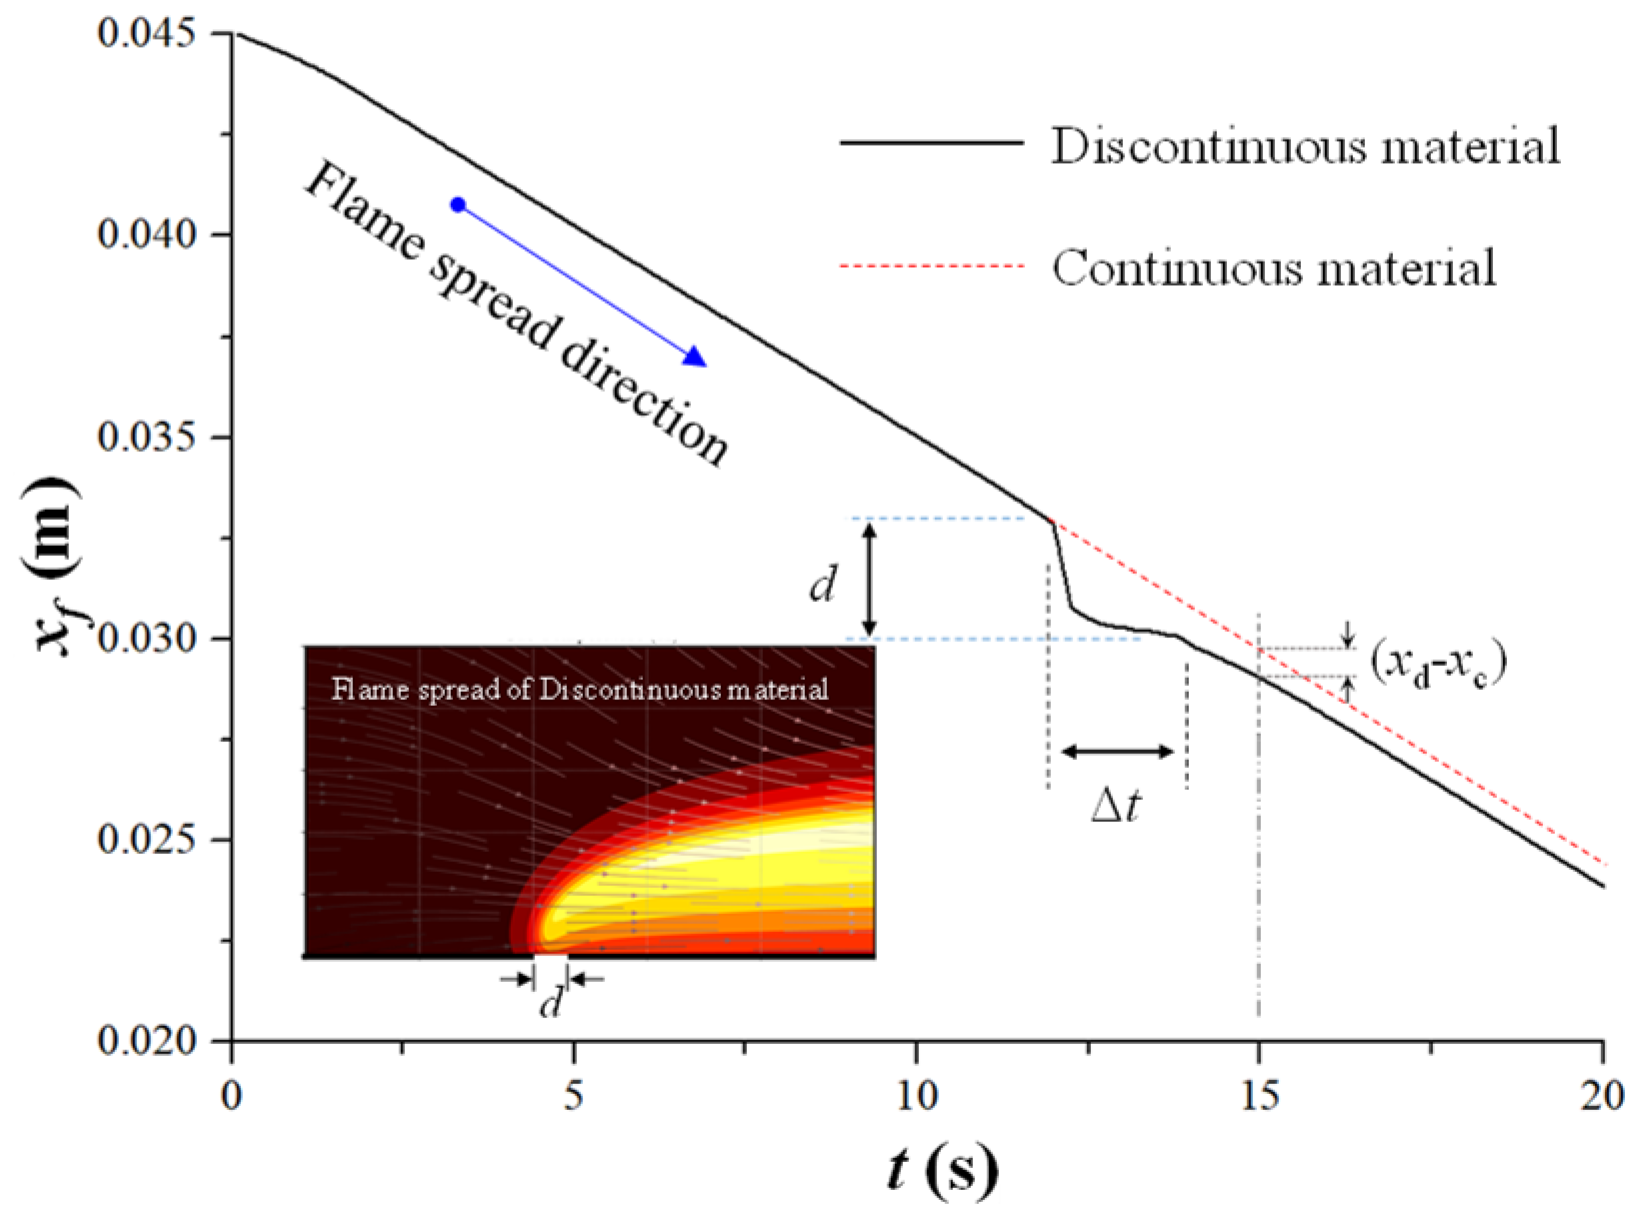
Previous studies [10,34] investigated the effects of parameters such as material thickness, countercurrent wind speed, and environmental components on the downward flame spread. Figure 7 gives the flame front position versus time during the downward flame spread for d = 1.5 mm. In the numerical model, the flame front position is determined by the characteristic temperature or burning rate at the gas-solid interface [35]. In this section, the flame front position can be determined by determining whether the burning rate of the material reaches a certain value (0.04 kg/(m2·s)). This value is obtained through a thorough numerical simulation process and serves only as a reference point for determining the position of the flame front. It has minimal impact on the rate of fire spread and therefore does not affect the overall conclusions of our study.
As in Figure 7, when the material is ignited, it gradually turns to a stable flame spread process after a short period of non-stable development. When the flame front spreads to the discontinuous zone, the curve of the flame front position shows certain irregularity. Before the flame spread to the continuous material on the other side of the discontinuous zone, the flame spread experienced a slow propagation process. When the flame crosses the discontinuous zone, the flame spread rate will gradually stabilize again. Meanwhile, Figure 7 gives the variation of flame front position versus time when there is no discontinuous zone (as shown by the red dashed line in Figure 7). It can be seen that after the discontinuous zone, the flame front position in the case of discontinuous material (xd) exceeds the flame front position in the case of normal flame spread (xc). This indicates that there is flame jumping at the discontinuous zone, which affects the flame spread rate.
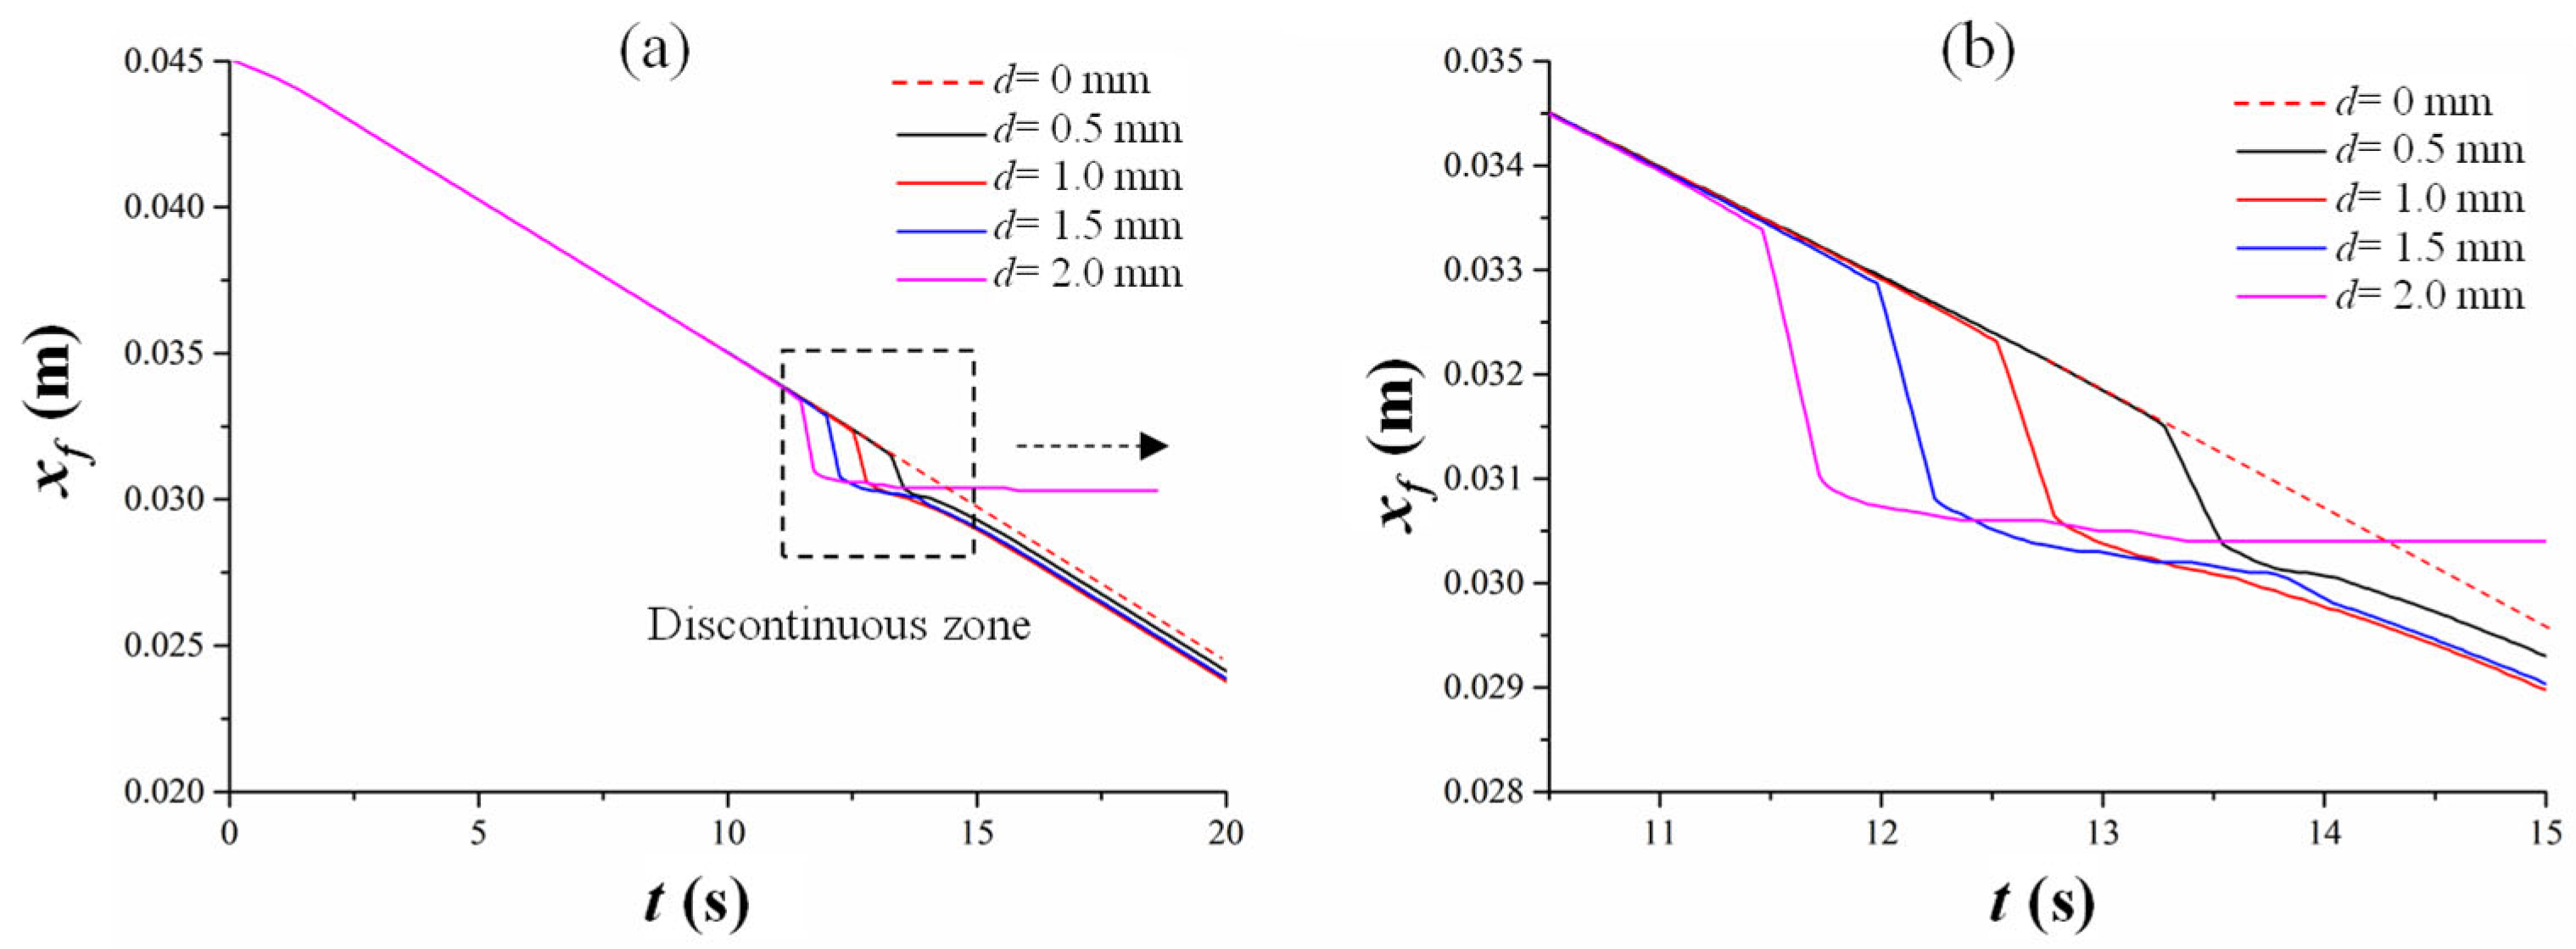
To study the effect of discontinuous distance d on the flame jump, flame spread simulations with different discontinuous distance d are carried out in this work. Figure 8a gives the flame front position versus time for the cases of discontinuous distance d of 0 mm, 0.5 mm, 1.0 mm, 1.5 mm, and 2.0 mm, respectively, and Figure 8b shows the local enlargement of the flame front position-time relationship curve in the discontinuous interval. Here, the average flame spread rate for a discontinuous zone is defined as Vd
where d is the length of the discontinuous zone, and td is the time taken by the flame to cross the discontinuous zone.
As can be seen from Figure 8b, the length of the discontinuous zone has a large effect on the flame front position. At t = 15 s, it can be seen that under the condition of d ≤ 1.5 mm, the flame front has crossed the discontinuous discontinuity zone. When d = 1.0 mm, the position of the flame front is the most forward. In the case of d = 0.5 mm, the position of the flame front is the last. The position of the flame front in the case of d = 1.5 mm is second. That is, xd = 1.0 < xd = 1.5 < xd = 0.5. This indicates that as the length of the discontinuous length increases, the average flame spread rate in the discontinuous zone increases and then decreases with the increase of the length d of the discontinuous zone.
This is mainly related to the competition mechanism between the “jump” of the flame in the discontinuous zone and the heat transfer from the flame to the unburned zone. As the distance from the flame front increases, the heat transfer from the flame to the unburned zone decreases. When the length of the discontinuity is small, the adjacent fuel can get enough heat from the flame and be ignited in a short time; the time to ignite the next section of fuel may be less than the time for the flame to spread on the fuel with length d. In this case, the flame spread rate increases with the increase of the discontinuous distance, and the flame “jump” phenomenon plays a major role. On the other hand, as d increases, the heat transfer from the flame to the unburned material decreases, and the time required to ignite the next section of fuel will increase, thus reducing the average fire spread rate. The “jump” effect can be quantitively investigated by the energy balance analysis [21].
For the downward flame spread, the heat transfer from the flame to the unburned zone ahead of the flame front satisfies the exponent function [36], which can be expressed as
where Lh is the characteristic length of heat transfer as defined in previous research [36,37]. is heat transfer per unit area ahead of the flame front. Here, the x denotes the x-coordinate position. is the surface heat flux per unit area at the flame front position. The relationship between the time to ignite the discrete fuel Δt, the gap size d, and the heat transfer can be expressed as
where Δx is the small length at the beginning of the next fuel bed. Let Δx →0 in Equation (15); we obtain
Combining Equations (12)–(14), the nominal flame spread rate (Vd) over the discontinuous region with a length of d can be expressed as
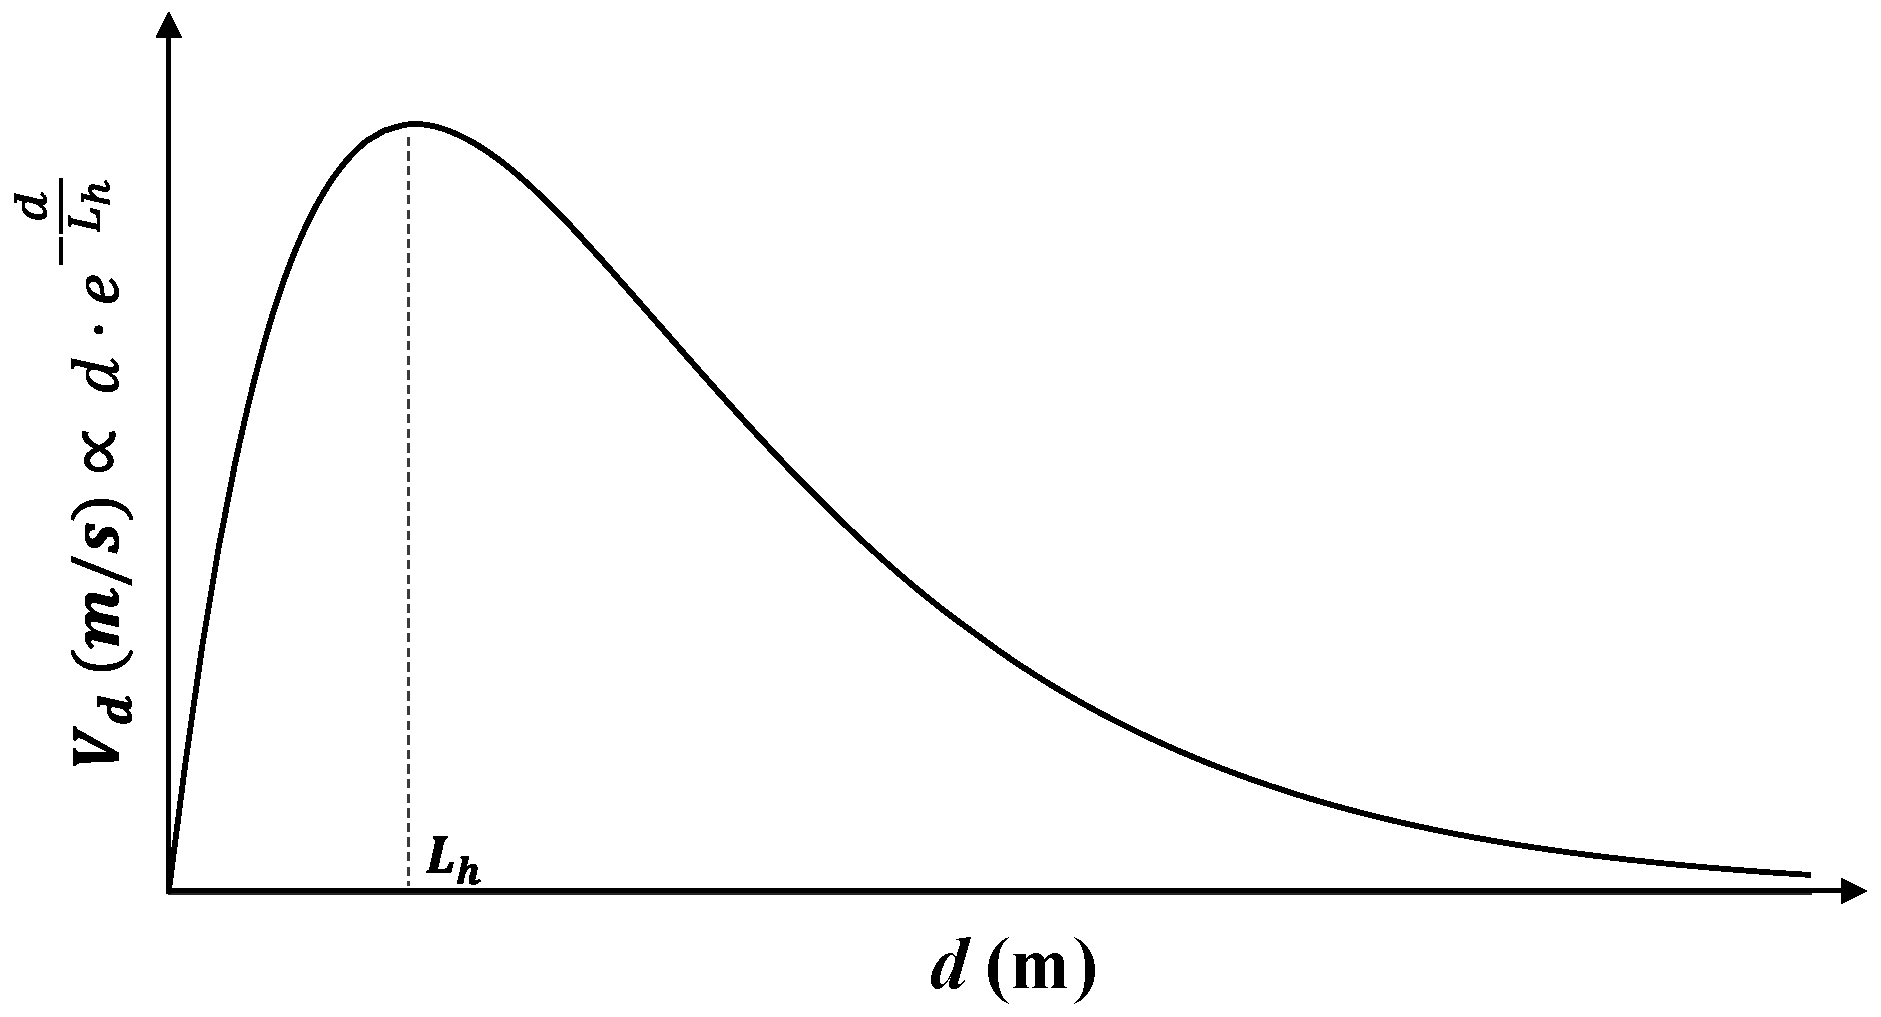
Equation (15) illustrates that the Vd is proportional to . Figure 9 plots the diagram for the relationship between Vd and d. It shows that Vd reaches a maximum when d = Lh. Meanwhile, Vd increases with d before d = Lh and then decreases with d after d = Lh. Therefore, the flame spread rate in discontinuous regions first increases with the increase of d and then decreases.
The critical spacing d of flame spread over the discontinuous zone obtained in this paper is based on the approximate conditions, such as the solid-phase and gas-phase reaction models in this paper. The actual space has certain convection and radiation heat transfer phenomena, and the pyrolysis gas of combustible materials may be emitted to the gas-phase zone through the interstitial zone to provide the fuel needed for gas-phase combustion, and these will play a positive role in the flame crossing the discontinuous zone. Therefore, the actual conditions of the critical spacing d for spreading across the discontinuous zone should be greater than the calculated value in this work.
When d increases to a certain critical condition, the flame will not be able to spread to the other side of the discontinuity; as in Figure 8, the flame spread will not be able to cross the discontinuity area when d = 2.0 mm, and the fire spread stops.
4. Conclusions
In conclusion, we have established a numerical model to study the flow, heat, and mass transfer during the downward flame spread of discontinuous material PMMA. Our results demonstrate that the “acute angle” of the high-temperature zone of the flame front changes from large to small during the flame spread in the discontinuous region, and the flame front deflects towards the surface of solid fuel, gradually returning to the normal state after crossing the discontinuity area. The concentration of combustible gas in the gas phase decreases in the discontinuous zone, which affects the reaction rate of the gas phase. The flame spread in the discontinuous zone exhibits a flame “jump” phenomenon, and the average flame spread rate is related to the competition mechanism of heat transfer from the flame to the unburned zone. The fire spread rate initially rises with the increase of the gap, but if the gap is further increased, the average flame spread rate will decrease until the flame is unable to spread to the other side of the discontinuous zone. Our study provides insights into the growth and development of fires involving discretely distributed combustible materials, which should contribute to the design of effective fire suppression strategies and fire-resistant structures. Furthermore, the incorporation of turbulence models in future research will facilitate the investigation of realistic, large-scale fire scenarios.
Author Contributions
Formal analysis, Y.Z. (Yanli Zhao) and Y.Z. (Yiping Zeng); Investigation, S.L. and G.W.; Methodology, Y.Z. (Yeming Zhu); Resources, Y.Z. (Yiping Zeng), S.S. and G.W.; Validation, Y.Z. (Yeming Zhu), Y.Z. (Yanli Zhao), and R.W.; Writing—original draft, S.L. All authors have read and agreed to the published version of the manuscript.
Funding
This work was supported by Postdoctoral Later-stage Foundation Project of SUSTech (No. K22327502). The authors gratefully acknowledge the support.
Data Availability Statement
Data is contained within the article.
Conflicts of Interest
The authors declare no conflict of interest.
References
- Wang, H.; Wang, Z.; Wen, L.; Meng, H.; Wang, W.; Huang, X. The flame spread performance over discrete wooden chips varying wood species. Therm. Sci. Eng. Prog. 2023, 39, 101674. [Google Scholar] [CrossRef]
- Wichman, I.S.; Williams, F.A. Comments on Rates of Creeping Spread of Flames over Thermally Thin Fuels. Combust. Sci. Technol. 1983, 33, 207–214. [Google Scholar] [CrossRef]
- Fernandez-Pello, A.; Ray, S.; Glassman, I. Downward flame spread in an opposed forced flow. Combust. Sci. Technol. 1978, 19, 19–30. [Google Scholar] [CrossRef]
- Fernandez-Pello, A.; Williams, F.A. Laminar flame spread over PMMA surfaces. Symp. Combust. 1975, 15, 217–231. [Google Scholar] [CrossRef]
- Fernandez-Pello, A.C.; Santoro, R.J. On the dominant mode of heat transfer in downward flame spread. Symp. Combust. 1979, 17, 1201–1209. [Google Scholar] [CrossRef]
- Fernández-Tarrazo, E.; Liñán, A. Flame spread over solid fuels in opposite natural convection. Proc. Combust. Inst. 2002, 29, 219–225. [Google Scholar] [CrossRef]
- Fernandez-Pello, A.; Williams, F.A. A theory of laminar flame spread over flat surfaces of solid combustibles. Combust. Flame 1977, 28, 251–277. [Google Scholar] [CrossRef]
- Tolejko, K.; Feier, I.I.; T’ien, J.S. Effects of fuel Lewis number on flame spread over solids. Proc. Combust. Inst. 2005, 30, 2263–2270. [Google Scholar] [CrossRef]
- Johnston, M.C.; T’Ien, J.S.; Muff, D.E.; Zhao, X.; Olson, S.L.; Ferkul, P.V. Self induced buoyant blow off in upward flame spread on thin solid fuels. Fire Saf. J. 2015, 71, 279–286. [Google Scholar] [CrossRef]
- Dl Blasi, C.; Continillo, G.; Crescitelli, S.; Russo, G. Numerical Simulation of Opposed Flow Flame Spread over a Thermally Thick Solid Fuel. Combust. Sci. Technol. 1987, 54, 25–36. [Google Scholar] [CrossRef]
- Blasi, C.D.; Wichman, I.S. Effects of solid-phase properties on flames spreading over composite materials. Combust. Flame 1995, 102, 229–240. [Google Scholar] [CrossRef]
- Rangwala, A.S. Flame Spread Analysis Using a Variable B-Number; University of California: San Diego, CA, USA, 2006. [Google Scholar]
- Jiang, L.; Miller, C.H.; Gollner, M.J.; Sun, J.H. Sample width and thickness effects on horizontal flame spread over a thin PMMA surface. Proc. Combust. Inst. 2017, 36, 2987–2994. [Google Scholar] [CrossRef]
- Huang, X.; Wang, Q.; Zhang, Y.; Yin, Y.; Sun, J. Thickness effect on flame spread characteristics of expanded polystyrene in different environments. J. Thermoplast. Compos. Mater. 2012, 25, 427–438. [Google Scholar] [CrossRef]
- Zhang, Y.; Li, Q.; Tang, K.; Lin, Y. Surface inclination effects on heat transfer during flame spread acceleration based on FireFOAM. Case Stud. Therm. Eng. 2022, 32, 101905. [Google Scholar] [CrossRef]
- You, F.; Hu, Y. Reaction-to-fire properties and fire spread properties of metal-skinned expanded polystyrene foam sandwich panel. Ranshao Kexue Yu Jishu/J. Combust. Sci. Technol. 2012, 18, 228–236. [Google Scholar]
- Moallemi, M.K.; Zhang, H.; Kumar, S. Numerical modeling of two-dimensional smoldering processes. Combust. Flame 1993, 95, 170–182. [Google Scholar] [CrossRef]
- Moallemi, M.K.; Zhang, H. Two-Dimensional Numerical Modeling of Laminar Flame Spread over Porous Solid Fuel; NIST: Gaithersburg, MD, USA, 1993; p. 19. [Google Scholar]
- Gollner, M.J.; Xie, Y.; Lee, M.; Nakamura, Y.; Rangwala, A.S. Burning behavior of vertical matchstick arrays. Combust. Sci. Technol. 2012, 184, 585–607. [Google Scholar] [CrossRef]
- Jiang, L.; Zhao, Z.; Tang, W.; Miller, C.; Sun, J.-H.; Gollner, M.J. Flame spread and burning rates through vertical arrays of wooden dowels. Proc. Combust. Inst. 2019, 37, 3767–3774. [Google Scholar] [CrossRef]
- Luo, S.; Zhao, Y.; Zhang, H. Numerical study on opposed-flow flame spread over discrete fuels—The influence of gap size and opposed-flow velocity. Fuel 2021, 283, 118862. [Google Scholar] [CrossRef]
- Bu, R.; Zhou, Y.; Fan, C.; Wang, Z. Understanding the effects of inclination angle and fuel bed width on concurrent flame spread over discrete fuel arrays. Fuel 2021, 289, 119924. [Google Scholar] [CrossRef]
- Zhou, B.; Wang, K.; Xu, M.; Yang, W.; Zhu, F.; Sun, B.; Wang, X.; Ke, W. Influence of air-gap and thickness on the upward flame spread over discrete wood chips. Therm. Sci. Eng. Prog. 2021, 26, 101106. [Google Scholar] [CrossRef]
- Wu, K.-K.; Chen, C.-H. A numerical analysis of ignition to steady downward flame spread over a thin solid fuel. Combust. Sci. Technol. 2003, 175, 933–964. [Google Scholar] [CrossRef]
- Paolini, C.P.; Udgaonkar, A.; Bhattacharjee, S.; Takahashi, S.; Wakai, K. A numerical investigation of flame geometry in opposed flow flame spread over thin fuels. In Proceedings of the 5th Asia-Pacific Conference on Combustion, Adelaide, SA, Australia, 17–20 July 2005; pp. 273–276. [Google Scholar]
- Yamamoto, K.; Ogata, Y.; Yamashita, H. Flame structure and flame spread rate over a solid fuel in partially premixed atmospheres. Proc. Combust. Inst. 2011, 33, 2441–2448. [Google Scholar] [CrossRef]
- Ananth, R.; Ndubizu, C.C.; Tatem, P.A. Burning rate distributions for boundary layer flow combustion of a PMMA plate in forced flow. Combust. Flame 2003, 135, 35–55. [Google Scholar] [CrossRef]
- Zheng, G.Y.; Wichman, I.S.; Benard, A. Opposed-flow flame spread over polymeric materials: Influence of phase change. Combust. Flame 2001, 124, 387–408. [Google Scholar] [CrossRef]
- Juste, G.L.; Contat-Rodrigo, L. Temperature field reconstruction from phase-map obtained with moiré deflectometry in diffusion flame on solids. Combust. Sci. Technol. 2007, 179, 1287–1302. [Google Scholar] [CrossRef]
- Shaklein, A.A.; Bolkisev, A.A.; Karpov, A.I.; Korobeinichev, O.P.; Trubachev, S.A. Two-step gas-phase reaction model for the combustion of polymeric fuel. Fuel 2019, 255, 115878. [Google Scholar] [CrossRef]
- Ayani, M.B.; Esfahani, J.A.; Sousa, A.C.M. The effect of surface regression on the downward flame spread over a solid fuel in a quiescent ambient. Therm. Sci. 2007, 11, 67–86. [Google Scholar] [CrossRef]
- Bhattacharjee, S.; King, M.D.; Paolini, C. Structure of downward spreading flames: A comparison of numerical simulation, experimental results and a simplified parabolic theory. Combust. Theory Model. 2006, 8, 23–39. [Google Scholar] [CrossRef]
- Singh, A.V.; Gollner, M.J. A methodology for estimation of local heat fluxes in steady laminar boundary layer diffusion flames. Combust. Flame 2015, 162, 2214–2230. [Google Scholar] [CrossRef]
- Diblasi, C. Processes of Flames Spreading over the Surface of Charring Fuels—Effects of the Solid Thickness. Combust. Flame 1994, 97, 225–239. [Google Scholar] [CrossRef]
- Kumar, C.; Kumar, A. Gravity modulation study on opposed flame spread over thin solid fuels. Proc. Combust. Inst. 2013, 34, 2675–2682. [Google Scholar] [CrossRef]
- Sibulkin, M.; Kim, J. The dependence of flame propagation on surface heat transfer I. Downward burning. Combust. Sci. Technol. 1976, 14, 43–56. [Google Scholar] [CrossRef]
- Williams, F. Mechanisms of fire spread. Symp. Combust. 1977, 16, 1281–1294. [Google Scholar] [CrossRef]
Figure 1.
Schematic diagram of the process of ignition and fire spread in discontinuous materials.

Figure 2.
(a) The temperature structure of the gas phase in the stable stage of fire spread and (b) its comparison with experiment results in Ref [7].
Figure 2.
(a) The temperature structure of the gas phase in the stable stage of fire spread and (b) its comparison with experiment results in Ref [7].

Figure 3.
Gas-phase temperature field during flame spread in the discontinuous region at different times (a–h) for the case with d = 1.5 mm.
Figure 3.
Gas-phase temperature field during flame spread in the discontinuous region at different times (a–h) for the case with d = 1.5 mm.

Figure 4.
Temperature distribution of the material surface during flame spread in the discontinuous zone at different times (a–h) for the case with d = 1.5 mm.
Figure 4.
Temperature distribution of the material surface during flame spread in the discontinuous zone at different times (a–h) for the case with d = 1.5 mm.

Figure 5.
Gas-phase reaction source term during flame spread in the discontinuous zone at different times (a–h) for the case with d = 1.5 mm.
Figure 5.
Gas-phase reaction source term during flame spread in the discontinuous zone at different times (a–h) for the case with d = 1.5 mm.

Figure 6.
Distribution of gas-phase combustible fuel concentration during flame spread in the discontinuous zone at different times (a–h) for the case with d = 1.5 mm.
Figure 6.
Distribution of gas-phase combustible fuel concentration during flame spread in the discontinuous zone at different times (a–h) for the case with d = 1.5 mm.

Figure 7.
Flame front position versus time during the flame spread of discontinuous materials (d = 1.5 mm).
Figure 7.
Flame front position versus time during the flame spread of discontinuous materials (d = 1.5 mm).

Figure 8.
(a) Flame front position versus time during the flame spread of discontinuous materials with different discontinuous lengths. (b) the local enlargement of the flame front position-time curve in the discontinuity region.
Figure 8.
(a) Flame front position versus time during the flame spread of discontinuous materials with different discontinuous lengths. (b) the local enlargement of the flame front position-time curve in the discontinuity region.

Figure 9.
Diagram for the relationship between and d.

Disclaimer/Publisher’s Note: The statements, opinions and data contained in all publications are solely those of the individual author(s) and contributor(s) and not of MDPI and/or the editor(s). MDPI and/or the editor(s) disclaim responsibility for any injury to people or property resulting from any ideas, methods, instructions or products referred to in the content. |
© 2023 by the authors. Licensee MDPI, Basel, Switzerland. This article is an open access article distributed under the terms and conditions of the Creative Commons Attribution (CC BY) license (https://creativecommons.org/licenses/by/4.0/).
Share and Cite
MDPI and ACS Style
Zhu, Y.; Luo, S.; Zhao, Y.; Zeng, Y.; Wu, G.; Wei, R.; Sun, S. Numerical Simulation of Downward Flame Propagation in Discontinuous Region of Solid Fuel. Fire 2023, 6, 207. https://doi.org/10.3390/fire6050207
AMA Style
Zhu Y, Luo S, Zhao Y, Zeng Y, Wu G, Wei R, Sun S. Numerical Simulation of Downward Flame Propagation in Discontinuous Region of Solid Fuel. Fire. 2023; 6(5):207. https://doi.org/10.3390/fire6050207
Chicago/Turabian StyleZhu, Yeming, Shengfeng Luo, Yanli Zhao, Yiping Zeng, Guohua Wu, Ruichao Wei, and Shutang Sun. 2023. "Numerical Simulation of Downward Flame Propagation in Discontinuous Region of Solid Fuel" Fire 6, no. 5: 207. https://doi.org/10.3390/fire6050207