
Numerical Simulation on the Smoke Prevention Performance of Air Curtains in an Island-Type Subway Station

Abstract
:1. Introduction
2. FDS Model
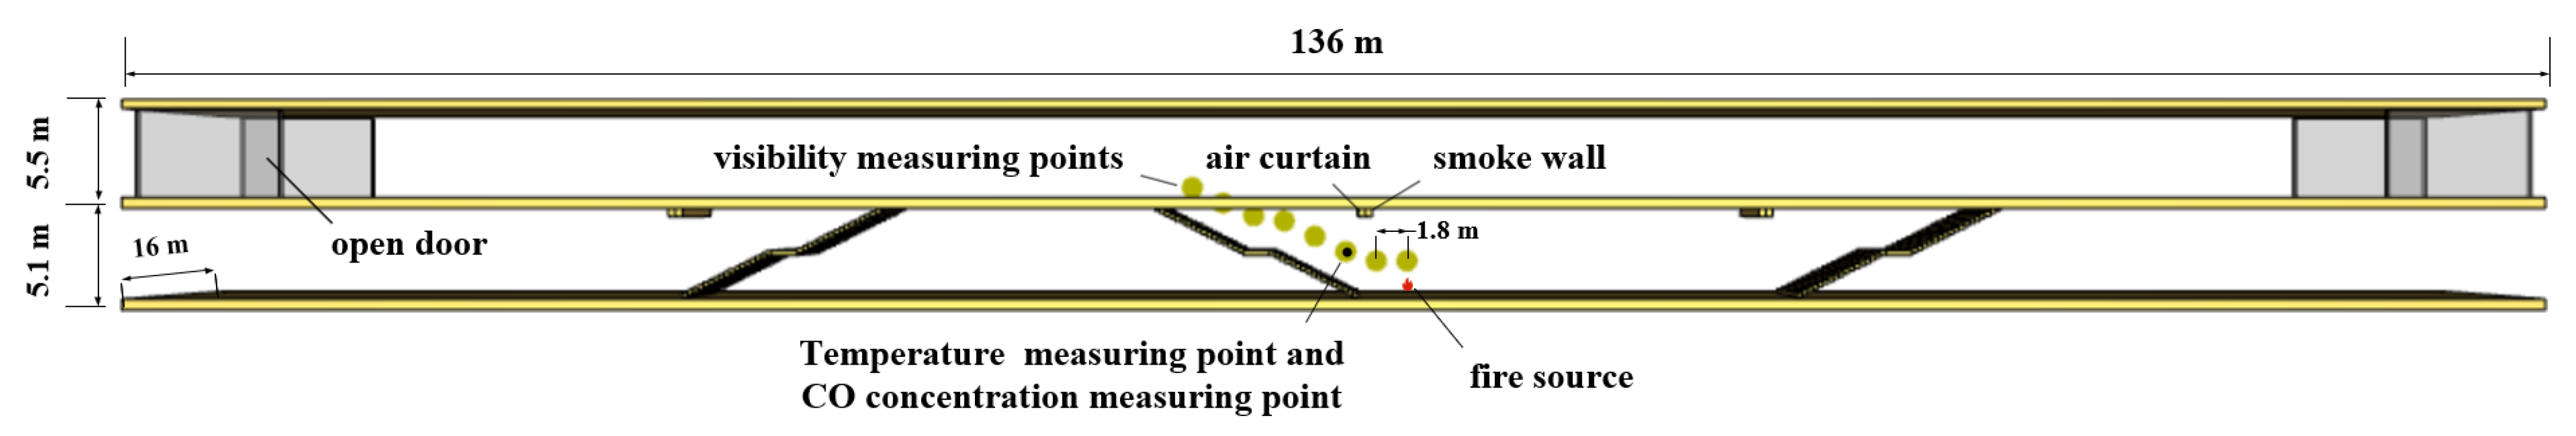
2.1. Numerical Modelling
2.2. Grid Independence Study
2.3. Working Conditions and Boundary Conditions
2.4. Evaluation Criteria
3. Results and Discussion
3.1. Influence of the Air Curtain
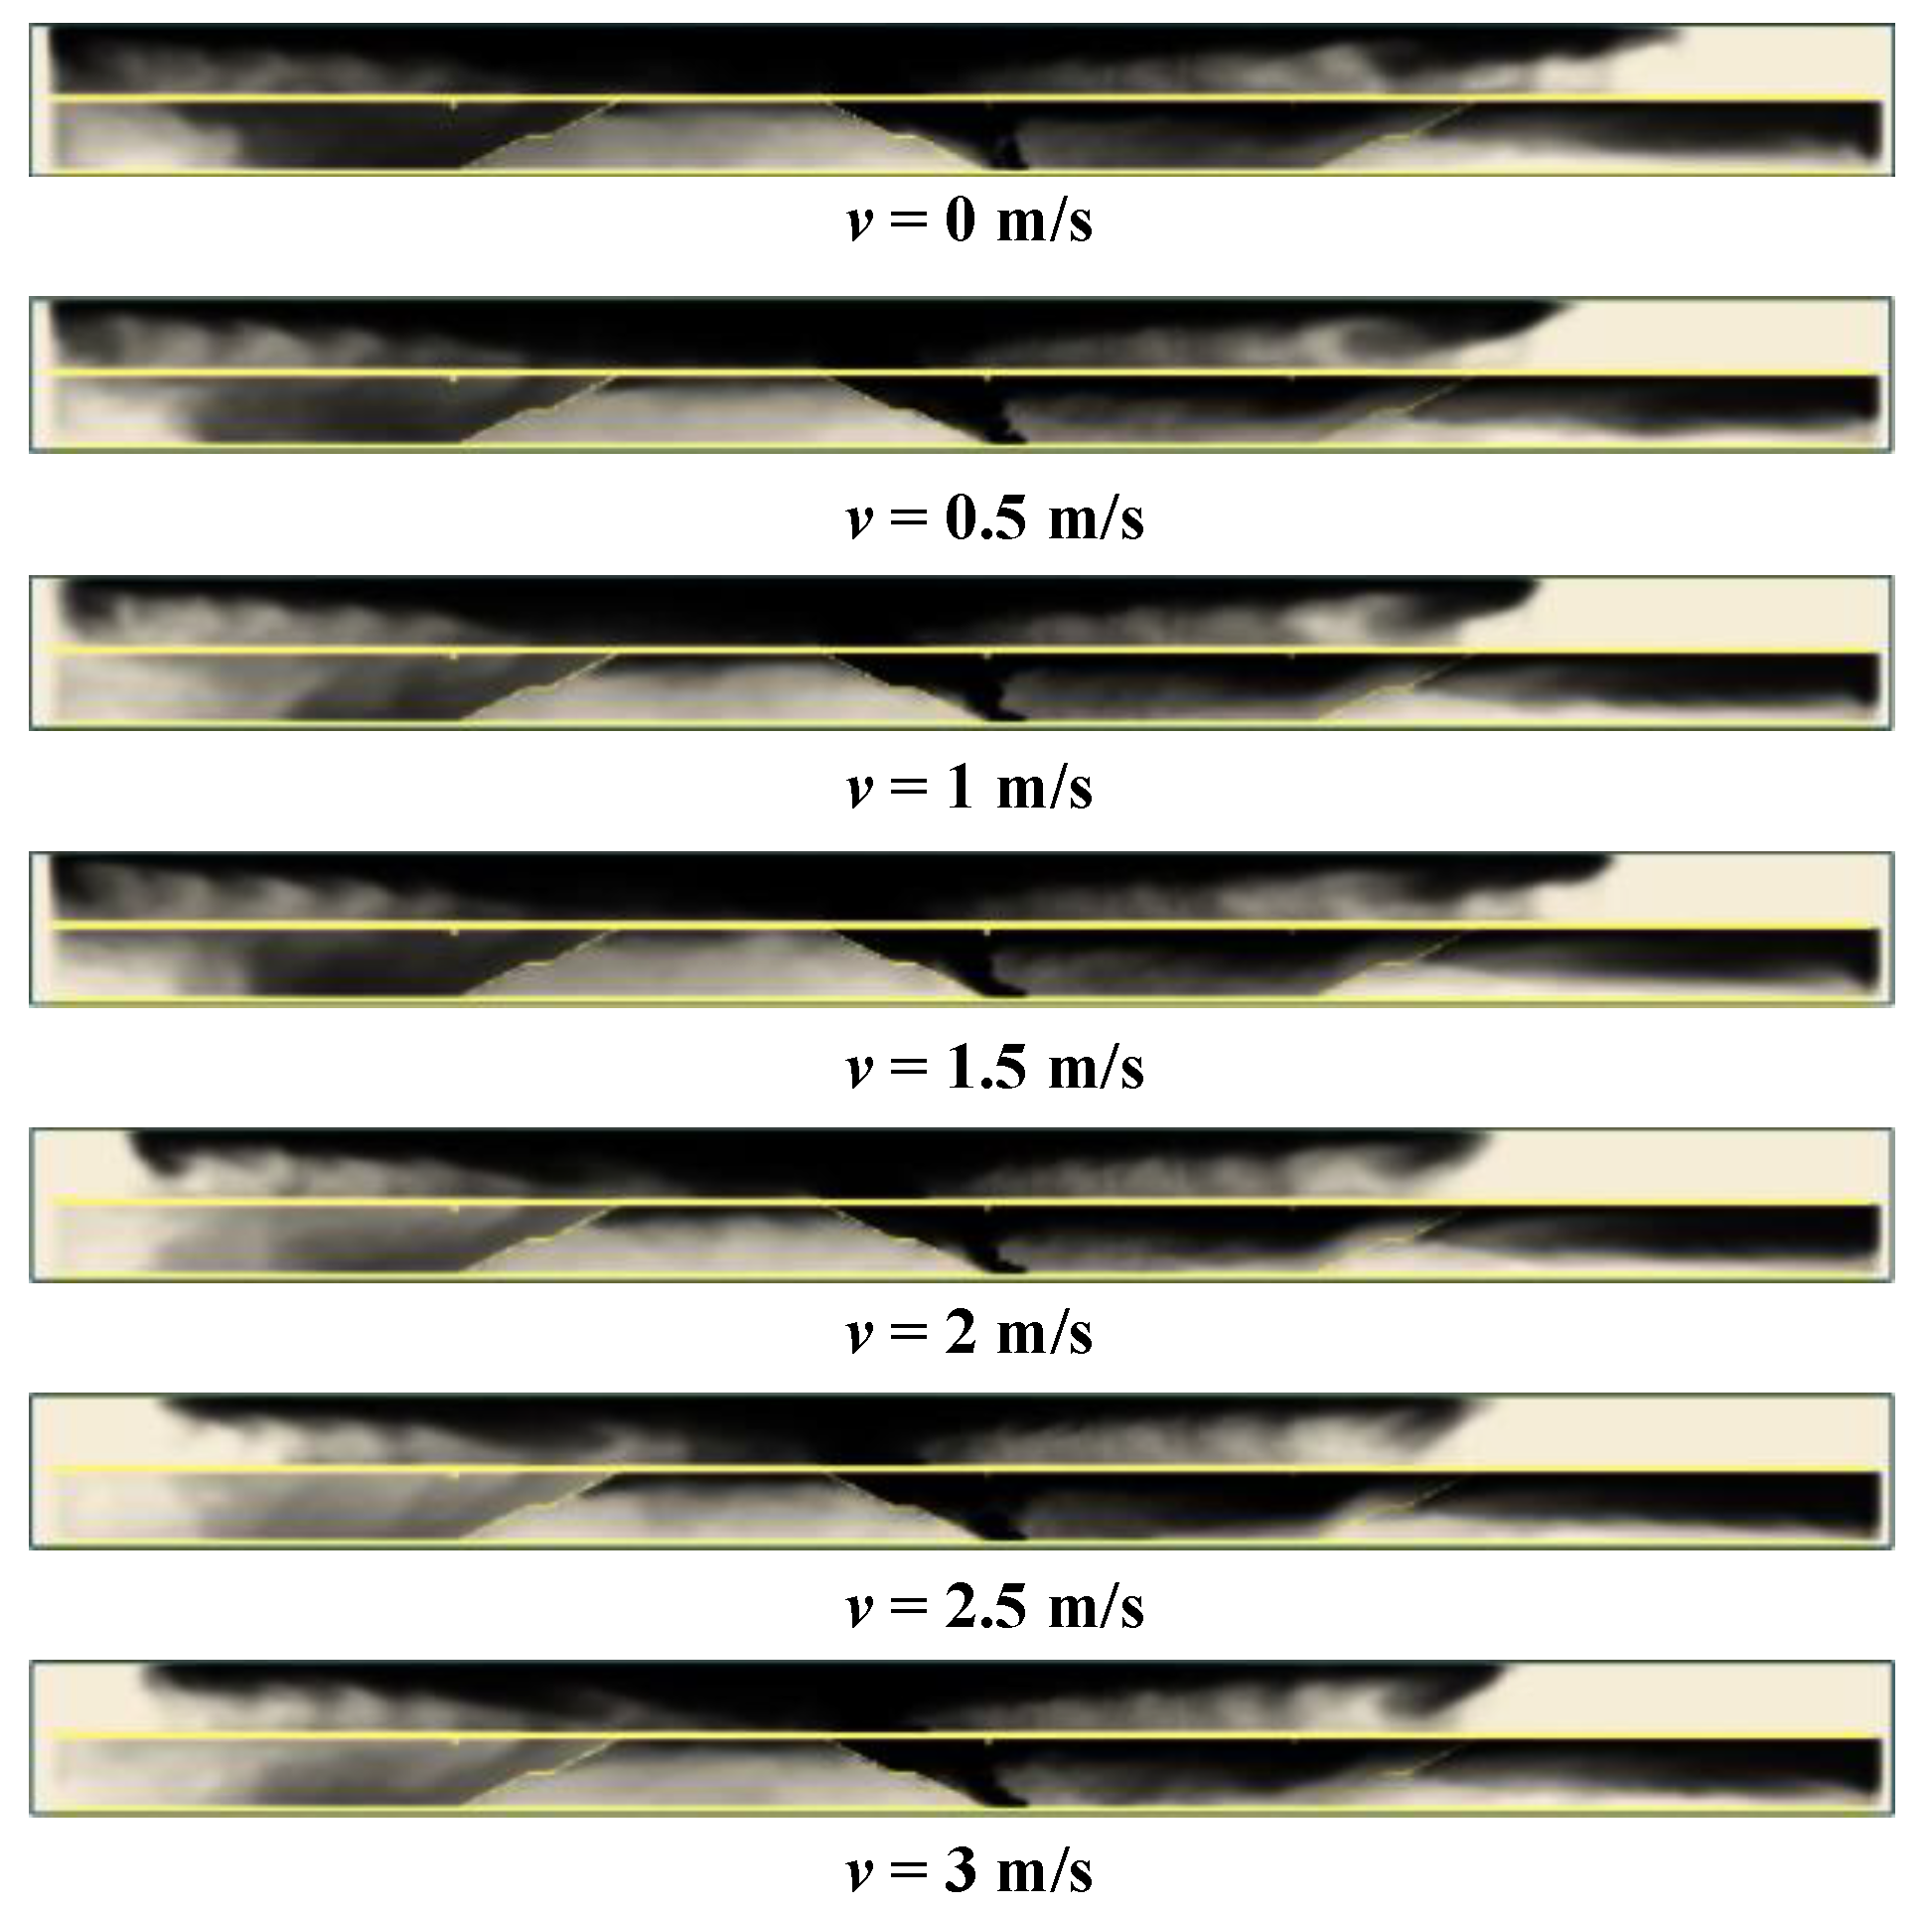
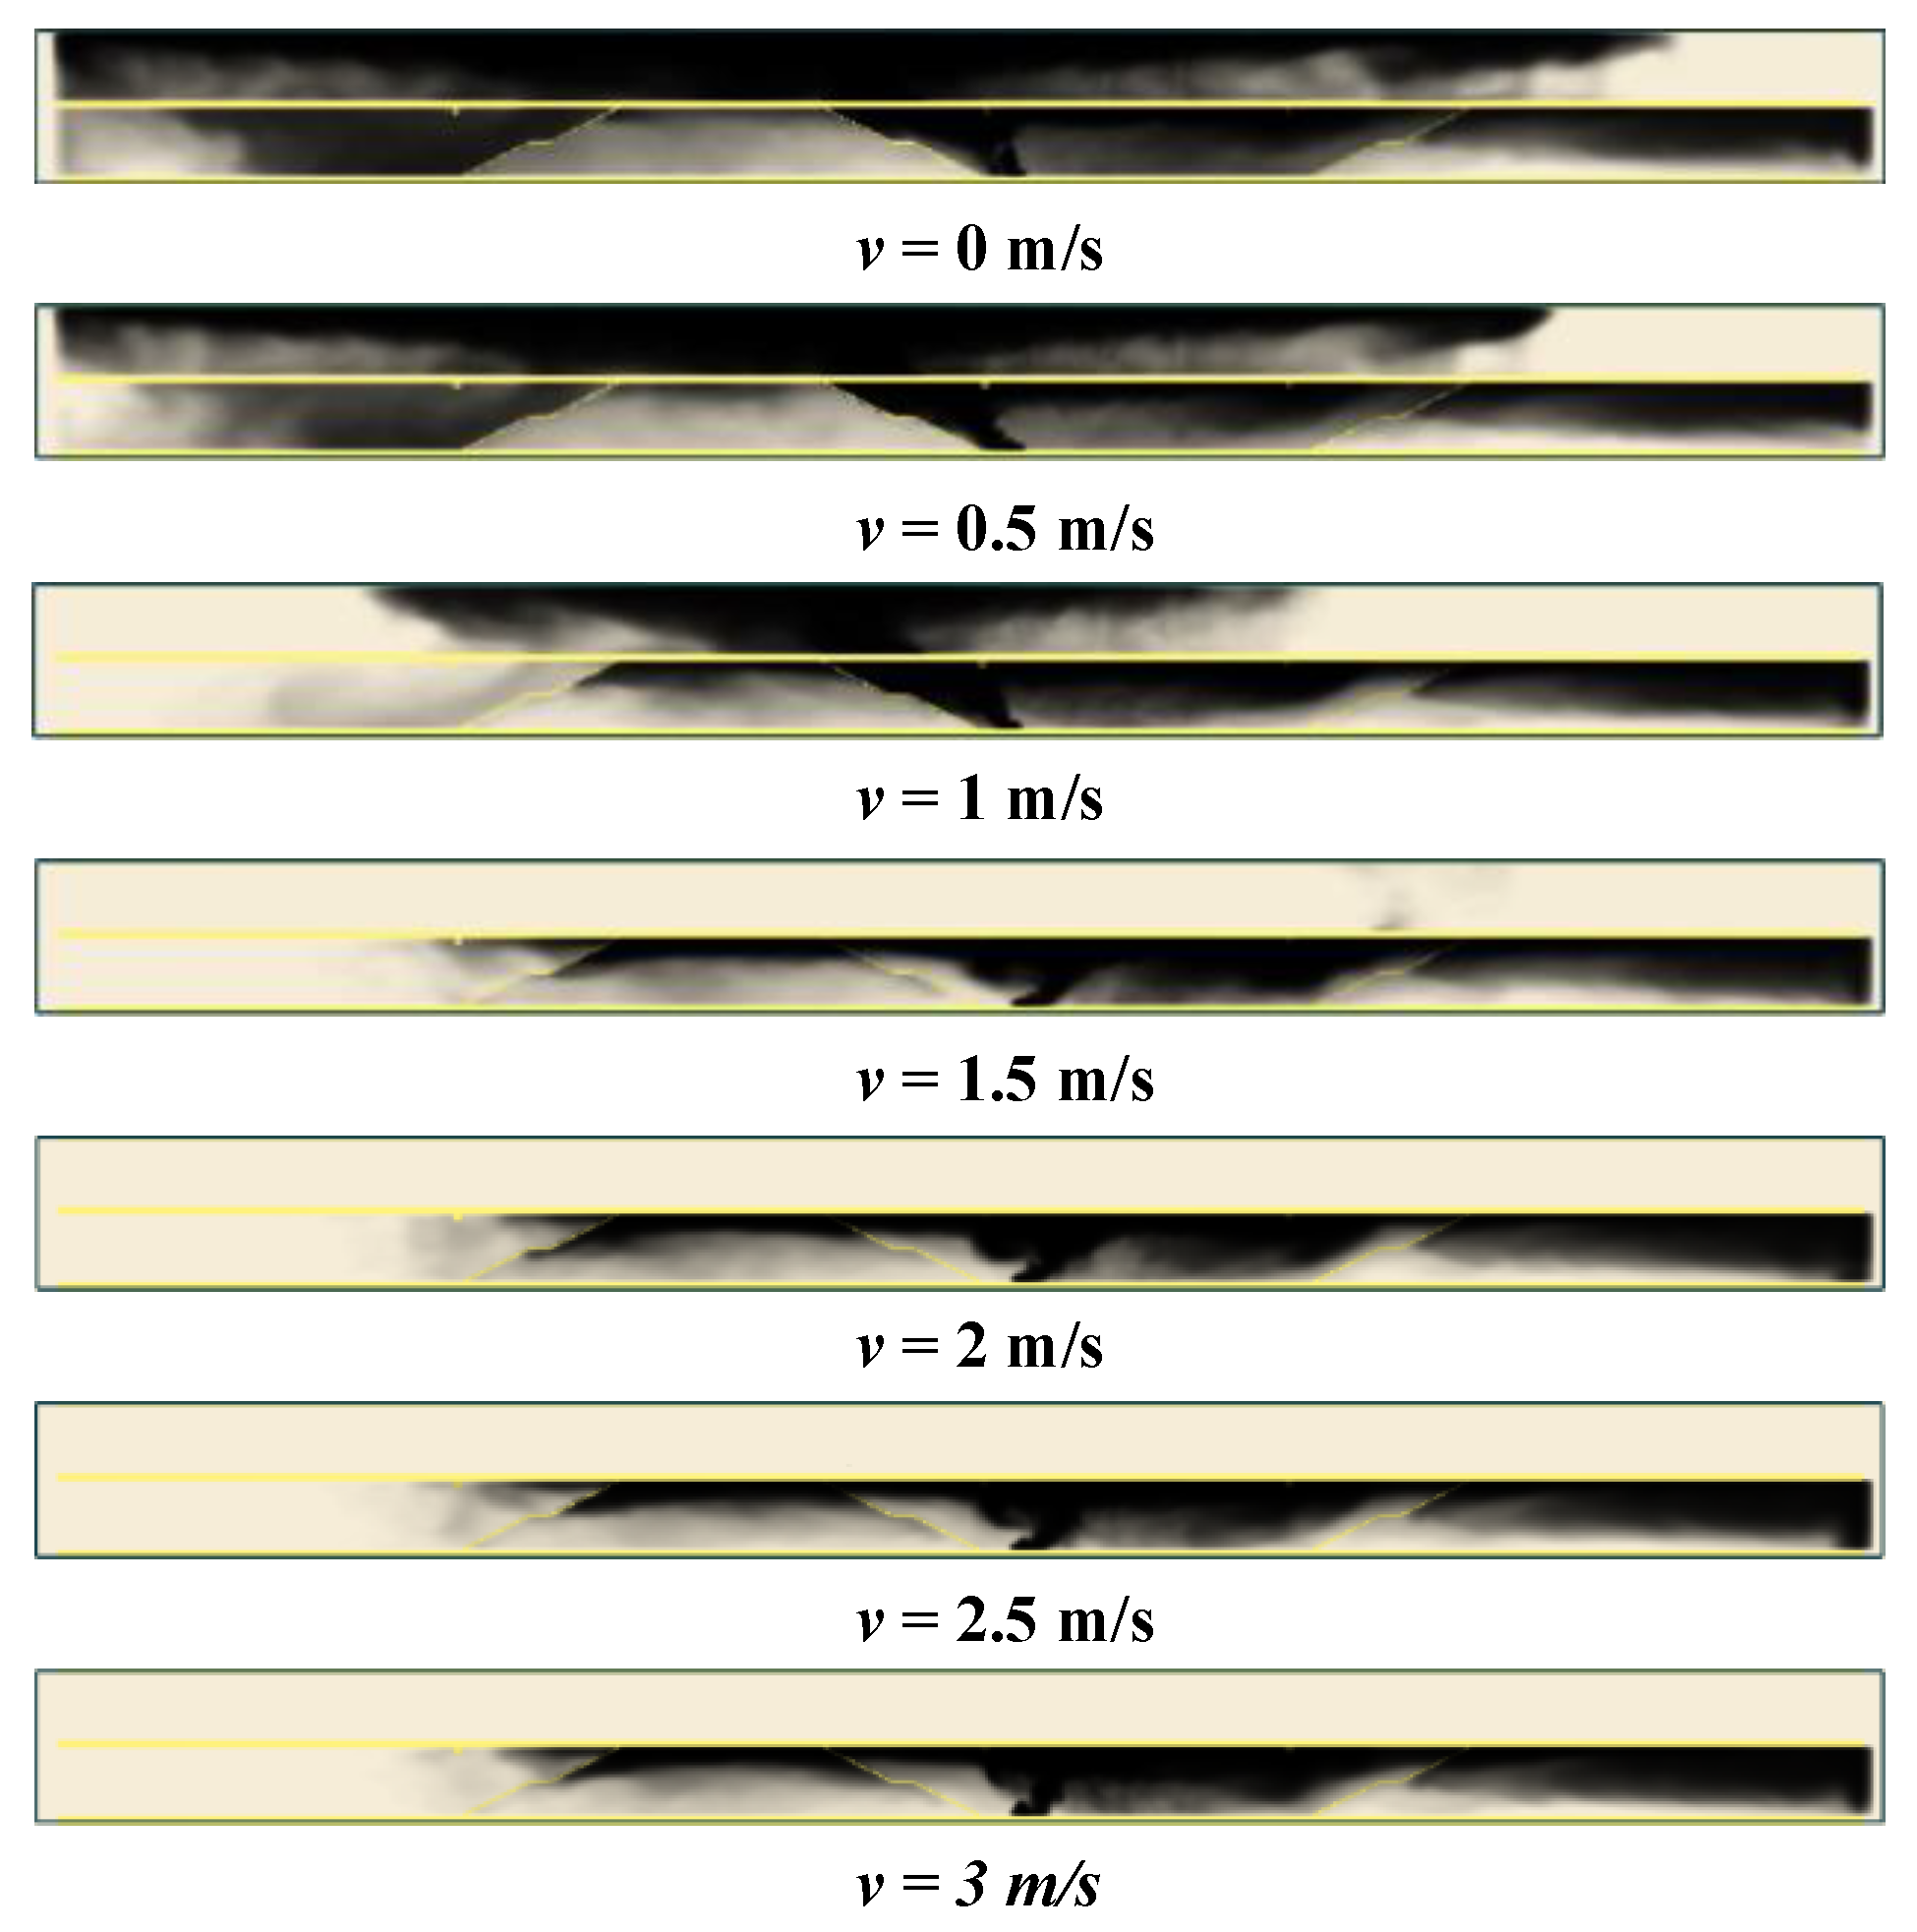
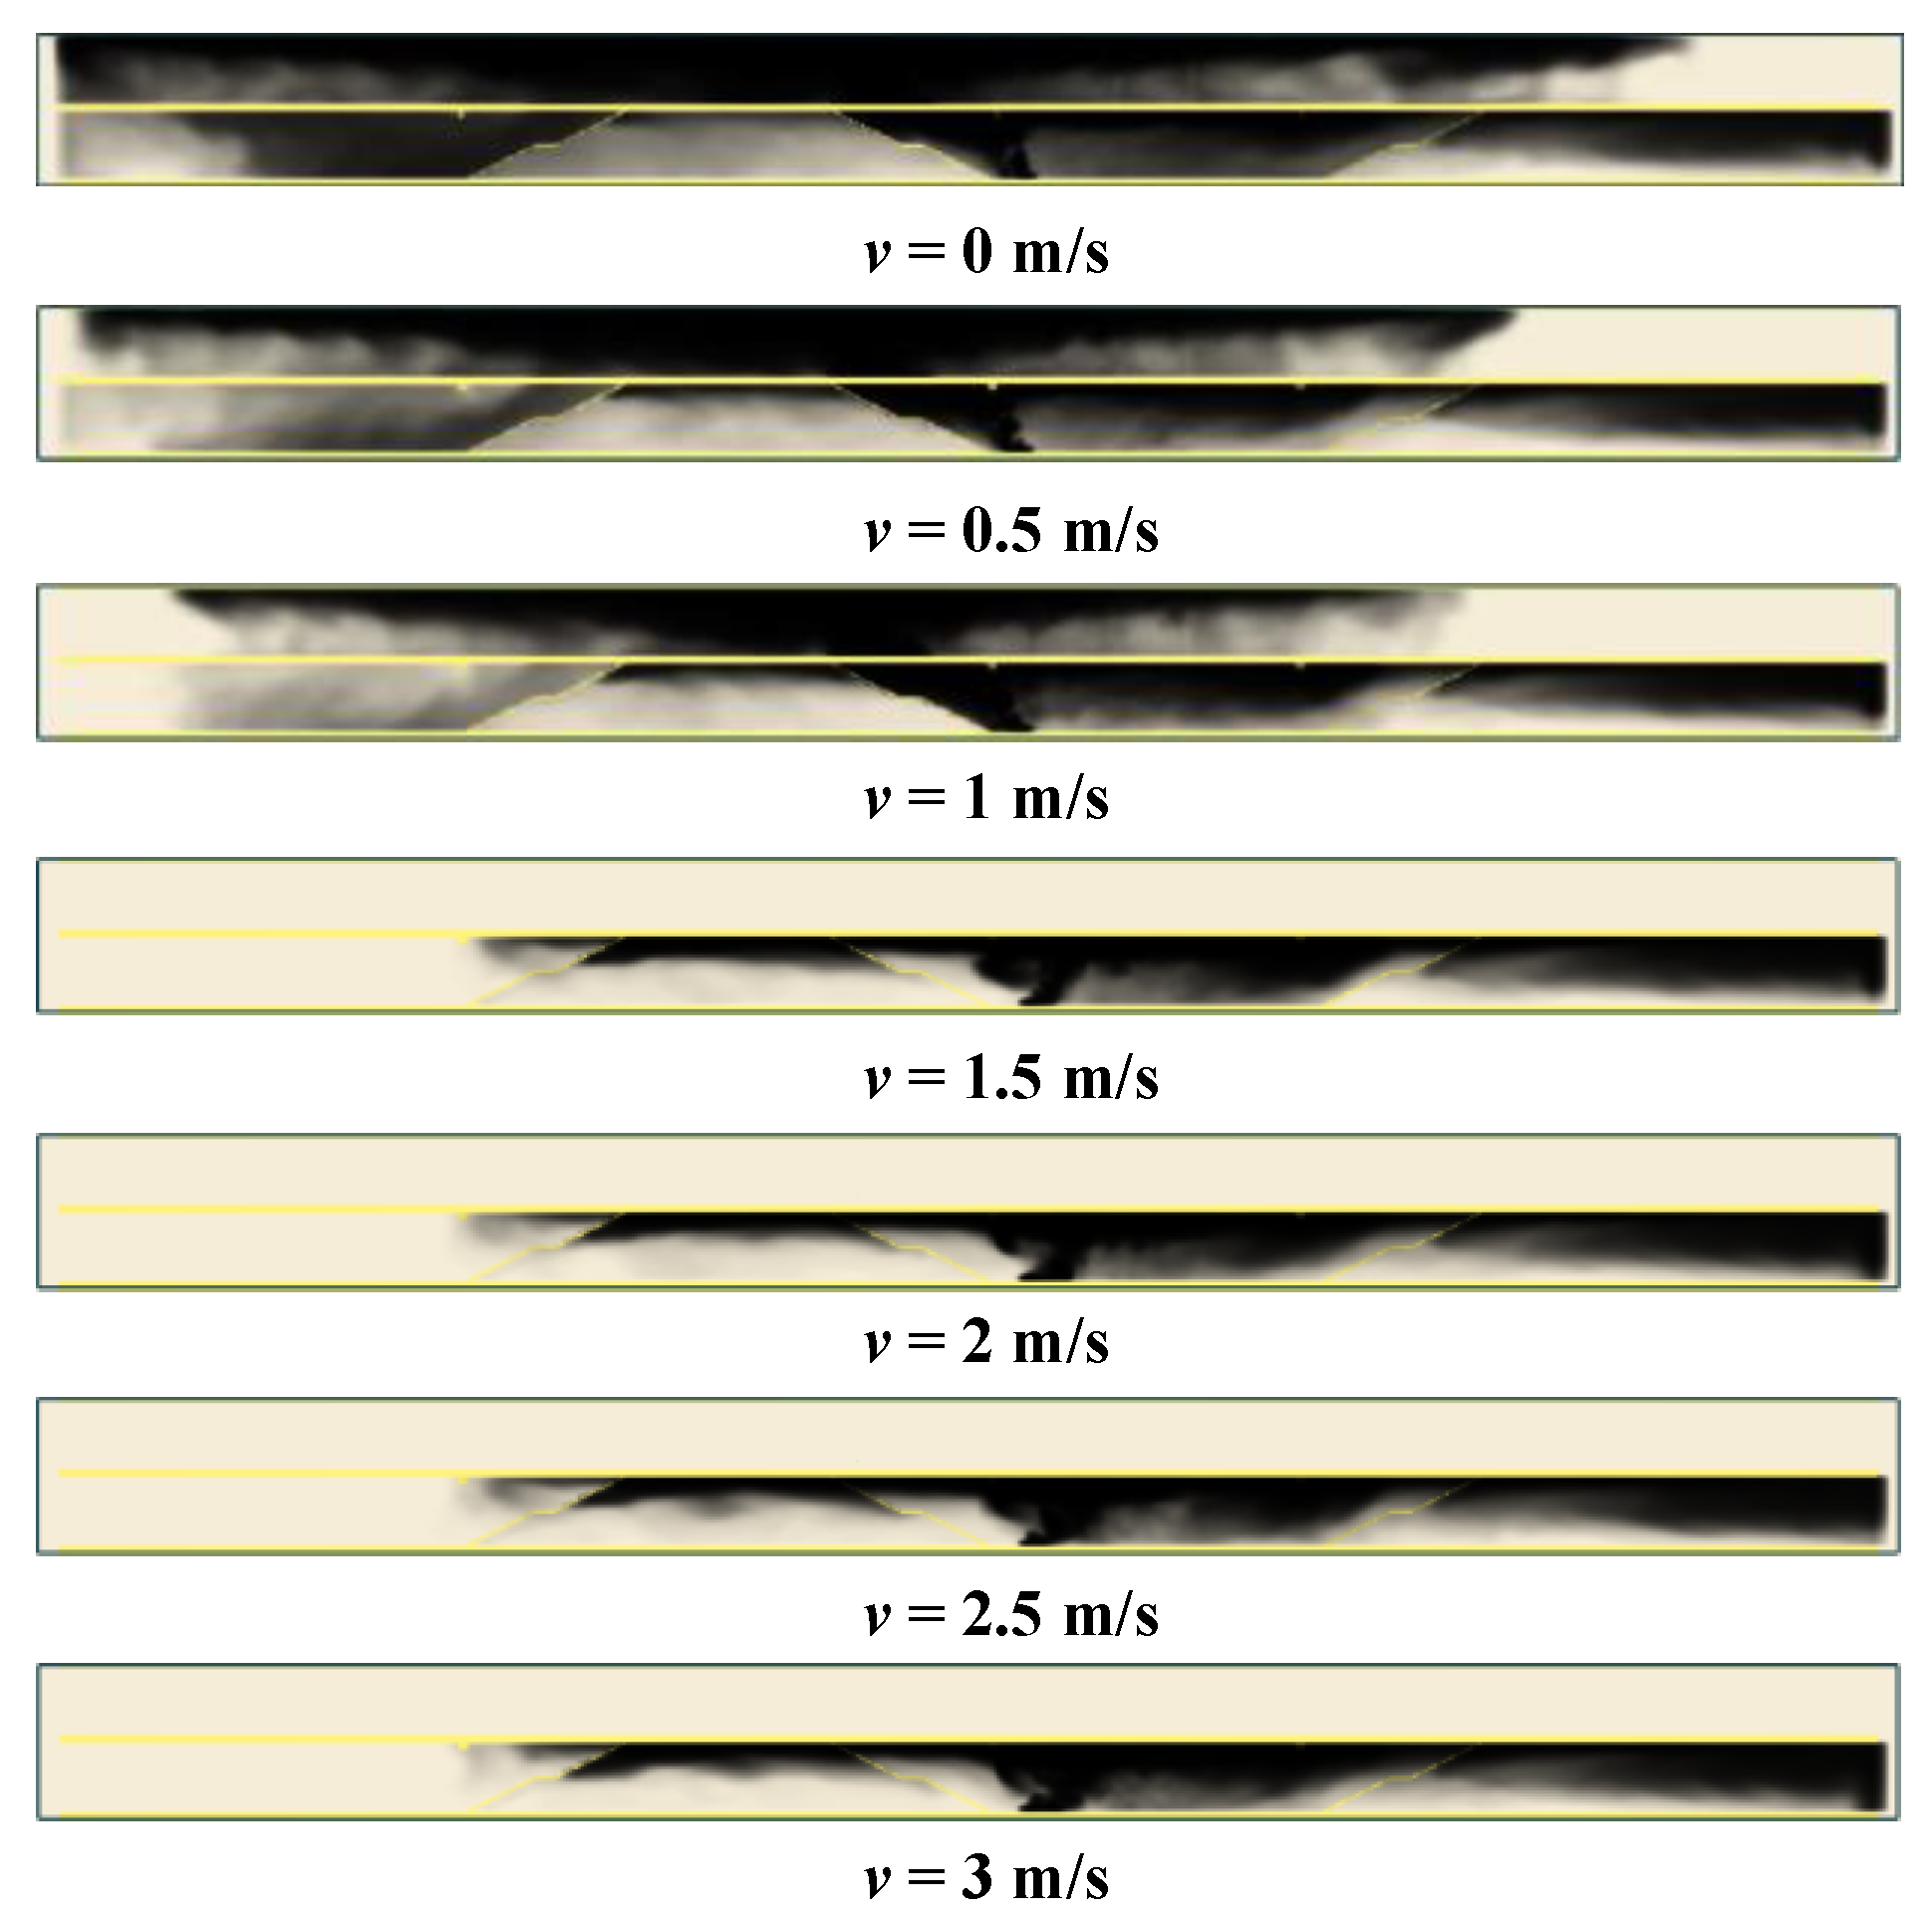
3.1.1. Smoke Spread Process
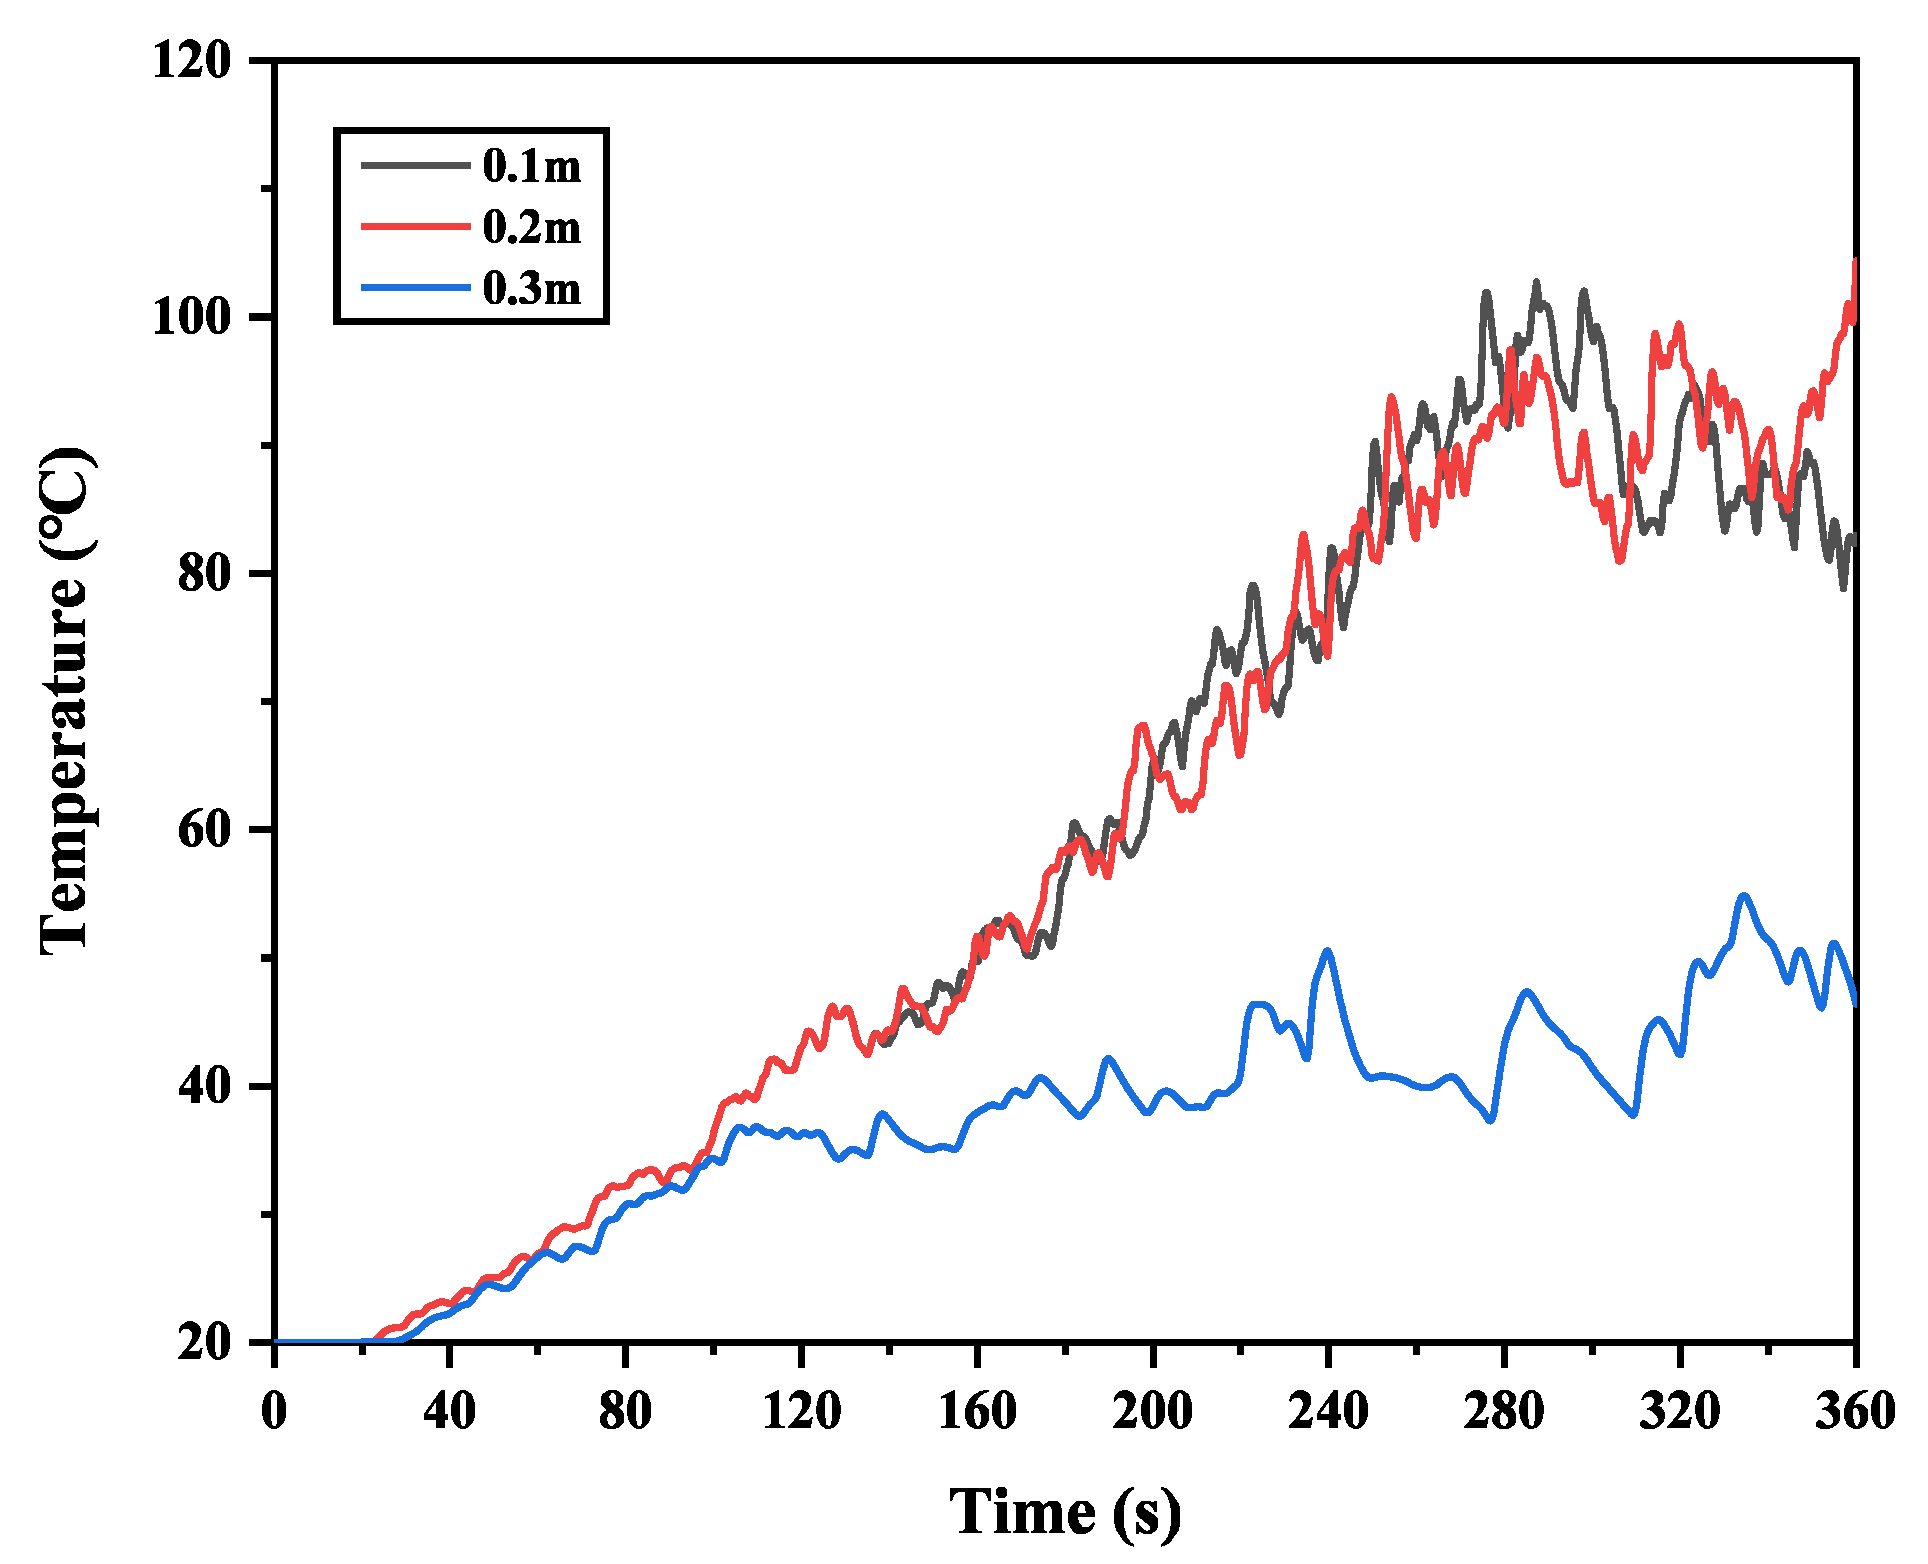
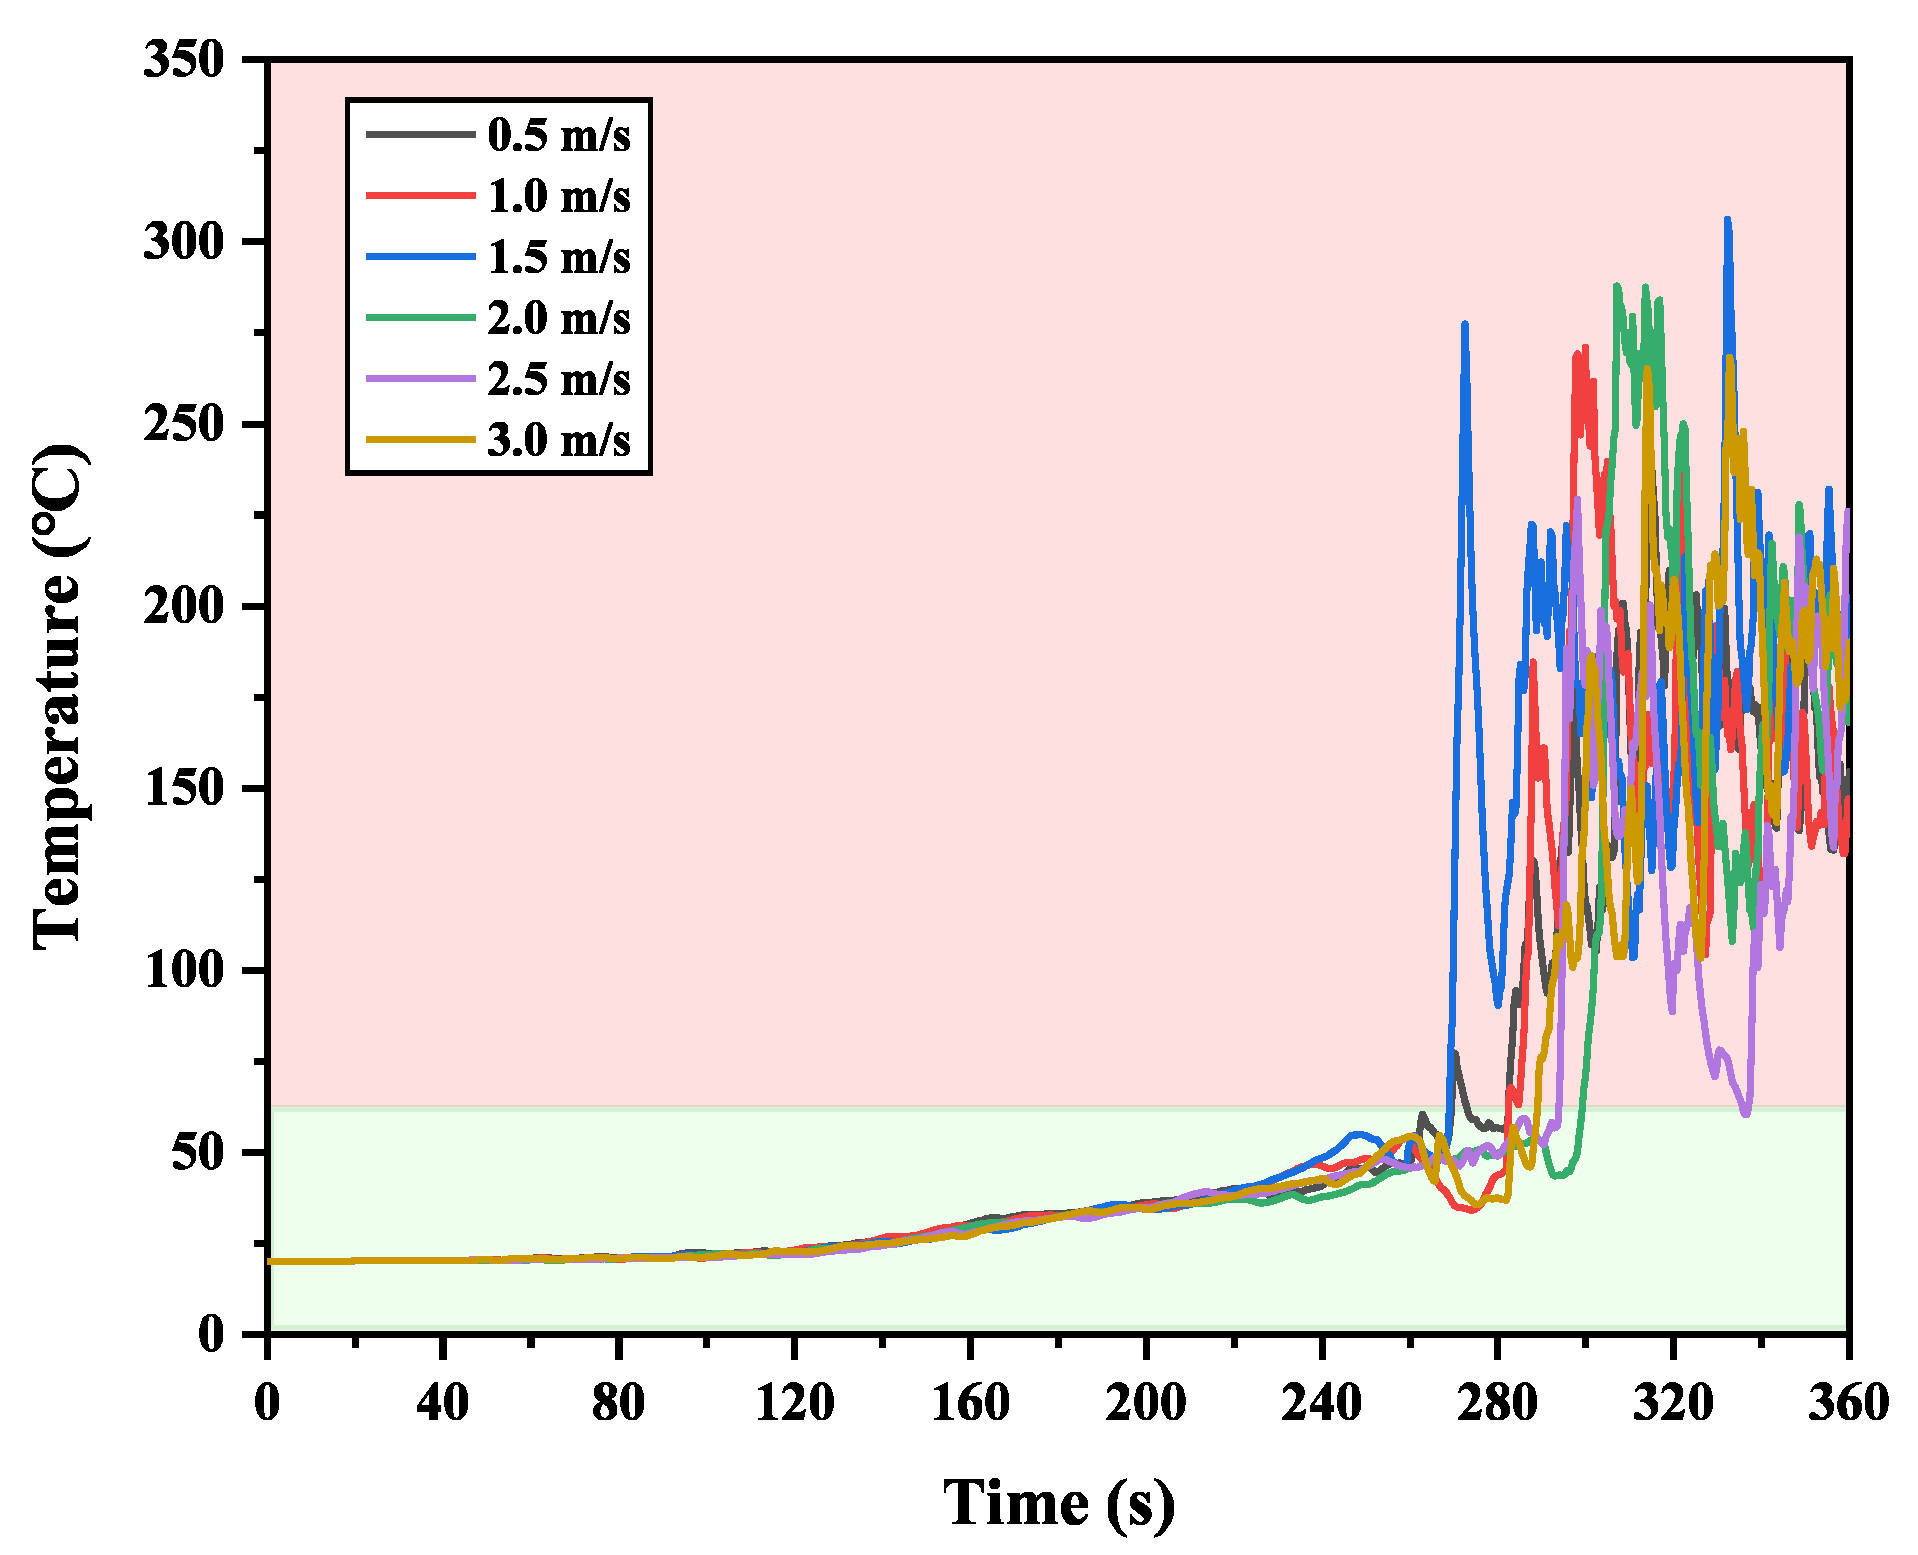
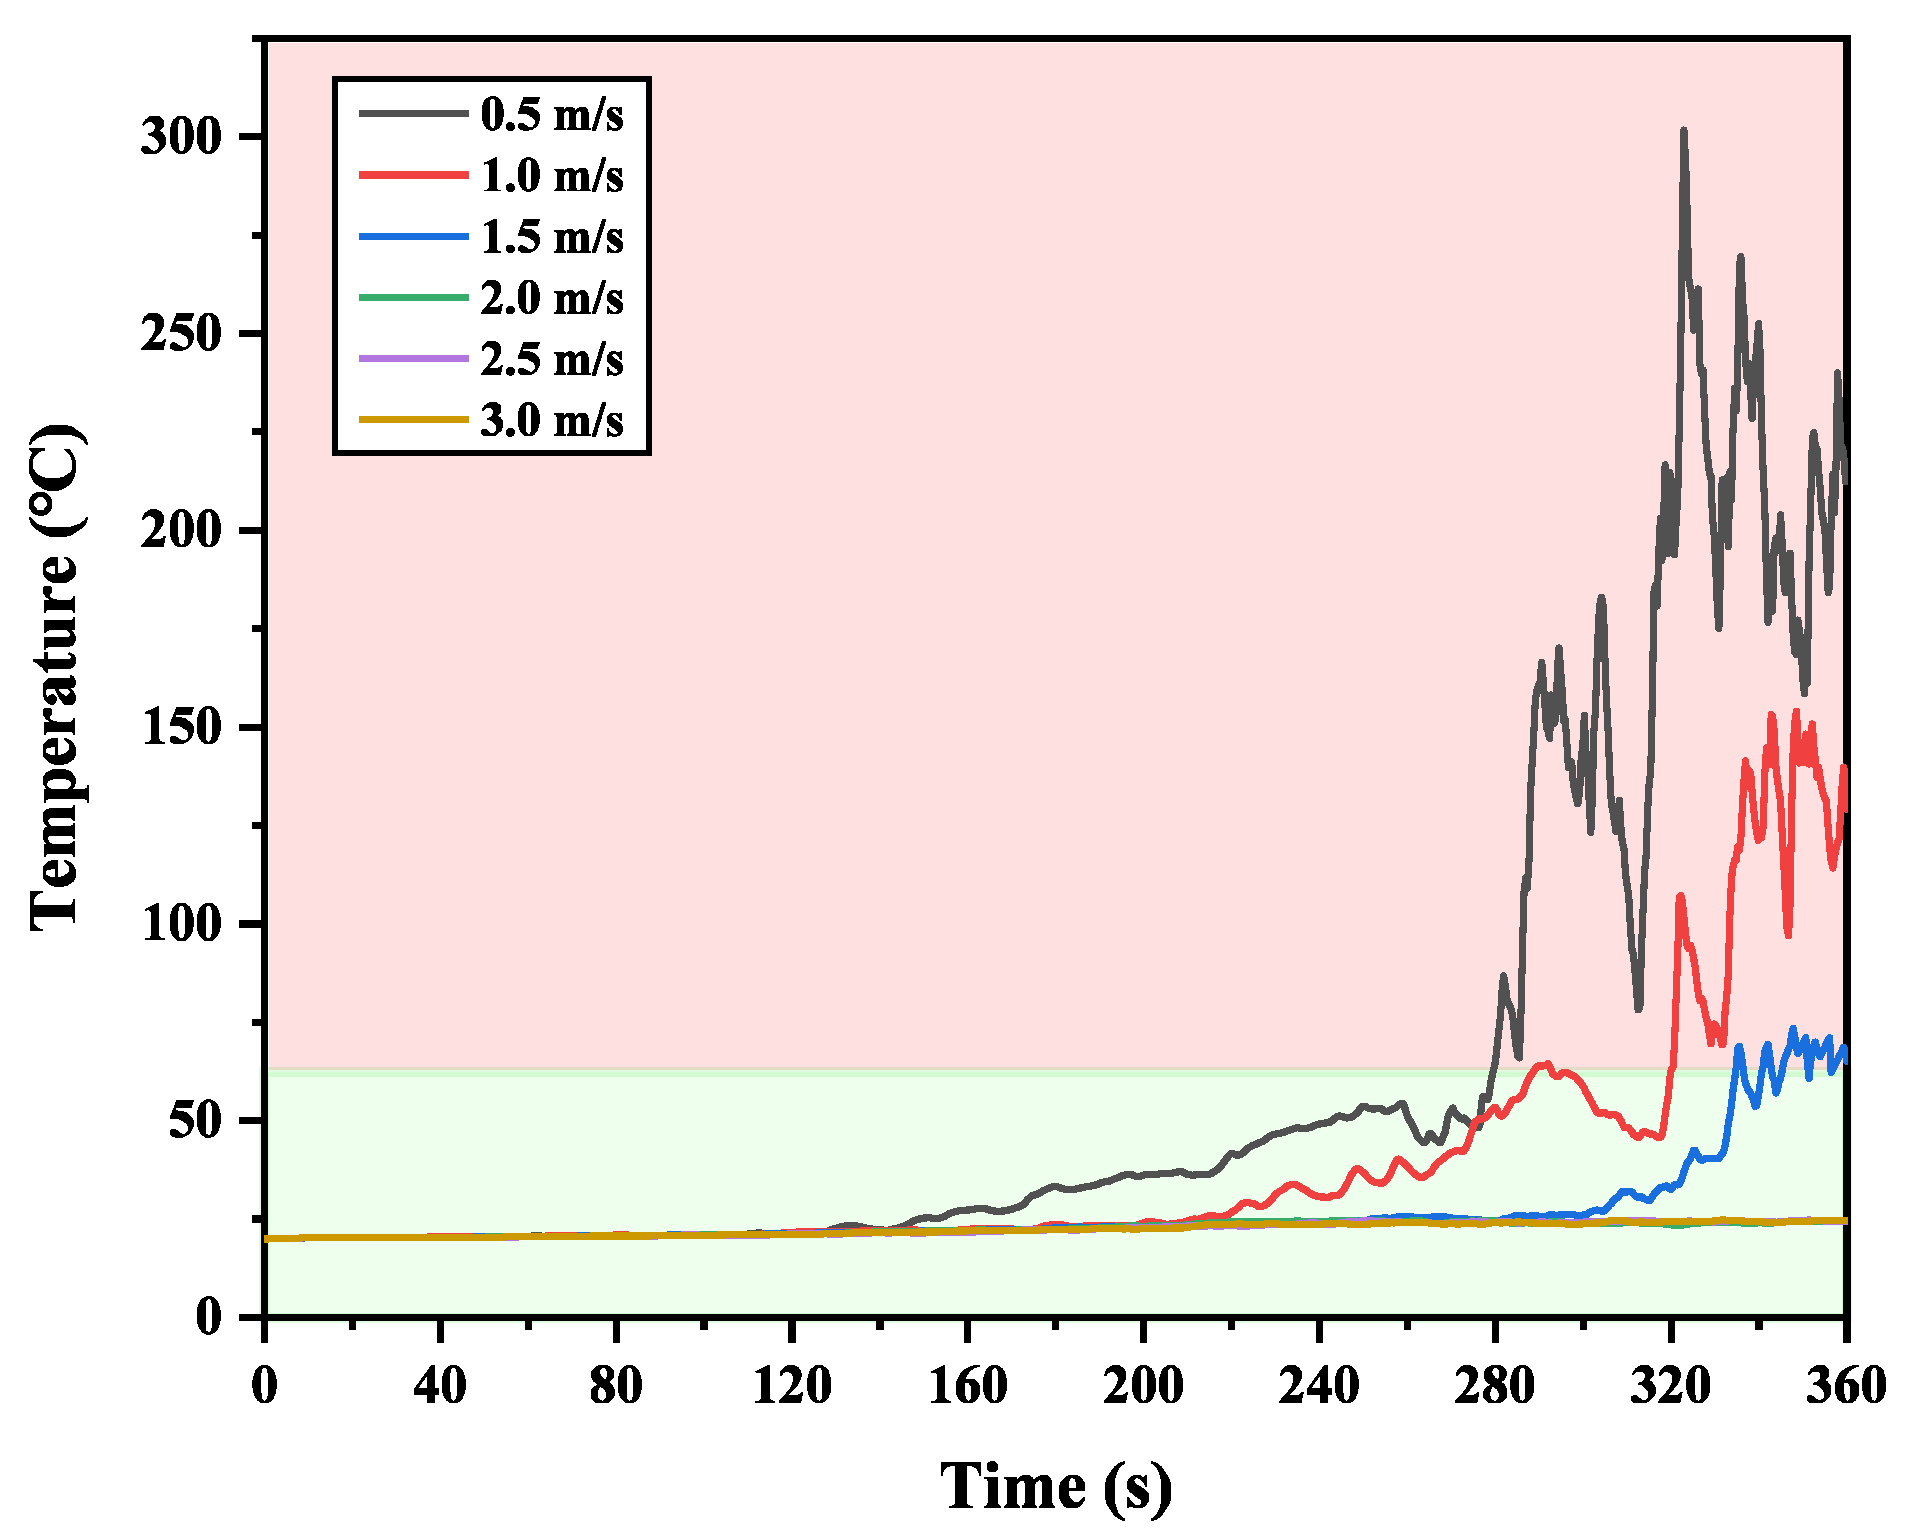
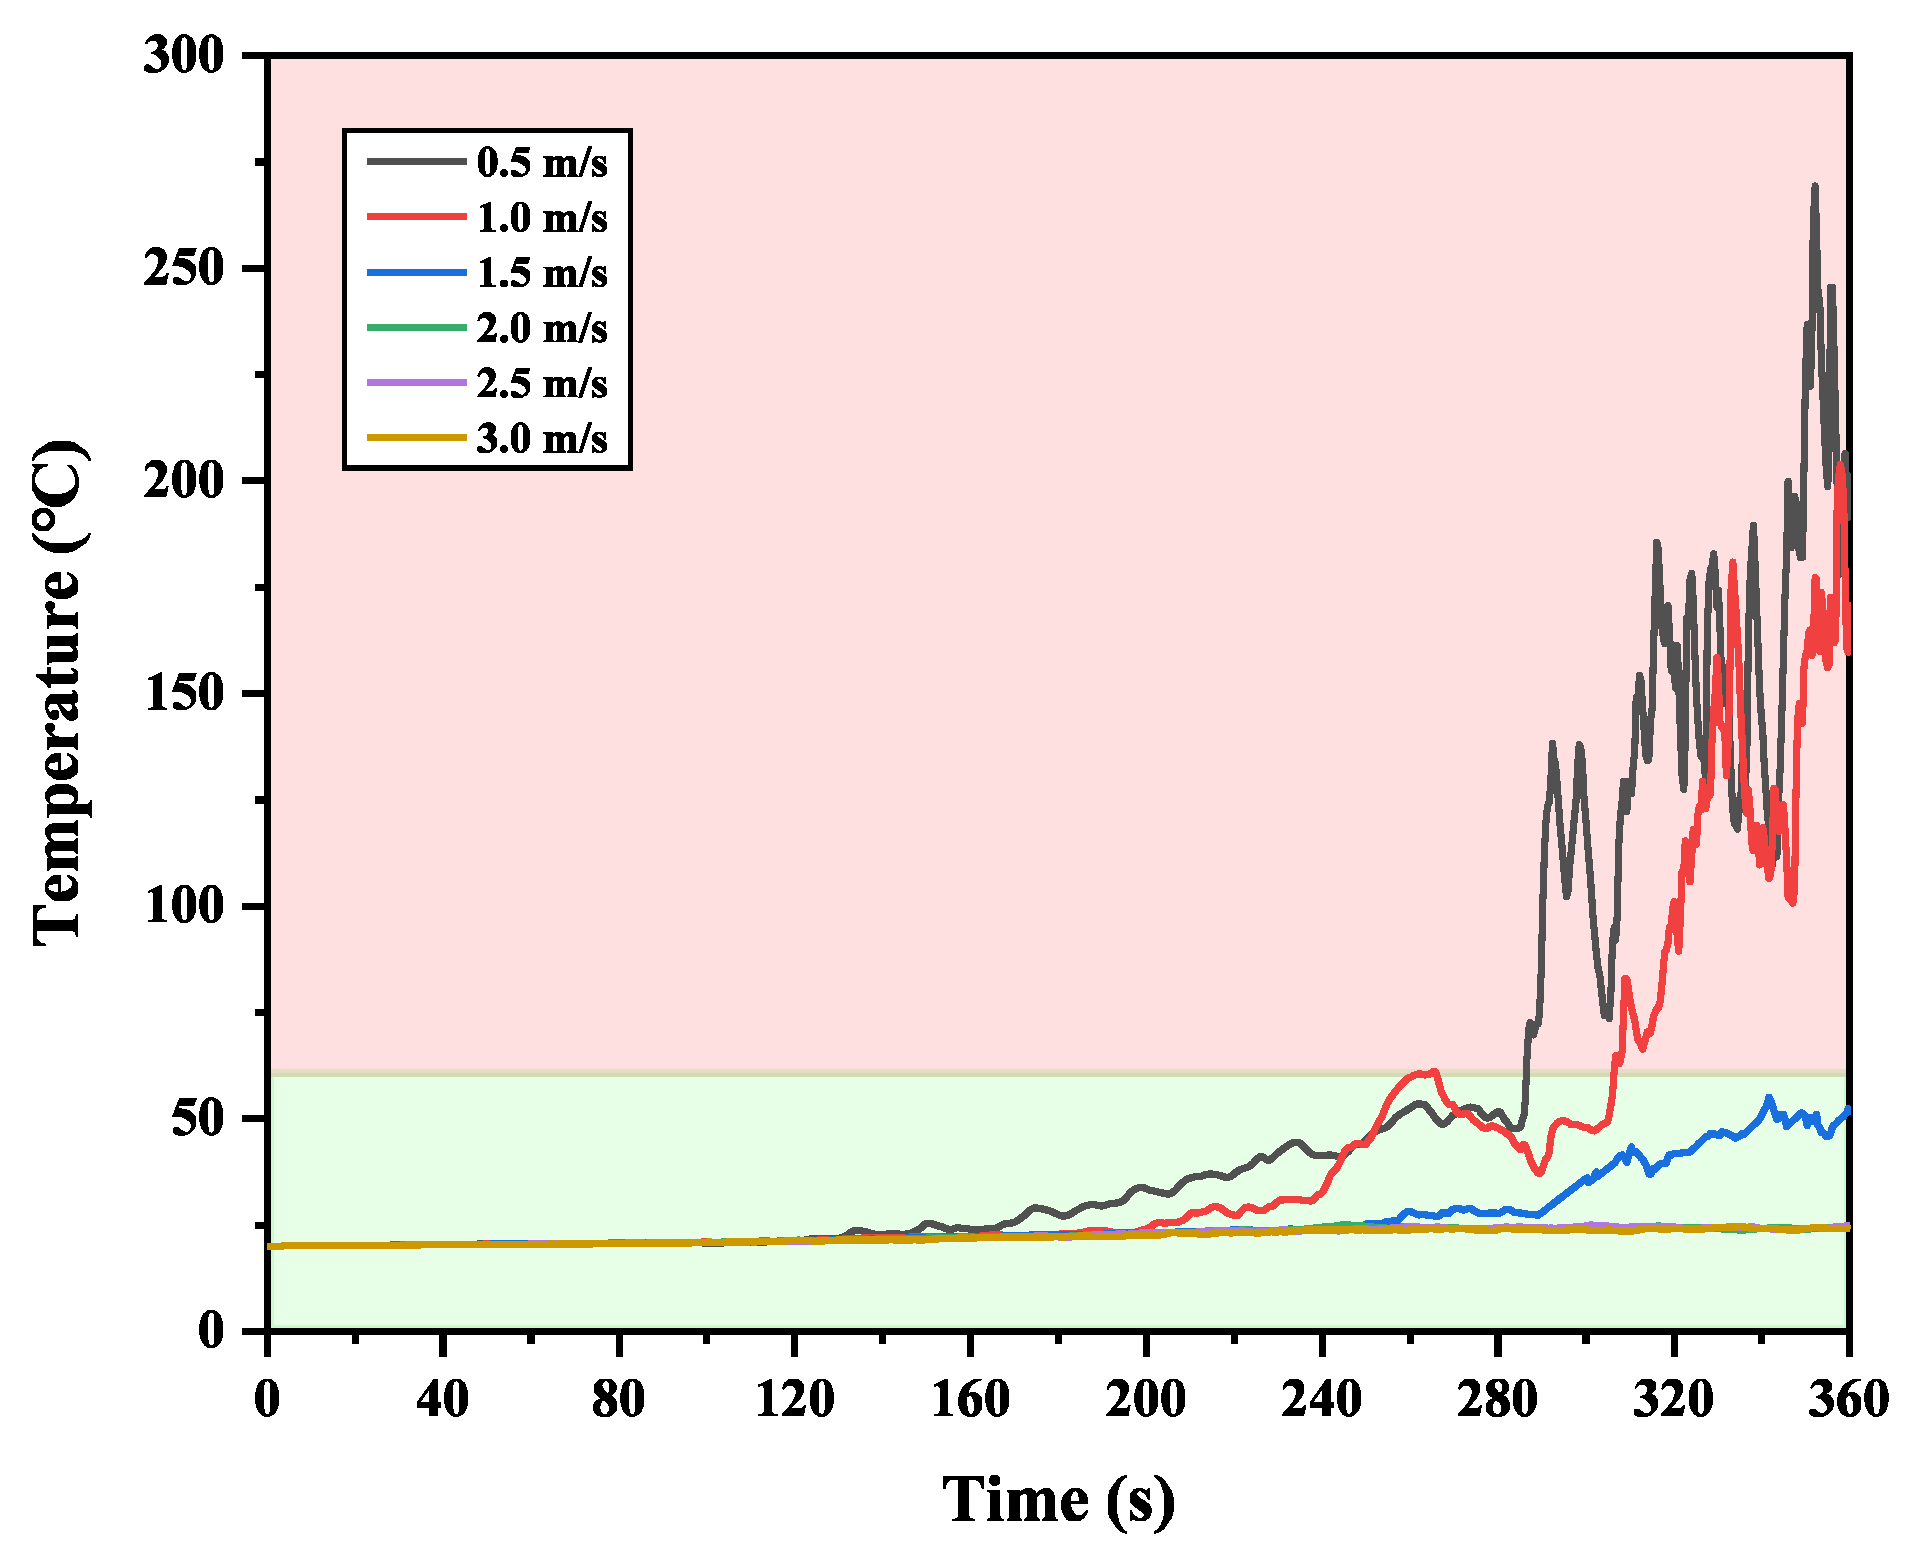
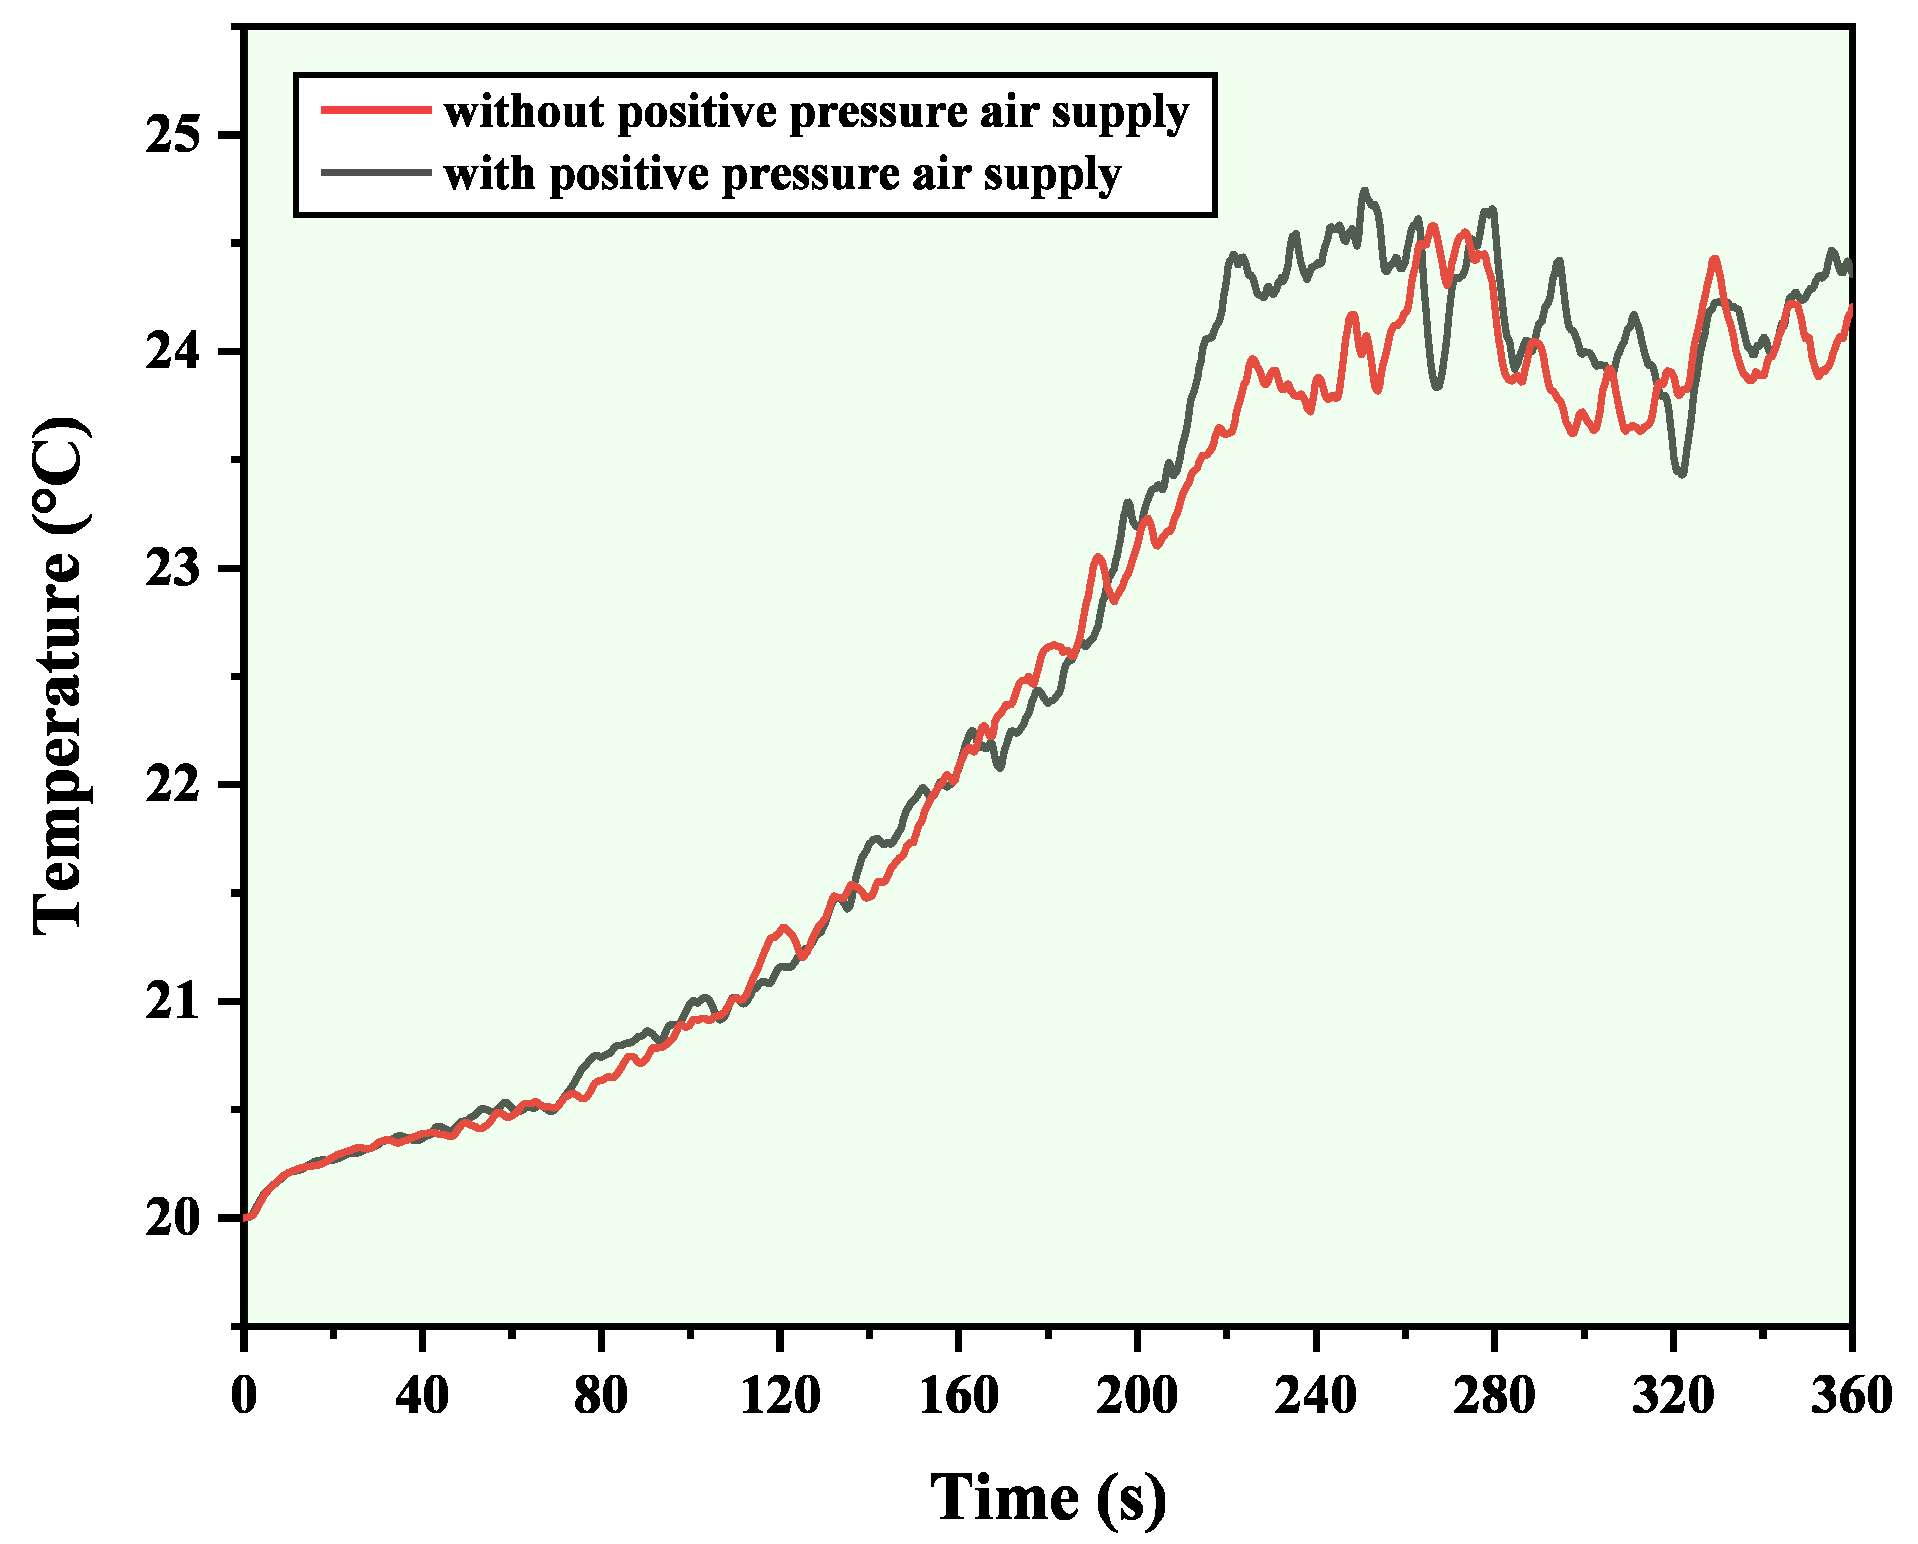
3.1.2. Temperature
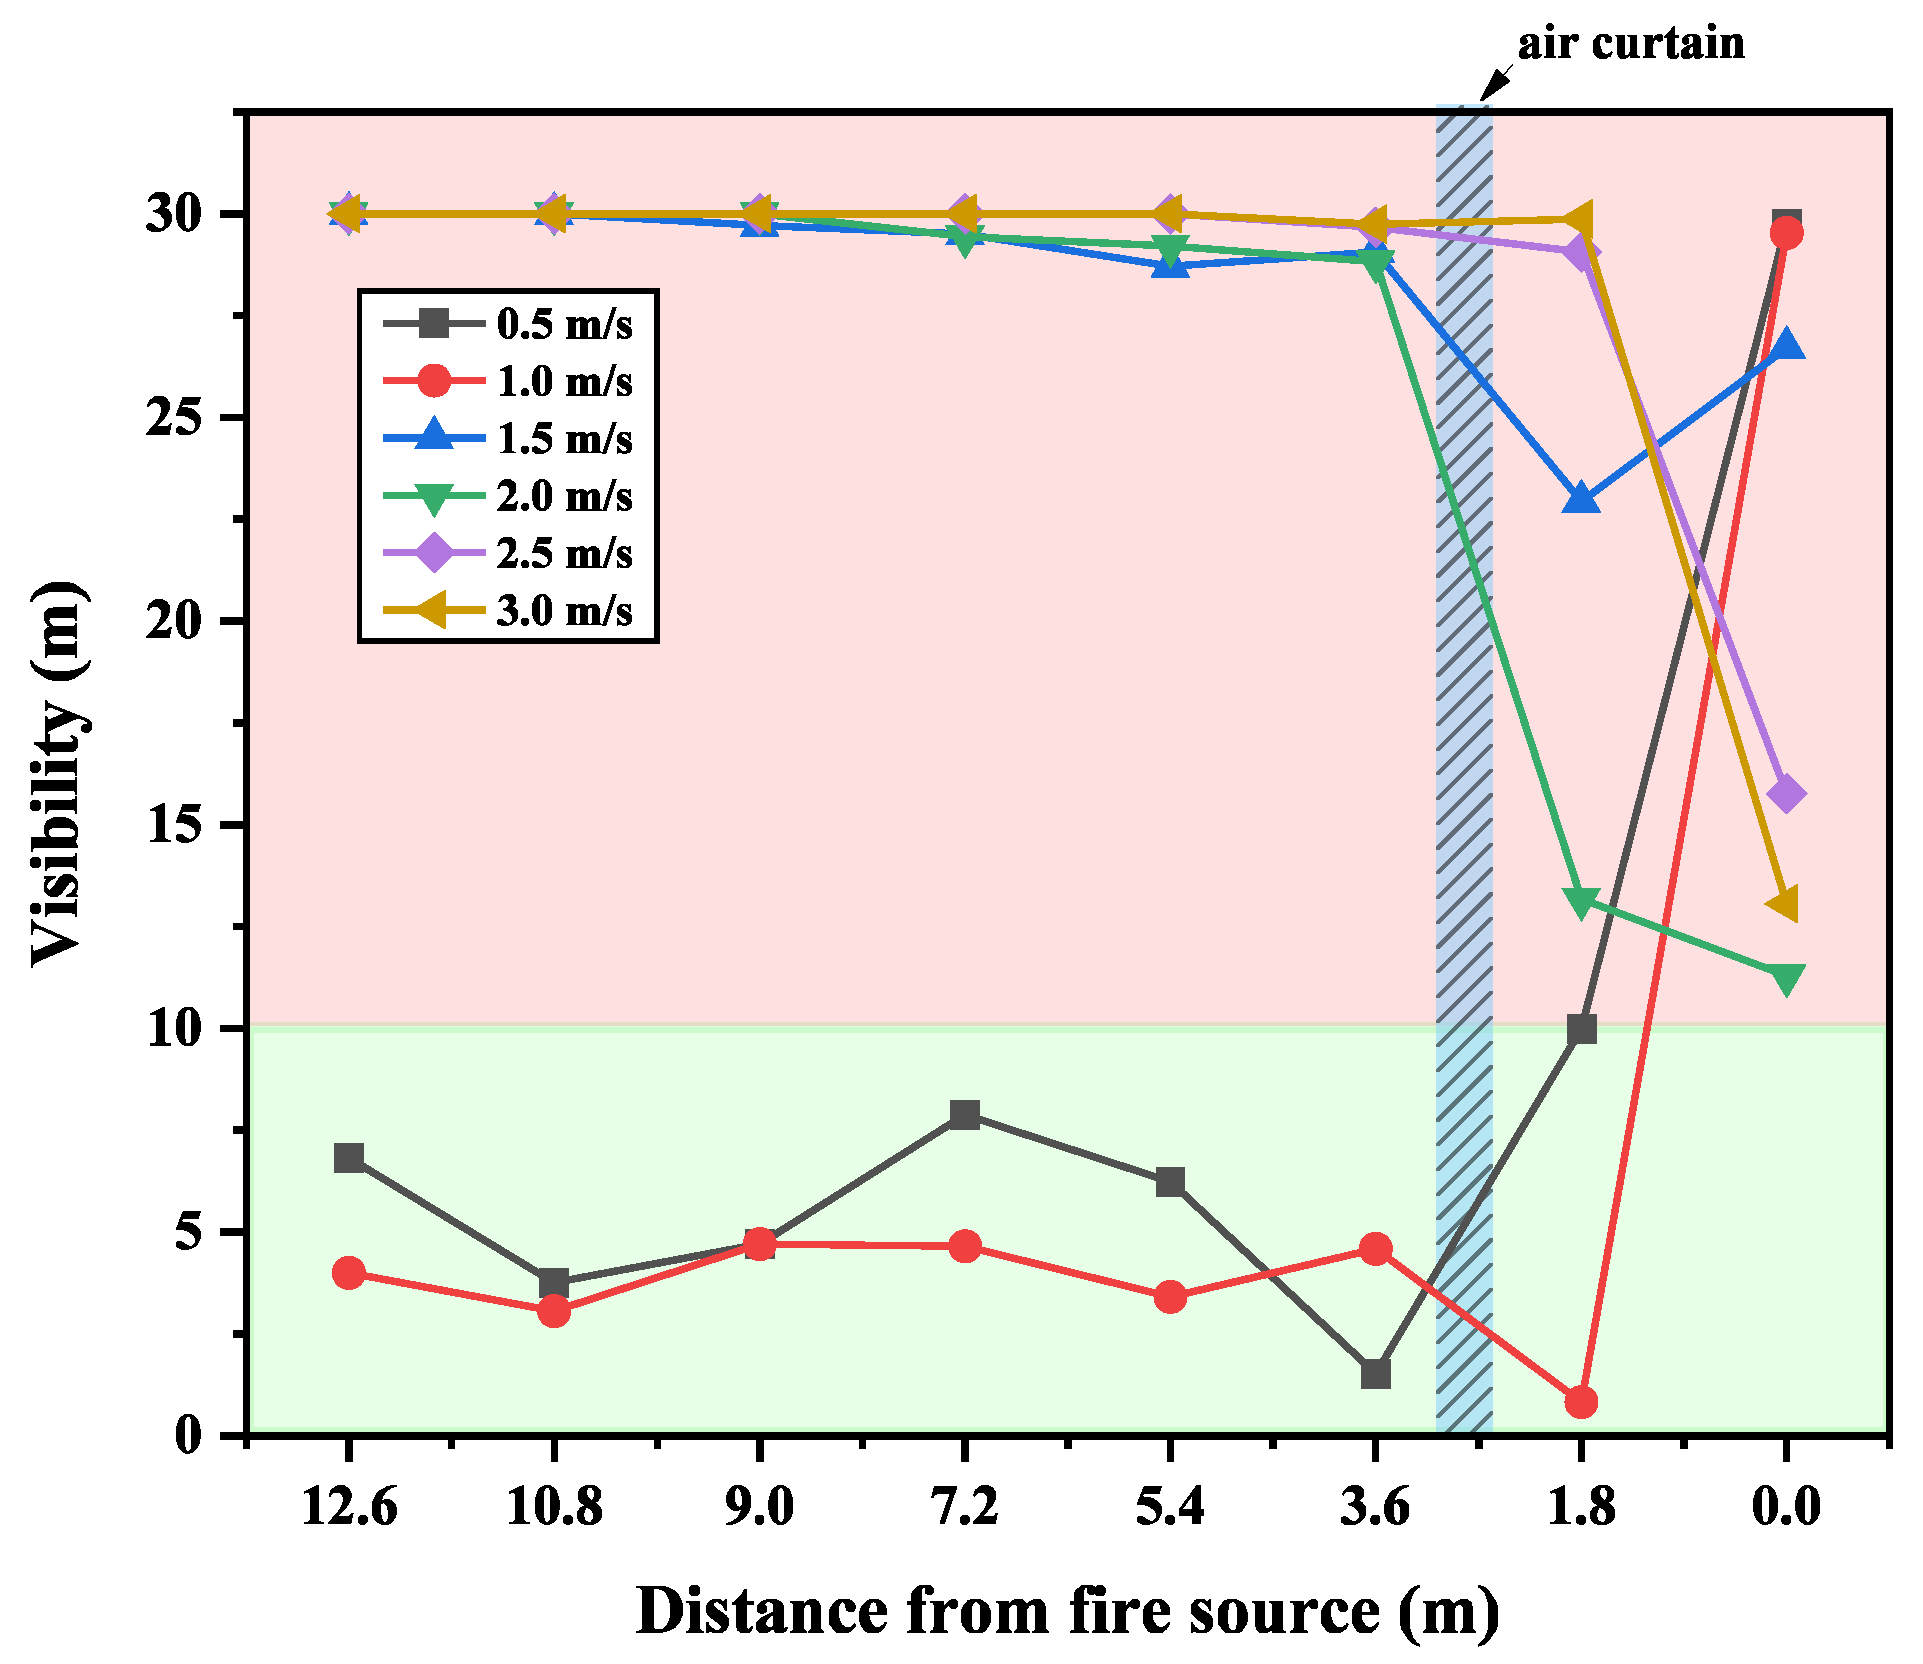
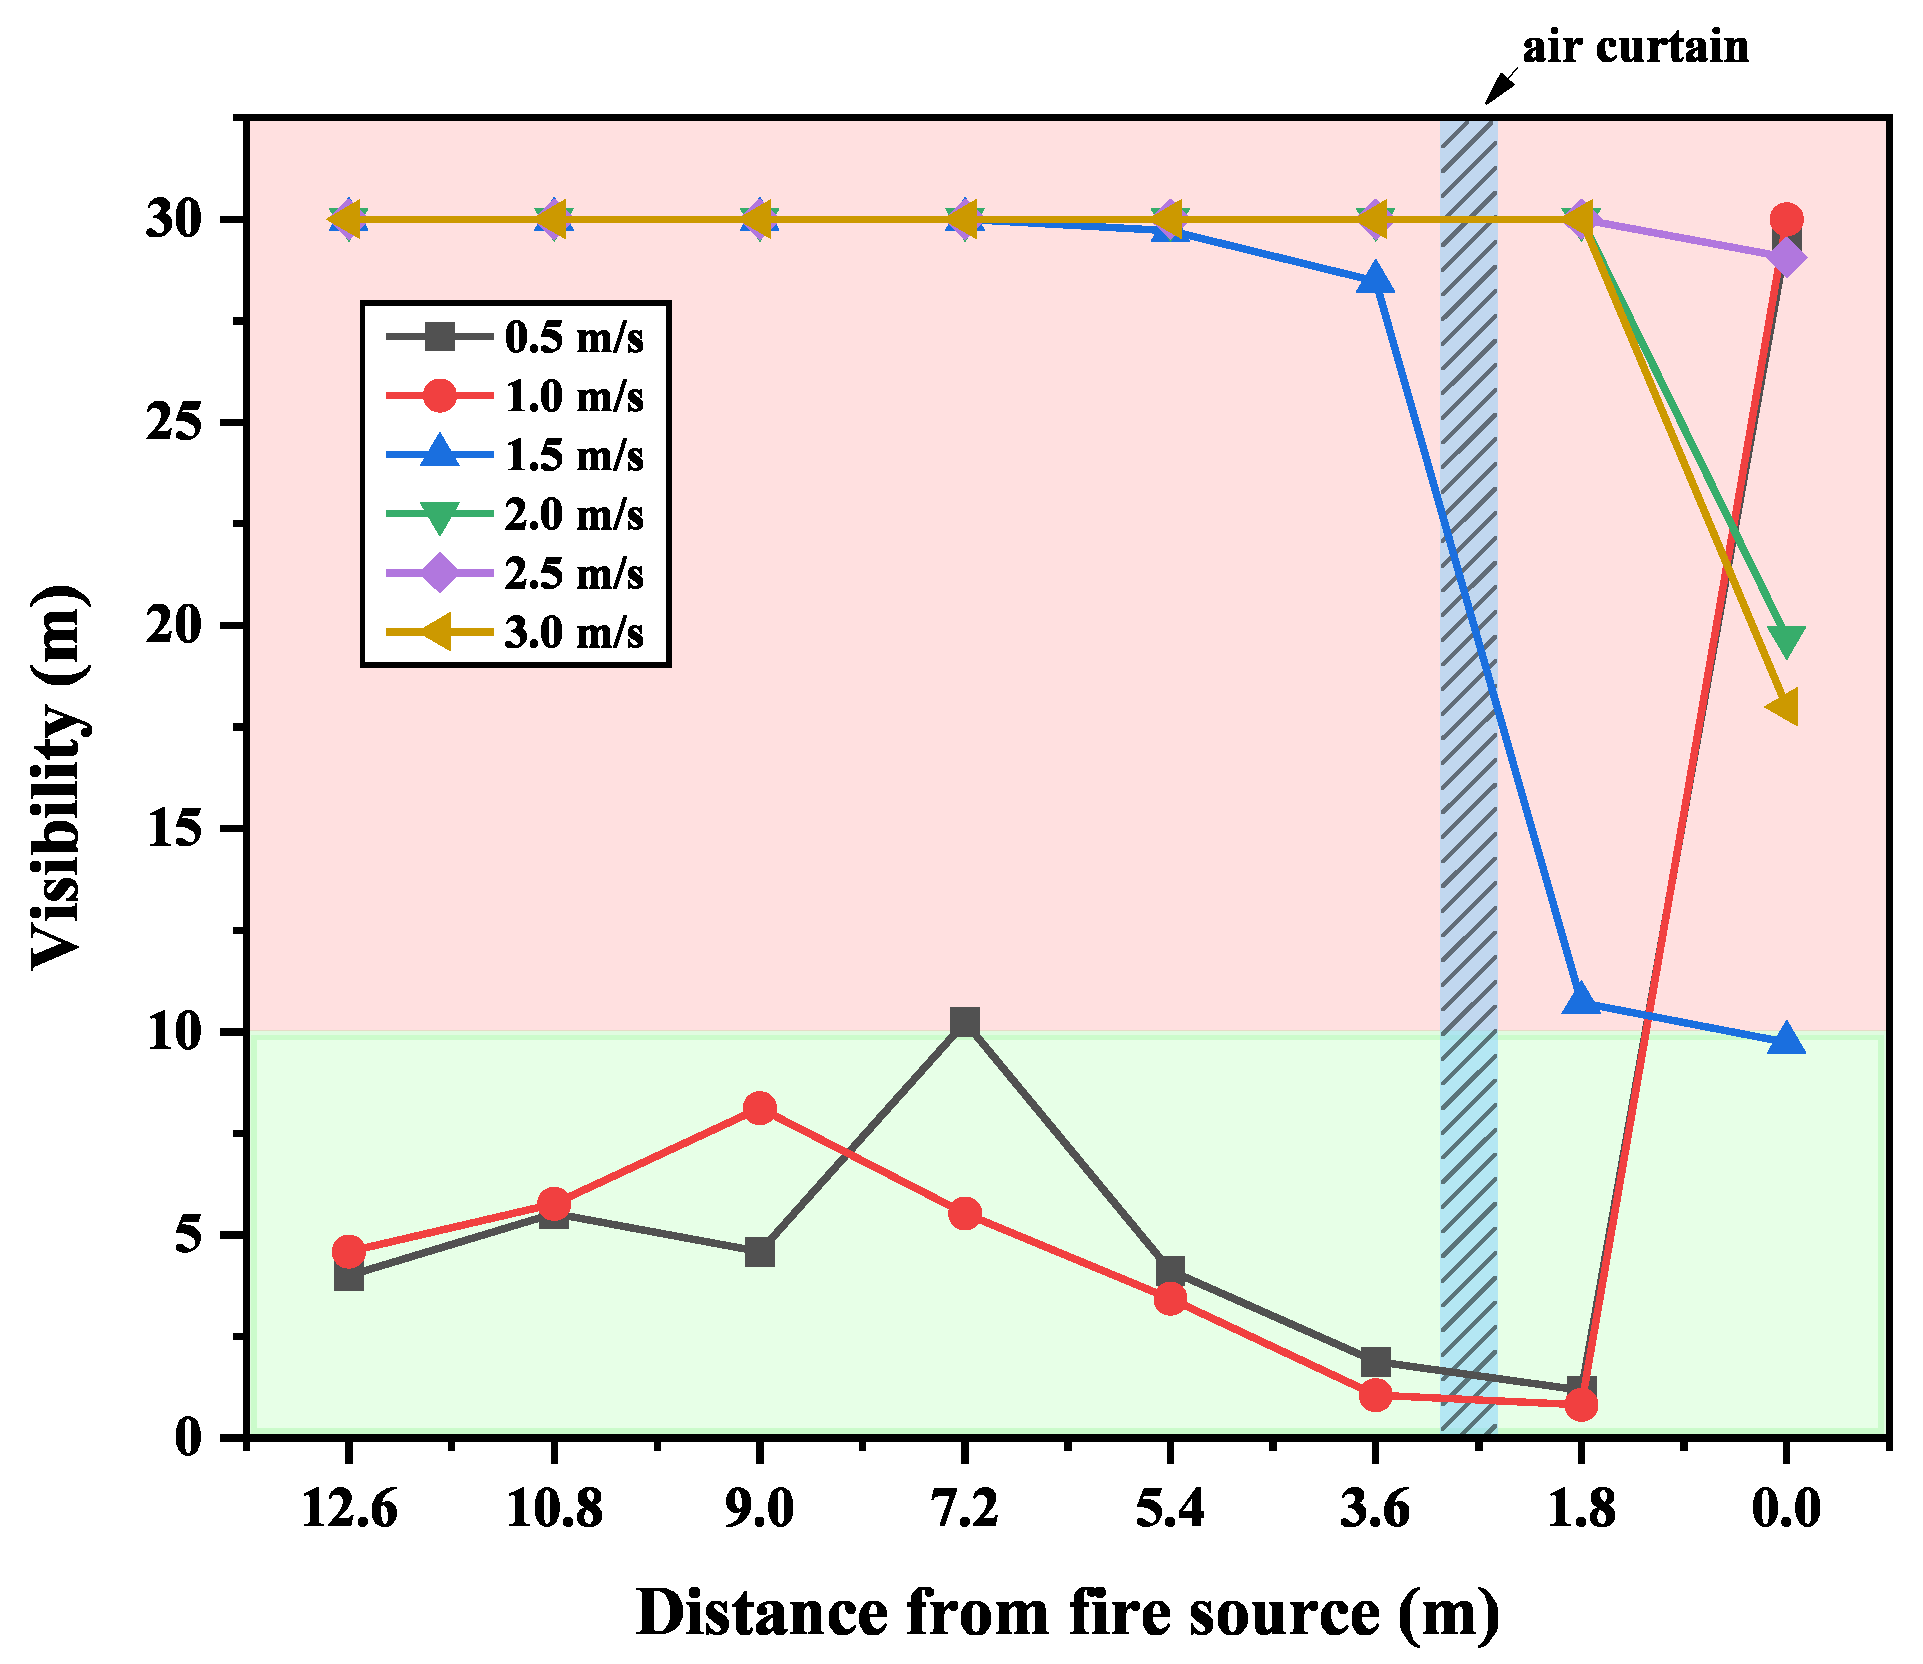
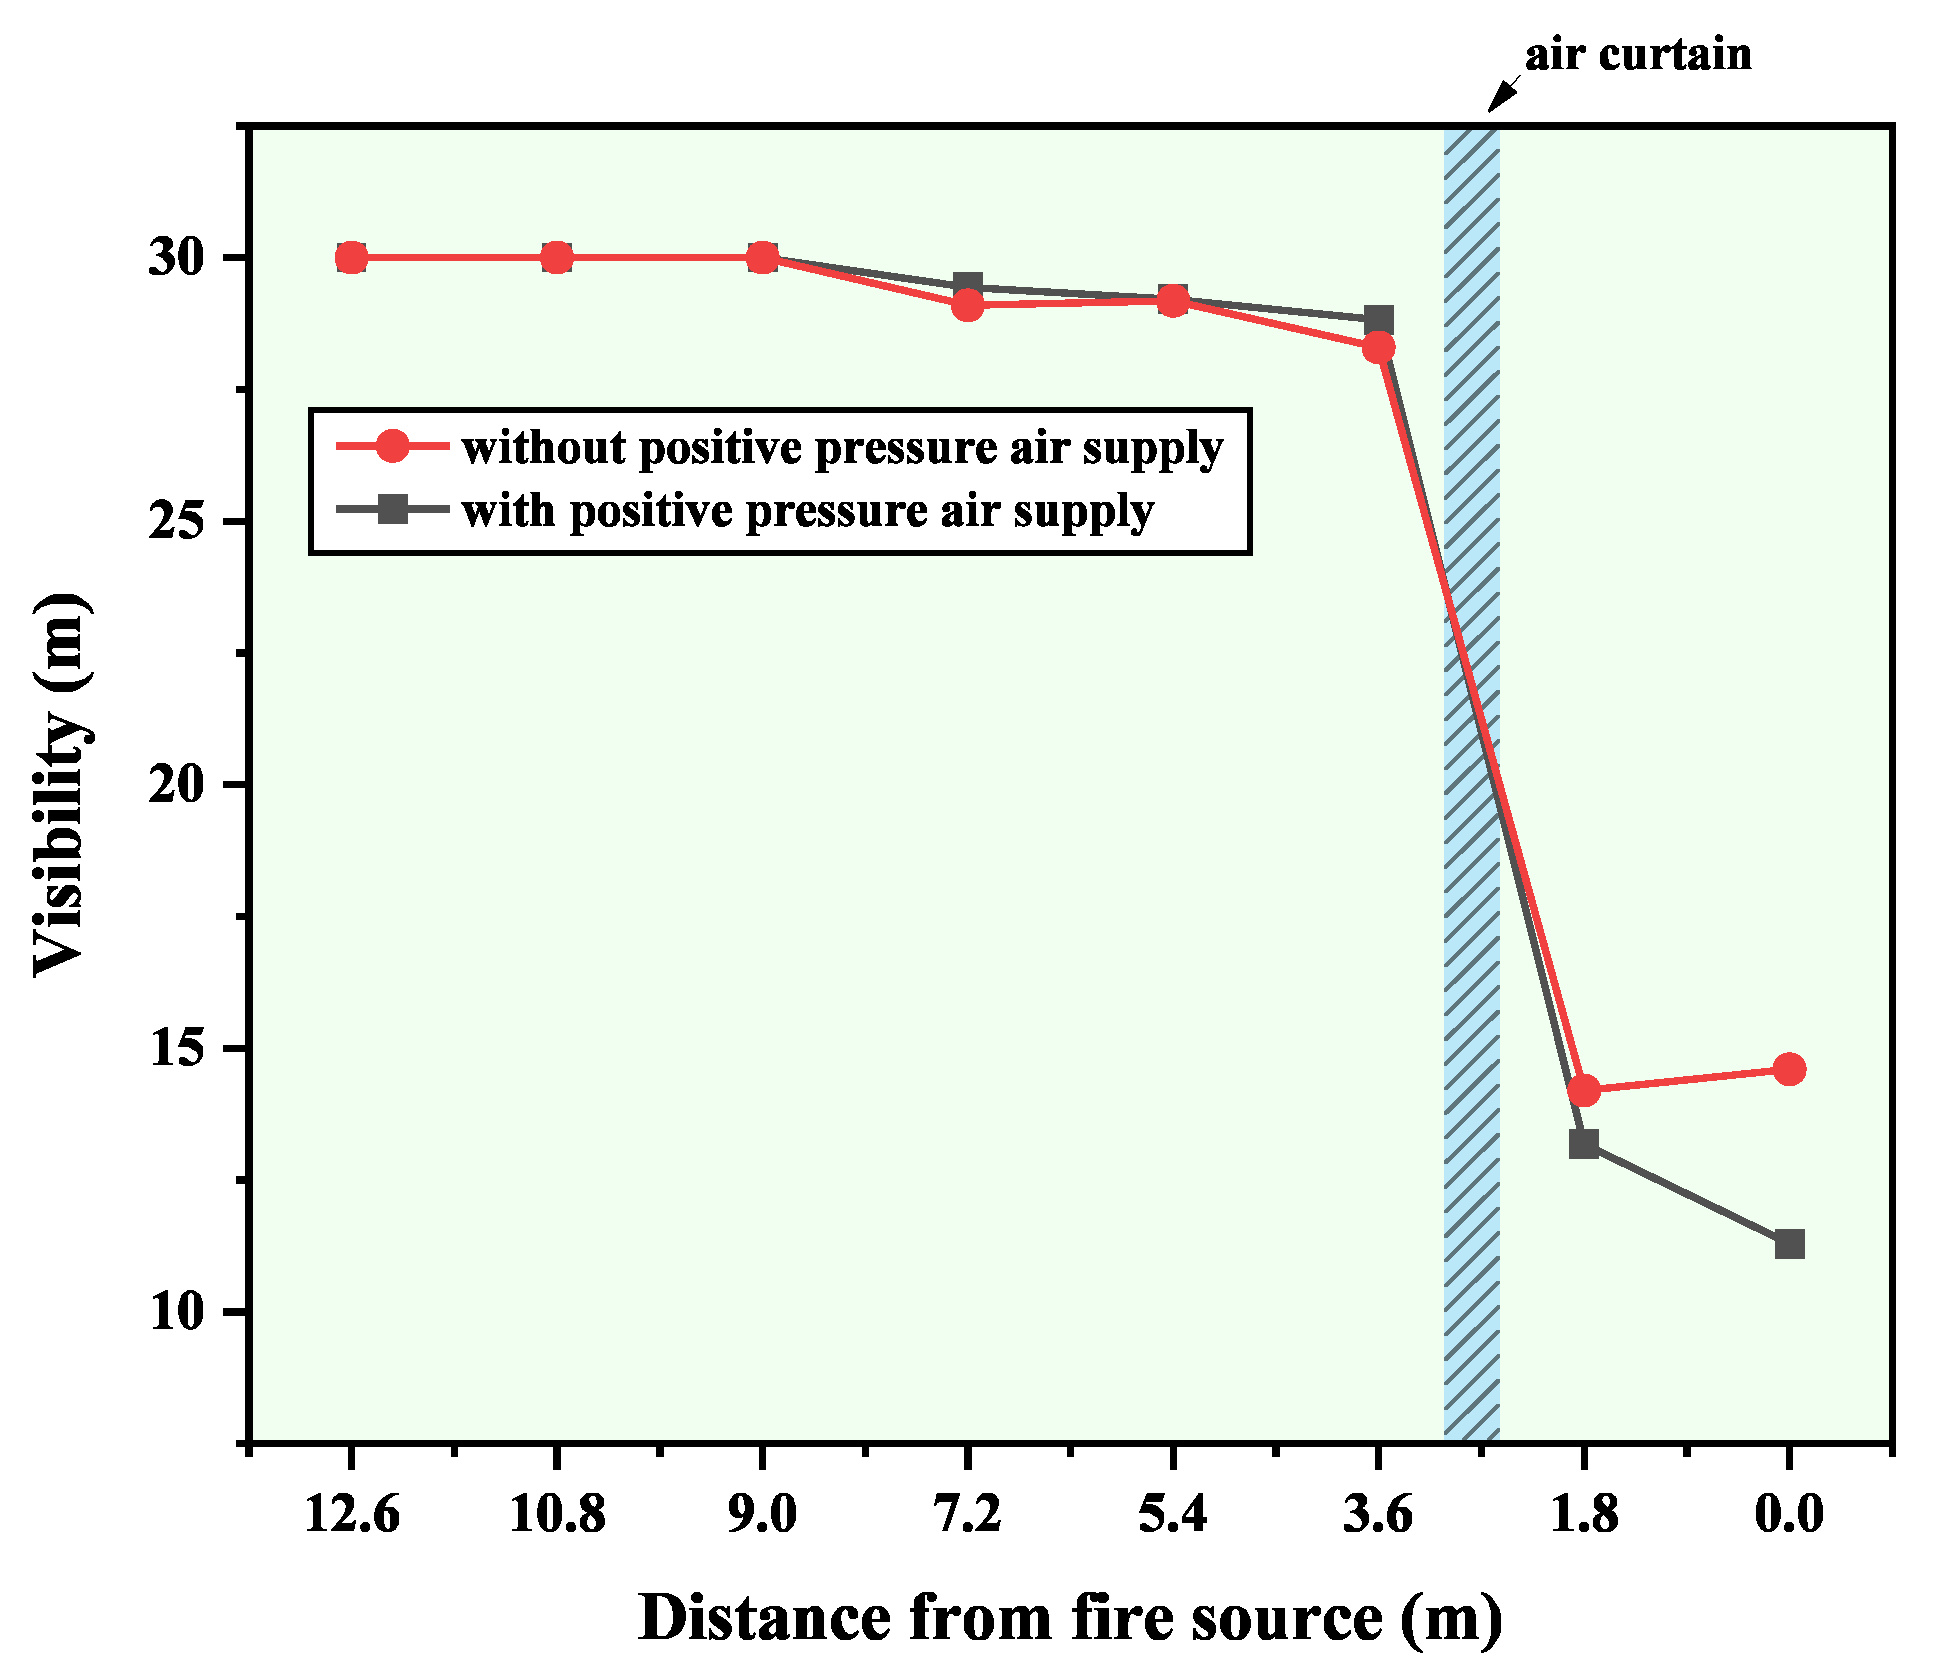
3.1.3. Visibility
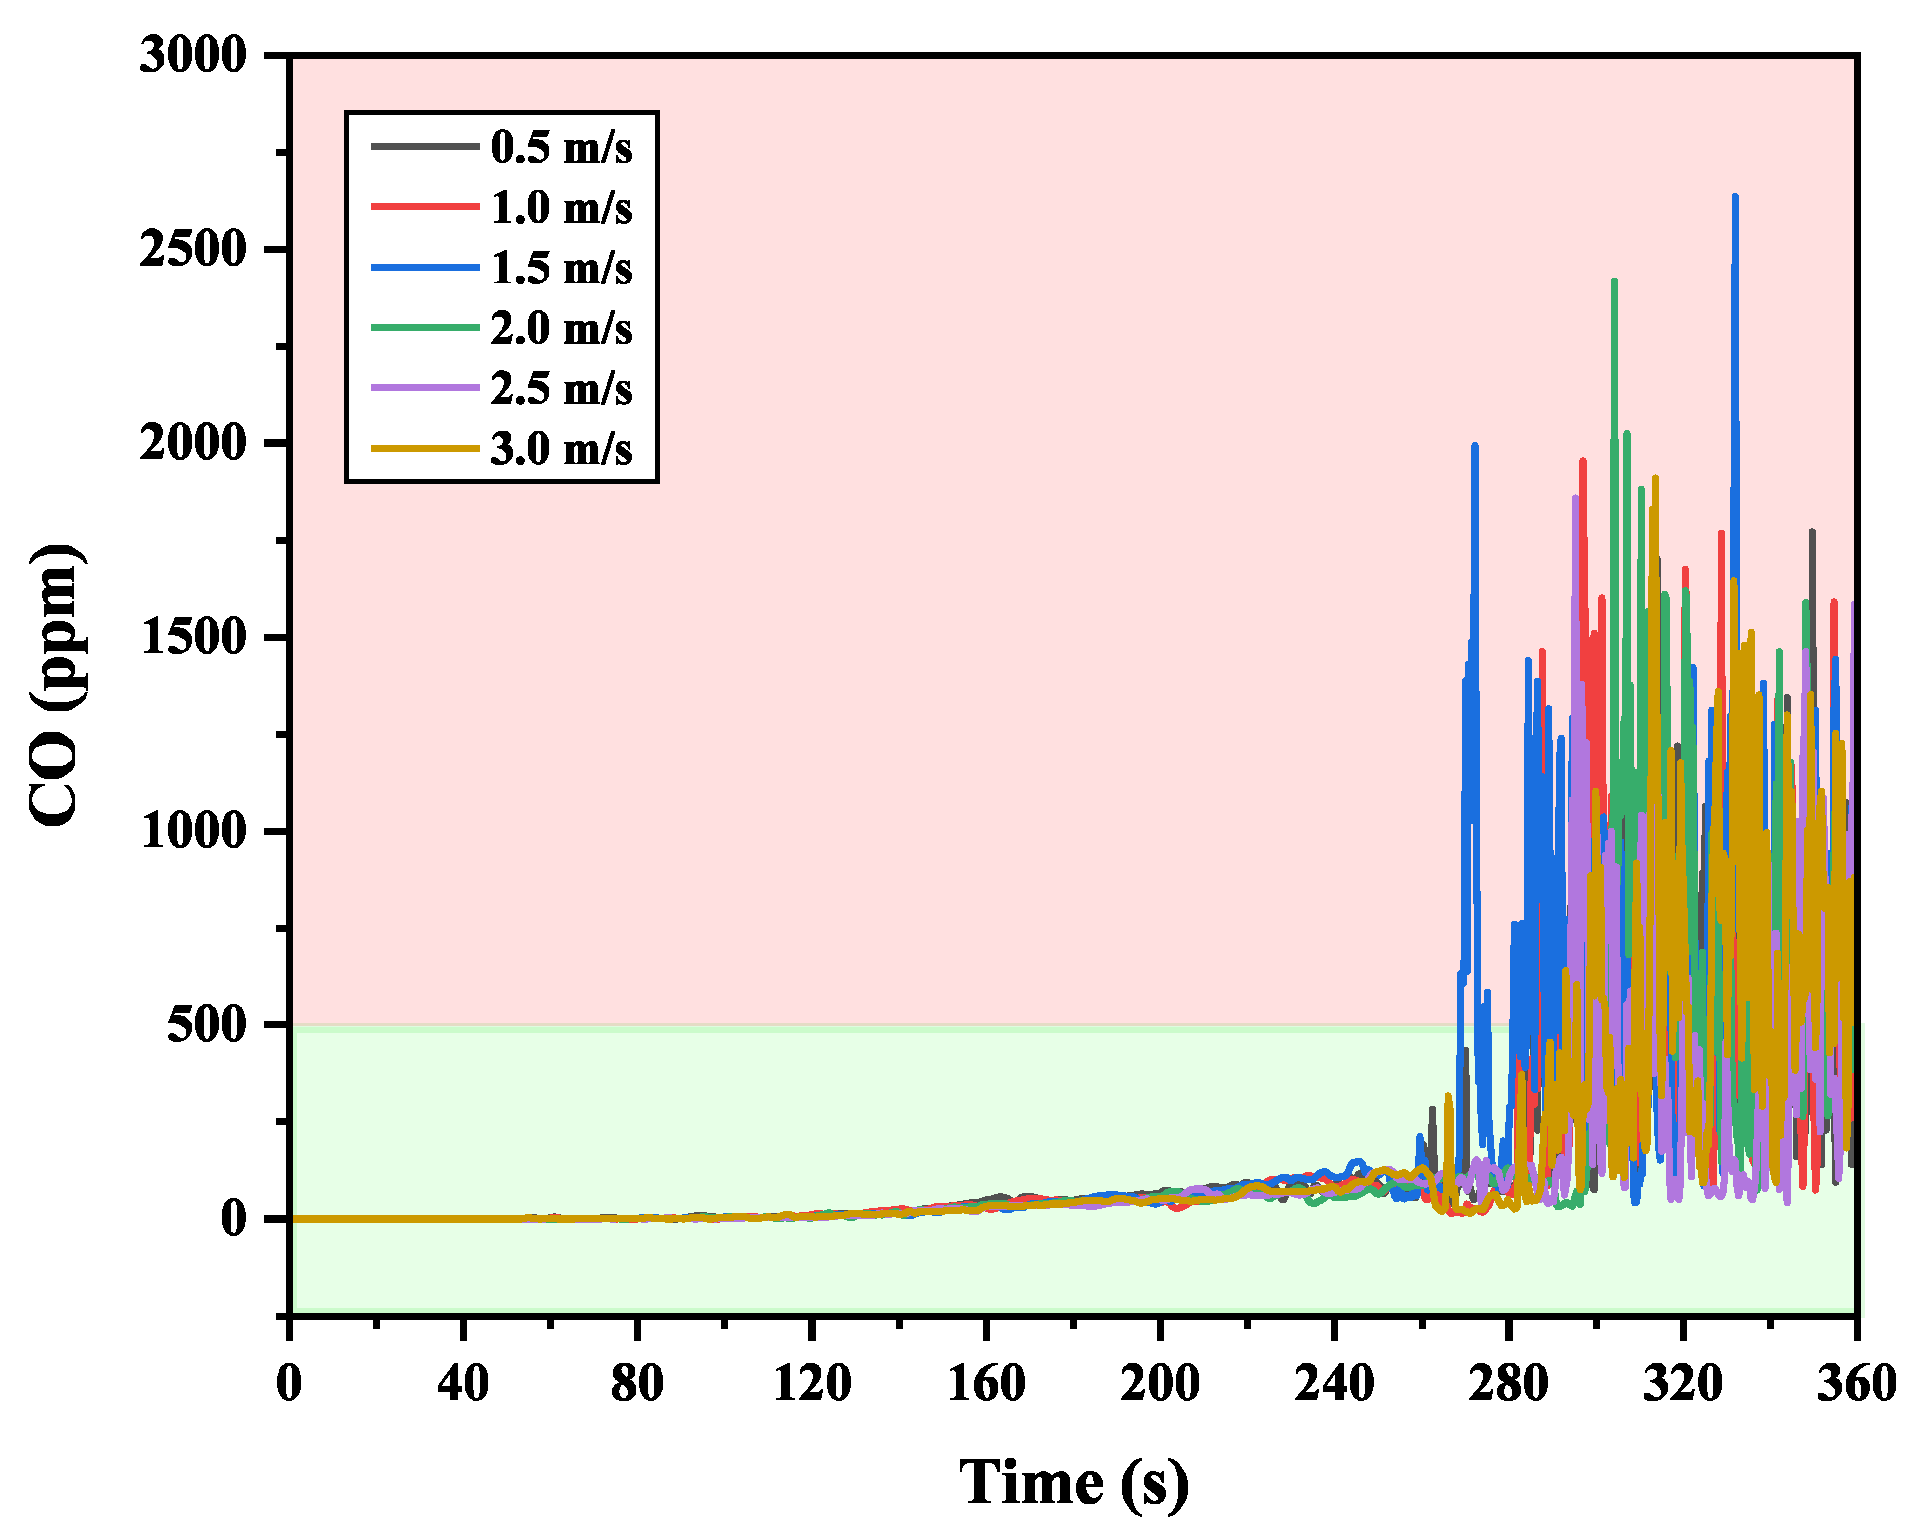
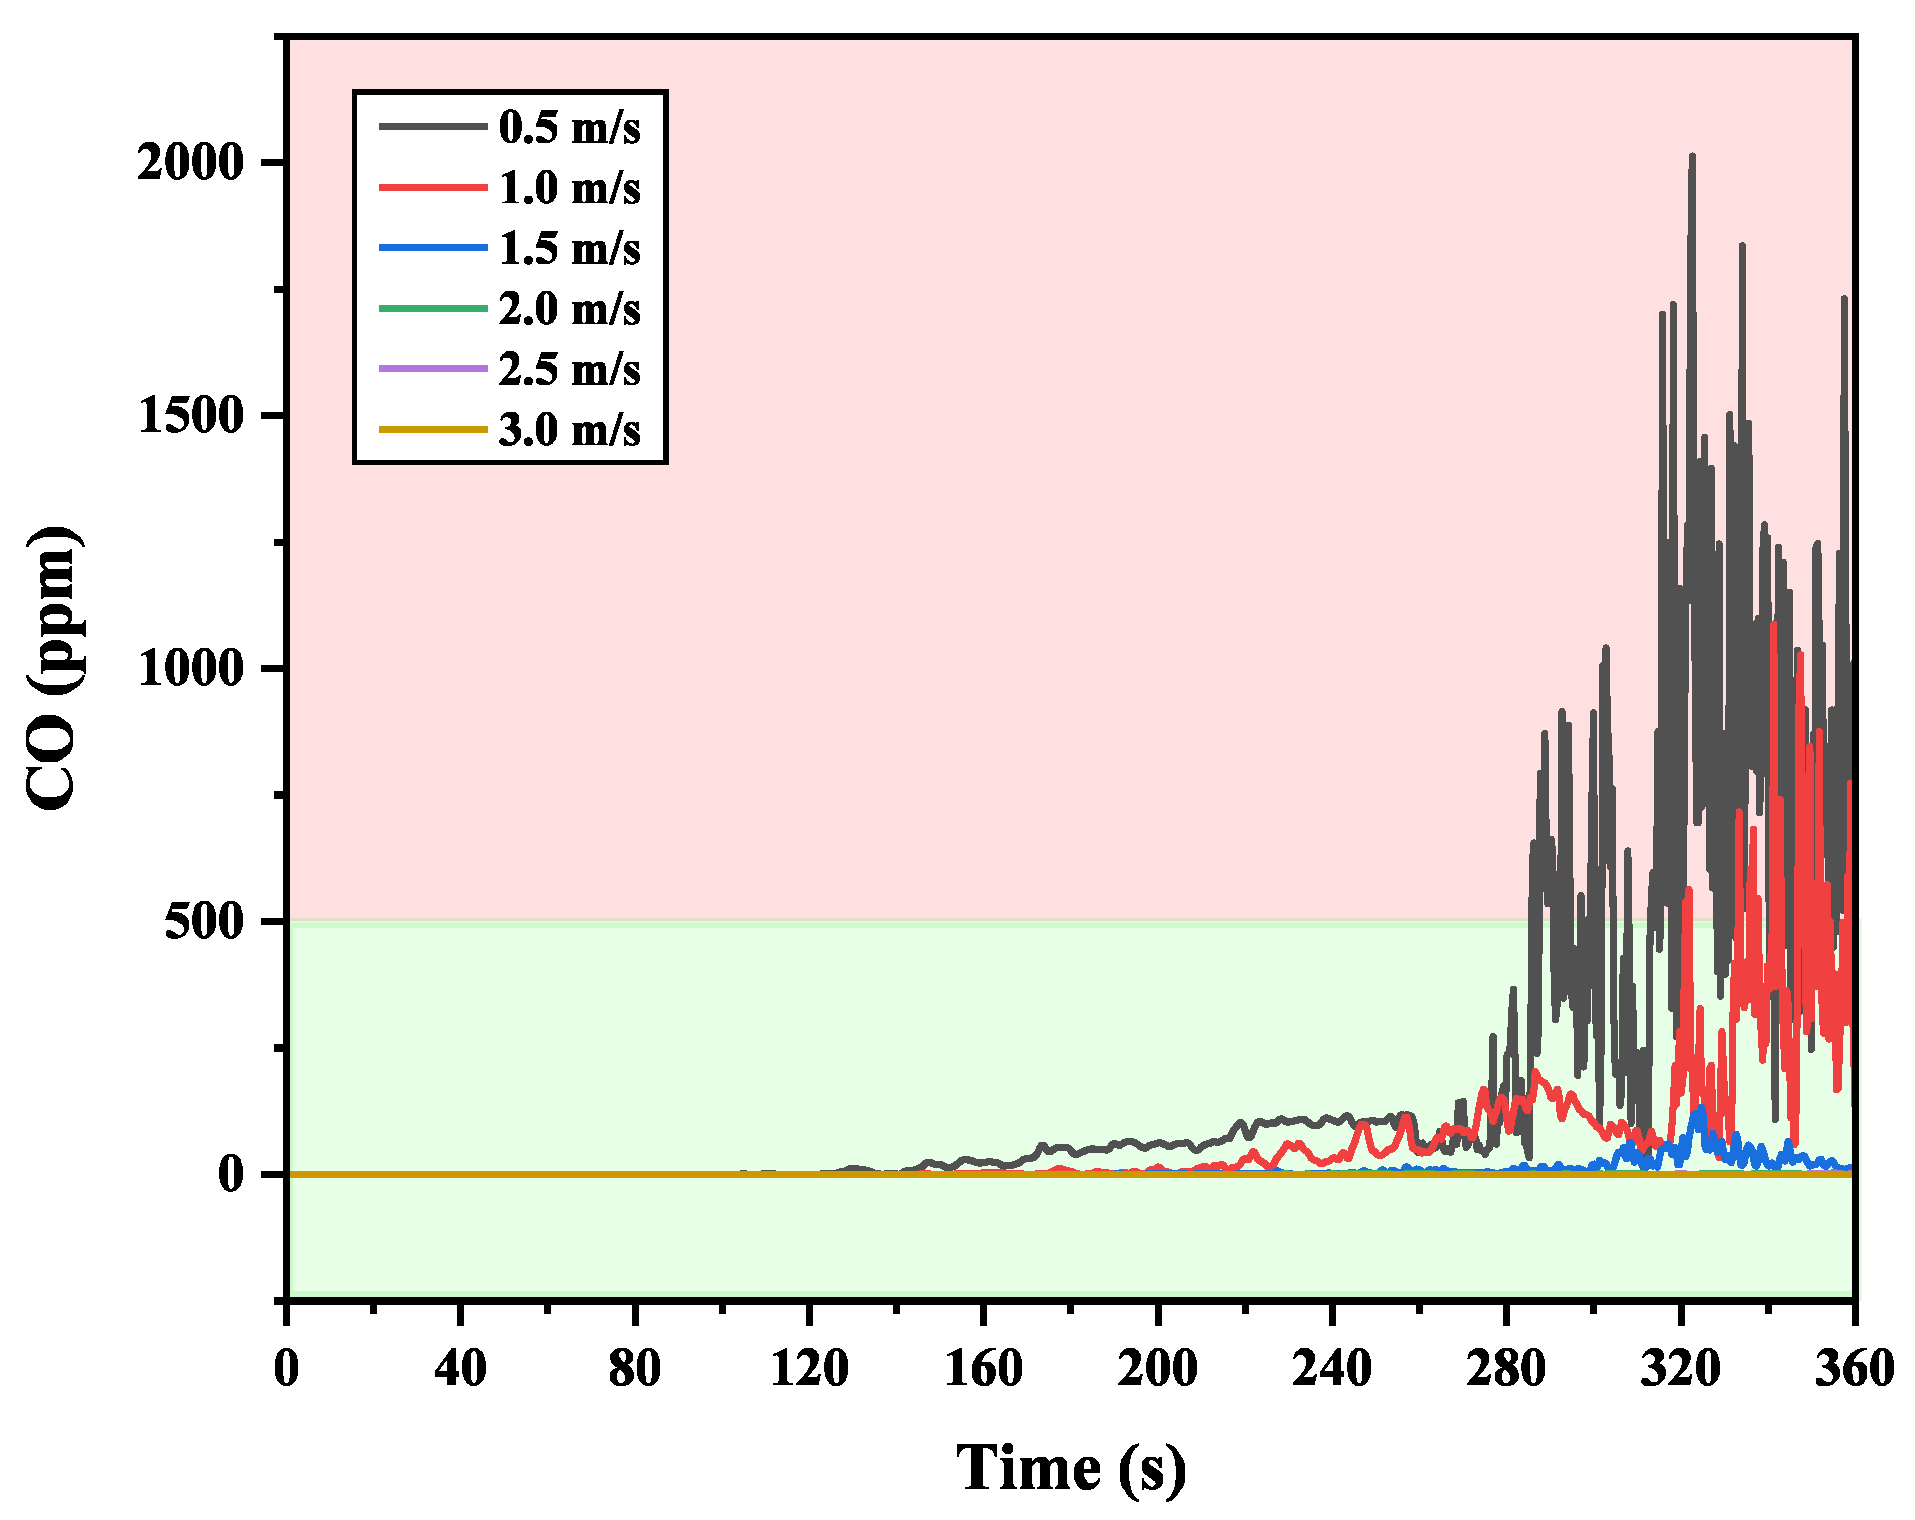
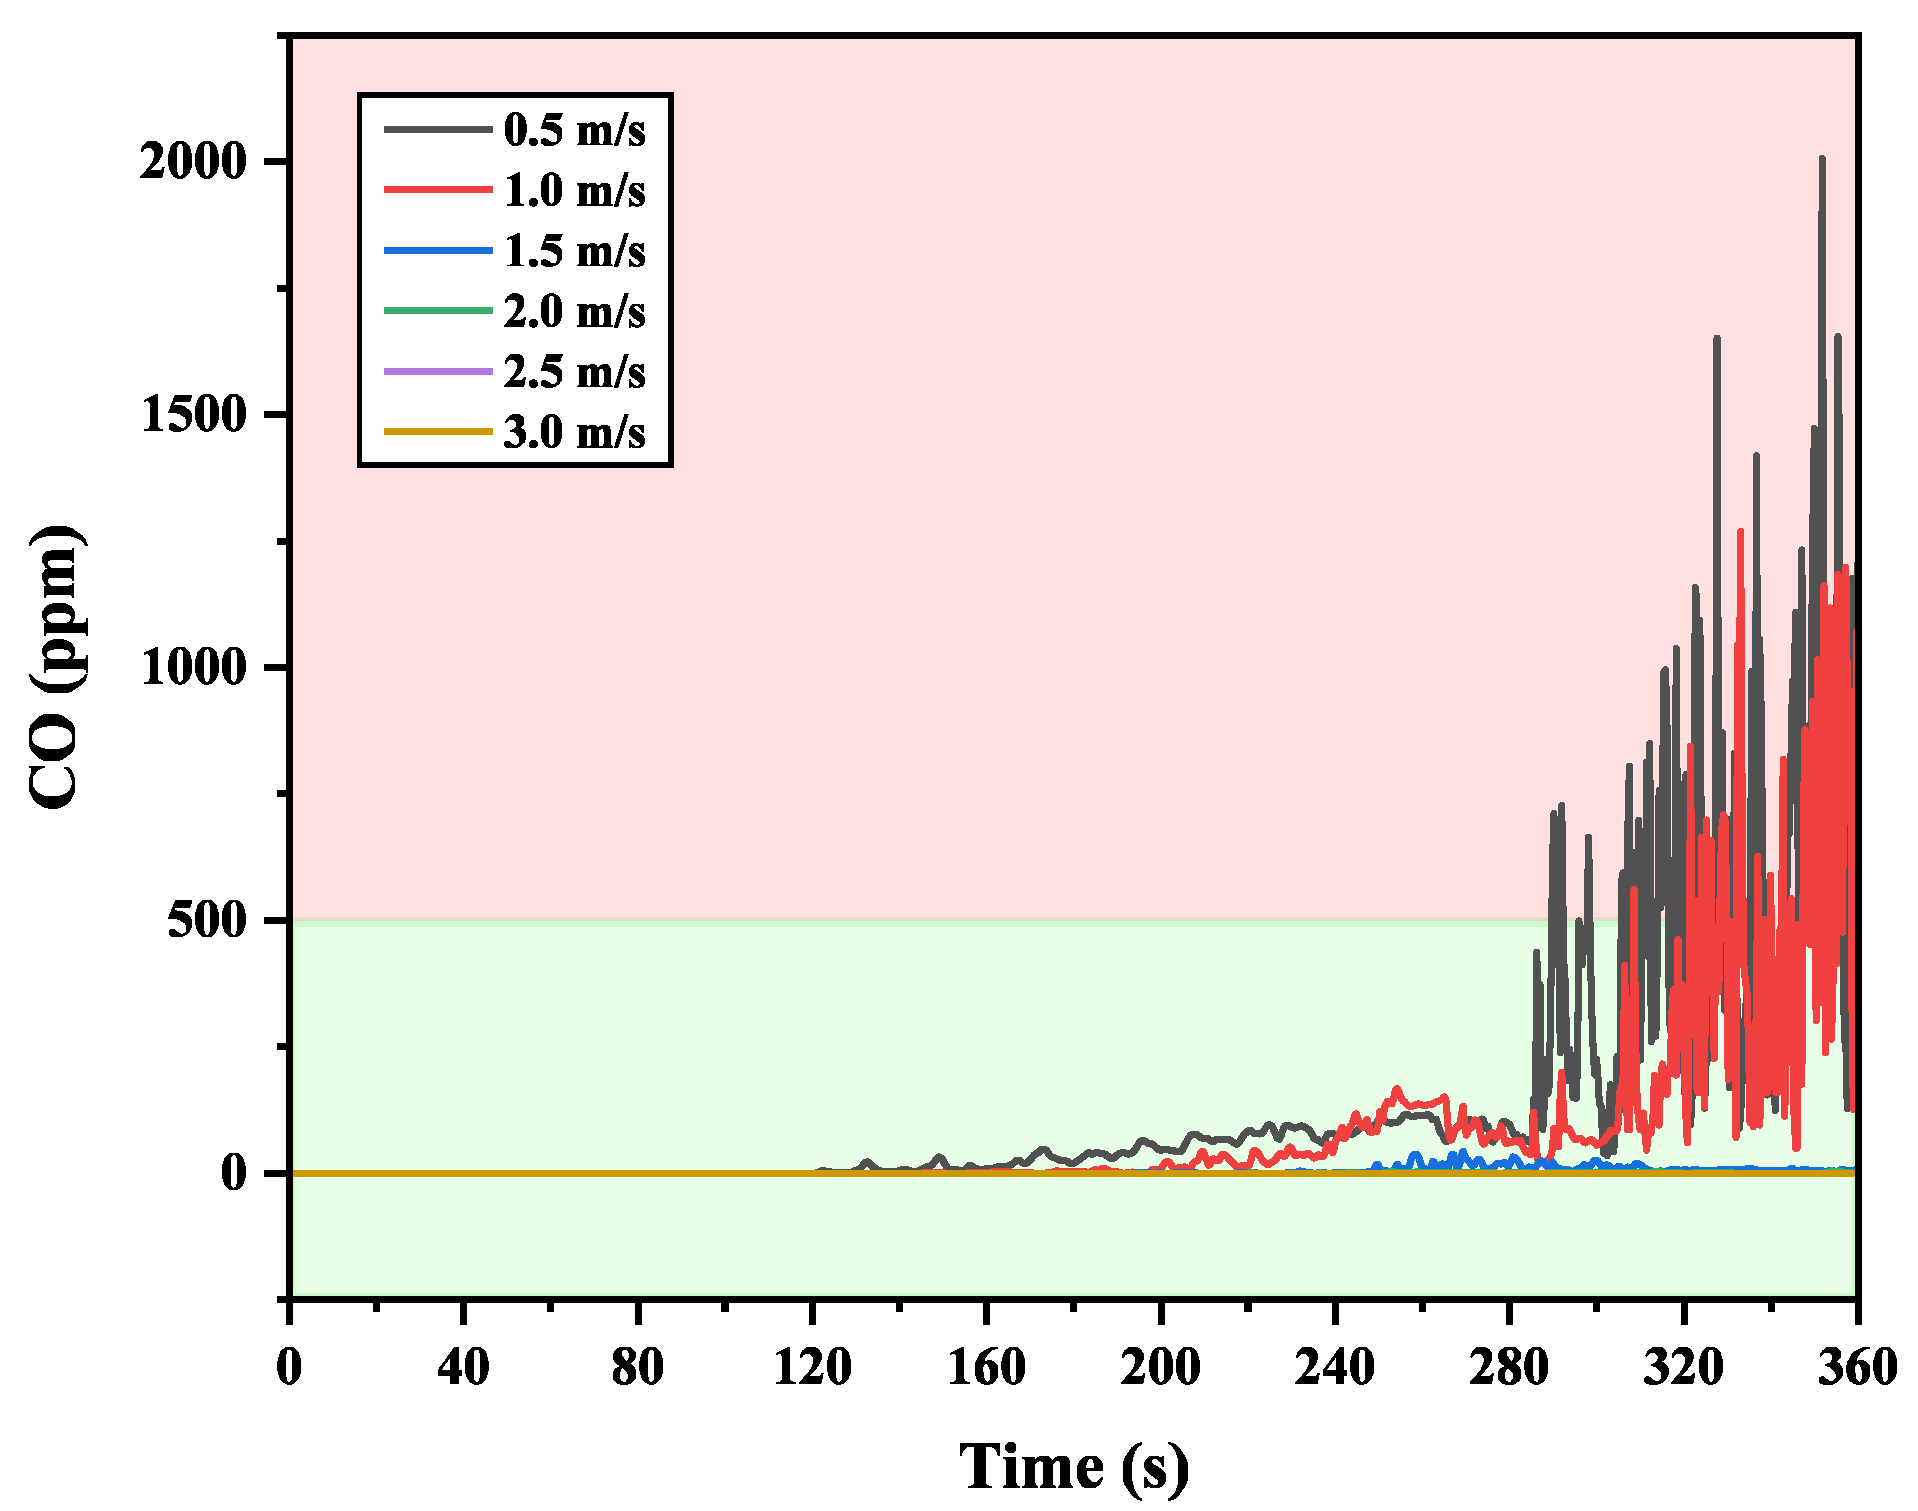
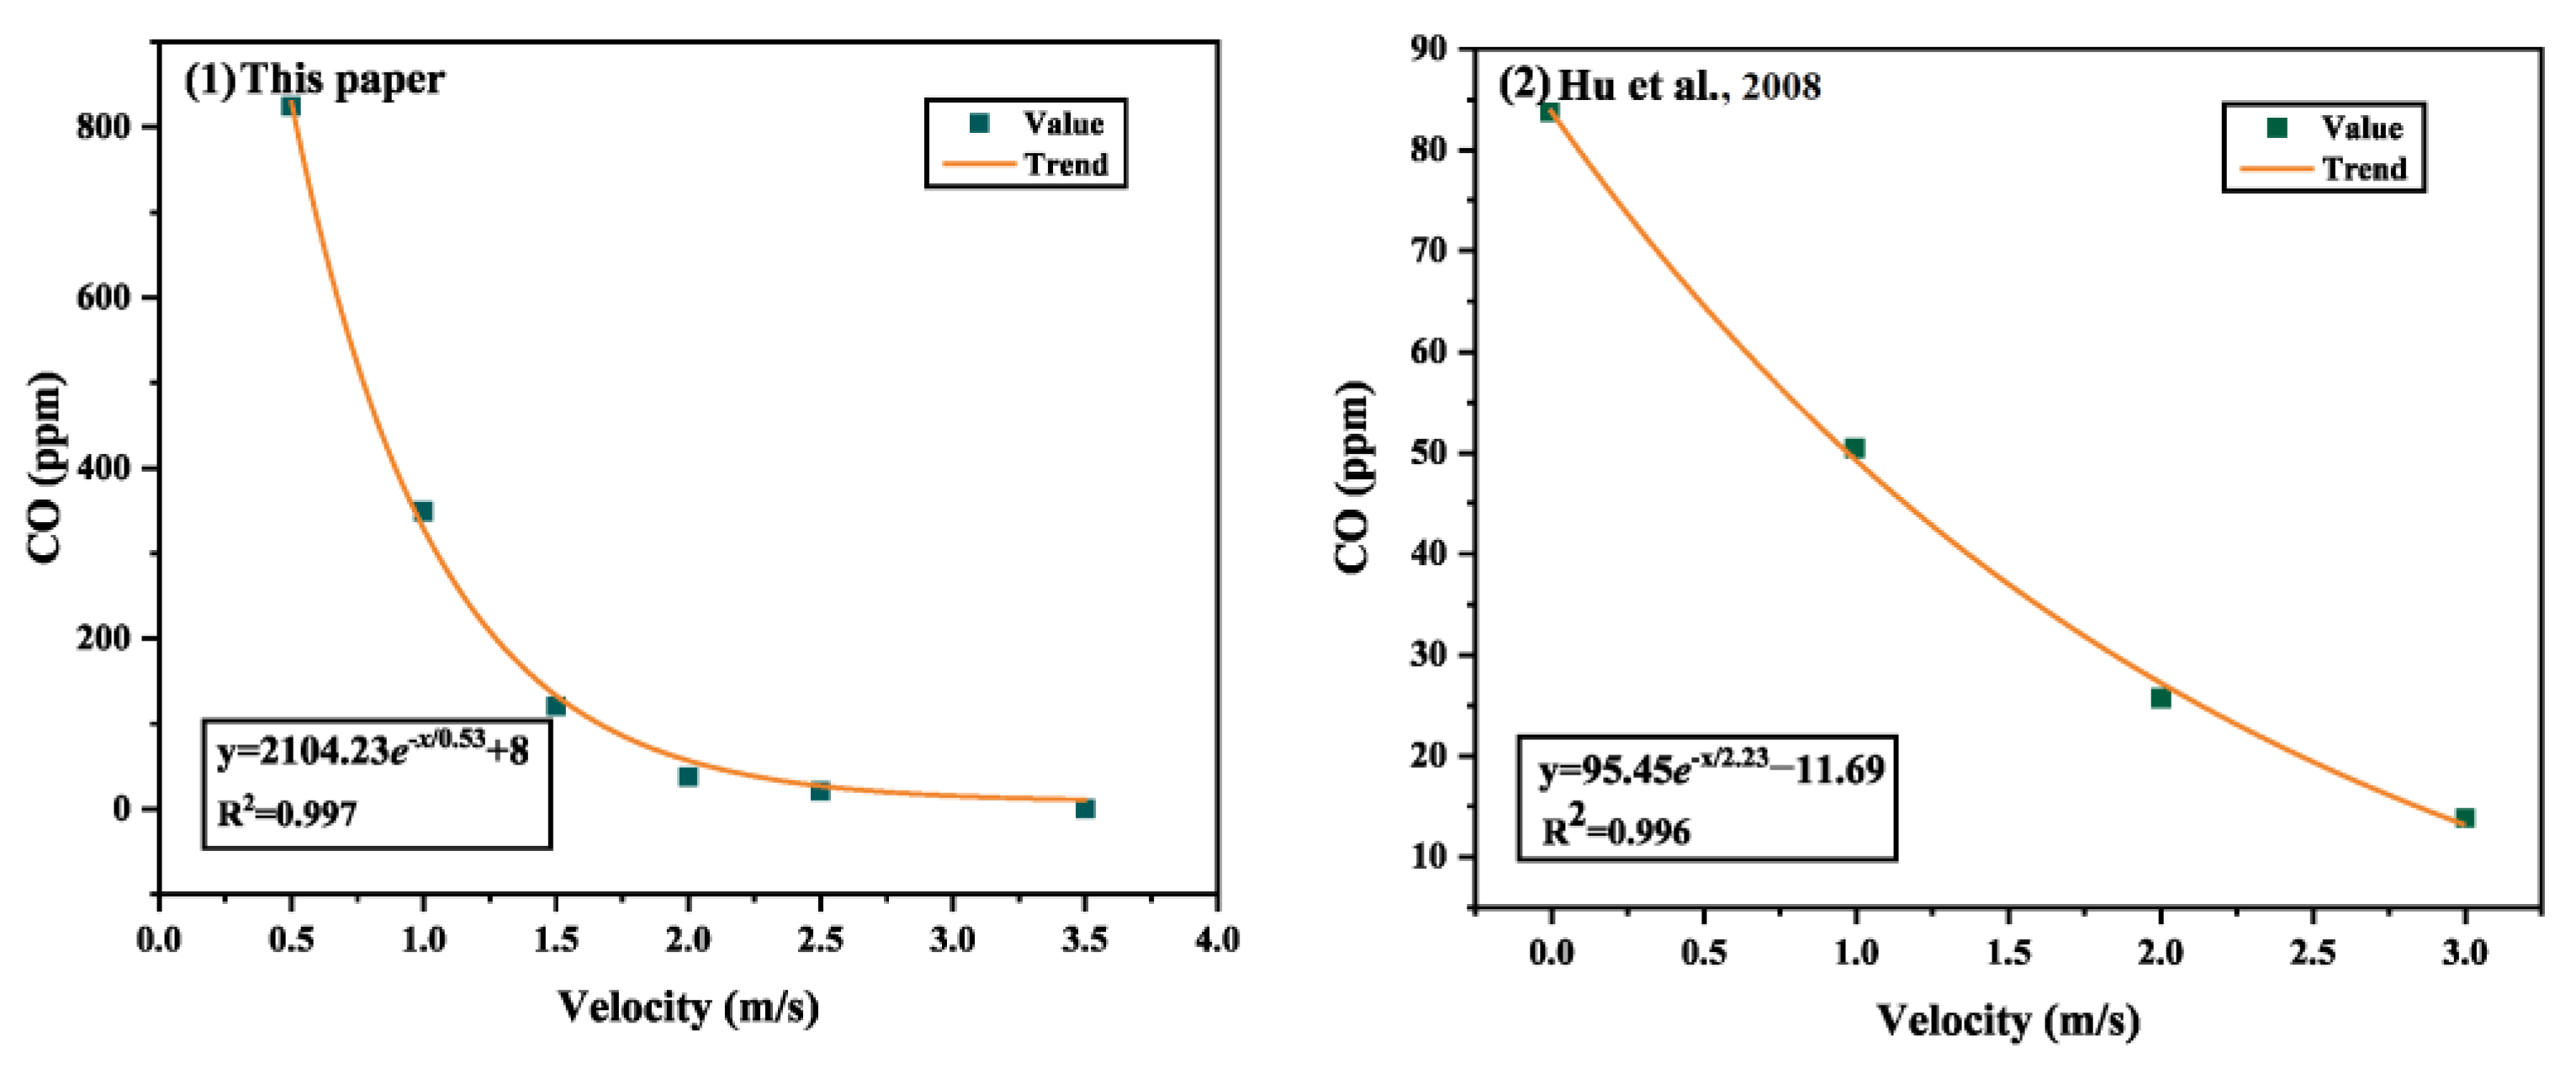
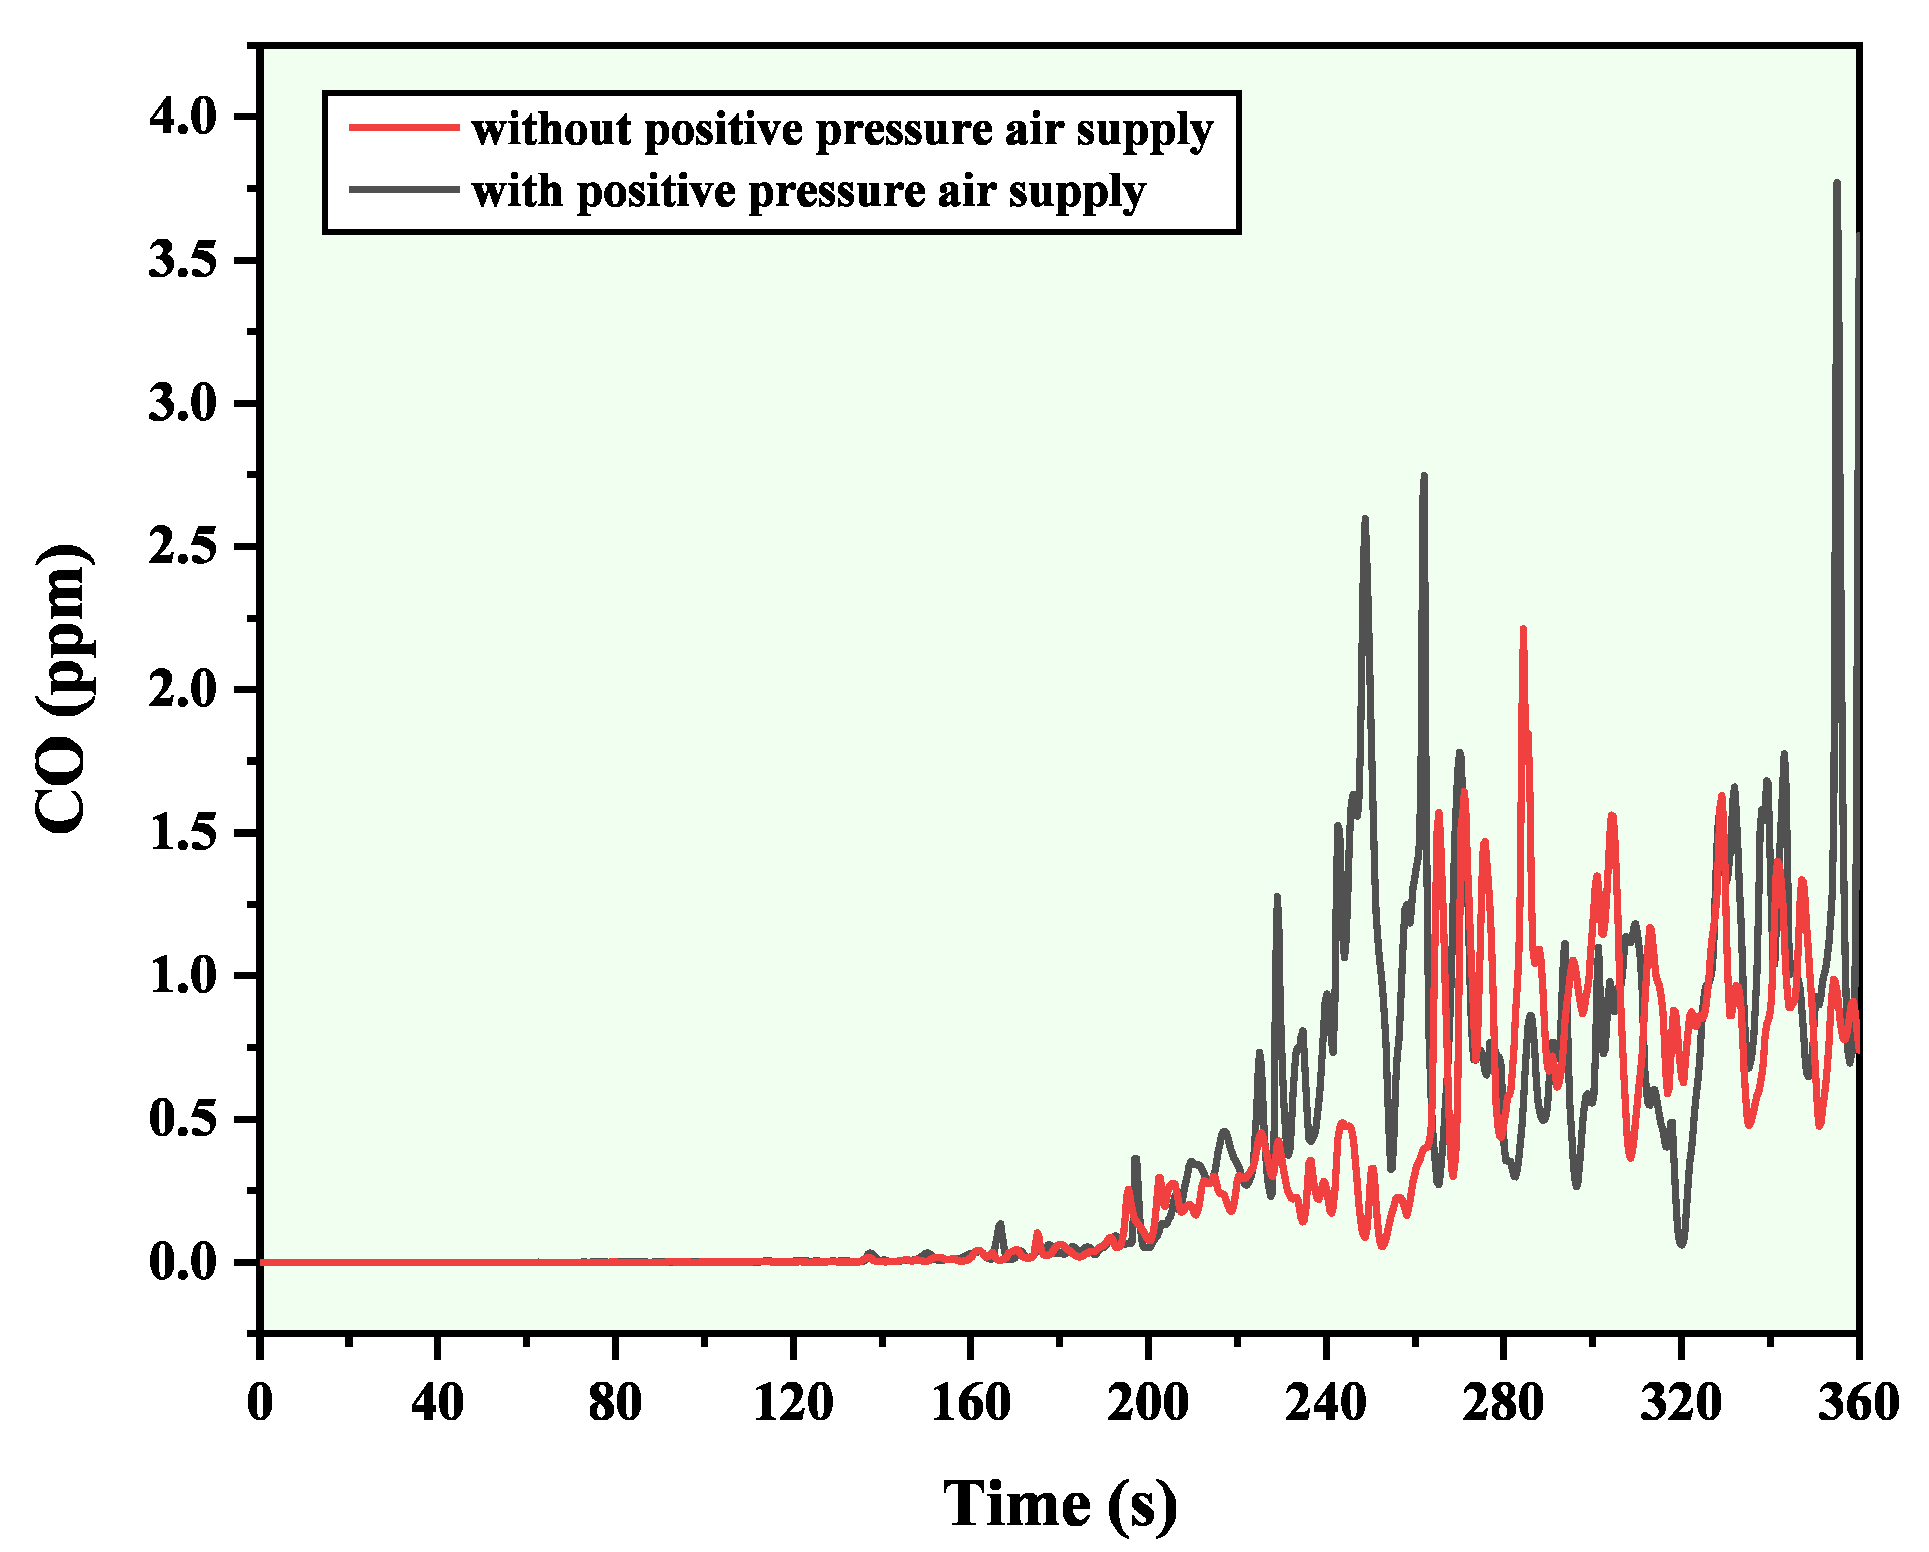
3.1.4. CO Concentration
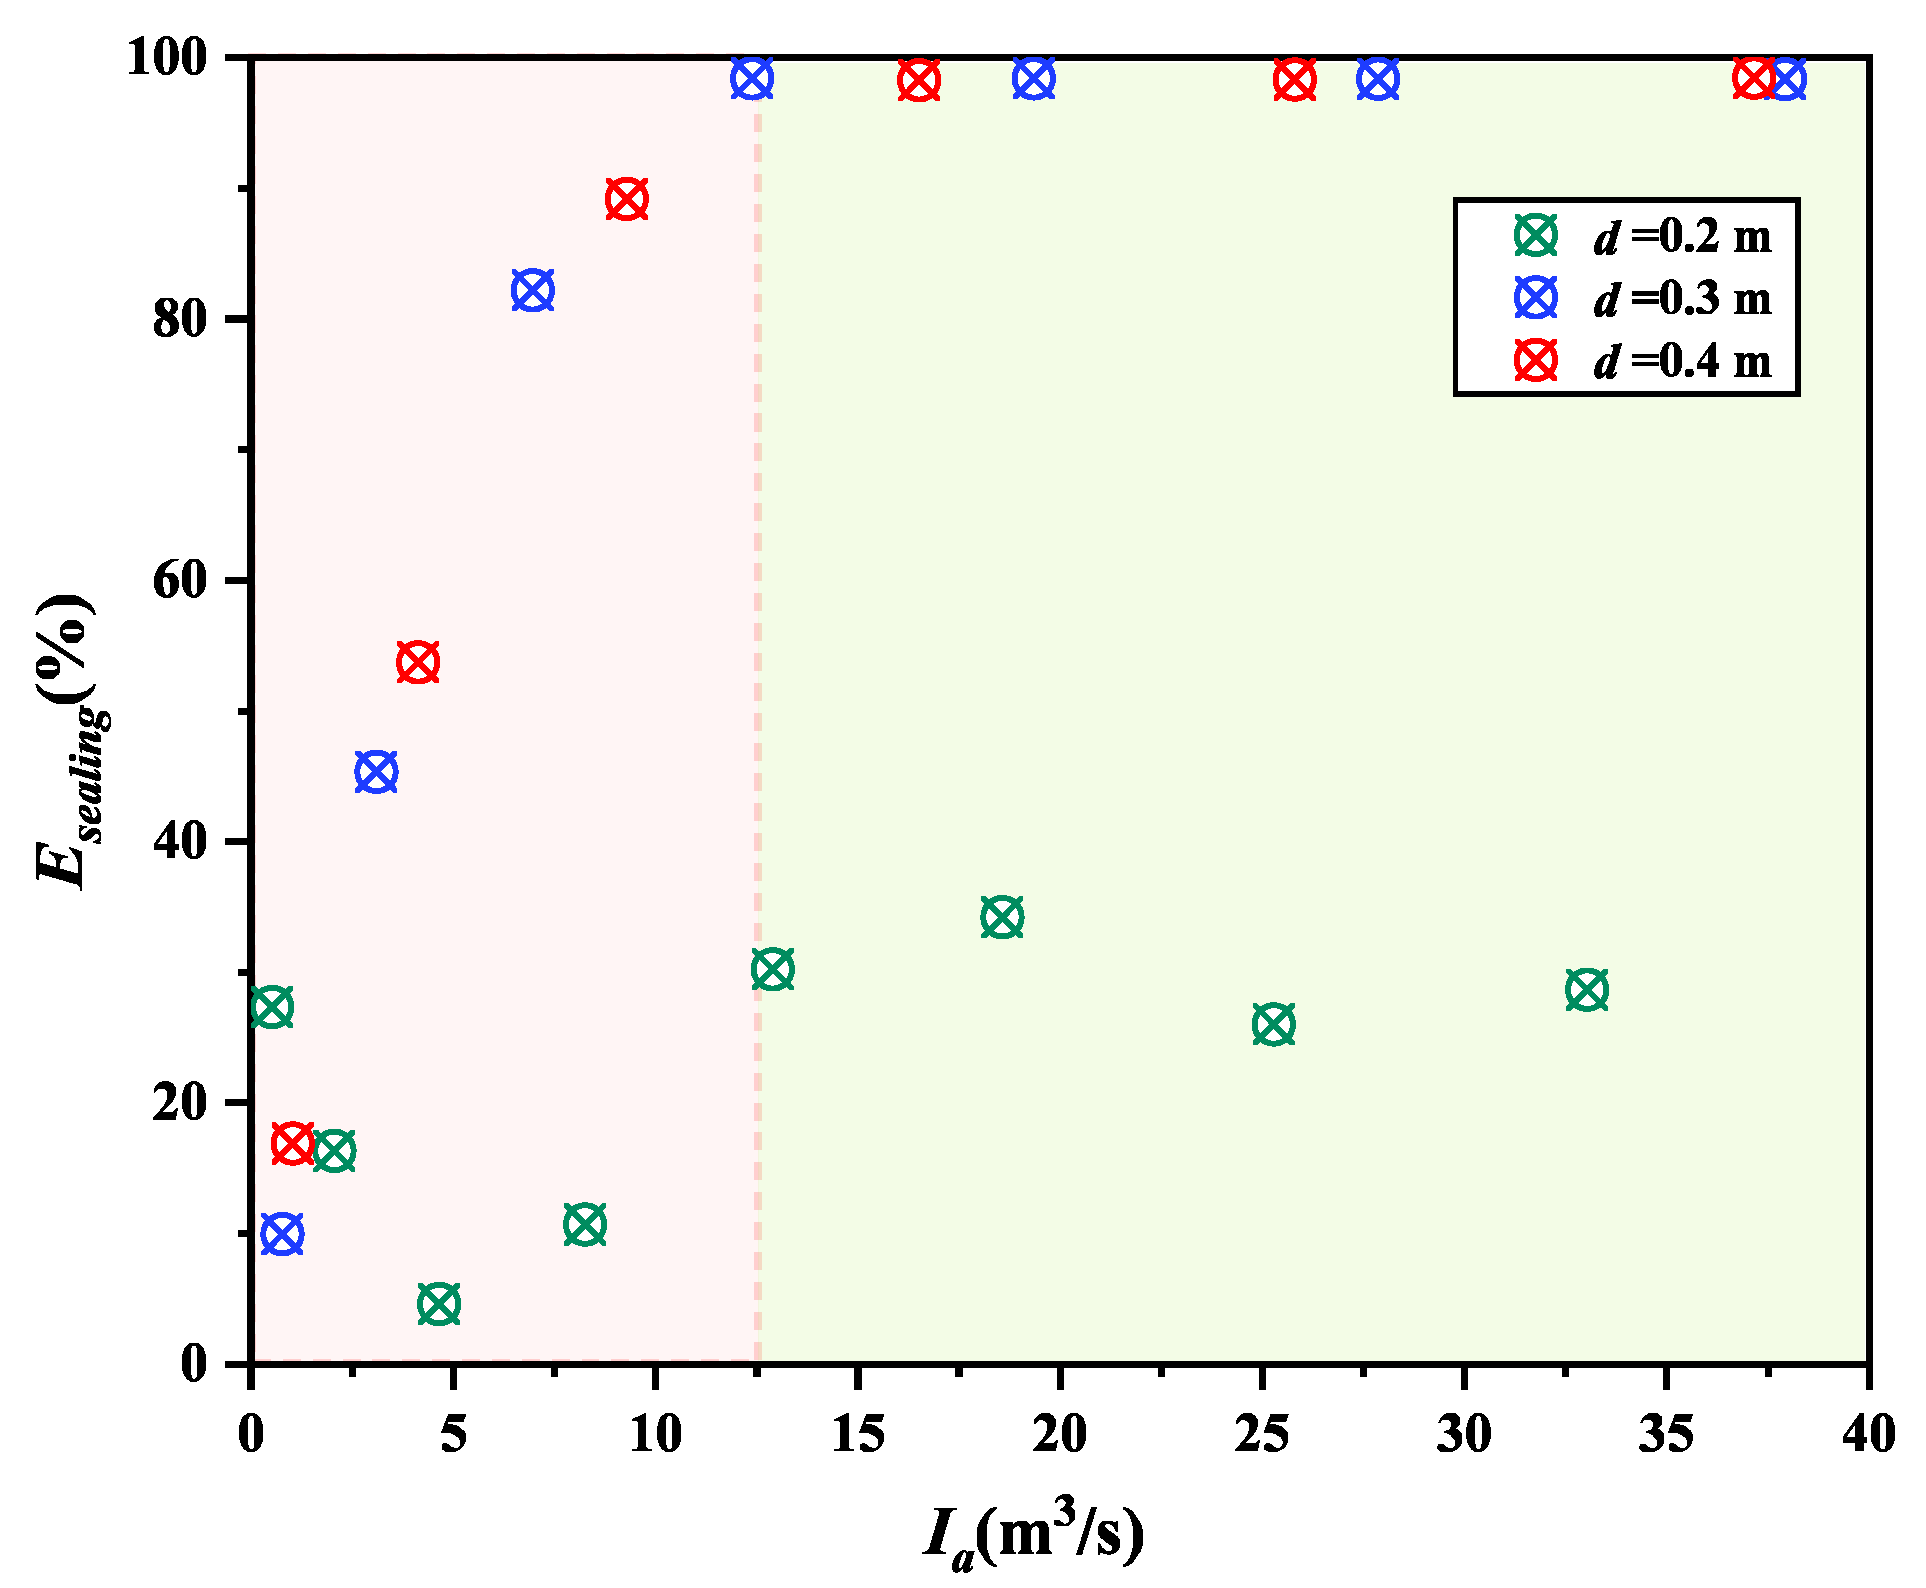
3.1.5. Sealing Effectiveness
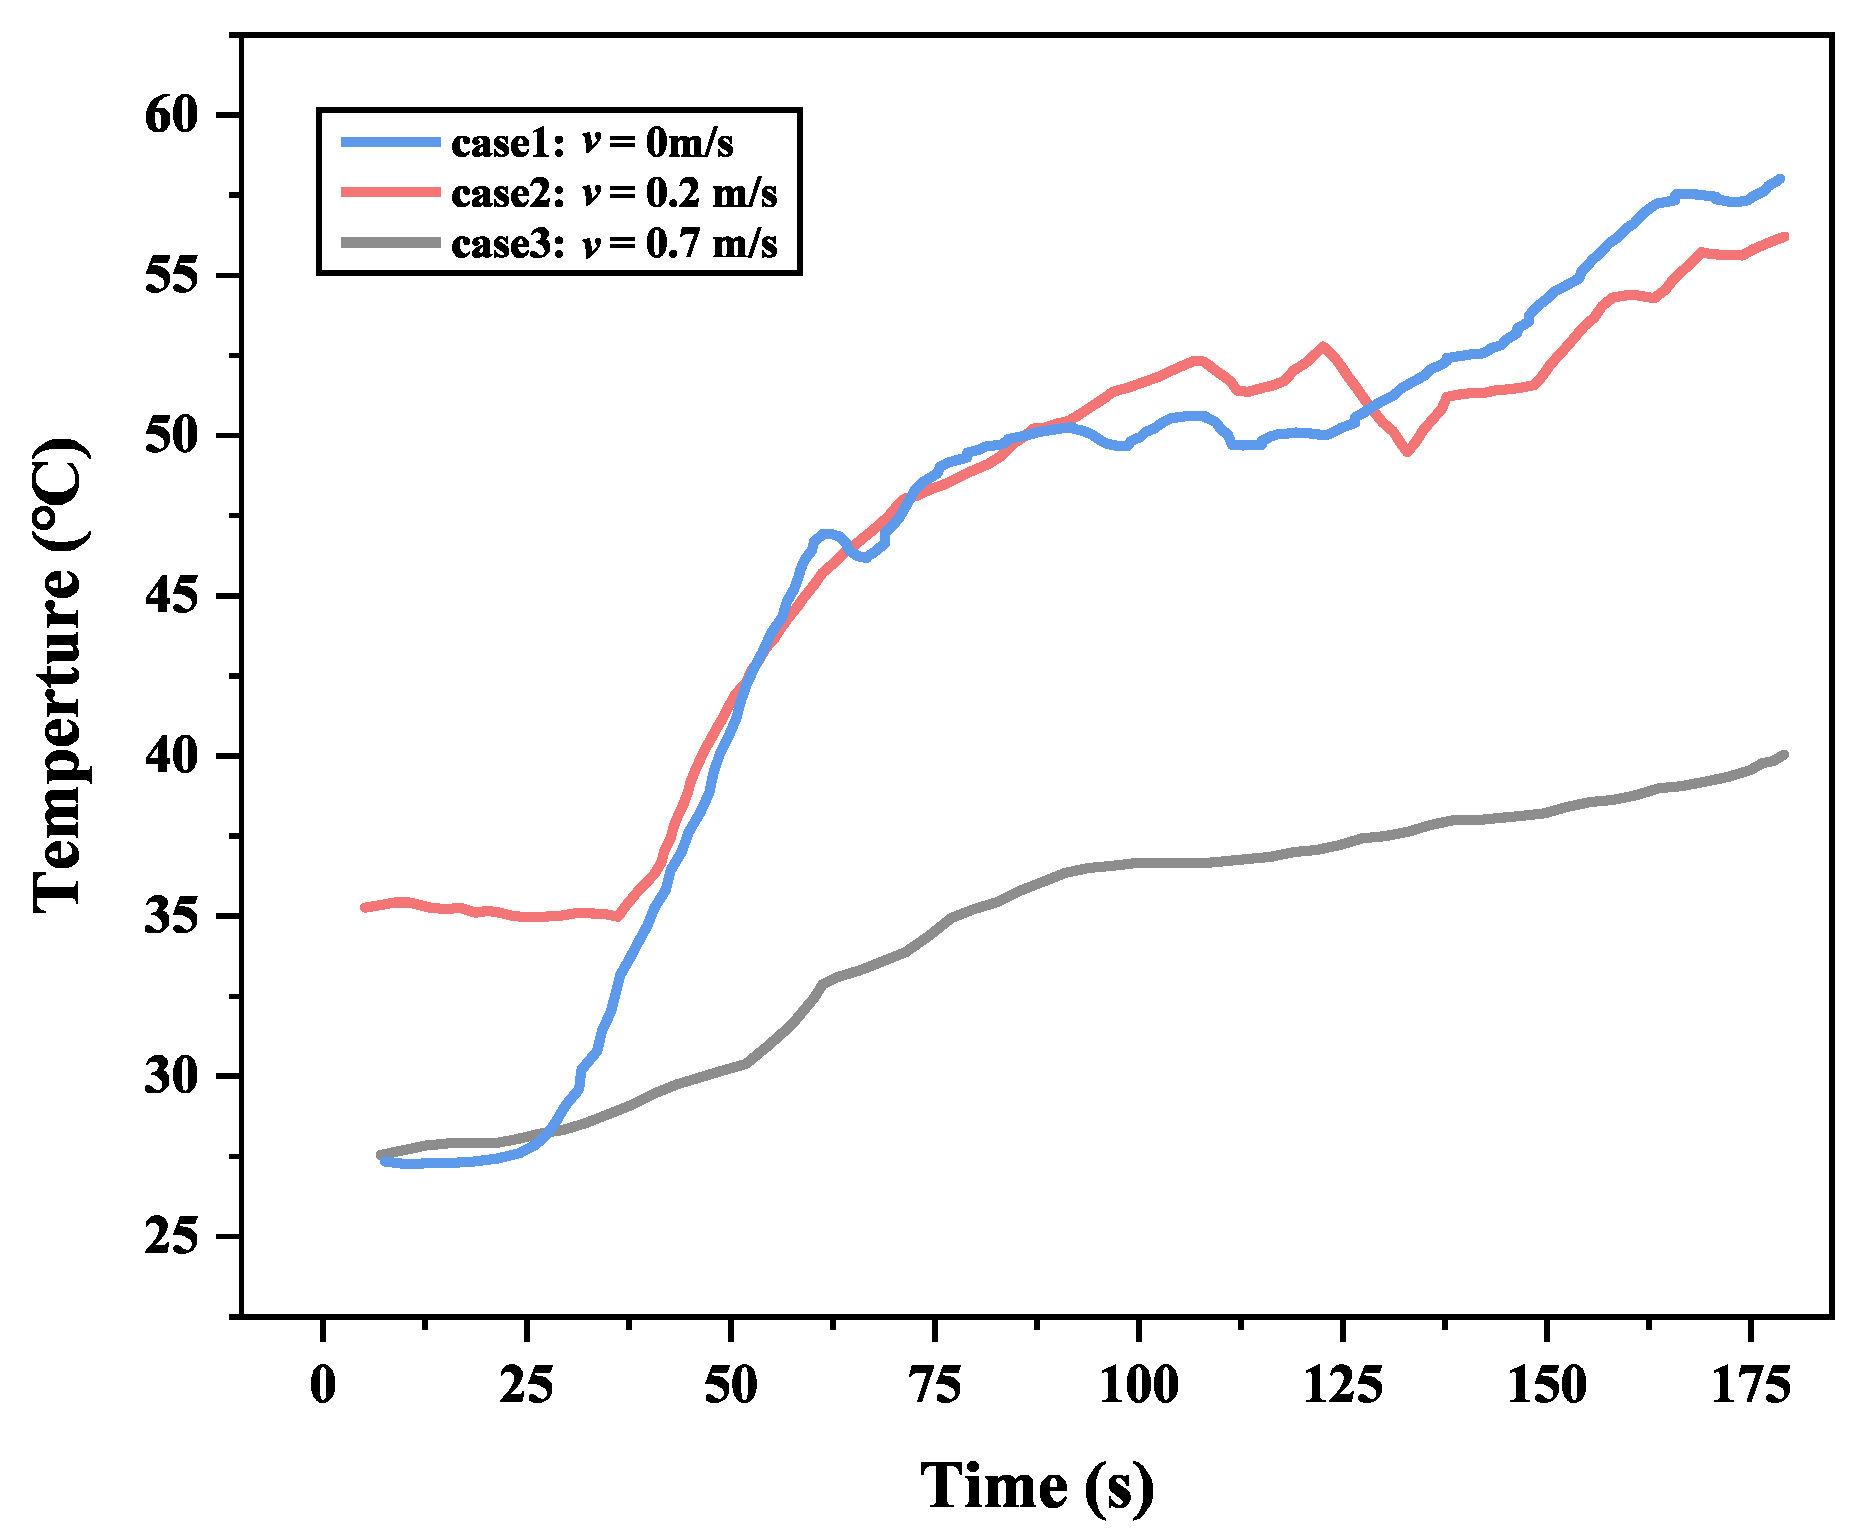
3.2. Comparison between with and without Positive Pressure Ventilation
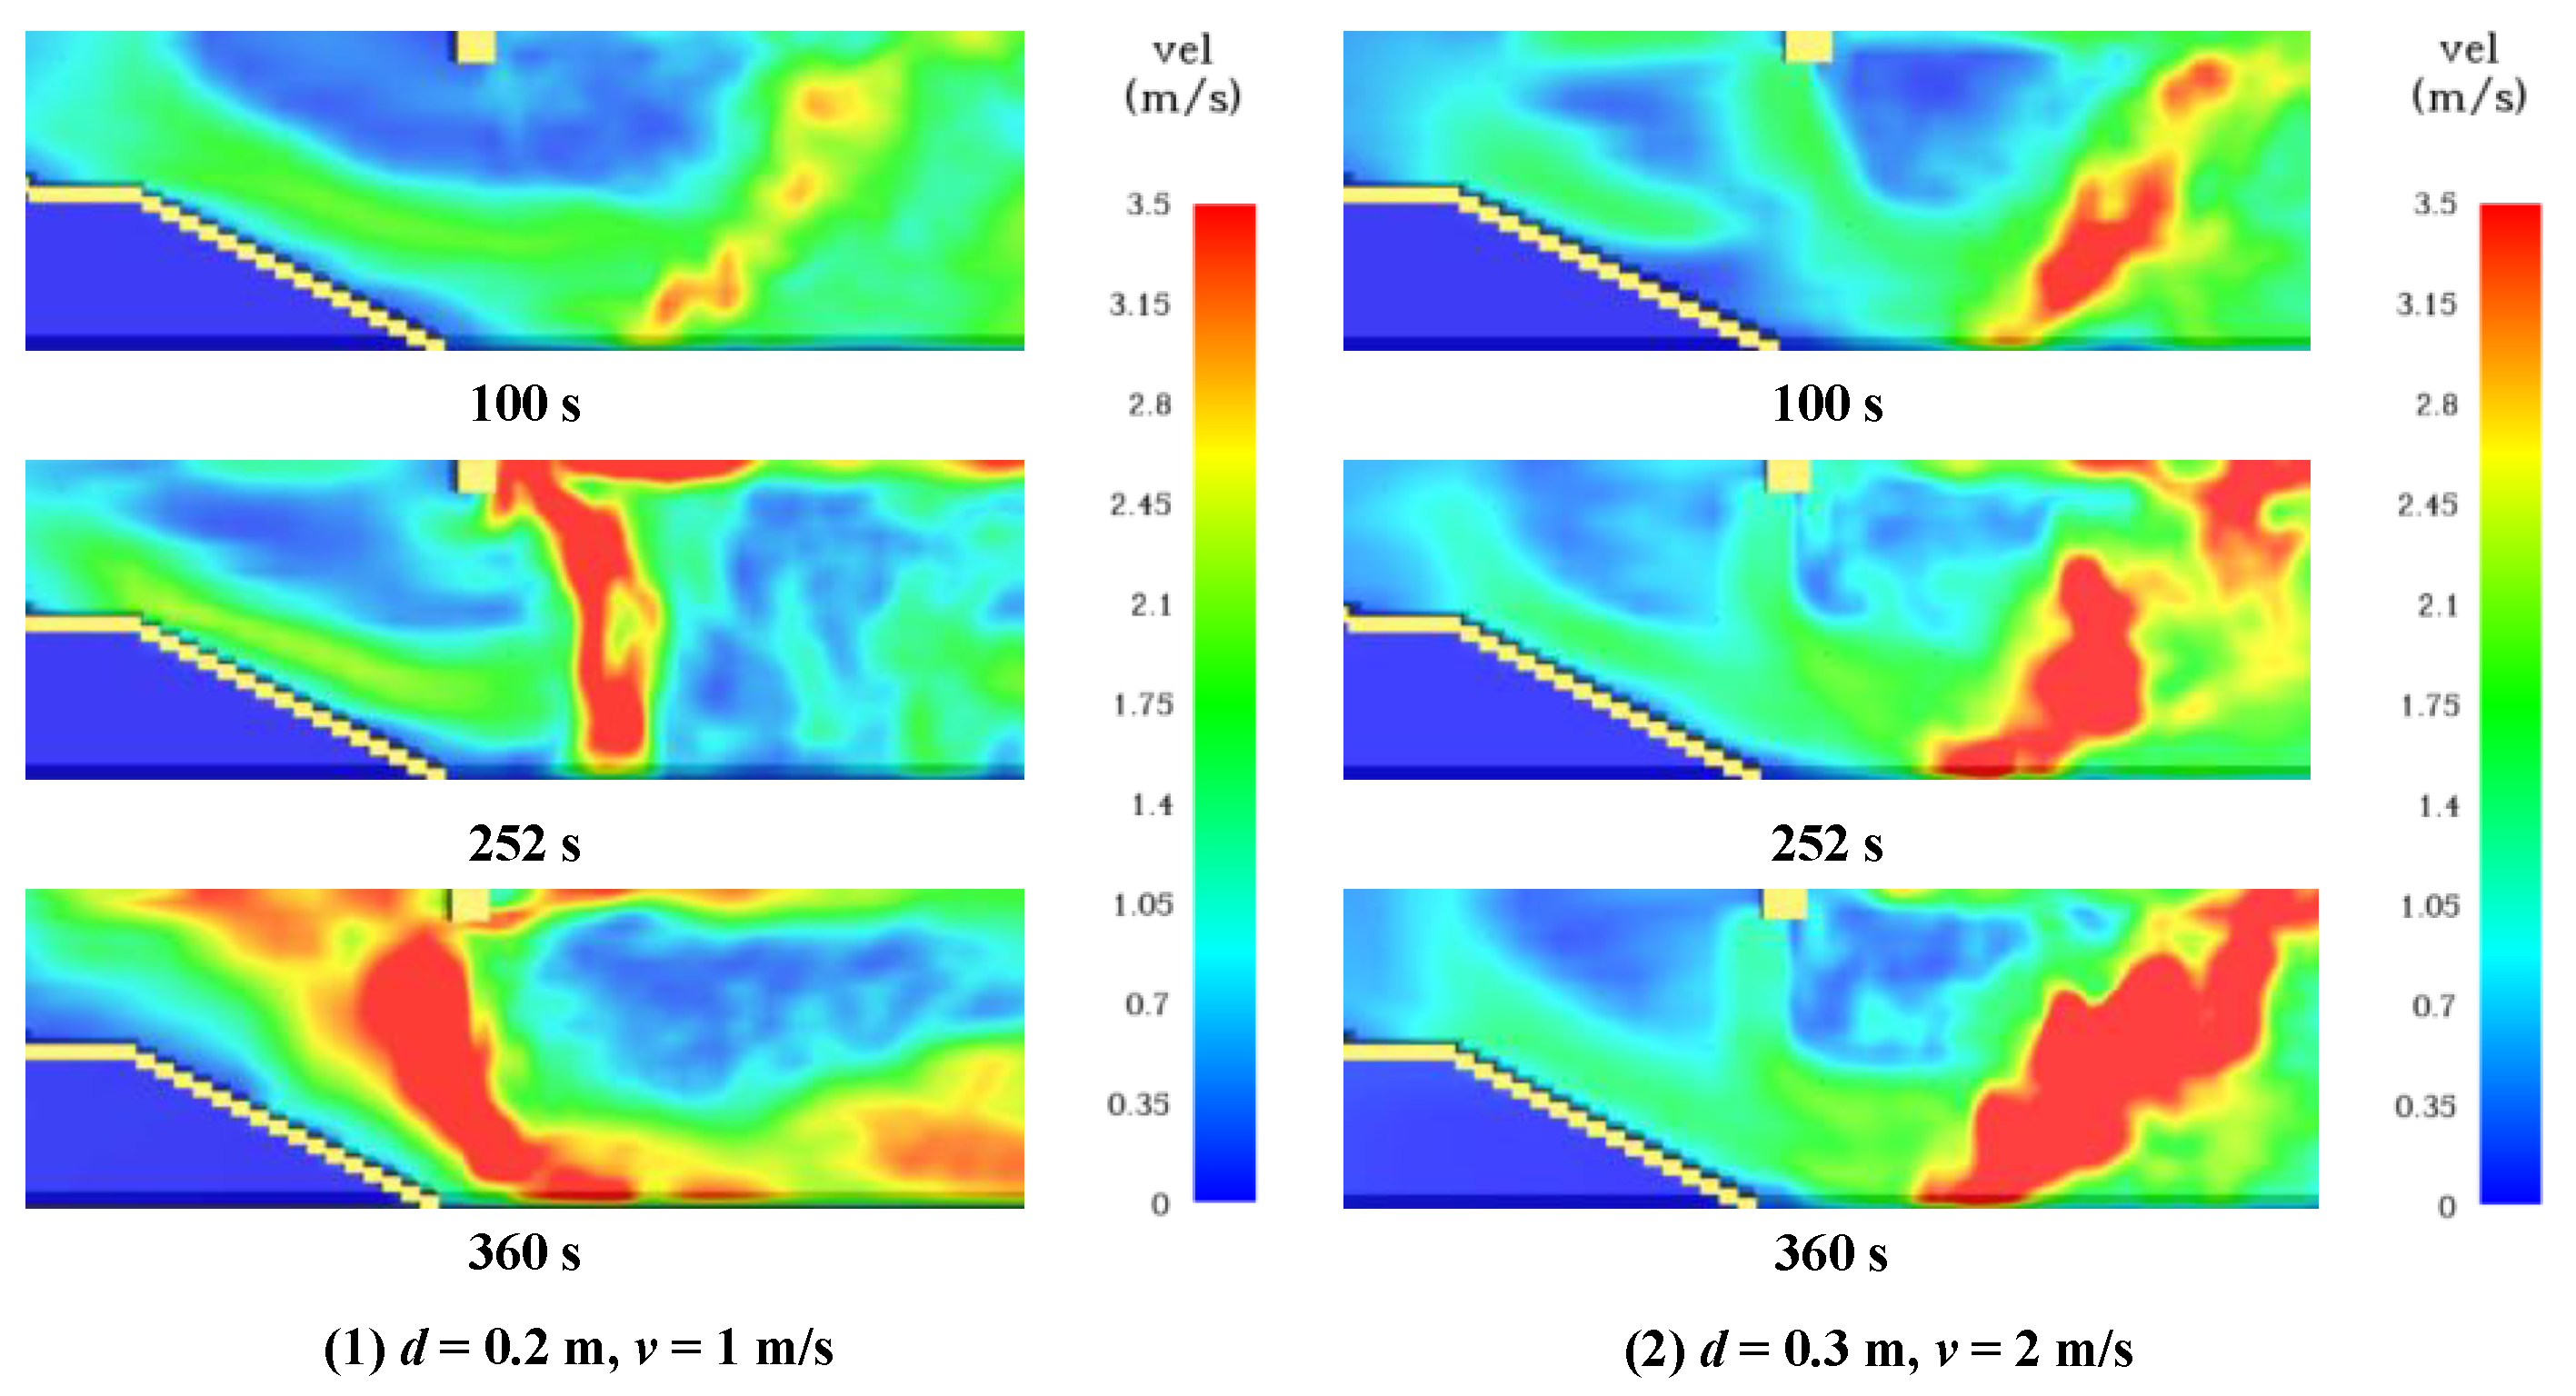
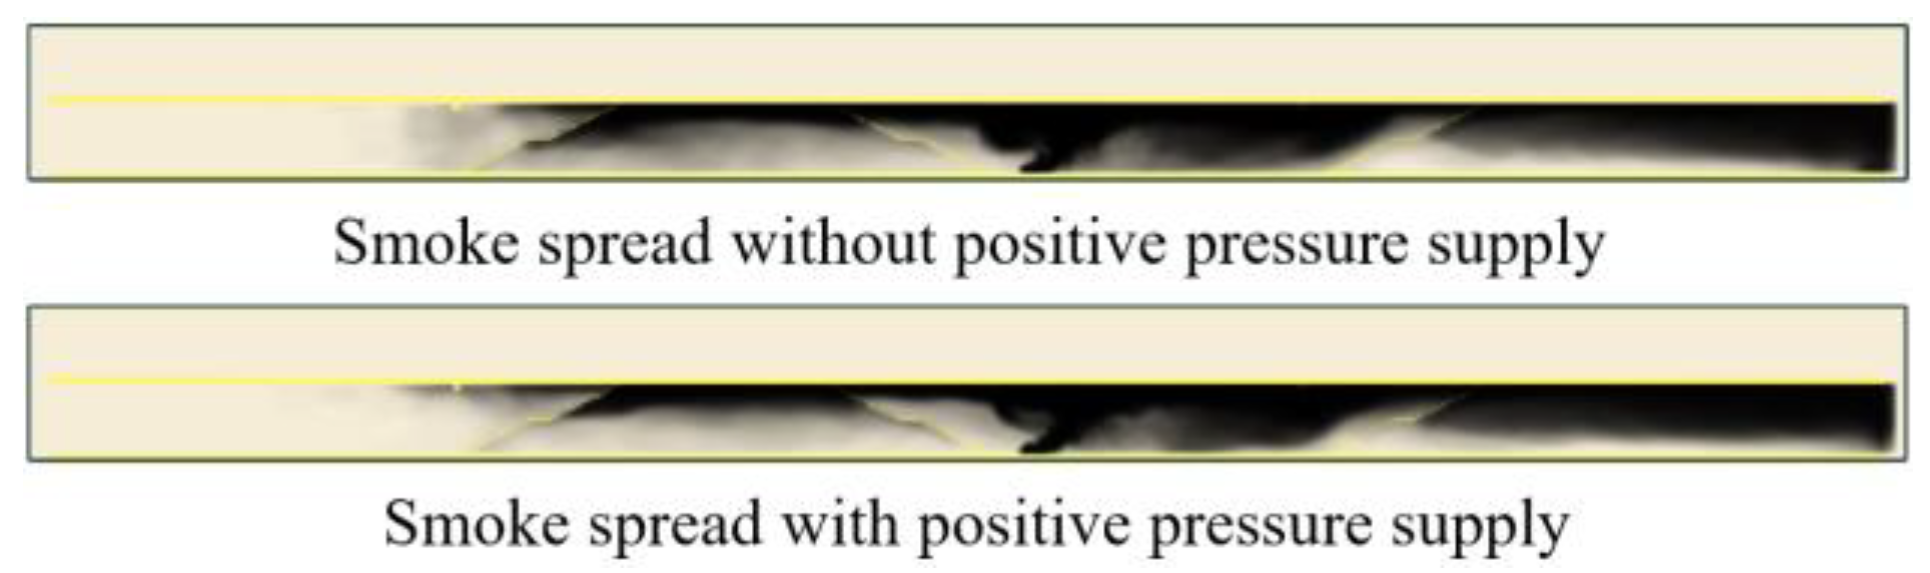
3.2.1. Smoke Spread Process
3.2.2. Energy-Saving Effectiveness of Air Curtain
4. Conclusions
- (1)
- Compared with the subway station fire scene without air curtains, the installation of air curtains can block the spread of smoke from the platform to the station hall to a certain extent.
- (2)
- For lower thicknesses and velocities of the air curtains, it cannot work well to prevent the smoke. As the jet velocity reaches 2 m/s and the thickness reaches 0.3 m, the smoke is almost completely controlled at the platform. At this point, the time for the safe evacuation of passengers has been greatly extended.
- (3)
- The sealing effectiveness peaks when Ia = 12.5 kg·m/s2. As the air curtain momentum increases, the sealing effectiveness is gradually enhanced. However, there is a critical value. Beyond this critical value, the sealing effectiveness will level off and the effect of the increase in the velocity on the sealing effectiveness will become slight. At this point, the increase in the thickness will have a greater impact.
- (4)
- For working condition 11 (d = 0.3 m, v = 2 m/s), an energy-saving efficiency of 85.2% can be achieved by replacing positive pressure ventilation with air curtains.
Author Contributions
Funding
Data Availability Statement
Conflicts of Interest
References
- Wang, Q.; Jin, S.; Hou, Z. Cooperative MFAILC for Multiple Subway Trains With Actuator Faults and Actuator Saturation. IEEE Trans. Veh. Technol. 2022, 71, 8164–8174. [Google Scholar] [CrossRef]
- Gao, R.; Li, A.; Zhang, Y.; Luo, N. How domes improve fire safety in subway stations. Saf. Sci. 2015, 80, 94–104. [Google Scholar] [CrossRef]
- Shi, C.; Zhong, M.; Nong, X.; He, L.; Shi, J.; Feng, G. Modeling and safety strategy of passenger evacuation in a metro station in China. Saf. Sci. 2012, 50, 1319–1332. [Google Scholar] [CrossRef]
- Carvel, R. Lessons learned from catastrophic fires in tunnels. Proc. Inst. Civ. Eng. 2008, 161, 49–53. [Google Scholar] [CrossRef]
- Tsukahara, M.; Koshiba, Y.; Ohtani, H. Effectiveness of downward evacuation in a large-scale subway fire using Fire Dynamics Simulator. Tunn. Undergr. Space Technol. 2011, 26, 573–581. [Google Scholar] [CrossRef]
- Hill, I.R. Immediate Causes of Death in Fires. Med. Sci. Law. 1989, 29, 287–292. [Google Scholar] [CrossRef] [PubMed]
- GB/T 33668-2017; Code for Safety Evacuation of Metro. China National Standard: Beijing, China, 2017.
- Zhou, Y.; Bu, R.; Gong, J.; Xu, Z.; Chen, H.; Fan, C. Numerical investigation on the effectiveness of positive pressure ventilation technology in a multi-layer subway station. Indoor Built Environ. 2019, 28, 984–998. [Google Scholar] [CrossRef]
- Krajewski, G.; Węgrzyński, W. Air curtain as a barrier for smoke in case of fire: Numerical modelling. Bull. Pol. Acad. Sci. Tech. Sci. 2015, 63, 145–153. [Google Scholar] [CrossRef]
- Yang, H.; Yuen, R.; Zhang, H.P. Numerical Study of Smoke Control for Underground Platform in a High-Speed Railway Station. AMM 2012, 256–259, 2803–2812. [Google Scholar] [CrossRef]
- Luo, N.; Li, A.; Gao, R.; Tian, Z.; Zhang, W.; Mei, S.; Feng, L.; Ma, P. An experiment and simulation of smoke confinement and exhaust efficiency utilizing a modified Opposite Double-Jet Air Curtain. Saf. Sci. 2013, 55, 17–25. [Google Scholar] [CrossRef]
- Razeghi, S.M.J.; Safarzadeh, M.; Pasdarshahri, H. Evaluation of air curtain and emergency exhaust system for smoke confinement of an enclosure. J. Build. Eng. 2021, 33, 101650. [Google Scholar] [CrossRef]
- Gupta, S.; Pavageau, M.; Elicer-Cortés, J.-C. Cellular confinement of tunnel sections between two air curtains. Build. Environ. 2007, 42, 3352–3365. [Google Scholar] [CrossRef]
- Zhou, Z.; Lu, Y.; Cui, Y. Study on the Effect of Jet Direction of Compound Air Curtain on Smoke Control. Energies 2021, 14, 6983. [Google Scholar] [CrossRef]
- Hu, L.; Zhou, J.; Huo, R.; Peng, W.; Wang, H. Confinement of fire-induced smoke and carbon monoxide transportation by air curtain in channels. J. Hazard. Mater. 2008, 156, 327–334. [Google Scholar] [CrossRef]
- Jung, U.-H.; Kim, S.; Yang, S.-H.; Kim, J.-H.; Choi, Y.-S. Numerical study of air curtain systems for blocking smoke in tunnel fires. J. Mech. Sci. Technol. 2016, 30, 4961–4969. [Google Scholar] [CrossRef]
- Jin, X.; Gong, J.; Lin, Z.; Hua, S. The Influence of Air Curtains on Fire Smoke in Tunnels. IJHT 2022, 40, 569–576. [Google Scholar] [CrossRef]
- Chen, Z.; Liu, Z.; Li, X.; Linqi, H.; Niu, G. Numerical study of the effect of air curtains on smoke blocking and leakage heat flux in tunnel fires. Case Stud. Therm. Eng. 2022, 35, 102164. [Google Scholar] [CrossRef]
- Gao, D.; Li, T.; Mei, X.; Chen, Z.; You, S.; Wang, Z.; Wang, K.; Lin, P. Effectiveness of smoke confinement of air curtain in tunnel fire. Fire Technol. 2020, 56, 2283–2314. [Google Scholar] [CrossRef]
- Du, F.; Zhang, Q.; Wang, K.; Cui, W.; Guo, Y.; Deng, Y. Study on crowd evacuation in subway transfer station fires based on numerical simulation. Emerg. Manag. Sci. Technol. 2022, 2, 16. [Google Scholar] [CrossRef]
- Liu, Y.; Li, Y.Z.; Ingason, H.; Liu, F. Control of thermal-driven smoke flow at stairways in a subway platform fire. Int. J. Therm. Sci. 2021, 165, 106937. [Google Scholar] [CrossRef]
- Hansell, G.; Morgan, H. Design Approaches for Smoke Control in Atrium Buildings; Fire Research Station Borehamwood: Borehamwood, UK, 1994. [Google Scholar]
- NFPA 130; Standard for Fixed Guideway Transit and Passenger Rail Systems. National Fire Protection Association: Quincy, MA, USA, 2007.
- Xiong, S.; Lv, W.; Xiong, X.; Liu, D.; Li, X.; Zhao, C. Research progress and application of emergency plans in China: A review. Emerg. Manag. Sci. Technol. 2023, 3, 3. [Google Scholar] [CrossRef]
- Li, X.; Maghelal, P.; Arlikatti, S.; Dorsett, C. Review of evacuee mobilization challenges causing time-lag: Conceptualizing a new framework. Emerg. Manag. Sci. Technol. 2022, 2, 20. [Google Scholar] [CrossRef]
- Shao, X.; Ye, R.; Wang, J.; Feng, J.; Wang, Y.; Jiang, J. Progress and prospects in crowd safety evacuation research in China. Emerg. Manag. Sci. Technol. 2023, 3, 1. [Google Scholar] [CrossRef]
- Cai, T.; Wang, J.; Zhang, C.; Cao, M.; Jiang, S.; Wang, X.; Wang, B.; Hu, W.; Hu, Y. Halogen and halogen-free flame retarded biologically-based polyamide with markedly suppressed smoke and toxic gases releases. Compos. Part B Eng. 2020, 184, 107737. [Google Scholar] [CrossRef]
- Liang, Q.; Li, Y.; Li, J.; Xu, H.; Li, K. Numerical studies on the smoke control by water mist screens with transverse ventilation in tunnel fires. Tunn. Undergr. Space Technol. 2017, 64, 177–183. [Google Scholar] [CrossRef]
- Hurley, M.J.; Gottuk, D.T.; Hall, J.R., Jr.; Harada, K.; Kuligowski, E.D.; Puchovsky, M.; Watts, J.M., Jr.; Wieczorek, C.J. SFPE Handbook of Fire Protection Engineering; Springer: Berlin/Heidelberg, Germany, 2015. [Google Scholar]
- Institution, B.S. Application of Fire Safety Engineering Principles to the Design of Buildings; British Standards Institution: Chiswick, UK, 2021. [Google Scholar]
- Luo, N.; Li, A.; Gao, R.; Zhang, W.; Tian, Z. An experiment and simulation of smoke confinement utilizing an air curtain. Saf. Sci. 2013, 59, 10–18. [Google Scholar] [CrossRef]
- Yu, L.-X.; Beji, T.; Zadeh, S.E.; Liu, F.; Merci, B. Simulations of Smoke Flow Fields in a Wind Tunnel Under the Effect of an Air Curtain for Smoke Confinement. Fire Technol. 2016, 52, 2007–2026. [Google Scholar] [CrossRef] [Green Version]


| Dimension | Value (m) | |
|---|---|---|
| Station hall/platform | Length | 136 |
| Width | 16 | |
| Height | 5.1/5.5 | |
| Open doors | Width | 8 |
| Height | 5.5 | |
| Stairs | Length | 11.4 |
| Width | 8 | |
| Height | 5.1 | |
| Smoke walls | Length | 8 |
| Width | 0.4 | |
| Height | 0.5 | |
| Air curtains | Length | 8 |
| Thickness | 0.2/0.3/0.4 | |
| Height | 0.5 |
| NO. | v (m/s) | d (m) | Positive Pressure Ventilation | The Volume of Smoke Exhausted (m3/s) |
|---|---|---|---|---|
| 1 | / | / | √ | 82.8 |
| 2–19 | 0.5 | 0.2/0.3/0.4 | √ | 85.2/88.8/93.6 |
| 1 | √ | 87.6/90/92.4 | ||
| 1.5 | √ | 90/93.6/97.2 | ||
| 2 | √ | 92.4/97.2/102 | ||
| 2.5 | √ | 94.8/100.8/106.8 | ||
| 3 | √ | 97.2/104.4/116.2 | ||
| 21–22 | 3.5/4 | 0.2 | √ | 99.6/102 |
| 23 | 3.5 | 0.3 | √ | 108 |
| 24 | 2 | 0.3 | × | 36.3 |
| d (m) | v (m/s) | |||||||
|---|---|---|---|---|---|---|---|---|
| 0.5 | 1 | 1.5 | 2 | 2.5 | 3 | 3.5 | 4 | |
| 0.2 | 0.516 | 2.064 | 4.644 | 8.256 | 12.900 | 18.576 | 25.284 | 33.024 |
| 0.3 | 0.774 | 3.096 | 6.966 | 12.384 | 19.350 | 27.864 | 37.926 | / |
| 0.4 | 1.032 | 4.128 | 9.288 | 16.512 | 25.800 | 37.152 | / | / |
| d (m) | v (m/s) | |||||||
|---|---|---|---|---|---|---|---|---|
| 0.5 | 1 | 1.5 | 2 | 2.5 | 3 | 3.5 | 4 | |
| 0.2 | 27.336 | 16.326 | 4.617 | 10.690 | 30.219 | 23.895 | 26.002 | 28.669 |
| 0.3 | 9.970 | 55.355 | 82.191 | 98.420 | 98.407 | 98.400 | 98.367 | / |
| 0.4 | 16.896 | 38.719 | 89.200 | 98.277 | 98.323 | 98.473 | / | / |
Disclaimer/Publisher’s Note: The statements, opinions and data contained in all publications are solely those of the individual author(s) and contributor(s) and not of MDPI and/or the editor(s). MDPI and/or the editor(s) disclaim responsibility for any injury to people or property resulting from any ideas, methods, instructions or products referred to in the content. |
© 2023 by the authors. Licensee MDPI, Basel, Switzerland. This article is an open access article distributed under the terms and conditions of the Creative Commons Attribution (CC BY) license (https://creativecommons.org/licenses/by/4.0/).
Share and Cite
Yan, X.; Yang, H.; Mo, H.; Xie, Y.; Jin, Z.; Zhou, Y. Numerical Simulation on the Smoke Prevention Performance of Air Curtains in an Island-Type Subway Station. Fire 2023, 6, 177. https://doi.org/10.3390/fire6050177
Yan X, Yang H, Mo H, Xie Y, Jin Z, Zhou Y. Numerical Simulation on the Smoke Prevention Performance of Air Curtains in an Island-Type Subway Station. Fire. 2023; 6(5):177. https://doi.org/10.3390/fire6050177
Chicago/Turabian StyleYan, Xu, Hongyun Yang, Huiqiang Mo, Ye Xie, Zhongfu Jin, and Yang Zhou. 2023. "Numerical Simulation on the Smoke Prevention Performance of Air Curtains in an Island-Type Subway Station" Fire 6, no. 5: 177. https://doi.org/10.3390/fire6050177