Article

Numerical Study of the Effects of Surface Tension and Initial Volume Fraction on Gas-Liquid-Foam Three-Phase Flow Separation Process

1
Anhui Province Key Laboratory of Electric Fire and Safety Protection, State Grid Anhui Electric Power Research Institute, Hefei 230601, China
2
Faculty of Engineering, China University of Geosciences, Wuhan 430074, China
*
Authors to whom correspondence should be addressed.
Fire 2023, 6(3), 117; https://doi.org/10.3390/fire6030117
Submission received: 10 February 2023 / Revised: 2 March 2023 / Accepted: 8 March 2023 / Published: 13 March 2023
(This article belongs to the Special Issue Fire Numerical Simulation)

Abstract

:
Since it is low in cost and low in toxicity and has good biodegradability, gas-liquid-foam three-phase flow has been widely used in industrial fire protection. Due to the different characteristics of gas, liquid, and foam, liquid precipitation is liable to occur under static conditions, resulting in unstable performance of the mixture. To improve fire extinguishing efficiency, it is of great significance to study the separation process of gas-liquid-foam. In the present study, the effects of the surface tension (range from 0.04 to 0.07) and initial liquid volume fraction (range from 0.2 to 0.5) on the gas-liquid-foam separation process are investigated with the numerical tool Fluent. The liquid volume fraction is mainly influenced by two inverse effects: (a) the transformation of liquid into foam, and (b) the liquid drainage and bursting of foam. In the separation process, the volume fraction of small foam decreases monotonically while the volume fraction of medium and large foam increases slightly. Since the volume fraction of small foam is much greater than medium and large foam and its bursting process is dominant, the liquid volume fraction presents a monotonic increasing trend. The volume of the separated liquid increases almost linearly with time at various surface tensions and initial volume fractions, and the increase rate is about 0.004. In the range of the surface tension examined, the separation process is insensitive to the surface tension, resulting in almost the same drainage time. On the other hand, the separation process depends on the initial liquid volume fraction non-monotonically; namely, when the initial volume fraction is small, with the increase of the initial volume fraction, the liquid is more easily separated from the mixture, and when the initial volume fraction is over a critical value (about 0.4), the separation process is decelerated.

1. Introduction

Gas-liquid-foam (three-phase flow) has the advantages of low density, good thermal insulation and protection performance, and high fire-extinguishing efficiency. It is widely used in the fire protection field, mainly to extinguish liquid or solid fires such as petrochemical, substation, etc. [1,2,3,4,5,6,7,8]. For example, Zhao et al. [4] improved the fire extinguishing efficiency by combining gas-liquid-foam three-phase flow with a clean and degradable fire suppressant. The laboratory-scale experiments demonstrated that excellent fire- extinguishing performance can be achieved by optimizing the volume flow ratio of air to foam. Ding et al. [7] experimentally studied the extinguishing efficiency of the compressed gas-liquid-foam with different air–water ratios on the diesel pool fire, in which 25% drainage time and expansion ratio were investigated, and the gas–water ratio was in the range of 5–24. They found that both the 25% drainage time and the expansion ratio increased with increasing air–water ratio [7]. In order to achieve a better fire-extinguishing effect, it is necessary to understand the flow stability characteristics of gas-liquid-foam.
Since the density of the water is larger than that of the air and foam, the gas-liquid-foam three-phase flow is not stable under static condition. To be precise, under the effect of gravity, the bubbles burst, the water separates from the gas-liquid-foam three-phase flow and sinks to the bottom of the container, which degrades the fire-extinguishing performance of the gas-liquid-foam three-phase flow. Therefore, numerous researchers [9,10,11,12,13,14,15,16,17,18] have studied the stability of gas-liquid-foam three-phase flow so as to improve its fire-extinguishing performance. For example, Risal et al. [12] experimentally investigated the effect of surface-modified nanoparticles on the stability and pore-plugging performance of gas-liquid-foam, indicating that the modified nanoparticle-stabilized foam had high stability with an increasing pressure difference. Bashir et al. [18] studied the effects of foam quality and temperature on dynamic foam viscosity, pointing out that foam viscosity is a key attribute to calculate the foam flow in narrow channels. Due to the influence of nanoparticles, the stability and apparent viscosity of foam at high temperatures were increased.
Considering that it is difficult to analyze the interaction between phase flows by experimental methods, in recent years, numerical simulation technology has been increasingly applied to fluid flow analysis [19,20,21,22,23,24,25,26,27,28,29,30,31]. For example, Buwaand Ranade [20] numerically studied the effect of gas velocity, sparger design, and coalescence-suppressing additives on the dynamics of gas-liquid flow in a rectangular bubble column, and the model predictions were verified by comparison with the experimental data. Bhole et al. [23] developed a computational fluid dynamics code with the finite volume method in the Eulerian framework for the simulation of axisymmetric steady-state gas-liquid flows in bubble columns, where the population balance equation for the bubble number density was included. In the framework, assuming the mechanical balance of each bubble, the resistance and lift are properly sealed so that each bubble has a different speed [23].
In general, the aforementioned research provides valuable experimental and numerical data for studying the interphase interaction of gas-liquid two-phase flow. Comparatively, the inter-phase interaction of air–water foam three-phase flow is more complex, and the relevant research is limited. The foam is considered as a separate phase comprised of a mixture of air and water, and gas-liquid-foam three-phase flow involves two processes, namely, the formation of foam due to the transformation of both air and water into foam and the destruction due to water drainage and bursting of bubbles, which is quite different from the gas-liquid two-phase flow. To deepen our understanding of gas-liquid-foam three-phase flow, the separation process of the water from the gas-liquid-foam three-phase flow is conducted.
The present study is organized as follows. Firstly, the numerical scenarios are described. Next, the mathematical model is introduced briefly. Then, after a grid independence test is conducted, the effects of the surface tension and of the initial volume fraction on the separation process of the water from the gas-liquid-foam three-phase flow are investigated. Finally, the study is summarized and some conclusions are drawn.

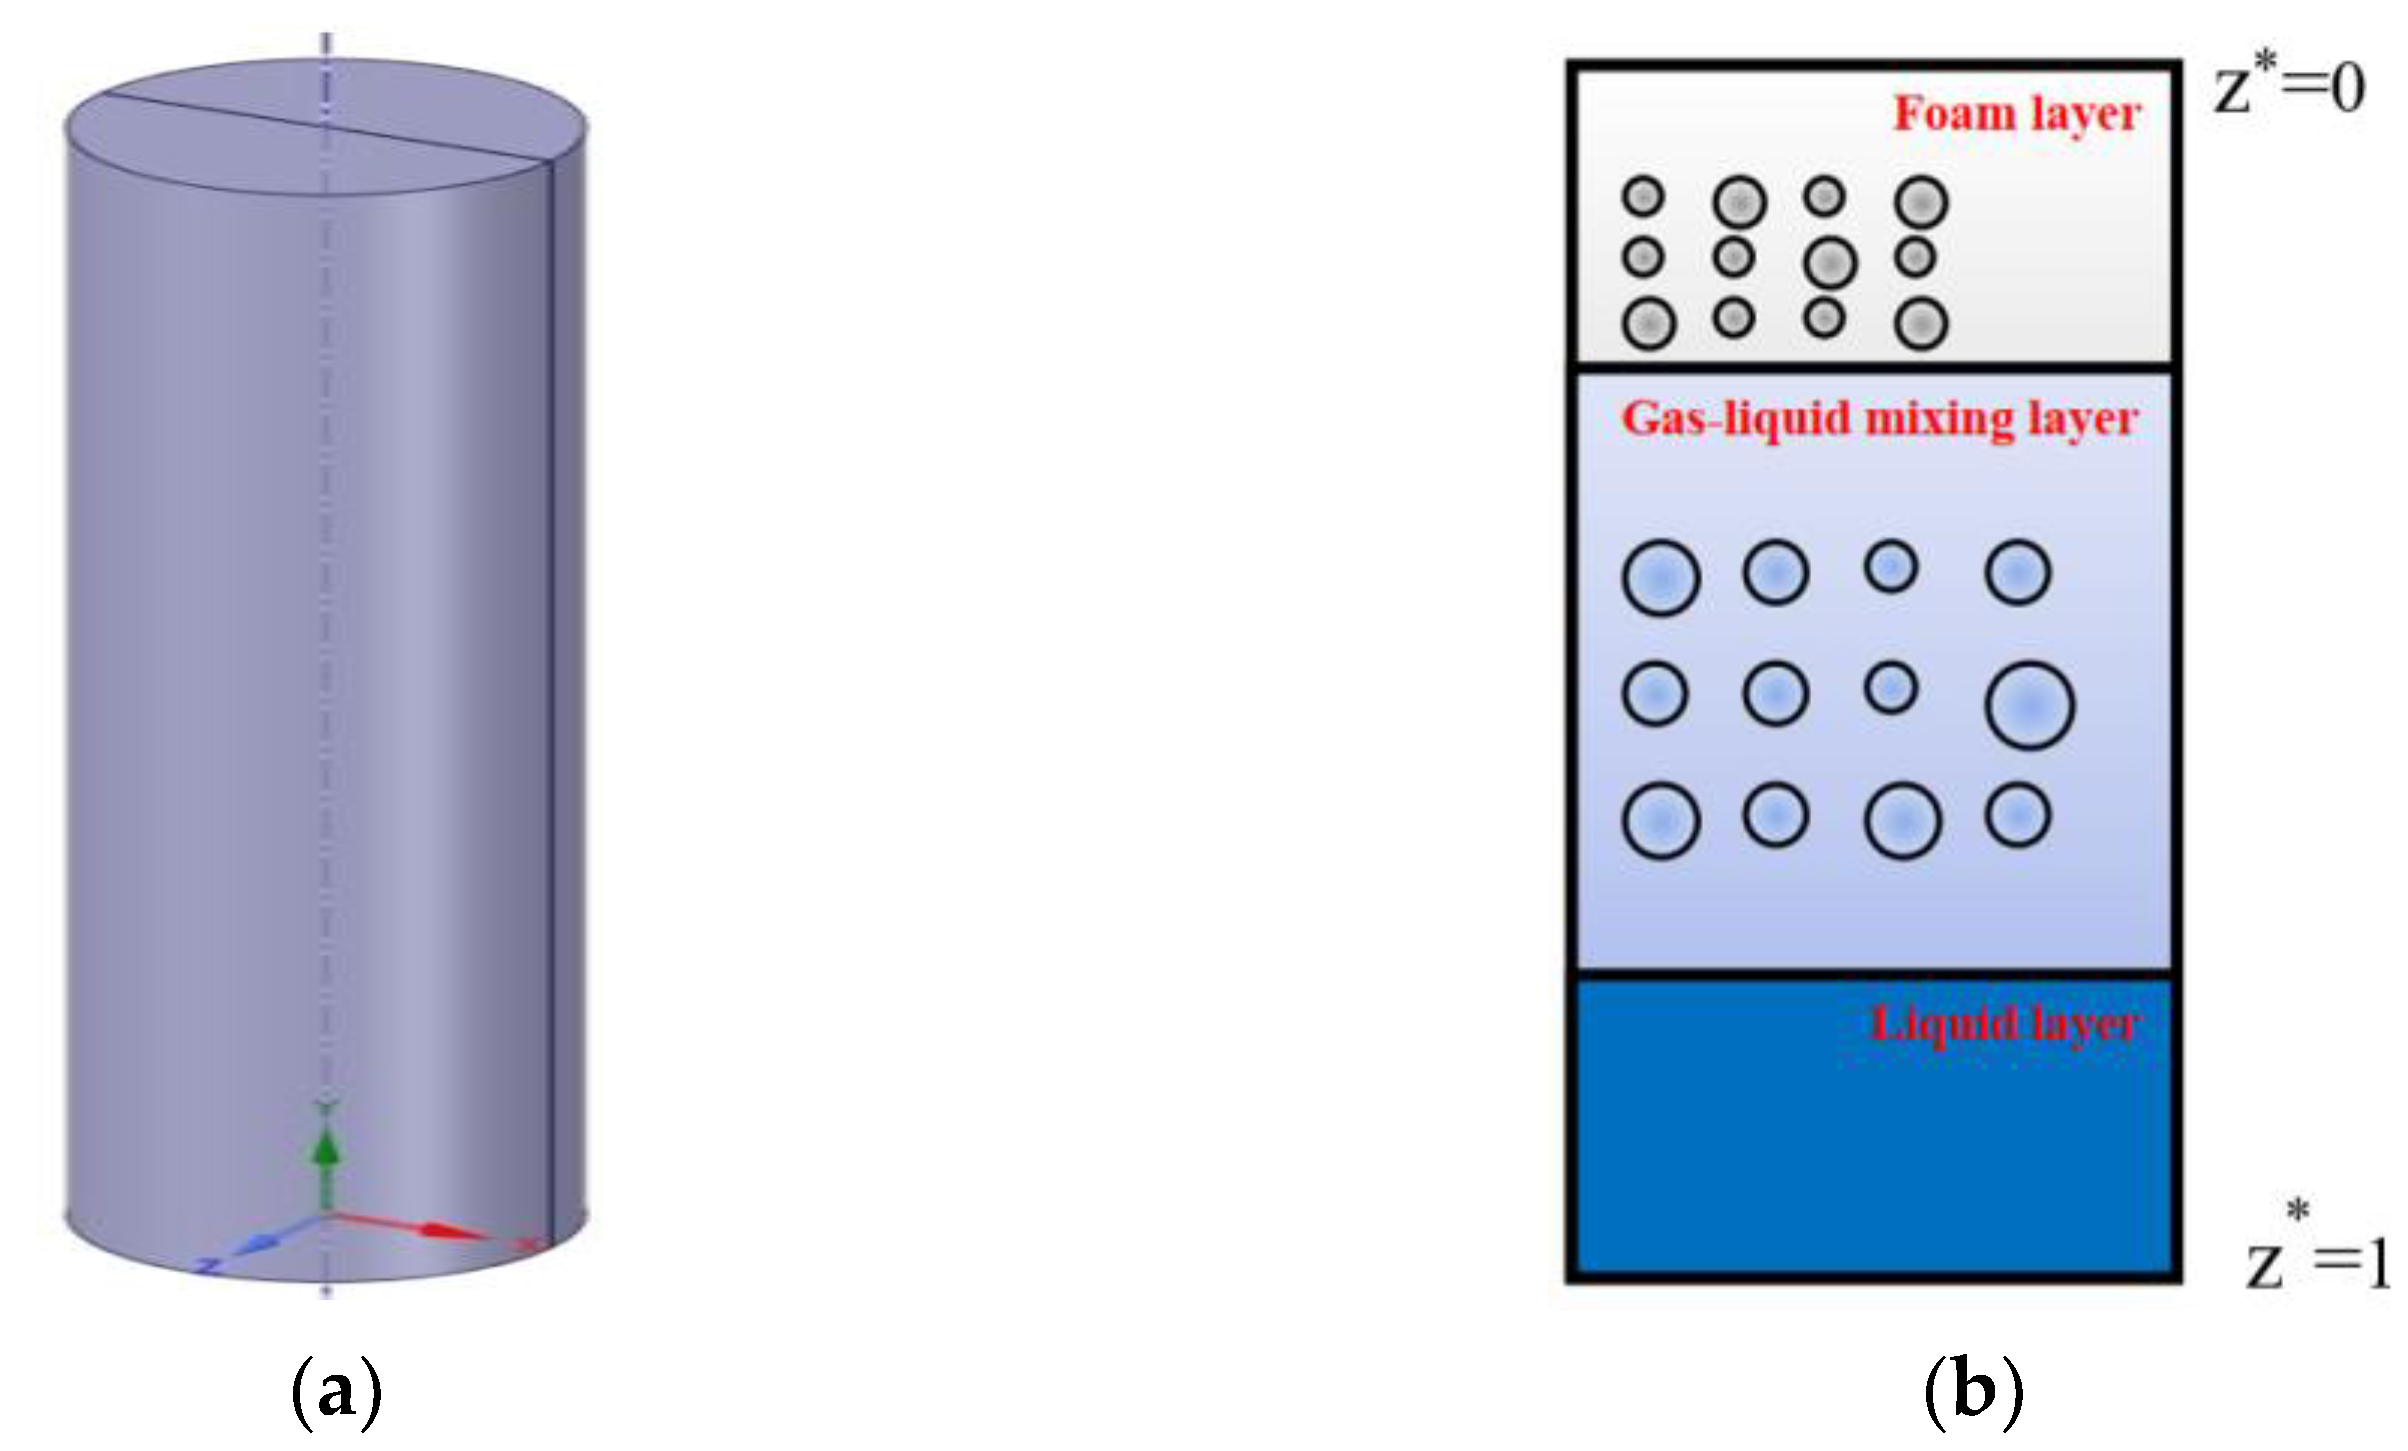
2. Numerical Modelling Setup

2.1. Numerical Scenarios

Fluent is one of the most commonly used CFD software in the world. It has many modules to simulate different physical and chemical reaction processes. Compared with other software, it has the following advantages: (1) Good stability. Fluent has been checked by a large number of examples, and these have been found to be in good agreement with the experiment; (2) Fluent has a wide range of applications, including a variety of heat transfer combustion models and multiphase flow models, which can be applied to almost all fluid-related fields; and (3) The calculation accuracy is high, up to second-order accuracy. Thus, the FLUENT code is employed for flow simulation to predict flow behavior in a cylindrical container. Figure 1 shows the setup of the model. The diameter of the cylindrical container is 108 mm, and the height of the cylindrical container(h) is 500 mm, which is filled with the gas-liquid-foam mixture initially. All the boundaries of the cylindrical container are walls, except that the top boundary is open to the atmosphere. The wall surface is set as “No slip,” and the related thermal conductivity is 0.45. There are many bubbles in the gas-liquid dispersion in the container. Due to the difference in density, the air bubbles will cream. During the creaming process, the aerated mixture in the cylindrical container can be divided into three layers: the foam layer, the gas-liquid mixing layer, and the liquid layer. Since the density of the liquid is larger than the gas and foam, the gas-liquid-foam mixture is not stable under the static condition; due to liquid drainage and foam bursting, the liquid separates from the gas-liquid-foam mixture and sinks to the bottom of the cylindrical container. The characteristic dimensionless height z* is expressed by:
z* = z/h
where z and h mean the vertical distance from the container top and container height, respectively.
The characteristic time t* is expressed by:
t* = U0t/h
where t means time and U0 means the free-creaming speed of a single bubble in the liquid.
Figure 1. Modelling setup. The aerated mixture can be divided into three layers: the foam layer, the gas-liquid mixing layer, and the liquid layer. (a) Three-Dimensional Model. (b) xy-Plane Slice.
Fire 06 00117 g001
To investigate the separation process of the liquid from the gas-liquid-foam mixture numerically, the population balance model [32,33] is adopted, where the distribution of the foam diameter is a key parameter. In the present study, twelve foam classes are adopted, which cover the typical foam diameters. Figure 2 shows the distribution of the foam diameter. The minimum foam diameter is 0.5 mm, and the maximum foam diameter is 4 mm. The gas-liquid-foam mixture consists of three phases: gas phase, liquid phase, and foam phase. The densities of the gas phase and liquid phase are 3 kg/m3 and 1200 kg/m3, respectively, and the viscosities of the gas phase and liquid phase are 0.0001 Ns/m2 and 0.04 Ns/m2, respectively. The foam is considered as a separate phase comprised of a mixture of gas and liquid, and the density and viscosity of the foam phase are calculated by the following equations [32,33],
ρf = ρg + ρl(1 − αl)
vf = vg + vl(1 − αl)
where ρg, ρl, and ρf, respectively, denote the density of the gas, liquid, and foam phases; νg, νl and νf, respectively, represent the viscosity of the gas, liquid, and foam phases; and αl is the liquid volume fraction in the foam phase. The density and viscosity of the foam phase increase with liquid volume fraction. The whole simulation was conducted using a Dell Workstation T7920 with the CPU of Intel (R)5218R*2, and the total computing time took about one month.

2.2. Governing Equations

To investigate the separation process of the liquid from the gas-liquid-foam mixture numerically, the population balance model and the Eulerian model [32,33] are adopted. The separation process of the liquid from the gas-liquid-foam mixture involves inter-phase mass and momentum transfer, formation, and bursting of foam, thus solving the mass and momentum conservation equations; population balance equation is important. We assume that liquid, gas, and foam are independent phases. The mass conversion equation is given by
a k ρ k t + a k ρ k V k = k = 1 , k l 3 Γ k l   ,   k = 1 , 2 , 3
where αk is the volume fraction of the k-phase, Vk is the velocity of the k-phase, and Γkl is the inter-phase mass exchange between the k-phase and the l-phase.
Based on the finite volume method, the momentum conservation equation for each phase in the Euler approach is
a k ρ k v k t + a k ρ k V k = a k p + a k ( τ k + T k ) + a k ρ k N ¯ + M k l ,   k = 1 , 2 , 3
where p is pressure, N ¯ is the body force vector, Tk is the Reynolds stress, Mkl is the inter-phase momentum exchange between the k-phase and l-phase, and τk is the shear stress.
The scalar parameter foam phase is introduced into the gas phase and foam phase.
Due to the transformation of gas and liquid into foam and the destruction of liquid drainage and foam bursting, the number density of the different foam classes will vary. To track the number density of a single bubble class, the population balance equation is employed as follows:
a k ρ k Θ k i t + a k ρ k V k Θ k i = S i
where Θ k i denotes the fraction of foam class i, and Si refers to the source term of foam class i caused by the rupture and coalescence of foam and gas-liquid dispersion.

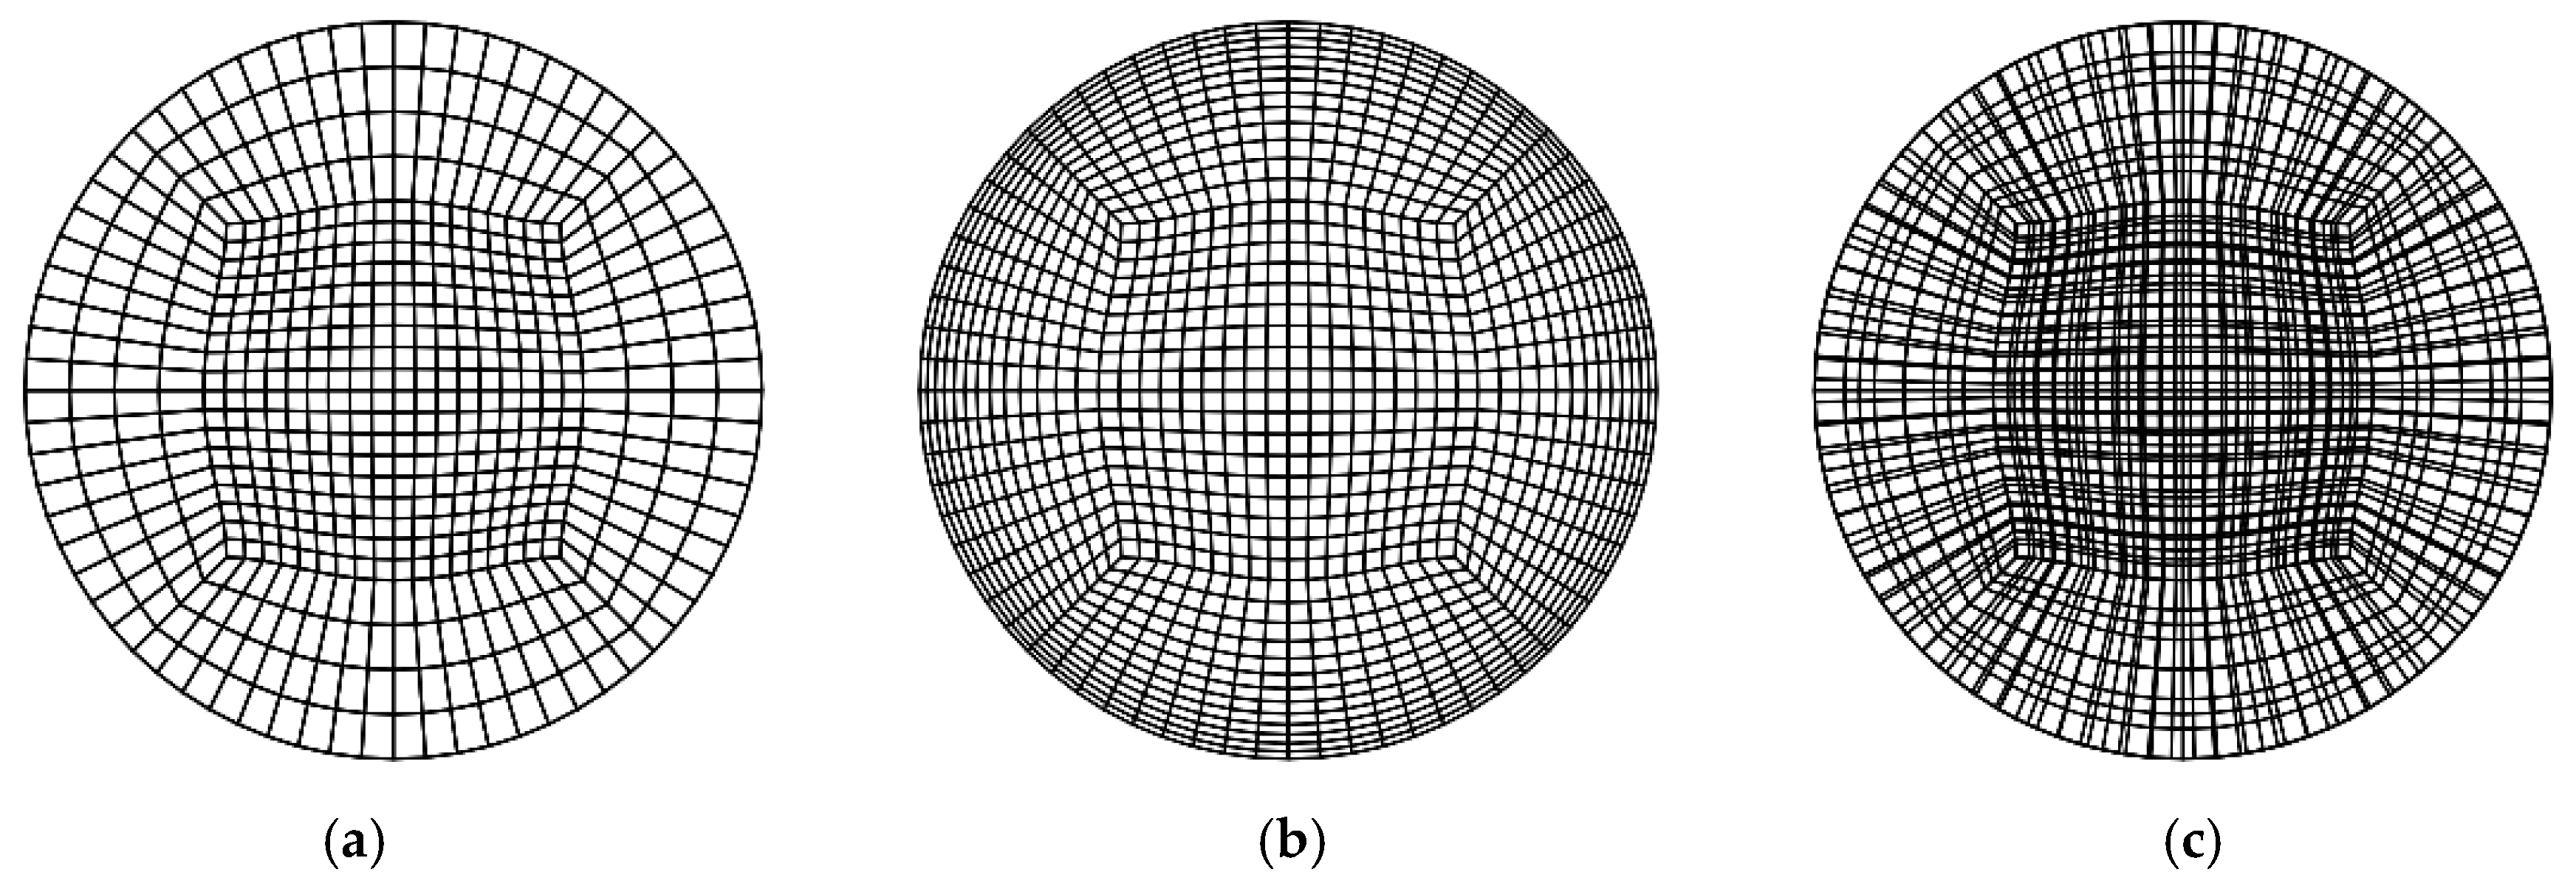
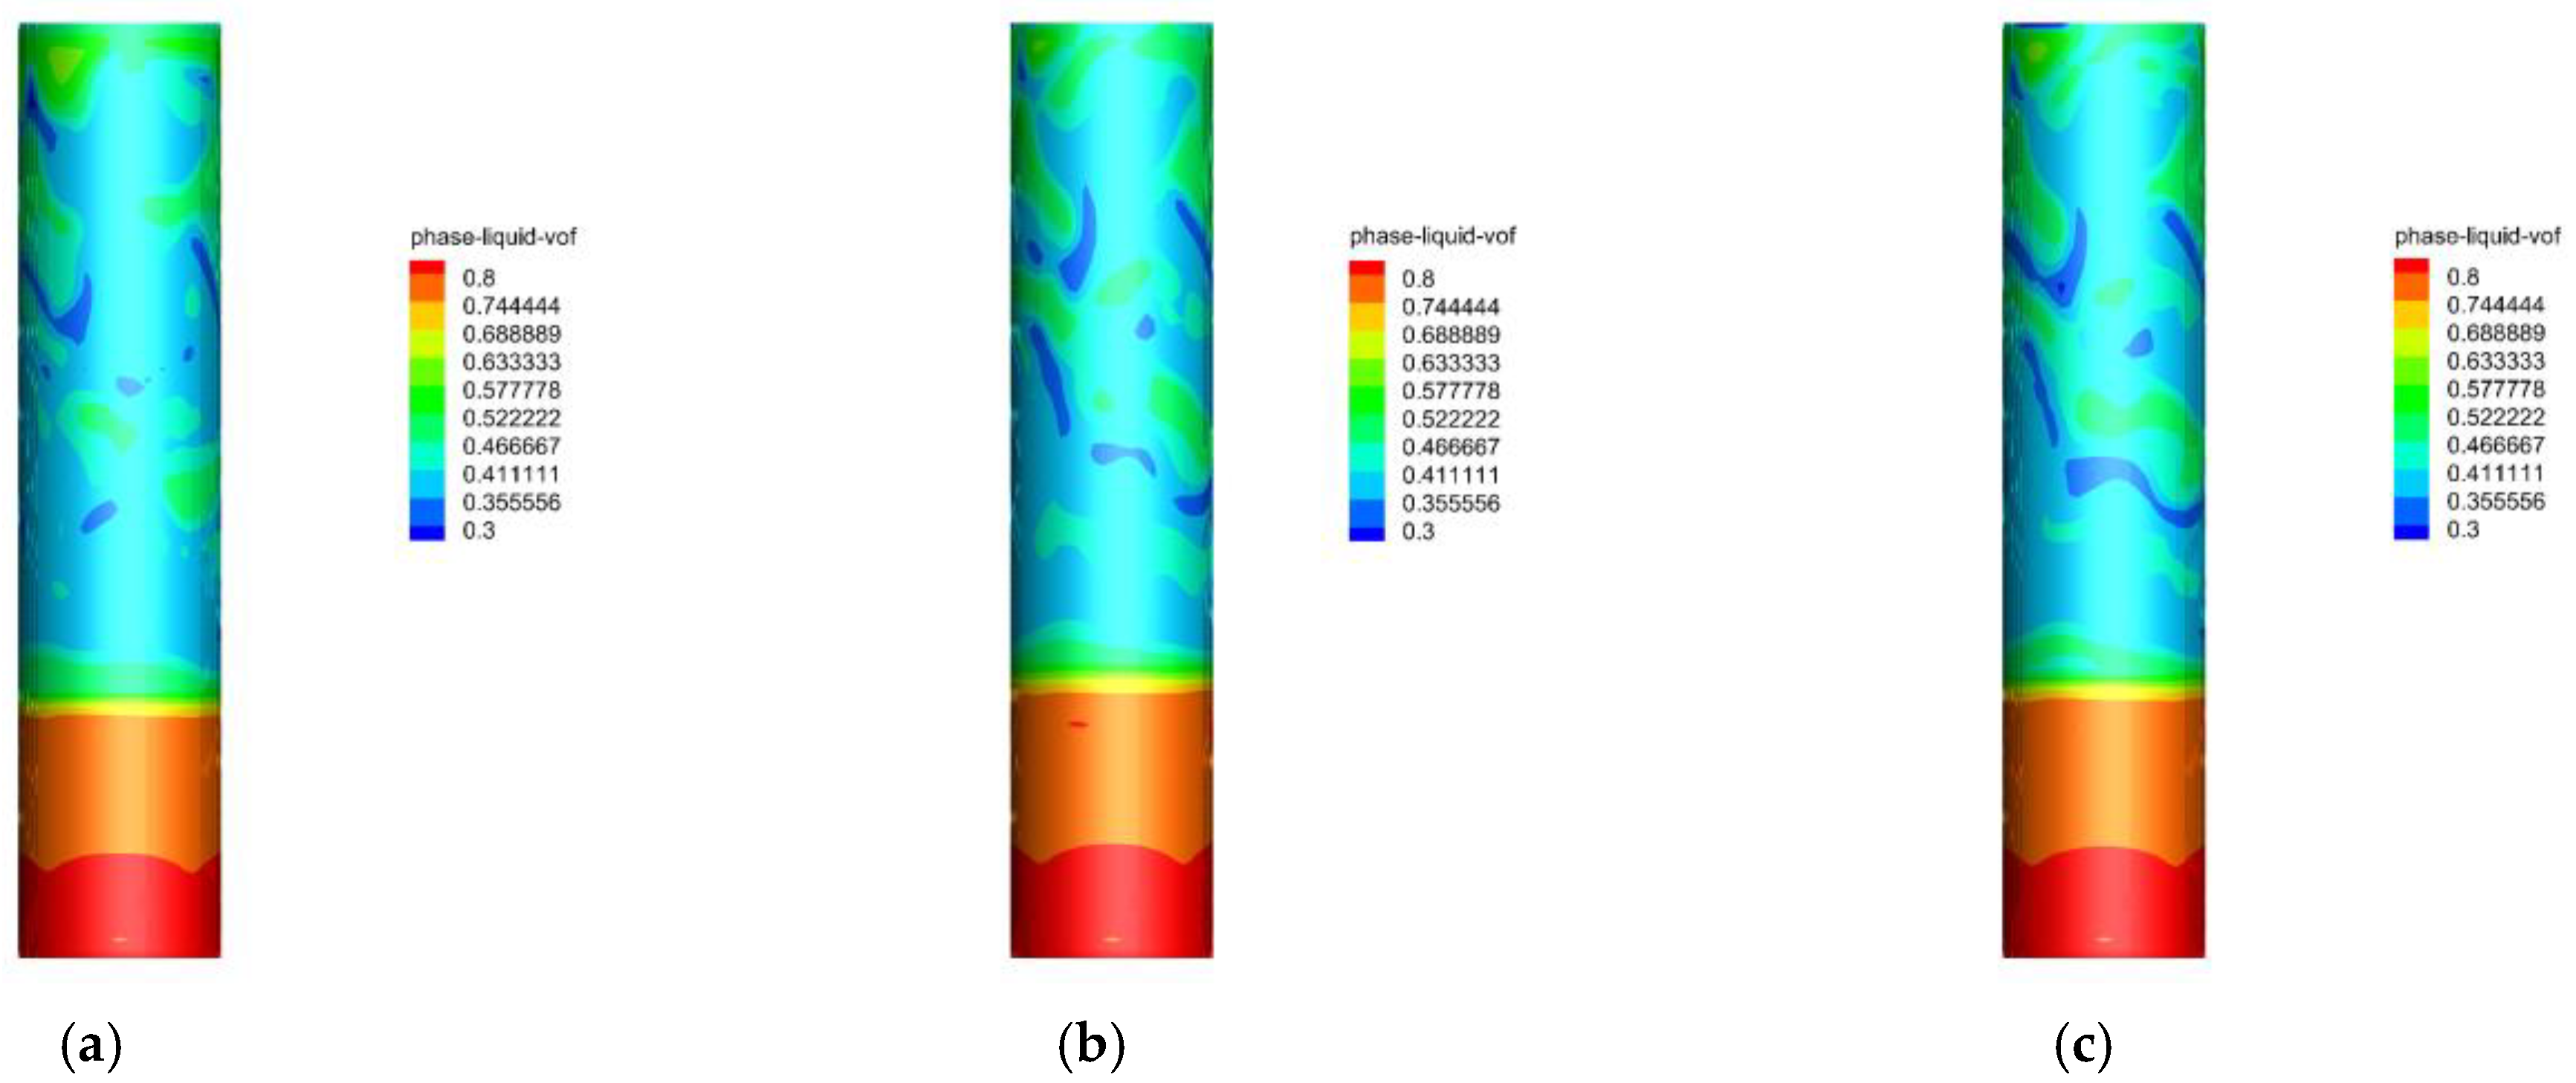
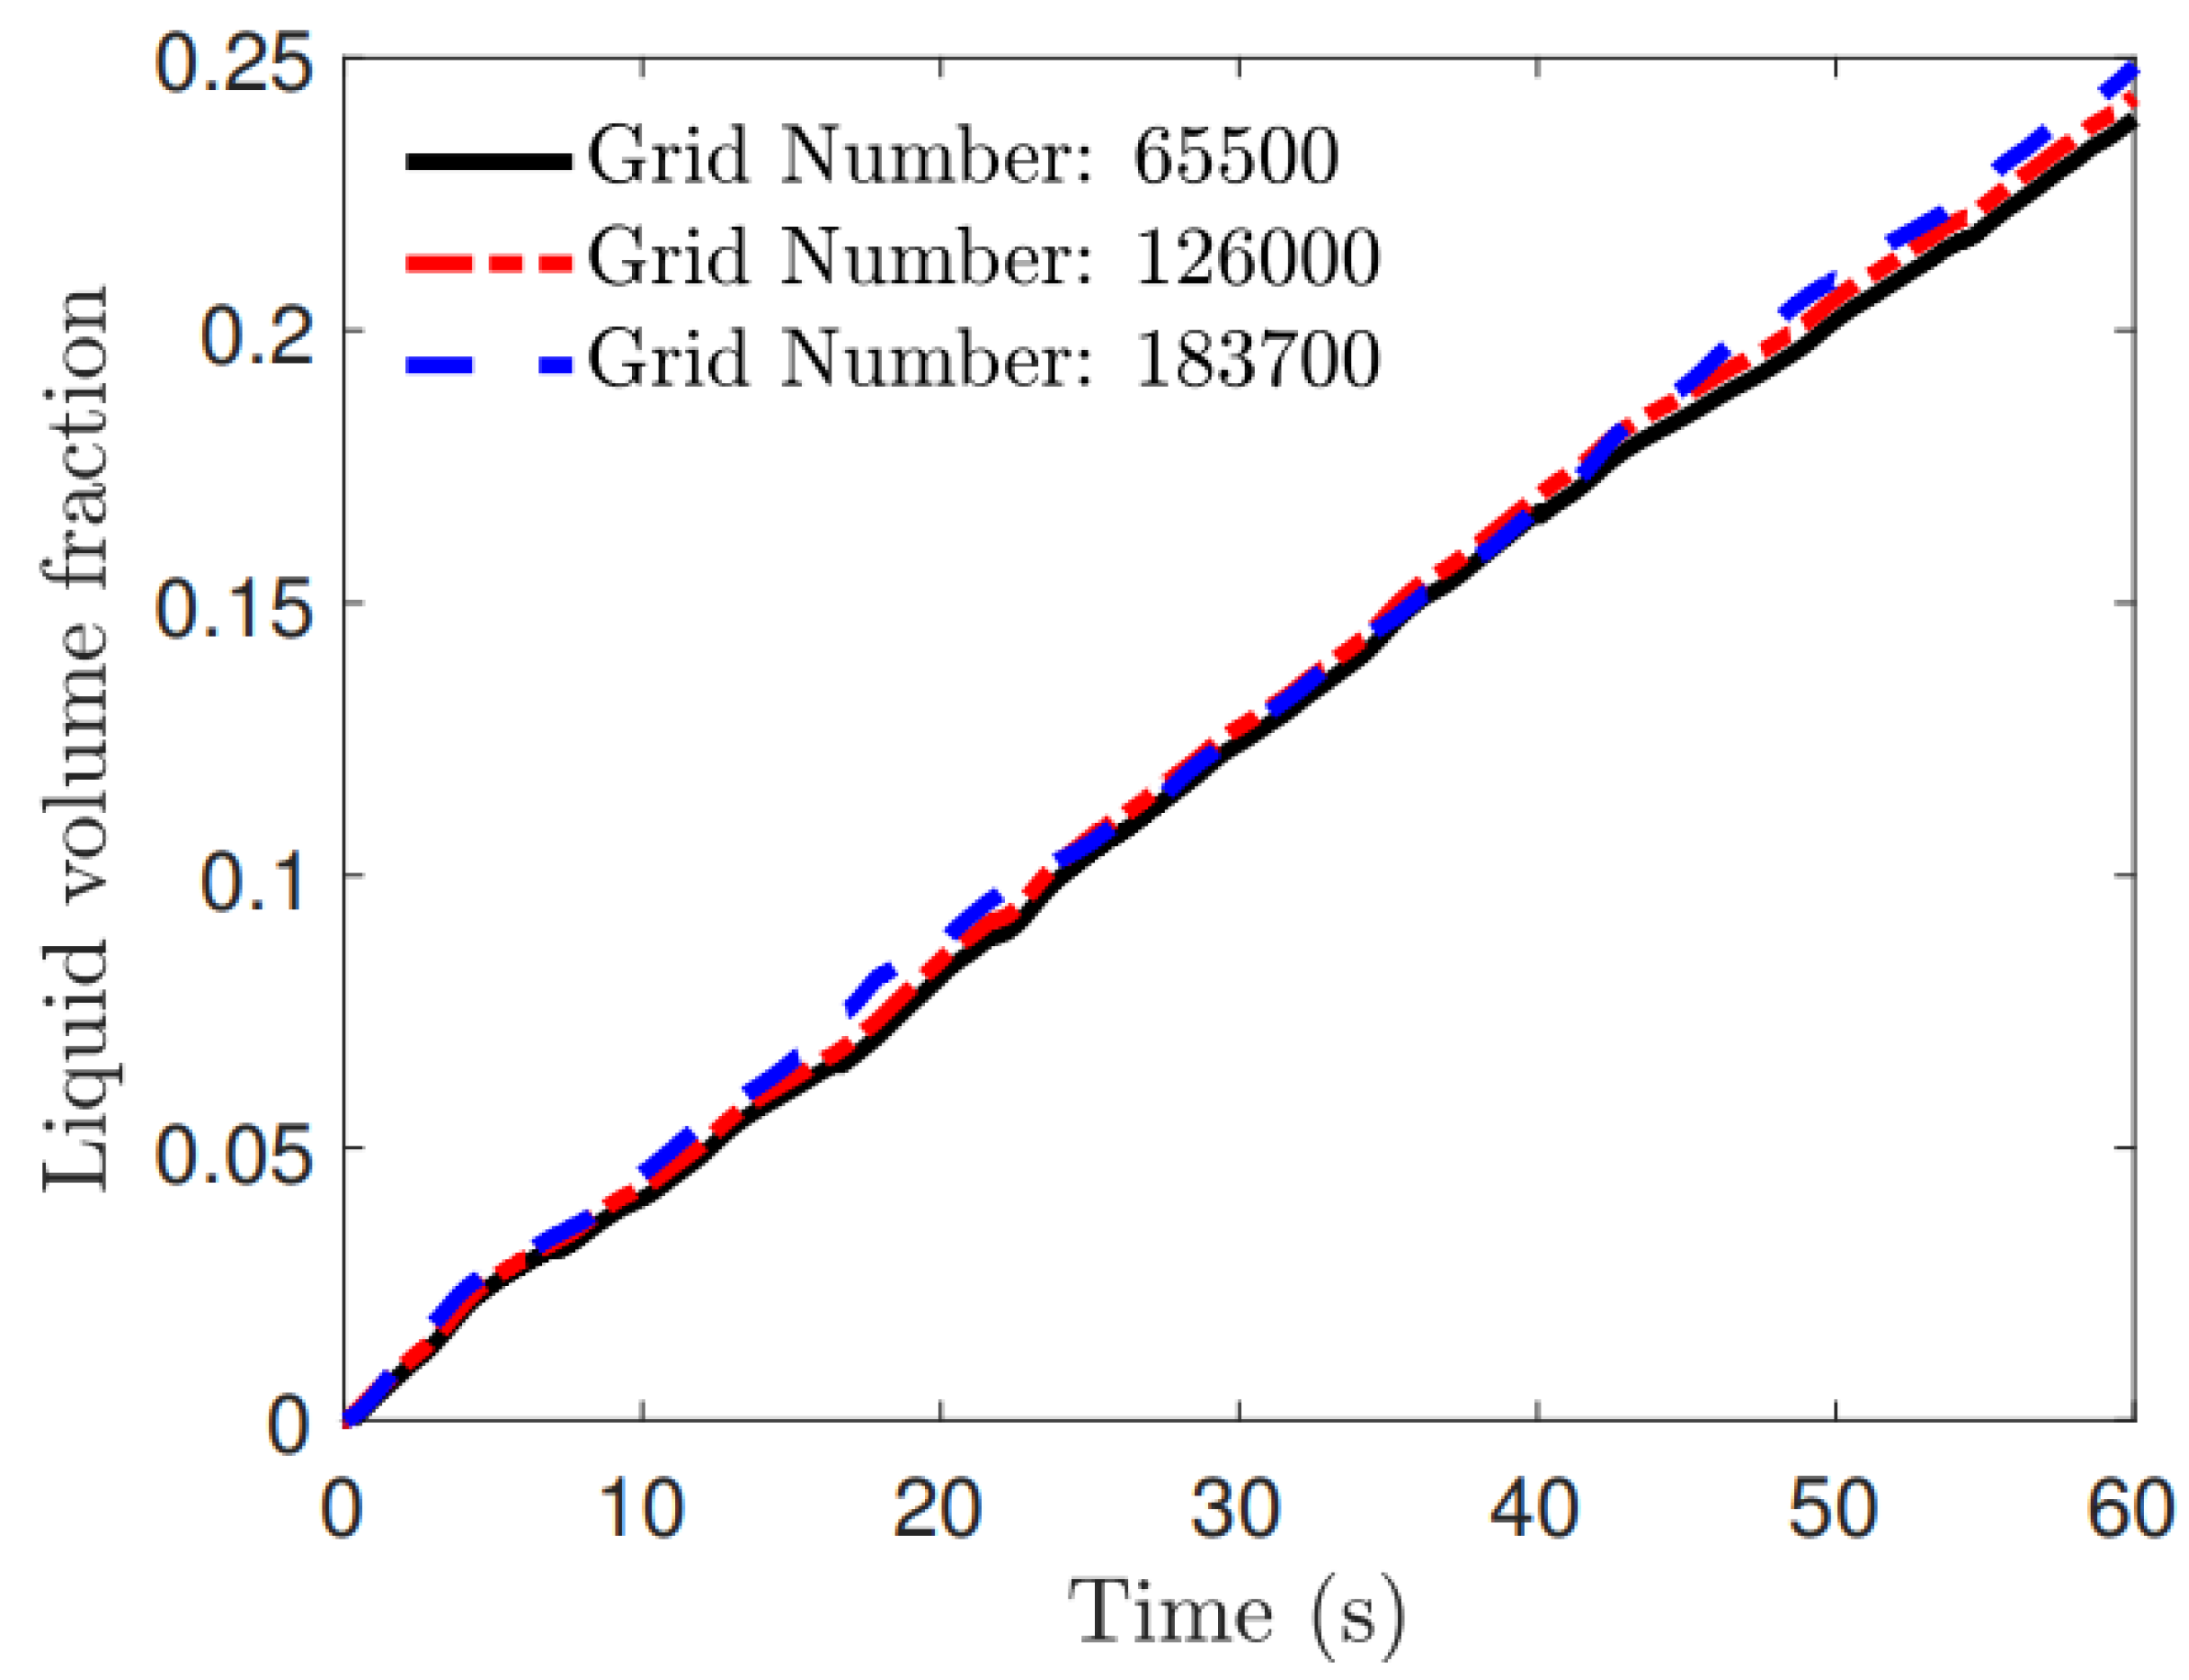
2.3. Grid Sensitivity Analysis and Model Verification

Using a coarse grid may cause the results to deviate from the accurate solution, while using a too-find grid will raise the cost of obtaining an accurate solution. To investigate the separation process of the liquid from the gas-liquid-foam mixture accurately, a grid independence test is conducted. To increase the computational accuracy, the structured hexahedron grid is adopted. Taking the case of surface tension σ = 0.07 and initial liquid volume fraction αl = 0.4 as an example, Figure 3 shows the grid arrangement of xz-plane slice, where the grid numbers are 65,500, 126,000, and 18,3700, respectively. It should be noted that the above three grid numbers are selected on the basis of the Fluent grid recommendation criteria. Obviously, with the increase in the grid number, the grid becomes finer, and the interphase interaction of the gas-liquid-foam mixture is described more accurately. Figure 4 shows the distribution of the gas-liquid-foam three-phase flow during the separation process at 30 s, where the grid numbers are 65,500, 126,000, and 183,700, respectively. Since the density of the liquid is larger than that of the gas and foam, under the effect of the gravity the foam bursts and the liquid separates from the gas-liquid-foam mixture and sinks to the bottom of the container. It is observed that the distribution of the gas-liquid-foam between the grid numbers 65,500 and 126,000 is obviously different, while the distribution of the gas, liquid, and foam between the grid numbers 126,000 and 183,700 is very close. Moreover, Figure 5 shows the time history of the liquid volume fraction, where the grid numbers are 65,500, 126,000, and 183,700, respectively. The volume fraction of the liquid increases monotonically until the liquid volume fraction reaches 0.25 (25%), and the separation process of the liquid from the gas-liquid-foam mixture reaches the steady state. Similarly, between the grid numbers 65,500 and 126,000, the difference in the volume fraction of the liquid is obvious, while the volume fraction of the liquid is very close between grid numbers 126,000 and 183,700. In order to balance the accuracy and efficiency of the numerical results, the grid number 126,000 is adopted.

3. Results and Discussion

To investigate the separation process of the liquid from the gas-liquid-foam mixture, the effects of the surface tension and the initial volume fraction on the separation process are discussed.

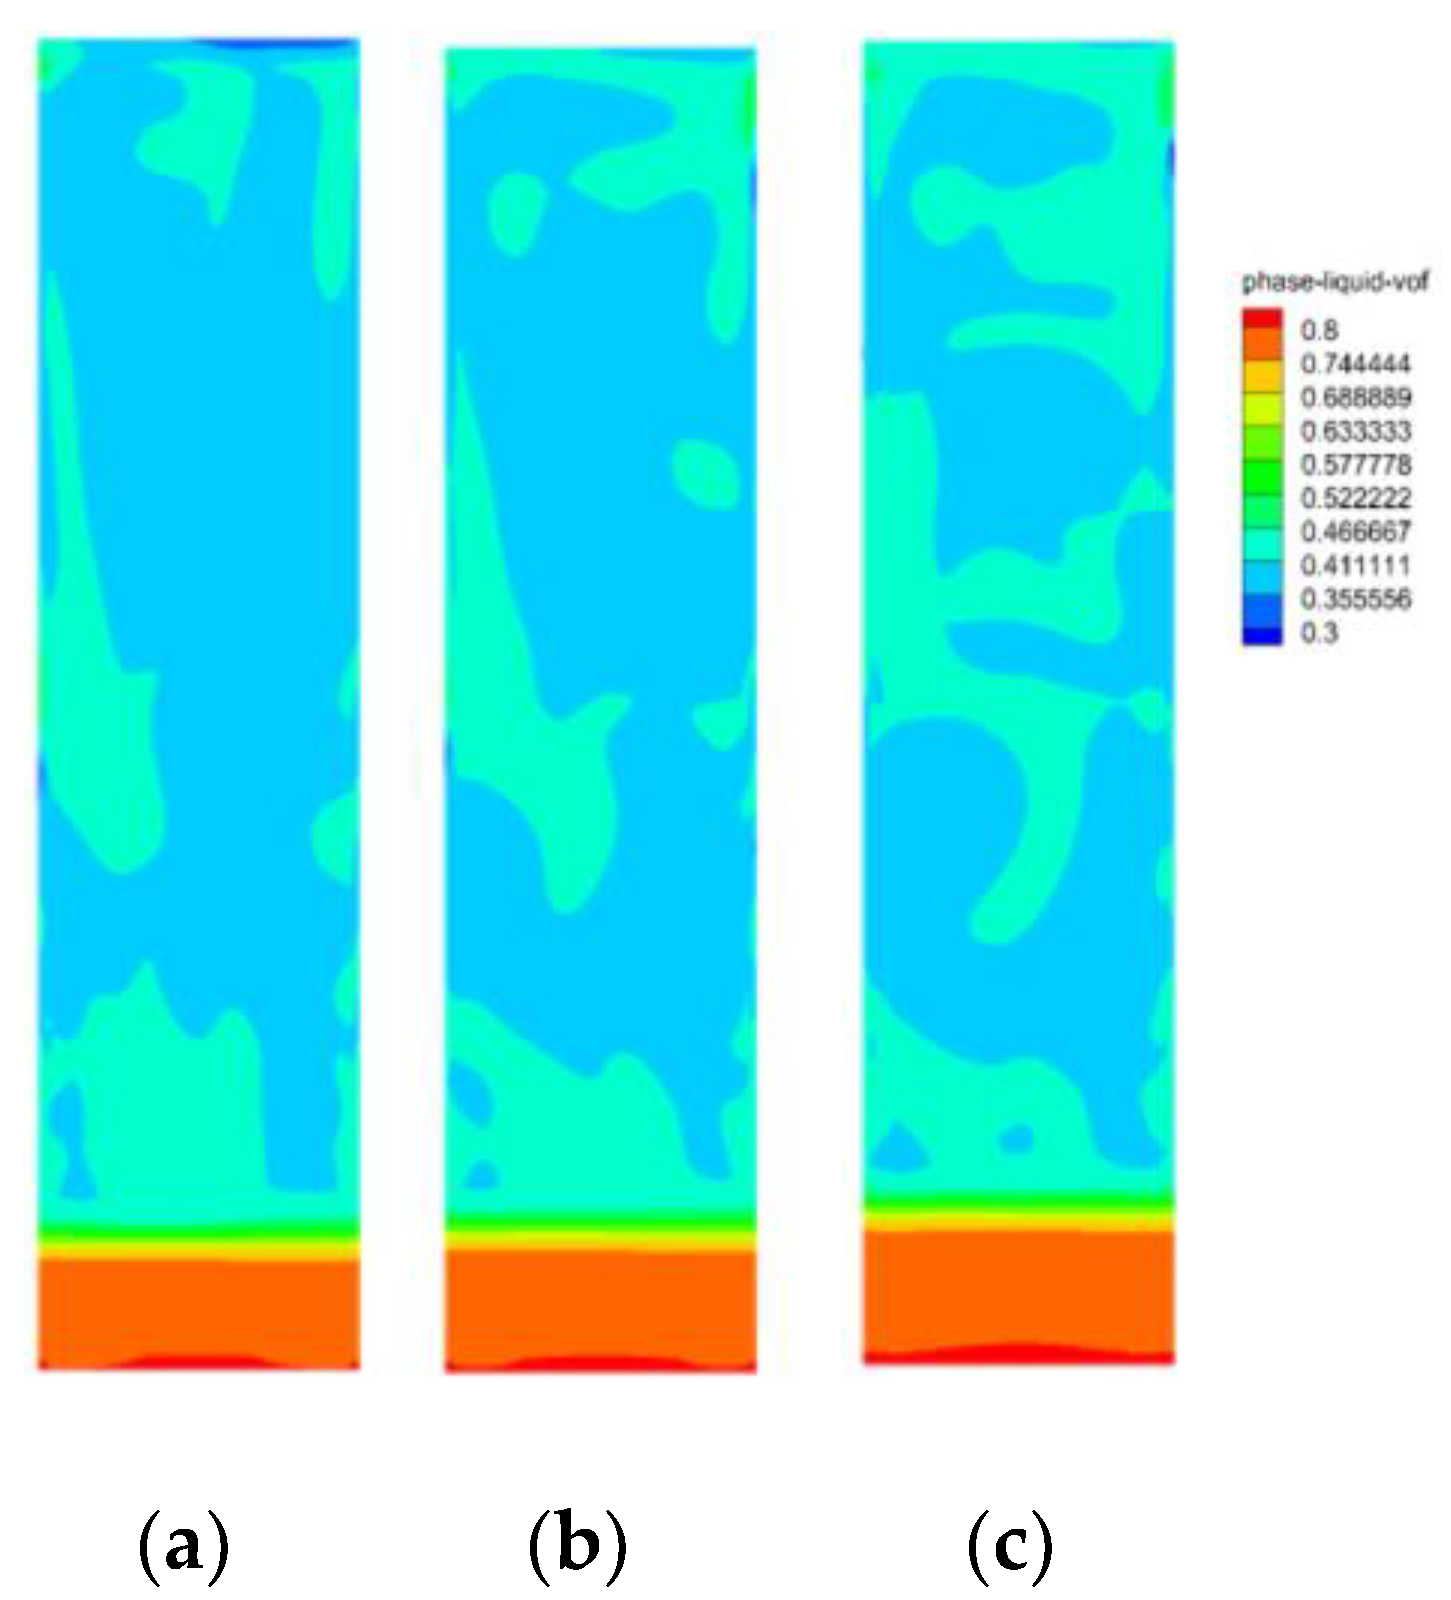
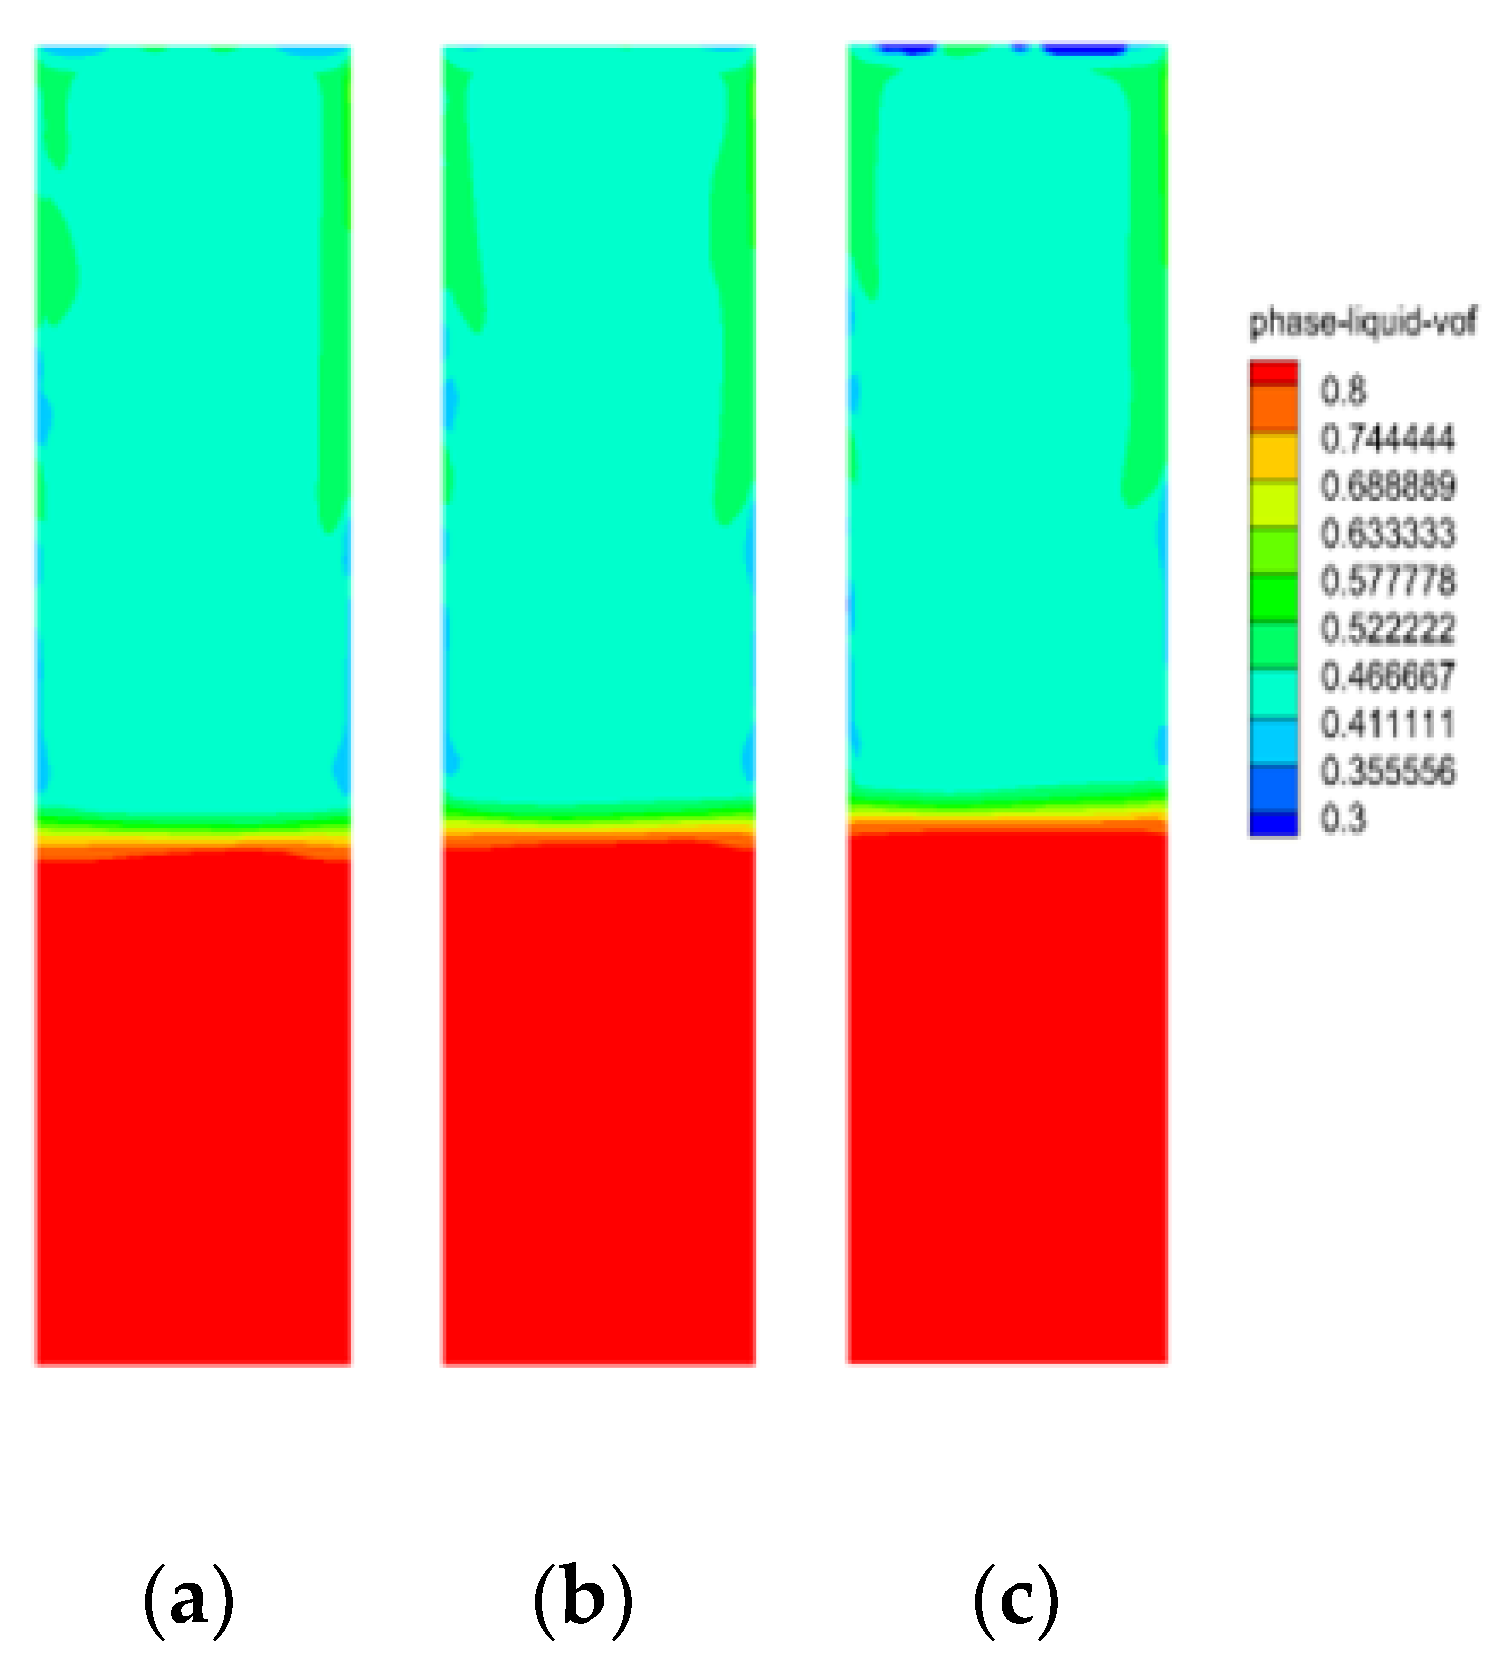
3.1. Effect of Surface Tension on Liquid Separation

Under the static condition, the gas-liquid-foam mixture is not stable; namely, it is apt to reach a low surface energy state. Thus, the surface tension may affect the separation process of the gas-liquid-foam mixture. Initially, the liquid volume fraction is set to be αl = 0.1. The surface tension of the liquid phase is dominant. Thus, the selection of the surface tension is close to the liquid phase. To investigate the separation process of the gas-liquid-foam mixture quantitatively, Figure 6 presents the evolution of the liquid volume fraction with time, where different surface tensions are adopted. Obviously, the whole volume fractions of the liquid phase increase almost linearly. Interestingly, the separation process of the gas-liquid-foam mixture is insensitive to surface tension; namely, at different surface tensions, the drainage time is almost the same.
To visualize the separation process of the gas-liquid-foam mixture, Figure 7 and Figure 8 show the distribution of the liquid volume fraction of xy-plane slice during the separation process at 30 s and 60 s, respectively, where the surface tensions are different. Under the effect of gravity, the liquid volume fraction increases obviously. Since the density of the liquid is larger than that of the gas and foam, the liquid phase sinks to the bottom of the cylindrical container. At 30 s, though the surface tension is different, the distribution of the liquid volume fraction is quite similar. At 60 s, at the bottom of the cylindrical container, the liquid volume fraction is close to 1. Figure 9 exhibits the time history of the volume fraction of the foam phase, where the surface tension is σ = 0.055. With the increase in class index, the foam becomes larger. The liquid volume fraction is affected by two processes: the formation of foam due to the transformation of both gas and liquid into foam and the destruction due to liquid drainage and foam burst. During the separation process, after a short period of increase, the volume fraction of the small foam decreases monotonically, while the volume fraction of the medium and large foam increases weakly. However, the volume fraction of the small foam is much greater than that of medium and large foam, due to the bursting of the small foam; the liquid separates from the gas-liquid-foam mixture, and the liquid volume fraction increases monotonically.
At different surface tensions, the liquid volume fraction increases with time almost linearly. Thus, a linear fitting, namely, αl = kt + b, is adopted to investigate the relation between the liquid volume fraction and the time, where k is the slope of the line, and b is the interception of the line. Figure 10 shows the curves of the liquid volume fraction with the time, together with the linear fitting results, where the surface tensions are different. It is observed that the linear fitting is very close to the original data; namely, the liquid volume fraction increases linearly with time. Furthermore, Figure 11 shows the relation between the slope of the line and the surface tension, where the surface tensions are different. At different surface tensions, the difference in the slopes of the lines is negligible (in Figure 11, the error of growth rate is within ±5%); namely, the separation process of the gas-liquid-foam mixture is insensitive to the surface tension.

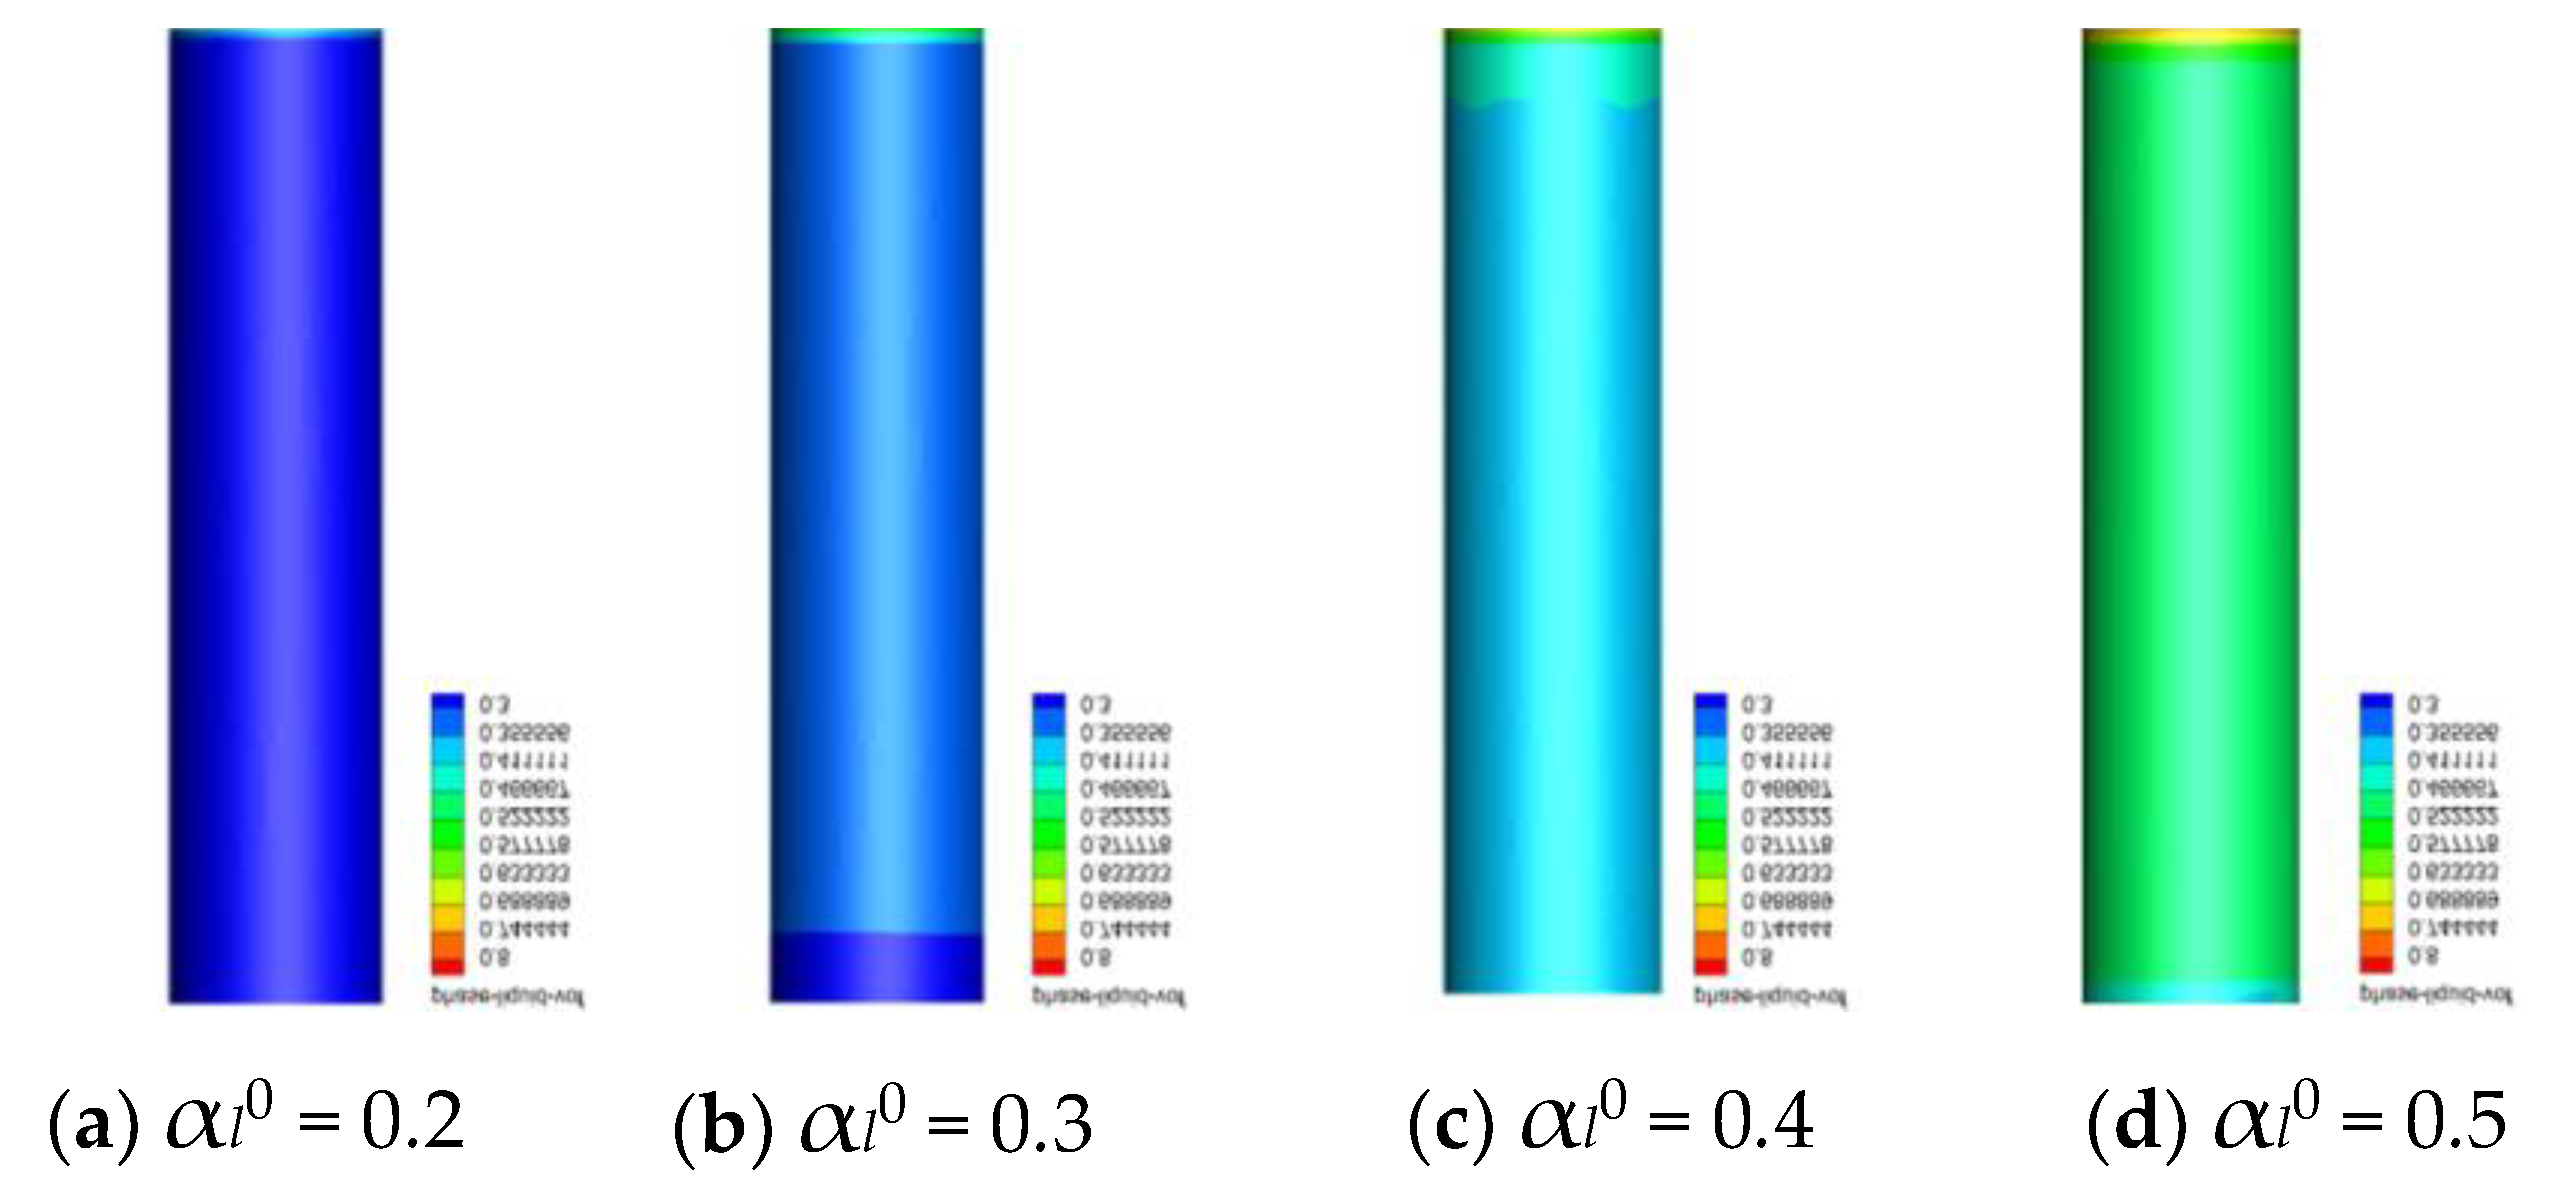
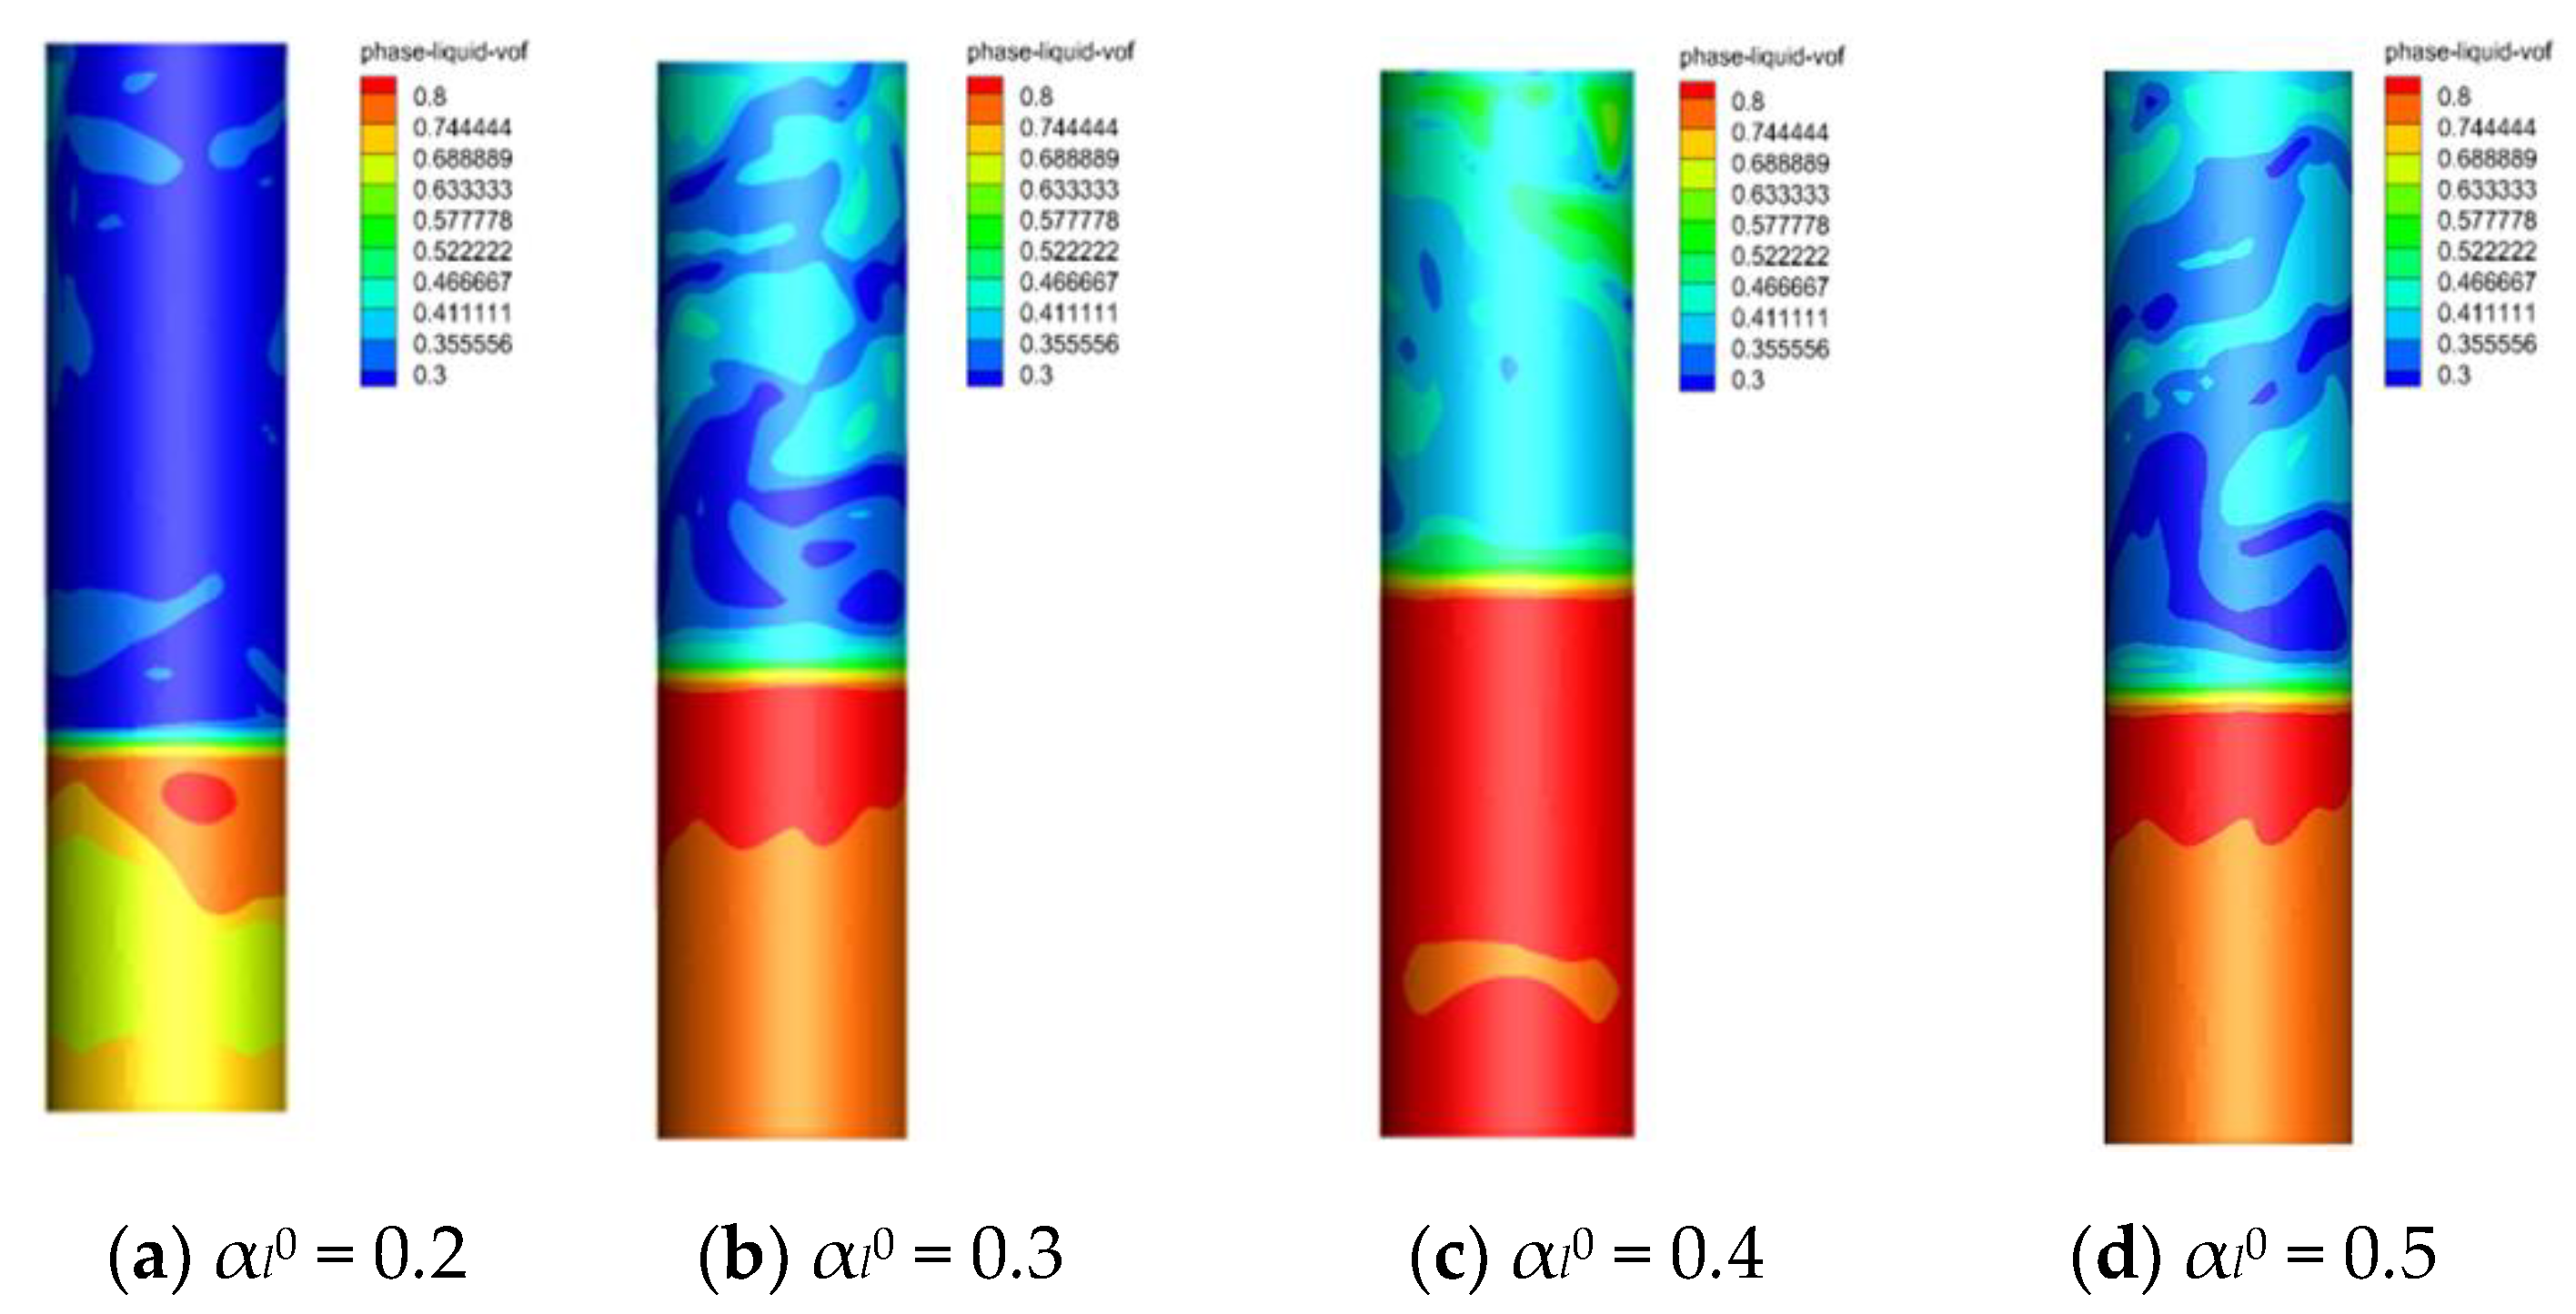
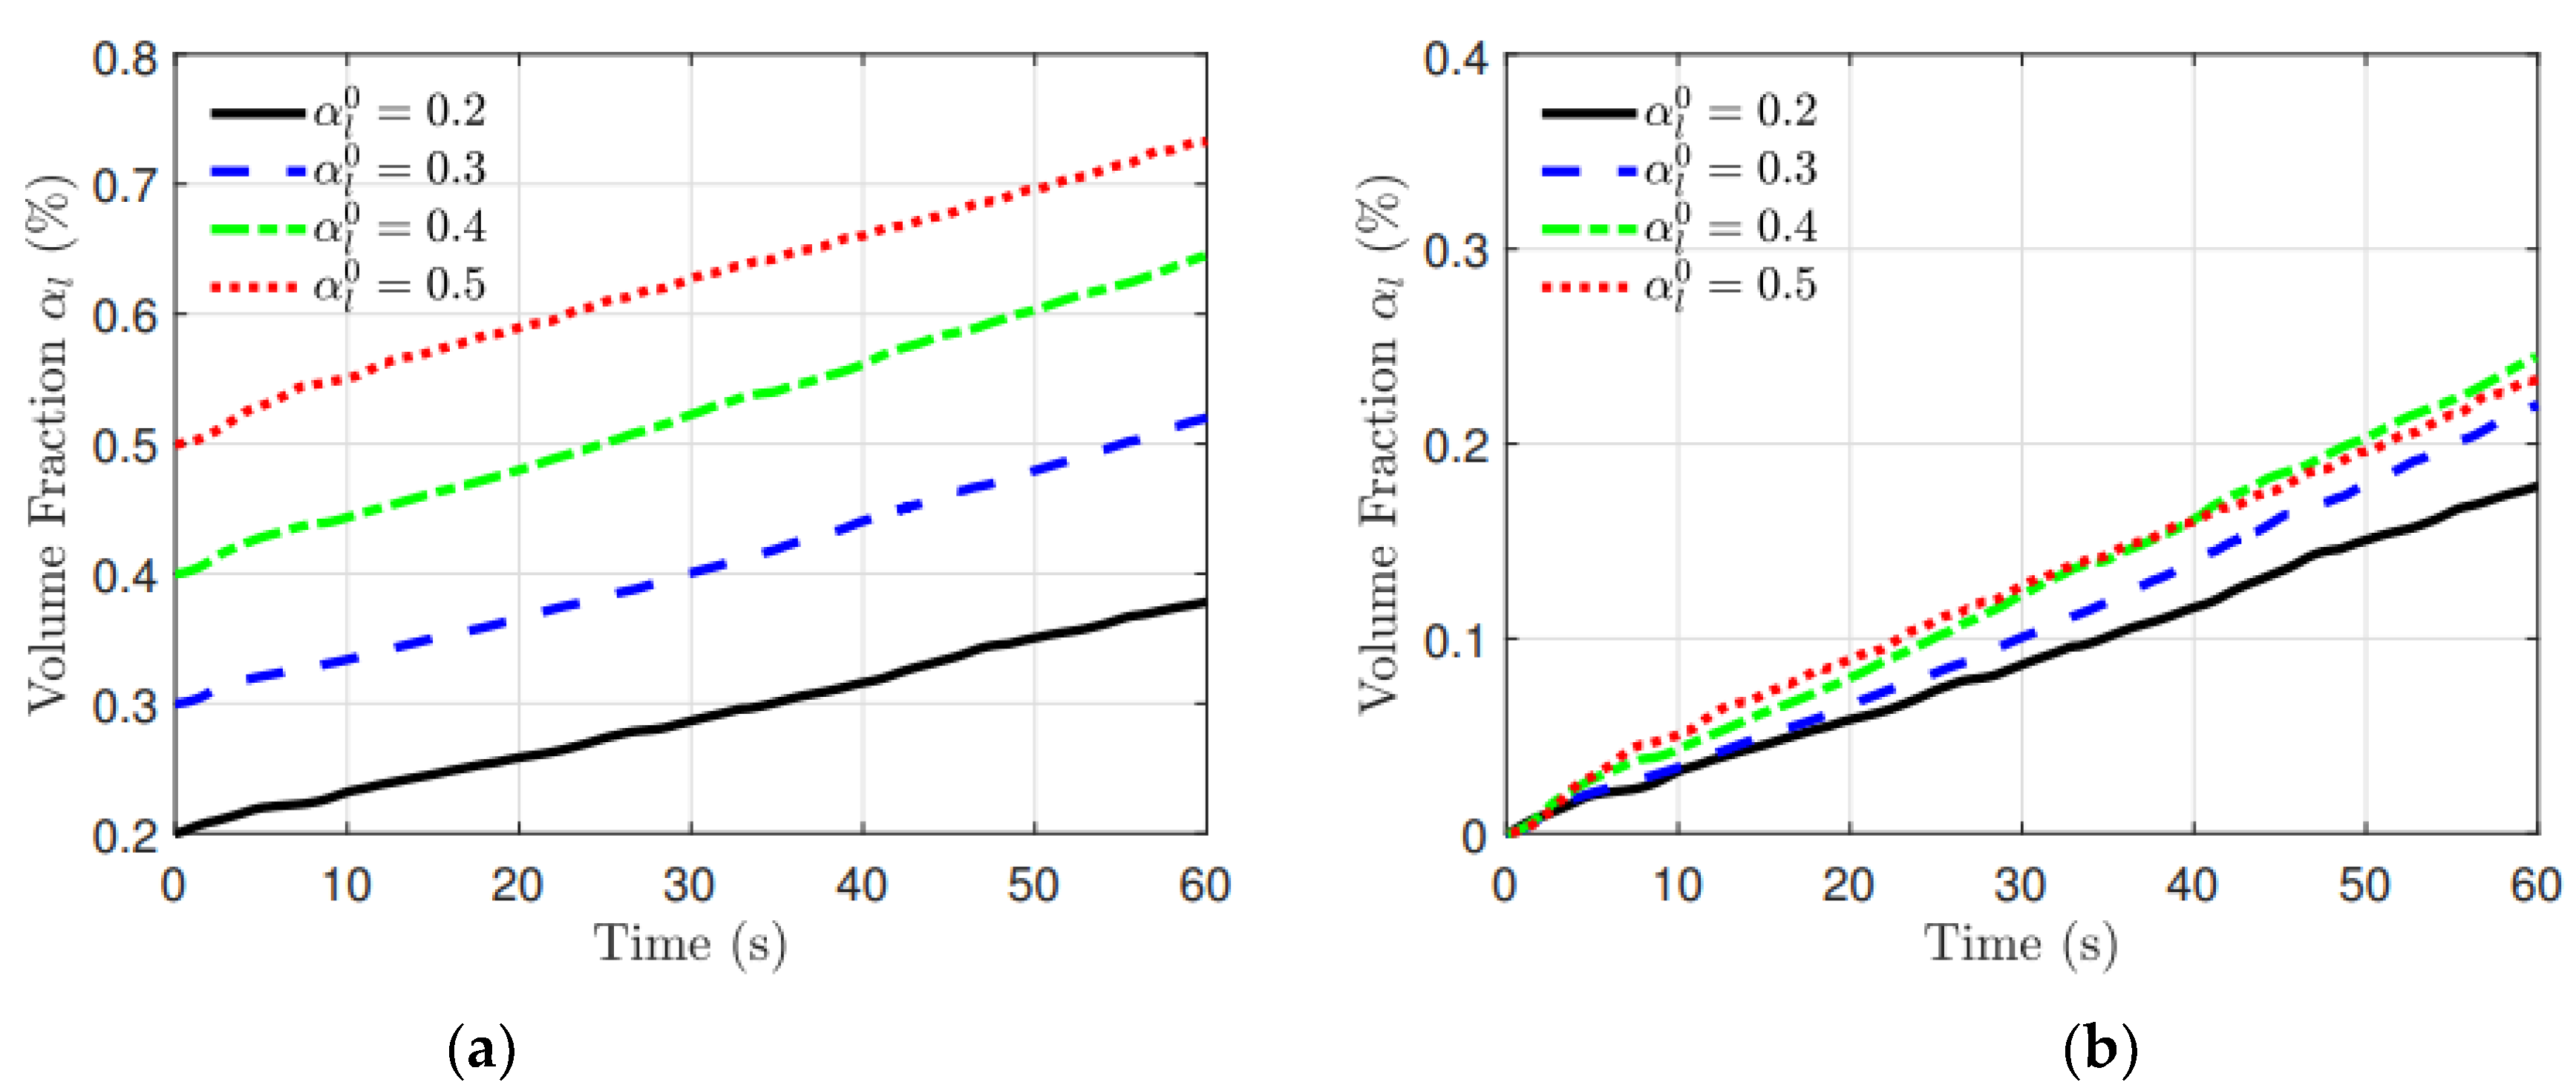
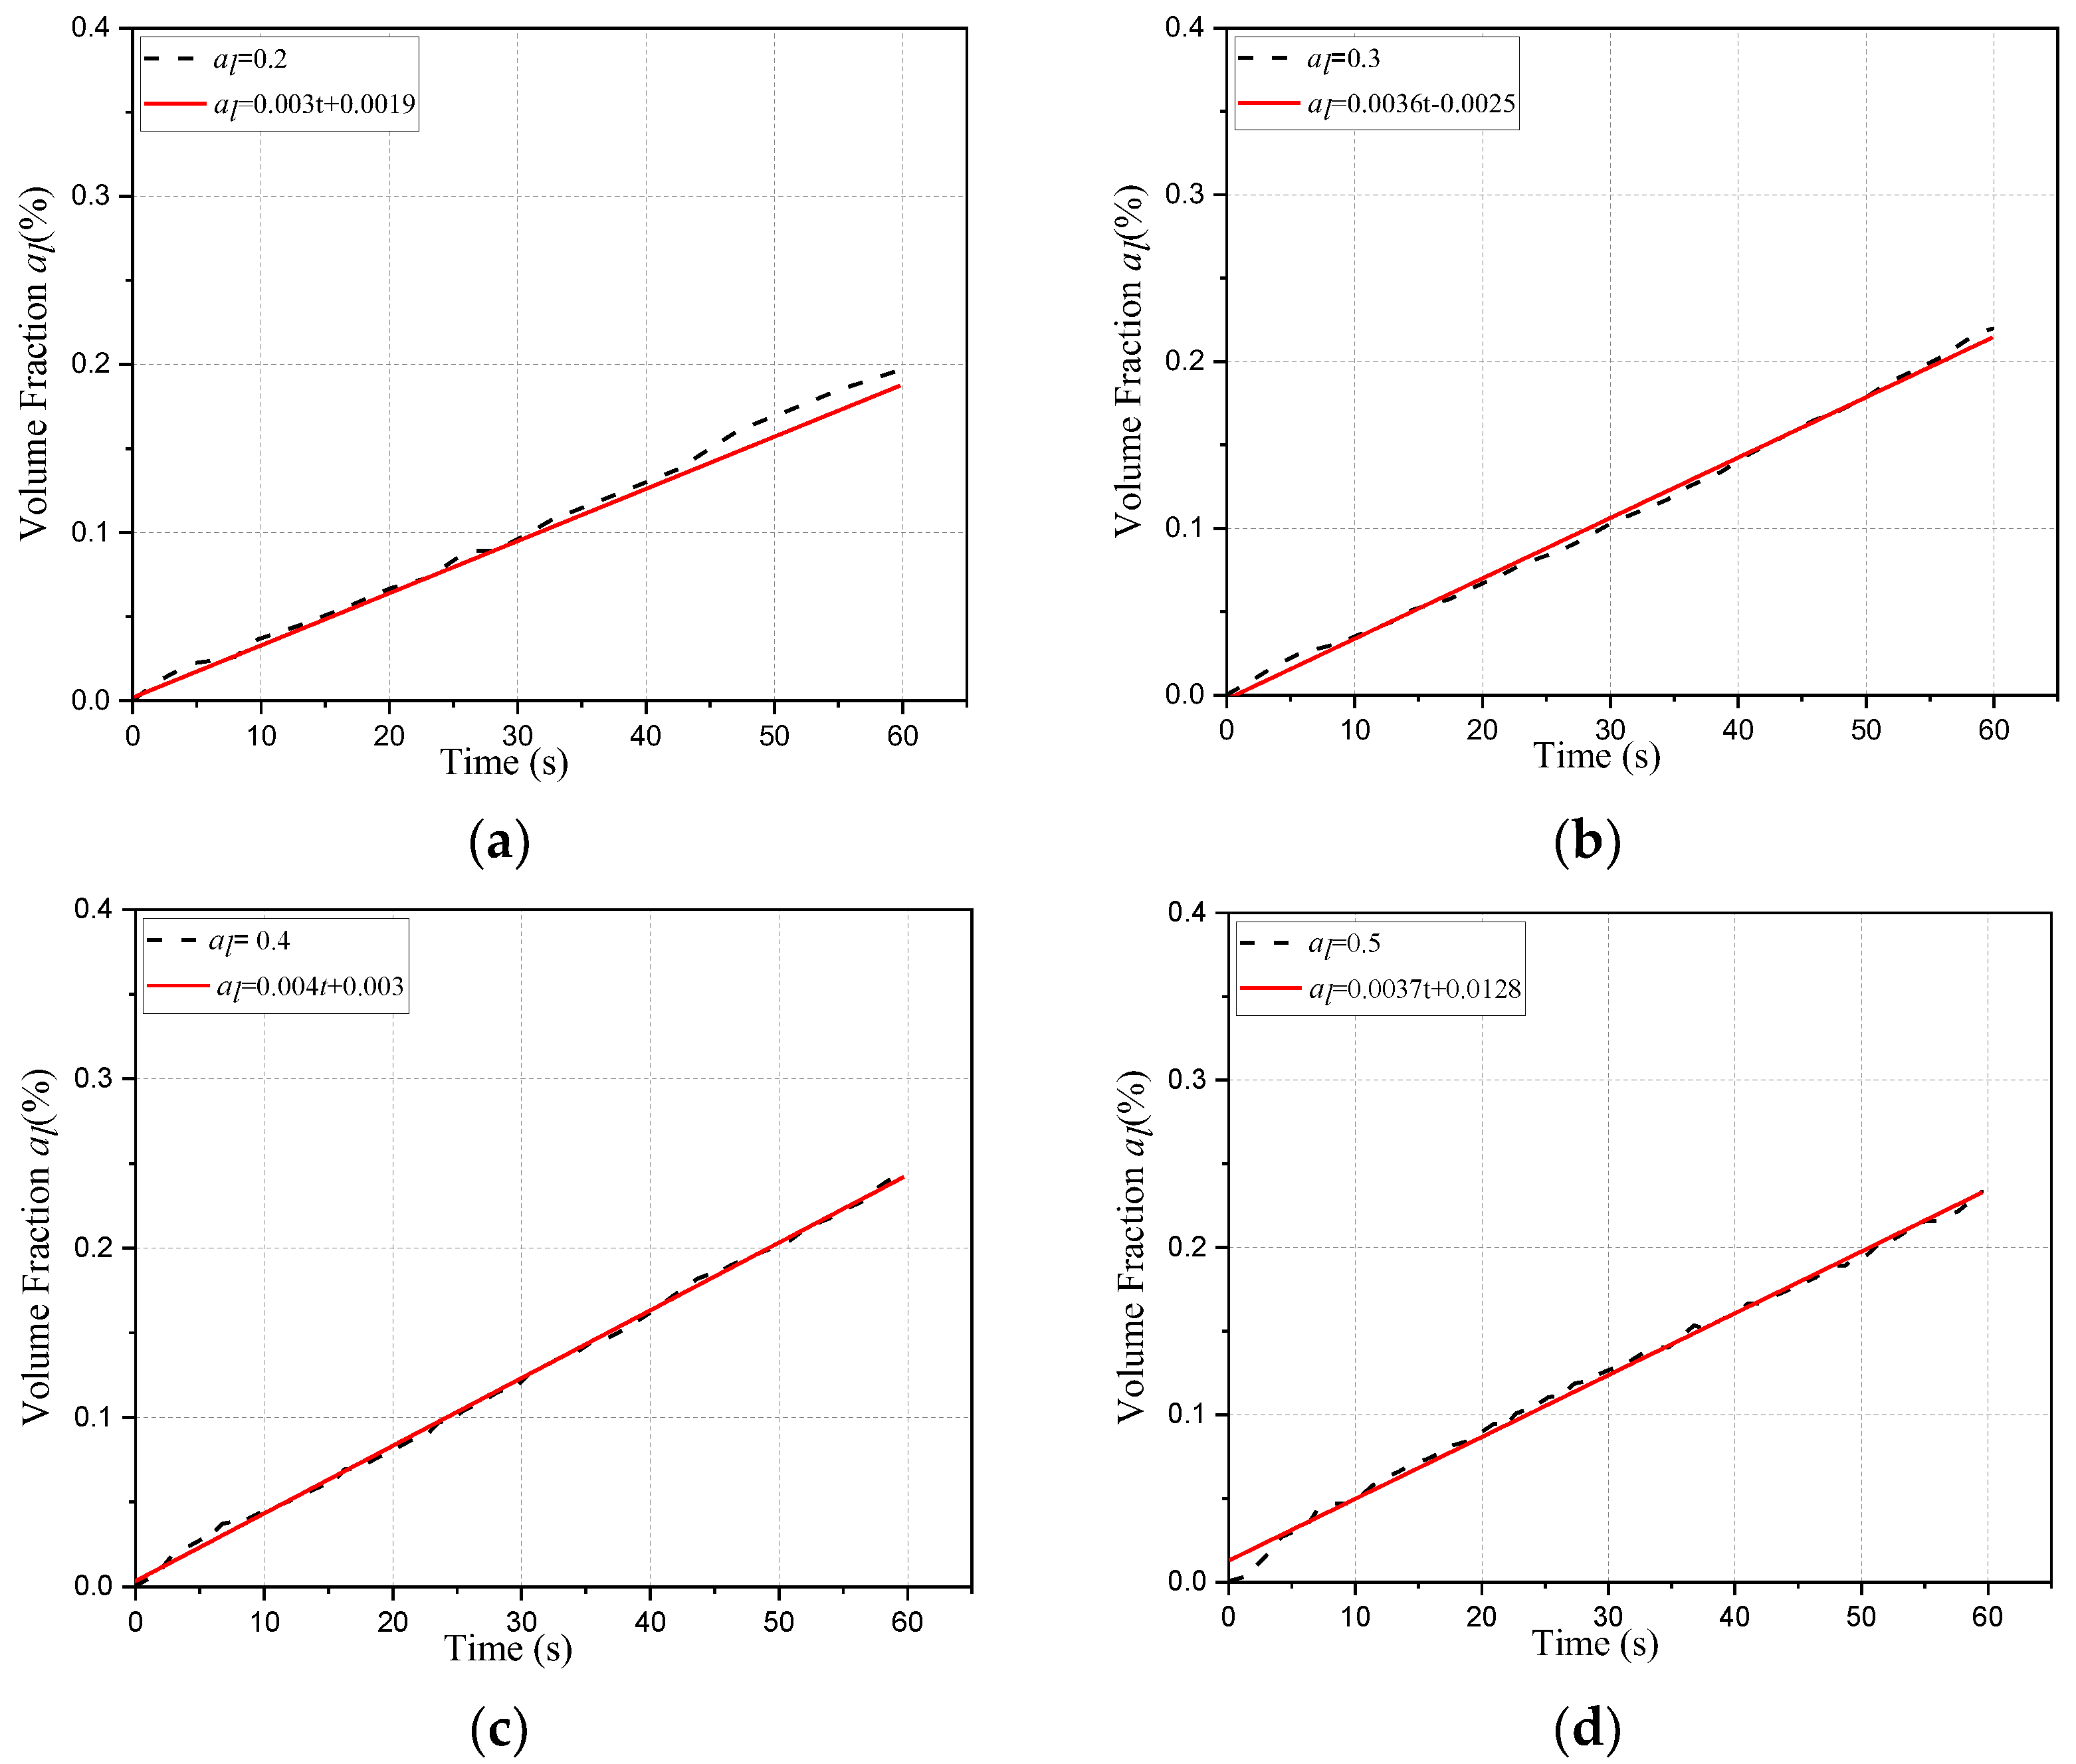
3.2. Effect of Initial Volume Fraction on Liquid Separation

Next, the effect of the initial liquid volume fraction on the separation process is discussed. The separation process is insensitive to the surface tension, and the surface tension is set to 0.07. Seven initial volume fractions of the liquid are adopted: αl0 = 0.2, 0.25, 0.3, 0.35, 0.4, 0.45, and 0.5. Taking the cases of αl0 = 0.2, 0.3, 0.4, and 0.5 as an example, Figure 12 and Figure 13 show the distribution of the liquid volume fraction at t = 5 s and 50 s. Initially, with the increase in αl0, the volume fraction of the liquid increases. At t = 50 s, the separation process reaches the steady state, at the bottom of the cylindrical container, and the liquid volume fraction is close to 1. Meanwhile, the largest liquid volume fraction is reached at the condition of αl0 = 0.4.
In addition, Figure 14 shows the time history of the volume fraction of the liquid, where the initial volume fractions of the liquid are different, namely, αl0 = 0.2, 0.3, 0.4, and 0.5. It is observed that the volume fraction of the liquid increases with time almost linearly. The volume fraction of the liquid is composed of two parts, the initial part and the separate part. To understand the separation process, the initial part is subtracted from the volume fraction of the liquid. At different αl0, the volume fraction of the liquid increases monotonically. However, the rate of the volume fraction is different. Figure 15 shows the time history of the volume fraction of the liquid, together with the result of the linear fitting. It is observed that the difference between the original data and the linear fitting is very small, namely, the volume fraction of the liquid increases with time almost linearly. Furthermore, Figure 16 shows the relation between the slope of the line and the initial volume fraction of the liquid, where the initial volume fractions of the liquid are different. From αl0 = 0.2 to 0.5, it is observed that the volume fraction of the liquid depends on the initial volume fraction of the liquid non-monotonically. To be precise, when αl0 is small, with an increase of αl0 = 0.2, the liquid is easier to be separated from the mixture; however, when αl0 is over a critical value, the separation process is decelerated. By comparison, when αl0 is around 0.4—i.e., the initial volume fraction is 0.4 initially—the separation process is the fastest. In practice, to improve the stability of the mixture, the 0.4 initial liquid volume fraction should be avoided.

4. Conclusions

In the present study, the effects of the surface tension and initial liquid volume fraction on the gas-liquid-foam separation process are investigated numerically. The results show that during the separation process, after a short period of increase, the volume fraction of the small foam decreases monotonically while the volume fraction of the medium and large foam increases weakly. The volume fraction of the small foam is much greater than that of the medium and large foam. Due to the bursting of the small foam, the liquid separates from the gas-liquid-foam mixture and the liquid volume fraction increases monotonically. One interesting behavior is that the separation process of the gas-liquid-foam mixture is insensitive to surface tension; namely, the drainage time is almost the same at different surface tensions. With the increase in the initial liquid volume fraction, the rate of the separation process first increases and then decreases. In the range of numerical conditions, when the initial volume fraction of the liquid reaches the critical value of 0.4, the separation process is the fastest, which should be avoided to improve stability. In actual firefighting, from the stability of compressed air foam and the actual application, it is recommended to use a high gas–liquid ratio to improve the stability of the foam. Considering the foam equivalent diameter, foam shape and foam cracking (or coalescence) are the important factors affecting the liquid separation process, and related research work will be carried out in the future.

Author Contributions

All the authors equally contributed to the data analysis and the simulation, the results analysis, the writing, and the review. All authors have read and agreed to the published version of the manuscript.

Funding

This research was funded by the Science and Technology Project of State Grid Anhui Electric Corporation of China under grant number 521205220009.

Institutional Review Board Statement

No statement.

Informed Consent Statement

Not applicable.

Data Availability Statement

No data was used for the research described in the article.

Acknowledgments

This study was supported by the Science and Technology Project of State Grid Anhui Electric Corporation of China under Grant No. 521205220009.

Conflicts of Interest

The authors declare no conflict of interest.

References

  1. Zhou, F.; Ren, W.; Wang, D.; Song, T.; Li, X.; Zhang, Y. Application of three-phase foam to fight an extraordinarily serious coal mine fire. Int. J. Coal Geol. 2006, 67, 95–100. [Google Scholar] [CrossRef]
  2. Choi, J.H.; Chae, S.U.; Hwang, E.H.; Choi, D.M. Fire Propagation Characteristics and Fire Risks of Polyurethanes: Effects of Material Type (Foam & Board) and Added Flame Retardant. Fire 2022, 5, 105. [Google Scholar] [CrossRef]
  3. Gao, H.; Zhang, M.; Xia, J.-J.; Song, B.; Wang, Y.-K. Time and surfactant types dependent model of foams based on the Herschel–Bulkley model. Colloids Surfaces A Physicochem. Eng. Asp. 2016, 509, 203–213. [Google Scholar] [CrossRef]
  4. Zhao, M.; Ni, X.; Zhang, S.; Cao, W.; Guan, Y.; Liang, C.; Wang, X.; Zhang, H. Improving the performance of fluoroprotein foam in extinguishing gasoline pool fires with addition of bromofluoropropene. Fire Mater. 2016, 40, 261–272. [Google Scholar] [CrossRef]
  5. Zhou, R.; Dou, X.; Lang, X.; He, L.; Liu, J.; Mu, S. Foaming ability and stability of silica nanoparticle-based triple-phase foam for oil fire extinguishing: Experimental. Soft Mater. 2018, 16, 327–338. [Google Scholar] [CrossRef]
  6. Szurgacz, D.; Tutak, M.; Brodny, J.; Sobik, L.; Zhironkina, O. The Method of Combating Coal Spontaneous Combustion Hazard in Goafs—A Case Study. Energies 2020, 13, 4538. [Google Scholar] [CrossRef]
  7. Ding, F.; Kang, W.; Yan, L.; Xu, Z.; Guo, X. Influence of gas—Liquid ratio on the fire-extinguishing efficiency of compressed gas protein foam in diesel pool fire. J. Therm. Anal. Calorim. 2021, 146, 1465–1472. [Google Scholar] [CrossRef]
  8. Tao, Y.; Lu, K.; Chen, X.; Mao, S.; Ding, Y.; Zhao, Y. Experimental investigation on the temperature profile of large scale RP—5 aviation kerosene pool fire in an open space. Fuel 2020, 264, 116852. [Google Scholar] [CrossRef]
  9. Chang, S.; Grigg, R. Effects of foam quality and flow rate on CO2-foam behavior at reservoir temperature and pressure. SPE Reserv. Eval. Eng. 1999, 2, 248–254. [Google Scholar] [CrossRef]
  10. Dziubinski, M.; Fidos, H.; Sosno, M. The flow pattern map of a two-phase non-Newtonian liquid–gas flow in the vertical pipe. Int. J. Multiph. Flow 2004, 30, 551–563. [Google Scholar] [CrossRef]
  11. Kruglyakov, P.; Elaneva, S.; Vilkova, N.; Karakashev, S. Investigation of foam drainage using foam pressure drop technique. Colloids Surfaces A Physicochem. Eng. Asp. 2010, 354, 291–297. [Google Scholar] [CrossRef]
  12. Risal, A.R.; Manan, M.A.; Yekeen, N.; Azli, N.B.; Samin, A.M.; Tan, X.K. Experimental investigation of enhancement of carbon dioxide foam stability, pore plugging, and oil recovery in the presence of silica nanoparticles. Pet. Sci. 2019, 16, 344–356. [Google Scholar] [CrossRef] [Green Version]
  13. Fan, Y.; Pereyra, E.; Sarica, C.; Schleicher, E.; Hampel, U. Analysis of flow pattern transition from segregated to slug flow in upward inclined pipes. Int. J. Multiph. Flow 2019, 115, 19–39. [Google Scholar] [CrossRef]
  14. Govindu, A.; Ahmed, R.; Shah, S.; Amani, M. Stability of foams in pipe and annulus. J. Pet. Sci. Eng. 2019, 180, 594–604. [Google Scholar] [CrossRef]
  15. Katsiavria, A.; Bontozoglou, V. Stability of liquid film flow laden with the soluble surfactant sodium dodecyl sulphate: Predictions versus experimental data. J. Fluid Mech. 2020, 894, A18. [Google Scholar] [CrossRef]
  16. Govindu, A.; Ahmed, R.; Shah, S.; Amani, M. The Effect of Inclination on the Stability of Foam Systems in Drilling and Well Operations. SPE Drill. Complet. 2021, 36, 263–280. [Google Scholar] [CrossRef]
  17. Zhang, P.; Guo, D.; Cao, X.; Li, X.; Xia, W.; Peng, W.; Bian, J. Foam stability: The key to inhibiting slug generation in gas–liquid flow. J. Pet. Sci. Eng. 2022, 218, 110969. [Google Scholar] [CrossRef]
  18. Bashir, A.; Haddad, A.; Rafati, R. An experimental investigation of dynamic viscosity of foam at different temperatures. Chem. Eng. Sci. 2022, 248, 117262. [Google Scholar] [CrossRef]
  19. Vardar-Sukan, F. Foaming: Consequences, prevention and destruction. Biotechnol. Adv. 1998, 16, 913–948. [Google Scholar] [CrossRef]
  20. Buwa, V.V.; Ranade, V. Dynamics of gas–liquid flow in a rectangular bubble column: Experiments and single/multi-group CFD simulations. Chem. Eng. Sci. 2002, 57, 4715–4736. [Google Scholar] [CrossRef]
  21. Chen, P.; Sanyal, J.; Duducovic, M. Numerical simulation of bubble columns flows: Effect of different breakup and coalescence closures. Chem. Eng. Sci. 2005, 60, 1085–1101. [Google Scholar] [CrossRef]
  22. Bannari, R.; Kerdouss, F.; Selma, B.; Bannari, A.; Proulx, P. Three-dimensional mathematical modeling of dispersed two-phase flow using class method of population balance in bubble columns. Comput. Chem. Eng. 2008, 32, 3224–3237. [Google Scholar] [CrossRef]
  23. Bhole, M.; Joshi, J.B.; Ramkrishna, D. CFD simulation of bubble columns incorporating population balance modeling. Chem. Eng. Sci. 2008, 63, 2267–2282. [Google Scholar] [CrossRef]
  24. Díaz, M.E.; Iranzo, A.; Cuadra, D.; Barbero, R.; Montes, F.J.; Galán, M.A. Numerical simulation of the gas–liquid flow in a laboratory scale bubble column: Influence of bubble size distribution and non-drag forces. Chem. Eng. J. 2008, 139, 363–379. [Google Scholar] [CrossRef]
  25. Liao, Y.; Lucas, D. A literature review on mechanisms and models for the coalescence process of flu-id particles. Chem. Eng. Sci. 2010, 65, 2851–2864. [Google Scholar] [CrossRef]
  26. Tong, M.; Kole, K.; Neethling, S. Drainage and stability of 2D foams: Foam behavior in vertical Hele-Shaw cells. Colloids Surf. A Physicochem. Eng. Asp. 2011, 382, 42–49. [Google Scholar] [CrossRef]
  27. Ma, T.; Ziegenhein, T.; Lucas, D.; Krepper, E.; Fröhlich, J. Euler–Euler large eddy simulations for dispersed turbulent bubbly flows. Int. J. Heat Fluid Flow 2015, 56, 51–59. [Google Scholar] [CrossRef]
  28. Montoya, G.; Sanyal, J.; Braun, M. On the assessment, implementation, validation, and verification of drag and lift forces in gas-liquid applications for the CFD codes FLUENT and CFX. Exp. Comput. Multiph. Flow 2019, 1, 255–270. [Google Scholar] [CrossRef] [Green Version]
  29. Diba, F.; Karim, R.; Naser, J. Fluidized bed CFD using simplified solid-phase coupling. Powder Technol. 2020, 375, 161–173. [Google Scholar] [CrossRef]
  30. Shu, S.; Yang, N.; Bertrand, F.; Chaouki, J. High-resolution simulation of oscillating bubble plumes in a square cross-sectioned bubble column with an unsteady k-ε model. Chem. Eng. Sci. 2021, 231, 116321. [Google Scholar] [CrossRef]
  31. Agarwal, N.; Bhutani, G. LES modelling of multiphase turbulent flows in bubble columns using an adaptive-mesh finite element method. Chem. Eng. Res. Des. 2022, 180, 90–108. [Google Scholar] [CrossRef]
  32. Sattar, M.; Naser, J.; Brooks, G. Numerical simulation of creaming and foam formation in aerated liquid with population balance modeling. Chem. Eng. Sci. 2013, 94, 69–78. [Google Scholar] [CrossRef]
  33. Sarhan, A.; Naser, J.; Brooks, G. CFD modeling of bubble column: Influence of physico-chemical properties of the gas/liquid phases properties on bubble formation. Sep. Purif. Technol. 2018, 201, 130–138. [Google Scholar] [CrossRef]
Figure 2. Distribution of the foam diameter, where twelve foam classes are adopted.
Fire 06 00117 g002
Figure 3. Grid arrangement of xz-plane slice, where the grid numbers are 65,500 (a), 126,000 (b), and 183,700 (c), respectively.
Fire 06 00117 g003
Figure 4. Distribution of the gas-liquid-foam during the separation process at 30 s, where the grid numbers are 65,500 (a), 126,000 (b), and 183,700 (c), respectively.
Fire 06 00117 g004
Figure 5. Correlation of liquid volume fraction with time, where the grid numbers are 65,500, 126,000, and 183,700, respectively.
Fire 06 00117 g005
Figure 6. Evolution of the liquid volume fraction with time, where different surface tensions are adopted.
Fire 06 00117 g006
Figure 7. Distribution of the liquid volume fraction of xy-plane slice during the separation process at 30 s, where the surface tensions are σ = 0.04 (a), σ = 0.055 (b), σ = 0.07 (c), respectively.
Fire 06 00117 g007
Figure 8. Distribution of the liquid volume fraction of xy-plane slice during the separation process at 60 s, where the surface tensions are σ = 0.04 (a), σ = 0.055 (b), σ = 0.07 (c), respectively.
Fire 06 00117 g008
Figure 9. Time history of the volume fraction of the foam phase, where the surface tension is σ = 0.055.
Fire 06 00117 g009
Figure 10. Curves of the liquid volume fraction with the time, together with the linear fitting results, where the surface tensions are different.
Fire 06 00117 g010
Figure 11. Relation between the slope of the line and the surface tension, where the surface tensions are different.
Fire 06 00117 g011
Figure 12. Distribution of the liquid volume fraction at t = 5 s, where αl0 = 0.2, 0.3, 0.4, and 0.5.
Fire 06 00117 g012
Figure 13. Distribution of the liquid volume fraction at t = 50 s, αl0 = 0.2, 0.3, 0.4, and 0.5.
Fire 06 00117 g013
Figure 14. Time history of the volume fraction of the liquid, where the initial volume fractions of the liquid are different, namely, αl0 = 0.2, 0.3, 0.4, and 0.5. (a) Volume fraction of the liquid. (b) Initial volume fraction is subtracted.
Fire 06 00117 g014
Figure 15. Curves of the liquid volume fraction with the time, together with the linear fitting results. (a) αl0 = 0.2. (b) αl0 = 0.3. (c) αl0 = 0.4. (d) αl0 = 0.5.
Fire 06 00117 g015
Figure 16. Relation between the slope of the line and the initial volume fraction of the liquid, where the initial volume fractions of the liquid are different.
Fire 06 00117 g016
Disclaimer/Publisher’s Note: The statements, opinions and data contained in all publications are solely those of the individual author(s) and contributor(s) and not of MDPI and/or the editor(s). MDPI and/or the editor(s) disclaim responsibility for any injury to people or property resulting from any ideas, methods, instructions or products referred to in the content.

