

Deep Learning Approaches for Wildland Fires Using Satellite Remote Sensing Data: Detection, Mapping, and Prediction

Abstract
:1. Introduction
- We provide a comprehensive analysis of recent (between 2018 and 2022) deep learning models used for wildland fire detection, mapping, and damage and spread prediction using satellite data.
- We review the most popular datasets used for wildland fire detection, mapping, and prediction tasks, providing an overview of their attributes.
- We discuss the challenges associated with these tasks, including data preprocessing (i.e., filtering, cleaning, and normalizing data), and the interpretability of deep learning models for each of these tasks.
2. Satellite Systems
- Geostationary orbit (GEO) circles the earth above the equator of the earth following the rotation of the earth. It orbits the earth at an altitude of 35,786 km. The satellite in GEO appears to be stationary above a fixed point on the earth’s surface, thus providing continuous coverage to the same area. Many satellites are used, such as Geostationary Operational Environmental Satellites (GOES) [24], Landsat [25], and Sentinel [26]. They have a high temporal resolution. GOES offers a high spatial, temporal, and spectral resolution. It provides accurate weather information and real-time weather monitoring. However, some of them have a low spatial resolution and long revisit times, for example, eight days for LandSat-8, and 2 to 3 days for Sentinel-2B. GEO systems allow for the detection of the size, intensity, and locations of wildfires. They provide information on the wind direction and speed, which can help in estimating the spread of wildfires and in firefighting operations.
- Low-earth orbit (LEO) is an orbit centered on the earth having an altitude of less than or equal to 2000 km. Its orbital period is less than one day. It is more suitable for observation and communication as it is closer to the earth. It provides high-resolution imagery, low communication latency, and high bandwidth. However, LEO satellites have a limited lifetime due to their low altitude. LEO systems can be used to detect wildland fires, as well as their locations and behaviors, which helps firefighting operators provide accurate strategies for wildfire prevention.
- Polar sun-synchronous orbit (SSO) is an orbit around the earth in which the ground track of the satellite follows the sun. It has the same position at all times, with an altitude of between 200 and 1000 km, which allows for a continuous coverage of a precise zone at the same time and place every day. Numerous satellites are used, such as MODIS (Moderate Resolution Imaging Spectroradiometer) [27], AVHRR (Advanced Very-High-Resolution Radiometer) [28], and VIIRS (Visible Infrared Imaging Radiometer Suite) [29]. SSO satellites are used for monitoring the climate and for forecasting the weather. They are also capable of detecting and monitoring wildland fires, providing the size, location, and intensity of wildfires, as well as their spread based on weather information. However, their lifetime is very limited due to their low altitude.

| System | Advantage | Disadvantage |
|---|---|---|
| Geostationary orbit (GEO) | Altitude of 35,786 km Provides a consistent view of the same zone High temporal resolution | Coverage limited area Large revisit time |
| Low-earth orbit (LEO) | Altitude less than or equal to 2000 km High-resolution imageryLow communication latency High bandwidth | Lifetime limited |
| Polar sun-synchronous orbit (SSO) | Altitude between 200 and 1000 km Continuous coverage of a precise zone at the same time and place everyday | Lifetime limited |
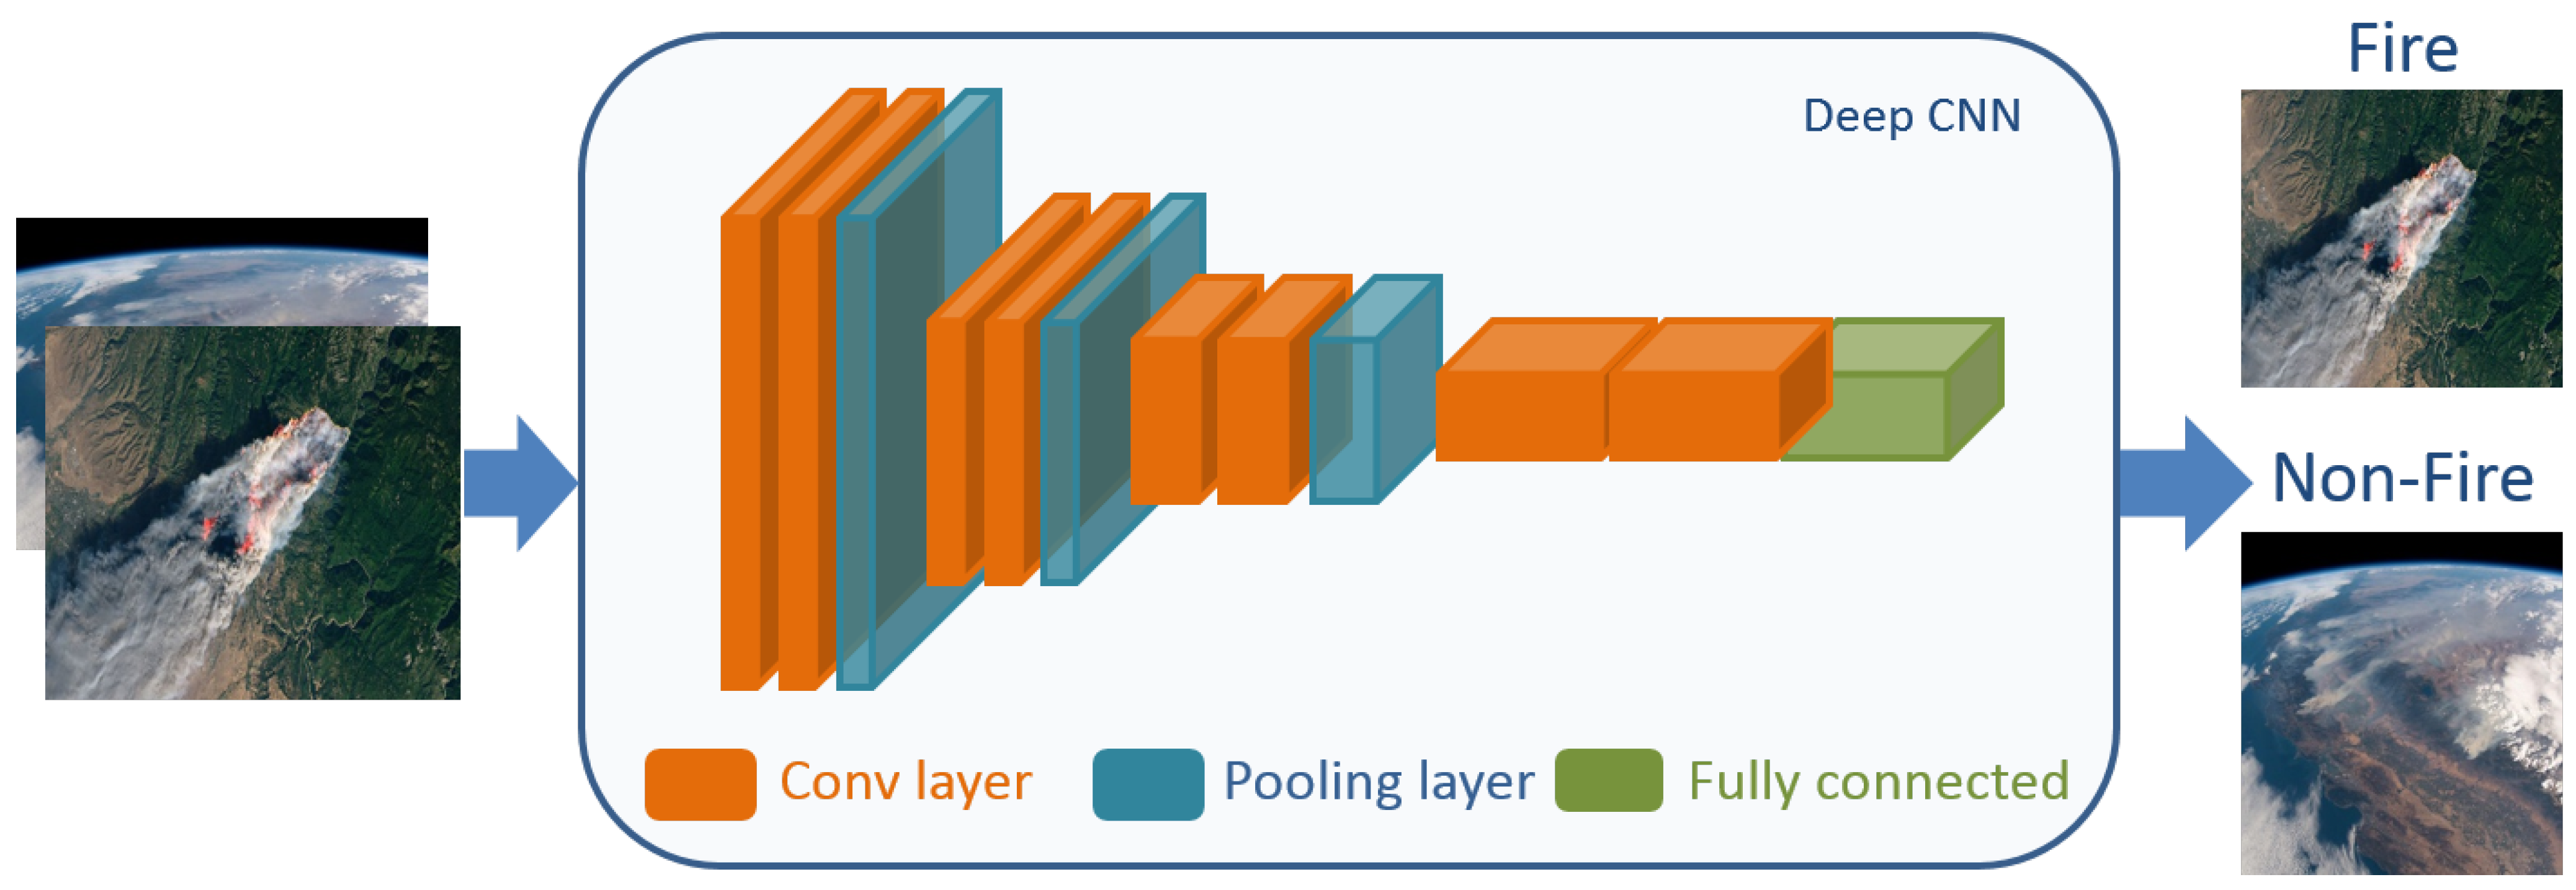
3. Deep Learning-Based Approaches for Fire Detection Using Satellite Data
| Ref. | Methodology | Dataset | Results (%) |
|---|---|---|---|
| [30] | Simple CNN | 2157 Himawari-8 images, with 93,270 samples without fire and 7795 samples with fire | F1-score = 74.00 |
| [31] | MiniVGGNet | 715 wildfire images collected by the KITSUNE CubeSat | Accuracy = 98.00 |
| [32] | Custom optimized CNN | Landsat satellite images | Accuracy = 60.87 |
| [33] | Fire-Net | 722 Landsat-8 images | F1-score = 97.57 |
| [34] | MobileNet v2 | Fire perimeters, fire information (date, area, longitude, and altitude), and historical fire map collected from Landsat 7 and 8 | Accuracy = 73.30 |
| [38] | VIB_SD | 1836 multispectral based on Landsat 8 OLI and Landsat 5 TM imagery data | Accuracy = 92.41 |
| [39] | DC-CMEDA | 200 satellite images and 200 RGB images, each one including 100 smoke and 100 non-smoke images | Accuracy = 96.00 |
| [42] | VFNET | CBERS 04A WFI dataset: 775 images | F1-score = 81.00 |
| [50] | SmokeNet | USTC_SmokeRS: 6255 satellite images | Accuracy = 92.75 |
| [56] | 3D CNN | Weather data and imagery data (384 images) | F1-score = 94.00 |
| [60] | FireCNN | Himawari-8 satellite images: 3646 non-fire spots and 1823 fire spots | Accuracy = 99.90 |
| [62] | Swin transformer | FASDD dataset: 5773 images | mAP = 53.01 |
| [65] | FCN | 975 satellite images acquired by Himawari-8 and NOAA Visible Infrared Imaging Radiometer Suite | Accuracy = 99.50 |
| [68] | U-Net with ResNet-34 | 1850 satellite RGB images | Dice = 81.20 |
| [69] | Modified U-Net | LAFD dataset: 8194 wildfire images and their corresponding binary masks | Precision = 87.20 |
| [74] | U-Net | 1324 records of fire perimeters and 38,897 satellite images (Sentinel-1: 2619 images, Sentinel-2: 1892 images, Sentinel-3: 15,514 images, Terra and Aqua: 18,872 images) | F1-score = 87.00 |
| [76] | MultiScale-Net | LAFD dataset: 144 Landsat-8 images | F1-score = 90.58 |
| [77] | RAUNet | Sentinel-1 and -2 data, Google Earth images, MODIS fire products, and field observation data | Accuracy = 98.53 |
| [78] | FCN | LAFD dataset: 14,274 fire images and 10,685 non-fire images | Precision = 87.80 |
| [80] | Smoke-UNet | 47 Landsat-8 images | Accuracy = 92.30 |
| [84] | AOSVSSNET | 200 real satellite smoke images 10,000 synthetic satellite images | IoU = 72.84 IoU = 70.51 |
| [87] | U-Net | 2637 satellite images collected from Sentinel-2 and their burned area masks | Accuracy = 94.00 |
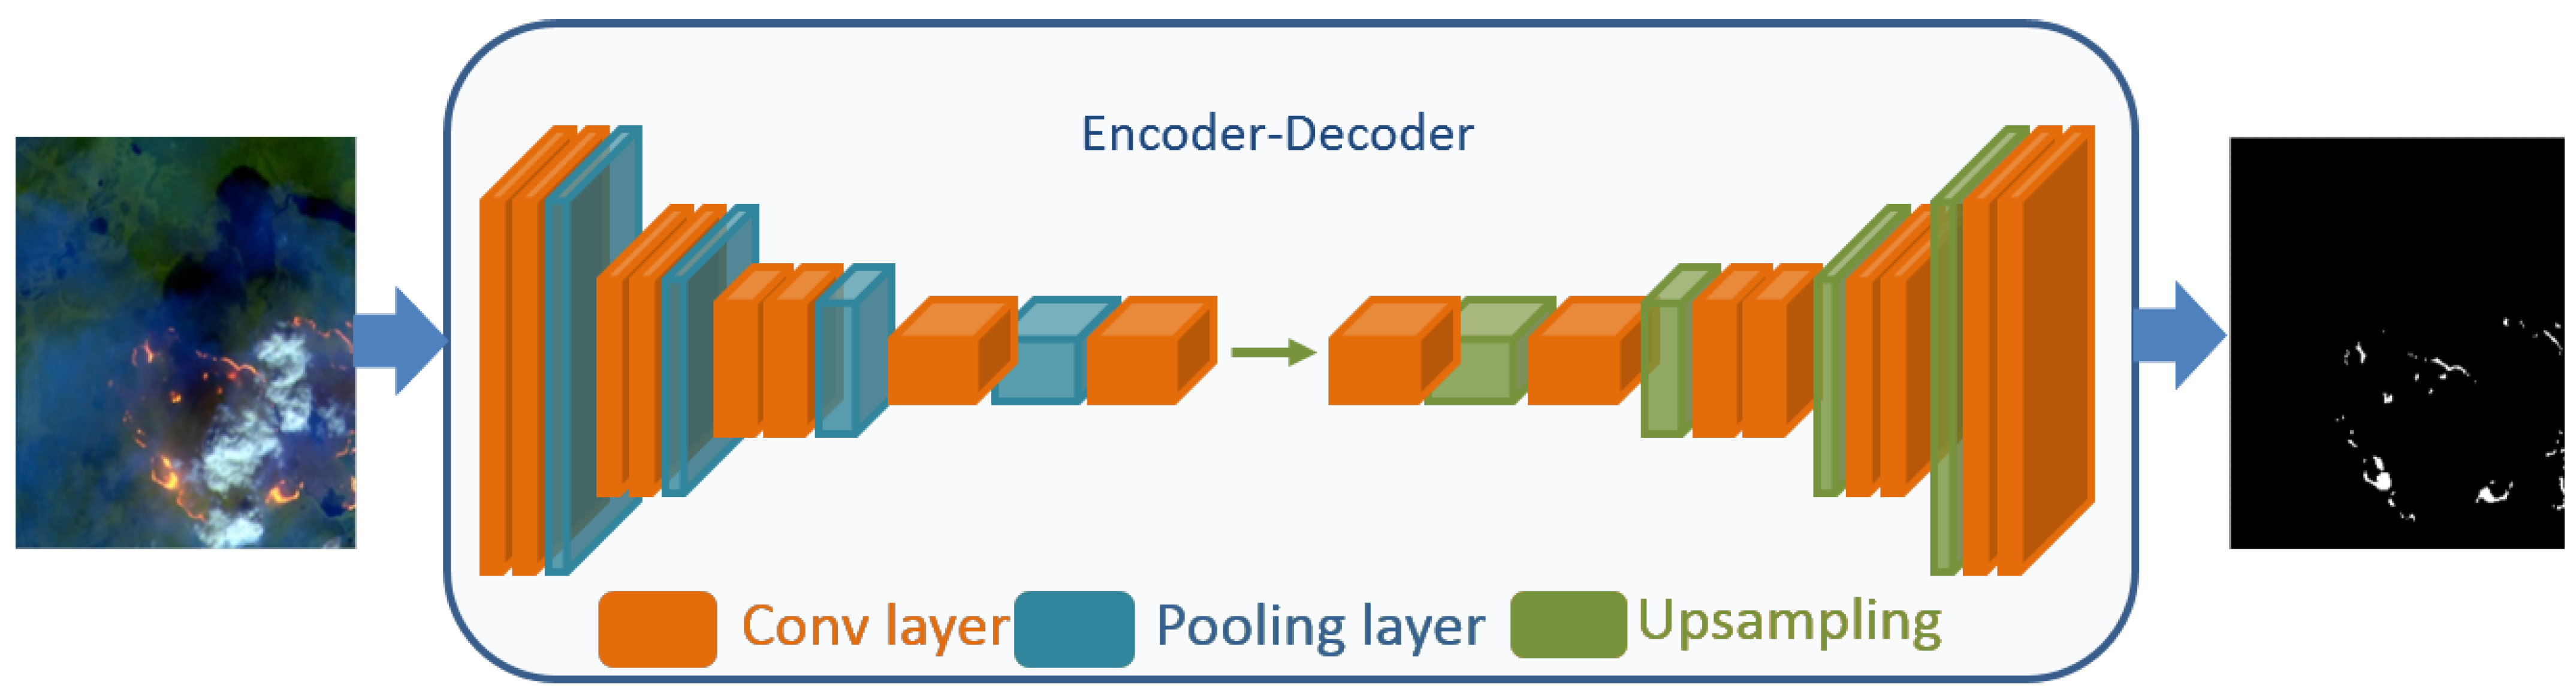
4. Deep Learning-Based Approaches for Fire Mapping Using Satellite Data
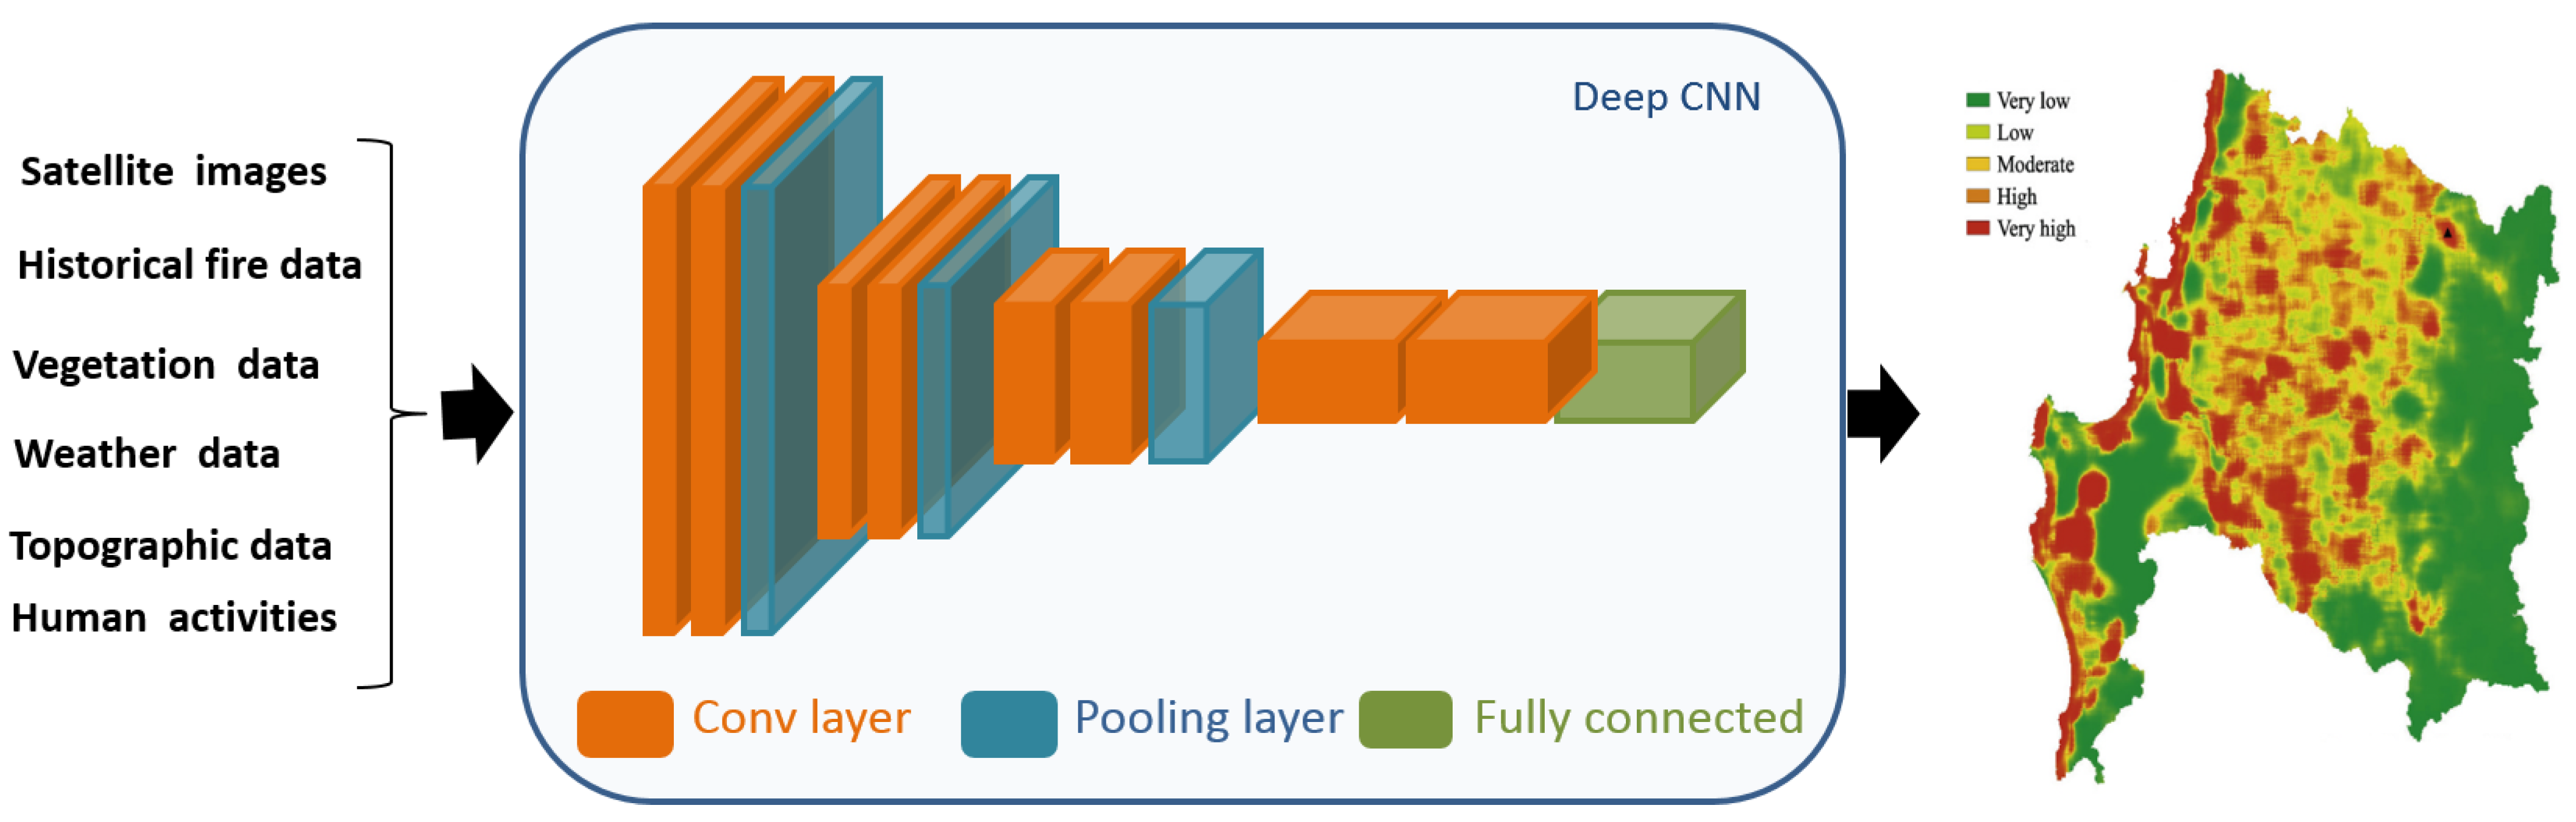
5. Deep Learning-Based Approaches for Fire Susceptibility Using Satellite Data
| Ref. | Methodology | Dataset | Results |
|---|---|---|---|
| [114] | Simple CNN | Climate data, vegetation data, topography data, and historical forest fire points (2002–2010) | Accuracy = 95.81 |
| [117] | ConvLSTM | Datacube dataset: burned areas and fire driver information between 2009 and 2020, daily weather data, satellite data, road density, land cover information, and topography data | Precison = 83.20 |
| [119] | CNN-2D | Daily dynamic fire behaviors, individual fire characteristics, estimated day of burn information, average temperature, specific humidity, accumulated precipitation, soil moisture, soil temperature, standardized precipitation index, LAI, and NDVI | Accuracy = 94.88 |
| [120] | Deep-NC | 2530 historical fire locations from 2007 to 2016, 2530 non-forest fire data points, slope, land use, NDWI, aspect, elevation, NDMI, curvature, NDVI, wind speed, relative humidity, temperature, and rainfall | Accuracy = 81.50 |
| [122] | LSTM | 536 instances and 12 features including temperature, relative humidity, rain, wind, ISI, DMC, FWI, FFMC, and BUI | RMSE = 0.021 |
| [123] | CNN2D-LSTM | Monthly burned area data between 1997 and 2016, monthly maximum/minimum temperature, average temperature, specific humidity, accumulated precipitation, soil moisture, soil temperature, standardized precipitation index, LAI, and NDVI | RMSE = 4.74 |
| [124] | Simple CNN | Historical fire data from 2001 to 2019 on regions in China, climatic data (daily maximum temperature, average temperature, daily average ground surface temperature, average air pressure, maximum wind speed, sunshine hours, daily average relative humidity, and average wind speed), vegetation data (fractional vegetation cover), topographic data (slope, aspect, and elevation), human activities (population, gross domestic product, special holiday, residential area, and road) | Accuracy = 87.40 |
| [125] | 2D/3D CNN | FireCube and NDWS datasets | Accuracy = 96.48 |
| [127] | LSTM | Historical wildfire data and burned data from Pakistan | Accuracy = 95.00 |
| [128] | Deep NN, FbSP, and risk function | NDVI, slope, precipitation, temperature, land use, elevation, road density, distance to river, distance to road, wind speed, humidity, annual temperature, and social and physical parameters such as population density, age, employment rate, housing, high density, high value, etc. | Kappa = 94.30 |
| [133] | CNN-GWO | Sentinel-1 SAR images from 2016 to 2020, aspect, altitude, slope, plan curvature, precipitation, maximum temperature, solar radiance, wind speed, distance to stream, drought index, soil moisture, NDVI, TWI, land use, distance use, and distance to settlement | RMSE = 0.334 |
| [136] | Ensemble learning | Fire history data from 2013 to 2019 from the Biobio and Nuble regions; climatic data (minimum and maximum temperature, precipitation, wind speed, climatic water deficit, and actual evapotranspiration); anthropogenic data (distance to urban zones and distance to roads); vegetation data (NDVI, distance to rivers and land cover type); topographic data (aspect, surface roughness, slope, and elevation) | F1-score = 88.77 |
| [138] | Residual U-Net | Historical wildfire data, topography data, drought data, vegetation data, and weather data | Accuracy = 83.00 |
| [144] | Double-Step U-Net | Burned maps of five regions (Spain, France, Portugal, Sweden, and Italy) affected by past fires and satellite images collected from Sentinel-2 | F1-score = 95.00 |
| [146] | Double-Step U-Net | Satellite imagery data collected from Sentinel-2 | MSE = 0.54 |
| [147] | DS-AttU DS-UNet DS-UNet++ | Satellite imagery and data collected from Sentinel-2 | RMSE = 2.42 RMSE = 1.85 RMSE = 1.85 |
| [149] | DS-UNet | Sentinel-2 data | RMSE = 1.08 |
| [150] | Attention U-Net | MTBS dataset: post-fire and pre-fire Top of Atmosphere Landsat images, dNBR images, perimeter mask, RdNBR images, thematic burn severity from 2010 to 2019 (more than 7000 fires) | Kappa = 88.63 |
| [154] | WLF-UNet | More than 5000 images captured by the Himawari-8 satellite between November 2019 and February 2020 in the Australian region | Accuracy = 80.00 |
| [155] | U-Net++ | SeasFire cube dataset: historical burned areas and fire emission between 2001 and 2021, climate, vegetation, oceanic indices, and human related data | F1-score = 50.70 |
6. Deep Learning-Based Approaches for Fire Spread Prediction Using Satellite Data
7. Datasets
- The GeoMAC (Geospatial Multi-Agency Coordination) database [176,177] illustrates stored fire perimeters data since August 2000. It is presented via the United States Geological Survey (USGS) data series product. It contains wildland fire perimeters information obtained from wildfire accidents, is evaluated for accuracy and completeness, and is collected via intelligence sources such as IR (infrared) imagery and GPS. It has public access via the GeoMAC Web application [176]. This data are archived by year and state.
- Landsat8 satellite imagery is used as a visual imagery data collected from GloVis [25] every few months. Each imagery has a resolution of 30 m, where each pixel corresponds to a 30 × 30 square meter area on the ground.
- Weather and atmospheric data are collected from the National Oceanic and Atmospheric Administration (NOAA) [66]. These include atmospheric pressure, wind direction, temperature (Celsius), precipitation, dew point, relative humidity, and wind speed for each wildfire location.
- Digital Elevation Models (DEMs) information [66] represents the zero surface elevation to which scientists and geodesists refer. It was generated from remotely sensed data collected by drones, satellites, and planes with spatial resolutions of 20 m or higher using various remote sensing methods such as SAR interferometry, LiDAR, Stereo Photogrammetry, and Digitizing contour lines. It was collected from the USGS National Map [188] for each fire location.
- VIIRS (Visible Infrared Imaging Radiometer Suite) Level 1B [102] data are developed by NASA (National Aeronautics and Space Administration) and generated using SIPS (NASA VIIRS Science Investigator-led Processing Systems). VIIRS is on two satellites, the JPSS (Joint Polar Satellite System) satellites and the SNPP (Suomi National Polar-orbiting Partnership). VIIRS Level 1B data contain an array of related information, calibrated radiance values, and uncertainty indices. These include three products for image resolution, day–night band, and moderate resolution. They provide geolocation products and calibrated radiances.
- VIIRS Active Fire [58] is a fire monitoring product generated by FIRMS (Fire Information for Resource Management System) from MODIS (Moderate Resolution Imaging Spectroradiometer) and VIIRS. It includes near-real-time (within 3 h of satellite observation) and real-time (only in the US and Canada) fire locations.
- The GlobFire (Gloab wildfire) dataset [178] is a public dataset generated by a data mining process utilizing MCD64A1 (MODIS burnt area product Collection 6). It was developed and available under the GWIS (Global Wildfire Information System) platform. It provides detailed information about each fire, such as the initial date, final date, perimeter, and burned area, which helps to determine the evolution of the fire.
- The Wildfires dataset [179,180] are public data obtained from the CWFIS (Canadian Wildland Fire Information System) [189]. It contains diverse data related to weather (land surface temperature), ground condition (NDVI), burned areas, and wildfire indicators (thermal anomalies) collected from MODIS. The burned areas represent various regions that differ in their burning period, size, extent, and burn date. This dataset contains 804 instances divided into 386 wildfire instances and 418 non-wildfire instances.
- MCD64A1 (Collection 6) C6 [103] is a burned area data product, which maps and identifies the approximate date and spatial extent of burning areas, employing a spatial resolution of 500 m of MODIS Surface Reflectance imagery. It includes the following data: burn date, quality assurance, burn data uncertainty, and the first and last days of the year, for reliable change detection.
- The LANDFIRE 2.0.0 database [186] consists of public data for Puerto Rico, Alaska, the continental United States, and Hawaii. It contains fuel and vegetation data collected from various existing information resources such as the USGS National Gap Analysis Program (GAP), NPS Inventory and Monitoring, State Inventory Data, and USFS Vegetation and Fuel Plot Data. It also includes landscape disturbances and changes such as wildland fire, storm damage, fuel and vegetation treatments, insects, disease, and invasive plants.
- The USTC_SmokeRS dataset [50,51] are public data for smoke detection tasks collected from MODIS satellites. It consists of 6225 satellite images with a spatial resolution of 1 km, a size resolution of 256 × 256 pix., and saved in “.tif” format. It includes six classes that are smoke (1016 images), seaside (1007 images), land (1027 images), haze (1002 images), dust (1009 images), and cloud (1164 images).
- The Sentinel-2 dataset [147,183] includes the data of 73 areas of interest collected in various regions of Europe by Copernicus EMS, which are used to delineate forest fires and to predict the damage level. Each area of interest was presented with an image with a resolution of 5000 × 5000 × 12 (12 illustrates the twelve channels acquired via satellite remote sensing) and classified according to the wildfire damage level, varying over 0 (no damage), 1 (negligible damage), 2 (moderate damage), 3 (high damage), and 4 (completely destroyed).
- The Landsat-8 Active fire detection (LAFD) dataset [69,70] is a public dataset developed for active fire detection. It contains 8194 satellite images (with a resolution of 256 × 256 pix.) of wildfires collected by Landsat-8 around the world in August 2020, 146,214 image patches with a resolution of 256 × 256 pix., consisting of 10-band spectral images, and associated results produced by three hand-crafted active fire detection methods [71,72,73], and 9044 image patches extracted from thirteen Landsat-8 images captured in September 2020 as well as their corresponding masks, which were manually annotated by a human specialist.
- The WildfireDB dataset [181,182] is an open source data for wildfire propagation tasks collected from the VIIRS thermal anomalies/active fire database. It presents the historical wildfire occurrence over 2012–2017, as well as the vegetation (the maximum, median, sum, minimum, mode, and count values of canopy base density, as well as canopy height, canopy cover, canopy base height, and existing vegetation height and cover), topography (slope and elevation), and weather (total precipitation; maximum, average, and minimum temperatures; relative wind speed; and average atmospheric pressure). It contains 17,820,835 data points collected from a large area that covers 8,080,464 square kilometers of the continental United States (United States, Brazil, and Australia).
- The TerraClimate dataset [137,184] is a high-resolution global dataset of monthly climate and climatic water balance from 1958 to present. It presents monthly the following climate factors: minimum and maximum temperature, precipitation, solar radiation, wind speed, climatic water deficit, vapor pressure, and reference evapotranspiration.
- The Datacube dataset [118] includes nineteen features collected from MODIS, grouped into dynamic and static attributes. The dynamic attributes are thirteen features, which are max and min 2 m temperature, precipitation, LAI, Fpar, day and night LST, EVI, NDVI, and the min and max u-/v-component of wind. The static attributes introduce six features, namely CLC (Corine Land Cover), slope, elevation, aspect, population, and road density.
- The GEODATA DEM-9S dataset [165] refers to Digital Elevation Model Version 3 and Flow Direction Grid 2008. It is public data, which presents ground level elevation points for all of Australia with a grid spacing of nine seconds in longitude and latitude, approximately 250 m in the GDA94 coordinate system. It is resampled to 500 m resolution using bilinear interpolation to generate the elevation, aspect, slope, sine, and cosine components of the spectrum.
- The dynamic land cover dataset [168] is developed by the Australian Bureau of Agriculture, and Resource Economics and Sciences and Geoscience Australia. It reports land cover, vegetation cover, and the land use information of Australia.
- The MTBS (Monitoring Trends in Burn Severity) dataset [107,150] is a large-scale public database developed to determine trends of burn severity. It describes burn severity and burn area delineation data for the entire United States land area between 1984 and 2021. It includes fire occurrence data and burned areas boundaries data, providing various influencing factors of fires such as post-fire and pre-fire Landsat Top of Atmosphere images, dNBR (delta Normalized Burnt Ratio) images, perimeter mask, RdNBR (relative dNBR) images, thematic fire severity from 1984 to 2021, and fire location obtained from various remote sensing satellites such as Landsat OLI, Landsat TM, Sentinel 2A, Sentinel 2B, Landsat ETM+, and Sentinel 2A.
- The CALFIRE (California Fire Perimeter Database) dataset [75] was developed by the Fire and Resource Assessment Program. It contains the records of perimeters of forest fires collected in the state of California between 1950 and 2019.
- The GFED (Global Fire Emissions Database, Version 4.1) dataset [185] includes the estimated monthly burned area, fractional contributions of different fire types, and monthly emissions, as well as 3-hourly or daily fields, which allow for scaling the monthly emissions to higher temporal resolutions. Additionally, it provides data for monthly biosphere fluxes. The spatial resolution of the data is 0.25 degrees latitude by 0.25 degrees longitude, and the time period covered is between 1995 and 2016. The emissions data consist of a variety of substances such as carbon, carbon monoxide, methane, dry matter, nitrogen oxides, total particulate matter, etc. These data are presented annually by region, globally, and by the source of fire for each area.
- The MapBiomas Fire dataset [175] is a public dataset of burned areas for Brazil between 1985 and 2020. Maps of the burned area are available in various temporal domains that are monthly, annual, and accumulated periods, as well as fire frequency. They are combined with annual land cover and land use to show the zones affected by the fires over the last 36 years.
- The PlanetScope dataset [94] is developed by the PlanetLabs cooperation. It includes high-resolution images with a spatial resolution of 3 m per pixels collected from 130 CubeSat 3U satellites, named Dove.
- The burned areas in the Indonesia dataset was developed by Prabowo et al. [94,97] to train and evaluate deep learning models related to burned area mapping tasks. It comprises 227 images with a resolution of 512 × 512 pix. (in GeoTIFF format) collected from the Landsat-8 satellite in regions of Indonesia between 2019 and 2021, as well as their corresponding ground truth images, which are manually annotated.
- The satellite burned area dataset [98,99] is a public dataset for burned area detection tasks based on the semantic segmentation method. It includes 73 forest fire images with a resolution of up to 10 m per pixel collected by the Sentinel-2 L2A satellite from 2017 to 2019 in Europe regions and their binary masks. It also contains the annotation of five severity damage levels, which range between undamaged and completely destroyed, generated by the Copernicus emergency management service annotation.
- The FASDD (Flame and Smoke Detection Dataset) [62,64] is a very large public dataset consisting of flame and smoke images collected from multiple sources such as satellite and vision camera. It includes 310,280 remote sensing images with resolutions of between 1000 × 1000 pix. and 2200 × 2200 pix. obtained by Landsat-8 with a 30 m resolution and Sentinel-2 with a 10 m resolution, covering numerous regions such as Canada (5764 images), America (8437 images), Brazil and Bolivia (6977 images), Greece and Bulgaria (10,725 images), South Africa (9537 images), China (624 images), Russia (2111 images), and Australia (266,069 images). Among these remote sensing images, 5773 images were labeled via human–computer interaction in four kinds of formats such as JSON, XML, and text.
- SeasFire Cube [156] is an open access dataset developed under the SeasFire project and funded by the ESA (European Space Agency). It contains fire data between 2001 and 2021 in 0.25 degree grid resolution and 8 day temporal resolution, including historical burned areas and wildfire emissions, meteorological data (humidity, direction of wind, wind speed, average/max/min temperature, solar radiation, total precipitation, etc.), human-related variables (population density), oceanic indices, vegetation data (LAI, land cover, etc.), and drought data.
- The NDWS (Next Day Wildfire Spread) dataset [79,187] is a public, large-scale, multivariate remote sensing dataset over the continental United States during 2012 and 2020. It comprises 2D fire data with numerous variables such as vegetation (NDVI), population density, weather (wind direction, wind speed, humidity, precipitation, and maximum/minimum temperature), topography (elevation), drought index, and an energy release component. It also includes 18,455 fire samples; each represents 64 km × 64 km at 1 km resolution from the time and location of the fire, as well as the previous fire mask (mask at time t) and fire mask (time at t + 1 day).
- The FireCube dataset [126] is a daily datacube for the modeling and analysis of wildfires in Greece. It includes numerous variables during 2009 and 2021 at a daily 1 km × 1 km grid: average (avg)/ maximum (max)/minimum (min) 2 m dewpoint temperature, avg/max relative humidity, avg/max/min surface pressure, avg/max/min total precipitation, avg/max/min 10 m V wind component, avg/max/min 10 m U wind component, avg/max/min 2 m temperature, 8 day evapotranspiration, FPAR (Fraction of Absorbed Photosynthetically Active Radiation), FWI (Forest Fire Weather Index), rasterized ignition points, LAI, day/night land surface temperature, wind direction of maw wind, max wind speed, daily number of fires, soil moisture index, soil moisture index anomaly, aspect, elevation, population density (2009–2021), distance from roads, roughness, slope, distance from waterways, etc.
8. Discussion
8.1. Data Preprocessing
8.2. Discussion of Model Results
9. Conclusions
Author Contributions
Funding
Institutional Review Board Statement
Informed Consent Statement
Data Availability Statement
Conflicts of Interest
Abbreviations
| DL | Deep learning |
| ML | Machine learning |
| CNN | Convolutional Neural Network |
| ReLU | Rectified Linear Unit |
| SWIR | Short-Wave Infrared |
| NIR | Near-Infrared |
| MODIS | Moderate Resolution Imaging Spectroradiometer |
| FCN | Fully Convolutional Network |
| IR | Infrared |
| GEO | Geostationary orbit |
| LEO | Low-earth orbit |
| SSO | Sun-synchronous orbit |
| MODIS | Moderate Resolution Imaging Spectroradiometer |
| AVHRR | Advanced Very-High-Resolution Radiometer |
| VIIRS | Visible Infrared Imaging Radiometer Suite |
| LAI | Leaf Area Index |
| NDVI | Normalized Difference Vegetation Index |
| Fpar | Fraction of Photosynthetically Active Radiation |
| EVI | Enhanced Vegetation Index |
| LST | Land Surface Temperature |
| SVM | Support Vector Machine |
| NDWI | Normalized Difference Water Index |
| NDMI | Normalized Difference Moisture Index |
| SGD | Stochastic Gradient Descent |
| Adam | Adaptive Moment Estimation |
| RMSProp | Root Mean Square Propagation |
| ISI | Initial Spread Index |
| DMC | Duff Moisture Code |
| FWI | Forest Fire Weather Index |
| FFMC | Fine Fuel Moisture Code |
| BUI | Buildup Index |
| RMSE | Root Mean Squared Error |
| GFED | Global Fire Emissions Database |
| CALFIRE | California Fire Perimeter Database |
| dNBR | delta Normalized Burnt Ratio |
| RdNBR | relative dNBR |
| NN | Neural Network |
| SAR | Synthetic Aperture Radar |
| TWI | Topographic Wetness Index |
| S-NPP | Suomi National Polar-Orbiting Partnership |
| EMS | Emergency Management Service |
| MTBS | Monitoring Trends in Burn Severity |
| NOAA | National Oceanic and Atmospheric Administration |
| LSTM | Long Short-Term Memory |
| RNN | Recurrent Neural Network |
| MAPE | Mean Absolute Percentage Error |
| PRISMA | PRecursore IperSpettrale della Missione Applicativa |
References
- Natural Resources Canada. National Wildland Fire Situation Report. 2023. Available online: https://cwfis.cfs.nrcan.gc.ca/report (accessed on 5 March 2023).
- Ghali, R.; Akhloufi, M.A.; Jmal, M.; Souidene Mseddi, W.; Attia, R. Wildfire Segmentation Using Deep Vision Transformers. Remote Sens. 2021, 13, 3527. [Google Scholar] [CrossRef]
- Ghali, R.; Akhloufi, M.A.; Mseddi, W.S. Deep Learning and Transformer Approaches for UAV-Based Wildfire Detection and Segmentation. Sensors 2022, 22, 1977. [Google Scholar] [CrossRef] [PubMed]
- Ghali, R.; Jmal, M.; Souidene Mseddi, W.; Attia, R. Recent Advances in Fire Detection and Monitoring Systems: A Review. In Proceedings of the 18th International Conference on Sciences of Electronics, Technologies of Information and Telecommunications (SETIT’18), Hammamet, Tunisia, 20–22 December 2018; Volume 1, pp. 332–340. [Google Scholar]
- Giglio, L.; Schroeder, W.; Justice, C.O. The collection 6 MODIS active fire detection algorithm and fire products. Remote Sens. Environ. 2016, 178, 31–41. [Google Scholar] [CrossRef] [PubMed]
- Chuvieco, E.; Aguado, I.; Salas, J.; García, M.; Yebra, M.; Oliva, P. Satellite remote sensing contributions to wildland fire science and management. Curr. For. Rep. 2020, 6, 81–96. [Google Scholar] [CrossRef]
- Ruffault, J.; Martin-StPaul, N.; Pimont, F.; Dupuy, J.L. How well do meteorological drought indices predict live fuel moisture content (LFMC)? An assessment for wildfire research and operations in Mediterranean ecosystems. Agric. For. Meteorol. 2018, 262, 391–401. [Google Scholar] [CrossRef]
- Sánchez Sánchez, Y.; Martínez-Graña, A.; Santos Francés, F.; Mateos Picado, M. Mapping Wildfire Ignition Probability Using Sentinel 2 and LiDAR (Jerte Valley, Cáceres, Spain). Sensors 2018, 18, 826. [Google Scholar] [CrossRef]
- Lin, Z.; Chen, F.; Niu, Z.; Li, B.; Yu, B.; Jia, H.; Zhang, M. An active fire detection algorithm based on multi-temporal FengYun-3C VIRR data. Remote Sens. Environ. 2018, 211, 376–387. [Google Scholar] [CrossRef]
- Ba, R.; Song, W.; Li, X.; Xie, Z.; Lo, S. Integration of Multiple Spectral Indices and a Neural Network for Burned Area Mapping Based on MODIS Data. Remote Sens. 2019, 11, 326. [Google Scholar] [CrossRef]
- Matasci, G.; Hermosilla, T.; Wulder, M.A.; White, J.C.; Coops, N.C.; Hobart, G.W.; Bolton, D.K.; Tompalski, P.; Bater, C.W. Three decades of forest structural dynamics over Canada’s forested ecosystems using Landsat time-series and lidar plots. Remote Sens. Environ. 2018, 216, 697–714. [Google Scholar] [CrossRef]
- Ott, C.W.; Adhikari, B.; Alexander, S.P.; Hodza, P.; Xu, C.; Minckley, T.A. Predicting Fire Propagation across Heterogeneous Landscapes Using WyoFire: A Monte Carlo-Driven Wildfire Model. Fire 2020, 3, 71. [Google Scholar] [CrossRef]
- Wu, C.; Zhang, F.; Xia, J.; Xu, Y.; Li, G.; Xie, J.; Du, Z.; Liu, R. Building Damage Detection Using U-Net with Attention Mechanism from Pre- and Post-Disaster Remote Sensing Datasets. Remote Sens. 2021, 13, 905. [Google Scholar] [CrossRef]
- Yu, Q.; Wang, S.; He, H.; Yang, K.; Ma, L.; Li, J. Reconstructing GRACE-like TWS anomalies for the Canadian landmass using deep learning and land surface model. Int. J. Appl. Earth Obs. Geoinf. 2021, 102, 102404. [Google Scholar] [CrossRef]
- Roy, S.K.; Kar, P.; Hong, D.; Wu, X.; Plaza, A.; Chanussot, J. Revisiting Deep Hyperspectral Feature Extraction Networks via Gradient Centralized Convolution. IEEE Trans. Geosci. Remote Sens. 2022, 60, 1–19. [Google Scholar] [CrossRef]
- Yuan, K.; Zhuang, X.; Schaefer, G.; Feng, J.; Guan, L.; Fang, H. Deep-Learning-Based Multispectral Satellite Image Segmentation for Water Body Detection. IEEE J. Sel. Top. Appl. Earth Obs. Remote Sens. 2021, 14, 7422–7434. [Google Scholar] [CrossRef]
- Herruzo, P.; Gruca, A.; Lliso, L.; Calbet, X.; Rípodas, P.; Hochreiter, S.; Kopp, M.; Kreil, D.P. High-resolution multi-channel weather forecasting—First insights on transfer learning from the Weather4cast Competitions 2021. In Proceedings of the IEEE International Conference on Big Data, Orlando, FL, USA, 15–18 December 2021; pp. 5750–5757. [Google Scholar] [CrossRef]
- Francis, A.; Sidiropoulos, P.; Muller, J.P. CloudFCN: Accurate and Robust Cloud Detection for Satellite Imagery with Deep Learning. Remote Sens. 2019, 11, 2312. [Google Scholar] [CrossRef]
- Kislov, D.E.; Korznikov, K.A.; Altman, J.; Vozmishcheva, A.S.; Krestov, P.V. Extending deep learning approaches for forest disturbance segmentation on very high-resolution satellite images. Remote Sens. Ecol. Conserv. 2021, 7, 355–368. [Google Scholar] [CrossRef]
- Barmpoutis, P.; Papaioannou, P.; Dimitropoulos, K.; Grammalidis, N. A Review on Early Forest Fire Detection Systems Using Optical Remote Sensing. Sensors 2020, 20, 6442. [Google Scholar] [CrossRef]
- Ghali, R.; Akhloufi, M.A. Deep Learning Approaches for Wildland Fires Remote Sensing: Classification, Detection, and Segmentation. Remote Sens. 2023, 15, 1821. [Google Scholar] [CrossRef]
- Mohapatra, A.; Trinh, T. Early Wildfire Detection Technologies in Practice: A Review. Sustainability 2022, 14, 12270. [Google Scholar] [CrossRef]
- Akhloufi, M.A.; Couturier, A.; Castro, N.A. Unmanned Aerial Vehicles for Wildland Fires: Sensing, Perception, Cooperation and Assistance. Drones 2021, 5, 15. [Google Scholar] [CrossRef]
- NOAA Office of Satellite and Product Operations. GOES Satellite. 2023. Available online: https://www.ospo.noaa.gov/Operations/GOES/transition.html (accessed on 5 March 2023).
- United States Geological Survey (USGS). GloVis. 2023. Available online: https://glovis.usgs.gov/app?fullscreen=0 (accessed on 5 March 2023).
- European Space Agence. Sentinel Satellite. 2023. Available online: https://sentinels.copernicus.eu/web/sentinel/home (accessed on 5 March 2023).
- NASA Office. MODIS Satellite. 2023. Available online: https://modis.gsfc.nasa.gov/about/ (accessed on 5 March 2023).
- Earth Data Website. AVHRR Satellite. 2023. Available online: https://www.earthdata.nasa.gov/sensors/avhrr (accessed on 5 March 2023).
- Earth Data Website. VIIRS Satellite. 2023. Available online: https://www.earthdata.nasa.gov/learn/find-data/near-real-time/viirs (accessed on 5 March 2023).
- Kang, Y.; Jang, E.; Im, J.; Kwon, C. A deep learning model using geostationary satellite data for forest fire detection with reduced detection latency. Gisci. Remote Sens. 2022, 59, 2019–2035. [Google Scholar] [CrossRef]
- Azami, M.H.b.; Orger, N.C.; Schulz, V.H.; Oshiro, T.; Cho, M. Earth Observation Mission of a 6U CubeSat with a 5-Meter Resolution for Wildfire Image Classification Using Convolution Neural Network Approach. Remote Sens. 2022, 14, 1874. [Google Scholar] [CrossRef]
- Kalaivani, V.; Chanthiya, P. A novel custom optimized convolutional neural network for a satellite image by using forest fire detection. Earth Sci. Inform. 2022, 15, 1285–1295. [Google Scholar] [CrossRef]
- Seydi, S.T.; Saeidi, V.; Kalantar, B.; Ueda, N.; Halin, A.A. Fire-Net: A deep learning framework for active forest fire detection. J. Sens. 2022, 2022, 8044390. [Google Scholar] [CrossRef]
- Maria Jose Lozano, P.; MacFarlane, I. Predicting California Wildfire Risk with Deep Neural Networks. In Proceedings of the CS230: Deep Learning, Winter 2018; Stanford University: Stanford, CA, USA, 2018; pp. 1–6. [Google Scholar]
- Sandler, M.; Howard, A.; Zhu, M.; Zhmoginov, A.; Chen, L.C. MobileNetV2: Inverted Residuals and Linear Bottlenecks. In Proceedings of the IEEE Conference on Computer Vision and Pattern Recognition (CVPR), Salt Lake City, UT, USA, 18–23 June 2018; pp. 4510–4520. [Google Scholar]
- He, K.; Zhang, X.; Ren, S.; Sun, J. Deep Residual Learning for Image Recognition. In Proceedings of the IEEE Conference on Computer Vision and Pattern Recognition (CVPR), Las Vegas, NV, USA, 27–30 June 2016; pp. 770–778. [Google Scholar]
- Deng, J.; Dong, W.; Socher, R.; Li, L.J.; Li, K.; Fei-Fei, L. ImageNet: A large-scale hierarchical image database. In Proceedings of the IEEE Conference on Computer Vision and Pattern Recognition, Miami, FL, USA, 20–25 June 2009; pp. 248–255. [Google Scholar]
- Zhao, L.; Liu, J.; Peters, S.; Li, J.; Oliver, S.; Mueller, N. Investigating the Impact of Using IR Bands on Early Fire Smoke Detection from Landsat Imagery with a Lightweight CNN Model. Remote Sens. 2022, 14, 3047. [Google Scholar] [CrossRef]
- Wang, Y.; Liu, X.; Li, M.; Di, W.; Wang, L. Deep Convolution and Correlated Manifold Embedded Distribution Alignment for Forest Fire Smoke Prediction. Comput. Inform. 2020, 39, 318–339. [Google Scholar] [CrossRef]
- Filonenko, A.; Kurnianggoro, L.; Jo, K.H. Smoke detection on video sequences using convolutional and recurrent neural networks. In Proceedings of the Computational Collective Intelligence (ICCCI 2017), Nicosia, Cyprus, 27–29 September 2017; pp. 558–566. [Google Scholar]
- Wei, X.; Wu, S.; Wang, Y. Forest fire smoke detection model based on deep convolution long short-term memory network. J. Comput. Appl. 2019, 39, 2883–2887. [Google Scholar] [CrossRef]
- Higa, L.; Marcato, J., Jr.; Rodrigues, T.; Zamboni, P.; Silva, R.; Almeida, L.; Liesenberg, V.; Roque, F.; Libonati, R.; Gonçalves, W.N.; et al. Active Fire Mapping on Brazilian Pantanal Based on Deep Learning and CBERS 04A Imagery. Remote Sens. 2022, 14, 688. [Google Scholar] [CrossRef]
- Kim, K.; Lee, H.S. Probabilistic Anchor Assignment with IoU Prediction for Object Detection. In Proceedings of the Computer Vision—ECCV 2020, Glasgow, UK, 23–28 August 2020; pp. 355–371. [Google Scholar]
- Zhang, H.; Wang, Y.; Dayoub, F.; Sunderhauf, N. VarifocalNet: An IoU-Aware Dense Object Detector. In Proceedings of the IEEE/CVF Conference on Computer Vision and Pattern Recognition (CVPR), Nashville, TN, USA, 20–25 June 2021; pp. 8514–8523. [Google Scholar]
- Zhang, S.; Chi, C.; Yao, Y.; Lei, Z.; Li, S.Z. Bridging the Gap between Anchor-Based and Anchor-Free Detection via Adaptive Training Sample Selection. In Proceedings of the IEEE/CVF Conference on Computer Vision and Pattern Recognition (CVPR), Seattle, WA, USA, 13–19 June 2020; pp. 9759–9768. [Google Scholar]
- Wang, J.; Zhang, W.; Cao, Y.; Chen, K.; Pang, J.; Gong, T.; Shi, J.; Loy, C.C.; Lin, D. Side-aware boundary localization for more precise object detection. In Proceedings of the Computer Vision–ECCV 2020, Glasgow, UK, 23–28 August 2020; pp. 403–419. [Google Scholar]
- Lin, T.Y.; Goyal, P.; Girshick, R.; He, K.; Dollar, P. Focal Loss for Dense Object Detection. In Proceedings of the IEEE International Conference on Computer Vision (ICCV), Venice, Italy, 22–29 October 2017; pp. 2980–2988. [Google Scholar]
- Ren, S.; He, K.; Girshick, R.; Sun, J. Faster R-CNN: Towards Real-Time Object Detection with Region Proposal Networks. In Proceedings of the Advances in Neural Information Processing Systems, Montreal, QC, Canada, 7–12 December 2015; pp. 91–99. [Google Scholar]
- Higa, L.; Marcato Junior, J.; Rodrigues, T.; Zamboni, P.; Silva, R.; Almeida, L.; Liesenberg, V.; Roque, F.; Libonati, R.; Gonçalves, W.N.; et al. Active Fire Detection (CBERS 4A—RGB). 2023. Available online: https://sites.google.com/view/geomatics-and-computer-vision/home/datasets (accessed on 5 March 2023).
- Ba, R.; Chen, C.; Yuan, J.; Song, W.; Lo, S. SmokeNet: Satellite Smoke Scene Detection Using Convolutional Neural Network with Spatial and Channel-Wise Attention. Remote Sens. 2019, 11, 1702. [Google Scholar] [CrossRef]
- Ba, R.; Chen, C.; Yuan, J.; Song, W.; Lo, S. USTC_SmokeRS Dataset. 2023. Available online: https://pan.baidu.com/s/1GBOE6xRVzEBV92TrRMtfWg (accessed on 5 March 2023).
- Simonyan, K.; Zisserman, A. Very deep convolutional networks for large-scale image recognition. In Proceedings of the 3rd International Conference on Learning Representations, ICLR, San Diego, CA, USA, 7–9 May 2015; pp. 1–14. [Google Scholar]
- Huang, G.; Liu, Z.; van der Maaten, L.; Weinberger, K.Q. Densely Connected Convolutional Networks. In Proceedings of the IEEE Conference on Computer Vision and Pattern Recognition (CVPR), Honolulu, HI, USA, 21–26 July 2017; pp. 4700–4708. [Google Scholar]
- Wang, F.; Jiang, M.; Qian, C.; Yang, S.; Li, C.; Zhang, H.; Wang, X.; Tang, X. Residual Attention Network for Image Classification. In Proceedings of the IEEE Conference on Computer Vision and Pattern Recognition (CVPR), Honolulu, HI, USA, 21–26 July 2017; pp. 3156–3164. [Google Scholar]
- Hu, J.; Shen, L.; Sun, G. Squeeze-and-Excitation Networks. In Proceedings of the IEEE Conference on Computer Vision and Pattern Recognition (CVPR), Salt Lake City, UT, USA, 18–22 June 2018; pp. 7132–7141. [Google Scholar]
- Phan, T.C.; Nguyen, T.T. Remote Sensing meets Deep Learning: Exploiting Spatio-Temporal-Spectral Satellite Images for Early Wildfire Detection. 2023. Available online: https://infoscience.epfl.ch/record/270339 (accessed on 5 March 2023).
- Li, Z.; Kaufman, Y.J.; Ichoku, C.; Fraser, R.; Trishchenko, A.; Giglio, L.; Jin, J.; Yu, X. A review of AVHRR-based active fire detection algorithms: Principles, limitations, and recommendations. In Global and Regional Vegetation Fire Monitoring from Space, Planning and Coordinated International Effort; Kugler Publications: Amsterdam, The Netherlands, 2001; pp. 199–225. [Google Scholar]
- Schroeder, W.; Oliva, P.; Giglio, L.; Csiszar, I.A. The New VIIRS 375 m active fire detection data product: Algorithm description and initial assessment. Remote Sens. Environ. 2014, 143, 85–96. [Google Scholar] [CrossRef]
- Xu, W.; Wooster, M.; Roberts, G.; Freeborn, P. New GOES imager algorithms for cloud and active fire detection and fire radiative power assessment across North, South and Central America. Remote Sens. Environ. 2010, 114, 1876–1895. [Google Scholar] [CrossRef]
- Hong, Z.; Tang, Z.; Pan, H.; Zhang, Y.; Zheng, Z.; Zhou, R.; Ma, Z.; Zhang, Y.; Han, Y.; Wang, J.; et al. Active Fire Detection Using a Novel Convolutional Neural Network Based on Himawari-8 Satellite Images. Front. Environ. Sci. 2022, 10, 102. [Google Scholar] [CrossRef]
- Japan Aerospace Exploration Agency. Himawari-8 Dataset. 2023. Available online: https://www.eorc.jaxa.jp/ptree/userguide.html (accessed on 5 March 2023).
- Wang, M.; Jiang, L.; Yue, P.; Yu, D.; Tuo, T. FASDD: An Open-access 100,000-level Flame and Smoke Detection Dataset for Deep Learning in Fire Detection. Earth Syst. Sci. Data Discuss. 2022, 2022, 1–22. [Google Scholar] [CrossRef]
- Zhu, X.; Su, W.; Lu, L.; Li, B.; Wang, X.; Dai, J. Deformable DETR: Deformable Transformers for End-to-End Object Detection. arXiv 2020, arXiv:2010.04159. [Google Scholar]
- Wang, M.; Jiang, L.; Yue, P.; Yu, D.; Tuo, T. Flame and Smoke Detection Dataset (FASDD). 2023. Available online: https://www.scidb.cn/en/detail?dataSetId=ce9c9400b44148e1b0a749f5c3eb0bda (accessed on 5 March 2023).
- Larsen, A.; Hanigan, I.; Reich, B.J.; Qin, Y.; Cope, M.; Morgan, G.; Rappold, A.G. A deep learning approach to identify smoke plumes in satellite imagery in near-real time for health risk communication. Expo. Sci. Environ. Epidemiol. 2021, 31, 170–176. [Google Scholar] [CrossRef]
- National Centers for Environmental Information. National Oceanic and Atmospheric Administration (NOAA). 2023. Available online: https://www.usgs.gov/programs/national-geospatial-program/national-map (accessed on 5 March 2023).
- Ronneberger, O.; Fischer, P.; Brox, T. U-Net: Convolutional networks for biomedical image segmentation. In Proceedings of the Medical Image Computing and Computer-Assisted Intervention—MICCAI, Munich, Germany, 5–9 October 2015; pp. 234–241. [Google Scholar]
- Khryashchev, V.; Larionov, R. Wildfire Segmentation on Satellite Images using Deep Learning. In Proceedings of the Moscow Workshop on Electronic and Networking Technologies (MWENT), Moscow, Russia, 11–13 March 2020; pp. 1–5. [Google Scholar]
- de Almeida Pereira, G.H.; Fusioka, A.M.; Nassu, B.T.; Minetto, R. Active fire detection in Landsat-8 imagery: A large-scale dataset and a deep-learning study. ISPRS J. Photogramm. Remote Sens. 2021, 178, 171–186. [Google Scholar] [CrossRef]
- de Almeida Pereira, G.H.; Fusioka, A.M.; Nassu, B.T.; Minetto, R. Active Fire Detection in Landsat-8 Imagery. 2023. Available online: https://github.com/pereira-gha/activefire (accessed on 5 March 2023).
- Schroeder, W.; Oliva, P.; Giglio, L.; Quayle, B.; Lorenz, E.; Morelli, F. Active fire detection using Landsat-8/OLI data. Remote Sens. Environ. 2016, 185, 210–220. [Google Scholar] [CrossRef]
- Kumar, S.S.; Roy, D.P. Global operational land imager Landsat-8 reflectance-based active fire detection algorithm. Int. J. Digit. Earth 2018, 11, 154–178. [Google Scholar] [CrossRef]
- Murphy, S.W.; de Souza Filho, C.R.; Wright, R.; Sabatino, G.; Correa Pabon, R. HOTMAP: Global hot target detection at moderate spatial resolution. Remote Sens. Environ. 2016, 177, 78–88. [Google Scholar] [CrossRef]
- Rashkovetsky, D.; Mauracher, F.; Langer, M.; Schmitt, M. Wildfire Detection From Multisensor Satellite Imagery Using Deep Semantic Segmentation. IEEE J. Sel. Top. Appl. Earth Obs. Remote Sens. 2021, 14, 7001–7016. [Google Scholar] [CrossRef]
- California Department of Forestry and Fire Protection’s Fire and Resource Assessment Program (FRAP). CAL FIRE Dataset. 2023. Available online: https://frap.fire.ca.gov/frap-projects/fire-perimeters/ (accessed on 5 March 2023).
- Rostami, A.; Shah-Hosseini, R.; Asgari, S.; Zarei, A.; Aghdami-Nia, M.; Homayouni, S. Active Fire Detection from Landsat-8 Imagery Using Deep Multiple Kernel Learning. Remote Sens. 2022, 14, 992. [Google Scholar] [CrossRef]
- Shirvani, Z.; Abdi, O.; Goodman, R.C. High-Resolution Semantic Segmentation of Woodland Fires Using Residual Attention UNet and Time Series of Sentinel-2. Remote Sens. 2023, 15, 1342. [Google Scholar] [CrossRef]
- Sun, C. Analyzing Multispectral Satellite Imagery of South American Wildfires Using Deep Learning. In Proceedings of the 2022 International Conference on Applied Artificial Intelligence (ICAPAI), Halden, Norway, 5 May 2022; pp. 1–6. [Google Scholar]
- Huot, F.; Hu, R.L.; Goyal, N.; Sankar, T.; Ihme, M.; Chen, Y.F. Next Day Wildfire Spread: A Machine Learning Dataset to Predict Wildfire Spreading From Remote-Sensing Data. IEEE Trans. Geosci. Remote Sens. 2022, 60, 1–13. [Google Scholar] [CrossRef]
- Wang, Z.; Yang, P.; Liang, H.; Zheng, C.; Yin, J.; Tian, Y.; Cui, W. Semantic Segmentation and Analysis on Sensitive Parameters of Forest Fire Smoke Using Smoke-UNet and Landsat-8 Imagery. Remote Sens. 2022, 14, 45. [Google Scholar] [CrossRef]
- Long, J.; Shelhamer, E.; Darrell, T. Fully Convolutional Networks for Semantic Segmentation. In Proceedings of the IEEE Conference on Computer Vision and Pattern Recognition (CVPR), Boston, MA, USA, 7–12 June 2015; pp. 3431–3440. [Google Scholar]
- Zhao, H.; Shi, J.; Qi, X.; Wang, X.; Jia, J. Pyramid Scene Parsing Network. In Proceedings of the IEEE Conference on Computer Vision and Pattern Recognition (CVPR), Honolulu, HI, USA, 21–26 July 2017; pp. 2881–2890. [Google Scholar]
- Kamal, U.; Tonmoy, T.I.; Das, S.; Hasan, M.K. Automatic Traffic Sign Detection and Recognition Using SegU-Net and a Modified Tversky Loss Function with L1-Constraint. IEEE Trans. Intell. Transp. Syst. 2020, 21, 1467–1479. [Google Scholar] [CrossRef]
- Wang, T.; Hong, J.; Han, Y.; Zhang, G.; Chen, S.; Dong, T.; Yang, Y.; Ruan, H. AOSVSSNet: Attention-Guided Optical Satellite Video Smoke Segmentation Network. IEEE J. Sel. Top. Appl. Earth Obs. Remote Sens. 2022, 15, 8552–8566. [Google Scholar] [CrossRef]
- Zhou, Z.; Rahman Siddiquee, M.M.; Tajbakhsh, N.; Liang, J. UNet++: A Nested U-Net Architecture for Medical Image Segmentation. In Proceedings of the Deep Learning in Medical Image Analysis and Multimodal Learning for Clinical Decision Support, Granada, Spain, 20 September 2018; pp. 3–11. [Google Scholar]
- Chen, L.C.; Zhu, Y.; Papandreou, G.; Schroff, F.; Adam, H. Encoder-Decoder with Atrous Separable Convolution for Semantic Image Segmentation. In Proceedings of the European Conference on Computer Vision (ECCV), Munich, Germany, 8–14 September 2018; pp. 801–818. [Google Scholar]
- Knopp, L.; Wieland, M.; Rättich, M.; Martinis, S. A Deep Learning Approach for Burned Area Segmentation with Sentinel-2 Data. Remote Sens. 2020, 12, 2422. [Google Scholar] [CrossRef]
- Belenguer-Plomer, M.A.; Tanase, M.A.; Chuvieco, E.; Bovolo, F. CNN-based burned area mapping using radar and optical data. Remote Sens. Environ. 2021, 260, 112468. [Google Scholar] [CrossRef]
- Abid, N.; Malik, M.I.; Shahzad, M.; Shafait, F.; Ali, H.; Ghaffar, M.M.; Weis, C.; Wehn, N.; Liwicki, M. Burnt Forest Estimation from Sentinel-2 Imagery of Australia using Unsupervised Deep Learning. In Proceedings of the Digital Image Computing: Techniques and Applications (DICTA), Gold Coast, Australia, 9 November–1 December 2021; pp. 01–08. [Google Scholar]
- Hu, X.; Ban, Y.; Nascetti, A. Uni-Temporal Multispectral Imagery for Burned Area Mapping with Deep Learning. Remote Sens. 2021, 13, 1509. [Google Scholar] [CrossRef]
- Poudel, R.P.; Liwicki, S.; Cipolla, R. Fast-scnn: Fast semantic segmentation network. In Proceedings of the 30th British Machine Vision Conference (BMVC), Cardiff, UK, 9–12 September 2019; pp. 9–12. [Google Scholar]
- Wang, J.; Sun, K.; Cheng, T.; Jiang, B.; Deng, C.; Zhao, Y.; Liu, D.; Mu, Y.; Tan, M.; Wang, X.; et al. Deep High-Resolution Representation Learning for Visual Recognition. IEEE Trans. Pattern Anal. Mach. Intell. 2021, 43, 3349–3364. [Google Scholar] [CrossRef]
- Cho, A.Y.; Park, S.e.; Kim, D.j.; Kim, J.; Li, C.; Song, J. Burned Area Mapping Using Unitemporal PlanetScope Imagery with a Deep Learning Based Approach. IEEE J. Sel. Top. Appl. Earth Obs. Remote Sens. 2023, 16, 242–253. [Google Scholar] [CrossRef]
- PlanetLabs Team. PlanetScope Dataset. 2023. Available online: https://developers.planet.com/docs/data/planetscope/ (accessed on 5 March 2023).
- Brand, A.; Manandhar, A. Semantic segmentation of burned areas in satellite images using a U-Net based convolutional neural network. Int. Arch. Photogramm. Remote Sens. Spat. Inf. Sci. 2021, XLIII-B3-2021, 47–53. [Google Scholar] [CrossRef]
- Seydi, S.T.; Hasanlou, M.; Chanussot, J. Burnt-Net: Wildfire burned area mapping with single post-fire Sentinel-2 data and deep learning morphological neural network. Ecol. Indic. 2022, 140, 108999. [Google Scholar] [CrossRef]
- Prabowo, Y.; Sakti, A.D.; Pradono, K.A.; Amriyah, Q.; Rasyidy, F.H.; Bengkulah, I.; Ulfa, K.; Candra, D.S.; Imdad, M.T.; Ali, S. Deep Learning Dataset for Estimating Burned Areas: Case Study, Indonesia. Data 2022, 7, 78. [Google Scholar] [CrossRef]
- Colomba, L.; Farasin, A.; Monaco, S.; Greco, S.; Garza, P.; Apiletti, D.; Baralis, E.; Cerquitelli, T. A Dataset for Burned Area Delineation and Severity Estimation from Satellite Imagery. In Proceedings of the 31st ACM International Conference on Information & Knowledge Management, Atlanta, GA, USA, 17–21 October 2022; pp. 3893–3897. [Google Scholar]
- Luca, C.; Alessandro, F.; Simone, M.; Salvatore, G.; Paolo, G.; Daniele, A.; Elena, B.; Tania, C. Satellite Burned Area Dataset. 2023. [Google Scholar] [CrossRef]
- Zhang, P.; Ban, Y.; Nascetti, A. Learning U-Net without forgetting for near real-time wildfire monitoring by the fusion of SAR and optical time series. Remote Sens. Environ. 2021, 261, 112467. [Google Scholar] [CrossRef]
- Pinto, M.M.; Libonati, R.; Trigo, R.M.; Trigo, I.F.; DaCamara, C.C. A deep learning approach for mapping and dating burned areas using temporal sequences of satellite images. ISPRS J. Photogramm. Remote Sens. 2020, 160, 260–274. [Google Scholar] [CrossRef]
- NASA Visible Infrared Imaging Radiometer Suite Level-1B Product User Guide. VIIRS Level-1B Products. 2023. Available online: https://ladsweb.modaps.eosdis.nasa.gov/missions-and-measurements/science-domain/viirs-L0-L1/ (accessed on 5 March 2023).
- Giglio, L.; Boschetti, L.; Roy, D.P.; Humber, M.L.; Justice, C.O. The Collection 6 MODIS burned area mapping algorithm and product. Remote Sens. Environ. 2018, 217, 72–85. [Google Scholar] [CrossRef]
- Chuvieco, E.; Lizundia-Loiola, J.; Pettinari, M.L.; Ramo, R.; Padilla, M.; Tansey, K.; Mouillot, F.; Laurent, P.; Storm, T.; Heil, A.; et al. Generation and analysis of a new global burned area product based on MODIS 250 m reflectance bands and thermal anomalies. Earth Syst. Sci. Data 2018, 10, 2015–2031. [Google Scholar] [CrossRef]
- Rodrigues, J.A.; Libonati, R.; Pereira, A.A.; Nogueira, J.M.; Santos, F.L.; Peres, L.F.; Santa Rosa, A.; Schroeder, W.; Pereira, J.M.; Giglio, L.; et al. How well do global burned area products represent fire patterns in the Brazilian Savannas biome? An accuracy assessment of the MCD64 collections. Int. J. Appl. Earth Obs. Geoinf. 2019, 78, 318–331. [Google Scholar] [CrossRef]
- Roteta, E.; Bastarrika, A.; Padilla, M.; Storm, T.; Chuvieco, E. Development of a Sentinel-2 burned area algorithm: Generation of a small fire database for sub-Saharan Africa. Remote Sens. Environ. 2019, 222, 1–17. [Google Scholar] [CrossRef]
- Hu, X.; Zhang, P.; Ban, Y. MTBS Dataset. 2023. Available online: https://www.mtbs.gov/direct-download (accessed on 5 March 2023).
- Goodwin, N.R.; Collett, L.J. Development of an automated method for mapping fire history captured in Landsat TM and ETM+ time series across Queensland, Australia. Remote Sens. Environ. 2014, 148, 206–221. [Google Scholar] [CrossRef]
- Institute for the Conservation of Nature and Forests (ICNF). ICNF Burned Areas. 2023. Available online: https://www.icnf.pt// (accessed on 5 March 2023).
- Seydi, S.T.; Hasanlou, M.; Chanussot, J. DSMNN-Net: A Deep Siamese Morphological Neural Network Model for Burned Area Mapping Using Multispectral Sentinel-2 and Hyperspectral PRISMA Images. Remote Sens. 2021, 13, 5138. [Google Scholar] [CrossRef]
- Ngadze, F.; Mpakairi, K.S.; Kavhu, B.; Ndaimani, H.; Maremba, M.S. Exploring the utility of Sentinel-2 MSI and Landsat 8 OLI in burned area mapping for a heterogenous savannah landscape. PLoS ONE 2020, 15, e0232962. [Google Scholar] [CrossRef] [PubMed]
- Roy, D.P.; Huang, H.; Boschetti, L.; Giglio, L.; Yan, L.; Zhang, H.H.; Li, Z. Landsat-8 and Sentinel-2 burned area mapping - A combined sensor multi-temporal change detection approach. Remote Sens. Environ. 2019, 231, 111254. [Google Scholar] [CrossRef]
- Syifa, M.; Panahi, M.; Lee, C.W. Mapping of Post-Wildfire Burned Area Using a Hybrid Algorithm and Satellite Data: The Case of the Camp Fire Wildfire in California, USA. Remote Sens. 2020, 12, 623. [Google Scholar] [CrossRef]
- Zhang, G.; Wang, M.; Liu, K. Forest fire susceptibility modeling using a convolutional neural network for Yunnan province of China. Int. J. Disaster Risk Sci. 2019, 10, 386–403. [Google Scholar] [CrossRef]
- NCAR Research Data Archive (RDA). Data for Climate & Weather Research. 2023. Available online: https://rda.ucar.edu/ (accessed on 5 March 2023).
- NASA Earth Observation Data. Earth Data. 2023. Available online: https://search.earthdata.nasa.gov/search (accessed on 5 March 2023).
- Prapas, I.; Kondylatos, S.; Papoutsis, I.; Camps-Valls, G.; Ronco, M.; Fernández-Torres, M.; Guillem, M.P.; Carvalhais, N. Deep Learning Methods for Daily Wildfire Danger Forecasting. arXiv 2021, arXiv:2111.02736. [Google Scholar]
- Prapas, I.; Kondylatos, S.; Papoutsis, I. A Datacube for the Analysis of Wildfires in Greece. 2023. [CrossRef]
- Zhang, G.; Wang, M.; Liu, K. Deep neural networks for global wildfire susceptibility modelling. Ecol. Indic. 2021, 127, 107735. [Google Scholar] [CrossRef]
- Le, H.V.; Hoang, D.A.; Tran, C.T.; Nguyen, P.Q.; Tran, V.H.T.; Hoang, N.D.; Amiri, M.; Ngo, T.P.T.; Nhu, H.V.; Hoang, T.V.; et al. A new approach of deep neural computing for spatial prediction of wildfire danger at tropical climate areas. Ecol. Inform. 2021, 63, 101300. [Google Scholar] [CrossRef]
- Le, H.V.; Bui, Q.T.; Bui, D.T.; Tran, H.H.; Hoang, N.D. A Hybrid Intelligence System Based on Relevance Vector Machines and Imperialist Competitive Optimization for Modelling Forest Fire Danger Using GIS. J. Environ. Inform. 2018, 36, 43–57. [Google Scholar] [CrossRef]
- Omar, N.; Al-zebari, A.; Sengur, A. Deep Learning Approach to Predict Forest Fires Using Meteorological Measurements. In Proceedings of the 2nd International Informatics and Software Engineering Conference (IISEC), Ankara, Turkey, 16–17 December 2021; pp. 1–4. [Google Scholar]
- Zhang, G.; Wang, M.; Liu, K. Dynamic prediction of global monthly burned area with hybrid deep neural networks. Ecol. Appl. 2022, 32, e2610. [Google Scholar] [CrossRef]
- Shao, Y.; Wang, Z.; Feng, Z.; Sun, L.; Yang, X.; Zheng, J.; Ma, T. Assessment of China’s forest fire occurrence with deep learning, geographic information and multisource data. J. For. Res. 2022, 1–14. [Google Scholar] [CrossRef]
- Shams-Eddin, M.H.; Roscher, R.; Gall, J. Location-aware Adaptive Denormalization: A Deep Learning Approach for Wildfire Danger Forecasting. arXiv 2022, arXiv:2212.08208. [Google Scholar]
- Prapas, I.; Kondylatos, S.; Papoutsis, I. FireCube: A Daily Datacube for the Modeling and Analysis of Wildfires in Greece. 2023. [Google Scholar] [CrossRef]
- Jamshed, M.A.; Theodorou, C.; Kalsoom, T.; Anjum, N.; Abbasi, Q.H.; Ur-Rehman, M. Intelligent computing based forecasting of deforestation using fire alerts: A deep learning approach. Phys. Commun. 2022, 55, 101941. [Google Scholar] [CrossRef]
- Naderpour, M.; Rizeei, H.M.; Ramezani, F. Forest Fire Risk Prediction: A Spatial Deep Neural Network-Based Framework. Remote Sens. 2021, 13, 2513. [Google Scholar] [CrossRef]
- Australian Government, Bureau of Meteorology. Meteorology Data. 2023. Available online: http://www.bom.gov.au/ (accessed on 5 March 2023).
- NSW Governement Website. Land Cover Data. 2023. Available online: https://data.nsw.gov.au/ (accessed on 5 March 2023).
- Geoscience Australia’s New Website. Elvis—Elevation and Depth—Foundation Spatial Data. 2023. Available online: https://elevation.fsdf.org.au/ (accessed on 5 March 2023).
- Demographic Resource Centre. Social Data. 2023. Available online: https://profile.id.com.au/northern-beaches (accessed on 5 March 2023).
- Nur, A.S.; Kim, Y.J.; Lee, C.W. Creation of Wildfire Susceptibility Maps in Plumas National Forest Using InSAR Coherence, Deep Learning, and Metaheuristic Optimization Approaches. Remote Sens. 2022, 14, 4416. [Google Scholar] [CrossRef]
- Atashpaz-Gargari, E.; Lucas, C. Imperialist competitive algorithm: An algorithm for optimization inspired by imperialistic competition. In Proceedings of the IEEE Congress on Evolutionary Computation, Singapore, 25–28 September 2007; pp. 4661–4667. [Google Scholar]
- Mirjalili, S.; Mirjalili, S.M.; Lewis, A. Grey Wolf Optimizer. Adv. Eng. Softw. 2014, 69, 46–61. [Google Scholar] [CrossRef]
- Bjånes, A.; De La Fuente, R.; Mena, P. A deep learning ensemble model for wildfire susceptibility mapping. Ecol. Inform. 2021, 65, 101397. [Google Scholar] [CrossRef]
- Abatzoglou, J.T.; Dobrowski, S.Z.; Parks, S.A.; Hegewisch, K.C. TerraClimate, a high-resolution global dataset of monthly climate and climatic water balance from 1958–2015. Sci. Data 2018, 5, 170191. [Google Scholar] [CrossRef]
- Huot, F.; Hu, R.L.; Ihme, M.; Wang, Q.; Burge, J.; Lu, T.; Hickey, J.; Chen, Y.; Anderson, J.R. Deep Learning Models for Predicting Wildfires from Historical Remote-Sensing Data. arXiv 2020, arXiv:2010.07445. [Google Scholar]
- NASA Earth Observation Data. MOD14A1—MODIS/Terra Thermal Anomalies/Fire Daily L3 Global 1 km SIN Grid. 2023. Available online: https://ladsweb.modaps.eosdis.nasa.gov/missions-and-measurements/products/MOD14A1 (accessed on 5 March 2023).
- NASA Earth Observation Data. VIIRS/NPP Vegetation Indices 16-Day L3 Global 500 m SIN Grid V001. 2023. Available online: https://cmr.earthdata.nasa.gov/search/concepts/C1392010616-LPDAAC_ECS.html (accessed on 5 March 2023).
- Farr, T.G.; Rosen, P.A.; Caro, E.; Crippen, R.; Duren, R.; Hensley, S.; Kobrick, M.; Paller, M.; Rodriguez, E.; Roth, L.; et al. The shuttle radar topography mission. Rev. Geophys. 2007, 45, 1–33. [Google Scholar] [CrossRef]
- Abatzoglou, J.T.; Rupp, D.E.; Mote, P.W. Seasonal Climate Variability and Change in the Pacific Northwest of the United States. J. Clim. 2014, 27, 2125–2142. [Google Scholar] [CrossRef]
- Abatzoglou, J.T. Development of gridded surface meteorological data for ecological applications and modelling. Int. J. Climatol. 2013, 33, 121–131. [Google Scholar] [CrossRef]
- Farasin, A.; Colomba, L.; Garza, P. Double-Step U-Net: A Deep Learning-Based Approach for the Estimation of Wildfire Damage Severity through Sentinel-2 Satellite Data. Appl. Sci. 2020, 10, 4332. [Google Scholar] [CrossRef]
- Miller, J.D.; Thode, A.E. Quantifying burn severity in a heterogeneous landscape with a relative version of the delta Normalized Burn Ratio (dNBR). Remote Sens. Environ. 2007, 109, 66–80. [Google Scholar] [CrossRef]
- Monaco, S.; Pasini, A.; Apiletti, D.; Colomba, L.; Garza, P.; Baralis, E. Improving Wildfire Severity Classification of Deep Learning U-Nets from Satellite Images. In Proceedings of the IEEE International Conference on Big Data (Big Data), Atlanta, GA, USA, 10–13 December 2020; pp. 5786–5788. [Google Scholar]
- Monaco, S.; Greco, S.; Farasin, A.; Colomba, L.; Apiletti, D.; Garza, P.; Cerquitelli, T.; Baralis, E. Attention to Fires: Multi-Channel Deep Learning Models for Wildfire Severity Prediction. Appl. Sci. 2021, 11, 11060. [Google Scholar] [CrossRef]
- Oktay, O.; Schlemper, J.; Folgoc, L.L.; Lee, M.C.H.; Heinrich, M.P.; Misawa, K.; Mori, K.; McDonagh, S.G.; Hammerla, N.Y.; Kainz, B.; et al. Attention U-Net: Learning Where to Look for the Pancreas. arXiv 2018, arXiv:1804.03999. [Google Scholar]
- Monaco, S.; Pasini, A.; Apiletti, D.; Colomba, L.; Farasin, A.; Garza, P.; Baralis, E. Double-Step deep learning framework to improve wildfire severity classification. In Proceedings of the EDBT/ICDT Workshops, Nicosia, Cyprus, 23 March 2021; pp. 1–6. [Google Scholar]
- Hu, X.; Zhang, P.; Ban, Y. Large-scale burn severity mapping in multispectral imagery using deep semantic segmentation models. ISPRS J. Photogramm. Remote Sens. 2023, 196, 228–240. [Google Scholar] [CrossRef]
- Qin, X.; Zhang, Z.; Huang, C.; Dehghan, M.; Zaiane, O.R.; Jagersand, M. U2-Net: Going deeper with nested U-structure for salient object detection. Pattern Recognit. 2020, 106, 107404. [Google Scholar] [CrossRef]
- Huang, H.; Lin, L.; Tong, R.; Hu, H.; Zhang, Q.; Iwamoto, Y.; Han, X.; Chen, Y.W.; Wu, J. UNet 3+: A Full-Scale Connected UNet for Medical Image Segmentation. In Proceedings of the IEEE International Conference on Acoustics, Speech and Signal Processing (ICASSP), Barcelona, Spain, 4–8 May 2020; pp. 1055–1059. [Google Scholar]
- Chen, L.; Papandreou, G.; Schroff, F.; Adam, H. Rethinking Atrous Convolution for Semantic Image Segmentation. arXiv 2017, arXiv:1706.05587. [Google Scholar]
- Ding, C.; Zhang, X.; Chen, J.; Ma, S.; Lu, Y.; Han, W. Wildfire detection through deep learning based on Himawari-8 satellites platform. Int. J. Remote Sens. 2022, 43, 5040–5058. [Google Scholar] [CrossRef]
- Prapas, I.; Ahuja, A.; Kondylatos, S.; Karasante, I.; Panagiotou, E.; Alonso, L.; Davalas, C.; Michail, D.; Carvalhais, N.; Papoutsis, I. Deep Learning for Global Wildfire Forecasting. arXiv 2022, arXiv:2211.00534. [Google Scholar]
- Alonso, L.; Gans, F.; Karasante, I.; Ahuja, A.; Prapas, I.; Kondylatos, S.; Papoutsis, I.; Panagiotou, E.; Mihail, D.; Cremer, F.; et al. SeasFire Cube: A Global Dataset for Seasonal Fire Modeling in the Earth System. 2023. [Google Scholar] [CrossRef]
- Natural Resources Canada. Canadian Forest Fire Behavior Prediction (FBP) System. 2023. Available online: https://cwfis.cfs.nrcan.gc.ca/background/summary/fbp (accessed on 5 March 2023).
- Stankevich, T.S. Development of an Intelligent System for Predicting the Forest Fire Development Based on Convolutional Neural Networks. In Proceedings of the Advances in Artificial Systems for Medicine and Education III, Moscow, Russia, 1–3 October 2019; pp. 3–12. [Google Scholar]
- NASA Earth Observation Data. FIRMS (Fire Information for Resource Management System). 2023. Available online: https://firms.modaps.eosdis.nasa.gov/map/#d:24hrs;@0.0,0.0,2z (accessed on 5 March 2023).
- European Space Agency. Land Cover Map ESA/CCI. 2023. Available online: http://maps.elie.ucl.ac.be/CCI/viewer/ (accessed on 5 March 2023).
- Ventusky InMeteo. Ventusky InMeteo Data. 2023. Available online: https://www.ventusky.com/ (accessed on 5 March 2023).
- Radke, D.; Hessler, A.; Ellsworth, D. FireCast: Leveraging Deep Learning to Predict Wildfire Spread. In Proceedings of the International Joint Conference on Artificial Intelligence (IJCAI), Macao, China, 10–16 August 2019; pp. 4575–4581. [Google Scholar]
- Finney, M.A. FARSITE, Fire Area Simulator–Model Development and Evaluation; US Forest Service: Ogden, UT, USA, 1998.
- Bergado, J.R.; Persello, C.; Reinke, K.; Stein, A. Predicting wildfire burns from big geodata using deep learning. Saf. Sci. 2021, 140, 105276. [Google Scholar] [CrossRef]
- Hutchinson, M.; Stein, J.; Stein, J.; Anderson, H. GEODATA 9 s DEM and D8: Digital Elevation Model Version 3 and Flow Direction Grid 2008. 2023. Available online: http://pid.geoscience.gov.au/dataset/ga/66006, (accessed on 5 March 2023).
- Department of Environment, Land, Water and Planning of Victoria. Road Network—Vicmap Transport. 2023. Available online: https://services.land.vic.gov.au/SpatialDatamart/dataSearchViewMetadata.html?anzlicId=ANZVI0803002595&extractionProviderId=1 (accessed on 5 March 2023).
- State Government of Victoria. Vicmap Features of Interest. 2023. Available online: http://services.land.vic.gov.au/catalogue/metadata?anzlicId=ANZVI0803003646&publicId=guest&extractionProviderId=1#tab0 (accessed on 5 March 2023).
- Lymburner, L.; Tan, P.; Mueller, N.; Thackway, R.; Thankappan, M.; Islam, A.; Lewis, A.; Randall, L.; Senarath, U. Dynamic Land Cover Dataset. 2023. Available online: https://ecat.ga.gov.au/geonetwork/srv/eng/catalog.search#/metadata/71069 (accessed on 5 March 2023).
- Hodges, J.L.; Lattimer, B.Y. Wildland fire spread modeling using convolutional neural networks. Fire Technol. 2019, 55, 2115–2142. [Google Scholar] [CrossRef]
- Liang, H.; Zhang, M.; Wang, H. A Neural Network Model for Wildfire Scale Prediction Using Meteorological Factors. IEEE Access 2019, 7, 176746–176755. [Google Scholar] [CrossRef]
- Khennou, F.; Ghaoui, J.; Akhloufi, M.A. Forest fire spread prediction using deep learning. In Geospatial Informatics XI; SPIE: Bellingham, WA, USA, 2021; pp. 106–117. [Google Scholar]
- Khennou, F.; Akhloufi, M.A. Predicting wildland fire propagation using deep learning. In Proceedings of the 1st International Congress on Fire in the Earth System: Humans and Nature (fEs2021), Valencia, Spain, 4–8 November 2021; p. 104. [Google Scholar]
- Allaire, F.; Mallet, V.; Filippi, J.B. Emulation of wildland fire spread simulation using deep learning. Neural Netw. 2021, 141, 184–198. [Google Scholar] [CrossRef]
- McCarthy, N.F.; Tohidi, A.; Aziz, Y.; Dennie, M.; Valero, M.M.; Hu, N. A Deep Learning Approach to Downscale Geostationary Satellite Imagery for Decision Support in High Impact Wildfires. Forests 2021, 12, 294. [Google Scholar] [CrossRef]
- MapBiomas Website. MapBiomas Fire Dataset. 2023. Available online: https://mapbiomas.org/ (accessed on 5 March 2023).
- United States Geological Survey (USGS). Geospatial Multi-Agency Coordination (GeoMAC). 2023. Available online: https://wildfire.usgs.gov/geomac/GeoMACTransition.shtml (accessed on 5 March 2023).
- Walters, S.P.; Schneider, N.J.; Guthrie, J.D. Geospatial Multi-Agency Coordination (GeoMAC) Wildland Fire Perimeters, 2008. US Geol. Surv. Data Ser. 2011, 612, 6. [Google Scholar]
- Artés, T.; Oom, D.; De Rigo, D.; Durrant, T.H.; Maianti, P.; Libertà, G.; San-Miguel-Ayanz, J. A global wildfire dataset for the analysis of fire regimes and fire behaviour. Sci. Data 2019, 6, 296. [Google Scholar] [CrossRef]
- Sayad, Y.O.; Mousannif, H.; Al Moatassime, H. Predictive modeling of wildfires: A new dataset and machine learning approach. Fire Saf. J. 2019, 104, 130–146. [Google Scholar] [CrossRef]
- Sayad, Y.O.; Mousannif, H.; Al Moatassime, H. Wildfires Dataset. 2023. Available online: https://github.com/ouladsayadyounes/Wildfires (accessed on 5 March 2023).
- Singla, S.; Mukhopadhyay, A.; Wilbur, M.; Diao, T.; Gajjewar, V.; Eldawy, A.; Kochenderfer, M.; Shachter, R.; Dubey, A. WildfireDB: An Open-Source Dataset Connecting Wildfire Spread with Relevant Determinants. In Proceedings of the 35th Conference on Neural Information Processing Systems (NeurIPS 2021) Track on Datasets and Benchmarks, Virtual, 6–14 December 2021; pp. 1–10. [Google Scholar]
- Singla, S.; Mukhopadhyay, A.; Wilbur, M.; Diao, T.; Gajjewar, V.; Eldawy, A.; Kochenderfer, M.; Shachter, R.; Dubey, A. WildfireDB Dataset. 2023. Available online: https://wildfire-modeling.github.io/ (accessed on 5 March 2023).
- Monaco, S.; Greco, S.; Farasin, A.; Colomba, L.; Apiletti, D.; Garza, P.; Cerquitelli, T.; Baralis, E. Sentinel-2 Data. 2023. Available online: https://github.com/dbdmg/rescue (accessed on 5 March 2023).
- Abatzoglou, J.T.; Dobrowski, S.Z.; Parks, S.A.; Hegewisch, K.C. TerraClimate Dataset. 2023. Available online: https://data.nkn.uidaho.edu/dataset/monthly-climate-and-climatic-water-balance-global-terrestrial-surfaces-1958-2015 (accessed on 5 March 2023).
- Randerson, J.; Van Der Werf, G.; Giglio, L.; Collatz, G.; Kasibhatla, P. GFEDv4 Dataset. 2023. Available online: https://daac.ornl.gov/cgi-bin/dsviewer.pl?ds_id=1293 (accessed on 5 March 2023).
- U.S. Department of the Interior, Geological Survey. LANDFIRE 2.0.0 Database. 2023. Available online: https://landfire.gov/lf_remap.php// (accessed on 5 March 2023).
- Huot, F.; Hu, R.L.; Goyal, N.; Sankar, T.; Ihme, M.; Chen, Y.F. Next Day Wildfire Spread Dataset. 2023. Available online: https://www.kaggle.com/datasets/fantineh/next-day-wildfire-spread (accessed on 5 March 2023).
- National Center for Environmental Information. Climate Data Online. 2023. Available online: https://www.ncdc.noaa.gov/cdo-web/ (accessed on 5 March 2023).
- Government of Canada. The Canadian Wildland Fire Information System (CWFIS). 2023. Available online: https://cwfis.cfs.nrcan.gc.ca/ (accessed on 5 March 2023).


| Ref. | Methodology | Dataset | Results |
|---|---|---|---|
| [88] | Simple CNN | Sentinel-1 data Sentinel-2 data | Dice = 57.00 Dice = 70.00 |
| [89] | VGG16, K-means, and thresholding methods | Sentinel-2 imagery data of Australia | F1-score = 87.00 |
| [90] | U-NetFast-SCNN H-RNet | Sentinel-2 and Landsat-8 images | Kappa = 90.00 Kappa = 82.00 Kappa = 78.00 |
| [93] | U-Net | PlanetScope dataset, dissimilarity, NDVI, and land cover map data | F1-score = 93.80 |
| [95] | U-Net | Sentinel-2 imagery data of the Indonesia and Central Africa regions | F1-score = 92.00 |
| [96] | Burnt-Net | Post-fire Sentinel-2 images | Accuracy = 98.08 |
| [97] | U-Net | 227 satellite images and their corresponding binary masks | Jaccard = 93.00 |
| [98] | U-Net | Satellite burned area dataset (73 images) | Accuracy = 94.30 |
| [100] | Deep residual U-Net | Sentinel-2 MSI time series and Sentinel-1 SAR data | F1-score = 84.23 |
| [101] | BA-Net | VIIRS Active Fires data, VIIRS Level 1B data, MCD64A1C6, FireCCI51, Landsat-8 53 scenes, FireCCISFD11 dataset, MTBS dataset, TERN AusCover data, ICNF Burned Areas | Dice = 92.00 |
| Ref. | Methodology | Dataset | Results (%) |
|---|---|---|---|
| [162] | FireCast | GeoMAC, Landsat data, and atmospheric and weather data | Accuracy = 87.70 |
| [164] | AllConvNet | Wildfire burn data from the Victoria Australia region during 2006 and 2017, topography data (slope, elevation, and aspect), weather data (rainfall, humidity, wind direction, wind speed, temperature, solar radiation, and lighting flash density), proximity to anthropogenic interface (distance to the power line and distance to roads), and fuel information (fuel moisture, fuel type, and emissivity) | Accuracy = 58.23 |
| [169] | DCIGN | Vegetation information (canopy height, canopy cover, and crown ratio), fuel model, moisture information (100-h moisture, 10-h moisture, 1-h moisture, live woody moisture, and live herbaceous moisture), wind information (north wind and east wind), elevation, and initial burn map | F1-score = 93.00 |
| [170] | BPNN, RNN, and LSTM | Eleven points of meteorological data: minimum temperature, mean temperature, maximum temperature, cooling degree days, total rain, total precipitation, heating degree days, total snow, speed of maximum wind gust, snow on ground, and direction of maximum wind gust | Accuracy = 90.90 |
| [171] | FU-NetCast | Fire perimeter, landsat data, DEM, and climate data | Accuracy = 92.73 |
| [172] | FU-NetCastV2 | GeoMAC data: 400 fire perimeters from 2013 to 2019 | Accuracy = 94.60 |
| [173] | Deep CNN | Environmental data, map data of Corsica | MAPE = 32.80 |
| [174] | U-Net | LANDFIRE 2.0.0 database, GEO satellite imagery, and fire perimeters data | Precision = 90.00 |
| Ref. | Data Name | Data Type | Spatial Resolution | Patch Size |
|---|---|---|---|---|
| [50,51] | USTC_SmokeRS | 6225 satellite images | 1 km | 256 × 256 |
| [69,70] | LAFD | 8194 satellite images of wildfires collected by Landsat-8 around the world in August 2020; 146,214 image patches, consisting of 10-band spectral images and associated results; 9044 image patches extracted from thirteen Lansdsat-8 images captured in September 2020, as well as their corresponding masks | 30 m 10 m | 256 × 256 |
| [42,49] | CBERS 04A WFI | 775 RGB images collected by the WFI sensor on board the CBERS 04A satellite between May 2020 and August 2020 in the Brazilian Pantanal areas | 5 m | 256 × 256 |
| [62,64] | FASDD | 310,280 images covering numerous regions: Canada (5764 images), America (8437 images), Brazil and Bolivia (6977 images), Greece and Bulgaria (10,725 images), South Africa (9537 images), China (624 images), Russia (2111 images), and Australia (266,069 images); 5773 labeled images (format JSON, XML, and text) | 10 m 30 m | 1000 × 1000 2200 × 2200 |
| Ref. | Data Name | Data Type | Spatial Resolution | Labeling Type |
|---|---|---|---|---|
| [25] | Landsat-8 satellite imagery | Imagery data | 15 m 30 m | Mapping |
| [66] | DEM | Elevation | 20 m | Mapping |
| [102] | VIIRS Level 1B | Imagery data, fire location | 375 m 750 m | Mapping |
| [58] | VIIRS Active Fire | Imagery data, fire location | 375 m | Mapping |
| [175] | MapBiomas Fire | Maps of burned areas for Brazil between 1985 and 2020, annual land cover and land use | 30 m | Mapping |
| [94] | PlanetScope | Images collected from 130 CubeSat 3U satellites | 3 m | Mapping |
| [103] | MCD64A1 C6 | Burn date, quality assurance, burn data uncertainty, and the first and last days of the year for reliable change detection | 500 m | Mapping |
| [94,97] | Burned areas in Indonesia | 227 images with a resolution of 512 × 512 pix collected from Indonesia’s regions between 2019 and 2021, and their corresponding ground truth images | 30 m | Mapping |
| [66] | Weather and atmospheric data | Atmospheric pressure, wind direction, temperature, precipitation, dew point, relative humidity, and wind speed | 1 km | Mapping Prediction |
| [98,99] | Satellite burned area | 73 wildfire images collected by Sentinel-2 L2A satellite from 2017 to 2019 in Europe regions, their binary masks, and the annotation of five severity damage levels | 10 m | Mapping Prediction |
| [176,177] | GeoMAC | Fire perimeter, fire location | NS | Prediction |
| [178] | GlobFire | Initial date of fire, final date of fire, fire perimeter, and burned area | NS | Prediction |
| [179,180] | Wildfires | Weather data (land surface temperature), ground condition (NDVI), burned areas, and wildfire indicators (thermal anomalies) | 250 m 500 m 1 km | Prediction |
| [181,182] | WildfireDB | Historical wildfire occurrence from 2012 to 2017; vegetation data (the maximum, median, sum, minimum, mode, and count values of canopy base density, canopy height, canopy cover, canopy base height, and existing vegetation height and cover); topography data (slope and elevation); weather data (total precipitation, maximum, average, and minimum temperature, relative wind speed, and average atmospheric pressure) | 30 m 375 m | Prediction |
| [147,183] | Sentinel-2 | Various samples collected in various regions of Europe by Copernicus EMS with a resolution of 5000 × 5000 × 12 and classified according to the wildfire damage level | 10 to 60 m | Prediction |
| [137,184] | TerraClimate | Climatic data from 1958 to present, including minimum and maximum temperature, precipitation, solar radiation, wind speed, climatic water deficit, vapor pressure, and reference evapotranspiration | <5 km | Prediction |
| [118] | Datacube | 19 features: max and min 2 m temperature, precipitation, LAI, Fpar, day and night LST, EVI, NDVI, min and max u-/v-component of wind, CLC, slope, elevation, aspect, population and road density | 1 km | Prediction |
| [165] | GEODATA DEM-9S | Ground level elevation points for all of Australia: slope, elevation, and aspect data | 1 km | Prediction |
| [166,167] | Vicmap | Distance to anthropogenic interfaces in Victoria: distance to roads and distance to power lines | 250 m | Prediction |
| [168] | Dynamic land cover | Land cover, vegetation cover, and land use information of Australia | 250 m | Prediction |
| [107,150] | MTBS | Post-fire and pre-fire Landsat Top of Atmosphere images, dNBR images, perimeter mask, RdNBR images, thematic fire severity from 1984 to 2021, and fire location | 30 m | Prediction |
| [75] | CALFIRE | Records of perimeters of forest fires collected in the state of California between the years 1950 and 2019 | 10 m | Prediction |
| [185] | GFEDv4 | Estimated monthly burned area, fractional contributions of different fire types, and monthly emissions, 3-hourly or daily fields, monthly biosphere fluxes | 27.8 km | Prediction |
| [186] | LANDFIRE 2.0.0 | Fuel data, vegetation data, and landscape disturbances and changes (wildland fire, storm damage, fuel and vegetation treatments, insects, disease, and invasive plants) | 30 m | Prediction |
| [156] | SeasFire Cube | Historical burned area and wildfire emissions between 2001 and 2021, meteorological data (humidity, direction of wind, wind speed, average/max/min temperature, solar radiation, total precipitation, etc.), human-related variables (population density), oceanic indices, vegetation data (LAI, land cover, etc.), and drought data | 27.8 km | Prediction |
| [79,187] | NWDS | 18,455 fire samples during 2012–2020, previous fire mask, fire mask, and 2D fire data with numerous variables such as vegetation (NDVI), population density, weather (wind direction, wind speed, humidity, precipitation, maximum/minimum temperature), topography (elevation), drought index, and energy release component | 1 km | Prediction |
| [126] | FireCube | Avg/min/max 2 m dewpoint temperature, avg/max relative humidity, avg/max/min surface pressure, avg/max/min total precipitation, avg/max/min 10 m V wind component, avg/max/min 10 m U wind component, avg/max/min 2 m temperature, 8 day evapotranspiration, FPAR, FWI, rasterized ignition points, LAI, day/night land surface temperature, wind direction of maw wind, max wind speed, daily number of fires, soil moisture index, soil moisture index anomaly, aspect, elevation, population density (2009–2021), distance from roads, roughness, slope, and distance from waterways | 1 km | Prediction |
| Task | Ref. | Data Augmentation Techniques |
|---|---|---|
| Fire detection | [38] | Horizontal/vertical flip |
| [68] | Rotation, shift, flip, mirroring, and random chromatic distortion in HSV color | |
| [76] | Horizontal/vertical flip | |
| [80] | Crop and horizontal/vertical mirroring | |
| [87] | Brightness, rotation, shift, contrast, and scale | |
| Fire mapping | [90] | Resize, mirror, rotation, aspect, crop, and color jitter |
| [93] | Rotation, mirror, and horizontal/vertical flip | |
| [97] | Rotation | |
| [98] | Rotation, shear, and vertical/horizontal flip | |
| Fire damage prediction | [144] | Horizontal/vertical flip, rotation, and shear |
| [150] | Vertical/horizontal flip |
Disclaimer/Publisher’s Note: The statements, opinions and data contained in all publications are solely those of the individual author(s) and contributor(s) and not of MDPI and/or the editor(s). MDPI and/or the editor(s) disclaim responsibility for any injury to people or property resulting from any ideas, methods, instructions or products referred to in the content. |
© 2023 by the authors. Licensee MDPI, Basel, Switzerland. This article is an open access article distributed under the terms and conditions of the Creative Commons Attribution (CC BY) license (https://creativecommons.org/licenses/by/4.0/).
Share and Cite
Ghali, R.; Akhloufi, M.A. Deep Learning Approaches for Wildland Fires Using Satellite Remote Sensing Data: Detection, Mapping, and Prediction. Fire 2023, 6, 192. https://doi.org/10.3390/fire6050192
Ghali R, Akhloufi MA. Deep Learning Approaches for Wildland Fires Using Satellite Remote Sensing Data: Detection, Mapping, and Prediction. Fire. 2023; 6(5):192. https://doi.org/10.3390/fire6050192
Chicago/Turabian StyleGhali, Rafik, and Moulay A. Akhloufi. 2023. "Deep Learning Approaches for Wildland Fires Using Satellite Remote Sensing Data: Detection, Mapping, and Prediction" Fire 6, no. 5: 192. https://doi.org/10.3390/fire6050192