Article

Evaluating Traffic Operation Conditions during Wildfire Evacuation Using Connected Vehicles Data

1
Department of Civil, Construction and Environmental Engineering, North Dakota State University, Fargo, ND 58102, USA
2
Department of Transportation, Logistic and Finance, North Dakota State University, Fargo, ND 58102, USA
*
Author to whom correspondence should be addressed.
Fire 2023, 6(5), 184; https://doi.org/10.3390/fire6050184
Submission received: 12 April 2023 / Revised: 26 April 2023 / Accepted: 28 April 2023 / Published: 1 May 2023
(This article belongs to the Special Issue Advances in Forest Fire Behaviour Modelling Using Remote Sensing)

Abstract

:
With climate change and the resulting rise in temperatures, wildfire risk is increasing all over the world, particularly in the Western United States. Communities in wildland–urban interface (WUI) areas are at the greatest risk of fire. Such fires cause mass evacuations and can result in traffic congestion, endangering the lives of both citizens and first responders. While existing wildfire evacuation research focuses on social science surveys and fire spread modeling, they lack data on traffic operations during such incidents. Additionally, traditional traffic data collection methods are unable to gather large sets of data on historical wildfire events. However, the recent availability of connected vehicle (CV) data containing lane-level precision historical vehicle movement data has enabled researchers to assess traffic operational performance at the region and timeframe of interest. To address this gap, this study utilized a CV dataset to analyze traffic operations during a short-notice evacuation event caused by a wildfire, demonstrating that the CV dataset is an effective tool for accurately assessing traffic delays and overall traffic operation conditions during the selected fire incident. The findings also showed that the selected CV dataset provides high temporal coverage and similar travel time estimates as compared to an alternate method of travel time estimation. The study thus emphasized the importance of utilizing advanced technologies, such as CV data, to develop effective evacuation strategies and improve emergency management.

1. Introduction

Natural disasters have become more common and costly in recent years. Extreme and no-notice disasters, defined as events that occur with little to no official warning, pose a significant threat to human life, property, and the integrity of the ecosystem. These catastrophic damages are often caused by wildfires, which are uncontrolled fires that spread quickly in the presence of extreme weather conditions such as dry vegetative fuel, severe drought, high wind, and steep topography. Unfortunately, because of climate change, these conditions are becoming more common, particularly in the Western United States [1,2]. Large-scale wildfires can cause mass evacuations, which can create social disruption, long-term infrastructure damage, and injuries or deaths of evacuees and first responders [3,4].
Additionally, communities living near undeveloped wildland or vegetative fuels, constituting wildland–urban interface (WUI) zones, are most vulnerable to fire due to proximity to flammable vegetation and limited egress routes [5,6]. Many of these communities are experiencing rapid population growth, but the traffic infrastructure and the number of exits are unable to keep up with the rising traffic demand, putting the lives of residents at risk [7].
In the event of an emergency evacuation, such as in WUI areas, having a reliable transportation system is necessary. It gives residents safe passage out of the affected area and provides essential access for first responders to reach the impacted region in time. Large-scale hazardous events (such as wildfires, tornadoes, hurricanes, earthquakes, floods, or chemical spills) often require mandatory evacuation of residents [8]. In these situations, the amount of time available for evacuation is critically important, especially in the event of a wildfire, where evacuees must watch out for smoke, flying debris, and burning flames as well as avoid conflict with emergency services [9,10]. The population density and traffic infrastructure of the area affected by the fire also have a significant impact on the safe and well-planned evacuation of people. When there is a sudden evacuation, high-density areas can result in increased traffic congestion and longer vehicular queues on the exiting routes, endangering the lives of stranded evacuees [11,12]. The response of the local authorities and first responders is also considered important in determining the behavior of residents during an evacuation. Pre-evacuation warnings and explicit instructions from emergency personnel can help evacuees to make thoughtful decisions about the fire risk and safely leave the affected area [13,14]. Additionally, the population’s demographics, including the size of the household, income, level of education, ownership of a car or home, ethnicity, and previous experience with mass evacuations can have a significant impact on the evacuation rate [15,16].
Currently, most of the research on wildfire evacuation focuses on conducting human behavioral studies using social science-based surveys to identify the aforementioned factors that affect the household’s decision to evacuate or not, with a few focusing on wait-and-see decisions [17]. Over the years, several evacuation behavior models and techniques have been developed to simulate individuals’ decision-making during emergency evacuations [18]. These include descriptive analysis, binary choice models, multinomial logistics models, latent choice models, and logistic regressions analysis evaluating factors such as demographic characteristics, risk perception, official orders, beliefs, and attitudes regarding wildfire risk, and waiting behavior during evacuation [19,20,21,22,23,24,25,26,27,28,29]. However, these studies lack the necessary information regarding evacuation traffic movement and individual or collective driving behavior during WUI fires.
In addition to studies on human behavior about evacuation decision-making, fire spread models have been developed to ascertain the location and severity of the fire, and its impact on evacuation [30]. Rothermel 1972 developed a semi-physical model using mathematical equations to forecast fire intensity and spread rates based on empirical wildfire spread data [31]. The elliptical fire shape model has been widely used to simulate the rates at which fire spread on a two-dimensional plane [32]. Some fire growth models are used to simulate the spread of fire in landscape areas [33]. Fire spread models are also combined with geographic information systems (GIS) for the identification of fire trigger points to derive a buffer around a place based on the shortest path algorithm. This is used to determine the time needed for the firefighting crew to move to shelter areas [34], plan staged evacuation of residents [35], and incorporate warning dynamics and fire propagation into simulation models [36]. However, these models only consider the decision-maker’s judgment and lack a systematic estimation of evacuation time [37].
Understanding the impact of fire ignition and rate of spread on the residents’ evacuation behavior is important, but it is also critical to comprehend the functioning of the transportation system to aid in the prompt and timely evacuation of people. Existing studies on assessing the effectiveness of transportation systems and determining evacuation clearance times integrate behavioral presumptions with fire spread and traffic simulation models. Beloglazo et al., (2016) estimated wildfire evacuation clearance times using SUMO traffic simulation software that took into account fire propagation and human response to various time-based evacuation advisories. However, it failed to incorporate the traffic demand under different times of the day and the drivers were not permitted to switch to different routes even during significant traffic delays [36]. Li et al. (2019) calculated evacuation time in MATSim microscopic traffic simulation model and coupled the results with the fire spread model and GIS to determine the location of fire buffers. However, the travel time estimation was made assuming that all residents would comply with the evacuation and would be present at their homes at the time of the evacuation [37] Similarly, Cova et al., 2002 estimated evacuation time in Paramics microsimulation platform considering Poisson distribution of vehicles which lacked the necessity to consider variation in travel demand under various times of the day or home occupancy [38]. Thus, existing research on WUI fires lacks empirical data on traffic movement and clearance time during evacuation [17].Therefore, there is a need to obtain historical traffic data on wildfire evacuation to better prepare for future hazardous events.
Over time, several traffic data collection technologies have been developed that are able to collect a broad range of traffic flow information such as vehicle type, traffic volumes, travel time, speed, road user classification, and traffic signal control [39]. Earlier, travel time data from a subset of vehicles were gathered manually using techniques such as driving a single vehicle along a corridor, but those methods were expensive and made it challenging to obtain statistically significant sample sizes [40]. Inductive loop detectors have been widely used to collect basic traffic information such as traffic volume and spot speed, but they lack the ability to easily estimate travel time since they mostly collect point measurement data [41]. Automated vehicle identification (AVI) systems are used at toll facilities to detect toll tags on vehicles at various locations and estimate travel time based on the arrival at each location. However, the accuracy of vehicle detection can be affected by physical obstruction, misleading toll tags, and placement distance from the road [42].
With the advancement in sensing technology, optical cameras are installed at different locations that capture images of license plates of vehicles and use video image processing and license plate matching at different locations to calculate travel times. However, they require a direct line of sight to the license plate to minimize visual obstructions that can also be impacted by weather conditions [43]. While the aforementioned travel time data collection methods can produce accurate travel time estimates if the sample size is sufficiently large and unbiased, they are more expensive and may require the installation of new types of sensors and hence are not feasible for deployment in urban areas [41].
More recently, Bluetooth and Wi-Fi technologies are becoming popular for gathering traffic data because they are inexpensive and easy to install. However, due to their limited detection range and accuracy, these technologies are not considered to be a practical means to obtain high-fidelity traffic data [44]. The advancement in traffic signal control operations has introduced the collection of high-resolution traffic signal controller data using automated traffic signal performance measures (ATSPM) that have been deployed at traffic signals by state agencies to collect various traffic performance measures [45]. This system can collect real-time and historical traffic signal data that can be used to improve traffic signal and corridor operations, and for support and validation of other existing and emerging traffic data collection technologies [46].
Over the last decade, large sets of data about human mobility, facilitated by extensive use of sensors, such as Global Positioning System (GPS) devices in many modes of transportation and mobile phones, have become the fundamental component of the new paradigm of smart cities [47]. Detailed information about a driver’s location, speed, and other information can be gathered from a person’s mobile device or vehicle by a public or private entity that can be used to obtain travel times [48]. Many independent third-party companies compile large amounts of crowdsourced data and provide high-quality real-time traffic information (such as Waze [49], INRIX [50], TomTom [51], and HERE [52]). Moreover, modern vehicles called connected vehicles (CV) produced by leading automobile manufacturers, are equipped with sensors that record temporal and spatial information about the vehicle trajectory and the surrounding environment, and transmit it to the cloud computing databases [53]. Several big data companies have also emerged (such as Otonomo (Otonomo: https://otonomo.io/, accessed on 10 February 2023), Wejo (Wejo data services: https://www.wejo.com/, accessed on 10 February 2023) who segregate and normalize historical CV data and share that with vehicle manufacturers, researchers, and technology developers for research and development [54]. For instance, Wejo has partnered with multiple global automobile manufacturers that record vehicle trajectory data from vehicle onboard sensors. The data are collected at a 3 s interval and each data point is recorded within a 3 m radius with an accuracy of 95%. Each of these data points includes a unique identifier, the location of the data point, a timestamp, the speed of the vehicle, and its direction of movement.
Although this anonymized CV dataset has recently become available to explore historical traffic patterns at the location of interest, several researchers have already tested Wejo’s vehicle movement dataset. Li et al., (2021) estimated border crossing time at Paso del Norte International Bridge in El Paso, TX using Wejo’s connected vehicle dataset and observed a correlation rate of around 0.8 with the existing Bluetooth-generated border crossing time information system. They also discovered that the temporal coverage rate of Wejo’s dataset was around 60–70% for estimating border crossing time at the selected site [55]. In another study, Desai et al., (2021) used this dataset to study the impact of interstate construction work zone diversions on traffic signal performance measures [56] Khadka et al., (2022) identified queue propagation at freeway bottlenecks and arterial traffic intersections using this CV data [57]. Furthermore, Saldivar-Carranza et al. (2021) estimated operational performance measures for various traffic signals in Indianapolis, and Abdelraouf et al., (2022) developed a sequence-to-sequence deep learning model to forecast traffic volume and speed on four expressways in Orlando, Florida [58,59].
Hence, given the limited availability of empirical data on WUI fire evacuation clearance times and the inability of existing travel data collection technologies to comprehend such data, the CV datasets provide an opportunity to evaluate traffic delays in a historical wildfire event. The travel time information obtained from CV data may provide valuable insights into improving traffic flow and safety, especially during wildfire-triggered emergency evacuations. Emergency managers may utilize this data to strategize and coordinate evacuation routes and timings, pinpoint and resolve potential bottlenecks, and communicate accurate estimates of travel time and recommended evacuation routes to the public [60]. Thus, this paper aims to utilize a CV dataset to calculate the actual travel time during a real-life wildfire incident and compare it with the travel delay information provided by the State. Additionally, the paper evaluates the temporal coverage and similarity of the CV dataset by comparing it with an alternative method of travel time estimation employed in the case study.

2. Materials and Methods
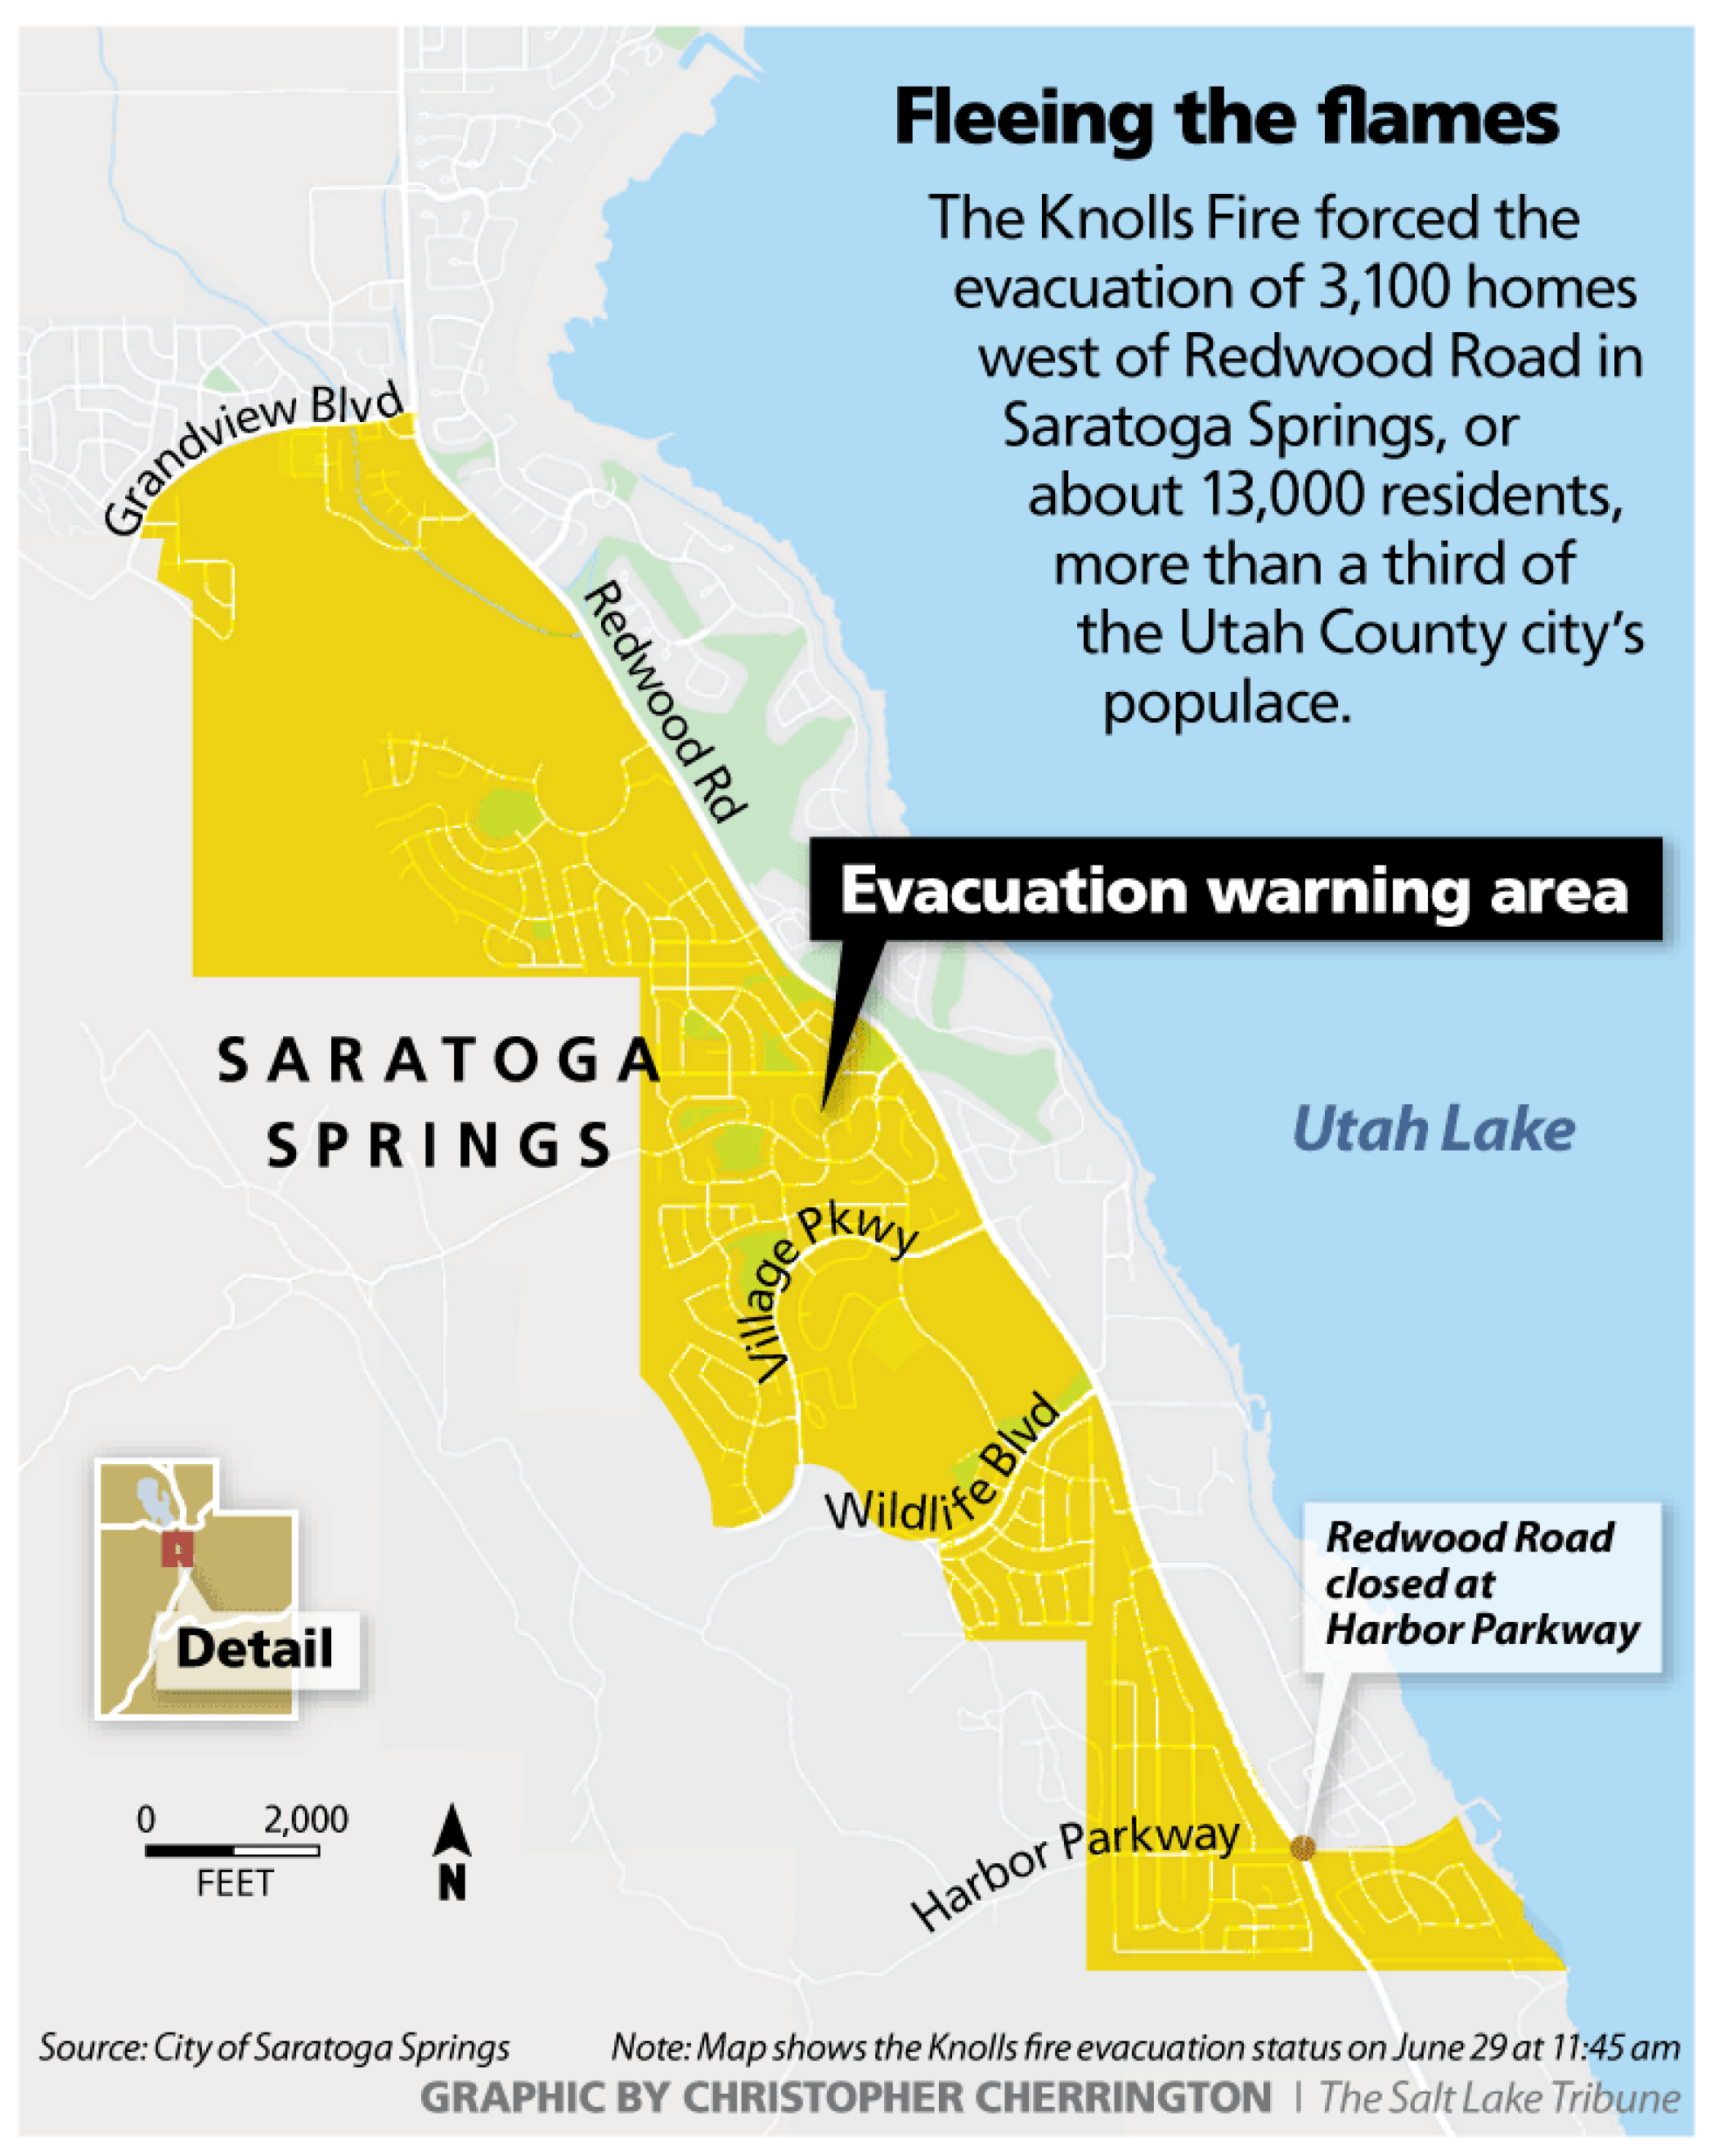
2.1. Case Study

The fire event selected for evaluation was the Knolls Fire 2020 that occurred in Saratoga Springs, Utah on 28 June 2020. The fire erupted between 2:00 pm and 2:30 pm in the east of Lake Mountain and south of Saratoga Springs and spread quickly towards the city driven by 60 mph gusting winds [61]. Saratoga Springs is one of the fastest-growing cities in Utah, with a population density of around 1625 people/sq. mi. [62]. The city is surrounded by Utah Lake on the eastern border and Lake Mountain on the western border with State Route 68 (SR-68) also called “Redwood Road” serving as the main exit corridor for the city. Following the ignition of the fire, mandatory evacuation orders were issued for more than 3100 homes or 13,000 residents, i.e., almost one-third of the population of the whole city [63]. The evacuation began at 2:45 pm, initially in the southern neighborhoods of the city, and residents were forced to evacuate their homes with very short notice amid high winds, smoke, and dust. Later in the afternoon, all residents who lived south of Grandview Boulevard on the west side of Redwood Road were asked to evacuate their homes because of the rapid spread of the fire as can be seen in Figure 1.
The emergency responders used Redwood Road to redirect the evacuation traffic northbound (NB) towards Westlake High School, which served as a shelter area for the affected evacuees. Additionally, due to downed powerlines near the fire perimeter, the road was closed to southbound traffic [65] The evacuation traffic created heavy traffic congestion and vehicular queues on the NB SR-68, especially in the evening period, as detailed in Table 1, which contains operator response notes on the incident obtained from the Utah Department of Transportation (UDOT).

2.2. Data Collection and Processing

In this study, Wejo’s vehicle trajectory data were collected for 10 days from 20–29 June 2020, to evaluate the travel time variation between evacuation and non-evacuation time frames for the selected study area. The definition of key attributes of the dataset is provided in Table 2.
The dataset was delivered in smaller parcels consisting of more than eighty thousand JSON files to Amazon Web Services (AWS) S3 cloud storage which was stored in the local storage using the AWS Command Line Interface (CLI). Initially, the stored JSON files were pre-processed into CSV files and compiled together in MS Excel to create a readable format for later use. Next, to visualize the processed tabular data, it was imported into the ArcGIS Pro software and the location attributes of the data (i.e., latitude and longitude) were utilized to create a feature class of the whole dataset.
The study area for travel time calculation consisted of 5 miles of NB SR-68 roadway between mile markers (MM) 25–30 to analyze the impact of the Knolls Fire on traffic conditions on SR-68. This section of SR-68 consisted of several connecting roads and five traffic signals allowing vehicular traffic to enter and exit the affected neighborhoods. So, the entire city dataset containing more than eleven million data points for the studied time frame was segregated to include only data points for the studied section of SR-68, and the heading attribute of each data point was used to eliminate the traffic heading south.
In this study, the travel time is defined as the hourly average time it takes vehicles to travel from MM 25-30 on SR-68. The travel time of an individual vehicle in the collected dataset is determined by matching the Journey ID identifier at two different locations and taking the difference in the timestamps. Considering that the selected section of SR-68 has several exit options along the way so a vehicle entering SR-68 at any intersection may not travel the entire 5-mile length segment of the road to determine the total travel time of this section. To address this issue, the following process was implemented to obtain more accurate travel time estimates:
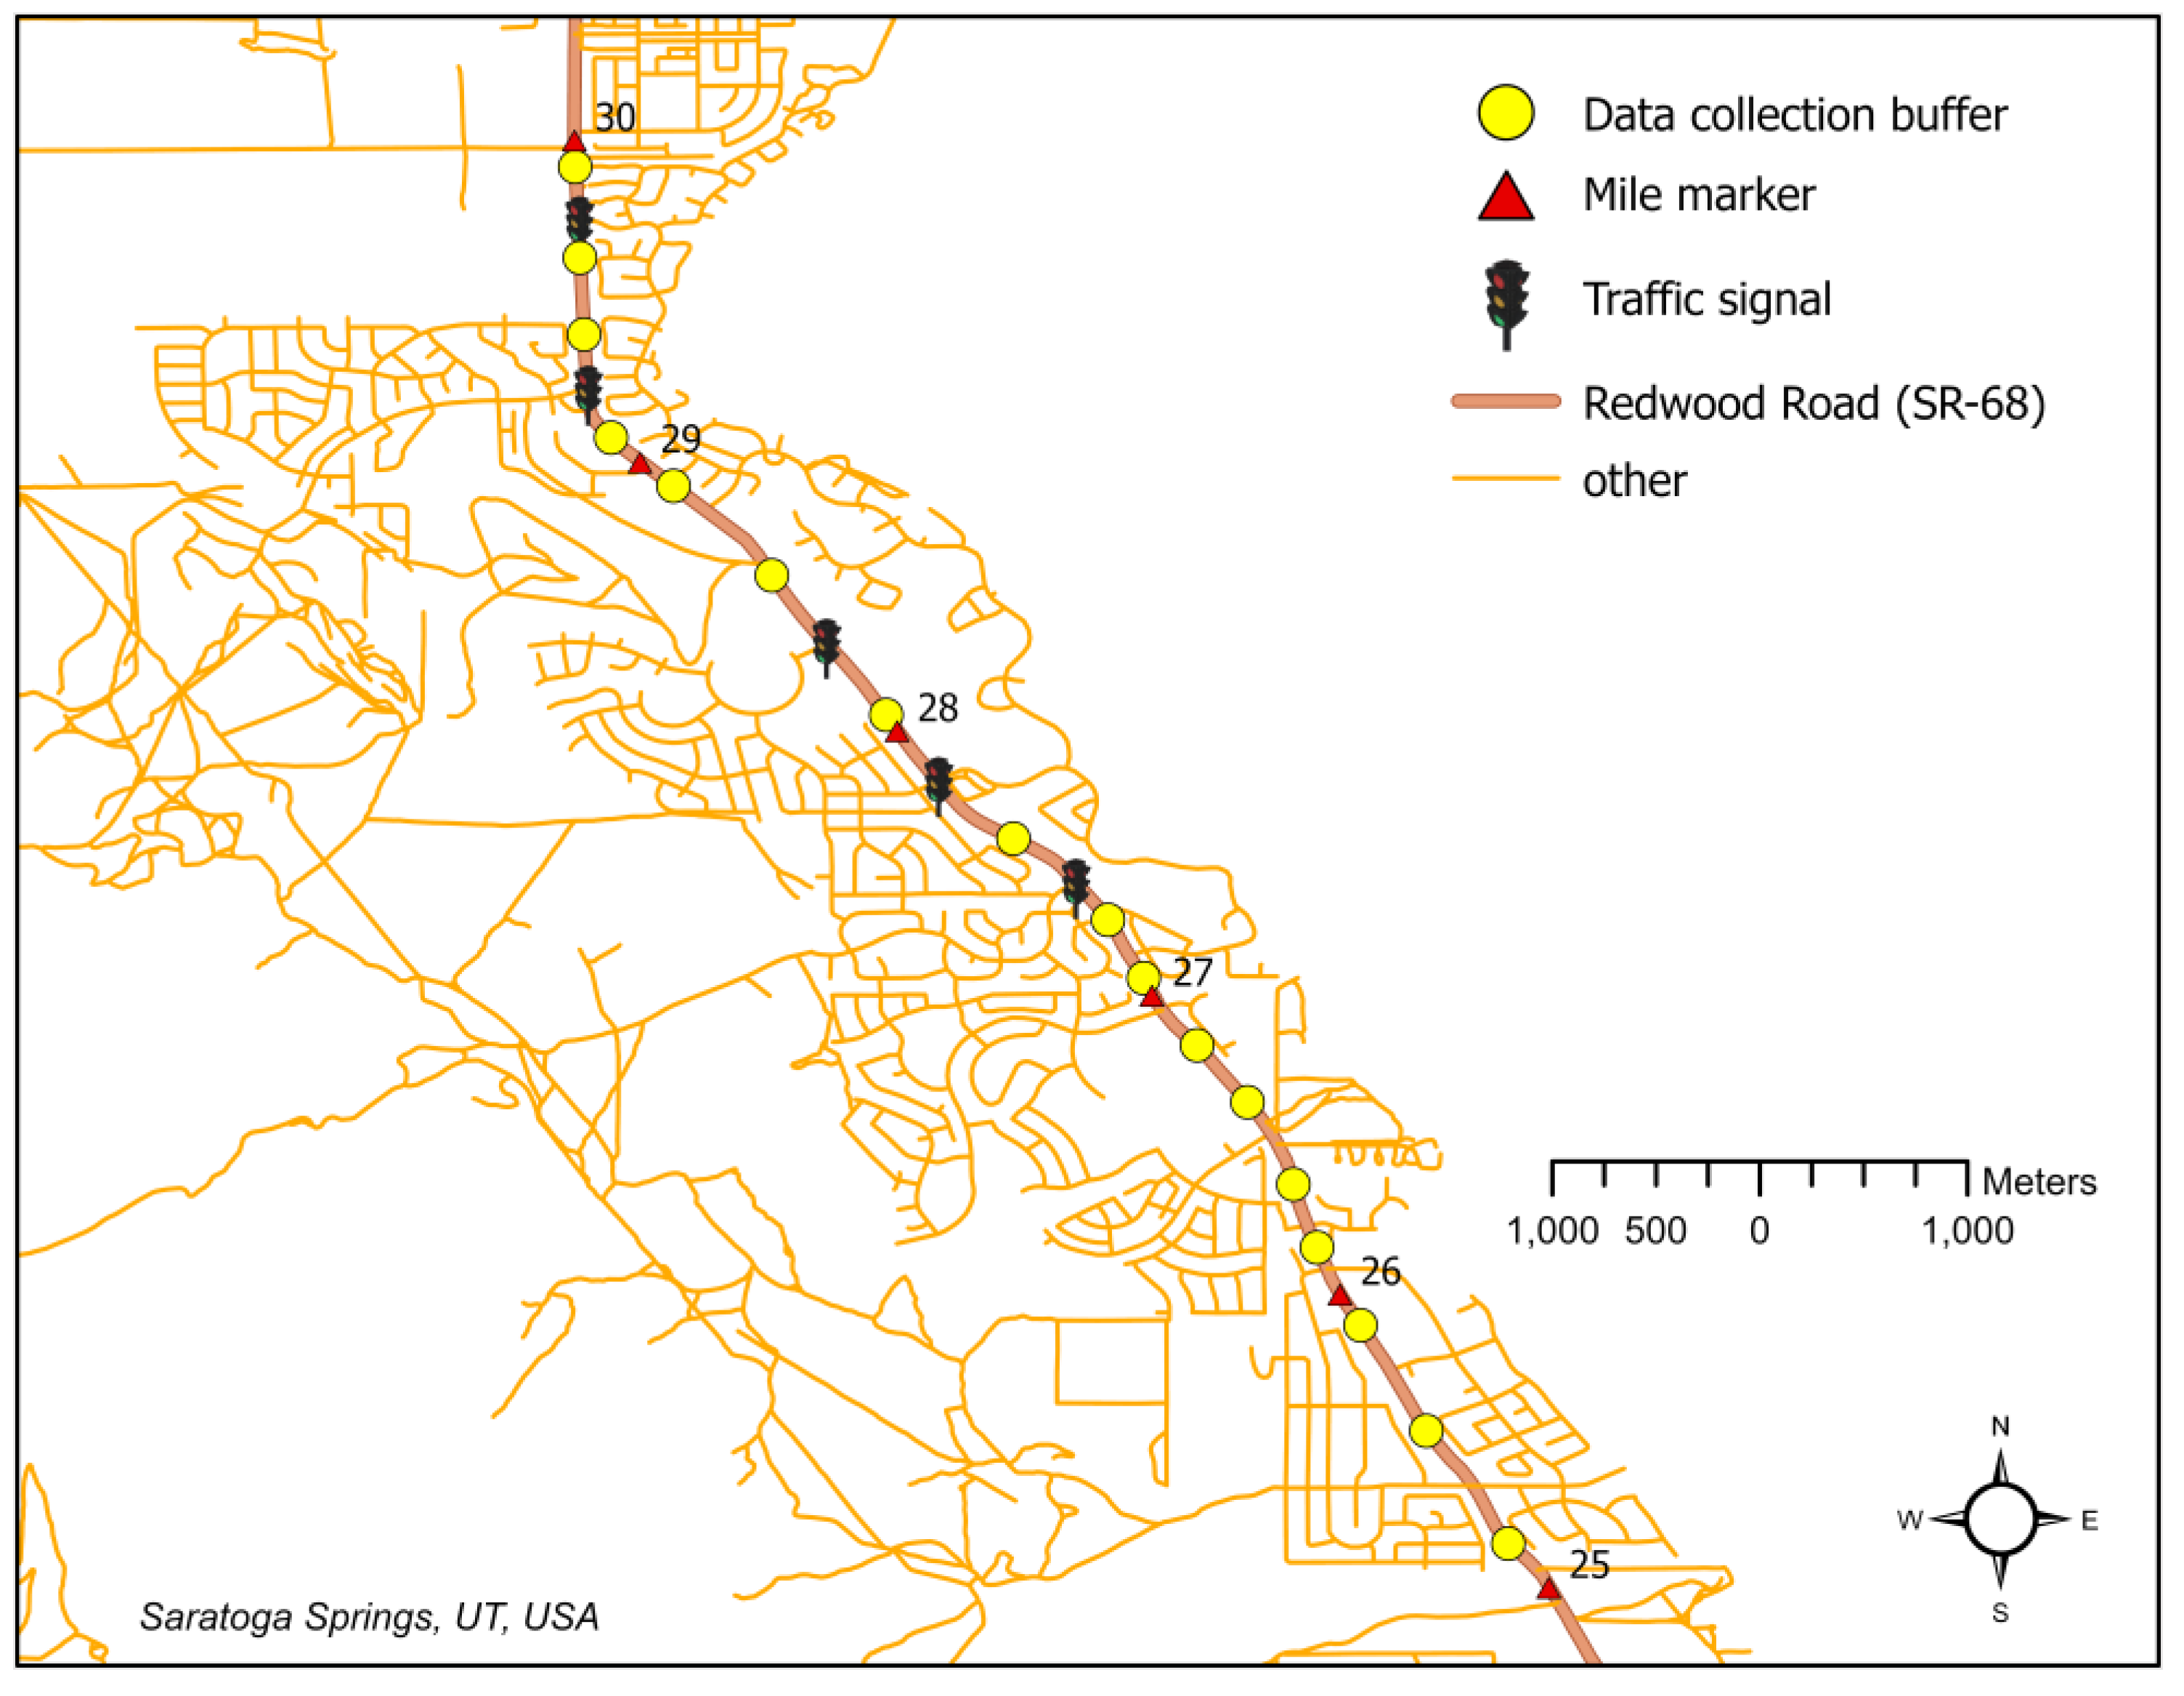
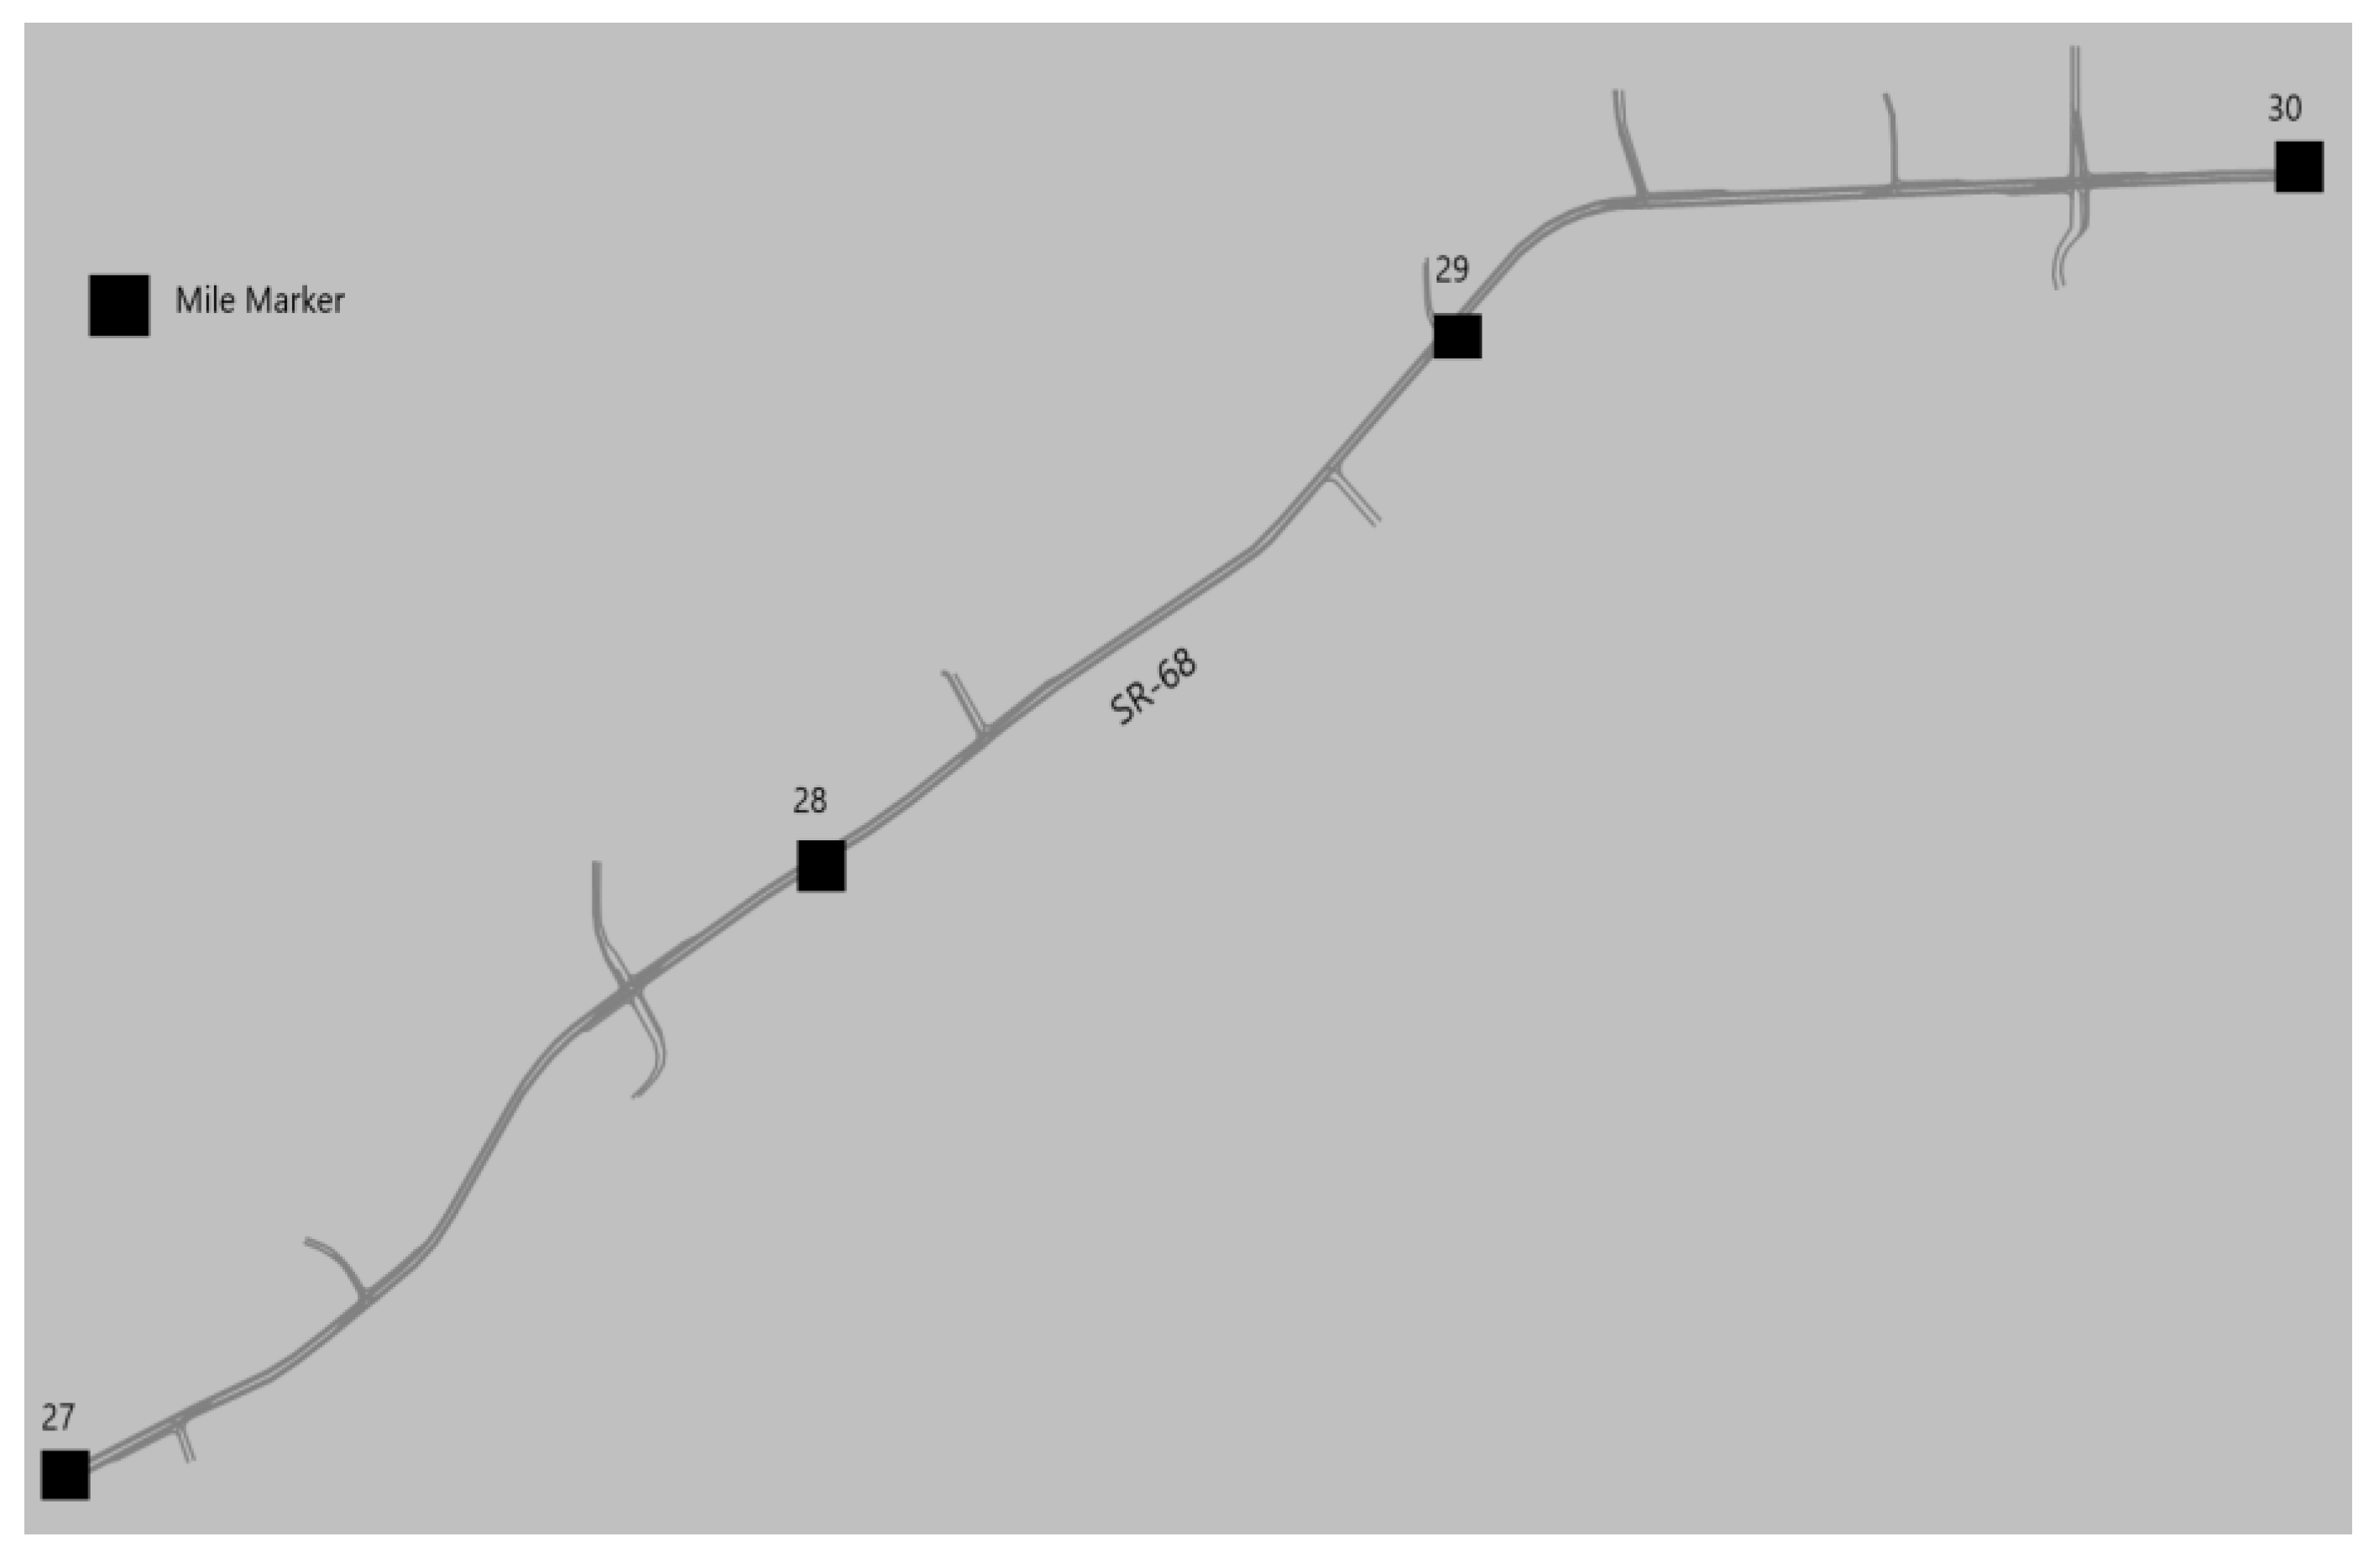
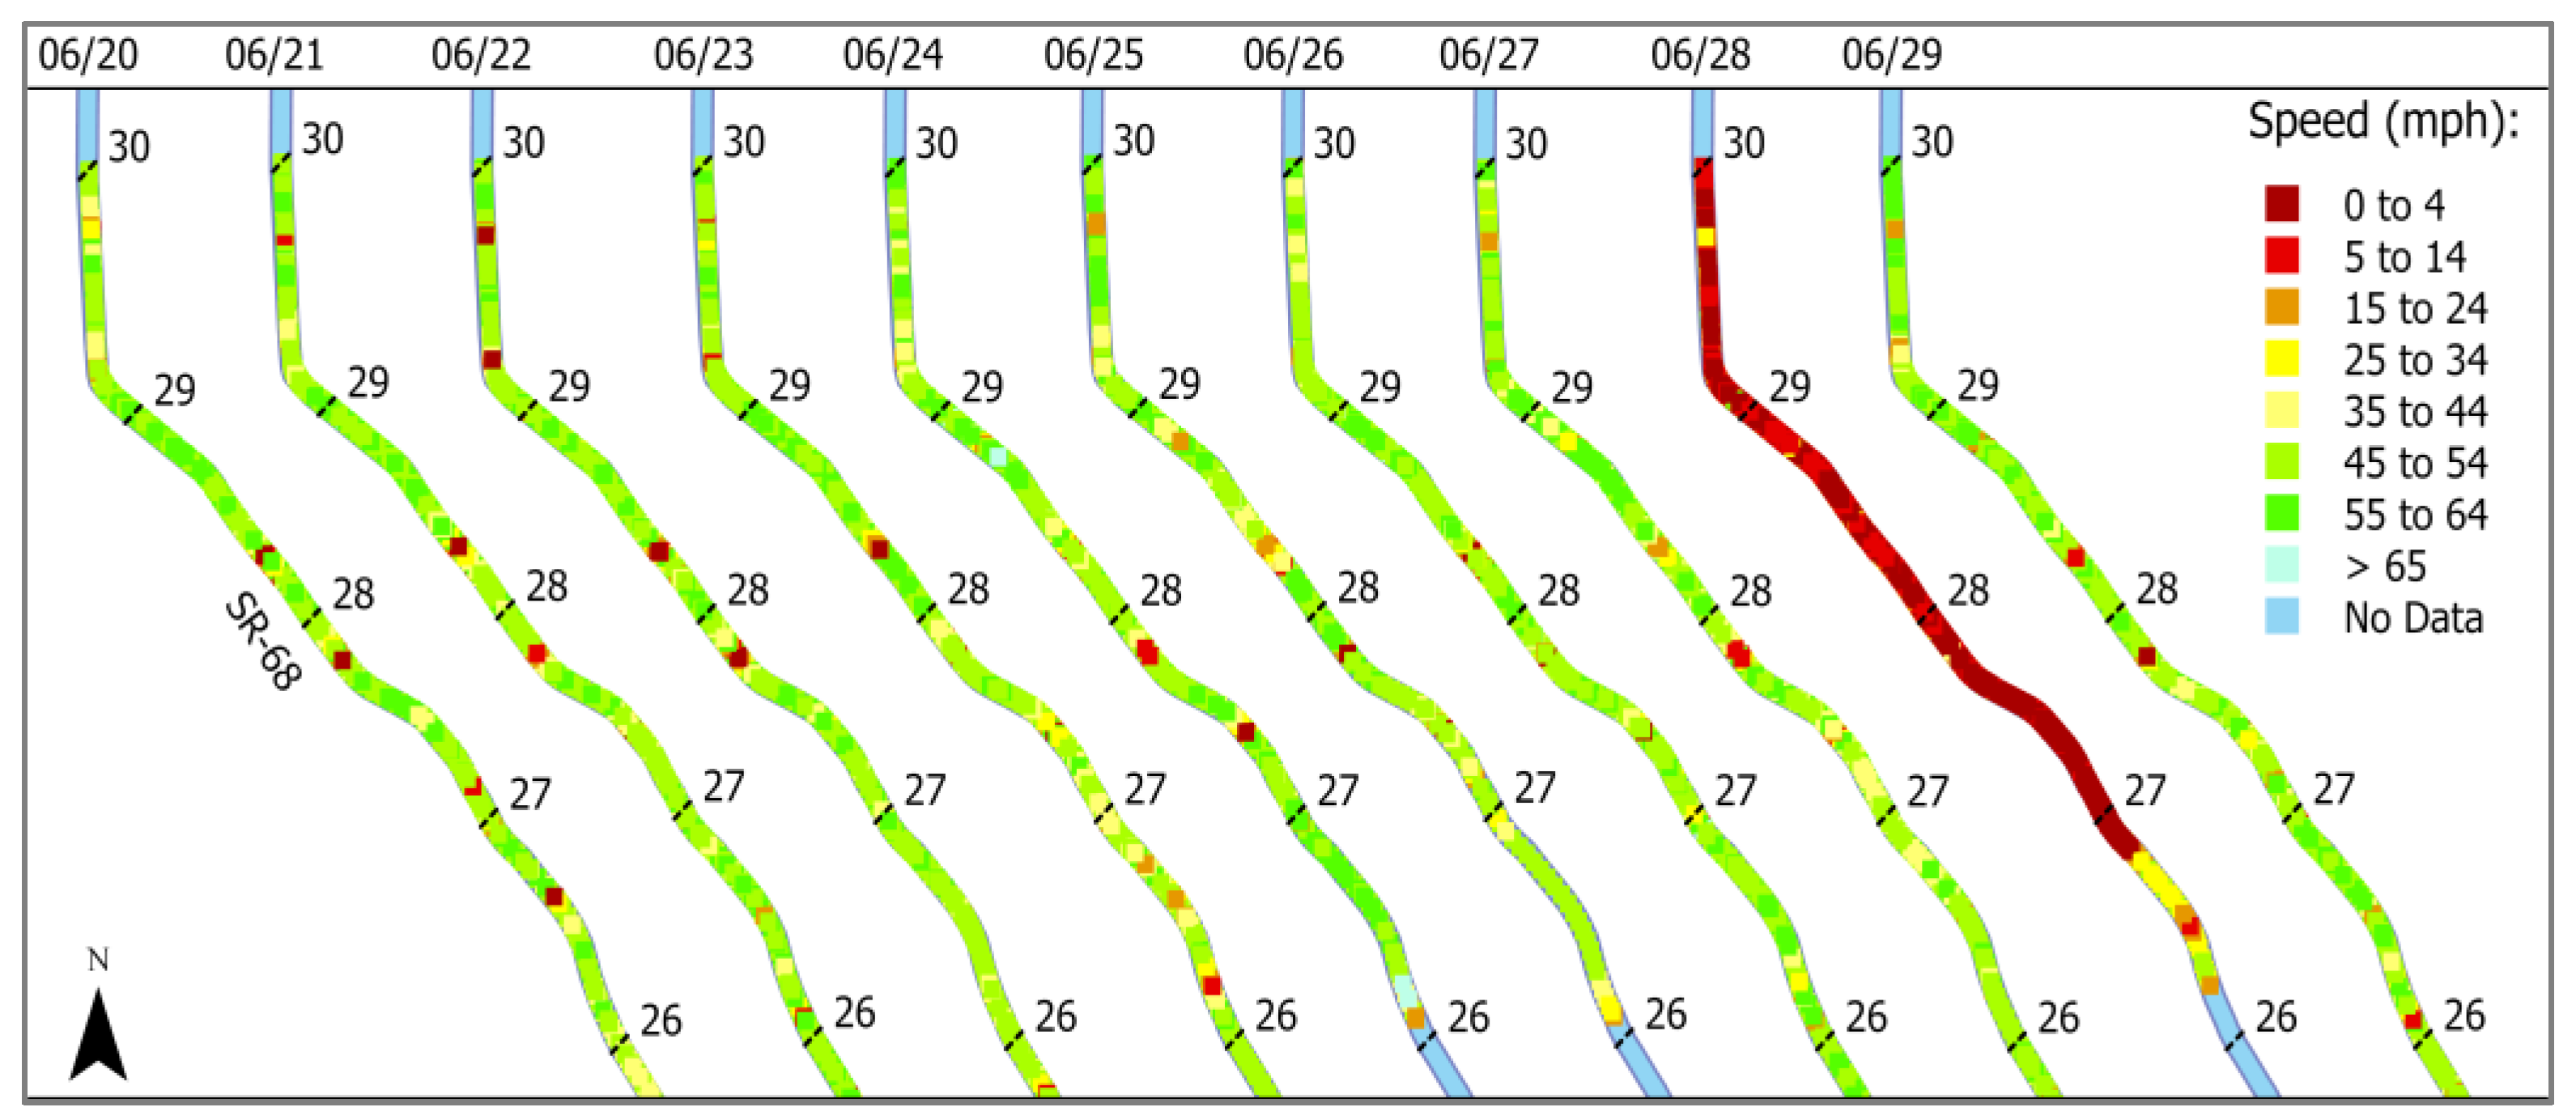
  • The entire NB segment of the road section under consideration was divided into several shorter segments by introducing data collection buffers on SR-68 after each road intersection with the state highway, as illustrated in Figure 2.
  • The diameter of each data collection buffer was assumed to be 500 feet considering that the maximum speed limit along selected section of SR-68 was 55 mph and the data points are collected at a 3 s interval, ensuring that the defined data collection buffers will contain at least one data point for each Journey ID. In case more than one data point for each Journey ID is collected, the earliest data point is selected.
  • For each shorter segment, unique Journey ID identifiers are matched between the two immediate data collection buffers at the two ends of the segment, and the difference in timestamps is calculated for each Journey ID which is then averaged to obtain the hourly average travel time for each shorter segment.
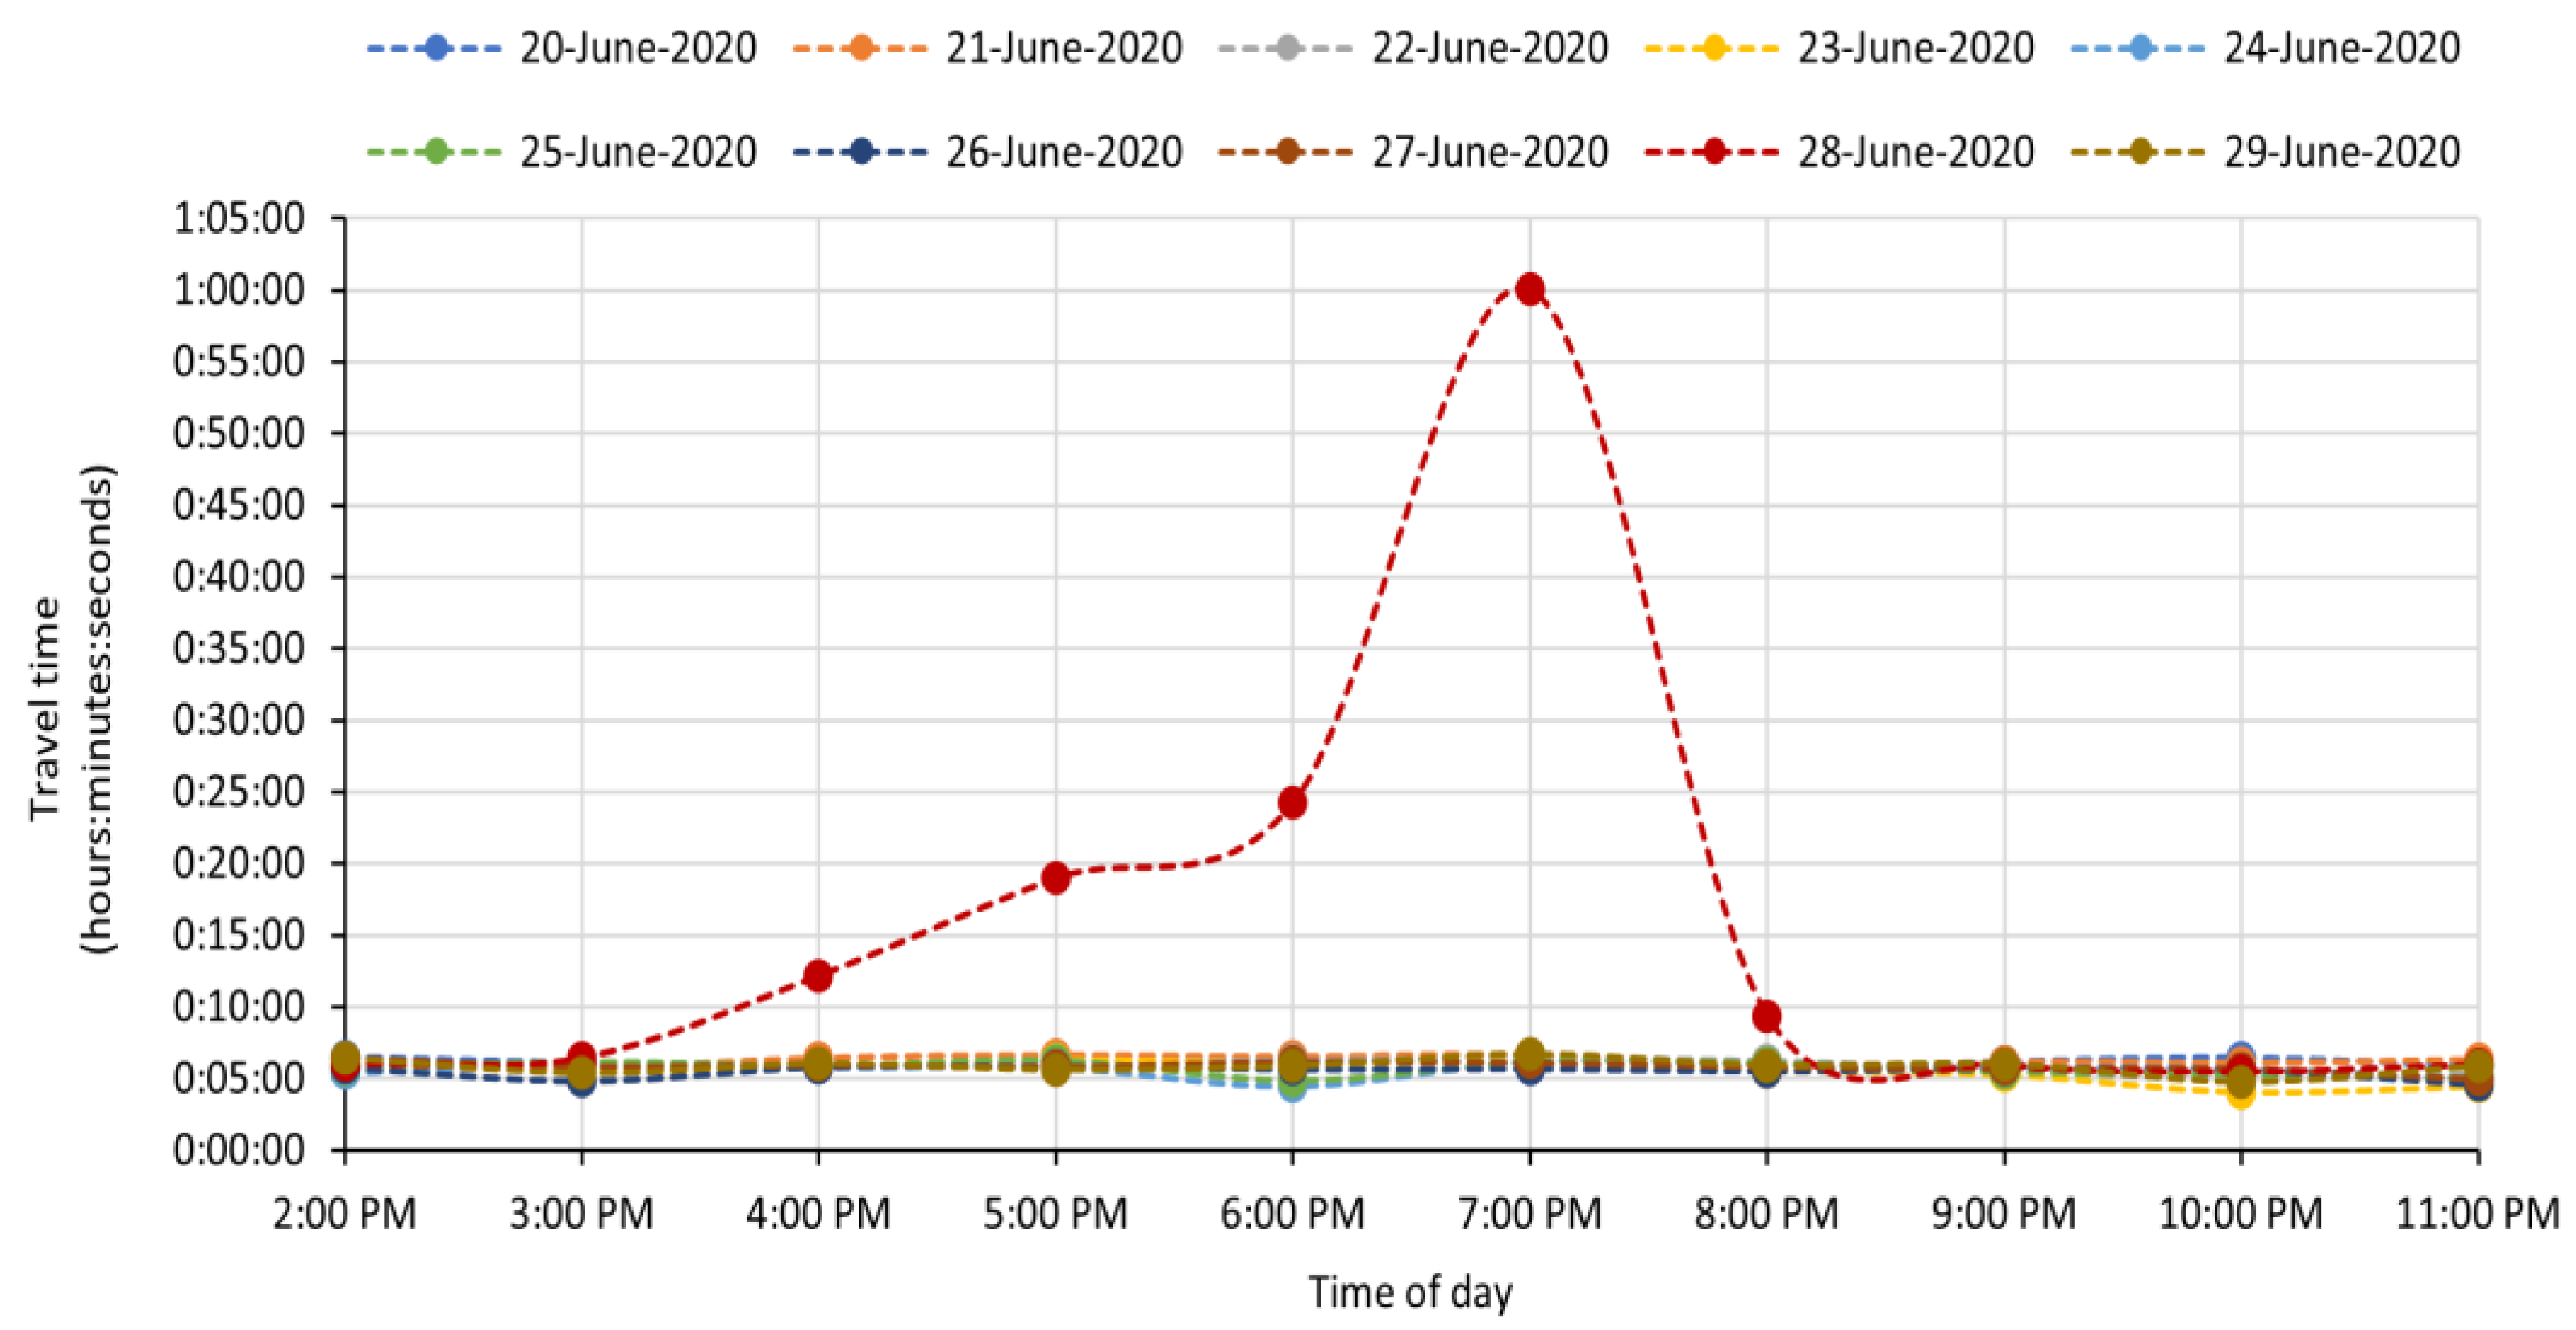
  • The full-length average travel time for each hour is obtained by summing up the hourly average travel time for all shorter segments.

2.3. Assessment of Wejo CV Data

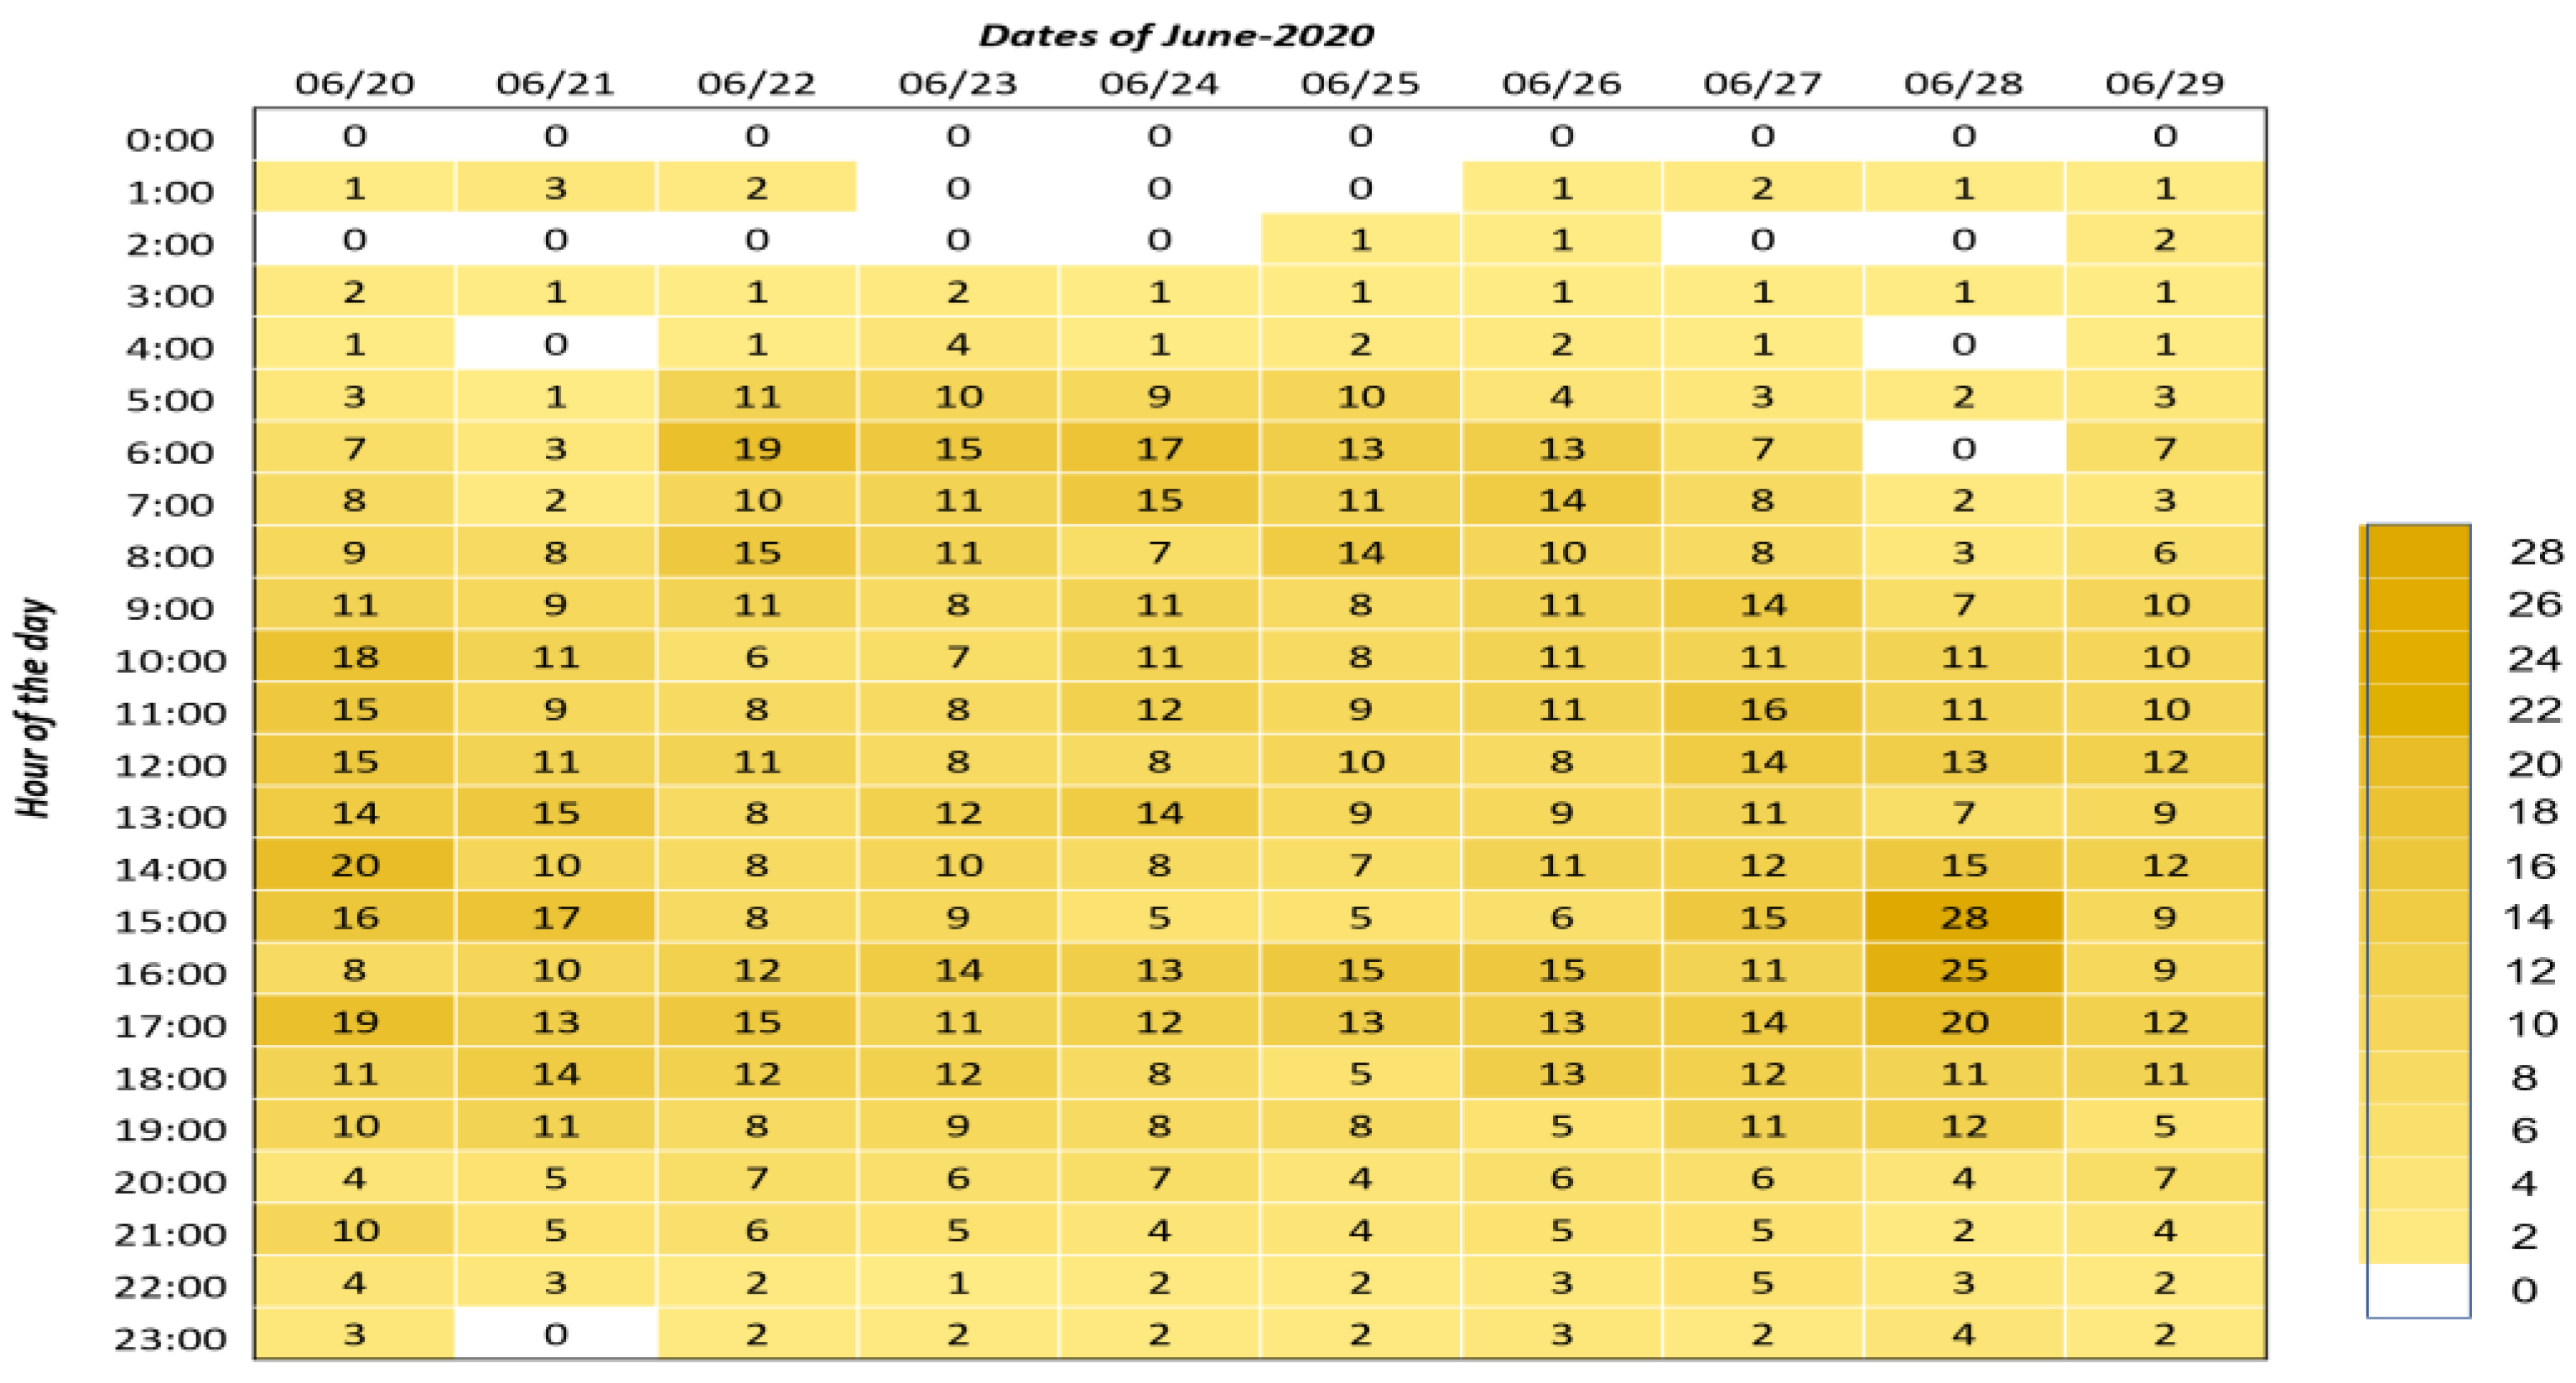
2.3.1. Temporal Coverage Assessment

In this study, the hourly average travel time for all shorter segments in the 10-day study period was calculated based on the number of Journey IDs available for the one-hour slots. It was considered that to accurately estimate travel time for each shorter segment, a sufficient number of Journey IDs for the one-hour slots must be obtained. So, the data’s temporal coverage was assessed to calculate the percentage of the uncovered one-hour slots for 24 h of the 10-day study period. It is assumed that a one-hour slot with an average zero number of Journey IDs for the entire road segment is considered an uncovered one-hour slot, as assumed in an earlier study [55]. Furthermore, several minimum Journey ID threshold values were also set to tighten the criteria for calculating the percentage of the uncovered one-hour slots.

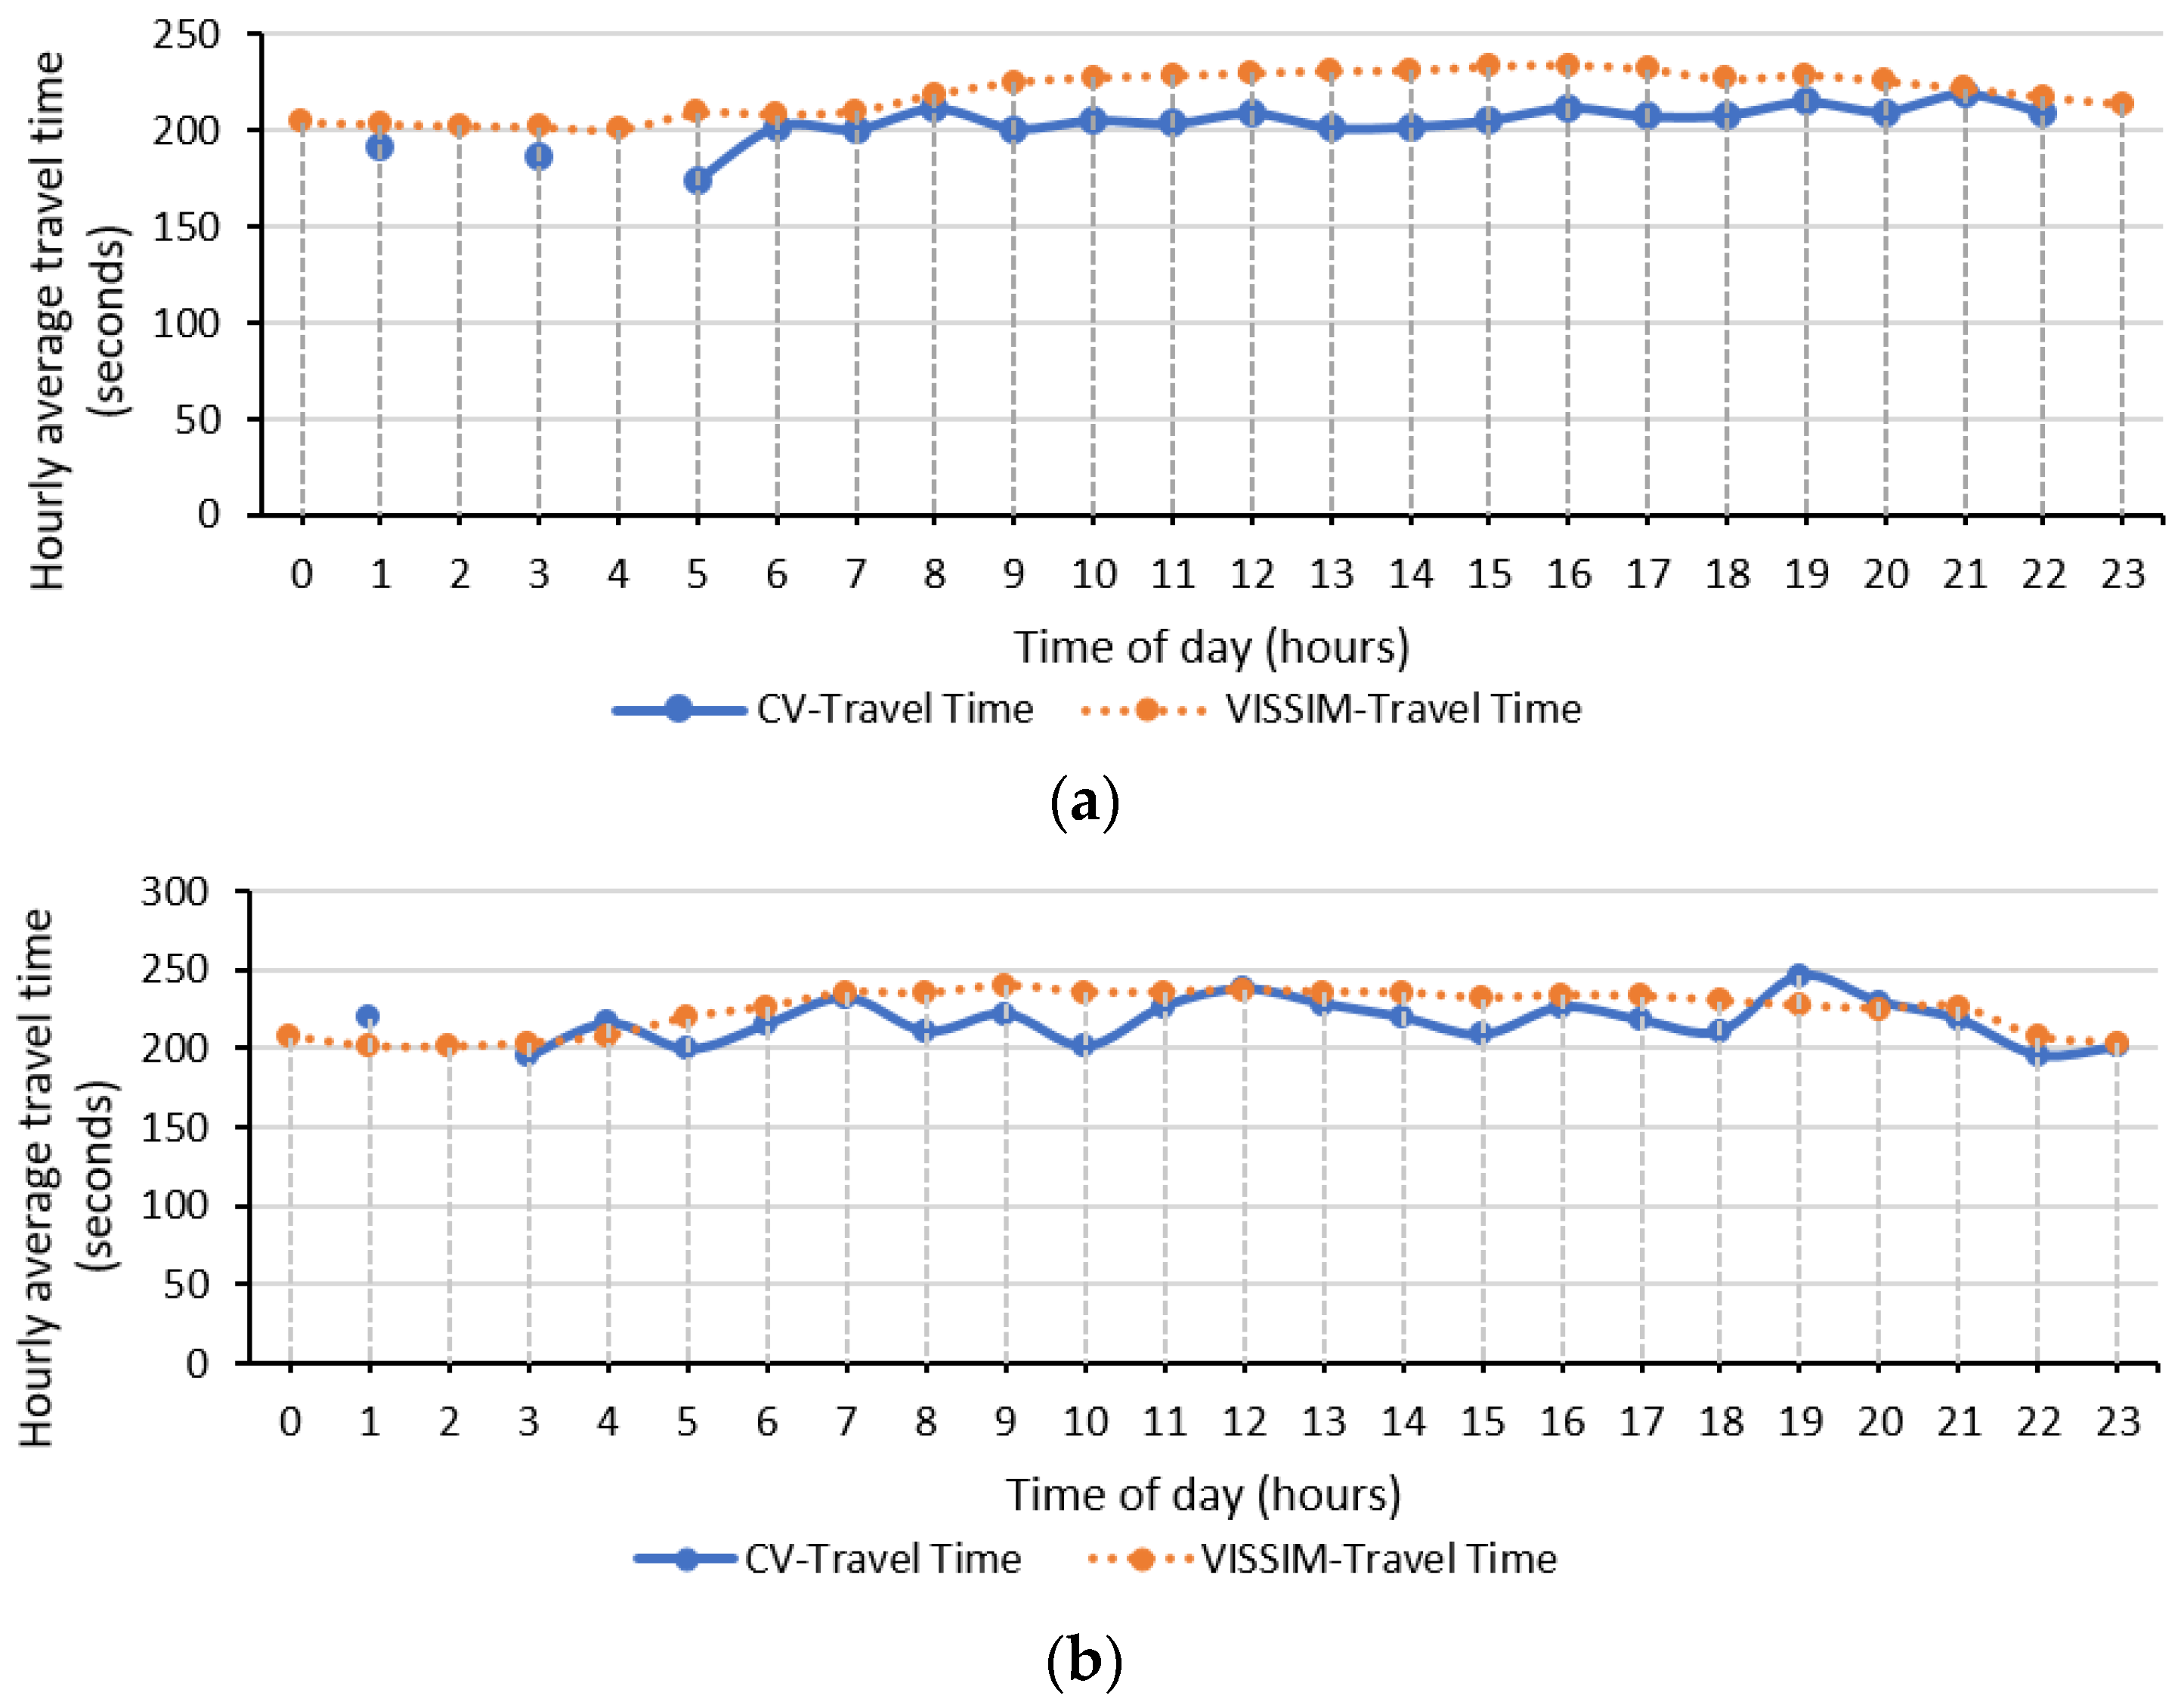
2.3.2. Similarity Assessment

Utah ATSPM data: In April 2012, UDOT began implementing an ATSPM program on statewide signalized intersections in collaboration with Purdue University, Federal Highway Administration (FHWA), and Indiana Department of Transportation (INDOT). The ATSPM program installed on signalized intersections contains historical and real-time information on various traffic signal performance metrics, such as approach volume, turning movement counts, and Purdue coordination diagrams, that can be used to evaluate the quality of traffic progression along corridors and identify maintenance issues that affect traffic flow on signalized intersections. This information is collected every 10 to 15 min with high-resolution traffic signal controllers as well as detector data associated with each equipped intersection. The system is installed at the majority of Utah’s signalized intersections and historical performance metrics for signalized intersections are accessible for public use via UDOT ATSPM website (https://udottraffic.utah.gov/atspm/, accessed on 10 February 2023).
Therefore, the ATSPM system installed at the signalized intersections along the selected section of SR-68 provides an opportunity to gather historical performance metrics for the defined time frame in the study area. These performance metrics can be fed into traffic simulation platforms for modeling historical traffic. The calibrated model can then generate travel time estimates of the study area which can be compared to CV data travel times. In this context, the PTV VISSIM microsimulation platform was adopted to develop a model of the selected study region, the details of which are explained in the following section.
PTV VISSIM modeling: PTV VISSIM is a predominant microsimulation tool developed by a German company PTV Vision in 1992 that is used to perform complex network and capacity analysis at signalized intersections, freeways, and merging and diverging segments [66]. The software consists of several traffic parameters that can be modified with the help of available performance metrics to develop a calibrated model of the selected study region such as vehicle input, vehicle routing decision, desired speed decisions, and signal control program. Furthermore, VISSIM uses a psychophysical car-following model Wiedemann 74 for urban driving that ensures that the driving behavior of simulated traffic is naturally distributed in each time step. This means that each driver has different driving capabilities for perception, reaction, and estimation of the surrounding traffic environment [67].
For this study, historical imagery of the road network was obtained from Google Earth and a VISSIM model was created that consisted of 3 miles of SR-68 between MM 27-30, as illustrated in Figure 3. This also contained 5 traffic signals and several roads interconnecting the selected section of the state highway. The historical performance metrics at the 5 signalized traffic intersection were obtained from UDOT ATSPM website for a two-day traffic period, i.e., 21–22 June 2020, since the data for the day of evacuation event were not available on the system, potentially due to communication loss or power outage at the selected intersections, as confirmed by the UDOT. The collected data consisted of approach volume, turning movement counts, and Purdue coordination diagrams that were used to calibrate the model parameters such as traffic flow and signal phasing. The speed limits on the study corridor were 50–55 mph over the 3-mile section, so the VISSIM input volumes were assigned a speed distribution based on the posted speed limit. In addition, the traffic composition was considered based on vehicle class data obtained from UDOT Performance Measurement System (PeMS) (https://udot.iteris-pems.com/, accessed on 10 February 2023).
Considering that the travel time obtained from the connected vehicle dataset was based on hourly average travel time calculated for shorter segments on the NB SR-68, the 3-mile NB simulated section of SR-68 was divided into the same length segments. This is conducted by placing travel time data collection points at the previously described data collection buffer locations. A series of one-hour test setups were used to evaluate the 24 h travel time similarity assessment for the selected two-day period. The test setup for the one-hour travel time estimation consisted of a one and a half hour simulation period with the initial 15 min warm-up and final 15 min cooling-down periods excluded from the evaluation results. This simulation setting is incorporated by running 10 simulation runs for each test as the minimum requirement defined by several state departments of transportation in USA [68].
Similarity assessment measures: To assess the similarity of travel time calculated using CV dataset and VISSIM modeling for the two-day assessment period, the hourly average travel times of the shorter segments obtained from the two datasets were compared by calculating the correlation coefficient, RMSE, and MAPE to quantify their similarities and differences. The following equations were used to calculate these measures based on the two datasets with the same sample size as:
C o r r e l a t i o n   C o e f f i c i e n t = t = 1 n x i x y i y t = 1 n x i x y i y
R M S E = t = 1 n x i y i 2 n
M A P E = 1 n t = 1 n x i y i x i
where x and y represent two sample groups. Each of them contains n samples, x i and y i represent the t-th sample in each group, and x and y represent the mean values of these two groups.
As previously stated, the total 3-mile length hourly average travel time is calculated by adding the hourly average travel times for the divided shorter segments. It was considered that more trips collected from the segment may result in a more accurate estimate of the hourly average travel times. Therefore, different calculation threshold values were used to tighten the criteria for generating travel times from each segment. The calculation threshold has a base value of one, so as long as there is one trip captured on the segment, the hourly average travel times can be generated from it, as applied in an earlier study [55].

3. Results and Discussion

3.1. Wejo Travel Time Calculation Results

This section presents the hourly average travel time for the 5-mile segment over the 10-day study period for the hours NB SR-68 was impacted by the Knolls Fire 2020, as illustrated in Figure 4. The comparative analysis showed that the non-evacuation days observed consistent travel times while a significant increase in the travel time values was observed on the evacuation day.
The highest traffic delays were seen during evening peak hours which is further evident by the observation of slow-moving traffic between MM 26–30 after six o’clock, as depicted by the speed profile illustrated in Figure 5. These traffic operation conditions were consistent with the operator response notes provided by UDOT on the incident showing high traffic delays on the 4-mile section of NB SR-68. This indicates that the evacuees were forced to spend a considerable amount of time stuck in traffic as their exit options were limited, putting their lives in danger.

3.2. Temporal Coverage Assessment

Considering the criterion explained earlier, a high temporal coverage rate of 90.00% was observed in the base case scenario where only 24 out of 240 slots were marked as CV-uncovered, as detailed in Figure 6. These uncovered slots mostly occurred during low-volume early midnight hours. Additionally, the threshold for determining the minimum number of Journey IDs to define CV uncovered slots was increased from zero to three with an interval of one, considering that more trips can result in more accurate travel time results. Here, we observed a noticeable decrease in CV-covered slots with the increase in the minimum threshold values, i.e., 81.25% (threshold = 1), 72.50% (threshold = 2), and 67.50% (threshold = 3). Given the low penetration rate of Wejo CV data in 2020, this evaluation showed roughly 67–90% of the one-hour slots with enough Wejo samples to estimate travel times in the studied region. In addition, the test results showed a significant increase in CV volume on 28 June 2020, during the peak evacuation timeframe when compared to the same day the week before.

3.3. Similarity Assessment

This test reports the hourly average travel time of CV and VISSIM for the selected 24 h evaluation period of 21–22 June 2020. Figure 7a,b show that the CV and VISSIM travel times appear to be closer in estimating hourly average travel times for most hours of the day. However, considering that the low-volume midnight hours had the most CV uncovered slots, as observed in the temporal coverage analysis, the dataset lacked the needed sample size to estimate travel time for these hours.
To better assess the statistical relationship between the travel times of the two datasets, the similarity assessment measures were calculated for the two-day period defined in the earlier section. Table 3 shows that a high correlation was observed between the travel time calculated using CV and VISSIM modeling at the base calculation threshold which increased to a maximum of 0.99 for the weekend day and 0.97 for the weekday when tightening the calculation criteria. The RMSE and MAPE were also estimated to be relatively low at the base calculation threshold for both days showing a strong relationship between the two calculated travel times, which further improved with the increase in minimum threshold values. This validates the earlier assumption that more trips result in more accurate travel time estimation results. Hence, the CV data were determined to be a valuable data source that could generate travel time estimates that are comparable to those of the VISSIM results that simulated historical ATSPM data.

4. Conclusions

The current approaches to estimating travel time lack the necessary details to accurately estimate evacuation times for historical hazardous events. To address this gap, this study utilized a CV dataset containing lane-level precision vehicle trajectory data, collected at 3 s intervals, to estimate the evacuation duration of a historical short-notice wildfire evacuation event. Using the CV dataset attributes, the study calculated the evacuation time during the wildfire event and found a significant increase in traffic delays on the evacuation route, with evening hours experiencing the highest congestion. The evacuation traffic operational conditions were consistent with operator response notes from the relevant state department of transportation on the fire incident.
In addition, temporal coverage assessment and similarity assessment tests were performed to accurately estimate travel time and eliminate any biases in the selected study period’s data. These assessments were also used to validate the usability of the travel time estimates and evaluate the dataset’s coverage. The temporal coverage assessment revealed that the dataset covered about 67–90% of one-hour time slots during the complete study period, with some low-volume midnight hours having insufficient data. The similarity assessment compared travel times estimated using the dataset and the PTV VISSIM microsimulation tool, which incorporated historical traffic performance measures from the state-established ATSPM system installed at the traffic signals along the study area. The results showed a correlation coefficient of 0.89 to 0.99, with a decrease in RMSE and MAPE when tightening the calculation threshold. Based on these results, it can be inferred that the CV dataset proved to be a valuable source of data for estimating traffic delays in this specific case study.
Therefore, given the limited availability of comprehensive data to analyze traffic operations and estimate travel time during wildfire evacuations, this study recommends using the CV dataset to estimate travel times for real-world wildfire evacuation events and prepare for future events. However, this study only evaluated traffic operations during a single wildfire evacuation event and for a shorter time period primarily due to licensing restrictions, and thus, may not be representative of general wildfire evacuation scenarios. Future studies should improve upon this research by adjusting the experimental conditions and proposing innovative solutions to enhance traffic operations in similar cases. Furthermore, future studies should assess the most recent CV datasets and examine longer evaluation periods to determine whether accurate travel time estimates can be achieved across a wider range of temporal coverage and different types of historical evacuation events.

Author Contributions

Conceptualization, S.A., Y.H. and A.A.; methodology, S.A. and A.A.; software, S.A. and A.A.; validation, S.A., A.A. and H.U.A.; formal analysis, S.A. and A.A.; investigation, S.A. and A.A.; resources, S.A., A.A., Y.H. and P.L.; data curation S.A., A.A. and Y.H.; writing—original draft preparation, S.A. and H.U.A.; writing—review and editing, A.A., Y.H. and P.L.; visualization, S.A.; supervision, Y.H. and P.L.; project administration, Y.H. and P.L.; funding acquisition, Y.H. and P.L. All authors have read and agreed to the published version of the manuscript.

Funding

This work was supported by the U.S. Department of Transportation under the agreement of No. 69A3551747108 through MPC project No. 685.

Informed Consent Statement

Not applicable.

Data Availability Statement

The data used in this article is confidential and was purchased from Wejo.com through purchasing agreement.

Acknowledgments

The authors would like to thank Wejo Data Services for the provided services along with the data agreement.

Conflicts of Interest

The authors declare no conflict of interest.

References

  1. Liu, Y.; Stanturf, J.; Goodrick, S. Trends in global wildfire potential in a changing climate. For. Ecol. Manag. 2010, 259, 685–697. [Google Scholar] [CrossRef]
  2. McKenzie, D.; Gedalof, Z.; Peterson, D.L.; Mote, P. Climatic change, wildfire, and conservation. Conserv. Biol. 2004, 18, 890–902. [Google Scholar] [CrossRef]
  3. Caton, S.E.; Hakes, R.S.P.; Gorham, D.J.; Zhou, A.; Gollner, M.J. Review of Pathways for Building Fire Spread in the Wildland Urban Interface Part I: Exposure Conditions. Fire Technol. 2017, 53, 429–473. [Google Scholar] [CrossRef]
  4. Paveglio, T.B.; Moseley, C.; Carroll, M.S.; Williams, D.R.; Davis, E.J.; Fischer, A.P. Categorizing the social context of the wildland urban interface: Adaptive capacity for wildfire and community ‘Archetypes’. For. Sci. 2015, 61, 298–310. [Google Scholar] [CrossRef]
  5. Calkin, D.E.; Cohen, J.D.; Finney, M.A.; Thompson, M.P. How risk management can prevent future wildfire disasters in the wildland-urban interface. Proc. Natl. Acad. Sci. USA 2014, 111, 746–751. [Google Scholar] [CrossRef]
  6. Theobald, D.M.; Romme, W.H. Expansion of the US wildland-urban interface. Landsc. Urban Plan. 2007, 83, 340–354. [Google Scholar] [CrossRef]
  7. Mietkiewicz, N.; Balch, J.K.; Schoennagel, T.; Leyk, S.; Denis, L.A.S.; Bradley, B.A. In the line of fire: Consequences of human-ignited wildfires to homes in the U.S. (1992–2015). Fire 2020, 3, 50. [Google Scholar] [CrossRef]
  8. Chen, C.; Shi, X. Effects of Incorporating Connected Vehicle Technologies Into No-Notice Emergency Evacuation During Winter Weather (Phase I); University of North Carolina at Charlotte, Center for Advanced Multimodal: Charlotte, NC, USA, 2020. [Google Scholar]
  9. Grajdura, S.; Qian, X.; Niemeier, D. Awareness, departure, and preparation time in no-notice wildfire evacuations. Saf. Sci. 2021, 139, 105258. [Google Scholar] [CrossRef]
  10. McCaffrey, S.; Wilson, R.; Konar, A. Should I Stay or Should I Go Now? Or Should I Wait and See? Influences on Wildfire Evacuation Decisions. Risk Anal. 2018, 38, 1390–1404. [Google Scholar] [CrossRef]
  11. Lin, C.; Yu, Y.; Wu, D.; Gong, B. Traffic flow catastrophe border identification for urban high-density area based on cusp catastrophe theory: A case study under sudden fire disaster. Appl. Sci. 2020, 10, 3197. [Google Scholar] [CrossRef]
  12. Wood, N.; Henry, K.; Peters, J. Influence of demand and capacity in transportation simulations of short-notice, distant-tsunami evacuations. Transp. Res. Interdiscip. Perspect. 2020, 7, 100211. [Google Scholar] [CrossRef]
  13. Chen, J.; Yu, J.; Wen, J.; Zhang, C.; Yin, Z.E.; Wu, J.; Yao, S. Pre-evacuation time estimation based emergency evacuation simulation in urban residential communities. Int. J. Environ. Res. Public Health 2019, 16, 4599. [Google Scholar] [CrossRef] [PubMed]
  14. Dulam, R.; Lalith, M.; Hori, M.; Ichimura, T.; Tanaka, S. A study on effectiveness of using officials for reducing pre-evacuation time in a large area, based on multi agent simulations. In Proceedings of the International Symposium on Engineering Lessons Learned from the 2011 Great East Japan Earthquake, Tokyo, Japan, 1–4 March 2012; pp. 1658–1665. [Google Scholar]
  15. Auld, J.; Sokolov, V.; Fontes, A.; Bautista, R. Internet-based stated response survey for no-notice emergency evacuations. Transp. Lett. 2012, 4, 41–53. [Google Scholar] [CrossRef]
  16. Carnegie, J.A.; Deka, D. Using Hypothetical Disaster Scenarios to Predict Evacuation Behavioral Response; The National Academies of Sciences, Engineering, and Medicine: Washington, DC, USA, 2010. [Google Scholar]
  17. Kuligowski, E. Evacuation decision-making and behavior in wildfires: Past research, current challenges and a future research agenda. Fire Saf. J. 2021, 120, 103129. [Google Scholar] [CrossRef]
  18. De Iuliis, M.; Battegazzorre, E.; Domaneschi, M.; Cimellaro, G.P.; Bottino, A.G. Large scale simulation of pedestrian seismic evacuation including panic behavior. Sustain. Cities Soc. 2023, 94, 104527. [Google Scholar] [CrossRef]
  19. Kuligowski, E.D.; Walpole, E.H.; Lovreglio, R.; Mccaffrey, S. Modelling evacuation decision-making in the 2016 Chimney Tops 2 fire in Gatlinburg, TN. Int. J. Wildland Fire 2020, 29, 1120–1132. [Google Scholar] [CrossRef]
  20. Lovreglio, R.; Kuligowski, E.; Gwynne, S.; Strahan, K. A modelling framework for householder decision-making for wildfire emergencies. Int. J. Disaster Risk Reduct. 2019, 41, 101274. [Google Scholar] [CrossRef]
  21. Toledo, T.; Marom, I.; Grimberg, E.; Bekhor, S. Analysis of evacuation behavior in a wildfire event. Int. J. Disaster Risk Reduct. 2018, 31, 1366–1373. [Google Scholar] [CrossRef]
  22. McCaffrey, S.M.; Winter, G. Understanding homeowner preparation and intended actions when threatened by a wildfire. In Proceedings of the Second Human Dimensions of Wildland Fire Conference; General Technical Report NRS-P-84; US Department of Agriculture, Forest Service, Northern Research Station: Newtown Square, PA, USA, 2011; pp. 88–95. [Google Scholar]
  23. Benight, C.C.; Gruntfest, E.; Sparks, K. Colorado Wildfires 2002. Quick Response Res. Rep. 2004, 167. Available online: http://www.colorado.edu/hazards/research/qr/qr167/qr167_mod.pdf (accessed on 10 February 2023).
  24. McCaffrey, S.; Velez, A.; Briefel, J. Difference in Information Needs for Wildfire Evacuees and Non-Evacuees|Treesearch. U.S For. Serv. 2013, 31, 4–24. Available online: https://www.fs.usda.gov/treesearch/pubs/44256 (accessed on 10 February 2023).
  25. Walpole, H.D.; Wilson, R.S.; McCaffrey, S.M. If you love it, let it go: The role of home attachment in wildfire evacuation decisions. Environ. Syst. Decis. 2020, 40, 29–40. [Google Scholar] [CrossRef]
  26. Wong, S.D.; Broader, J.C.; Walker, J.L.; Shaheen, S.A. Understanding California wildfire evacuee behavior and joint choice making. Transportation 2022, 1–47. [Google Scholar] [CrossRef]
  27. McNeill, I.M.; Dunlop, P.D.; Skinner, T.C.; Morrison, D.L. Predicting delay in residents’ decisions on defending v. evacuating through antecedents of decision avoidance. Int. J. Wildland Fire 2015, 24, 153–161. [Google Scholar] [CrossRef]
  28. Paveglio, T.; Prato, T.; Dalenberg, D.; Venn, T. Understanding evacuation preferences and wildfire mitigations among Northwest Montana residents. Int. J. Wildland Fire 2014, 23, 435–444. [Google Scholar] [CrossRef]
  29. Lovreglio, R.; Kuligowski, E.; Walpole, E.; Link, E.; Gwynne, S. Calibrating the Wildfire Decision Model using hybrid choice modelling. Int. J. Disaster Risk Reduct. 2020, 50, 101770. [Google Scholar] [CrossRef]
  30. Cimellaro, G.; Domaneschi, M.; Villa, V.; de Iuliis, M. Numerical Simulation of Fire-Following-Earthquake at Urban Scale; CRC Press: Boca Raton, FL, USA, 2019. [Google Scholar]
  31. Rothermel, R.C. A Mathematical Model for Predicting Fire Spread in Wildland Fuels. Intermt. For. Range Exp. Stn. For. Serv. US. 1972, 115. Available online: https://books.google.pt/books?id=AfyMv5NBSjoC (accessed on 10 February 2023).
  32. Van Wagner, C.E. A simple fire-growth model. For. Chron. 1969, 45, 103–104. [Google Scholar] [CrossRef]
  33. Finney, M.A. Fire growth using minimum travel time methods. Can. J. For. Res. 2002, 32, 1420–1424. [Google Scholar] [CrossRef]
  34. Li, D.; Cova, T.J.; Dennison, P.E. Using reverse geocoding to identify prominent wildfire evacuation trigger points. Appl. Geogr. 2017, 87, 14–27. [Google Scholar] [CrossRef]
  35. Larsen, J.C.; Dennison, P.E.; Cova, T.J.; Jones, C. Evaluating dynamic wildfire evacuation trigger buffers using the 2003 Cedar Fire. Appl. Geogr. 2011, 31, 12–19. [Google Scholar] [CrossRef]
  36. Beloglazov, A.; Almashor, M.; Abebe, E.; Richter, J.; Steer, K.C.B. Simulation of wildfire evacuation with dynamic factors and model composition. Simul. Model. Pract. Theory 2016, 60, 144–159. [Google Scholar] [CrossRef]
  37. Li, D.; Cova, T.J.; Dennison, P.E. Setting Wildfire Evacuation Triggers by Coupling Fire and Traffic Simulation Models: A Spatiotemporal GIS Approach. Fire Technol. 2019, 55, 617–642. [Google Scholar] [CrossRef]
  38. Cova, T.J.; Johnson, J.P. Microsimulation of neighborhood evacuations in the urban-wildland interface. Environ. Plan A 2002, 34, 2211–2229. [Google Scholar] [CrossRef]
  39. Guerrero-Ibáñez, J.; Zeadally, S.; Contreras-Castillo, J. Sensor technologies for intelligent transportation systems. Sensors 2018, 18, 1212. [Google Scholar] [CrossRef] [PubMed]
  40. Quiroga, C.; Bullock, D. Determination of sample sizes for travel time studies. ITE J. Web 1998, 68, 92–98. [Google Scholar]
  41. Vanajakshi, L.D.; Williams, B.M.; Rilett, L.R. Improved flow-based travel time estimation method from point detector data for freeways. J. Transp. Eng. 2009, 135, 26–36. [Google Scholar] [CrossRef]
  42. Haas, R.; Carter, M.; Perry, E.; Trombly, J.; Bedsole, E.; Margiotta, R. iFlorida Model Deployment; United States Federal Highway Administration: Washington, DC, USA, 2009. Available online: http://ntl.bts.gov/lib/31000/31000/31051/14480_files/iflorida.pdf (accessed on 10 February 2023).
  43. Xiao, L.; Wang, Z. Internet of things: A new application for intelligent traffic monitoring system. J. Netw. 2011, 6, 887–894. [Google Scholar] [CrossRef]
  44. Hidayat, A.; Terabe, S.; Yaginuma, H. WiFi Scanner Technologies for Obtaining Travel Data about Circulator Bus Passengers: Case Study in Obuse, Nagano Prefecture, Japan. Transp. Res. Rec. 2018, 2672, 45–54. [Google Scholar] [CrossRef]
  45. Huang, T.; Poddar, S.; Aguilar, C.; Sharma, A.; Smaglik, E.; Kothuri, S.; Koonce, P. Building intelligence in automated traffic signal performance measures with advanced data analytics. Transp. Res. Rec. 2018, 2672, 154–166. [Google Scholar] [CrossRef]
  46. Day, C.; O’Brien, P.; Stevanovic, A.; Hale, D.; Matout, N. Evaluating the Benefits and Costs of Implementing Automated Traffic Signal Performance; United States Federal Highway Administration: Washington, DC, USA, 2020.
  47. Ramezani, M.; Geroliminis, N. Queue Profile Estimation in Congested Urban Networks with Probe Data. Comput. -Aided Civ. Infrastruct. Eng. 2015, 30, 414–432. [Google Scholar] [CrossRef]
  48. SANDAG. Border Wait Time Technologies and Information Systems White Paper. 2017. Available online: https://www.sandag.org/-/media/SANDAG/Documents/PDF/projects-and-programs/borders-and-interregional-collaboration/binational/economic-and-air-quality-impacts-of-delays-at-the-border-2017-10-31.pdf (accessed on 29 April 2023).
  49. Li, X.; Dadashova, B.; Yu, S.; Zhang, Z. Rethinking highway safety analysis by leveraging crowdsourced waze data. Sustainability 2020, 12, 10127. [Google Scholar] [CrossRef]
  50. Cookson, G.; Pishue, B. INRIX Global Traffic Scorecard—Appendices. INRIX Res. 2017, p. 44. Available online: https://media.bizj.us/view/img/10360454/inrix2016trafficscorecarden.pdf (accessed on 10 February 2023).
  51. Wojnarski, M.; Gora, P.; Szczuka, M.; Nguyen, H.S.; Swietlicka, J.; Zeinalipour, D. IEEE ICDM 2010 Contest: TomTom Traffic prediction for intelligent GPS Navigation. In Proceedings of the IEEE International Conference on Data Mining, ICDM, Sydney, Australia, 13–17 December 2010; IEEE: Piscataway, NJ, USA, 2010; pp. 1372–1376. [Google Scholar] [CrossRef]
  52. Kürpick, P. Automated Driving—Networked Safety in Road Traffic. ATZelectronics Worldw. 2019, 14, 50–53. [Google Scholar] [CrossRef]
  53. Massaro, E.; Ahn, C.; Ratti, C.; Santi, P.; Stahlmann, R.; Lamprecht, A.; Roehder, M.; Huber, M. The Car as an Ambient Sensing Platform. Proc. IEEE 2017, 105, 3–7. [Google Scholar] [CrossRef]
  54. Zanwar, P.; Kim, J.; Kim, J.; Manser, M.; Ham, Y.; Chaspari, T.; Ahn, C.R. Use of Connected Technologies to Assess Barriers and Stressors for Age and Disability-Friendly Communities. Front. Public Health 2021, 9, 578832. [Google Scholar] [CrossRef]
  55. Li, X.; Martin, M.; Dadashova, B.; Salgado, D.; Samant, S. Exploring Crowdsourced Big Data To Estimate Border Crossing Times; Texas A & M Transportation Institute: El Paso, TX, USA, 2021.
  56. Desai, J.; Saldivar-Carranza, E.; Mathew, J.K.; Li, H.; Platte, T.; Bullock, D. Methodology for Applying Connected Vehicle Data to Evaluate Impact of Interstate Construction Work Zone Diversions. In Proceedings of the IEEE Conference on Intelligent Transportation Systems,Proceedings, ITSC, Indianapolis, IN, USA, 19–22 September 2021; IEEE: Piscataway, NJ, USA, 2021; pp. 4035–4042. [Google Scholar] [CrossRef]
  57. Khadka, S.; Li, P.T.; Wang, Q. Developing Novel Performance Measures for Traffic Congestion Management and Operational Planning Based on Connected Vehicle Data. J. Urban Plan. Dev. 2022, 148, 4022016. [Google Scholar] [CrossRef]
  58. Abdelraouf, A.; Abdel-Aty, M.; Mahmoud, N. Sequence-to-Sequence Recurrent Graph Convolutional Networks for Traffic Estimation and Prediction Using Connected Probe Vehicle Data. IEEE Trans. Intell. Transp. Syst. 2022, 24, 1395–1405. [Google Scholar] [CrossRef]
  59. Saldivar-Carranza, E.D.; Hunter, M.; Li, H.; Mathew, J.; Bullock, D.M. Longitudinal Performance Assessment of Traffic Signal System Impacted by Long-Term Interstate Construction Diversion Using Connected Vehicle Data. J. Transp. Technol. 2021, 11, 644–659. [Google Scholar] [CrossRef]
  60. Bahaaldin, K.; Fries, R.; Bhavsar, P.; Das, P. A Case Study on the Impacts of Connected Vehicle Technology on No-Notice Evacuation Clearance Time. J. Adv. Transp. 2017, 2017, 6357415. [Google Scholar] [CrossRef]
  61. Tribune, T.S.L. 1 Home Destroyed, 12 Damaged as Knolls Fire Grows to 10,000 Acres; Thousands Still under Evacuation in Saratoga Springs. 2020. Available online: https://www.sltrib.com/news/2020/06/28/draper-lehi-residents/ (accessed on 10 February 2023).
  62. U.S. Census Bureau. 2020 United States Census. Available online: https://www.census.gov/quickfacts/saratogaspringscityutah (accessed on 29 April 2023).
  63. Fox 13, Thousands Evacuated as ‘Knolls Fire’ Threatens Saratoga Springs Homes. 2020. Available online: https://www.fox13now.com/news/local-news/knolls-fire-forces-evacuations-in-saratoga-springs (accessed on 10 February 2023).
  64. Tribune, T.S.L. Evacuees Return Home in Saratoga Springs, But Knolls Fire Still Could Pose a Threat. 2020. Available online: https://www.sltrib.com/news/2020/06/29/all-evacuees-can-return/ (accessed on 10 February 2023).
  65. Fox 13, Knolls Fire Evacuations Lifted. 2020. Available online: https://www.fox13now.com/news/local-news/knolls-fire-in-utah-co-reaches-10k-acres-25-percent-containment (accessed on 10 February 2023).
  66. Vissim, P.T.V. 5.30-05 User Manual, 2011; PTV AG: Karlsruhe, Germany, 2020. [Google Scholar]
  67. Wiedemann, R. Simulation des StraBenverkehrsflusses; Institut fur Verkehrswesen, University of Karlsruhe: Karlsruhe, Germany, 1974. [Google Scholar]
  68. Virginia Department of Transportation. VDOT Vissim User Guide. 2020. Available online: https://www.virginiadot.org/business/resources/VDOT_Vissim_UserGuide_Version2.0_Final_2020-01-10.pdf (accessed on 10 February 2023).
Figure 1. Knolls Fire 2020 evacuation area [64].
Fire 06 00184 g001
Figure 2. Study area map.
Fire 06 00184 g002
Figure 3. PTV VISSIM simulated model.
Fire 06 00184 g003
Figure 4. CV travel time calculation results during evacuation time period.
Fire 06 00184 g004
Figure 5. NB SR-68 MM 26-30 speed profile heatmap 20–29 June 2020 (6 pm–7 pm).
Fire 06 00184 g005
Figure 6. CV data temporal coverage 20–29 June 2020.
Fire 06 00184 g006
Figure 7. Travel time results using CV and VISSIM modeling (a) 21 June 2020 (b) 22 June 2020.
Fire 06 00184 g007
Table 1. UDOT operator response notes on Knolls Fire 2020.
28 June 2020 3:48:04 pm
Description: A fire has started on the west side of Utah Lake on Lake Mountain. Redwood Road is being closed in both directions due to the fire. Northbound is being closed at milepost 0 at the US-6 junction. Southbound is being closed at milepost 28 at Lake View Terrace in Saratoga Springs. Reason(s) for IPR: Media Attention. Route(s) Affected: Redwood Rd, US-6, I-15, SR-145. On Scene: UHP, Local PD, Fire. Incident Mgr: TOC. Action(s) Taken: Notified Region 3, Primary PIO, and TOC Mgmt. Queue Length: None at this time. Delays: To detour around Redwood Road onto I-15 and US-6 adds 10 min of travel time. Estimated Duration: Unknown. Next update in ~60 min.
28 June 2020 4:42:56 pm
The UDOT Maintenance Sheds are setting up hard closures at the closure points. Traffic is congested throughout the Saratoga Springs area due to evacuations in the southern section of Saratoga. Delays in the area are 5–10 min at this time.
28 June 2020 5:44:11 pm
NB Redwood Rd is congested for 4 miles in Saratoga Springs. Delays are 10 min.
28 June 2020 6:34:08 pm
NB Redwood Rd in Saratoga is now congested for 4 miles with 20 min delays.
28 June 2020 7:49:39 pm
Congestion and delays on Redwood Road have cleared.
28 June 2020 9:06:29 pm
Congestion and delays in the area remain light.
28 June 2020 11:03:39 pm
Traffic and congestion is still light in the area.
Table 2. Wejo CV data attributes.
S No.Data AttributesDefinitions
1Datapoint IDRecords a unique identifier for an individual captured data point every 3 seconds.
2Journey IDRecords a unique identifier for an individual vehicle’s movement through to an ignition off event happening.
3TimestampRecords the time and date of each data point along with location time zone offset.
4HeadingRecords the heading of each data point with 0 = north moving clockwise to 359°.
5SpeedRecords the speed of vehicle at each data point.
6LatitudeProvides the north–south positioning of the vehicle on the Earth’s surface.
7LongitudeProvides the east–west positioning of the vehicle on the Earth’s surface.
Table 3. CV data similarity assessment 21–22 June 2020.
Calculation Threshold1234
Sunday, 21 June 2020
Correlation Coefficient0.970.980.990.99
RMSE (in seconds)9.858.757.957.54
MAPE (%)9.638.617.677.08
Monday, 22 June 2020
Correlation Coefficient0.890.940.960.97
RMSE (seconds)18.9517.5116.4416.40
MAPE (%)10.259.157.937.80
Disclaimer/Publisher’s Note: The statements, opinions and data contained in all publications are solely those of the individual author(s) and contributor(s) and not of MDPI and/or the editor(s). MDPI and/or the editor(s) disclaim responsibility for any injury to people or property resulting from any ideas, methods, instructions or products referred to in the content.

