
Probabilistic Wildfire Risk Assessment and Modernization Transitions: The Case of Greece


Abstract
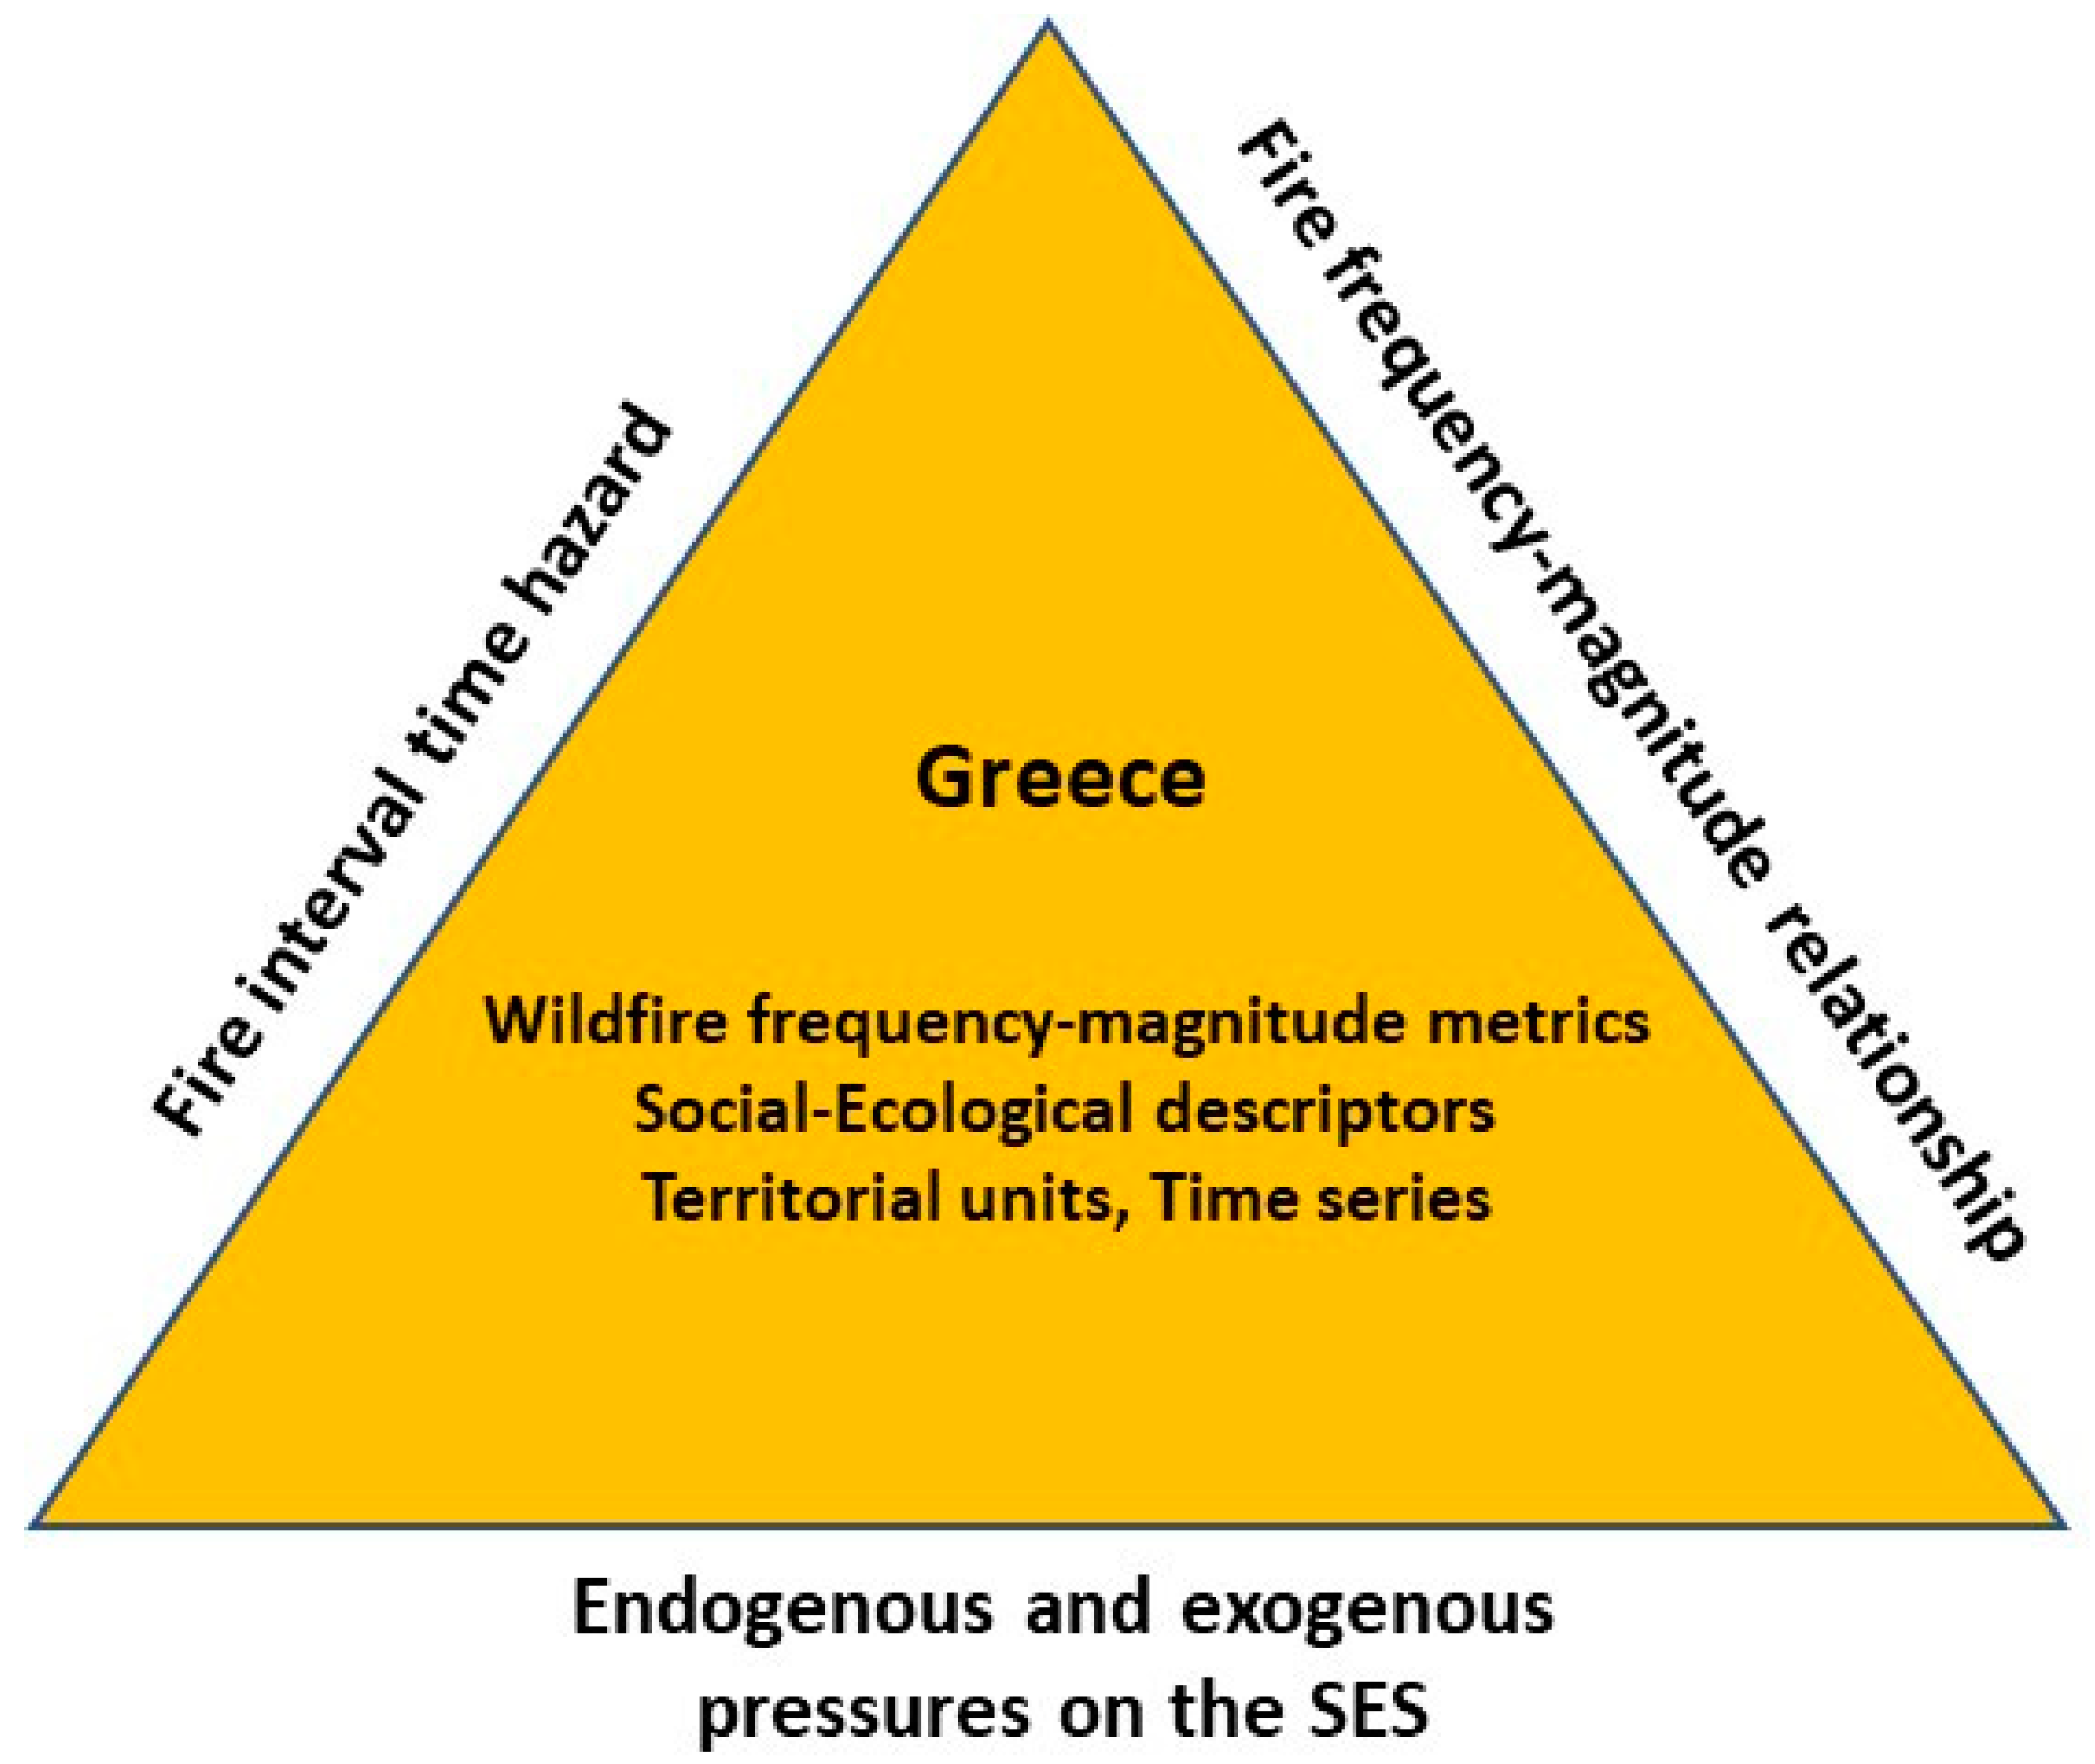
:1. Introduction
2. Materials and Methods
2.1. Preliminary Remarks
2.2. Descriptors and Data
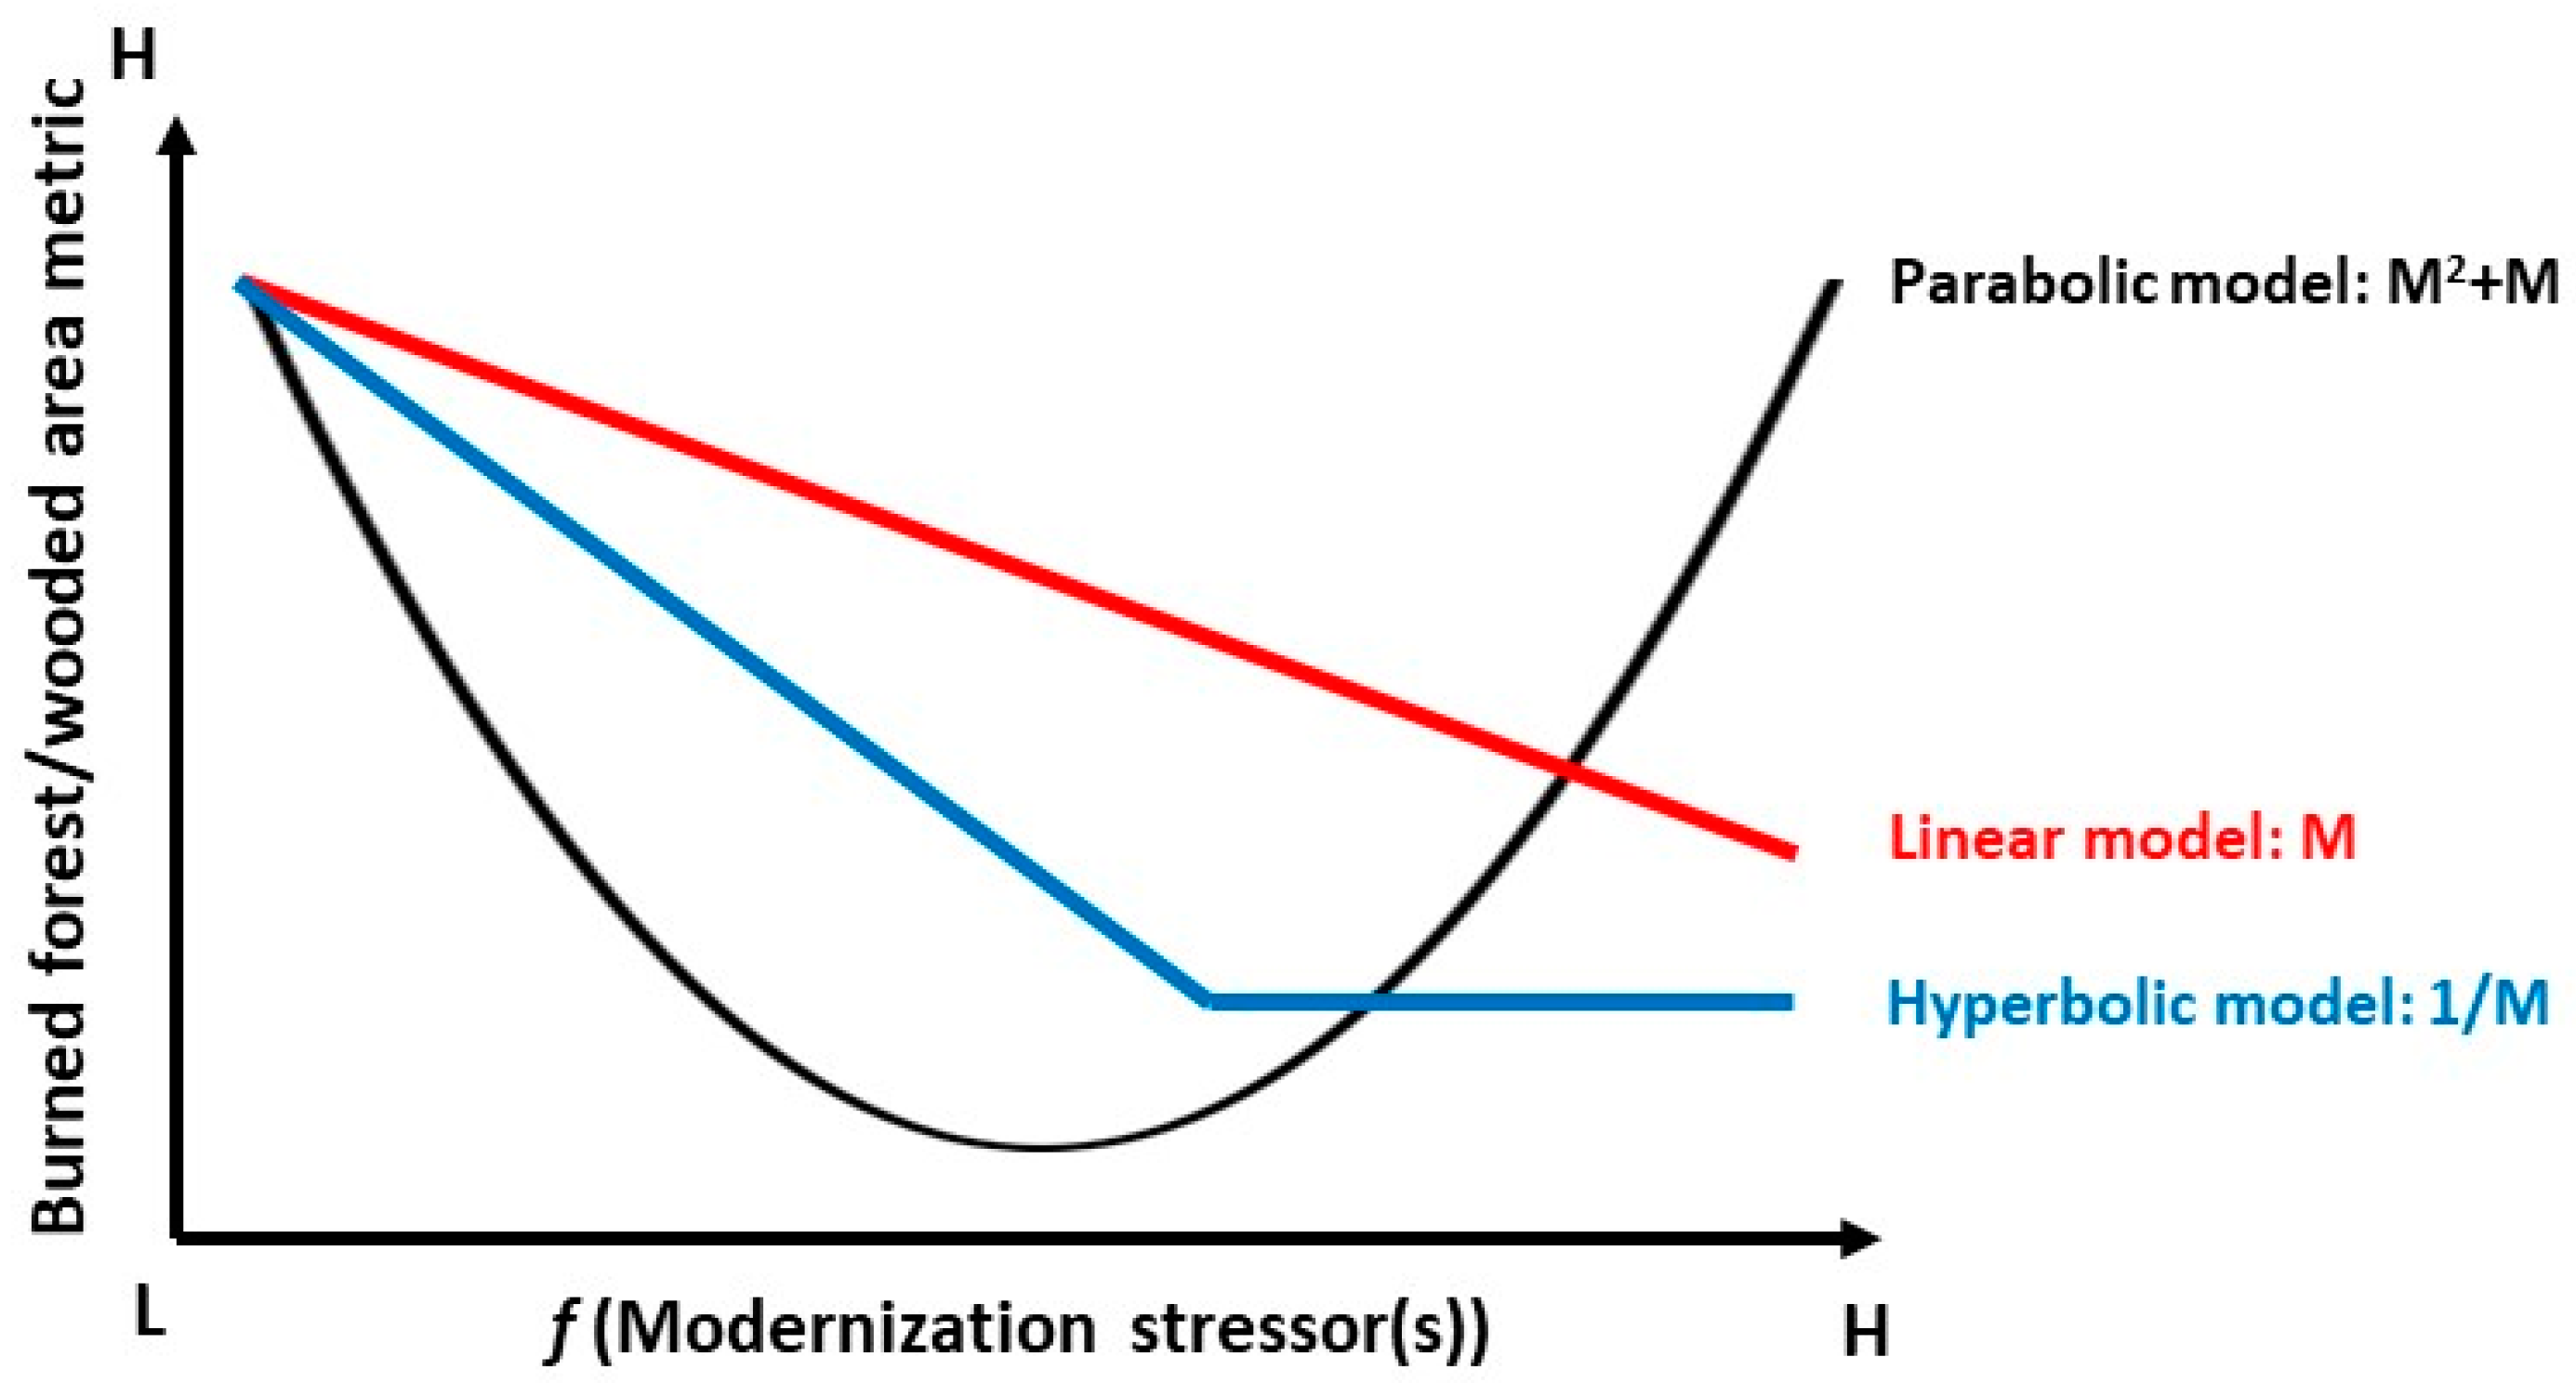
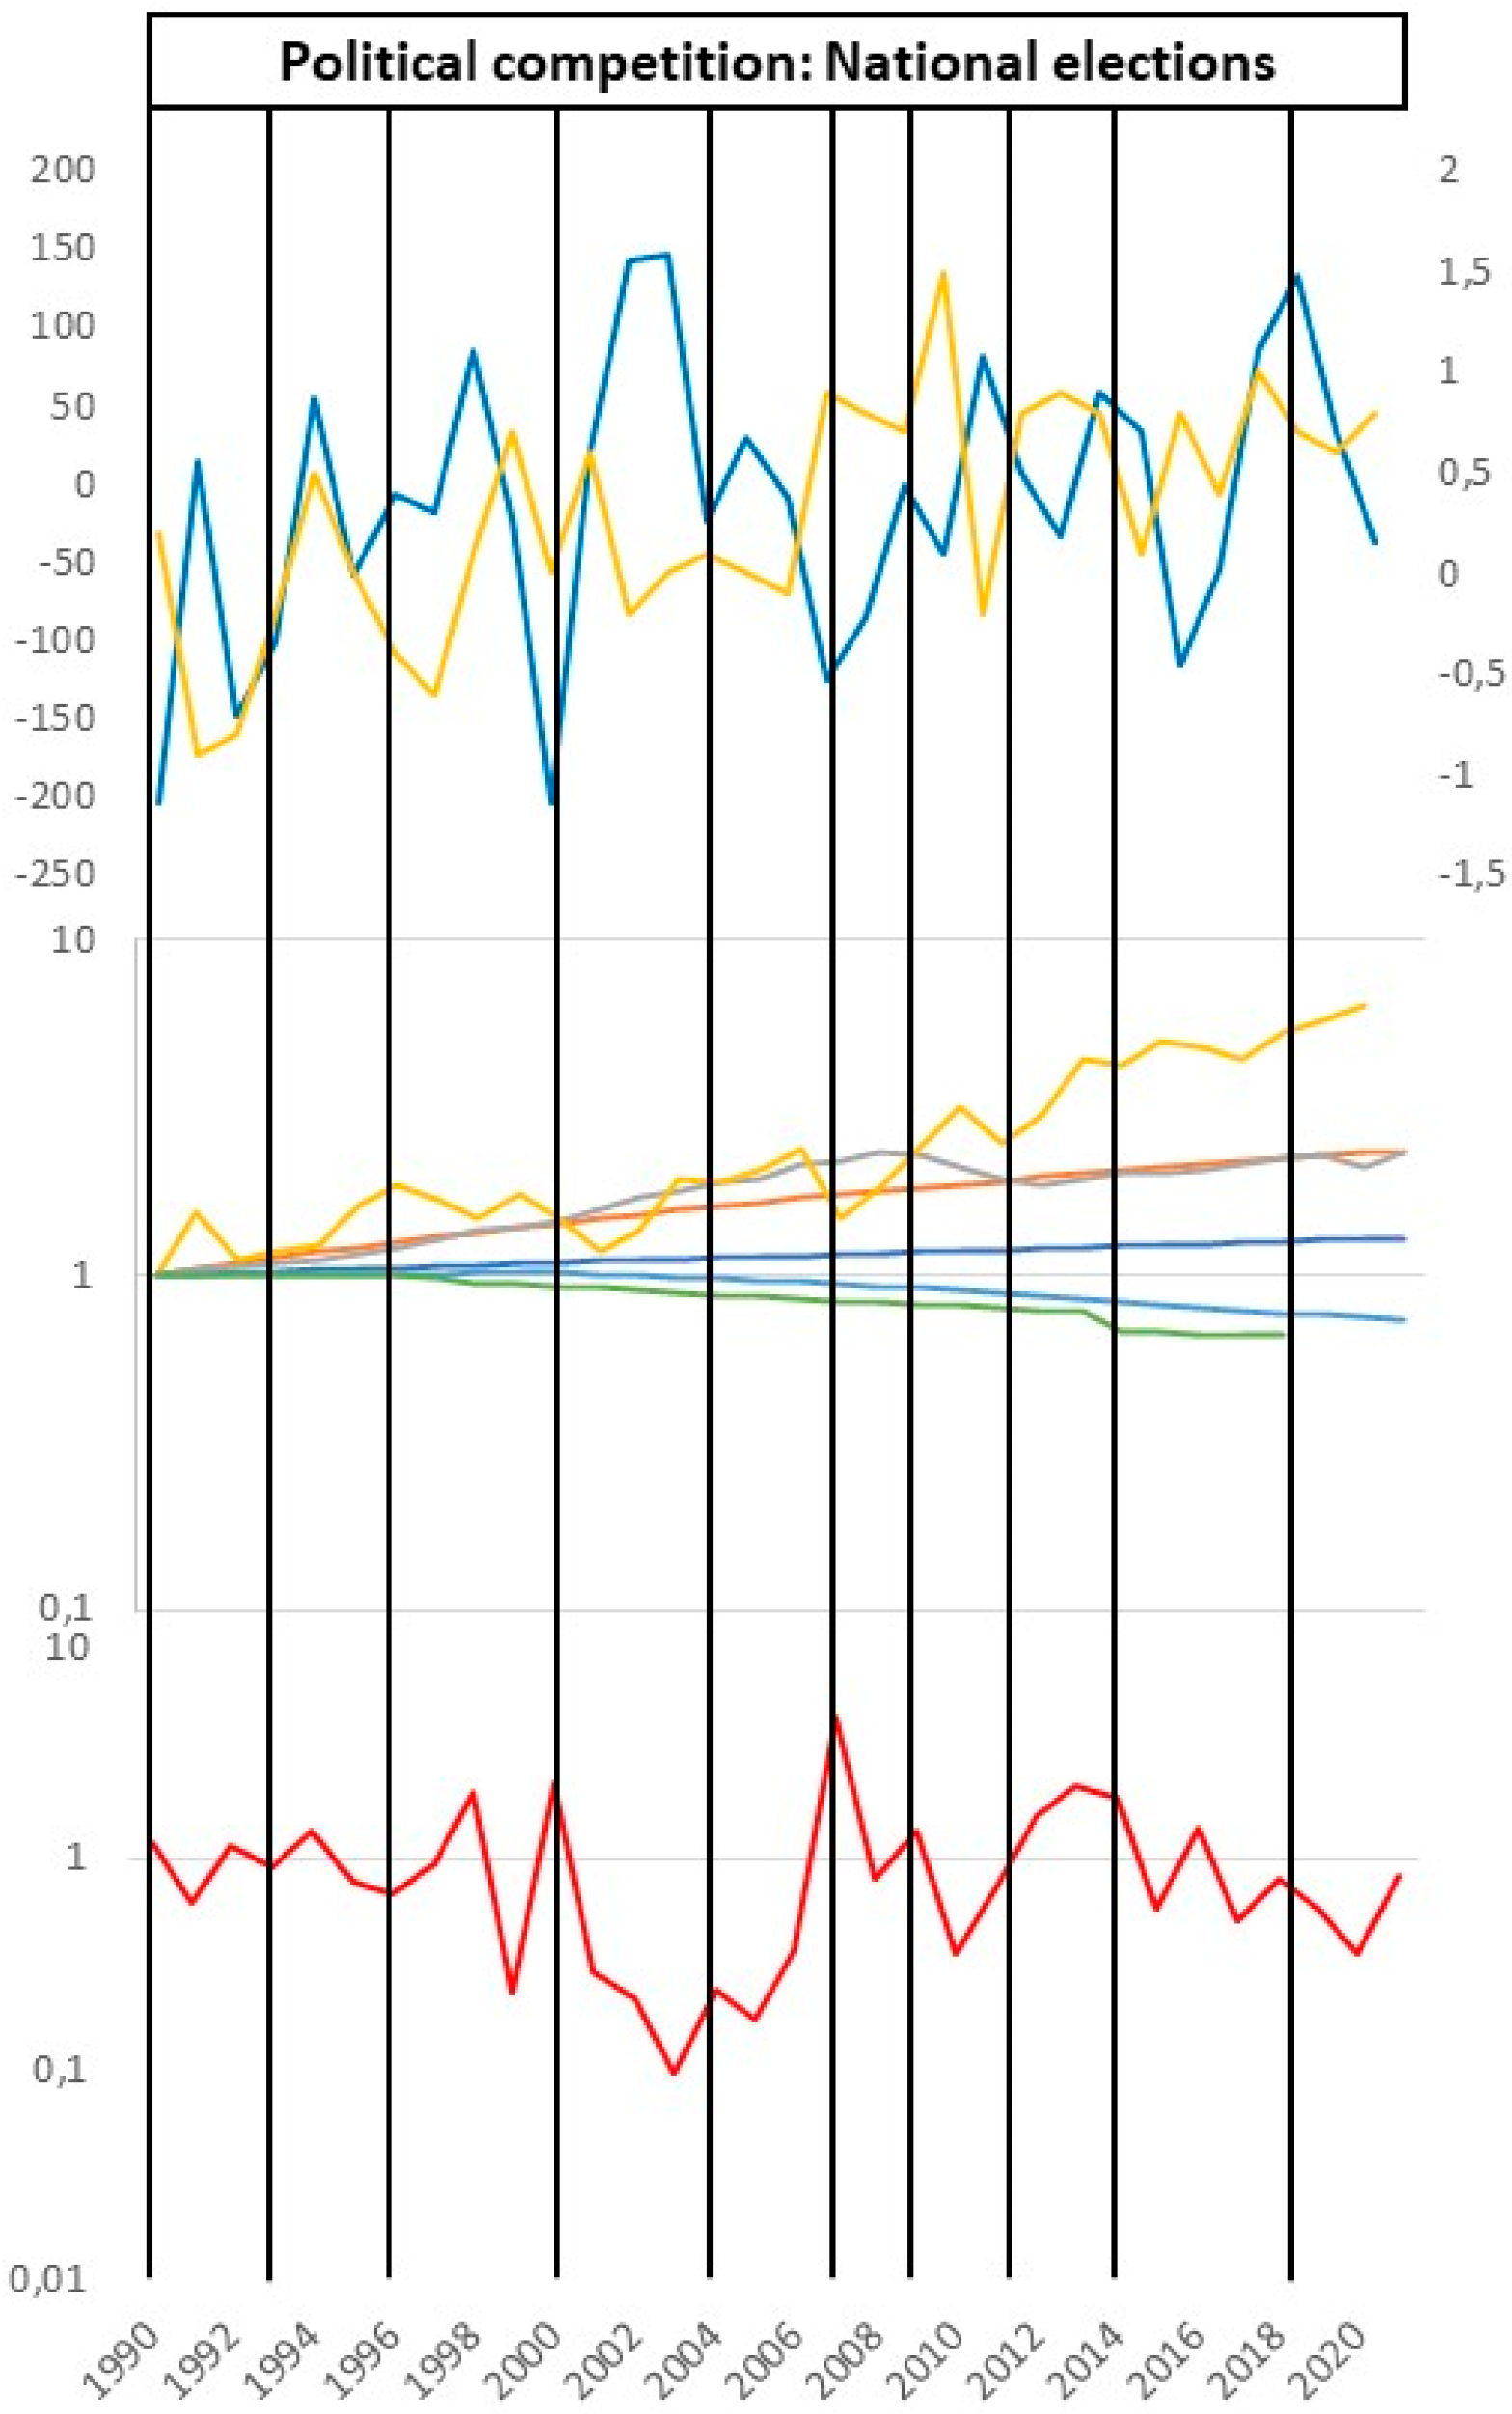
2.3. Modernization Stressors Trends
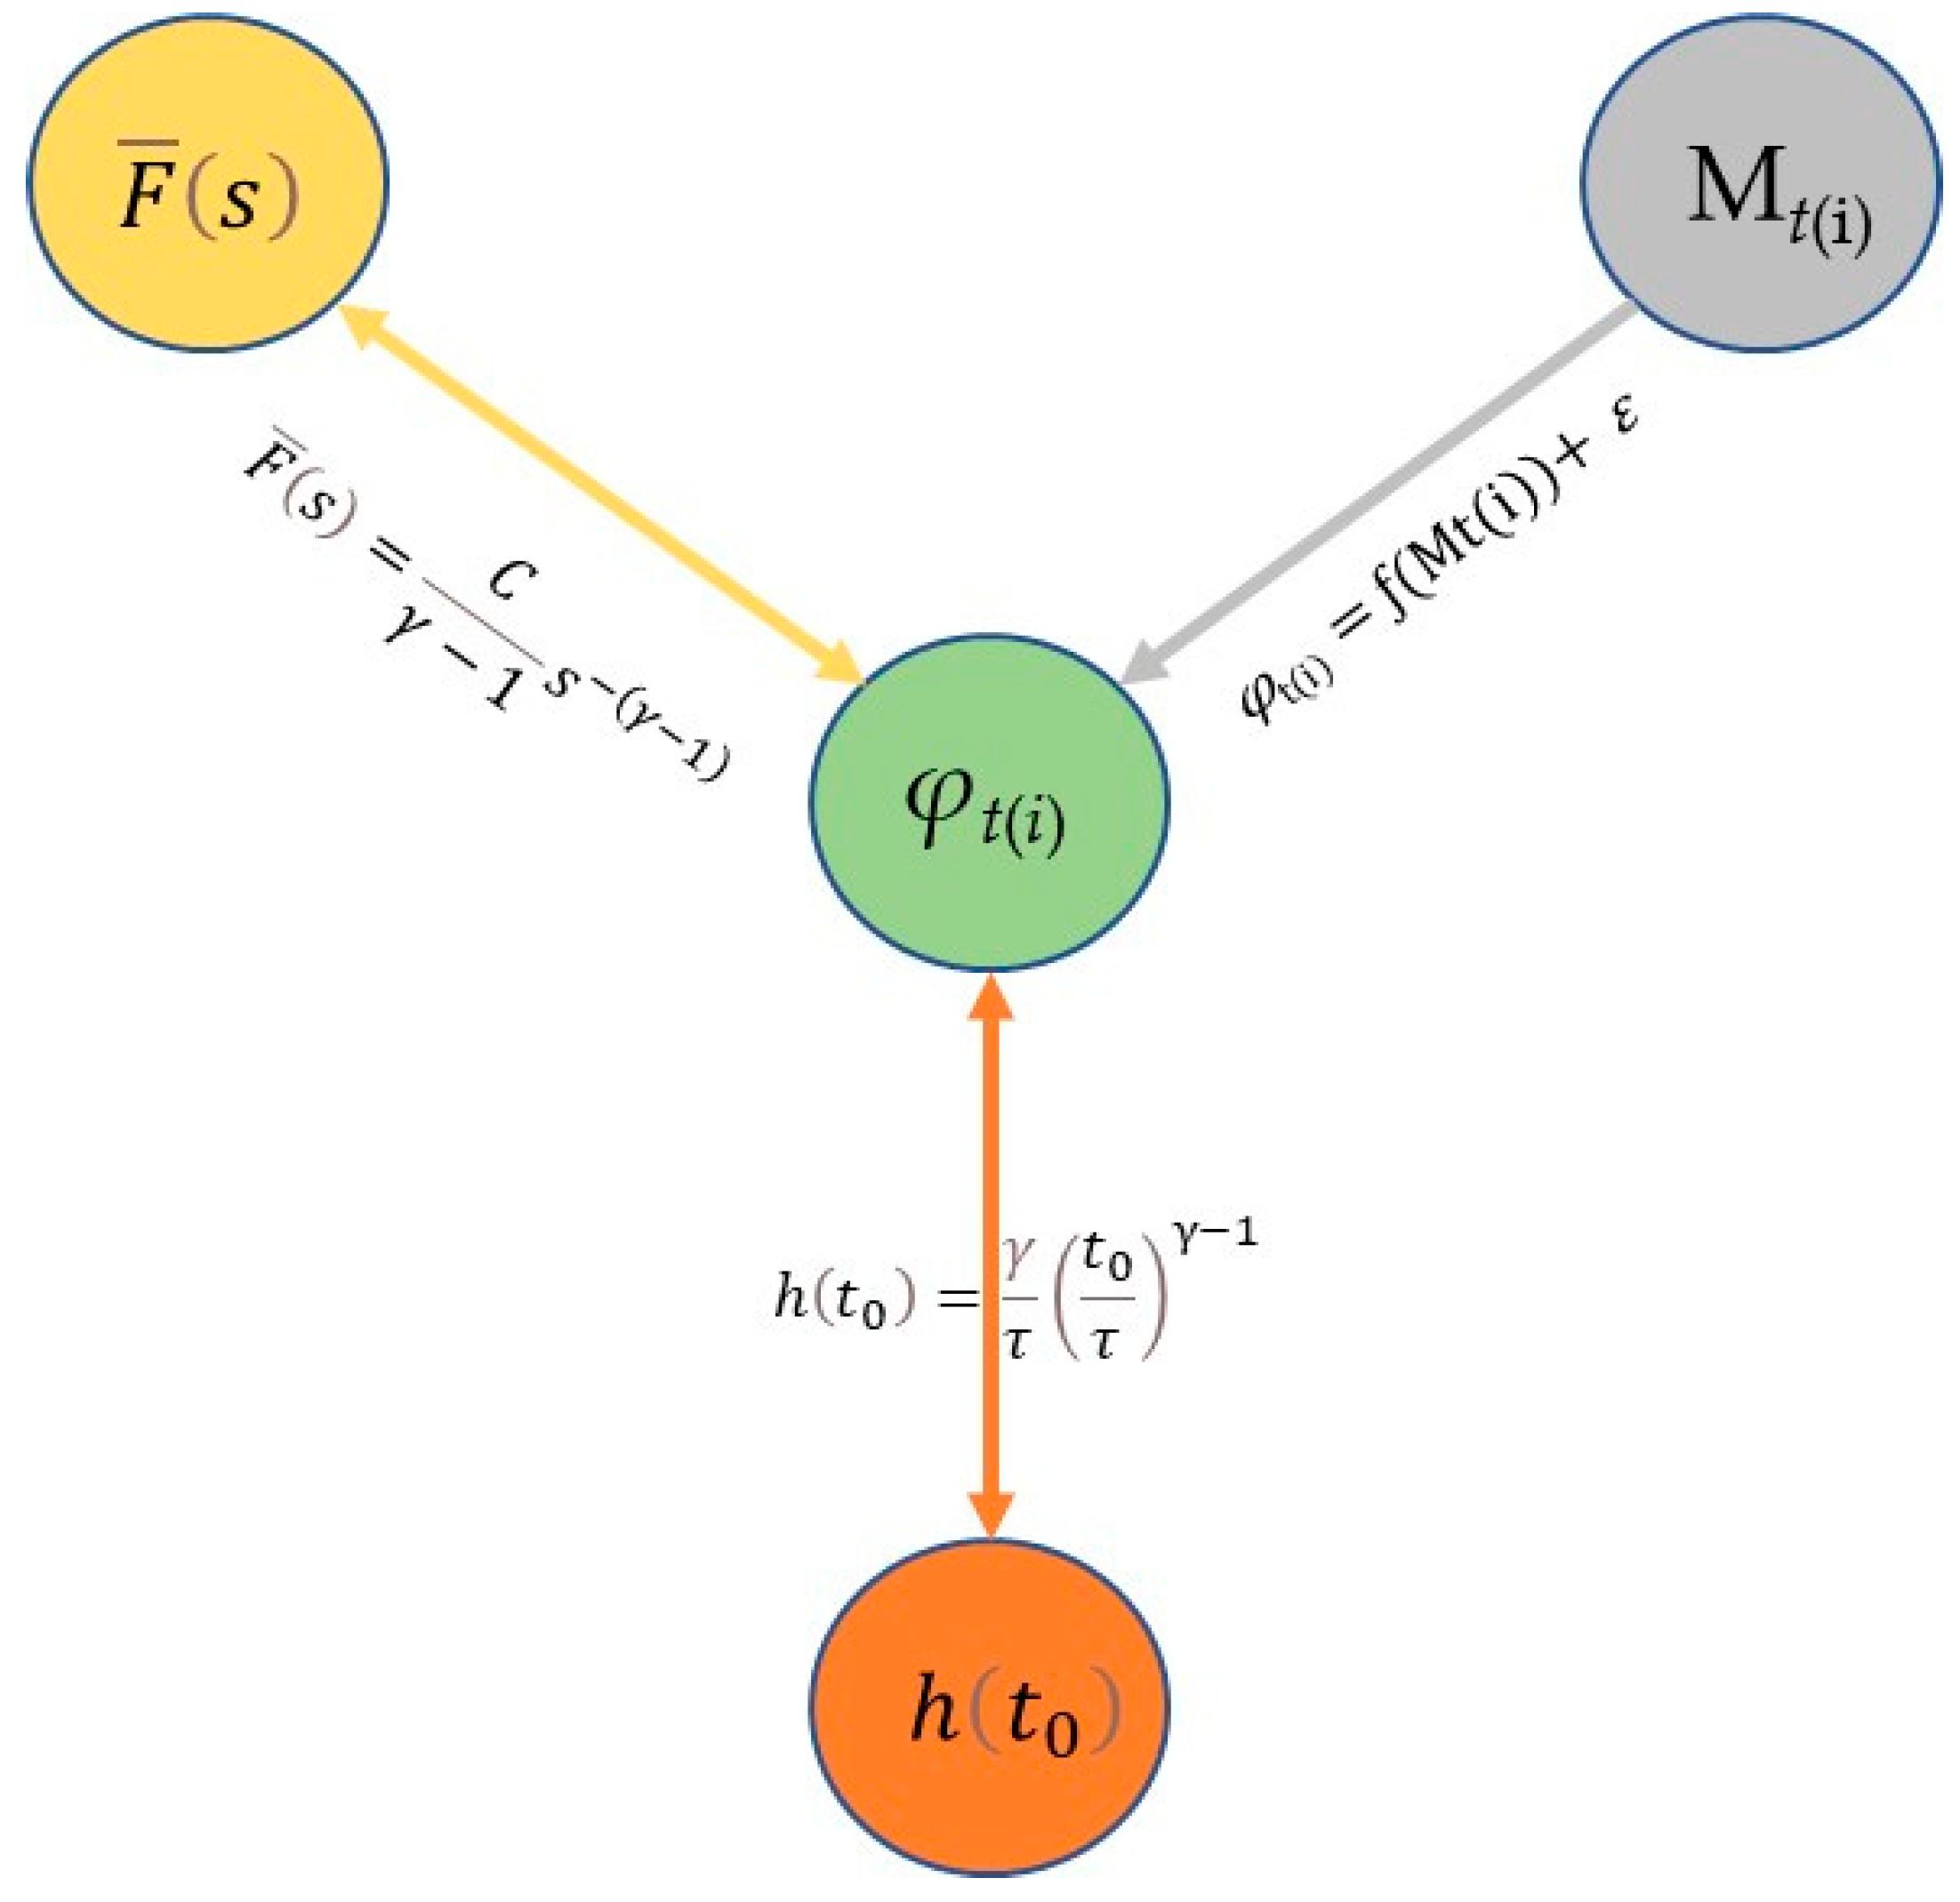
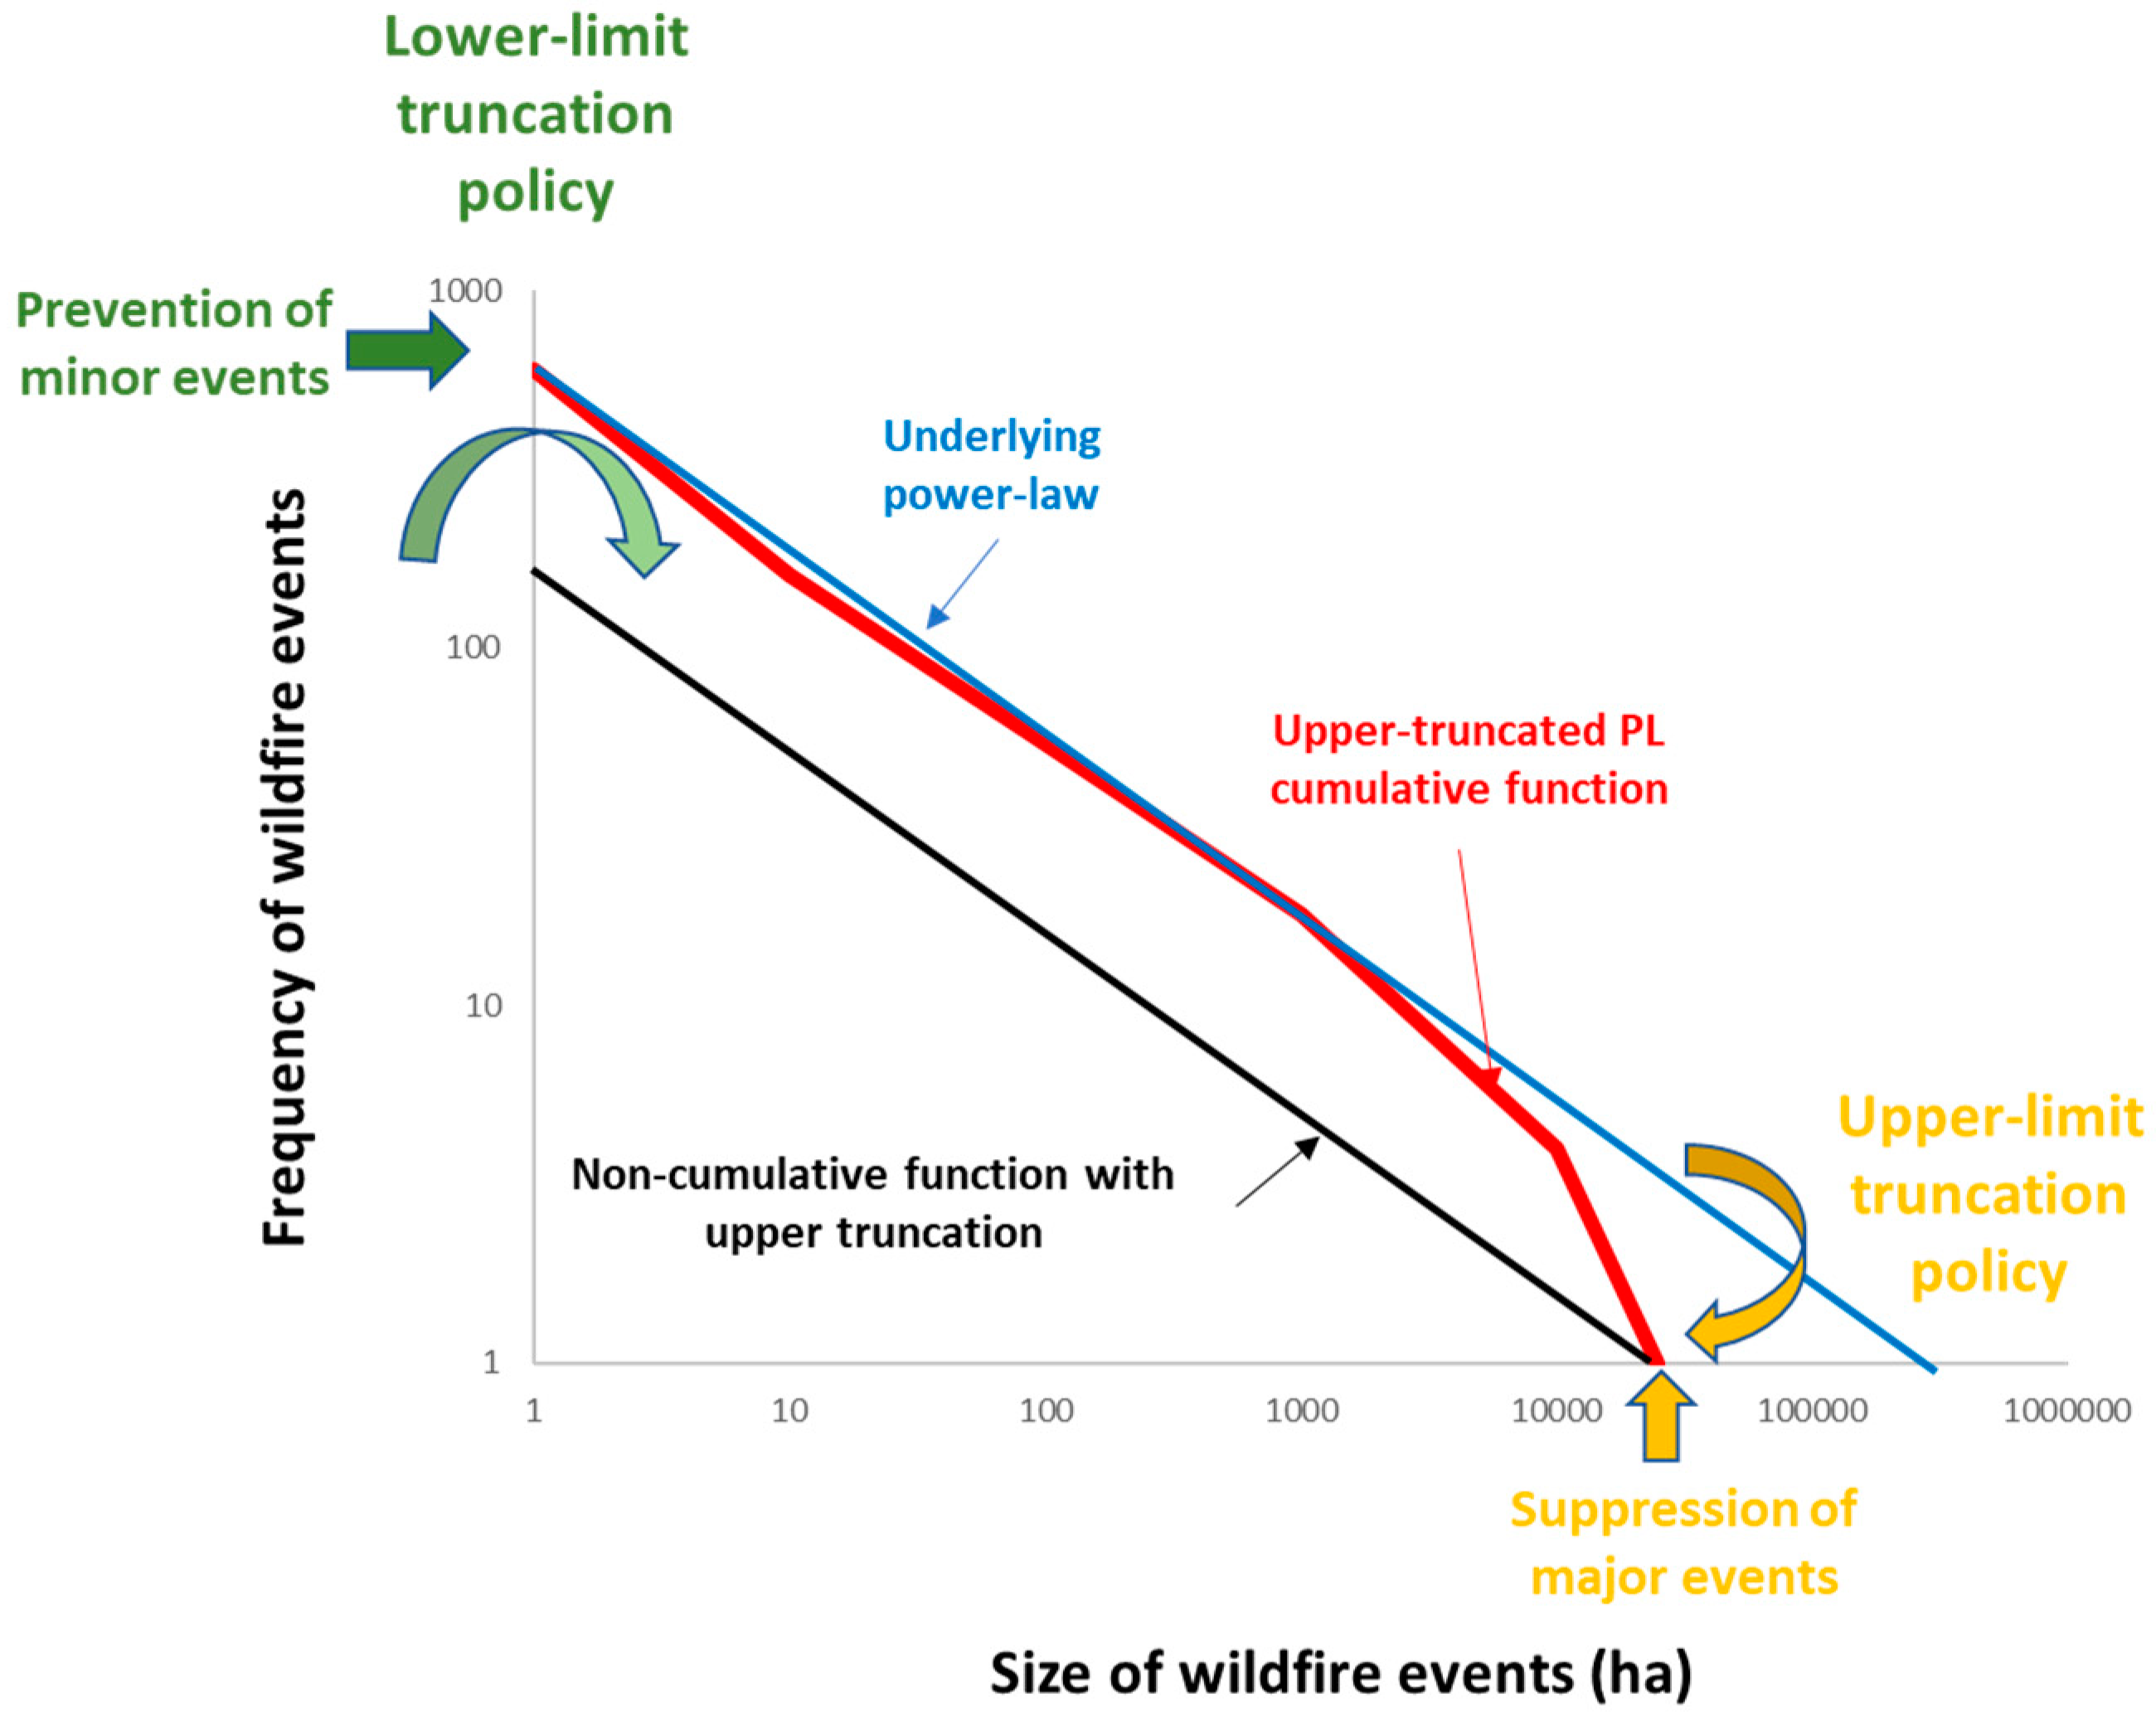
2.4. Estimation of Parameters of Wildfire Frequency–Size Distributions Methodology
2.5. Estimation of Parameters of Wildfire Interval Times Distributions Methodology
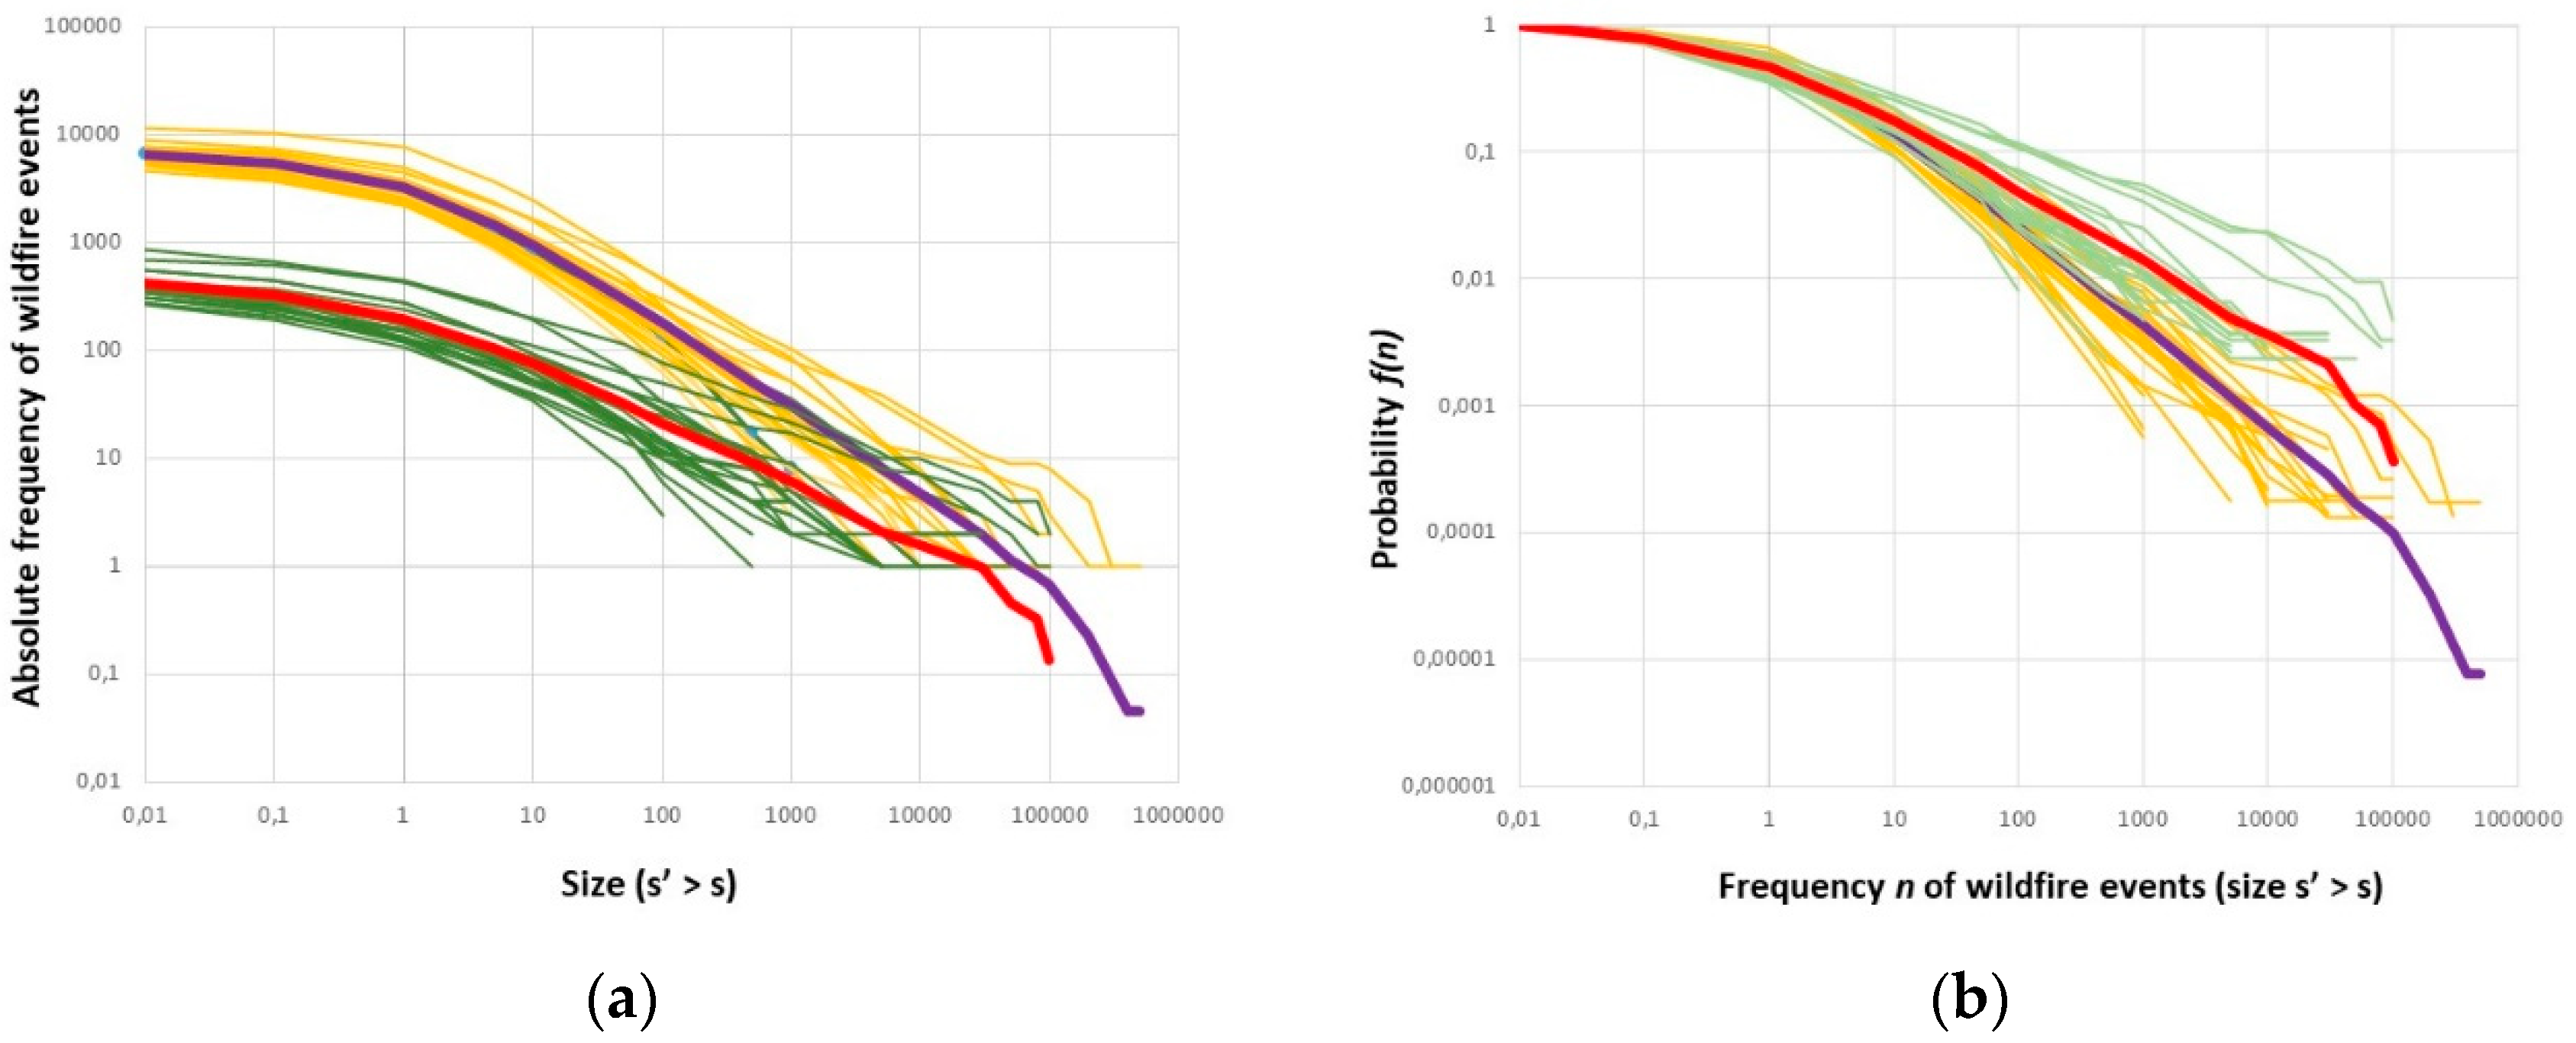
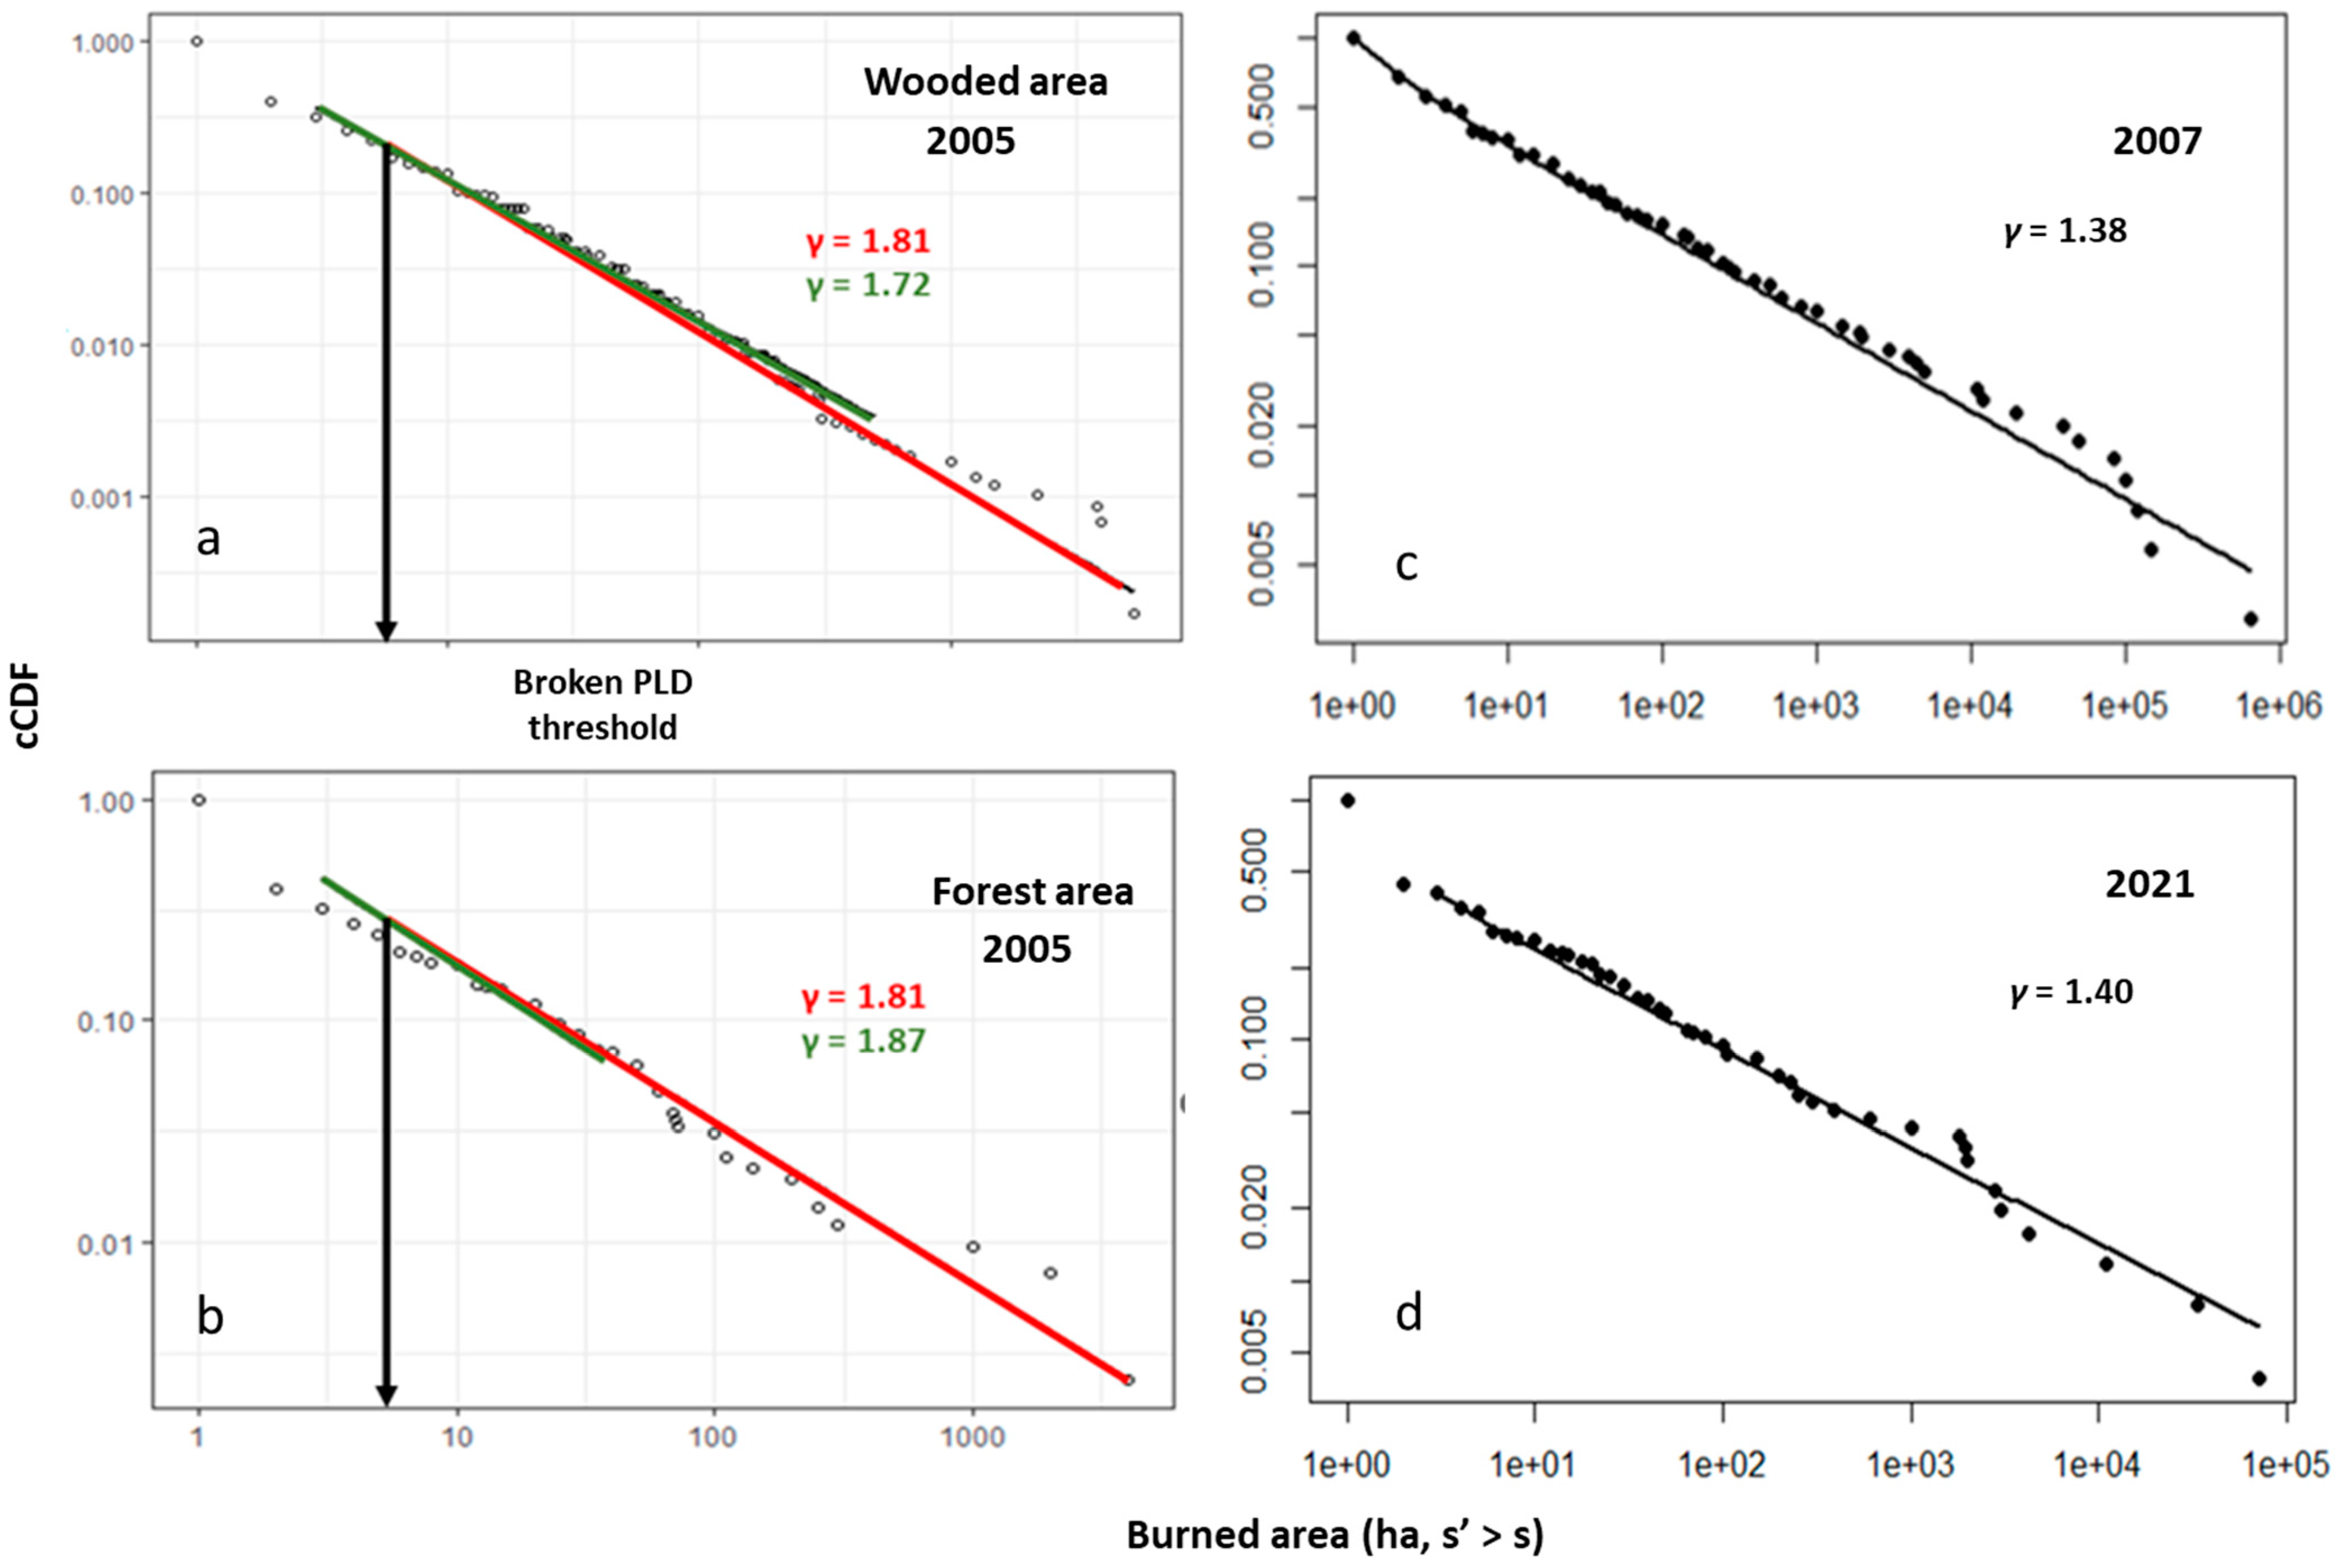
3. Results
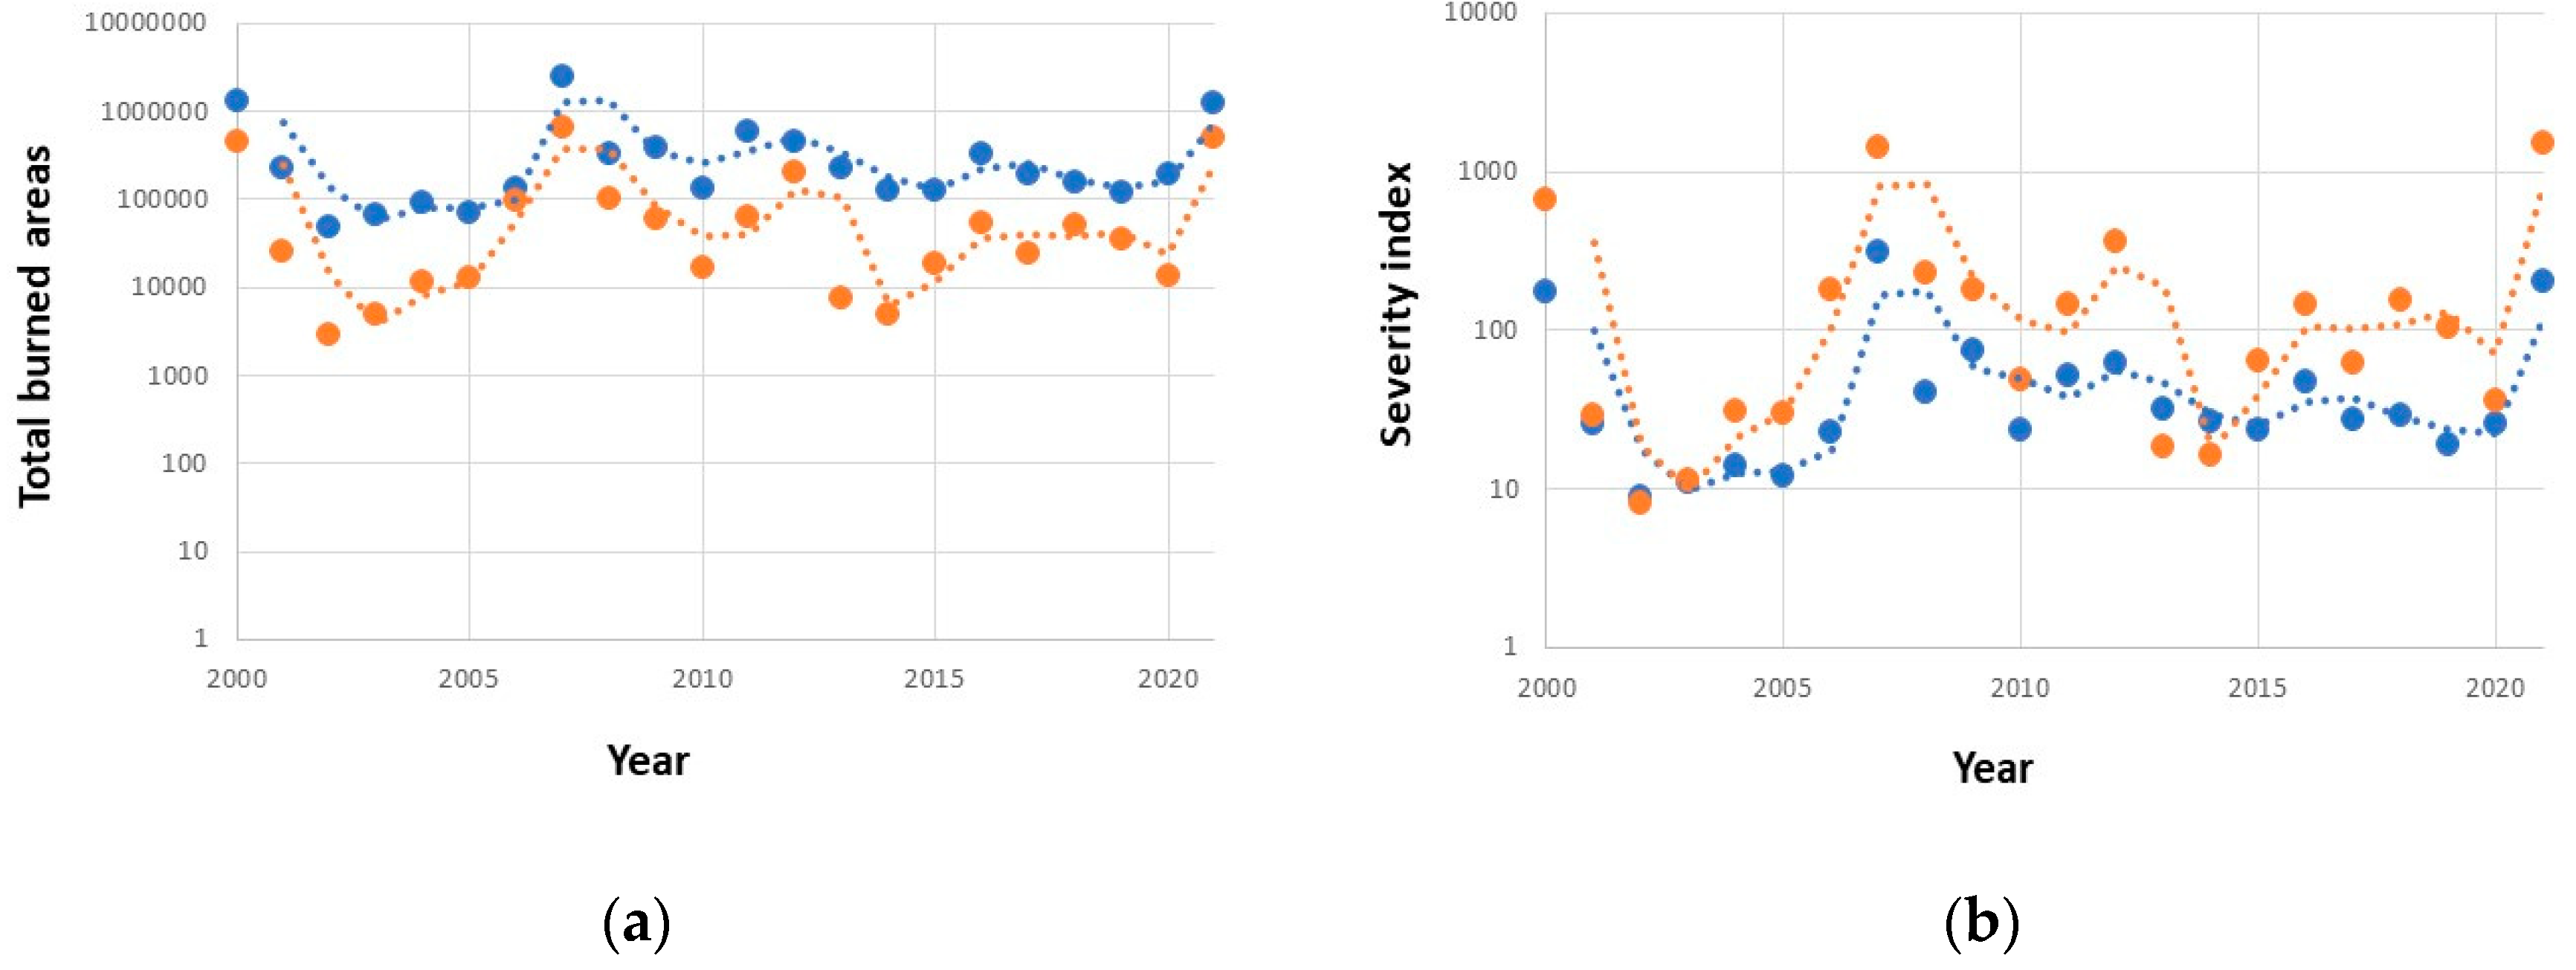
3.1. Wildfire Frequency–Size Distributions
- In eighteen over twenty-two years, burned areas are distributed as a single power–law, represented by a straight line in log-log scale; in the remaining four, a double power–law fits the actual distributions better;
- since 2000, the frequency of small-sized forest fires has increased;
- the evolution of the γ-scaling factor for forest areas presents a significant negative slope (standardized B = −0.297; p = 0.047), whereas it is non-significant for wooded areas (standardized B = 0.48; p = 0.861).
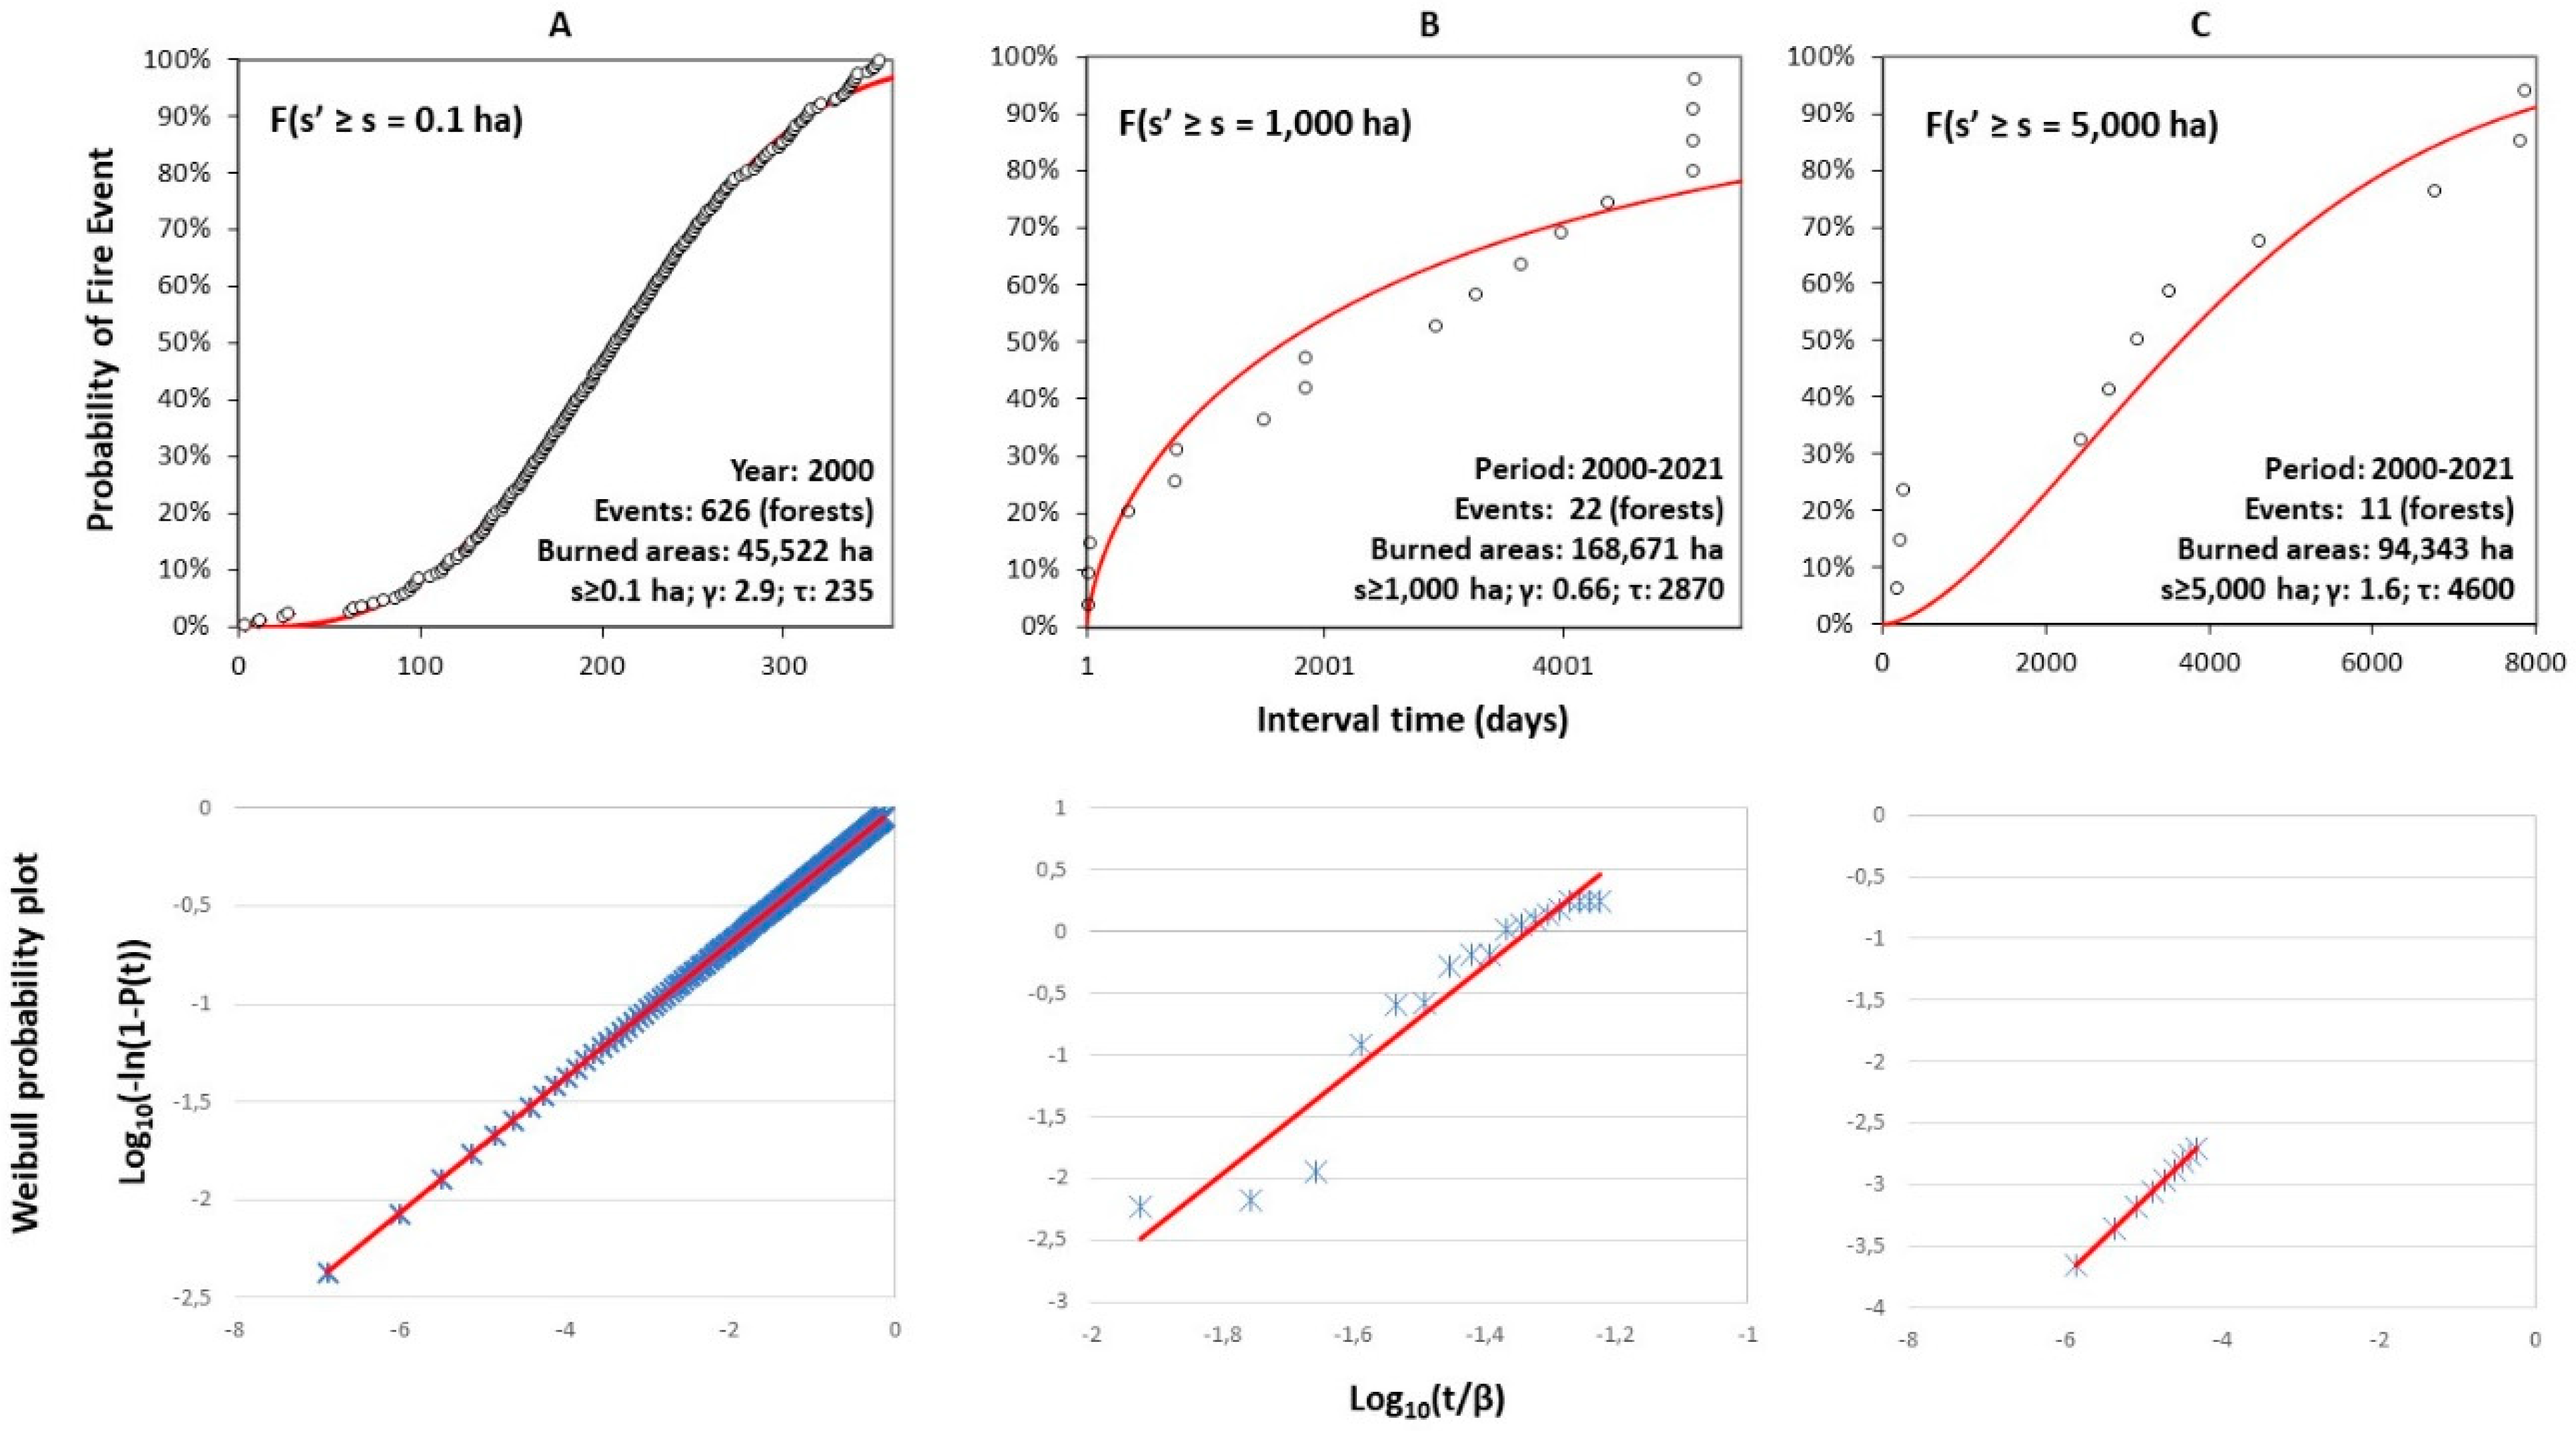
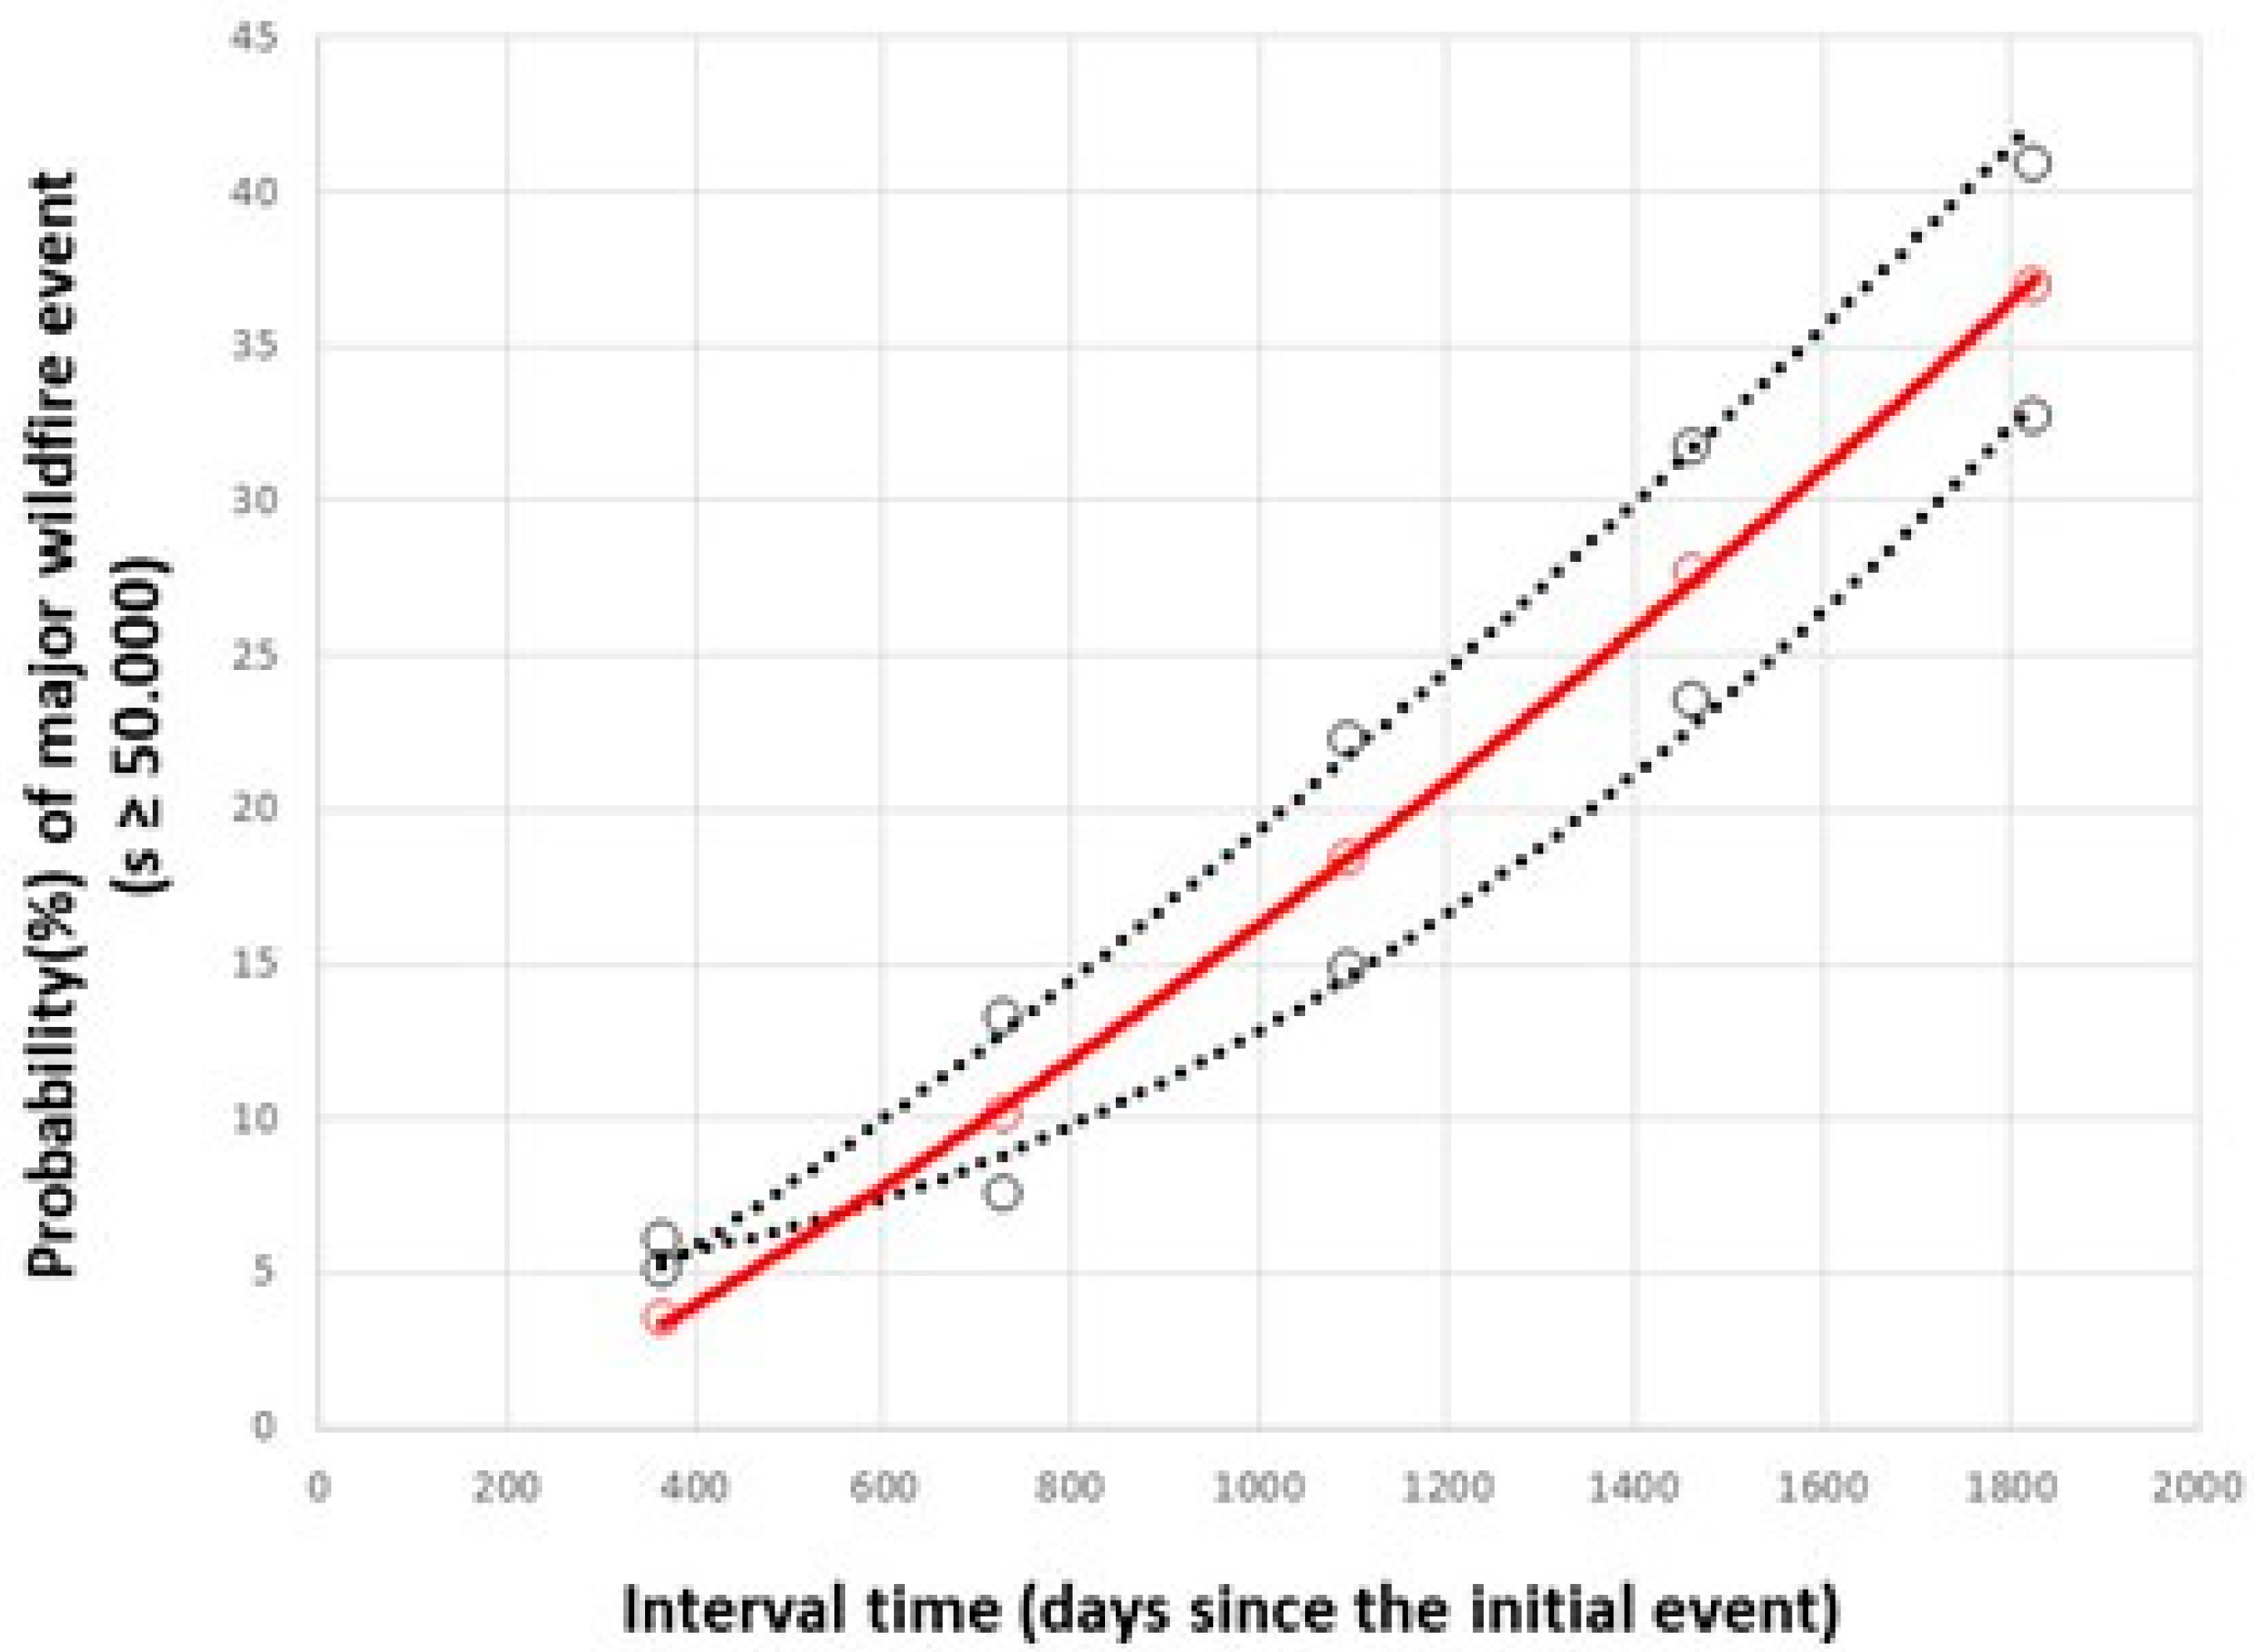
3.2. Wildfire Time Intervals Distributions
3.3. Automatic Linear Models of Relationships between Wildfire and Modernization Stressors
4. Discussion
5. Conclusions
Author Contributions
Funding
Acknowledgments
Conflicts of Interest
Appendix A

| Variables | Range | Type of Data | Units | Source | Remarks/Definitions |
|---|---|---|---|---|---|
| Wildfires | Numeric, count Burned area, ignition time, duration of the event, interval times | Forest.area_x differs according to the institutional regime of ‘forest’ adopted in successive years. Wooded. Areas comprise forests, afforestation areas due to abandonment, plantations and tree cultivations, and shrublands. | |||
| Forest.area_1 | 1955–2021 | 103 m2, ha | a | ||
| Forest.area_2 | 2000–2021 | 103 m2, ha | b | ||
| Wooded.areas_3 | 2000–2021 | 103 m2, ha | c | ||
| Number of fire events | 1955–2021 | Numeric, count | # fires | a b c | All fire events recorded |
| Modernization | 1960–2021 | Numeric, count Census of population | 106 ind #ind/km2 | e, f, h | Population density is midyear rural or urban population divided by the corresponding land area in square kilometers. |
| Population | |||||
| Urb.pop_dens | |||||
| Rur.pop_dens | |||||
| RES/Hydro in energy mixture | 1990–2021 | Numeric, count | % | g | % energy produced by Renewable Energy Sources and Hydropower plants |
| Agricultural.land% Wooded.land% | 1961–2018 1990–2020 | Numeric, count Agricultural statistics | % Territory | d, g | Agricultural land is the share of arable land under permanent crops and pastures. Forest area is land under natural or planted trees of at least 5 m in situ. |
| GDP/cap_PPP | 1990–2021 | Numeric, count Economic statistics | Current $ | d, h | Per capita values for the gross domestic product in current international $ converted by purchasing power parity (PPP) conversion factor. |
| Energy.consumption/cap | 1960–2014 | Numeric, count Energy statistics | kWh/cap | d, i | Production of power plants and combined heat and power plants less transmission, distribution, and transformation losses and use by heat and power plants. |
| Automobile fleet | 1985–2020 | Numeric, count | Number | h | Total of cars, trucks, motorbikes |
| Political risk | 1955–2021 | Nominal | Y/N | i | General elections for the Parliament |
| Climate change anomalies | 1979–2021 | Numeric, count | dimensionless | k | Deviations of Temperature and Precipitation from the 30-year average. |
References
- Shin, Y.; Midgley, G.F.; Archer, E.R.M.; Arneth, A.; Barnes, D.K.A.; Chan, L.; Hashimoto, S.; Hoegh-Guldberg, O.; Insarov, G.; Leadley, P.; et al. Actions to Halt Biodiversity Loss Generally Benefit the Climate. Glob. Chang. Biol. 2022, 28, 2846–2874. [Google Scholar] [CrossRef]
- van den Bergh, J.C.J.M.; Grazi, F. Ecological Footprint Policy? Land Use as an Environmental Indicator: Footprint Policy? J. Ind. Ecol. 2014, 18, 10–19. [Google Scholar] [CrossRef]
- Cafaro, P. Three Ways to Think about the Sixth Mass Extinction. Biol. Conserv. 2015, 192, 387–393. [Google Scholar] [CrossRef]
- Costanza, R.; de Groot, R.; Braat, L.; Kubiszewski, I.; Fioramonti, L.; Sutton, P.; Farber, S.; Grasso, M. Twenty Years of Ecosystem Services: How Far Have We Come and How Far Do We Still Need to Go? Ecosyst. Serv. 2017, 28, 1–16. [Google Scholar] [CrossRef]
- Crutzen, P.J. Geology of mankind. Nature 2002, 415, 23. [Google Scholar] [CrossRef] [PubMed]
- Cronon, W. Uncommon Ground: Rethinking the Human Place in Nature; Norton: New York, NY, USA, 1995. [Google Scholar]
- Pyne, S.J. The human geography of fire: A research agenda. Prog. Hum. Geogr. 2009, 33, 443–446. [Google Scholar] [CrossRef]
- Drossel, B. Self-organized criticality due to a separation of energy scales. Phys. A Stat. Mech. Its Appl. 1997, 236, 309–320. [Google Scholar] [CrossRef]
- Agee, J.K. Fire Ecology of Pacific Northwest Forests; Island Press: Washington, DC, USA; Covelo, CA, USA, 1996. [Google Scholar]
- Keeley, J.E.; Pausas, J.G. Evolutionary Ecology of Fire. Annu. Rev. Ecol. Evol. Syst. 2022, 53, 203–255. [Google Scholar] [CrossRef]
- Pyne, S.J. Problems, paradoxes, paradigms: Triangulating fire research. Int. J. Wildland Fire 2007, 16, 271–276. [Google Scholar] [CrossRef]
- Archibald, S.; Lehmann, C.E.; Gómez-Dans, J.L.; Bradstock, R.A. Defining pyromes and global syndromes of fire regimes. Proc. Natl. Acad. Sci. USA 2013, 10, 6442–6447. [Google Scholar] [CrossRef]
- Hardy, C.H. Wildland fire hazard and risk: Problems, definition, and context. For. Ecol. Manag. 2005, 211, 73–82. [Google Scholar] [CrossRef]
- Bowman, D.M.J.S.; Balch, J.; Artaxo, P.; Bond, W.J.; Cochrane, M.A.; D’Antonio, C.M.; DeFries, R.; Johnston, F.H.; Keeley, J.E.; Krawchuk, M.A.; et al. The human dimension of fire regimes on Earth. J. Biogeogr. 2011, 38, 2223–2236. [Google Scholar] [CrossRef]
- Bowman, D.M.J.S.; O’Brien, J.A.; Goldammer, J.G. Pyrogeography and the Global Quest for sustainable Fire Management. Annu. Rev. Environ. Resour. 2013, 38, 57–80. [Google Scholar] [CrossRef]
- Crutzen, P.J.; Goldammer, J.G. (Eds.) Fire in the Environment: The Ecological, Atmospheric and Climatic Importance of Vegetation Fires. In Dahlem Workshop Reports: Environmental Sciences Research Reports 13; Wiley: Chichester, UK, 1993. [Google Scholar]
- Edwards, D.P.; Socolar, J.B.; Mills, S.C.; Burivalova, Z.; Koh, L.P.; Wilcove, D.S. Conservation of Tropical Forests in the Anthropocene. Curr. Biol. 2019, 29, R1008–R1020. [Google Scholar] [CrossRef] [PubMed]
- Saravia, L.A.; Doyle, S.R.; Bond-Lamberty, B. Power laws and critical fragmentation in global forests. Sci. Rep. 2018, 8, 17766. [Google Scholar] [CrossRef] [PubMed]
- Flannigan, M.D.; Krawchuk, M.A.; de Groot, W.J.; Wotton, B.M.; Gowman, L.M. Implications of changing climate for global wildland fire. Int. J. Wildland Fire 2009, 18, 483–507. [Google Scholar] [CrossRef]
- Bowman, D.M.J.S.; Balch, J.K.; Artaxo, P.; Bond, W.J.; Carlson, J.M.; Cochrane, M.A.; D’Antonio, C.M.; DeFries, R.S.; Doyle, J.C.; Harrison, S.P.; et al. Fire in the Earth system. Science 2009, 324, 481–484. [Google Scholar] [CrossRef]
- Tedim, F.; Leone, V.; Coughlan, M.; Bouillon, C.; Xanthopoulos, G.; Royé, D.; Correia, F.J.; Ferreira, C. Extreme wildfire events: The definition. In Extreme Wildfire Events and Disasters; Elsevier: Amsterdam, The Netherlands, 2020; pp. 3–29. [Google Scholar] [CrossRef]
- Pausas, J.C.; Llovet, J.; Rodrigo, A.; Vallejo, R. Are wildfires a disaster in the Mediterranean basin?—A review. Int. J. Wildland Fire 2008, 17, 713–723. [Google Scholar] [CrossRef]
- Jones, M.W.; Abatzoglou, J.T.; Veraverbeke, S.; Andela, N.; Lasslop, G.; Forkel, M.; Smith, A.J.P.; Burton, C.; Betts, R.A.; van der Werf, G.R.; et al. Global and Regional Trends and Drivers of Fire Under Climate Change. Rev. Geophys. 2022, 60, e2020RG000726. [Google Scholar] [CrossRef]
- Silva, J.; Marques, J.; Goncalves, I.; Brito, R.; Teixeira, S.; Teixeira, J.; Alvelos, F. A Systematic Review and Bibliometric Analysis of Wildland Fire Behavior Modeling. Fluids 2022, 7, 374. [Google Scholar] [CrossRef]
- Mather, A.S.; Needle, C.L. The forest transition: A theoretical basis. Area 1998, 30, 117–124. [Google Scholar] [CrossRef]
- Kirk, D. Demographic transition theory. Popul. Stud. A J. Demogr. 1996, 50, 361. [Google Scholar] [CrossRef]
- Caldwell, J.C. Toward A Restatement of Demographic Transition Theory. Popul. Dev. Rev. 1976, 2, 321–366. [Google Scholar] [CrossRef]
- Clausen, R.; York, R. Global biodiversity decline of marine and freshwater fish: A cross-national analysis of economic, demographic, and ecological influences. Soc. Sci. Res. 2008, 37, 1310–1320. [Google Scholar] [CrossRef]
- Buttel, F.H. Ecological modernization as social theory. Geoforum 2000, 31, 57–65. [Google Scholar] [CrossRef]
- Tandetzki, J.; Schier, F.; Koethke, M.; Weimar, H. An evidence and gap map of the environmental Kuznets curve and the forest transition hypothesis for estimating forest area development. Environ. Res. Lett. 2022, 17, 123005. [Google Scholar] [CrossRef]
- Scarrow, R. Corruption drives deforestation. Nat. Plants 2017, 3, 910. [Google Scholar] [CrossRef]
- Morpurgo, J.; Kissling, W.D.; Tyrrell, P.; Negret, P.J.; van Bodegom, P.M.; Allan, J.R. The role of elections as drivers of tropical deforestation. Biol. Conserv. 2023, 279, 109832. [Google Scholar] [CrossRef]
- Spiegel, S.J. Deforestation: Call for justice, not militarization. Nature 2008, 453, 280. [Google Scholar] [CrossRef]
- Blume, L.R.; Sauls, L.A.; Knight, C.A.C.J. Tracing territorial-illicit relations: Pathways of influence and prospects for governance. Political Geogr. 2022, 97, 102690. [Google Scholar] [CrossRef]
- Kitcher, P. Two approaches to explanation. J. Philos. 1985, 82, 632–639. [Google Scholar] [CrossRef]
- Mantero, G.; Morresi, D.; Marzano, R.; Motta, R.; Mladenoff, D.J.; Garbarino, M. The influence of land abandonment on forest disturbance regimes: A Global Review. Landsc. Ecol. 2020, 35, 2723–2744. [Google Scholar] [CrossRef]
- Oliveira, T.M.; Guiomar, N.; Baptista, F.O.; Pereira, J.M.C.; Claro, J. Is Portugal’s forest transition going up in smoke? Land Use Policy 2017, 66, 214–226. [Google Scholar] [CrossRef]
- Kumagai, Y.; Carroll, M.S.; Cohn, P. Coping with Interface Wildfire as a Human Event: Lessons from the Disaster/Hazards literature. J. For. 2004, 102, 28–32. Available online: https://www.proquest.com/scholarly-journals/coping-with-interface-wildfire-as-human-event/docview/220831208/se-2 (accessed on 14 September 2022).
- Song, W.G.; Wang, J.; Satoh, K.; Fan, W.C. Three types of power-law distribution of forest fires in Japan. Ecol. Model. 2006, 196, 527–532. [Google Scholar] [CrossRef]
- Narayanaraj, G.; Wimberly, M.C. Influences of Forest Roads on the Spatial Patterns of Human- and Lightning-Caused Wildfire Ignitions. Appl. Geogr. 2012, 32, 878–888. [Google Scholar] [CrossRef]
- Ricotta, C.; Avena, G.; Marchetti, M. The Flaming Sandpile: Self-Organized Criticality and Wildfires. Ecol. Model. 1999, 119, 73–77. [Google Scholar] [CrossRef]
- Bak, P.; Chen, K.; Tang, C. A Forest-Fire Model and Some Thoughts on Turbulence. Phys. Lett. A 1990, 147, 297–300. [Google Scholar] [CrossRef]
- Bak, P.; Tang, C.; Wiesenfeld, K. Self-Organized Criticality: An Explanation of the 1/f Noise. Phys. Rev. Lett. 1987, 59, 381–384. [Google Scholar] [CrossRef]
- Clar, S.; Drossel, B.; Schwabl, F. Forest Fires and Other Examples of Self-Organized Criticality. J. Phys. Condensed. Matter 1996, 8, 6803–6824. [Google Scholar] [CrossRef]
- Clar, S.; Drossel, B.; Schwabl, F. Scaling Laws and Simulation Results for the Self-Organized Critical Forest-Fire Model. Phys. Rev. E 1994, 50, 1009–1018. [Google Scholar] [CrossRef]
- Drossel, B.; Schwabl, F. Self-Organized Criticality in a Forest-Fire Model. Phys. A Stat. Mech. Its Appl. 1992, 191, 47–50. [Google Scholar] [CrossRef]
- Turcotte, D.L. Self-Organized Criticality. Rep. Prog. Phys. 1994, 62, 1377–1429. [Google Scholar] [CrossRef]
- Jørgensen, S.E.; Mejer, H.; Nielsen, S.N. Ecosystem as Self-Organizing Critical Systems. Ecol. Model. 1998, 111, 261–268. [Google Scholar] [CrossRef]
- Abaimov, S.G.; Turcotte, D.L.; Shcherbakov, R.; Rundle, J.B. Recurrence and Interoccurrence Behavior of Self-Organized Complex Phenomena. Nonlinear Process. Geophys. 2007, 14, 455–464. [Google Scholar] [CrossRef]
- Lin, J.; Rinaldi, S.A. Derivation of the Statistical Characteristics of Forest Fires. Ecol. Model. 2009, 220, 898–903. [Google Scholar] [CrossRef]
- Corral, Á.; Telesca, L.; Lasaponara, R. Scaling and Correlations in the Dynamics of Forest-Fire Occurrence. Phys. Rev. E 2008, 77, 016101. [Google Scholar] [CrossRef]
- Dietz, S.; Adger, W.N. Economic growth, biodiversity loss and conservation effort. J. Environ. Manag. 2003, 68, 23–35. [Google Scholar] [CrossRef]
- Mills, J.H.; Waite, T.A. Economic prosperity, biodiversity conservation, and the environmental Kuznets curve. Ecol. Econ. 2009, 68, 2087–2095. [Google Scholar] [CrossRef]
- Pausas, J.G.; Ribeiro, E. The global fire productivity relationship. Glob. Ecol. Biogeogr. 2013, 22, 728–736. [Google Scholar] [CrossRef]
- Morley, J.; Buchanan, G.; Mitchard, E.T.A.; Keane, A. Quasi-experimental analysis of new mining developments as a driver of deforestation in Zambia. Sci. Rep. 2022, 12, 18252. [Google Scholar] [CrossRef]
- Troumbis, A.Y.; Kontos, T.; Gagani, K.M. Wildfire, bad governance and the silvacide triangle in Greece: A meta-regression analysis. 2023; in preparation. [Google Scholar]
- Brown, K.; Pearce, D.W. The Causes of Tropical Deforestation: The Economic and Statistical Analysis of Factors Giving Rise to the Loss of the Tropical Forests; University of British Columbia Press: Vancouver, BC, Canada, 1994. [Google Scholar]
- Mills Busa, J.H. Dynamite in the EKC Tunnel? Inconsistencies in Resource Stock Analysis under the Environmental Kuznets Curve Hypothesis. Ecol. Econ. 2013, 94, 116–126. [Google Scholar] [CrossRef]
- Altıntaş, H.; Kassouri, Y. Is the Environmental Kuznets Curve in Europe Related to the Per-Capita Ecological Footprint or CO2 Emissions? Ecol. Indic. 2020, 113, 106187. [Google Scholar] [CrossRef]
- York, R.; Rosa, E.A.; Dietz, T. Footprints on the Earth: The environmental consequences of modernity. Am. Sociol. Rev. 2003, 68, 279–300. [Google Scholar] [CrossRef]
- Czech, B. Prospects for reconciling the conflict between economic growth and biodiversity conservation with technological progress. Conserv. Biol. 2008, 22, 1389–1398. [Google Scholar] [CrossRef]
- Long, S. Regression Models for Categorical and Limited Dependent Variables; Sage: Thousand Oaks, CA, USA, 1997. [Google Scholar]
- Cade, B.S.; Noon, B.R. A Gentle Introduction to Quantile Regression for Ecologists. Front. Ecol. Environ. 2003, 1, 412–420. [Google Scholar] [CrossRef]
- Tabachnick, B.G.; Fidel, T.R. Using Multivariate Statistics, 6th ed.; Pearson: Bloomington, MN, USA, 2013. [Google Scholar]
- Yang, H. The Case for Being Automatic: Introducing the Automatic Linear Modeling (LINEAR) Procedure in SPSS Statistics. Mult. Linear Regres. Viewp. 2013, 39, 27–37. Available online: https://www.semanticscholar.org/paper/The-Case-for-Being-Automatic%3A-Introducing-the-in-Yang/ee9965f9991b14016a014fffa8e666852cb3247b (accessed on 14 September 2022).
- Serra-Peralta, M.; Serra, J.; Corral, A. Lognormals, power laws and double power laws in the distribution of frequencies of harmonic codewords from classical music. Sci. Rep. 2022, 12, 2615. [Google Scholar] [CrossRef]
- Newman, M. Power Laws, Pareto Distributions and Zipf’s Law. Contemp. Phys. 2005, 46, 323–351. [Google Scholar] [CrossRef]
- White, E.P.; Enquist, B.J.; Green, J.L. On estimating the exponent of power-law frequency distributions. Ecology 2008, 89, 905–912. [Google Scholar] [CrossRef]
- Clauset, A.; Shalizi, C.R.; Newman, M.E.J. Power-Law Distributions in Empirical Data. SIAM Rev. 2009, 51, 661–703. [Google Scholar] [CrossRef]
- Maschberger, T.; Kroupa, P. Estimators for the Exponent and Upper Limit, and Goodness-of-Fit Tests for (Truncated) Power-Law Distributions. Mon. Not. R. Astron. Soc. 2009, 395, 931–942. [Google Scholar] [CrossRef]
- Gillespie, C.S. Fitting Heavy Tailed Distributions: The PoweRlaw Package. J. Stat. Softw. 2015, 64, 2. [Google Scholar] [CrossRef]
- Wang, Y.V.; Sebastian, A. Equivalent hazard magnitude scale. Nat. Hazards Earth Syst. Sci. 2022, 22, 4103–4118. [Google Scholar] [CrossRef]
- Palaiologou, P.; Kalabokidis, K.; Troumbis, A.; Day, M.A.; Nielsen-Pincus, M.; Ager, A.A. Socio-Ecological Perceptions of Wildfire Management and Effects in Greece. Fire 2021, 4, 18. [Google Scholar] [CrossRef]
- Troumbis, A.Y.; Kalabokidis, K.; Palaiologou, P. Diverging Rationalities between Forest Fire Management Services and the General Public after the 21st-Century Mega-Fires in Greece. J. For. Res. 2022, 33, 553–564. [Google Scholar] [CrossRef]
- Berkes, F.; Colding, J.; Folke, C. Navigating Social-Ecological Systems: Building Resilience for Complexity and Change; Cambridge University Press: Cambridge, UK, 2003. [Google Scholar]
- Iliadis, L.S.; Papastavrou, A.K.; Lefakis, P.D. A Heuristic Expert System for Forest Fire Guidance in Greece. J. Environ. Manag. 2002, 65, 327–336. [Google Scholar] [CrossRef]
- Kountouris, Y. Examining the relationship between elections and wildfires. Int. J. Wildland Fire 2021, 30, 6–17. [Google Scholar] [CrossRef]
- List, J.A.; Sturm, D.M. How elections matter: Theory and evidence from environmental policy. Q. J. Econ. 2006, 121, 1249–1281. [Google Scholar] [CrossRef]
- Pailler, S. Re-election incentives and deforestation cycles in the Brazilian Amazon. J. Environ. Econ. Manag. 2018, 88, 345–365. [Google Scholar] [CrossRef]
- Ruggiero, P.G.C.; Pfaff, A.; Nichols, E.; Rosa, M.; Metzger, J.P. Election cycles affect deforestation within Brazil’s Atlantic Forest. Conserv. Lett. 2021, 14, e12818. [Google Scholar] [CrossRef]
- Rose, R.; Peiffer, C. Bad Governance and Corruption; Springer: Berlin/Heidelberg, Germany, 2019. [Google Scholar]
- Troumbis, A.Y. Biodiversity Conservation vs. Ecological Modernization in Post-Crisis Greece: Environmental Syndemics and the Biodiversity Degradation Syndrome. In The Geography of Greece. Managing Crises and Building Resilience; Darques, R., Sidiropoulos, G., Kalabokidis, K., Eds.; World Regional Geography Book Series; Springer Nature: Cham, Switzerland, 2023. [Google Scholar]
- Sapountzaki, K.; Karka, H. The Element of Sustainability in the Greek Statutory Spatial Planning System: A Real Operational Concept or a Political Declaration? Eur. Plan. Stud. 2001, 9, 407–426. [Google Scholar] [CrossRef]
- Apostolopoulou, E.; Pantis, J.D. Conceptual Gaps in the National Strategy for the Implementation of the European Natura 2000 Conservation Policy in Greece. Biol. Conserv. 2009, 142, 221–237. [Google Scholar] [CrossRef]
- UNDRR/GFMC. Conclusions and Proposals of the Independent Committee Tasked to Investigate the Underlying Causes and Explore the Perspectives for the Future Management of Landscape Fires in Greece. 2019. Available online: https://gfmc.online/allgemein/press-release.html (accessed on 14 September 2022).
- Floress, K.; Huff, E.S.; Snyder, S.A.; Koshollek, A.; Butler, S.; Allred, S.B. Factors Associated with Family Forest Owner Actions: A Vote-Count Meta-Analysis. Landsc. Urban Plan. 2019, 188, 19–29. [Google Scholar] [CrossRef]
- Weir, J.R.; Kreuter, U.P.; Wonkka, C.L.; Twidwell, D.; Stroman, D.A.; Russell, M.; Taylor, C.A. Liability and Prescribed Fire: Perception and Reality. Rangel. Ecol. Manag. 2019, 72, 533–538. [Google Scholar] [CrossRef]
- Wu, H.; Miller, Z.D.; Wang, R.; Zipp, K.Y.; Newman, P.; Shr, Y.H.; Dems, C.L.; Taylor, A.; Kaye, M.W.; Smithwick, E.A.H. Public and manager perceptions about prescribed fire in the Mid-Atlantic, United States. J. Environ. Manag. 2022, 322, 116100. [Google Scholar] [CrossRef] [PubMed]
- Peterson St-Laurent, G.; Hagerman, S.; Findlater, K.M.; Kozak, R. Public Trust and Knowledge in the Context of Emerging Climate-Adaptive Forestry Policies. J. Environ. Manag. 2019, 242, 474–486. [Google Scholar] [CrossRef]
- Wilson, P.I.; Paveglio, T.; Becker, D. The Politically Possible and Wildland Fire Research. Fire 2018, 1, 12. [Google Scholar] [CrossRef]
- Farley, J. The role of prices in conserving critical Natural Capital. Conserv. Biol. 2008, 22, 1399–1408. [Google Scholar] [CrossRef]


| Methodology | Metadata | Remarks |
|---|---|---|
| Case study | Country: Greece | Although wildfire data are recorded at the Department level (51), country-wide sums are used here. |
| Range | 2000–2021 | More extensive periods were used when data were available, e.g., 1990–2021 or 1955–2021. |
| Relationships | ||
| Power-law distribution | PDF, CDF, cCDF | Probability Density Function, Cumulative Density Function, Complementary Cumulative Density Function |
| Models | Linear, Hyperbolic, Parabolic | Detection of the best-fit model |
| Dependent variables | Burned area, number of wildfires, interval times/year | Calculations of scaling factor γ, the lower size of burned area smin, upper size smax |
| Independent variables | ||
| Modernization variable | Penetration RES (%), (GDP_PPP $) | RES: Renewable Energy Sources, PPP: Purchasing Power Parity |
| Complementary variables | Population change, wooded areas%, agricultural land%, rural population density, automobile fleet, energy consumption/cap, political risk, climate anomalies | Collinear variables excluded |
| Regressions | Automatic Linear Modeling procedure | Definition of one subset from the pool of candidate predictors that gives adequate prediction accuracy as an alternative to various regression methods |
| Modernization Stressors | Remarks/Definitions |
|---|---|
| Population size Urban population density Rural population density | Total number of individuals residing during a census period Population density is midyear rural or urban population divided by the corresponding land area in square kilometers. |
| Agricultural land % Wooded land % | Agricultural land is the share of arable land under permanent crops and pastures. A forest (wooded) area is land under natural or planted trees of at least 5 m in situ. |
| GDP/cap_PPP $US | Per capita values for the gross domestic product in current international $ converted by purchasing power parity (PPP) conversion factor. |
| Energy consumption/cap | Production of power plants and combined heat and power plants less transmission, distribution, and transformation losses and use by heat and power plants. |
| RES/Hydro in energy mixture | % of the energy produced by Renewable Energy Sources and Hydropower plants |
| Automobile fleet | Total of cars, trucks, motorbikes |
| Political competition | General elections for the Parliament |
| Climate anomalies | Annual deviations (positive or negative) of mean temperature and precipitations from the 30-year average trend |
Disclaimer/Publisher’s Note: The statements, opinions and data contained in all publications are solely those of the individual author(s) and contributor(s) and not of MDPI and/or the editor(s). MDPI and/or the editor(s) disclaim responsibility for any injury to people or property resulting from any ideas, methods, instructions or products referred to in the content. |
© 2023 by the authors. Licensee MDPI, Basel, Switzerland. This article is an open access article distributed under the terms and conditions of the Creative Commons Attribution (CC BY) license (https://creativecommons.org/licenses/by/4.0/).
Share and Cite
Troumbis, A.Y.; Gaganis, C.M.; Sideropoulos, H. Probabilistic Wildfire Risk Assessment and Modernization Transitions: The Case of Greece. Fire 2023, 6, 158. https://doi.org/10.3390/fire6040158
Troumbis AY, Gaganis CM, Sideropoulos H. Probabilistic Wildfire Risk Assessment and Modernization Transitions: The Case of Greece. Fire. 2023; 6(4):158. https://doi.org/10.3390/fire6040158
Chicago/Turabian StyleTroumbis, Andreas Y., Cleo Maria Gaganis, and Haralambos Sideropoulos. 2023. "Probabilistic Wildfire Risk Assessment and Modernization Transitions: The Case of Greece" Fire 6, no. 4: 158. https://doi.org/10.3390/fire6040158