1. Introduction
High population density is one of the main specifications of urban areas, resulting in high population in cities and steadily growing traffic volumes. Consequently, traffic congestion, and its adverse effects such as noise and air pollution, increase. To reduce traffic congestion, a road network’s infrastructure should be built more comprehensively. An influential section of road infrastructure is road tunnels. Road tunnels provide effective engineering solutions and increase traffic capacity and accessibility, thus saving traveling time. They are also a good alternative to travel through physical barriers such as mountains.
Despite the benefits mentioned above, the significant weakness of road tunnels is the severity of the accidents that may occur in them. Accidents which may result in catastrophic consequences. Although the accident rate is lower in road tunnels, those accidents have a greater severity than those on open roads. For instance, a study in Italy has shown that road tunnels have a severe accident rate between 9.13 and 20.45 crashes/108 vehicles per km, while on the associated motorways the rate was between 8.62 and 10.14 crashes/108 vehicles per km [
1].
Fire is the most disastrous hazard in road tunnels [
2]. It can cause catastrophic consequences, such as human loss and structural damage. The current severity of tunnel fires is indicated by previous fire accidents, such as the Trans-Alpine accidents that occurred in St. Gotthard, Switzerland in 2001; Wuxi Lihu, China in 2010; and Viamala, Switzerland in 2006, accidents which cost the life of 11, 24, and nine people, respectively, and also caused extensive destruction of facilities and significant economic losses that by far exceeded the rehabilitation of the infrastructure [
3]. The common causes of tunnel fires are collisions, mechanical or electrical defects in vehicles, and driver behavior [
4,
5,
6,
7]. Zhang et al. [
8] studied the causes of vehicle fire through statistical analysis of defective vehicle recall data caused by fires in China and the United States. Based on their study, 37.24% of the total fires happened because of electrical system defects, 41.03% happened due to defects in the fuel system, and 15.17% from the flammable liquid transportation system.
In addition to fires resulting from a collision, an electrical fault in passenger cars and overheating brakes of heavy goods vehicles (HGVs) on a long downward slope may also result in fires in tunnels [
9]. A summarized list of fires in road and rail tunnels is presented in
Table 1. A more comprehensive list is given in [
10].
As mentioned, researchers have been inspired to learn more about tunnel fire dynamics because of the increasing number of large-scale incidents in urban tunnels and the catastrophic influences of tunnel fire. Fire flame, smoke, and toxic combustion products travel to the tunnel ceiling and then spread in the left and right directions when a fire happens and threatens the drivers’ and firefighters’ lives. The structure of the tunnel is built up of concrete with steel bars that lose their strength and structural stability in contact with hot gases. Another consequence of fire is its spread from one vehicle to another. A lot of research about tunnel fire dynamics and the parameters that they influence has been undertaken within the last 20 years. Ref. [
11] offers a summary of the main research in that field.
One of the possible protections of tunnel structures in case of fire is by investigating the maximum smoke temperature under the tunnel ceiling so that the building owner understands the limits of the structure. Other than the stability of the tunnel structure, sprinklers or detectors installed in tunnels are activated by the smoke traveling through the ceiling or when the latter detects high temperature. A series of experimental tests and theoretical analyses have been conducted to investigate the maximum smoke temperature beneath the tunnel ceiling [
12]. Tunnel fire experiments have been carried out by Haddad et al. [
13] to examine the temperature distribution along the tunnel ceiling. This study includes both experimental and theoretical research with the results of the theoretical study compared with experimental data to present an acceptable prediction.
The aforementioned studies considered the maximum smoke temperature regardless of the blockage effect of vehicles inside the tunnel. The obstruction impact of vehicles influences the local velocity around the fire, the smoke flow pattern, and the temperature. Tang et al. [
14] proposed a global model including the effect of blockage ratio and blockage fire distance on the maximum smoke temperature. Scaled-down experiments have also been performed to study the effect of blockages on critical velocity, backlayering length [
15] and maximum smoke temperature [
16]. In [
16] the influence of blockage percentages on the maximum smoke temperature beneath the ceiling was investigated and the model of maximum smoke temperature published earlier by Li [
12] using local velocity near the fire source was improved.
In recent years, various computer models, such as computational fluid dynamic (CFD) models and zone models, have been used to simulate specific characteristics of tunnel fire, such as its heat release rate (HRR) and smoke and their effects, and the evacuation of people in the tunnel. A numerical simulation of a tunnel equipped with jet fans was carried out by [
17] to assess the safe evacuation. Based on their study under controlled ventilation, the evacuation time was prolonged as the flow of smoke could be controlled. The evacuation process in a tunnel under the contraflow condition was studied by [
18]. Traffic and passenger conditions are based on real data from a tunnel in the UK. Simulation results indicate that all evacuees can survive before the combustion gases and heat influence their survivability when a realistic worst-case fire scenario is modeled without longitudinal ventilation in the tunnel under study.
The severe consequences of accidents and fire incidents in road tunnels have also highlighted the importance of evaluating the safety level and effectiveness of safety measures to reduce these consequences. Risk analysis is an effective tool to improve and optimize the level of safety in road tunnels. Thus, safety analysts and policymakers have employed risk assessments for more than ten years to study fire risks related to road tunnels [
4]. There are two main types of risk analysis: qualitative and quantitative. Quantitative risk analysis (QRA) is divided into deterministic and probabilistic categories.
The deterministic type requires exact input parameters to derive accurate results. On the other hand, the probabilistic method is a better way to consider the uncertainty related with the risk analysis process and assess the long-term risk. The probabilistic method includes the identification of hazards, the estimations of probability and the consequences of each hazard, and quantifies the risk as the sum of probabilities multiplied by consequences. One of the outputs of QRA is societal risk, such as the expected number of fatalities in the tunnel per year, and is presented via the F/N curve, where F is the cumulative frequency that the number of fatalities is equal to or greater than a given number N. The F/N curve is required to be compared with the area between tolerable and intolerable thresholds, otherwise known as ‘As Low as Reasonably Practicable’ (so-called ALARP).
QRA has received more attention in past years, and has been demonstrated as an effective and efficient method for quantitatively evaluating the risks of tunnels in many countries such as the TuRisMo model of Austria, the TUNPRIM model of the Netherlands, the Italian risk analysis model, the OECD/PIARC model [
19], and the quantitative risk assessment for road tunnels (QRAFT) model of Singapore [
2,
20,
21]. PIARC 1995 sponsored a project on the transport of dangerous goods through road tunnels and the PIARC/OECD/EU QRA model (QRAM) was developed. This model has 13 hazardous scenarios and was computerized by spreadsheet-based software [
22]. The validation of the QRAM model was studied in Austria, France, Netherlands, Norway, Sweden, and Switzerland and various risk reduction measures were examined employing the QRAM software [
23].
All these QRA models choose societal risk as the risk indice to evaluate the safety level of a road tunnel. The risk analysis of a road tunnel is determined by different input parameters such as traffic flow, tunnel geometries, tunnel safety provisions, etc. It has been generally acknowledged that uncertainty is an unavoidable component in risk analysis.
A novel methodology to perform a quantitative fire risk assessment of road tunnels is explained in this paper. This model has two main sections: quantitative consequence analysis and quantitative frequency analysis. The quantitative consequence analysis section of this model was inspired by [
24]. Based on the results of this risk assessment, safety management strategies and safe evacuation policies can be developed.
This model was applied to the Gibraltar Airport Tunnel to show how it is operated and how the fire risk is analyzed via the application of this model. Temperature and toxic fume concentration were measured at human height to estimate the fatality rate of each fire scenario.
2. LBAQRAMo—Tunnel Risk Analysis Model for UK Road Tunnels
At a statistical level, tunnels are marked by a lower accident rate than the open-air sections because the user is more careful when driving and the weather and visibility conditions are constant. Although the possible consequences of a relevant event in a tunnel can be more significant than open-air events, especially if fatalities and damage to the infrastructure are considered. The recent history of tragedies in tunnels has resulted in the topic of tunnel safety being the center of attention and more resources are now being spent to improve the safety levels in tunnels. Whilst much has been done to improve tunnel safety since the early 2000s, there are still improvements to be made to harmonize and optimize the approach to tunnel safety. From the literature survey, it can be concluded that there is no generic QRA model for UK road tunnels and the lack of a QRA model has been felt. Therefore, it was decided to develop the most appropriate quantitative risk analysis model for safety in UK road tunnels, leading to improved and consistent decisions on the grounds of safety in the design and operation of road tunnels, the LBA quantitative risk analysis model (LBAQRAMo).
This article aims to propose a new QRA model for UK road tunnels by considering the unique characteristics of the tunnel under study. This type of analysis is usually the most detailed method and therefore requires more time and resources. It should be kept in mind that, while quantitative analysis is more objective, it is still an estimate.
Subsidiary risk assessments shall be made to determine the probability and likely impact of hazards with a range of potential impacts [
25]. Risks must be evaluated considering the tunnel geometry and its infrastructures, fire safety measures, as well as equipment and management procedures. In addition, they require the analysis of many complex factors and processes related to human behavior, such as pre-evacuation times, e.g., reluctance to leave the vehicle, interactions between occupants, interactions between occupants and smoke, etc. In this model, the risk assessment analysis is divided into quantitative consequence analysis and quantitative frequency analysis.
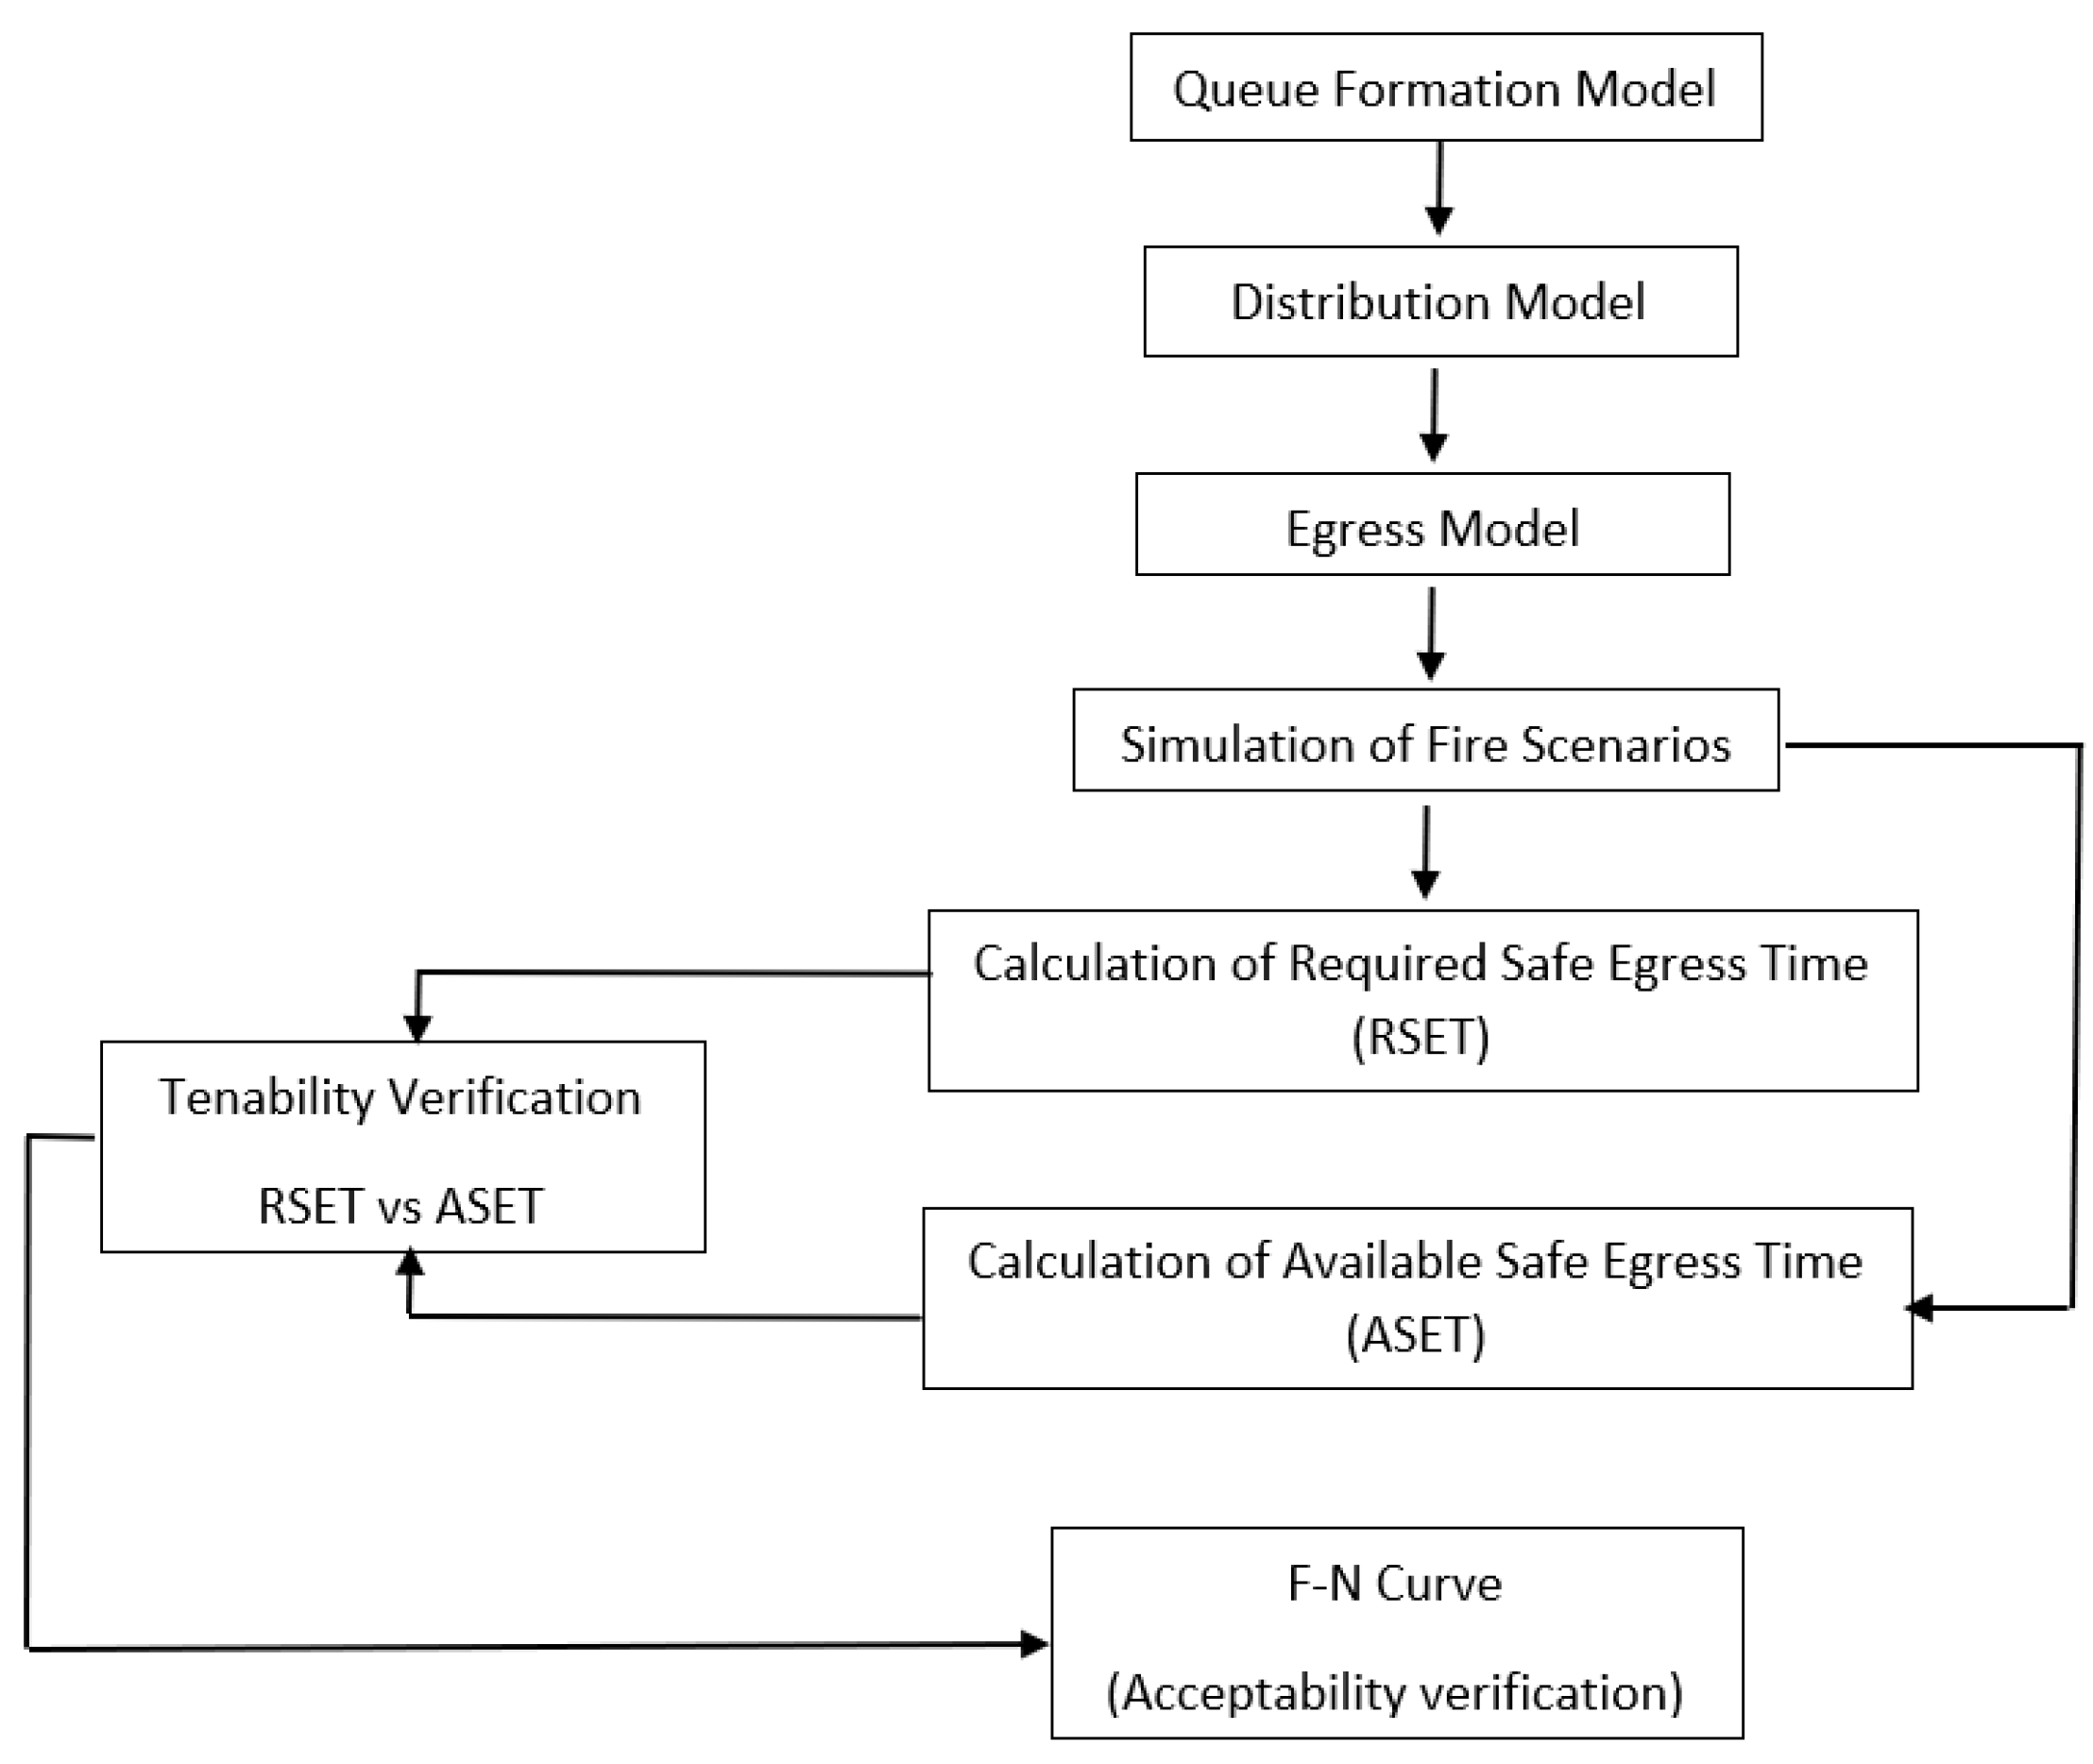
The quantitative consequence analysis model comprises three parts, a queue formation model which estimates the number of potential tunnel users, the distribution model which calculates the evacuation distance, and the egress model which calculates the required egress time.
In each scenario, a set of variables, including the influence of the different combinations of fire safety equipment, pre-movement time, movement speed, fire source location, type and number of vehicles involved, and tunnel characteristics, including its dimensions and lanes are considered. The possibility for safe egress is estimated by 3D fluid dynamics simulation via measuring tenability thresholds through the evacuation path.
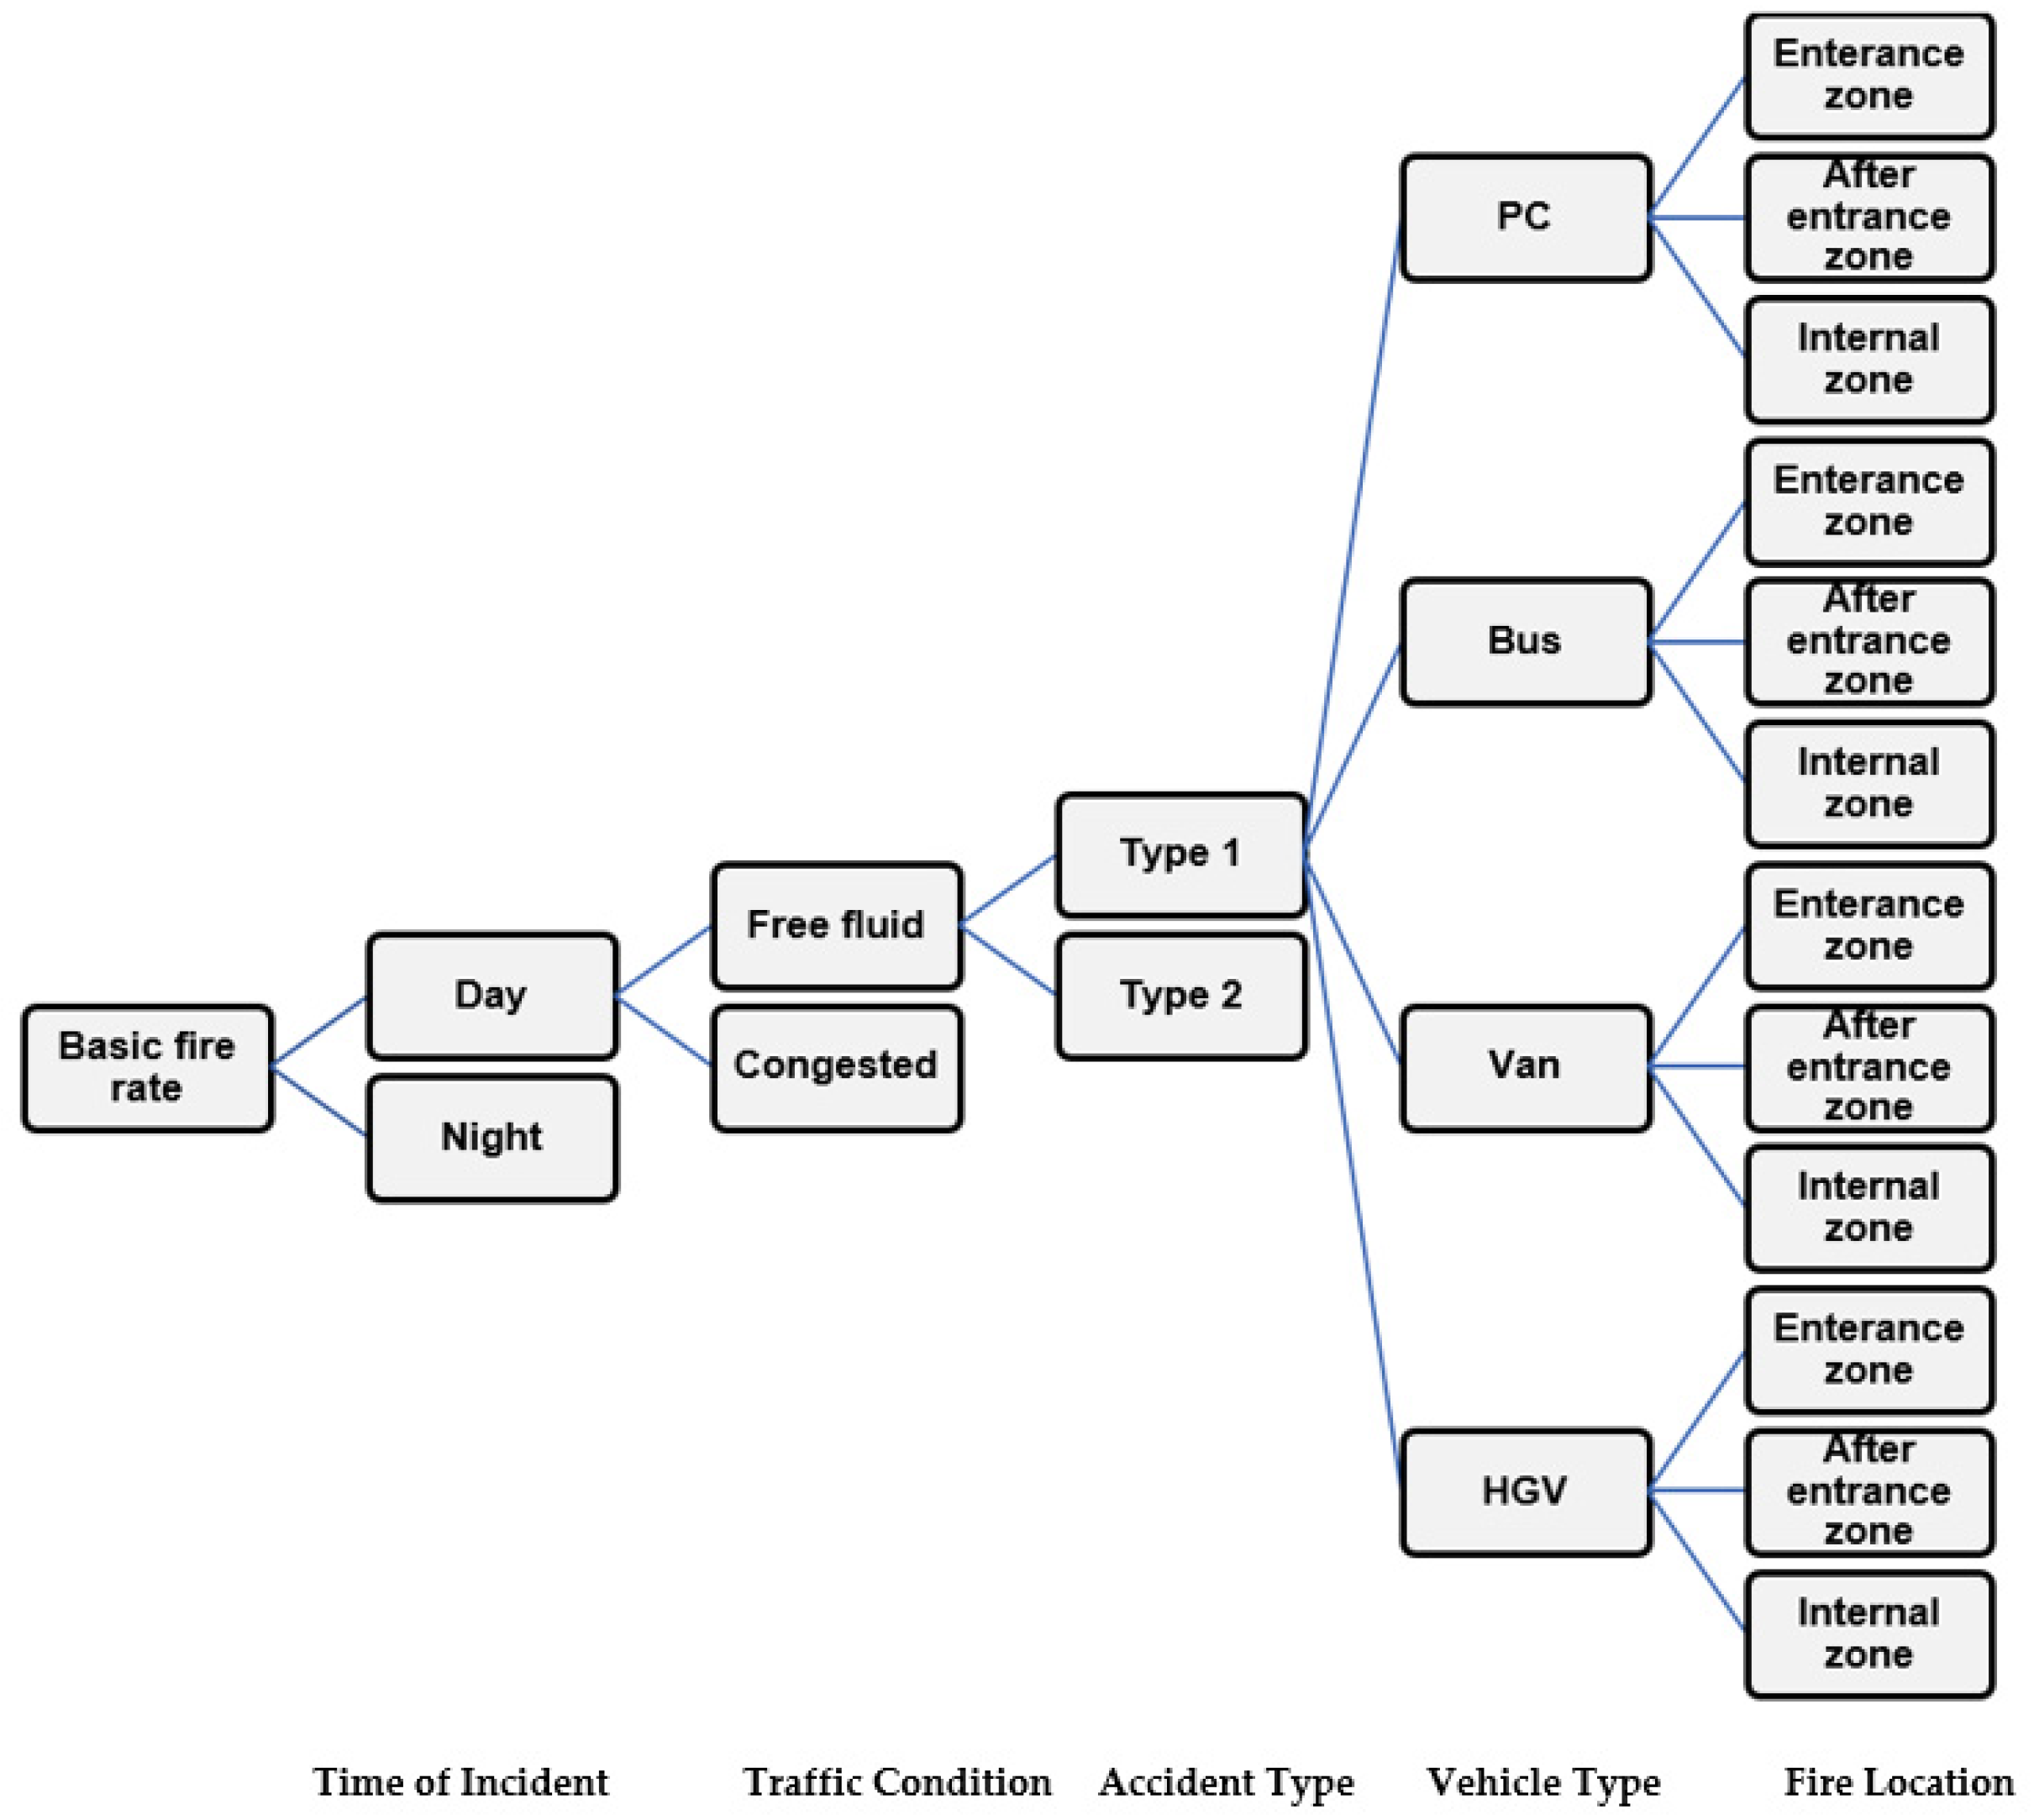
The quantitative frequency analysis is based on an event tree analysis to calculate the frequency of a specific fire incident, including UK road tunnels’ basic fire rate, the time of fire incidents, traffic conditions, accident type, vehicle type, and fire source locations.
F/N curves of societal risk are provided with the results of quantitative consequence analysis and quantitative frequency analysis. Risk acceptance is obtained using the ALARP criterion in the UK.
Five different vehicle types were considered: passenger car, small van or 2–3 cars, bus or empty HGV, a truck with combustible load, and HGV. Five accident locations inside the tunnel were investigated.
Two different ventilation regimes can be selected: natural and longitudinal. The design of the model allows a detailed investigation of the performance of the ventilation system regarding the number of activated jet fans and the time of activation.
This model was developed with the aid of Microsoft Excel. This model enables the safety analyst to create many scenarios, predict potential losses among trapped users in the event of a fire, and illustrate the effectiveness of fire safety systems.
Although this model provides a depiction of the current level of knowledge, it needs to update the relevant information as necessary. This information requires continuous updates with new data from new academic studies, and accidents and fire incidents data that may change the frequency.
2.1. Quantitative Consequence Analysis
For each scenario, the number of fatalities is calculated through the quantitative consequence analysis. Estimation of the number of fatalities due to accidents involving fire includes three main sections:
Queue formation model
Distribution model
Egress model
The key input parameters required for the LBAQRAMo are of three main categories: traffic parameters, tunnel safety systems, and tunnel characteristics. Tunnel characteristics include its length, width, height, the number of lanes, the number of emergency exits and the distance between them, and gradient. Traffic parameters include traffic volume and vehicle composition.
Functional parameters of a tunnel’s safety systems, including their specific characteristics and their reliabilities, are in its safety systems category.
Tunnel safety systems are divided into three categories in this model, primary, intermediate, and secondary. Tunnel safety systems that the activation of intermediate and secondary measures rely on are primary measures. Intermediate measures are a connection between the primary measures and the secondary measures, such as the tunnel control center. Secondary measures, such as the suppression system, are those whose applications depend on the intermediate and primary systems.
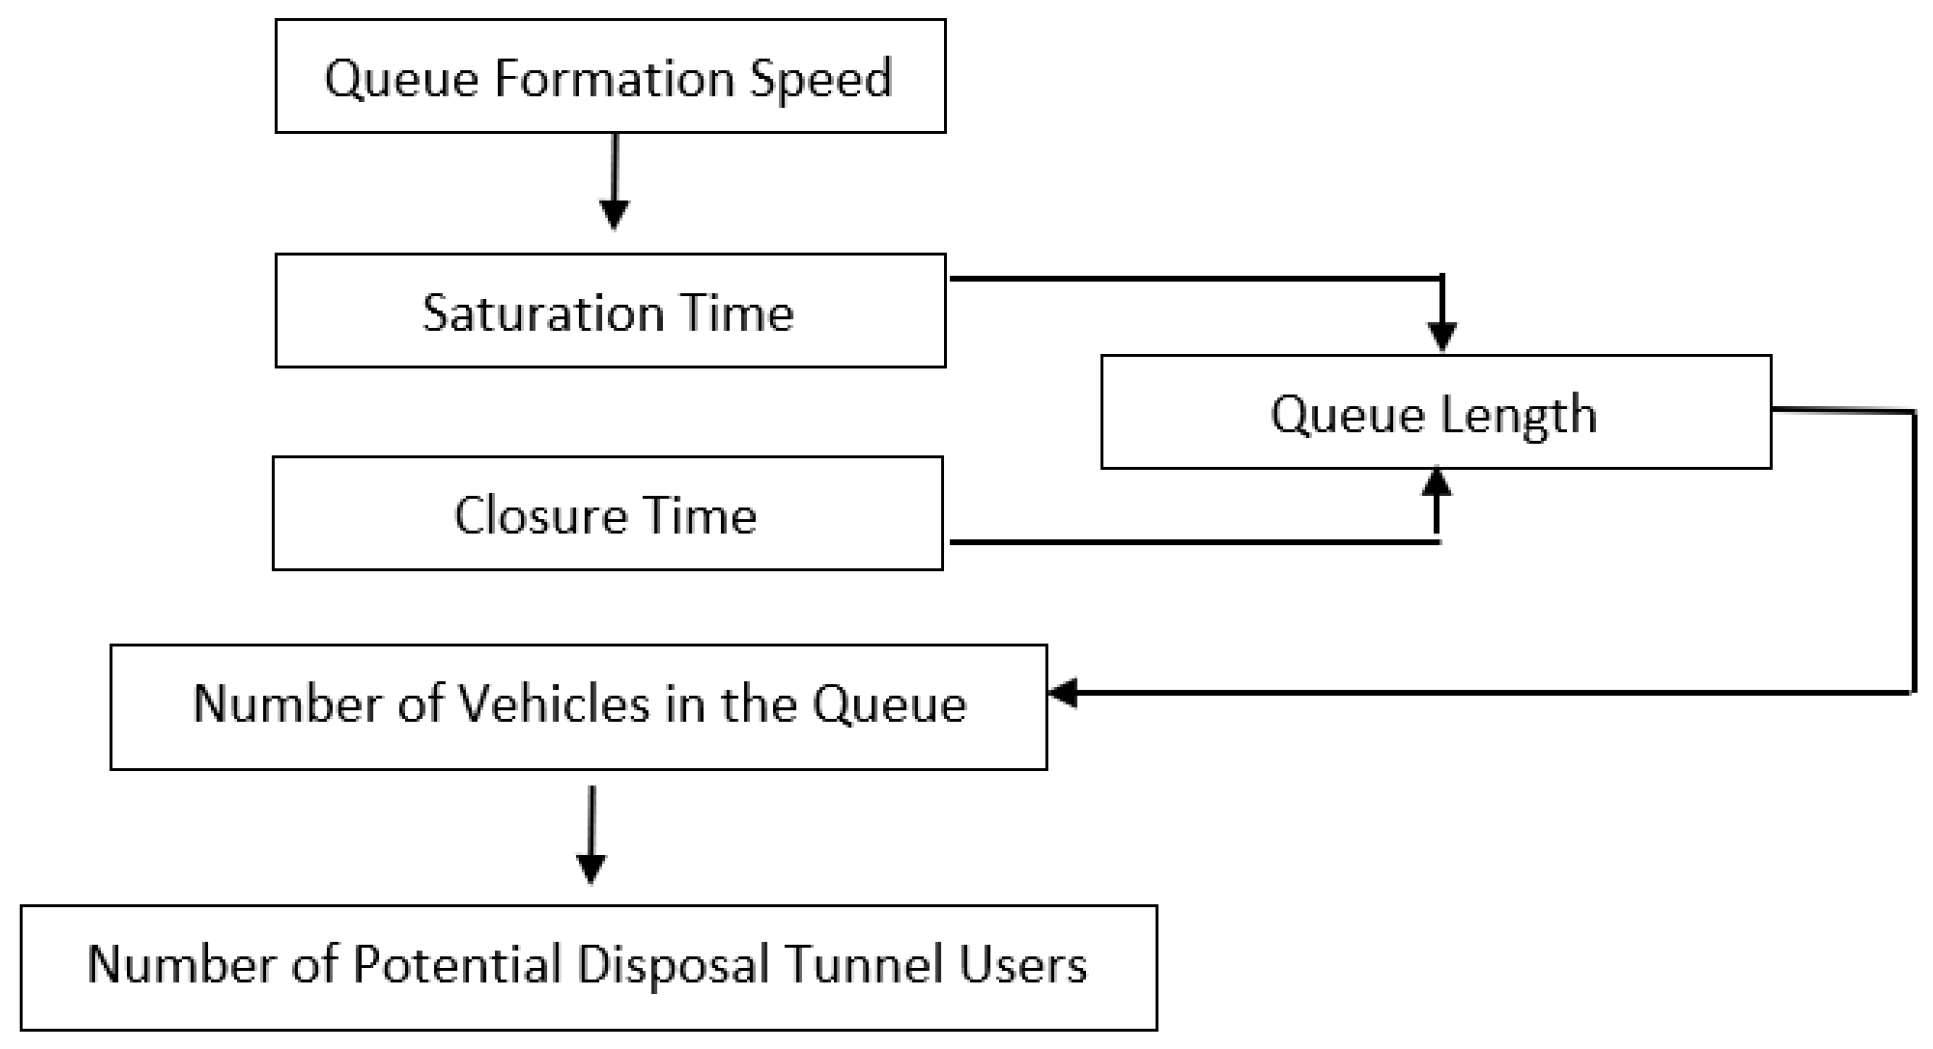
2.1.1. Queue Formation Model
The main output of the queue formation model of the LBAQRAMo is the estimation of the number of vehicles queueing in each lane. Traffic is divided into three categories; free flow, congested, and stoppage. Since the average peak traffic density, percentage, and type of vehicles are not uniform between various lanes in a multi-lane tunnel, in the first stage, the total traffic flow of the tunnel under study is divided between the left and right lanes in two-lane tunnels and between shoulder, middle, and median lanes in three-lane tunnels. Saad Yousif and his colleagues [
26] studied the distribution of traffic flow among the available number of lanes and modelled lane utilization. They studied a relatively large dataset which was more representative of current lane utilization on United Kingdom motorways. Therefore, their model was utilized in this model in the absence of tunnel-related information to estimate the lane utilization factor for each lane based on the total traffic flow of vehicles (veh/h) in two-lane and three-lane tunnels. The composition of different types of vehicles must also be determined at this stage. Then, the closure time of the tunnel (
) was calculated based on the basic value of the closure time, which is 120 s in this model, and all fire safety measures influencing it.
In this model, the stopping distance between vehicles in the queue can be estimated based on the type of traffic [
27]. If it is assumed that the average length of light vehicles (passenger cars and vans) is 5 m and 15 m for large vehicles, the stopping distance is calculated as below:
where D is the average peak traffic density (veh/km), %SV is the average of %PC and %VAN, and %LV is the average of %BUS, %TRUCK, and %HGV for each lane. Considering the stopping distance between vehicles, and the percentage and the average length of each type of vehicle in the traffic, the density of stopped vehicles was estimated. The density of stopped vehicles,
, traffic flow, Q (veh/h), and traffic density, D (veh/km) were used to calculate queue formation speed for congested and stoppage traffic as below for each lane:
The queue formation speed for the free flow traffic is equal to the traffic speed. The saturation time of each lane depends on the fire source location and queue formation speed. By comparing the closure time and the saturation time (for each lane in a multi-lane tunnel), the queue length,
is calculated. If the saturation time is smaller than the closure time,
is the same as the saturation length. otherwise:
The number of vehicles in each lane is determined as follows:
The total number of occupants in a specified tunnel is the sum of the individuals who are present in various lanes because traffic composition is different from one lane to the other. The composition of different types of vehicles in under-studied lanes and the average occupation coefficient of each specific type of vehicle must be known to estimate the number of occupants in the i-th lane.
Figure 1 shows the process of calculating the number of people in the queue.
2.1.2. Distribution Model
After calculating the number of potentially exposed people, the tunnel users were distributed into the queue via the distribution model. It was assumed that the users are distributed homogeneously along the queue. The queue length was divided into sections, named cells. All cells have the same length, and they extend to the end of the queue.
Figure 2 shows the schematic view of the distribution of users along the lane.
The evacuation starts from the evacuees’ initial position, and they travel cell by cell towards a place of safety i.e., an emergency exit. A two-dimensional evacuation simulation was conducted, as trapped users’ evacuation route is predominantly limited to two dimensions. The total distance of the evacuation path is calculated by considering both the horizontal travel distance and transversal travel distance:
where:
is the horizontal distance related to the center of c-th cell of the i-th lane
is the vertical distance related to the c-th cell center of the i-th lane.
The horizontal travel distance depends on the distance between each group of users (each cell) and the nearest emergency exit to them. The vertical travel distance depends on the tunnel width and the lane which is studied.
Figure 3 shows an illustration of the
from the centre of the first cell to the closest emergency exit, where the longitudinal
and lateral
contributions are shown.
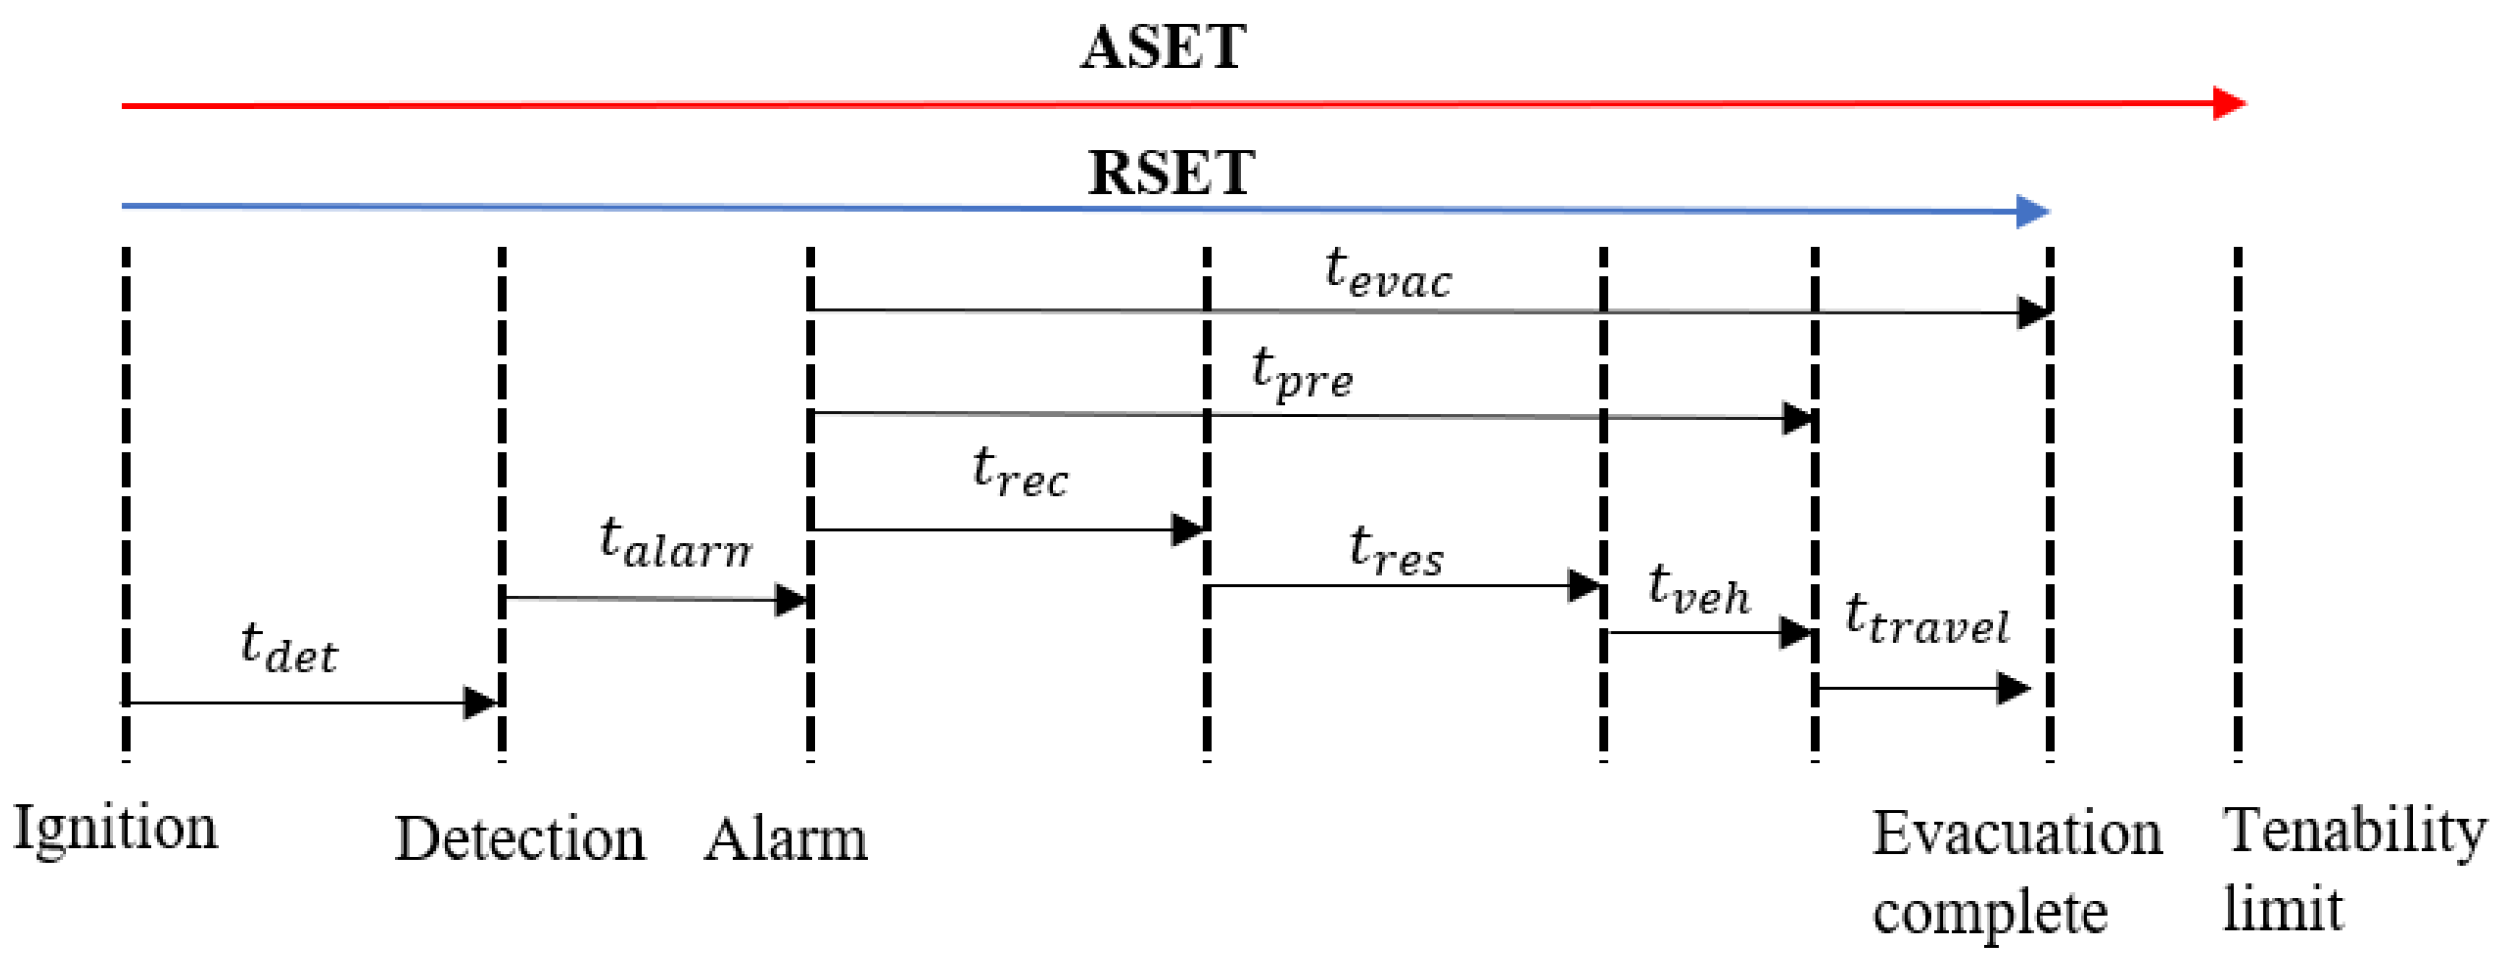
2.1.3. Egress Model
A timeline model is used for the egress model, which describes the sequence of events as a list of continuous phases. A four-stage evacuation process was considered. The first stage is detection which depends on the safety equipment in the tunnel. The second stage is the alarm stage which is the time between detection and the time when the alarm system is activated. The third stage is the pre-movement stage including recognition time, response time, and the time to exit the vehicle. The last stage is traveling which depends on the movement speed and the distance to the emergency exit.
Figure 4 illustrates the stages of the evacuation process. The total time of these stages defines the required safe escape time (RSET).
According to this description, RSET can be calculated through Equation (6) as below:
where:
: Detection time, time between when the fire starts and when the tunnel safety equipment detects the fire
: Alarm time, the time between the first detection and the general alarm
: Pre-evacuation time, the time consists of three behavioural phases of each user, namely recognition time (), response time () and time to leave the vehicle ().
Detection time is different for each tunnel, and it depends on the type of detection system installed in the tunnel. The way of calculating alarm time includes a basic alarm time, 90 sec in this model, and safety measures influence it via their connection between them and their reliabilities.
Recognition time consists of a period between the activation of the alarm system and when occupants recognize the danger. The process of calculating the recognition time starts with calculating the basic recognition time, which is influenced by the distance users have from the accident and the severity of the fire. As a result, the basic recognition time will decrease for more severe accidents and consequently, people become aware of the threatening situation within a shorter time. Moreover, the basic recognition time depends on the distance occupants have from the accident as the closer you are to the accident, the sooner you will notice the accident. Considering the distance to the fire location, the area in the vicinity of the accident was divided into three zones first. Zone 1 is from where the accident happened to 150 m down the queue. Zone 2 spans from 150 m to 300 m down the queue and Zone 3 extends from 300 m to the tunnel entrance.
Table 2 represents the recognition time allocated to each zone [
28].
Regarding the severity of the fire,
Table 3 shows the assumed influence of the fire severity on the recognition time as a function of fire heat release rate. The final recognition time is calculated by considering the influence of the fire safety systems.
Once evacuees recognize the fire, they tend to collect their belongings and gather their family members and they may also be reluctant to leave the perceived safety of their vehicles. The variation of basic recognition time is opposite to that of the basic response time as those who are actively evacuating influence those still in their car.
Table 4 presents the basic response time allocated to each zone [
28].
The final response time is also influenced by the available fire safety measures.
We assume that the flow capacity of a normal vehicle door is 1 person per 4 s [
29]. Based on the average occupancy of each type of vehicle, the number of each type of vehicle in the queue, and the number of cells the average time of leaving the vehicle is calculated.
This model uses numerical calculation via Fire Dynamic Simulator (FDS) and the extinction coefficient is measured at each cell and at each time step. FDS + Evac [
30], based on experiments conducted by Frantzich and Nilsson [
31], uses Equation (7) to calculate the walking speed in smoke.
The travel time was calculated cell by cell considering the walking speed in the smoke and the evacuation distance. In other words, every time one evacuee travels one cell, his/her walking speed is calculated and then the travelling time is calculated (Equation (8)).
where
is the moving speed in the smoke at a certain distance, the minimum walking speed is
= 0.1 ×
, and
is average walking speed. The experimental parameters α and β are 0.069 and 0.015, respectively.
When the total time of evacuation, which is the sum of detection time, alarm time, pre-movement time, and movement time, is calculated, the survival of tunnel users should be evaluated to find out if evacuees can start and then continue the evacuation process. The time when untenable conditions rise is compared with the evacuation time (comparison between ASET and RSET). Users can survive if RSET < ASET; in the opposite case, the users are assumed dead.
The first evaluation is the comparison between the summation of detection time, alarm time, and pre-movement time in each cell and the time when the tenability thresholds exceed their limits for each cell placed in the i-th lane. If users start to evacuate very late (the summation of detection time, alarm time, and pre-movement time are more than ASET at each cell), they are therefore dead before they start the traveling phase.
The next step is the verification of users’ egress process if evacuees can start the evacuation process. For users in each cell, the time taken to reach the next cell was contrasted with the development time of the impacts of each accidental fire. If they can reach the next cell before the time when untenable conditions arise, they will continue their traveling to another cell and the comparison is repeated. This process continues until evacuees reach the closest emergency exit.
Three tenability thresholds were measured at human height at the center of each cell to assess whether occupants can travel the evacuation path and reach a place of safety.
The tenability criteria used for this model were:
Fractional irritant concentration (FIC) < 1,
Fractional effective dose (FED) < 1,
Gas temperature < 60 °C
The extent of the damage of fire, the above criteria, was estimated with the support of computational fluid dynamics (CFD) simulation at each cell and at each time step. FDS, which solves the Navier–Stokes equations for low Mach numbers and performs the heat transfer and smoke propagation, was used to simulate tunnel fire scenarios. The tenability thresholds were measured at human height by FDS.
While at one stage of this process occupants reach a certain barycenter when conditions are untenable, users die, and they cannot continue the evacuation.
The total number of casualties is defined as the sum of fatalities of each cell where the tenability thresholds are exceeded (RSET > ASET). The total number of causalities of the whole tunnel is determined by the sum of fatalities in each lane.
However, the effect of fire incidents on emergency services (who have been identified as a sub-population of road users) will be greater compared to other road users due to their role in the rescue and recovery of persons from close to the scene of a fire. This is managed by their own safe systems of work and training.
Figure 5 illustrates the process of the quantitative consequence analysis model.
2.2. Quantitative Frequency Analysis
The frequency of defined accident scenarios was calculated via an event tree. The first column of the frequency event tree is initial fire frequency which has been obtained from the historical statics of fire incidents in UK road tunnels. Then, the influence of tunnel length, location, traffic volume, and gradient on the basic fire rate was considered to derive the fire rate for a specific tunnel. The second column of the frequency event tree is “The Time of the Incidents”. Since the fire rate is different in day and night, the influence of time on accidents should be considered in the frequency analysis. The data from UK roads have been used for the effect of time as the data from UK road tunnels were not ready at the time of drafting this paper. The third column of the frequency event tree is “Traffic Condition”. As the fire rate is varied by traffic condition, the effect of traffic condition on fire rate was considered by considering the congested hours of the tunnel under study. Two types of fire incidents were considered in this model. Incidents that include 1 vehicle are Type 1 and collisions that include more than 1 vehicle are Type 2. The probability of type 1 and 2 incidents are derived from UK road data.
The fifth column of the frequency event tree is “Vehicle Type”. According to tunnel fire data in PIARC 1999, the share of passenger cars, buses, vans, HGV, and trucks involved in the Type 1/Type 2 fire incidents listed in
Table 5 were used to consider different vehicle types.
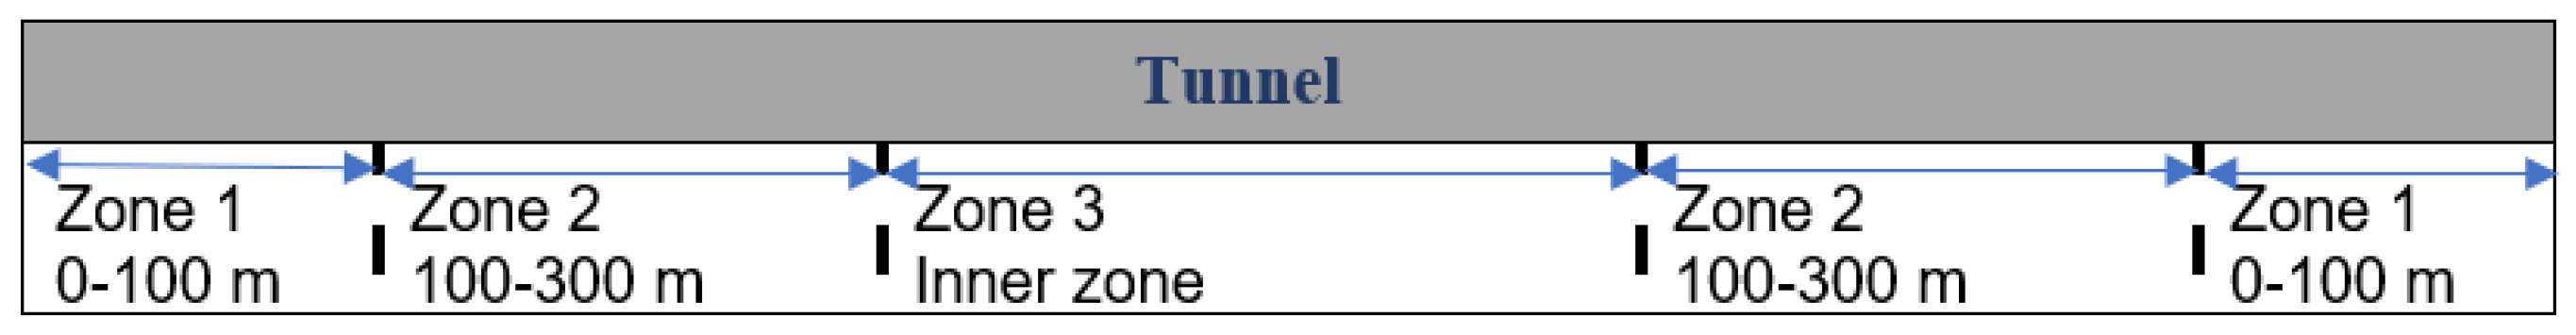
The last column of the frequency event tree is the Fire Source Location. To investigate the influence of various tunnel zones on the fire rate, the tunnel is divided into three zones. A typical sketch of the tunnel zones is presented in
Figure 6.
The crash rates in Zone 1 are higher than in Zone 2 and Zone 3 because of the sudden change in the visual environment, and when drivers pass Zone 1 and Zone 2, they are more experienced and careful in their driving [
32,
33].
Based on a comparison of crash rate distribution along the tunnel zones (Zones 1–3), an average crash rate value was considered to quantitatively understand the safety level of each tunnel zone (
Table 6).
The final fire frequency was calculated by multiplying the initial fire frequency by the below columns:
Time of fire incidents
Traffic condition
Accident type
Vehicle type
Fire source location
The level of detail for an event tree is defined in such a way that the available data material can be used appropriately. The illustration is shown in
Figure 7.
3. Case Study
UK road tunnels possess some characteristics which make them different from others in European countries. Therefore, in this paper, a QRA software named LBAQRAMo, which complies with the UK regulation and captures UK road tunnels’ differences, is elaborated. The application of this model has been evaluated by applying the proposed model and assessing the risk of fire to tunnel users in the under-construction Gibraltar Airport Tunnel. This north to south tunnel is located along an urban road serving a seaside city. Therefore, it is affected by high traffic flow, especially in summer. The transportation of dangerous goods is not forbidden.
The Gibraltar Airport Tunnel is a rectangular uni-directional road tunnel with two bores. It is a 360 m length, 7.3 m width, and 5.3 m height tunnel. The annual average daily traffic density of this tunnel is 20,700 vehicles/day with an average percentage of 8% HGVs. There are three emergency exits with about 100 m distance between them.
The major safety systems include a smoke/fire detection system, traffic monitoring, and vehicle detection system, ventilation system, emergency panels, and a communication system.
The longitudinal ventilation system is constituted of four pairs of jet fans fixed on the tunnel ceiling. In the event of a fire incident, all fans are activated to remove and control smoke and toxic gases generated by fire. The west-east wind with an average hourly speed of 18.8 kilometers per hour is considered.
The quantitative fire risk analysis was performed by the methodology explained in
Section 2.
The proposed QRA model requires determination of the fire scenarios to be examined and of the tunnel characteristics. In this case study, we estimate the societal risk for tunnel users. Different scenarios have been studied by changing the traffic flow, HRR, fire source location, and velocity and activation time of the ventilation system.
Table 7 illustrates the list of scenarios used in this case study.
After applying the characteristics of the tunnel under study and its traffic conditions, numerical simulation of fire scenarios by FDS was used to measure tenability conditions, temperature, FED, and FID, and visibility through the evacuation route. Based on RSET and ASET calculations, the number of fatalities for each scenario was estimated. The frequency of each scenario was derived by the frequency event tree of this QRA tool.
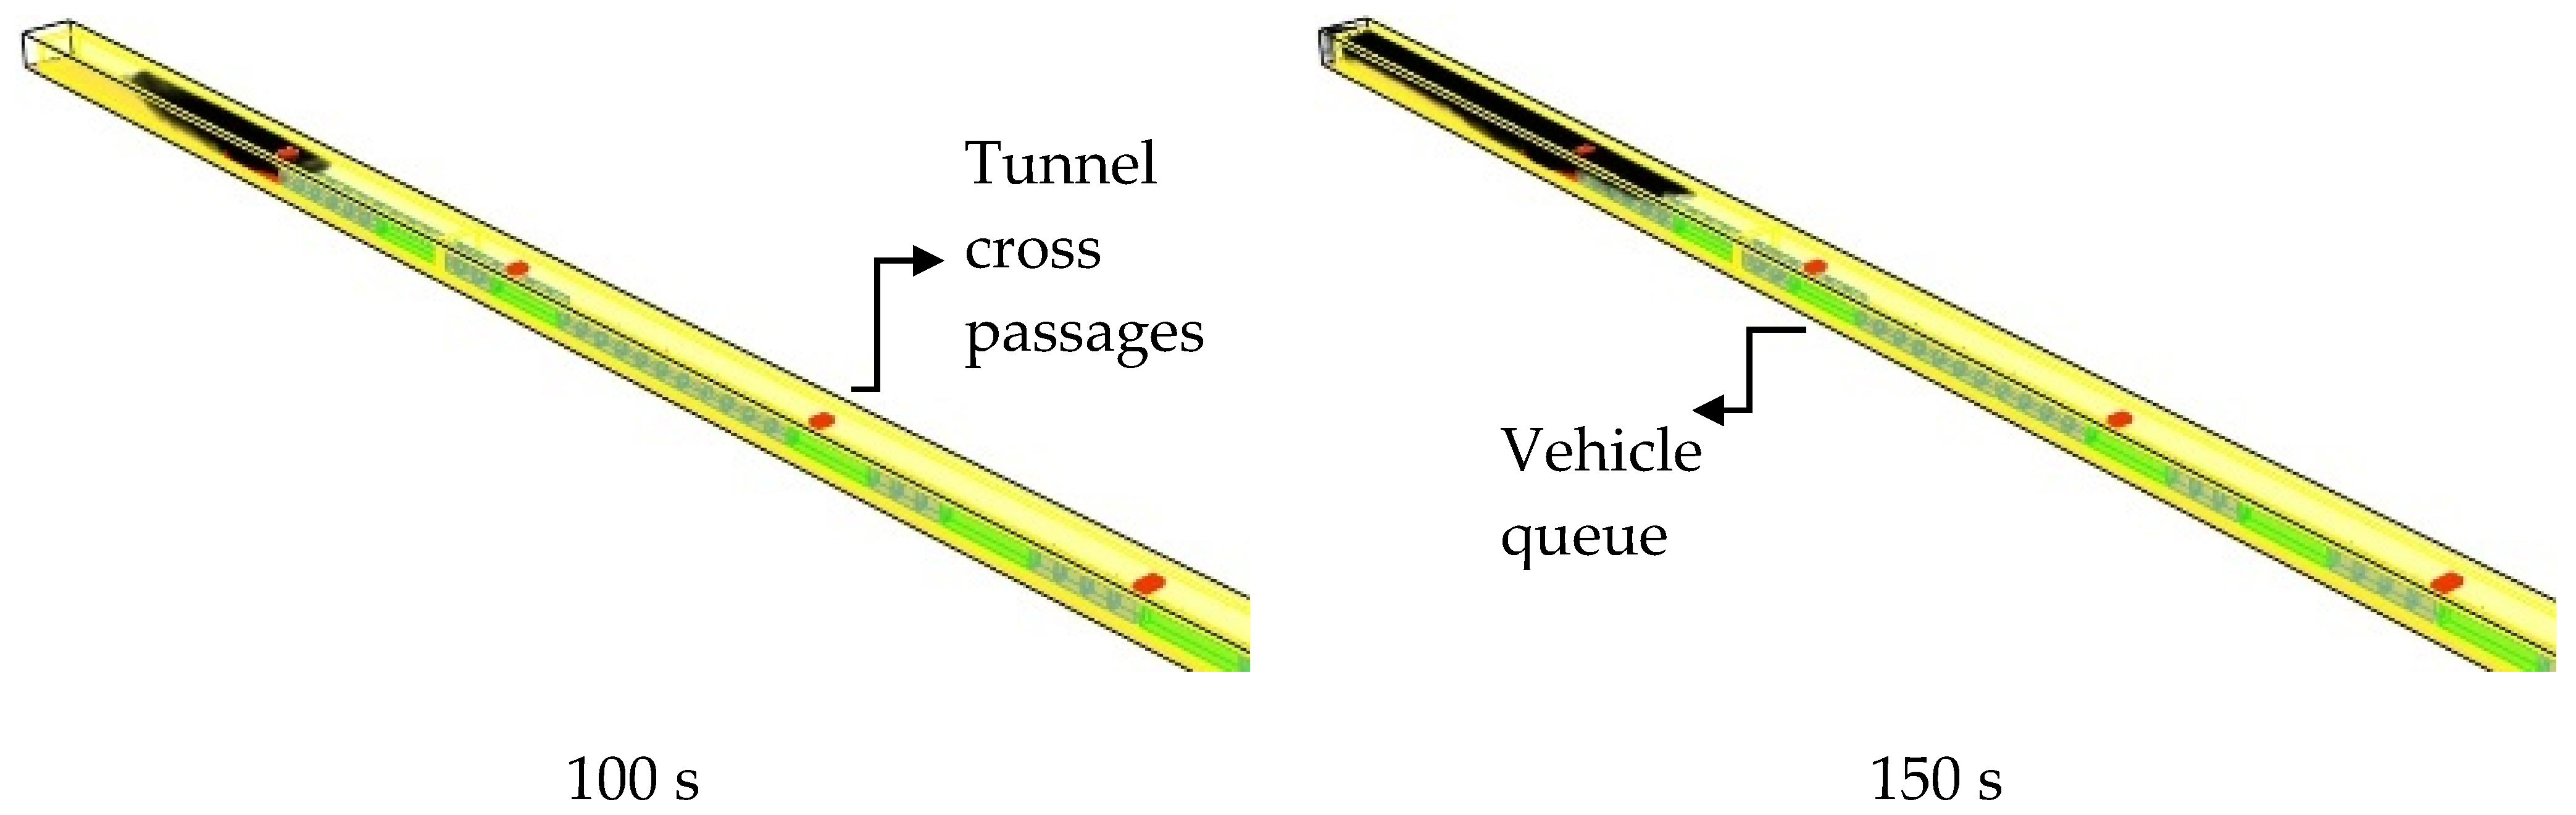
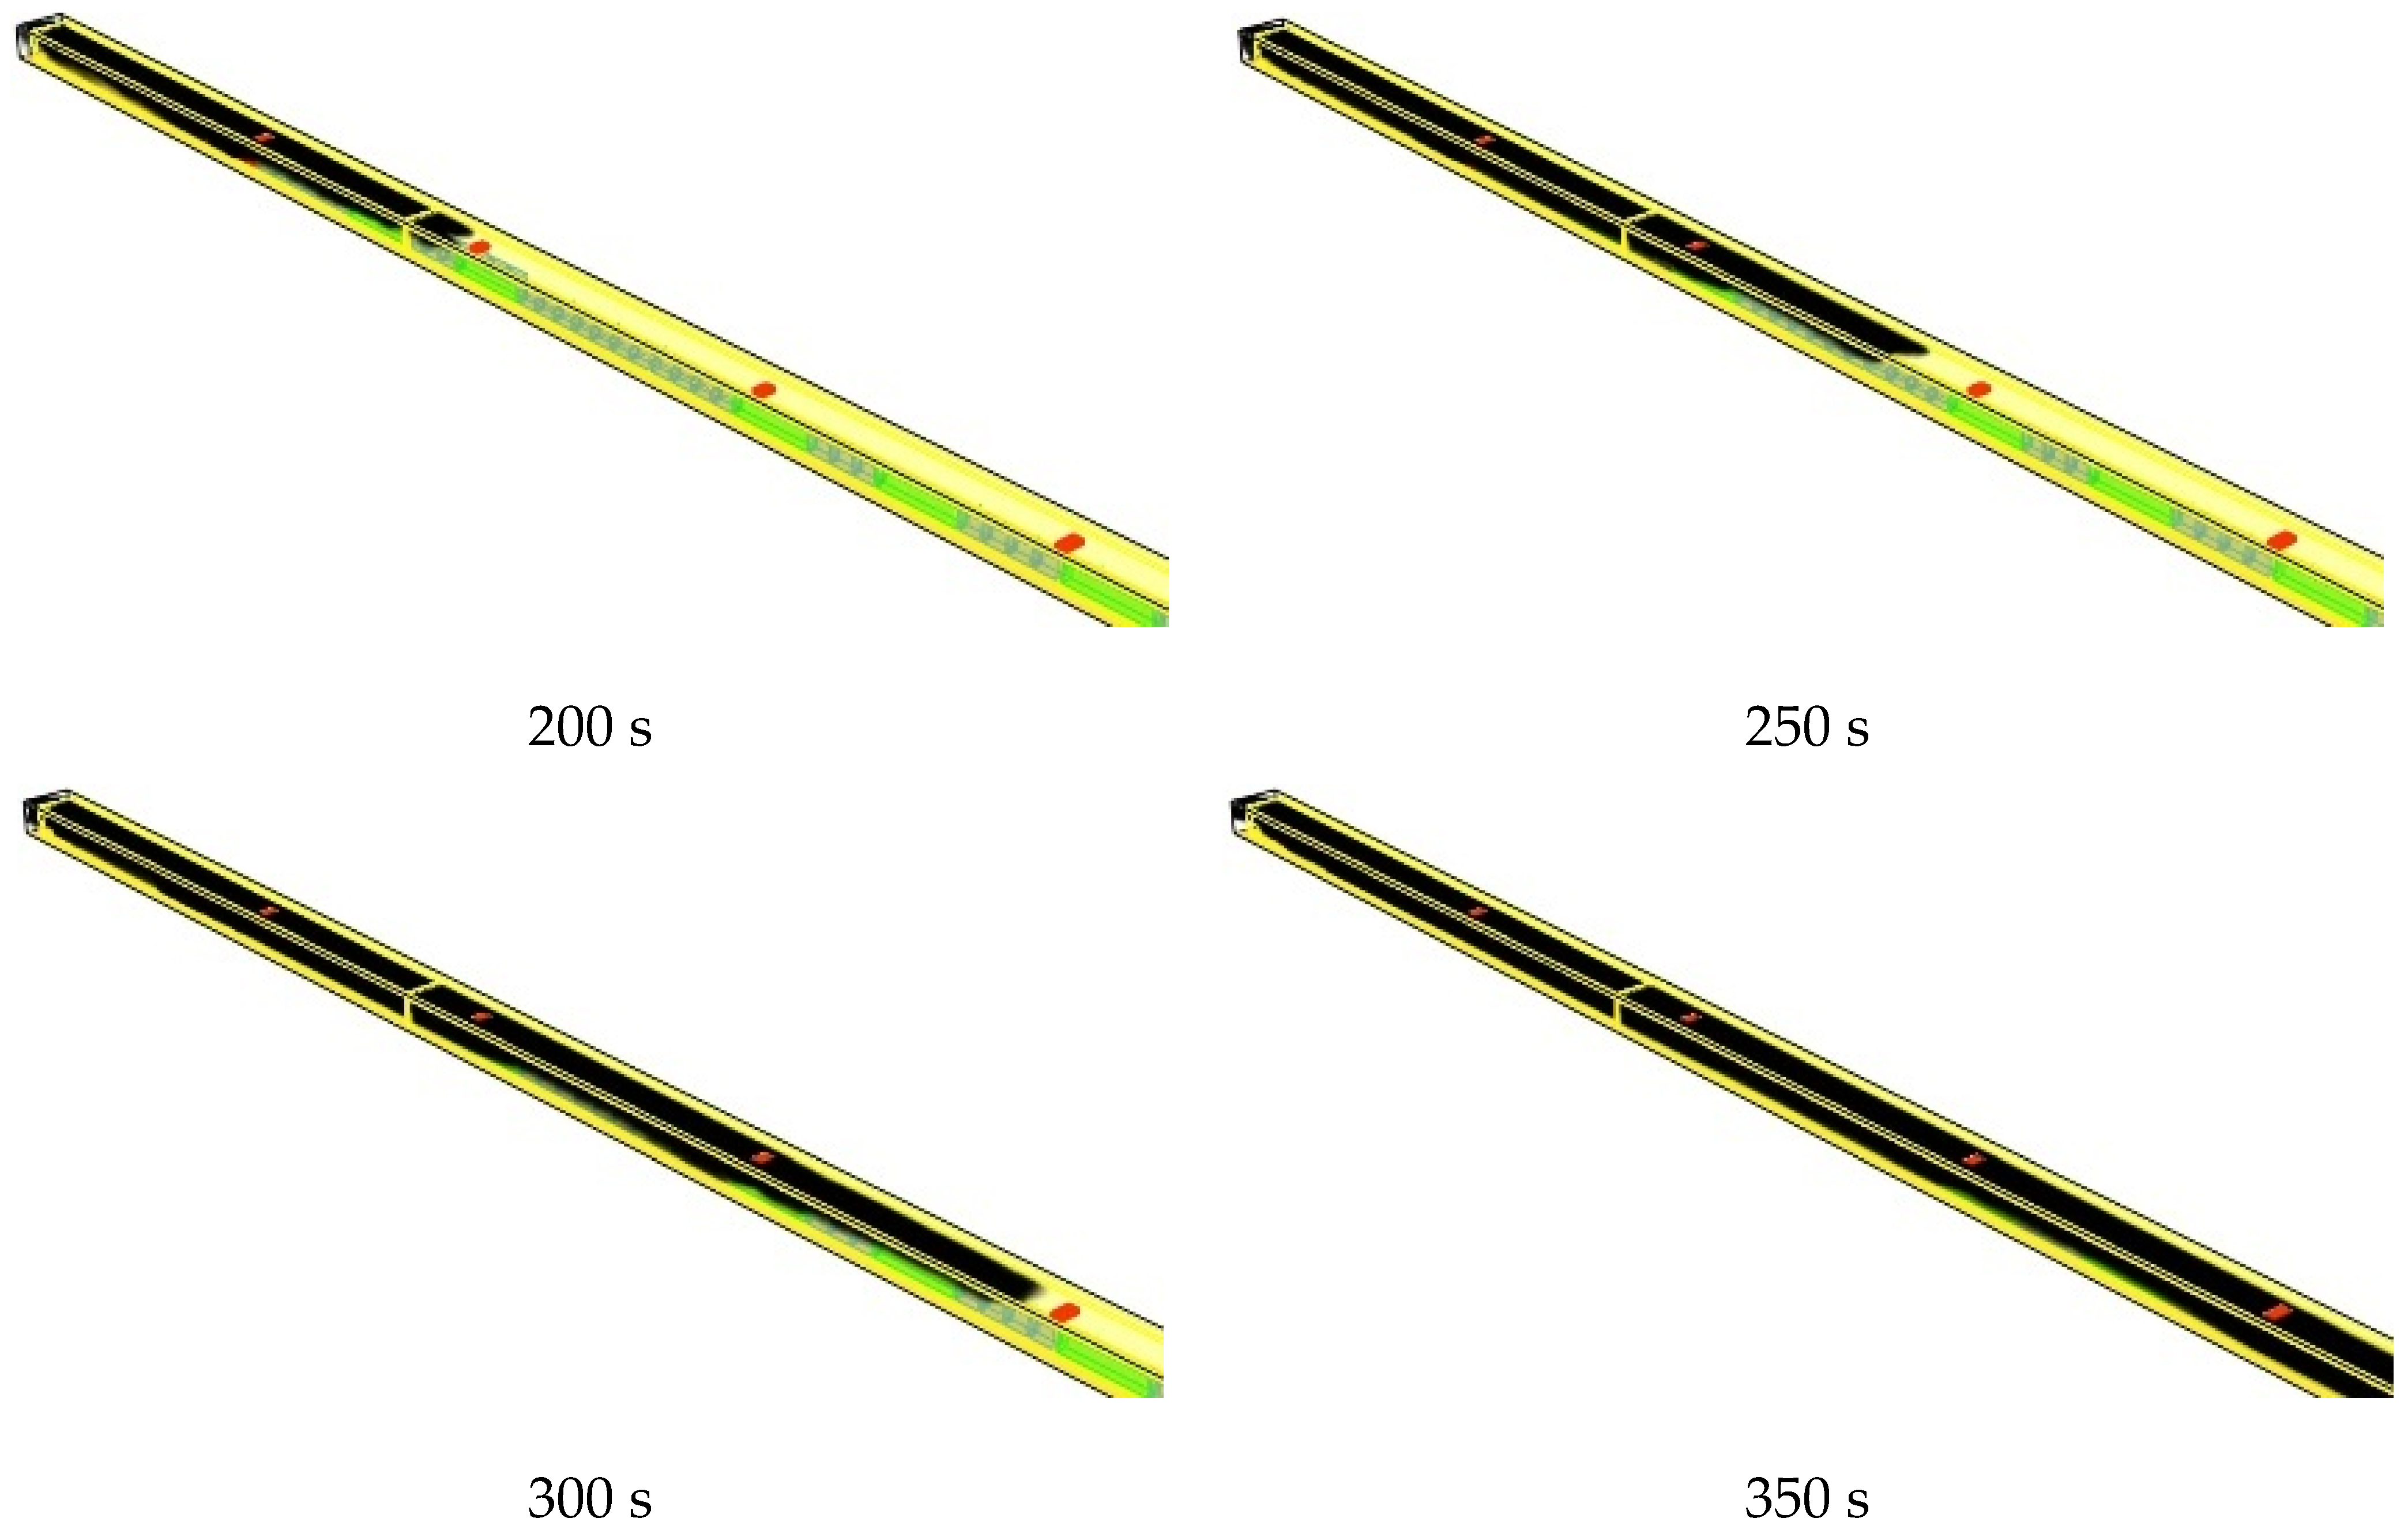
Figure 8 shows the 3D simulation of fire spread for a fire scenario with 158 MW fire size, 3.5 m/s ventilation velocity, and stoppage traffic.
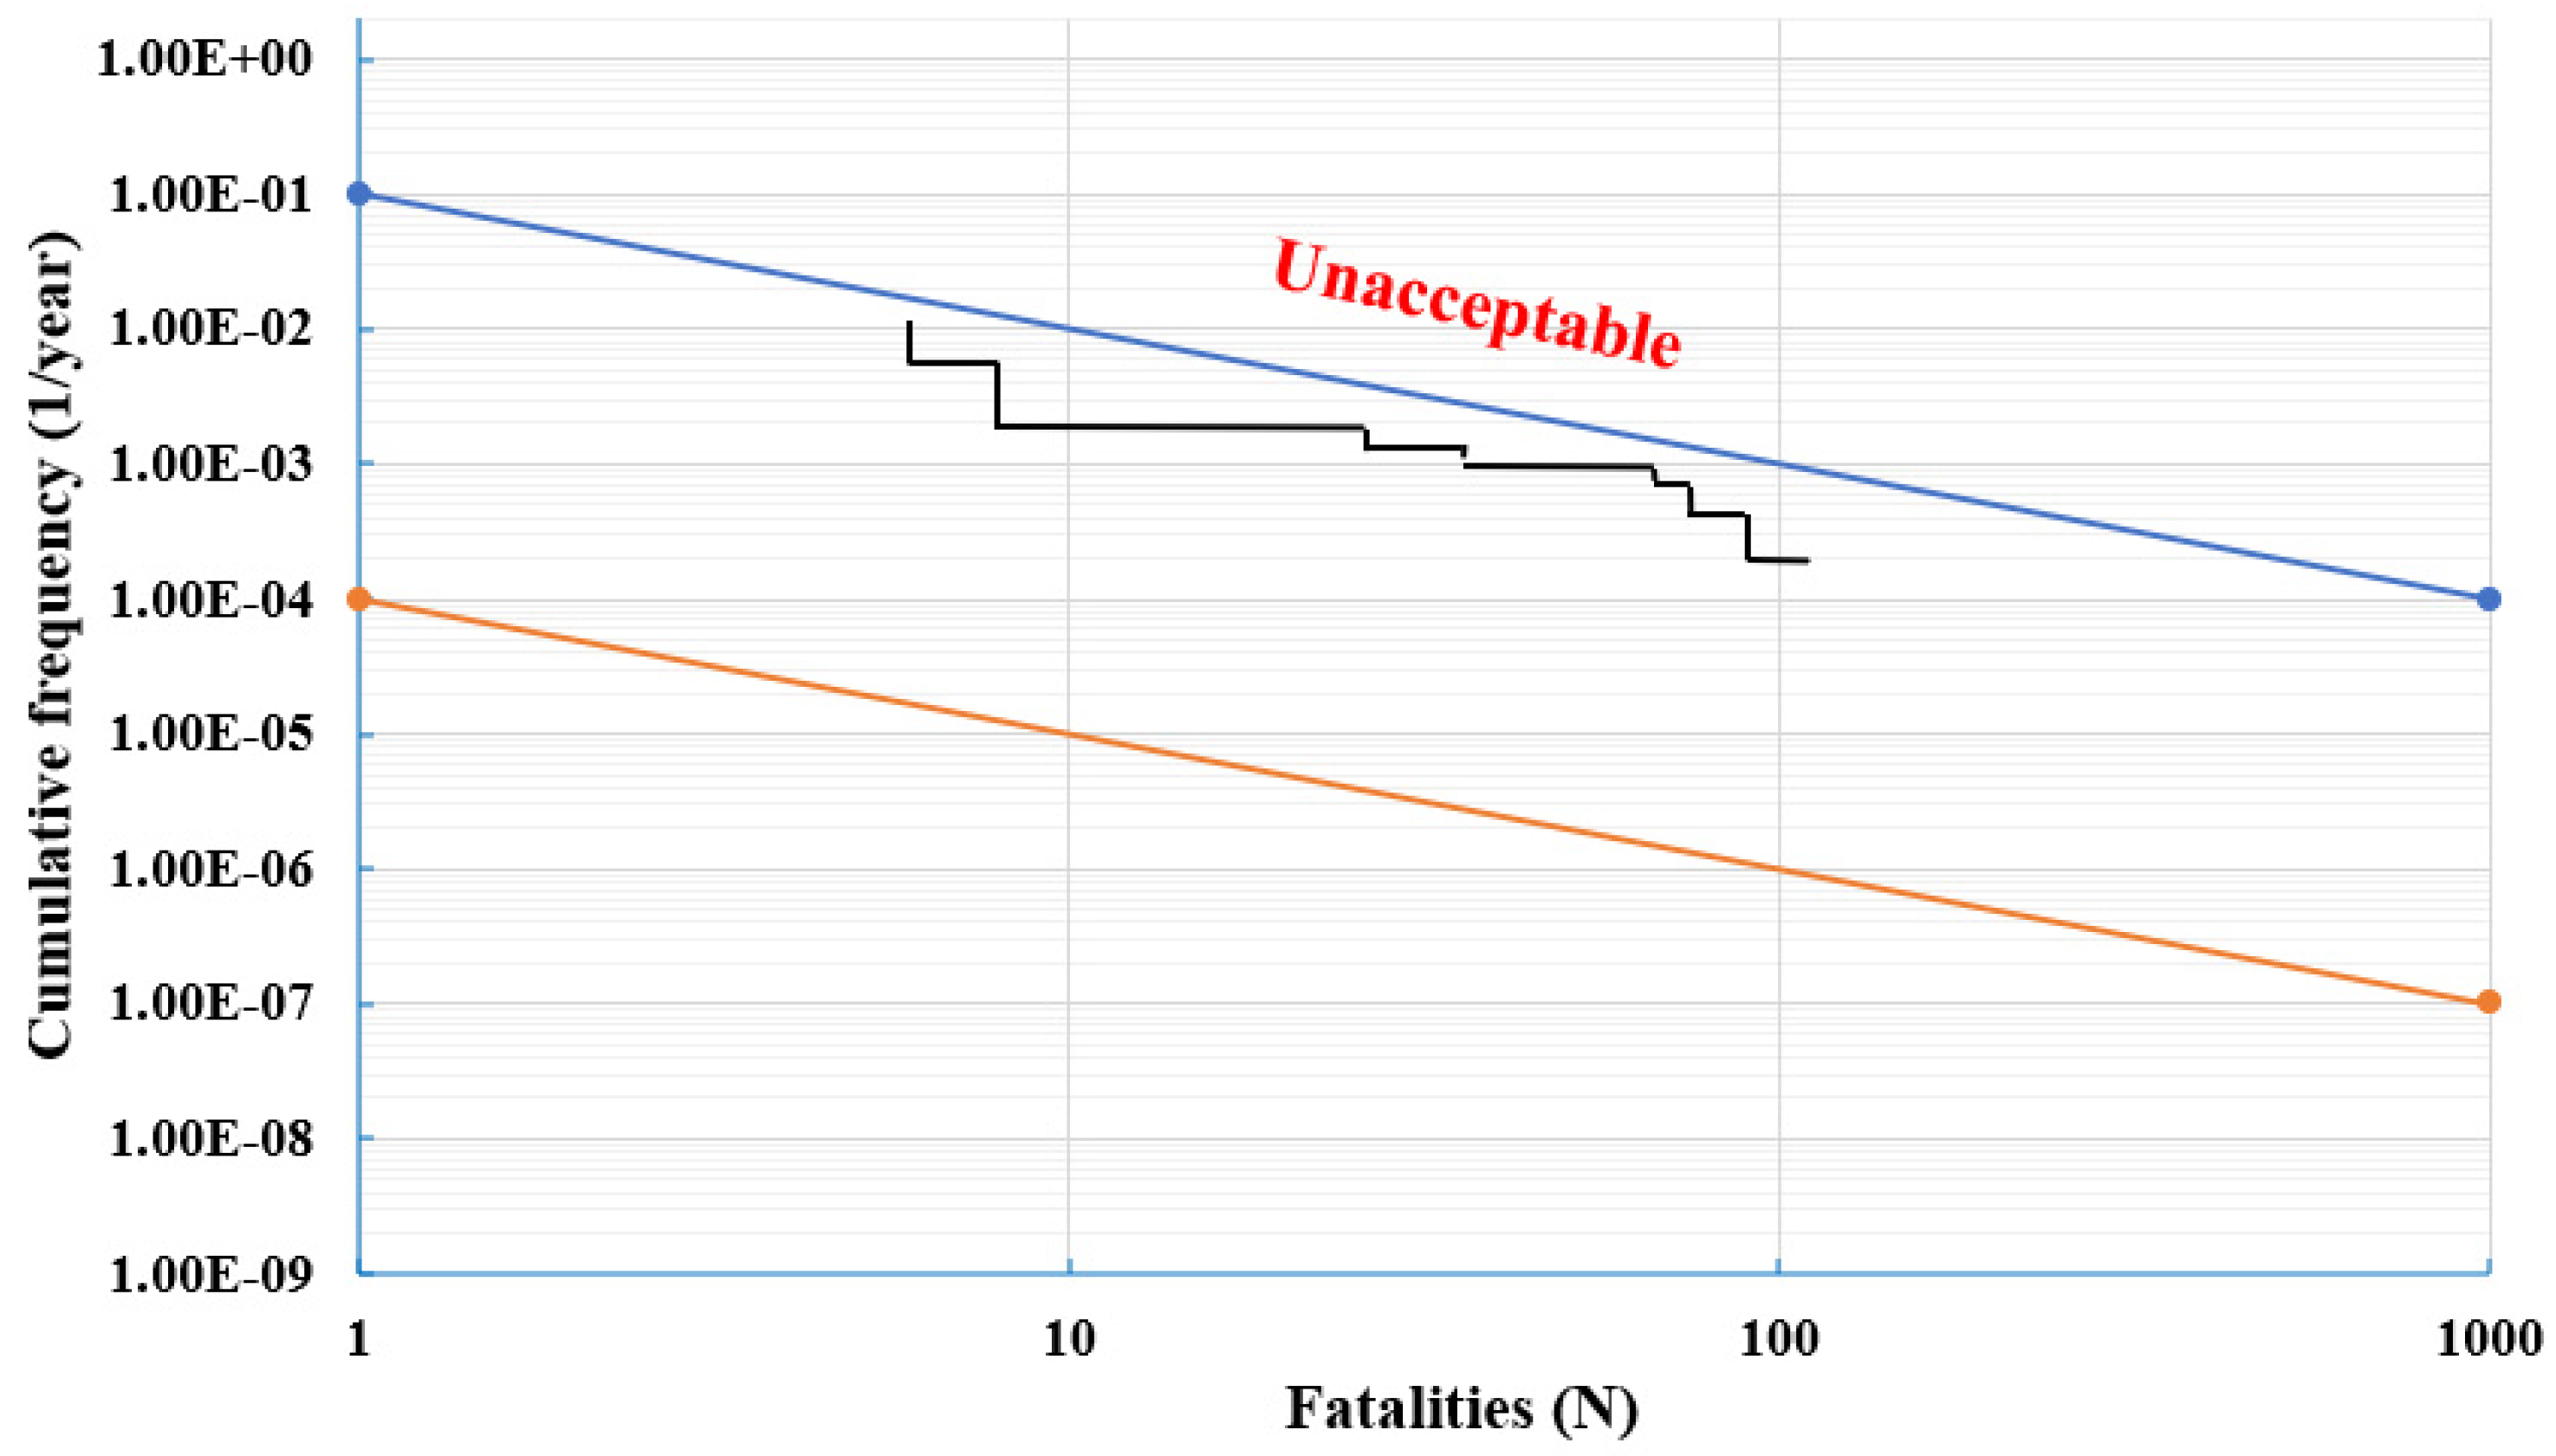
Figure 9 depicts the F/N curve of scenarios with 0 m/s ventilation velocity. The F/N curve was evaluated by comparing it with the safety target set by the UK ALARP region.
Figure 9 shows that the F/N curve can meet the safety target. Although the F/N curve locates in the acceptable region, a further analysis was carried out to study the effects of certain safety systems on the F/N curve.
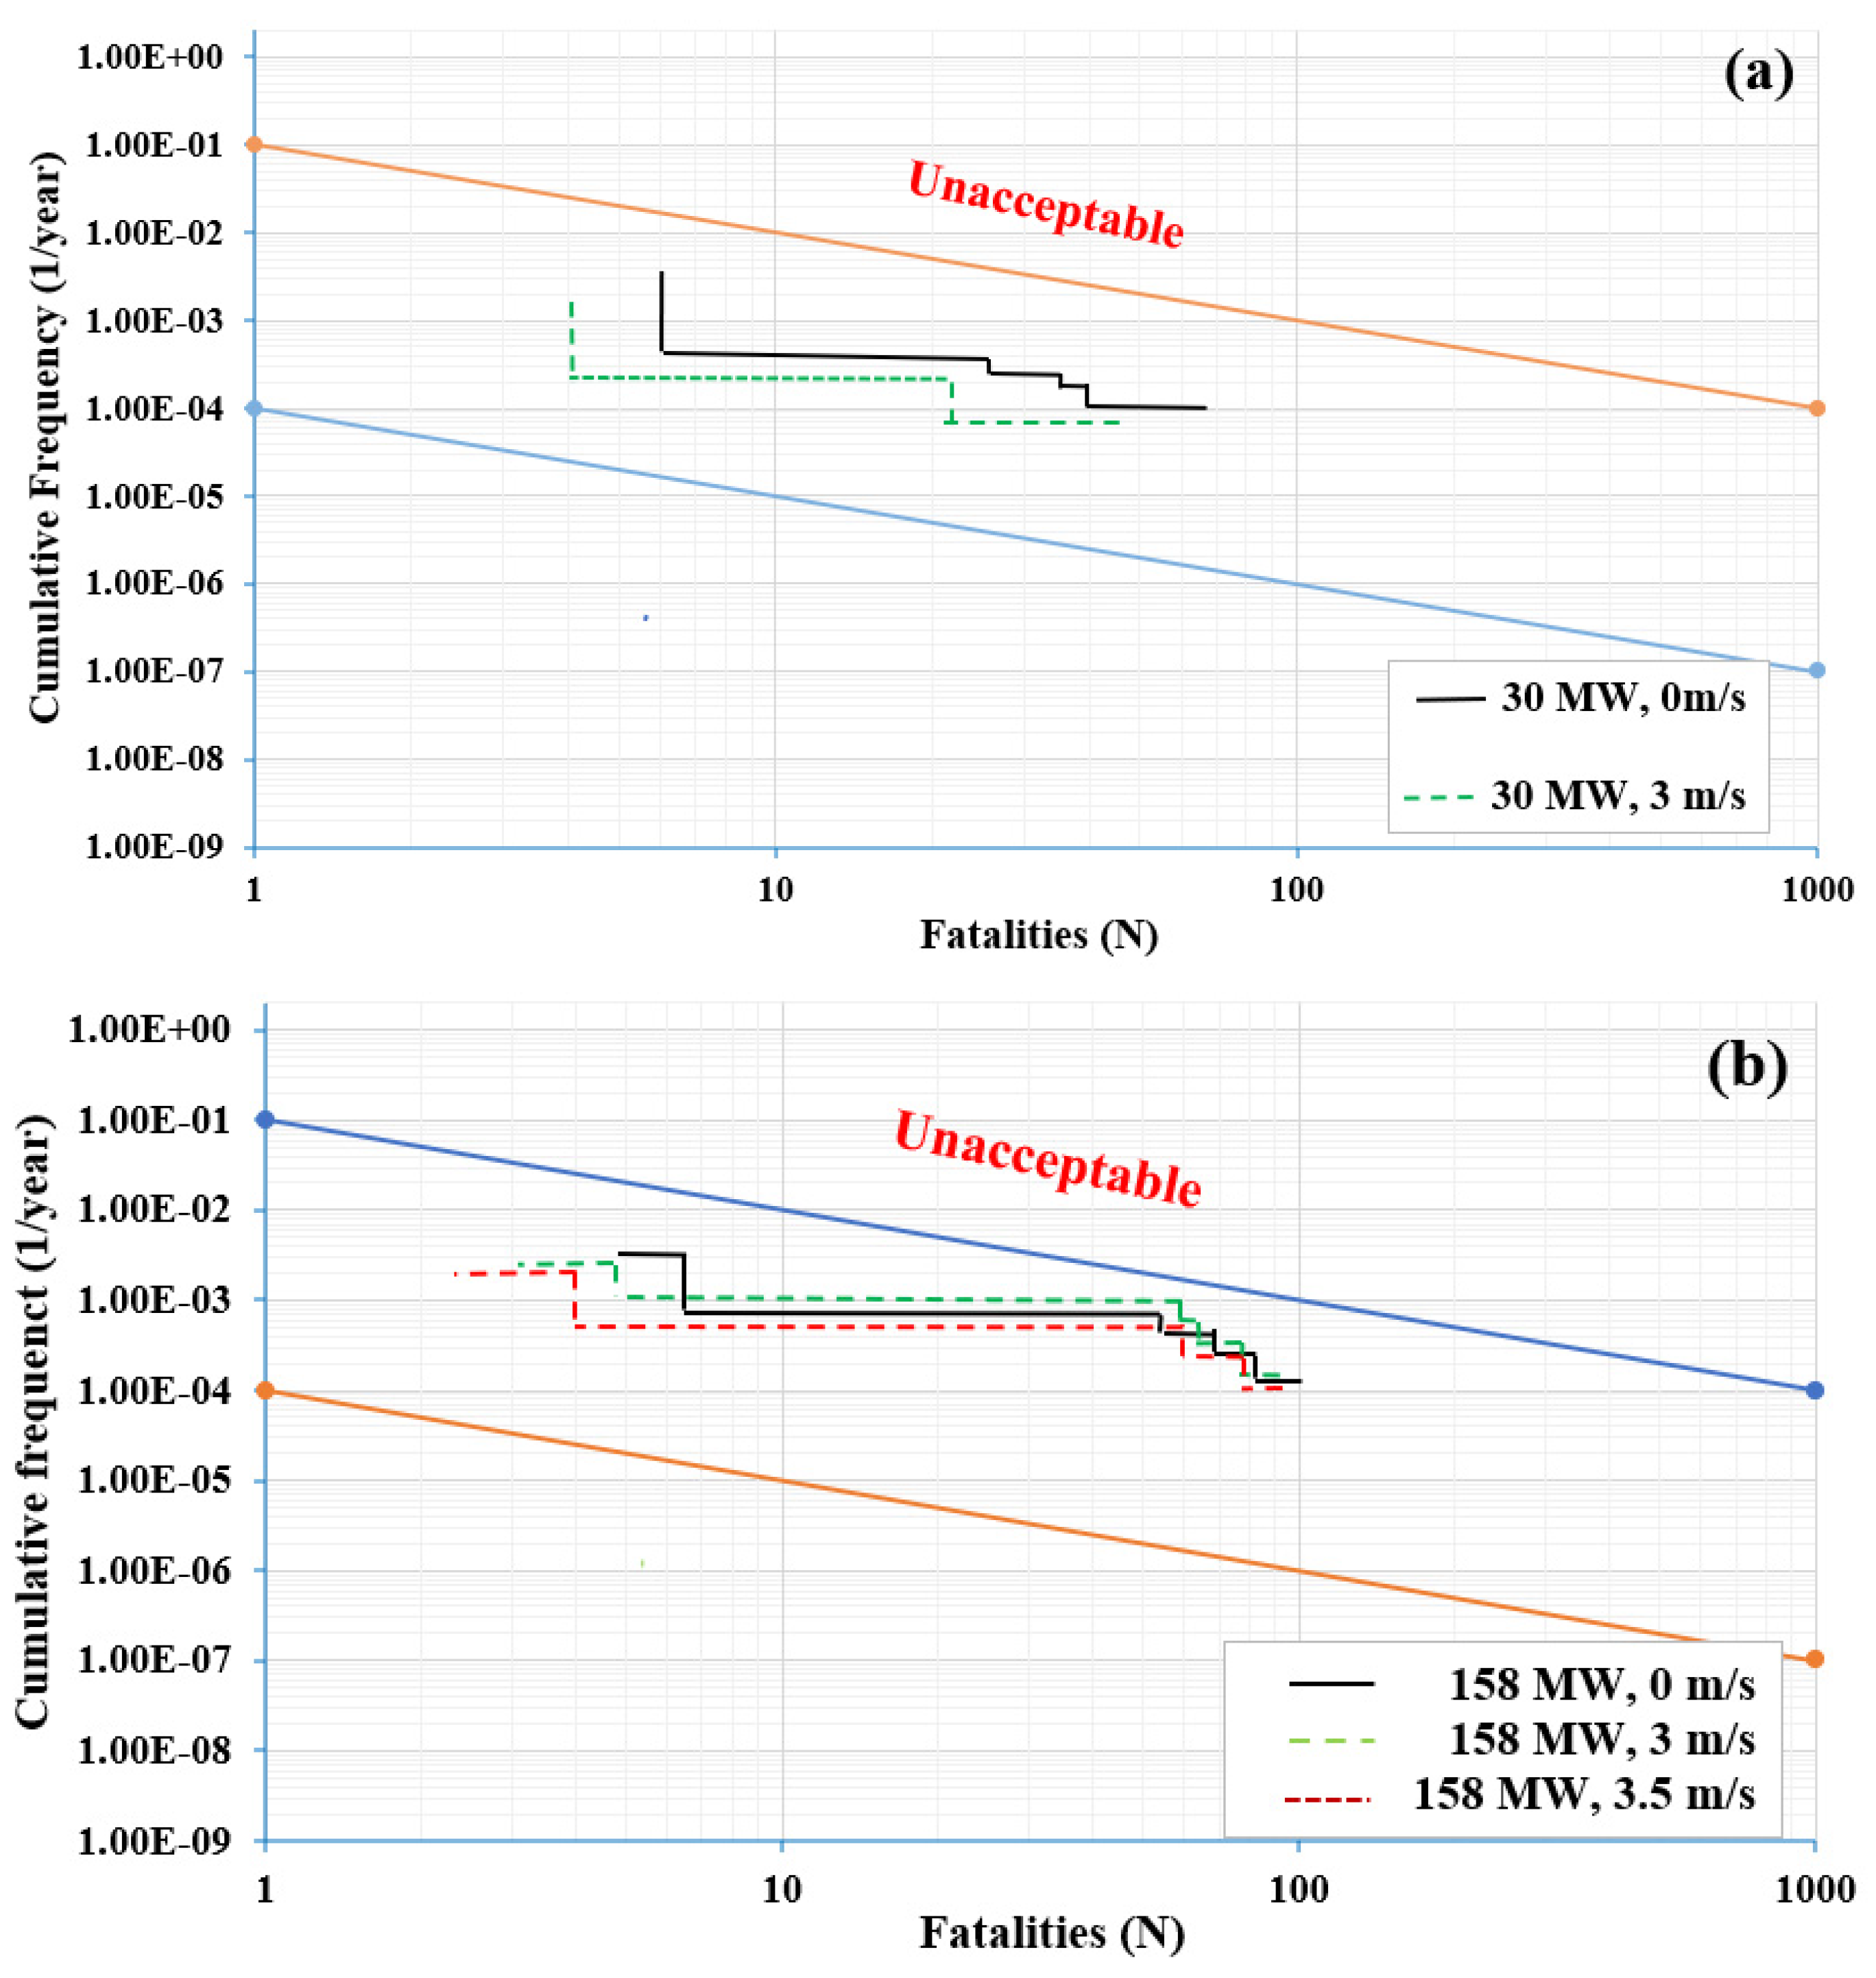
Figure 10 shows the F/N curve for ventilation velocities 0 m/s and 3 m/s for bus fire scenarios (a) and 0 m/s, 3 m/s, and 3.5 m/s for HGV fire scenarios (b). In these 34 scenarios, the tunnel can be considered safe. Although the F/N curve of 3 m/s scenarios is lower than 0 m/s scenarios for bus fire scenarios, which indicates the positive effect of the ventilation system, there is no significant difference between 0 m/s, 3 m/s, and 3.5 m/s HGV fire scenarios.
3.1. Sensitivity Analysis
3.1.1. Reference Recognition and Response Times, and Time Taken to Exit the Vehicle
Sensitivity analysis was carried out for 30 MW and 158 MW fire scenarios where there is no activate jet fans. Recognition time, response time, and time to leave the vehicle were determined pre-movement time of tunnel users ‘evacuation and time before the evacuation process toward the emergency exits begins. In this model, these pre-movement times have basic values,
(each type of vehicle). The higher these basic values, the more likely that the harmful effects of the fire incident reach the users before they start evacuation. Three modes, standard values of basic pre-movement parameters, halving of basic pre-movement parameters, and doubling basic pre-movement parameters, were considered to study the sensitivity of this model to pre-movement times. The expected damage value, EDV, which is calculated via Equation (9), is calculated for each mode.
where
is the number of fatalities for each fire scenario and
is the cumulated frequency of each fire scenario.
Table 8 illustrates the variation of EDV for halving and doubling pre-movement parameters in comparison with its value in the standard configuration.
By halving these parameters, the EDV decreases by about 57%. On the other hand, by doubling these parameters, the EDV increases by 9.85% which indicates greater pre-movement time and consequently, a higher number of tunnel users implementing the evacuation process later and being in the intolerable condition for too long.
3.1.2. The Accidents Frequency Involving HGVs
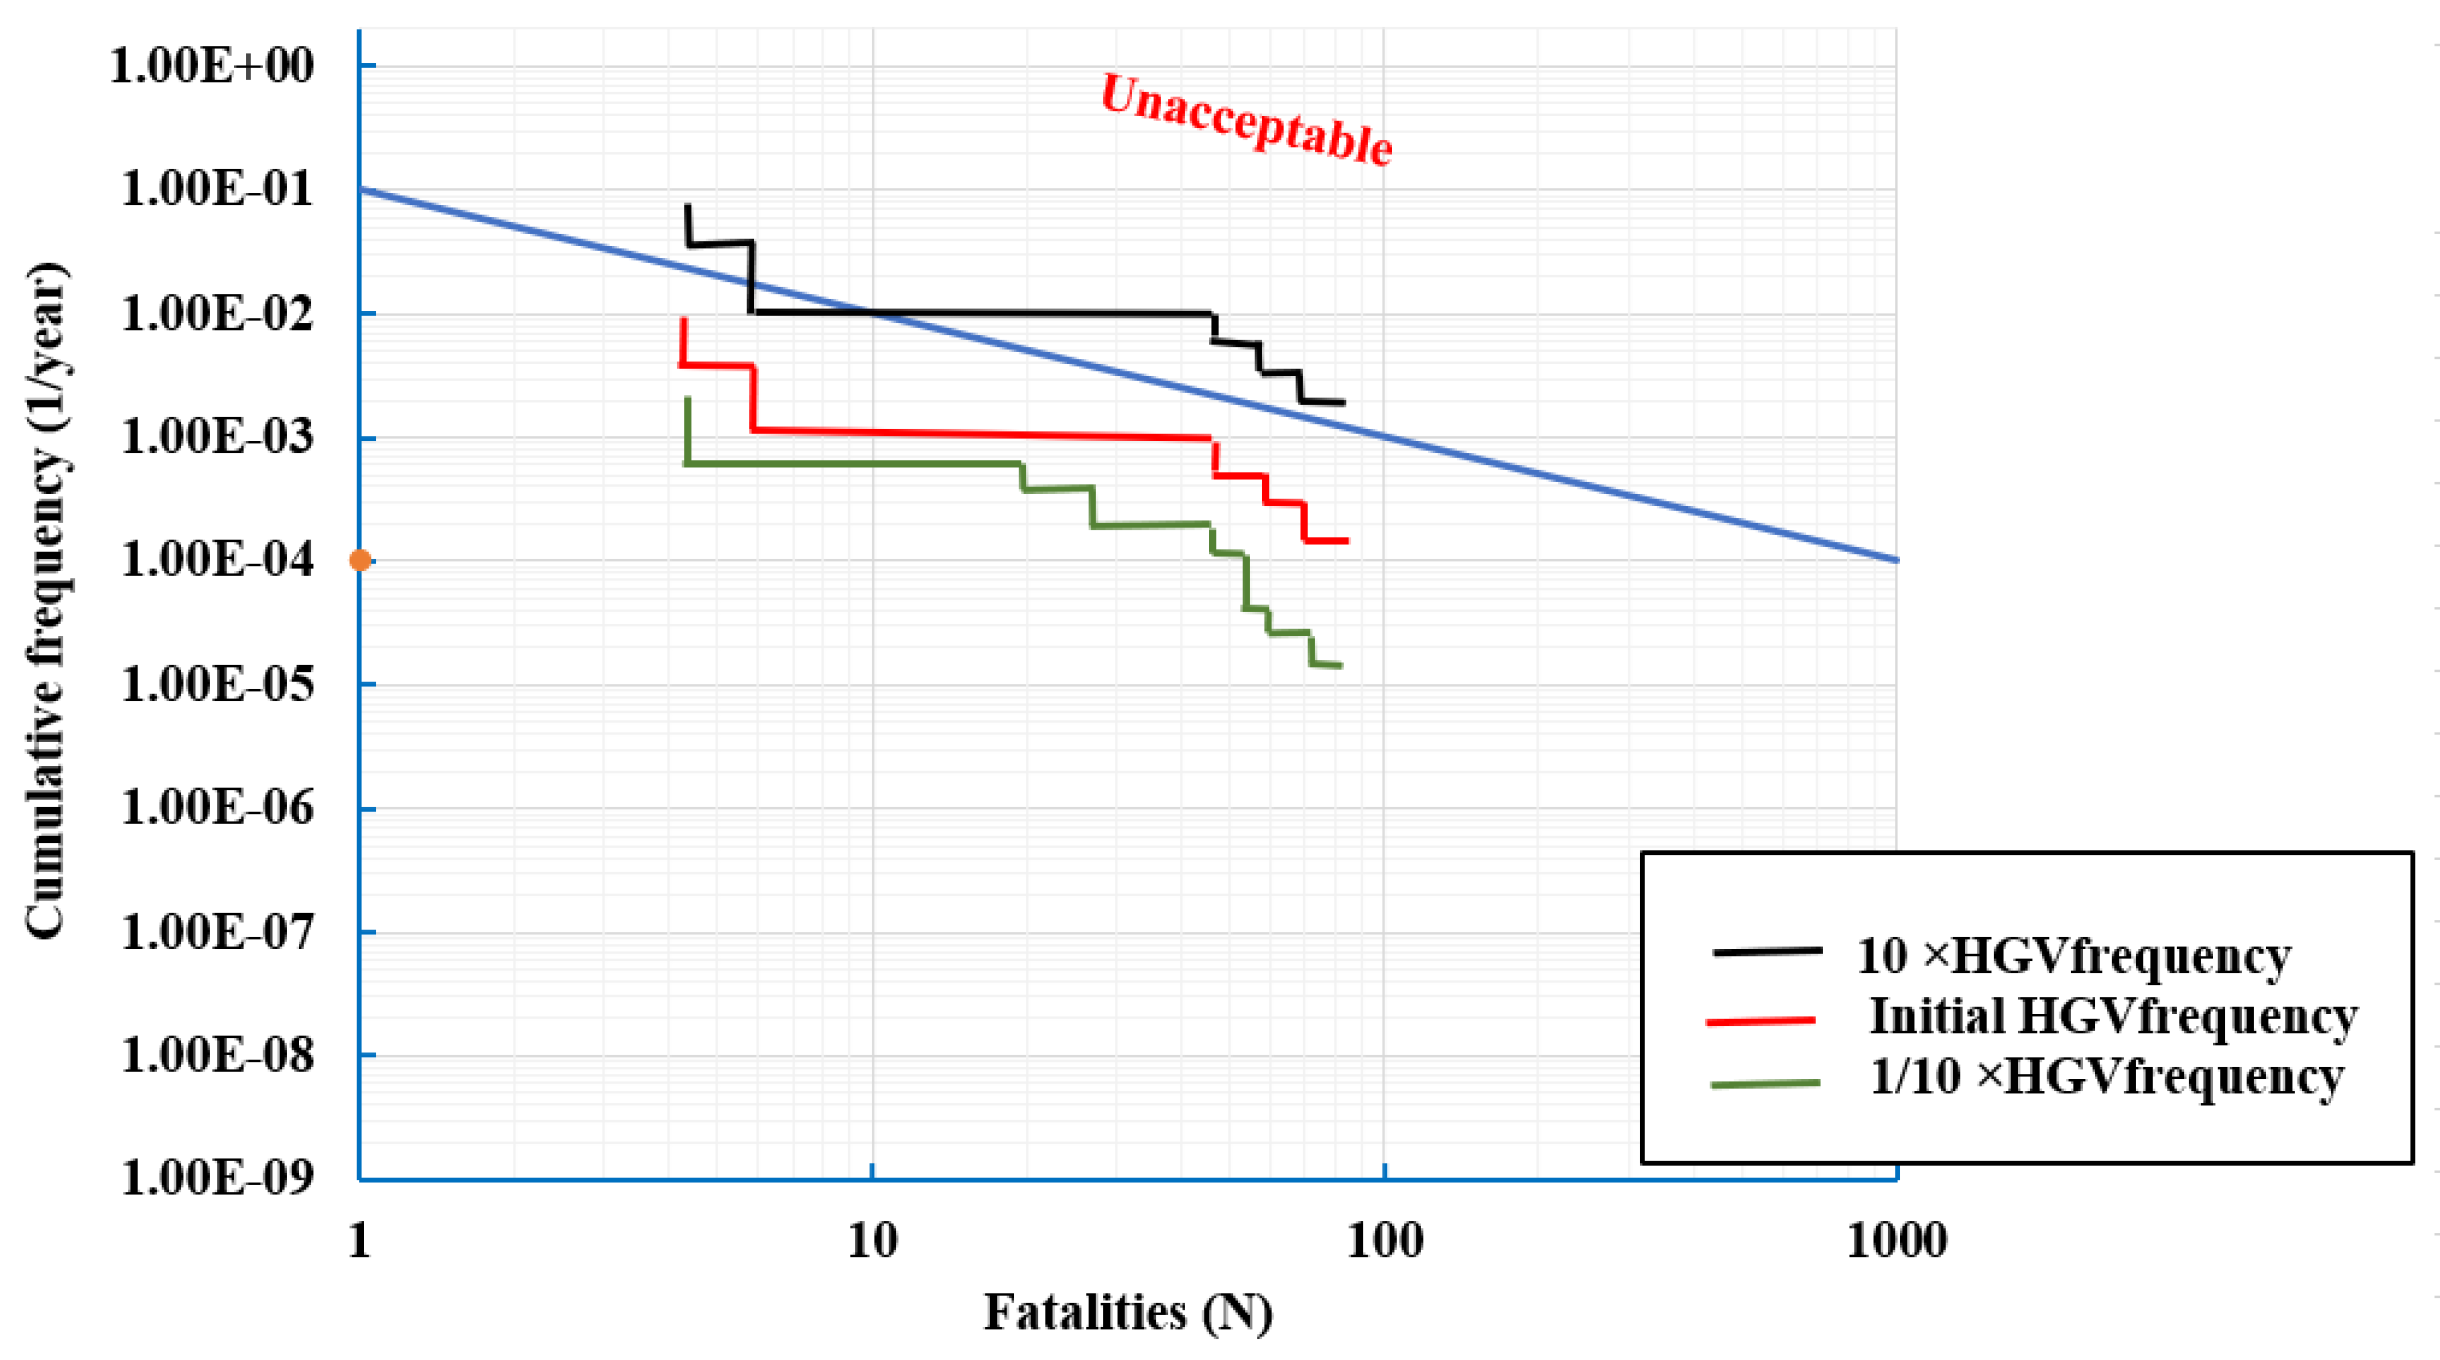
To study the influence of fire incident frequency involving HGV, the frequency of related scenarios, which are 158 MW fire incidents, is decreased and increased by a factor of 10. These frequencies, 1/10× HGV and 10× HGV, respectively lead to lower and higher cumulative frequencies and lower and higher FN curves, compared to initial FN curves of the same scenarios (without ventilation) (
Figure 11). These results explain that the frequency of occurrence of each scenario depends directly on the value of the incidental frequencies.
4. Conclusions
Tunnel fires cause fatalities and property damage. This paper provides a new methodology to perform quantitative risk analysis for road tunnels. The integrated method includes quantitative consequence analysis and quantitative frequency analysis. The quantitative consequence analysis aspect is a general method to calculate the number of fatalities and can be used for a wide range of fire scenarios and road tunnels with various characteristics. The quantitative frequency analysis was based on UK road/road tunnels statistical data. It was also applied to Gibraltar Airport Tunnel to show how the model illustrates the social risk of various fire scenarios.
Generally, the model applies to all tunnels either with natural ventilation or mechanical ventilation. The benefits of the LBAQRAMo are:
It has elements with high flexibility, and can be applied to almost every tunnel, ventilation, or traffic configuration. It can be used and supports decisionmakers to select safety measures for new tunnels or to upgrade measures for existing tunnels.
New information can be implemented very easily.
The impacts of important safety systems, their reliabilities, and the relationship between them can be included.
The interaction between smoke and fire propagation inside the tunnel and the self-rescue operation can be modelled.
The total distance of the evacuation path is calculated by considering both the longitudinal and lateral shares in the evacuation route
Traffic distribution: considering lane utilization factor for each lane based on total traffic flow of vehicles (veh/hr) in two-lane and three-lane tunnels.
The results of the model include information about the distribution of different accident consequence classes such as F/N curves.
Although LBAQRAMo has its limitations. Identification of relevant limitations is crucial for a correct interpretation of the results and the methods employed. This also makes it possible to extrapolate the findings to new applications. The main limitations of this project are:
Quantitative measures must depend on the scope and accuracy of the defined measurement scale.
Any errors in your setup or mistakes in execution can invalidate all your results. Even coming up with a hypothesis can be subjective, especially if you have a specific question that you already know you want to prove or disprove.
There are no standards and universally accepted information for implementing this method.
Only the lethal effects on humans have been of interest when analyzing the different scenarios, no consideration has been taken to material damage that might be caused because of the different scenarios that have been analyzed.
The Excel spreadsheet of the model has now been completed and has been successfully tested on three UK road tunnels.


