Article

Integrating Space Syntax and Location-Allocation Model for Fire Station Location Planning in a China Mega City

1
Engineering Physics Department, Tsinghua University, Beijing 100084, China
2
School of Intelligence Policing, China People’s Police University, Langfang 065000, China
3
Changsha Urban Planning Information Service Center, Changsha 410000, China
4
Fire and Rescue Department, Ministry of Emergency Management, Beijing 100032, China
*
Authors to whom correspondence should be addressed.
Submission received: 7 January 2023 / Revised: 5 February 2023 / Accepted: 8 February 2023 / Published: 9 February 2023

Abstract

:
The appropriate planning of infrastructure protects people’s lives and property. Fire stations are an essential part of a city’s infrastructure and they must be precisely located to shorten emergency response times and reduce casualties. Recently, the focus of the city emergency service has shifted from fire suppression to technical rescues. We compared the spatial distribution of fire suppression and technical rescues at a city scale to show the variation in their influences. An integrated road-network accessibility and location-allocation model (RNALA) for the location planning of a fire station was proposed. Specific sites for fire stations were identified using the L-A model. Then, the spatial design network analysis was performed to quantify areas around the selected site with high road network accessibility. The RNALA model was used to extend the selection from a point to a region by introducing road network accessibility to accomplish coverage and efficiency requirements. A quantitative and universal approach that focuses on fire station location planning based on emergency services is proposed. This methodology provides a practical solution for implementation, as a specific identified location might not be available for implementation. These results can serve as a reference for identifying fire station locations in cities.

1. Introduction

The rapid socioeconomic development and promotion of urbanization lead to an accumulation of urban population and wealth. The risk of disasters [1] and the total number and intensity of accidents in cities have also increased [2]. Proper planning of hazard prevention infrastructure is critical for protecting urban systems from disasters and ensuring the efficient functioning of emergency services [3]. Fire stations are vital for hazard prevention in cities [4]. The effectiveness of emergency services, including firefighting and technical rescue, can be greatly affected by the spatial configuration of fire stations [3]. Appropriate location planning of fire stations can avoid delays, reduce overlap in operating areas, and improve the efficiency of resource utilization [5,6].
The vigorous development of underground urban spaces has led to an increase in various types of accidents and disasters in them, posing new challenges for emergency services [7]. Therefore, emergency services should consider aboveground and underground spaces. Underground spaces, such as subway systems, underground shopping malls, and underground warehouses, are prone to evacuation difficulties; moreover, massive casualties can occur in the event of a fire. It is difficult to operate large rescue equipment in underground spaces where people are trapped [8].
Approximately 60% of the task of fire departments in China relate to technical rescues [9,10,11,12]; however, location planning continues to be based on standards oriented toward fire suppression, which is improper, as the spatial distribution requirements of these are different [13]. To reduce response times to disasters and achieve an equitable supply of emergency services, it is necessary to amend the method for the location planning of fire stations by combining the needs of fire suppression and technical rescues [14].
Fire station location planning should not only consider fire and technical rescue from the object of study but should also focus on relevant research methods. The location-allocation (L-A) model, used in several countries for fire station location planning, determines the optimal location in terms of travel time and distance, coverage, and other criteria [15]. For instance, Tali et al. [16] used the L-A model considering the data on locations of existing fire stations and occurrences of fire events to site fire stations in Mysore, India. Wang et al. [17] incorporated the L-A model with the network analysis to map the spatial coverage of fire stations in Beijing, China, by optimizing the coverage of high fire-risk areas and risk types. Jiang et al. [18] combined the L-A model with spatiotemporal big data, such as population density and points of interest (POI), to predict areas of fire hazards. Han et al. [19] conducted a clustering analysis using the K-means algorithm for fire occurrence locations. Subsequently, the L-A model was optimized by incorporating the speed of the road network into the location set coverage model using a travel time of 5 min as the impedance to site future fire stations in Nanjing, China.
Some studies have used the L-A model to integrate urban fire and technical rescue and other emergency services [20] to site fire stations [21]; however, studies comparing spatial loadings of different emergency services for the purpose of site selection are inadequate. Furthermore, L-A model-based methods provide specific optimal fire station locations, which are often unavailable or are in conflict with planned facilities. Thus, the selected location for a region must be sufficiently large and capable of maintaining the efficiency of the emergency service. A reasonable consideration is to circle a region around the selected site according to road accessibility (i.e., the ease of reaching service facilities or accessing the corresponding services by some means of transport [22,23,24,25]). However, in traditional planning, the location of fire stations is determined using the L-A model, and then, the urban transportation network is used for routing fire trucks to disaster sites based on road accessibility. These road accessibility studies have been extensively applied in transportation network analyses, but they have not been integrated with the L-A model at the planning stage.
Therefore, the present study aimed to compare the distribution of technical rescue and fire suppression and establish their relationships to city components to develop an integrated road-network accessibility and location-allocation model (RNALA) for siting fire stations which was suitable for engineering applications.

2. Materials and Methods

2.1. Study Area and Data Preprocessing

Emergency service call log data from January 1, 2019, to December 31, 2020, including time, location, and incident-type, were collected from a mega city in China with a population of more than 10 million. All emergency services in the city during these two years were marked on the map, and the study area was circled with ellipses of 68% standard deviation [26,27], as shown in Figure 1.
The use of internal circled roads comprising the circular ring highway effectively covers most of the area in which emergency incidents occur. The data distribution within the study area was relatively concentrated and included the core area for urban functions and most of the expansion areas. The purpose of this paper is to delineate the study area within the urban area based on data from the emergency response system of the city fire department, which excludes the interference of areas with no emergency service and rural areas [28].
Emergency services were classified into fire suppression and technical rescue [9,10,11]. Technical rescue includes assisting people trapped as a result of natural disasters, assisting with traffic accidents, saving people from suicide, removing hornet nests, hazardous material spills, and other rescues. Collected data included time, location, and type (fire and technical rescue) of each incident. Social factors associated with emergency services are determined to identify spatial fire safety risks and provide a basis for locating fire stations. Types of POI, such as residences; public services; shopping; and other commercial premises, offices, and population distribution, are factors that are strongly associated with emergency services [29,30,31]. Thus, data on POI, visitor throughput, road network, and travel speed were used in this study. Visitor throughput data consists of the origin and destination of urban residents based on location based services, with separate recording of each departure and arrival [32].
The occurrence of emergency services is strongly related to the activities of residents, and visitor throughput reflects the spatial distribution of the movement of urban residents [33]. In urban areas, a large number of mobile population groups engage in a variety of social activities. POI spatially describes regional community-level functions [34], supplementing demographic information. Adding POI features to population density may reduce relative errors [35], and models containing both are superior to univariate models [34].
Data on visitor throughput and POI for individual cells were obtained from the big data platform of Baidu Maps [36]. All data were normalized using Equation (1):
N i * = N i N m i n N m a x N m i n
where N i is the visitor throughput or the number of one of the four types of POIs (shops, public services, residences, and offices) in each cell, N m a x is the maximum value, and N m i n is the minimum value. The maximum value of POI is the sum of the four types of POIs. A very small number of cells have no data in them, and N m i n for POI and visitor throughput is 0.
Moreover, the spatial distribution of emergency services, POI, and visitor throughput were converted to kernel density using the following formula [37]:
f n ( x ) = 1 n h i = 1 n k ( x x i h )
where h is the search radius; n is the number of sample points within the search radius; x x i is the distance between x and each observation x i ; and k represents the weight of the distance, where the default value of the system is used.
Road network data were obtained from the Open Street Map (OSM) platform (http://www.openstreetmap.org/ (accessed on 15 October 2021)). Two-lane roads and higher-level roads were preserved and preprocessed as a single line. Non-municipal roads, such as the inner roads in residential quarters, were removed.
The latitude and longitude coordinates were marked according to the addresses of emergency service using the application program interface tool in Baidu Maps. The projection coordinate system selected for the study area was “WGS 1984 UTM Zone 49N”. The reported incidents were divided into 1200 × 1200 m cells in the urban area using ArcMap 10.6 [38].

2.2. Analysis of Fire Station Location through the Comparison of Fire and Emergency Services

The weights for POIs and visitor throughput were determined using a Geodetector model [39]. Different risk areas were identified using a spatial overlay. An L-A model was used to compare the locations of new fire stations considering risks of fire and emergency. Based on the identified locations of new fire stations, the boundaries of the probable sites of each fire station were determined, considering accessibility and areas above a medium-low risk that were conducive for engineering applications. The specific computational procedure is as follows.
  • The traffic network dataset was constructed based on cleaned OSM data using ArcGIS software. The travel time of roads was set as the access cost of the traffic network;
  • The spatial distribution of service demand was simulated using population and POIs to characterize fire suppression or emergency services. The spatial distribution of existing facilities was simulated (using existing fire station locations as supply points);
  • Possible candidate locations for the facilities were identified, with the centroid of the cell as the demand point. A calculation using the weights of fire and emergency service data was performed. Locations that overlapped original fire stations and those in low-risk areas were removed;
  • The maximal coverage location problem (MCLP) of the L-A model and its parameters were set;
  • The system automatically chose the appropriate location of the facility (“selected location”) according to the model;
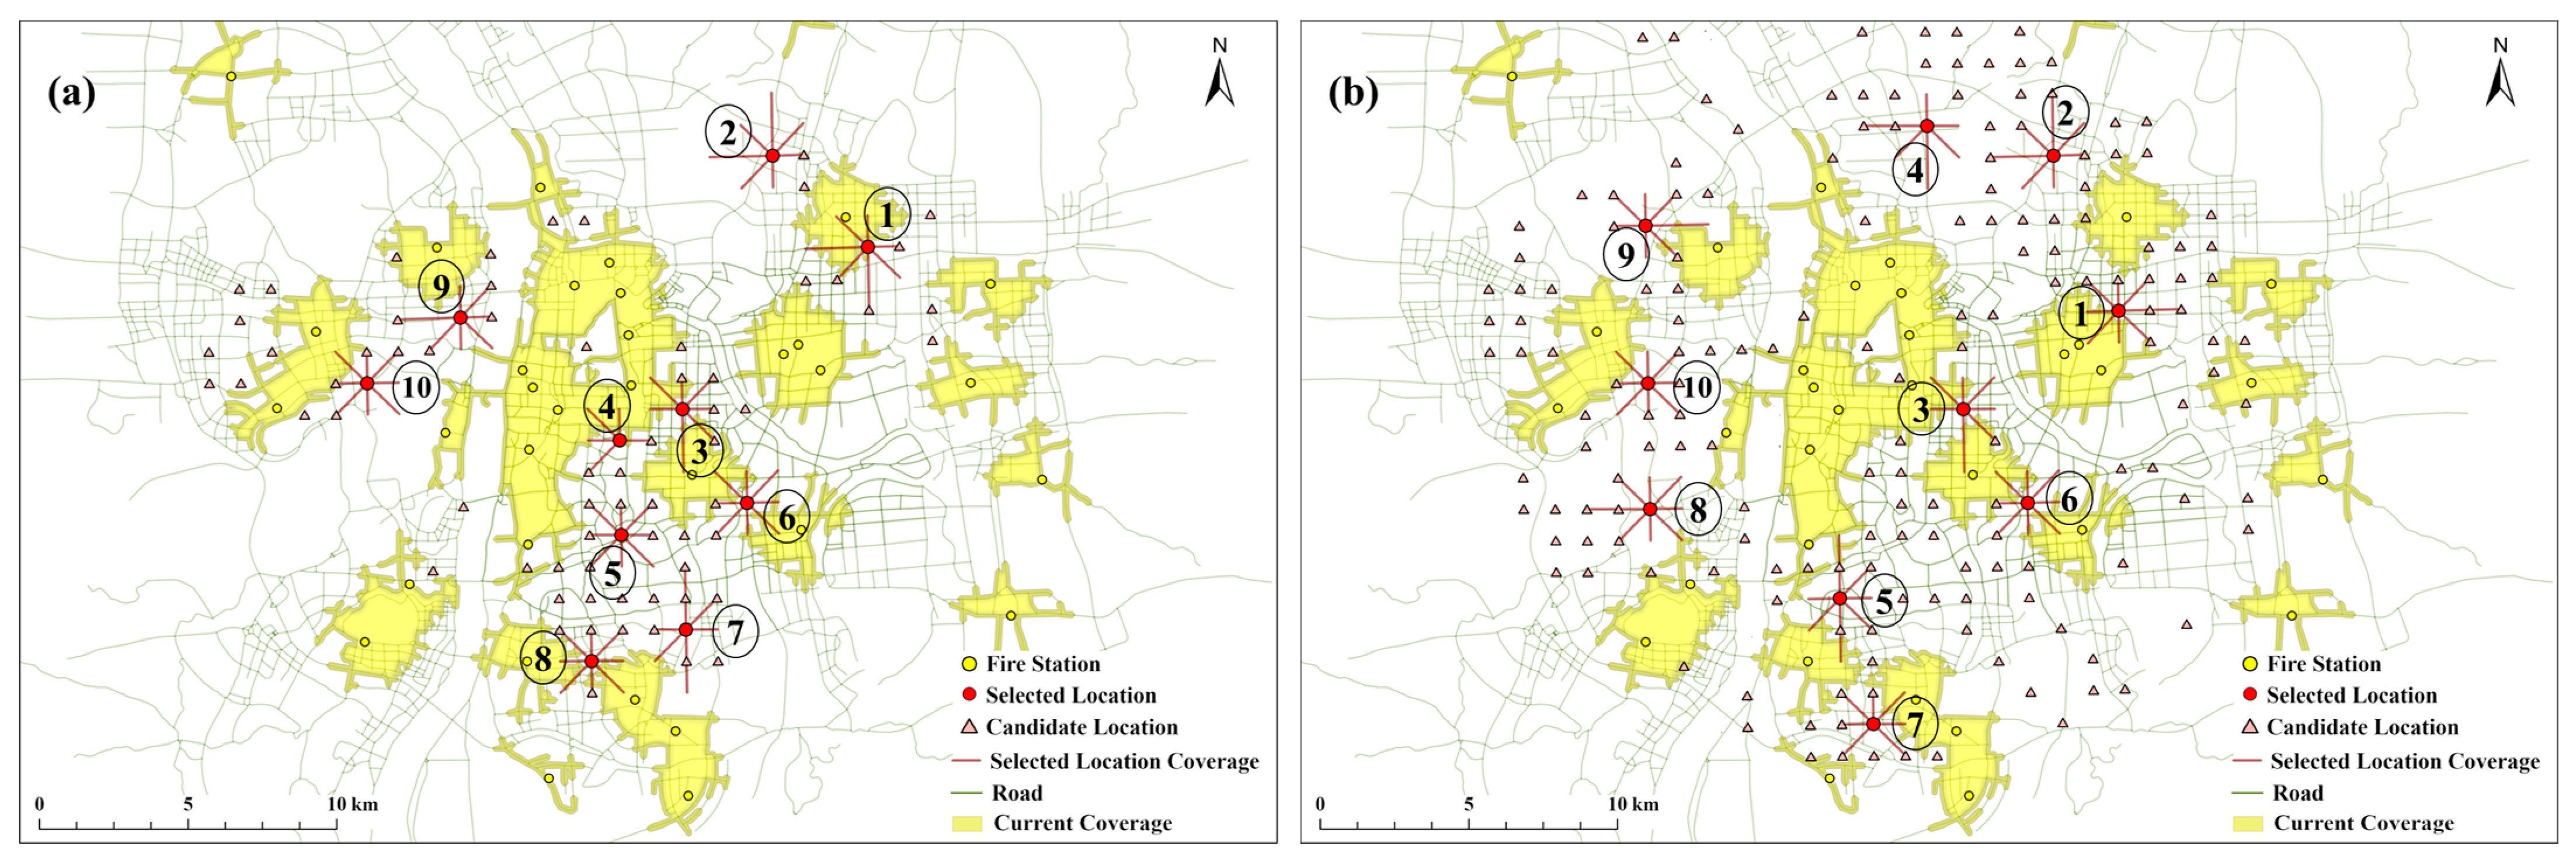
  • Results of location selection were compared and determined based on the weighted data of fire and emergency services;
  • Road network accessibility was calculated in the corresponding region of the selected location using the spatial design network analysis (sDNA) model;
  • Areas with high road network accessibility were identified as areas for candidate fire stations. Buffer zones were set for these roads;
  • Buffer zones were spatially overlaid with the areas above low risk (areas covered by existing fire stations were removed) to be used as the extension area for the results of step 6;
  • Results of the specific point of step 6 and the extension area corresponding to step 9 were combined to select the engineering region for the construction of the fire station.
The schematic framework of the spatial extension analysis for locating new fire stations is shown in Figure 2.

2.2.1. Determination of Weights in Spatial Overlay

Geodetector is a tool used to detect and exploit spatial stratified heterogeneity. The degree to which spatial stratification heterogeneity of factor x interprets attribute Y was measured using Equations (3)–(5) [40]. This study used four types of POIs [41,42] and visitor throughput to identify hotspots that would require fire suppression and emergency services.
q = 1 h = 1 L N h σ h 2 N σ 2 = 1 S S W S S T
S S W = h = 1 L N h σ h 2
S S T = N σ 2
where h = 1, …, L is the zones in a layer of the independent variable x; and N h and N are the number of zones in a layer h and the entire region, respectively. Additionally, σ h 2 and σ 2 are the variances in the h layer and entire region, respectively. SSW is the sum of the spatial variance of each layer, SST is the total variance of y in the region, and L is the layer number of variable x. The q value lies between 0 and 1. If variable x completely controls fire or technical rescue, the q value is 1; if variable x is completely unrelated to variable y, the q value is 0 [43].
The total POI and visitor throughput dataset was used to identify locations for fire suppression and emergency services. Then, the POI dataset was interpreted considering four types of POI. Next, the weights for the four types of POI and visitor throughput for fire suppression and emergency services were jointly calculated.
q was normalized to obtain the weighted values of different factors [44], as follows:
w j = q j j = 1 m q j
where w j is the weight of the jth indicator, q j is the degree to which spatial stratification heterogeneity of the jth type of indicator affects the dependent variable, and m is the number of indicator types.
The weights of the four types of POI and visitor throughput for fire and emergency services were obtained from the analysis. POI and visitor throughput data were spatially weighted and overlaid. By multiplying the number of POI or visitor throughput data points in each grid by their respective weights and then summing the results, the final superimposed risk map was generated. The formula for calculating the fire safety risk score of the study area is as follows:
R = i = 1 n w i s i
where R i is the regional safety risk score; m is the number of POI or visitor throughput in the study area; w j is the weight of the jth POI or visitor throughput; and s i j is the value of type j, observed at grid i.

2.2.2. Determination of Locations for New Fire Stations

The L-A model aims to identify appropriate facilities to serve the demand points [45]. ArcGIS software has several built-in L-A models to solve problems with different objectives and assumptions [46,47]. The goal of the MCLP model is to facilitate serving the maximum number of demand points within a defined impedance interrupt. The MCLP model is generally preferred because emergency rescue services typically must reach all request point locations within a specified response time [48]. Existing fire stations and cell centroids in areas that are above low risk are introduced into the model as the installation and demand points, respectively. The time from the fire station to the incident location will be the focal point, and hence, time (minutes) is determined as impedance.
The coverage of fire stations was computed based on the configuration of existing fire stations. Impedance interruption was set according to a 4 min travel time [49], the existing fire station location was loaded, and the existing fire station coverage zone was calculated. All segments had a mean travel speed of 32 km/h, which was determined using real-time Baidu Map road data for the considered city. The same travel speed was used for each line segment in the calculation [36].
The number of new fire stations in the near future needs to be determined based on financial resources of the government and future municipal planning, rather than locating all possible fire stations. By using the MCLP model in the L-A model [50], the locations of potential new fire stations were computed with a target of 10 new fire stations in the future. This parameter can be adjusted based on the planning of different cities.
The constraints of the maximized coverage model were determined using Equations (8)–(10) [47]:
j N i x j Z i 0 , i = 1 , 2 , , m
j = 1 n x j = p
Z i = { 1 , demand   point   i   covered 0 , demand   point   i   not   covered x j = { 1 , candidate   point   j   selected 0 , candidate   point   j   not   selected
where N i is the set of alternative fire station points that can serve a demand point i; m is the demand point; n is the candidate fire station point; and p is the total number of fire stations to be installed, with p = 10 in this study.

2.3. Spatial Extension of Locations of New Fire Stations

The method proposed in this section permits the extension of a point by the L-A model to an area. A range of locations was identified for each new fire station by calculating road accessibility and combining this with the area of risk already calculated according to Section 2.2.1.
Fire stations should be built along streets with good accessibility to the road network. sDNA [51] was used to quantitatively calculate road network accessibility. The accessibility of fire vehicles to a location in the area was evaluated using closeness, which is the travel cost from the road segment x to segment y within the radius, and this was quantified using the network quantity penalized by distance in the radius angular (NQPDA) parameter [52]; the higher the closeness, the better the accessibility of the location and the more efficient the emergency service. The equation for the NQPDA is as follows:
N Q P D A ( x ) = y R x P ( y ) d θ ( x , y )
where x and y represent network segments. The set of links in the network Euclidean radius from segment x is denoted as Rx. The proportion of any segment x within the radius is denoted as P(x), where P(y) is the weight of y within the search radius R. In discrete space, if the point is within the search radius, then the value is 1; otherwise, it is 0. In continuous space, it is determined by the ratio of the radius to the length of the section, 0 P ( y ) 1 . In addition, d θ ( x , y ) is the distance along a geodesic line between the origin segment x and destination segment y for the angular metric.
The search radius was used to calculate the coverage of a fire station with the following formula [53]:
A = 2 P 2 = 2 × ( S / λ ) 2
where A is the area protected by the fire station (km2); P is the straight-line distance from the fire station to the farthest point of the protection zone, i.e., the radius of the protection by a fire station (km); and S is the distance from the fire station to the farthest point at the edge of the protection zone, i.e., the farthest distance (km) a fire truck can travel in 4 min [49]. Additionally, λ is the road curvature coefficient, i.e., the ratio of the traffic distance between two points to the straight-line distance, which is 1.3–1.5 [53]. In this study, λ was 1.4, which yielded a protection radius of P = 1.87 km, i.e., the search radius in the sDNA was 1870 m.
A quantitative analysis of the local accessibility of the urban road network in the study area was performed by fixing a search radius of 1870 m as the closeness value. Spatial syntax theory counts roads in the top 20% of closeness values as high accessibility areas in the region [54]. The road segments with high accessibility were set as a buffer zone with a 300 m range [55,56]. Fire stations are not required to cover the entire urban city; it is sufficient for them to reach 90% of the major hazardous areas within the specified time [57]. In this study, the natural breakpoint method [58,59] was used to remove low-risk areas and retain areas above medium-low risk for calculation. After spatial overlaying, the area at above medium-low risk was selected to be overlaid spatially with the road buffer. The area already covered by the existing fire stations was removed, and areas where new fire stations could be optimally situated were derived.

3. Results and Discussion

3.1. Spatial Distribution

The spatial distribution of technical rescue, fire suppression, POI, and visitor throughput are presented in Figure 3. Fires were concentrated in the center (old town) and the visitor throughput was highly concentrated as well. In contrast, technical rescues were spread extensively, with various secondary clusters scattered outside the old town. Similarly, POIs were also distributed in parts, the primary occurrence in the old town and three smaller occurrences in the east, west, and south, where the new districts are situated. Such a coincidence might reflect the potential connection between rescues and POIs.
POIs were classified into shops, public services, residences, and offices, and their distributions are shown in Figure 4a–d. The densest part of all groups was in the center (as expected), which is the old town with a high frequency of fires and rescues, and thus, is the core area for emergency concern. Multiple additional subcenters for residences and shops exist in the periphery region that was superimposed on the strong clustering of public services and offices in the center to form the distribution map of total POIs (Figure 3c). The close association of shops with residences was rational, as the former was driven by the market to follow the development of new residential sites because the city was extended outward, while the movements of public services and offices were less efficient. Therefore, the connection between technical rescues and POIs in Figure 3 should be attributed to the residences. This was verified by examining the technical rescue records, wherein the majority of which was composed of removing hornet nests, saving trapped people, and sealing gas leaks.

3.2. Spatial Weighting and Overlay Analysis

The spatial distributions of technical rescue and fire suppression were determined through kernel density analysis. Although there were some spatially overlapping areas among these, the spatial distribution of technical rescue was extensive. Technical rescue accounted for a much larger proportion of emergency services; hence, locating fire stations should be based on technical rescue and fire suppression.
Data on emergency services change daily, while data on POI and visitor throughput remain relatively consistent over time. The analysis in Section 3.1 revealed that shops, public services, residences, offices, and visitor throughput have a high spatial overlap with emergency services, but they do not contribute equally to emergency services. The Geodetector tool was used in this study to determine the weight of each POI and visitor throughput, and spatial overlaying was used to identify different spatial risk zones. Total POI and visitor throughput q value and weights for fire suppression and emergency services are given in Table 1.
The q value and weights (q′) of four types of POI and total POI are given in Table 2.
The final q″ value and weights of the four types of POI (public services, offices, shops, and residences) and visitor throughput for fire suppression and emergency services are given in Table 3. The q″ value is derived by multiplying q′ from Table 2 with the different q values from Table 1 for the total POI for fire suppression and emergency services.
Table 3 shows that there is a difference in the weights of POI and visitor throughput for fire suppression and emergency services. Visitor throughput was 0.52 for fire suppression compared to 0.41 for emergency services, with weights of 0.11, 0.16, 0.05, and 0.16 for different types of POI for fire suppression, compared with 0.13, 0.20, 0.07, and 0.20 corresponding to emergency services. The consideration of technical rescue in emergency services is the main factor that increased the contribution of POIs, which is consistent with results of kernel density. Risk values were determined considering the weighted overlay of Equation (7).
Based on the values of calculated risk, the five intervals were classified into high risk, medium-high risk, medium risk, medium-low risk, and low risk using the natural breakpoint method (Table 2) [58,59].
As shown in Table 4, low-risk areas occupied 17.51% of the area of the case study, and these were not analyzed further. Therefore, data from medium-low to high risk were used for determining the locations of new fire stations. The results covered approximately 90% of the risk area.

3.3. Analysis of Fire Station Location through the Comparison of Fire and Emergency Services

Ten fire stations are planned to be built in the city, and this study used a location distribution model to determine the location planning map of these fire stations considering only fire data and fire data combined with technical rescue data. The results based on POI and visitor throughput are shown in Figure 5.
A comparison between Figure 5a,b shows that the service area obtained based on the real road network is an irregular polygon rather than a circle. The figure visually shows the coverage of fire stations, and many areas exceed the 4 min driving service radius specified, which indicates that the service level of fire stations in the area is insufficient. Most of the identified new locations for the fire stations had obvious differences. Only four locations of fire stations (2, 3, 6, and 10) remained essentially the same, with the same distribution areas for technical rescue and fire incidents, indicating locations of new priority fire stations. However, there were significant spatial differences in other regions, probably because of the high fire safety design standards and new circuitry systems in recently developed urban areas, which reduce the fire hazard. However, the rapidly increasing external population results in higher technical rescues, which influences the location of fire stations. Additionally, as old town roads are relatively narrow, driving speeds are slow, and typically minor traffic accidents occur often, without the requirement of assistance from the fire station. New urban areas, however, often have expressways, where traffic speeds are much greater, and traffic accidents can lead to trapped people, thereby requiring more rescues.
The distribution of fire stations (3, 4, 5, 6, 7, and 8) in Figure 5a is highly concentrated, mostly in the old town, wherein electrical wiring in buildings and other facilities are old, with piled up debris and outdated firefighting facilities, making it a high fire-risk area. If traditional planning is adopted to construct fire stations, then stations will be concentrated in the old town with limited financial resources. Based on the weighted calculation of emergency services data, only four fire stations (3, 5, 6, and 7) were shortlisted, and the number of stations was reduced and their distribution decentralized, as seen in Figure 5b. Selected locations (4 and 8) in Figure 5b are fire stations with different spatial sites compared to Figure 5a, where the selected location (8) is a university town with a concentration of higher education schools, vocational education schools, and technical engineering schools. This area is spatially superimposed on the city’s high-tech development zones and industrial parks, some of which have technology parks, factories, or processing plants attached to the schools. Location (4) is also an industrial park in the new town, and these areas have a high demand for technical rescue.
These results are consistent with the pattern of distribution of fire suppression and technical rescue based on kernel density analysis, indicating that using POI and visitor throughput data can better characterize the spatial pattern of the distribution of emergency services.

3.4. Network Accessibility Analysis

Results of sDNA on the accessibility of the road network indicate closeness on a log scale (Figure 6).
The average closeness of the road network in the study area was −1.28 within a search radius of 1870 m. For all roads in the road system, the average value was 56.99% of the total, indicating that there are many roads with poor accessibility in the city. Roads with low closeness values of −3.80 to −1.49 accounted for 19.75% of the total.
Figure 6 shows that the integration of the road network was high in the east and low in the west. The eastern and western parts had well-developed and underdeveloped road network structures, respectively. Two contiguous areas with a high closeness in the eastern and western areas were national economic and technological development districts. The contiguous area with a high closeness in the center of the eastern part is the largest business district in the city with the highest kernel density for technical rescue and fire suppression, and therefore, it requires new fire stations.
In spatial syntax theory, roads with higher closeness values are counted as foreground networks, which can reveal areas with high accessibility in a region [15]. Results show closeness values of −0.65 to −0.01, −0.95 to −0.65, and −1.13 to −0.95 accounted for 3.91, 11.40, and 20.01%, respectively, with a total of 35.32%, and these are preferred options for locating fire stations. This inference is consistent with the requirement that a “fire station should be located on a street where vehicles can be quickly dispatched” [53].

3.5. Extension of the Fire Station Location from a Specific Site to a Region

Based on the calculated accessibility of the road network, segments with higher closeness values were selected to fix buffer zones. The areas with a risk value of above medium-low were then overlapped to obtain areas for the optimal location of a new fire station (Figure 7).
Red points in Figure 7 correspond to the locations of the new fire stations, and areas with purple shading are extensions of these points. The shaded area corresponding to each point is not regular, and the extension area of a position (1, 2, 5, and 7) is larger, indicating larger space for building fire stations. These four regions correspond to the new urban areas of the city with wide roads and better accessibility compared to other regions. The same driving time can cover a wider area. Locations (3, 4, 6, 8, 9, and 10) correspond to small extension areas. Locations (4 and 8) have relatively fewer available roads owing to natural conditions (small lakes and mountains in the urban area) but have a relatively high demand for emergency services. Locations (3, 6, 9, and 10) are in relatively densely populated areas, and fire stations are present around them, but they cannot cover demand areas. The fire station should be constructed close to the optimum location to ensure that it does not overlap with the coverage area of an existing fire station.
Compared to the locations calculated using the L-A model, the optimal planning areas that were derived in this study are relatively large in scope and provide suitable options for appropriate planning. If a building already exists in an identified location, the final location can be selected from within the extension area of that point, preferably near the point. Locations (1, 2, 5, and 7) have larger available areas for localization (Figure 7). Locations (1 and 2) have a better transportation network and relatively comprehensive infrastructure support, but the coverage of the existing fire station is not adequate, indicating more available space for locating fire stations. Location 5 in the southern part of the city is in an area of commercial and economic importance and has many public-service institutions with a higher demand for a fire station. Location 7 currently has a low coverage of utility facilities; however, integration with neighboring southern cities is likely to accelerate, resulting in an increase in public service facilities and infrastructure, and therefore, more space is available to meet the increase in demand for fire stations.
A comparison between Figure 6 and Figure 7 reveals that existing fire stations are built in areas with better accessibility to the road network. Fire stations in these areas should avoid situations wherein their vehicles are prevented from being dispatched because of traffic congestion around them. The increase in population in large cities is likely to increase traffic congestion, and hence, road accessibility is vital for the siting and construction of new fire stations.

4. Conclusions

The present study analyzed the emergency service records of a mega city in China to show the spatial distribution of fire suppression and technical rescues and their connections to POI and visitor throughput quantities. A fire station location planning method was proposed by adding the accessibility of road networks to the traditional L-A model to outline a region for the construction of a fire station. The findings are as follows:
1. The spatial distribution of technical rescues was different from that of fire suppression. The former was concentrated in the city center but with a few additional secondary hot spots scattered in expansion areas of the city forming new subcenters. The latter was highly concentrated in the old town at the center. The emergency map was a combination of these two parts but reflected more technical rescues as it has emerged as the primary emergency task;
2. The connections between the distribution of emergencies to local POI and visitor throughput were quantified. Fires were evenly correlated between POI and visitor throughput, indicating that these static and dynamic components were significantly related. Emergency rescues were more aligned with the static component (POI), even though it was naturally cross-related to the dynamic visitor throughput;
3. An integrated RNALA model for siting fire stations was proposed by integrating the L-A model with road-network accessibility. The location planning of fire stations was steered more toward emergency services compared to fire suppression alone based on the distribution of POI and visitor throughput.
The identified locations for fire stations were significantly different when sites were selected using the weights of data on fire and emergency services. Selected sites were concentrated in the old town while considering weights of fire data, whereas they were dispersed while considering weights of data on emergency services. The location was pinpointed to a specific site using the traditional L-A model. The sDNA model using the spatial syntax method was applied to quantify the accessibility values of different roads. Roads with higher accessibility were selected according to the classification, and a buffer zone was established and spatially overlaid with the risk area identified using weights of data on emergency services to outline an extended area for siting. The final site selection was based on the availability of vacant land closer to the selected site based on the L-A model.
In general, the spatial difference between fire suppression and technical rescues is significant for the siting of fire stations, as the latter forms a major part of emergency services. Extending the selected site to an extended region is practical as the specific location might not be available for construction. The findings of the current study are in line with the development of the emergency service in cities and can serve as a reference for other cities. In future studies, the impact of weather and holidays on emergency services can be analyzed to explore the influence of the location of a fire station while considering spatiotemporal dimensions.

Author Contributions

Conceptualization, F.T.; methodology, F.T.; software, F.T. and J.L.; validation, X.Z. and Y.Y.; data curation, F.T. and Y.Y.; writing—original draft preparation, F.T.; writing—review and editing, F.T. and X.Z.; visualization, F.T.; supervision, X.Z. All authors have read and agreed to the published version of the manuscript.

Funding

This study was funded by the National Key R&D Program of China (No. 2020YFC0833400) and the Key Research Projects of Chinese People’s Police University (No. ZDZX202005).

Institutional Review Board Statement

Not applicable.

Informed Consent Statement

Not applicable.

Data Availability Statement

Not applicable.

Conflicts of Interest

The authors declare no conflict of interest.

References

  1. Lan, Z. Reflections on constructing national comprehensive emergency rescue system in the new era. Fire Sci. Technol. 2018, 37, 958–961. [Google Scholar]
  2. Fan, W.C. The development trend of safe and resilient cities. Labour Protect. 2020, 3, 20–23. [Google Scholar]
  3. Uddin, M.S.; Warnitchai, P. Decision support for infrastructure planning: A comprehensive location–allocation model for fire station in complex urban system. Nat. Hazards 2020, 102, 1475–1496. [Google Scholar] [CrossRef]
  4. Murray, A.T.; Grubesic, T.H. Overview of reliability and vulnerability in critical infrastructure. In Critical Infrastructure; Springer: Berlin/Heidelberg, Germany, 2007; pp. 1–8. [Google Scholar] [CrossRef]
  5. Chaudhary, P.; Chhetri, S.K.; Joshi, K.M.; Shrestha, B.M.; Kayastha, P. Application of an Analytic Hierarchy Process (AHP) in the GIS interface for suitable fire site selection: A case study from Kathmandu Metropolitan City, Nepal. Socio-Econ. Plan. Sci. 2016, 53, 60–71. [Google Scholar] [CrossRef]
  6. Liu, D.; Xu, Z.; Yan, L.; Wang, F. Applying real-time travel times to estimate fire service coverage rate for high-rise buildings. Appl. Sci. 2020, 10, 6632. [Google Scholar] [CrossRef]
  7. Wang, K.; Yuan, Y.; Chen, M.; Wang, D. A POIs based method for determining spatial distribution of urban fire risk. Process Saf. Environ. Prot. 2021, 154, 447–457. [Google Scholar] [CrossRef]
  8. Liu, Q.; He, R.; Zhang, L. Simulation-based multi-objective optimization for enhanced safety of fire emergency response in metro stations. Reliab. Eng. Syst. Saf. 2022, 228, 108820. [Google Scholar] [CrossRef]
  9. Pántya, P. Fire, rescue, disaster management. Experiences from different countries. Acad. Appl. Res. Mil. Public Manag. 2018, 17, 77–94. [Google Scholar] [CrossRef]
  10. Kuk, E.; Pántya, P. Fire service responses and the need for foreign language knowledge. J. Environ. Prot. Saf. Edu. Manag. 2016, 4, 29–36. [Google Scholar]
  11. Ikuomola, A.D.; Okunola, R.A. Urban space and the proliferaton of illegal and substandard crèche facilites in Nigeria. Ann. Univ. Paedagog. Crac. Stud. 2016, 2, 67–79. [Google Scholar]
  12. China Fire Yearbook Editorial Board. Available online: http://www.china-fire.com/ (accessed on 6 October 2021).
  13. Yao, J.; Zhang, X.; Murray, A.T. Location optimization of urban fire stations: Access and service coverage. Comput. Environ. Urban Syst. 2019, 73, 184–190. [Google Scholar] [CrossRef]
  14. Murray, A.T. Optimising the spatial location of urban fire stations. Fire Saf. J. 2013, 62, 64–71. [Google Scholar] [CrossRef]
  15. Chen, Z.; Li, J.; Lu, F.; Li, Q. Optimizing location of fire stations and it’s enlightenments for Xiongan New Area. J. Saf. Sci. Technol. 2018, 14, 14–19. [Google Scholar]
  16. Tali, J.A.; Malik, M.M.; Divyashree, S.; Nusrath, A.; Mahalingam, B. Location–allocation model applied to urban public services: Spatial analysis of fire stations in Mysore urban area Karnataka, India. Int. J. Adv. Res. Dev. 2017, 2, 795–801. [Google Scholar] [CrossRef]
  17. Wang, W.; Xu, Z.; Sun, D.; Lan, T. Spatial Optimization of Mega-City Fire Stations Based on Multi-Source Geospatial Data: A Case Study in Beijing. ISPRS Int. J. Geo-Inf. 2021, 10, 282. [Google Scholar] [CrossRef]
  18. Jiang, Y.; Lv, A.; Yan, Z.; Yang, Z. A GIS-Based Multi-Criterion Decision-Making Method to Select City Fire Brigade: A Case Study of Wuhan, China. ISPRS Int. J. Geo-Inf. 2021, 10, 777. [Google Scholar] [CrossRef]
  19. Han, B.; Hu, M.; Zheng, J.; Tang, T. Site selection of fire stations in large cities based on actual spatiotemporal demands: A case study of Nanjing city. ISPRS Int. J. Geo-Inf. 2021, 10, 542. [Google Scholar] [CrossRef]
  20. Abd El Karim, A.; Awawdeh, M.M. Integrating GIS accessibility and location-allocation models with multicriteria decision analysis for evaluating quality of life in Buraidah city, KSA. Sustainability 2020, 12, 1412. [Google Scholar] [CrossRef]
  21. Chevalier, P.; Thomas, I.; Geraets, D.; Goetghebeur, E.; Janssens, O.; Peeters, D.; Plastria, F. Locating fire stations: An integrated approach for Belgium. Socio-Econ. Plan. Sci. 2012, 46, 173–182. [Google Scholar] [CrossRef]
  22. Shahparvari, S.; Fadaki, M.; Chhetri, P. Spatial accessibility of fire stations for enhancing operational response in Melbourne. Fire Saf. J. 2020, 117, 103149. [Google Scholar] [CrossRef]
  23. Kiran, K.C.; Corcoran, J.; Chhetri, P. Measuring the spatial accessibility to fire stations using enhanced floating catchment method. Socio-Econ Plan. Sci. 2020, 69, 100671–100673. [Google Scholar] [CrossRef]
  24. Xia, Z.; Li, H.; Chen, Y.; Yu, W. Integrating Spatial and Non-Spatial Dimensions to Measure Urban Fire Service Access. ISPRS Int. J. Geo-Inf. 2019, 8, 138. [Google Scholar] [CrossRef]
  25. Min, S.; Kim, D.; Lee, C.K. Association between spatial accessibility to fire protection services and unintentional residential fire injuries or deaths: A cross-sectional study in Dallas, Texas. BMJ Open 2019, 9, e23780. [Google Scholar] [CrossRef]
  26. Zenk, S.N.; Schulz, A.J.; Matthews, S.A.; Odoms-Young, A.; Wilbur, J.; Wegrzyn, L.; Gibbs, K.; Braunschweig, C.; Stokes, C. Activity space environment and dietary and physical activity behaviors: A pilot study. Health Place 2011, 17, 1150–1161. [Google Scholar] [CrossRef] [PubMed] [Green Version]
  27. Li, Y.; Xue, Y.; Guang, J.; de Leeuw, G.; Self, R.; She, L.; Fan, C.; Xie, Y.; Chen, G. Spatial and temporal distribution characteristics of haze days and associated factors in China from 1973 to 2017. Atmos. Environ. 2019, 214, 116862. [Google Scholar] [CrossRef]
  28. Tian, F.; Sun, Z.; Zheng, X.; Yin, Y. Spatial heterogeneity and influencing factors of urban emergency services. Tsinghua Sci. Technol. 2023, 1–12. [Google Scholar] [CrossRef]
  29. Liu, D.; Xu, Z.; Wang, Z.; Fan, C. Regional evaluation of fire apparatus requirements for petrol stations based on travel times. Process Saf. Environ. Prot. 2020, 135, 350–363. [Google Scholar] [CrossRef]
  30. Jennings, C.R. Social and economic characteristics as determinants of residential fire risk in urban neighborhoods: A review of the literature. Fire Saf. J. 2013, 62, 13–19. [Google Scholar] [CrossRef]
  31. Costafreda-Aumedes, S.; Comas, C.; Vega-Garcia, C. Human-caused fire occurrence modelling in perspective: A review. Int. J. Wildland Fire 2018, 26, 983–998. [Google Scholar] [CrossRef]
  32. Hoon Hyun, K.; Min, A.; Kim, S.; Lee, J.H. Investigating cultural uniqueness in theme parks through finding relationships between visual integration of visitor traffics and capacity of service facilities. Int. J. Archit. Comput. 2016, 14, 247–254. [Google Scholar] [CrossRef]
  33. Li, T.; Pei, T.; Yuan, Y.; Song, C.; Wang, W.; Yang, G. A review on the classification, patterns and applied research of human mobility trajectory. Prog. Geogr. 2014, 33, 938–948. [Google Scholar]
  34. Wang, H.; Yao, H.; Kifer, D.; Graif, C.; Li, Z. Non-stationary model for crime rate inference using modern urban data. IEEE Trans. Big Data 2017, 5, 180–194. [Google Scholar] [CrossRef] [PubMed]
  35. Wang, H. Urban Computing with Mobility Data: A Unified Approach. Doctoral Thesis, The Pennsylvania State University, State College, PA, USA, 2018. [Google Scholar]
  36. Baidu China. Baidu Maps Platform. Available online: http://lbsyun.baidu.com/ (accessed on 25 June 2022).
  37. Chen, Y. A tutorial on kernel density estimation and recent advances. Biostat. Epidemiol. 2017, 1, 161–187. [Google Scholar] [CrossRef]
  38. ArcMap|ArcGIS Desktop. Available online: https://desktop.arcgis.com/ (accessed on 11 May 2022).
  39. Wang, J.; Xu, C. Geodetector: Principle and prospective. Acta Geogr. Sin. 2017, 72, 116–134. [Google Scholar]
  40. Wang, J.F.; Li, X.H.; Christakos, G.; Liao, Y.L.; Zhang, T.; Gu, X.; Zheng, X.Y. Geographical detectors-based health risk assessment and its application in the neural tube defects study of the Heshun Region, China. Int. J. Geogr. Inf. Sci. 2010, 24, 107–127. [Google Scholar] [CrossRef]
  41. David, J.; Alexander, Z. Defining fitness-for-use for crowdsourced points of interest (POI). ISPRS Int. J. Geo-Inf. 2016, 5, 149. [Google Scholar] [CrossRef] [Green Version]
  42. Yu, C.; Ren, F.; Du, Q.; Zhao, Z.; Nie, K. Web map-based POI visualization for spatial decision support. Cartogr. Geogr. Inf. Sci. 2013, 40, 172–182. [Google Scholar] [CrossRef]
  43. Shrestha, A.; Luo, W. Analysis of groundwater nitrate contamination in the Central Valley: Comparison of the geodetector method, principal component analysis and geographically weighted regression. ISPRS Int. J. Geo-Inf. 2017, 6, 297. [Google Scholar] [CrossRef]
  44. Yang, W.; Xu, K.; Lian, J.; Ma, C.; Bin, L. Integrated flood vulnerability assessment approach based on TOPSIS and Shannon entropy methods. Ecol. Indic. 2018, 89, 269–280. [Google Scholar] [CrossRef]
  45. Yalçinkaya, S.; Doğan, F.; Kaleli, H.O. Investigation of waste fires and spatial Accessibility of fire stations in Izmir, Turkey. Kent Akademisi 2022, 15, 727–741. [Google Scholar] [CrossRef]
  46. Toregas, C.; Swain, R.; ReVelle, C.; Bergman, L. The location of emergency service facilities. Oper. Res. 1971, 19, 1363–1373. [Google Scholar] [CrossRef]
  47. Church, R.; ReVelle, C. The maximal covering location problem. In Papers of the Regional Science Association; Springer: Berlin/Heidelberg, Germany, 1974; Volume 32, pp. 101–118. [Google Scholar]
  48. ESRI. Location-Allocation Analysis—ArcMap|Documentation. ESRI. 2022. Available online: https://desktop.arcgis.com/en/arcmap/latest/extensions/network-analyst/location-allocation.htm (accessed on 29 November 2022).
  49. Ministry of Housing and Urban-Rural Development of the People’s Republic of China (MOHURD); Ministry of Public Security of the People’s Republic of China (MPS). Code for Planning of Urban Fire Control GB 51080-2015; China Architecture & Building Press: Beijing, China, 2015; Available online: https://www.nssi.org.cn/nssi/front/87662586.html (accessed on 7 February 2023).
  50. Adesina, E.A.; Odumosu, J.O.; Zitta, N.; Ajayi, O.G.; Kuta, A.A.; Adamu, G.M. Location-Allocation Analysis of Public Health Site Selection Using P-Centre Model: A Case Study of Chanchaga Local Government Area, Minna, Niger State. In School of Environmental Technology Conference, SETIC. 2016. Available online: http://repository.futminna.edu.ng:8080/jspui/handle/123456789/10320 (accessed on 7 February 2023).
  51. Cooper, C.H.; Chiaradia, A.J. sDNA: 3-d spatial network analysis for GIS, CAD, Command Line & Python. Softwarex 2020, 12, 100525. [Google Scholar] [CrossRef]
  52. Cooper, C. Spatial Design Network Analysis (sDNA) Version 3.4 Manual; Cardiff University: Cardiff, UK, 2016. [Google Scholar]
  53. Ministry of Public Security of the People’s Republic of China. Construction Standards for Urban Fire Stations; China Planning Press: Beijing, China, 2017; Available online: https://kns.cnki.net/kcms/detail/detail.aspx?FileName=SCHF202112530&DbName=SCHF (accessed on 7 February 2023).
  54. Gu, H.; Shen, T.; Zhou, L.; Chen, H.; Xiao, F. Measuring Street layout’s spatio-temporal effects on housing price based on GWR and sDNA model: The case study of Guangzhou. Econ. Geogr. 2018, 38, 82–91. [Google Scholar]
  55. Khatakho, R.; Gautam, D.; Aryal, K.R.; Pandey, V.P.; Rupakhety, R.; Lamichhane, S.; Liu, Y.C.; Abdouli, K.; Talchabhadel, R.; Thapa, B.R.; et al. Multi-hazard risk assessment of Kathmandu Valley, Nepal. Sustainability 2021, 13, 5369. [Google Scholar] [CrossRef]
  56. Adewuyi, G.K. Assessment of fire service station response to filling stations fire outbreak and vulnerable healthcare centers to filling stations in urban settlement. Int. J. Res. Rev. 2020, 7, 10–30. [Google Scholar]
  57. National Fire Protection Association. NFPA 1710, Standard for the Organization and Deployment of Fire Suppression Operations, Emergency Medical Operations, and Special Operations to the Public by Career Fire Departments; National Fire Protection Association: Quincy, MA, USA, 2010. [Google Scholar]
  58. Li, X.; Li, M.; Cui, K.; Lu, T.; Xie, Y.; Liu, D. Evaluation of comprehensive emergency capacity to urban flood disaster: An example from Zhengzhou City in Henan Province, China. Sustainability 2022, 14, 13710. [Google Scholar] [CrossRef]
  59. Duan, C.; Zhang, J.; Chen, Y.; Lang, Q.; Zhang, Y.; Wu, C.; Zhang, Z. Comprehensive risk assessment of urban waterlogging disaster based on MCDA-GIS integration: The case study of Changchun, China. Remote Sens. 2022, 14, 3101. [Google Scholar] [CrossRef]
Figure 1. Selected area for case study (yellow zone) [28].
Fire 06 00064 g001
Figure 2. Framework used for the spatial extension of a selected point for locating a fire station.
Fire 06 00064 g002
Figure 3. Kernel density distribution maps (natural breakpoint classification).
Fire 06 00064 g003
Figure 4. Kernel density distribution maps (natural breakpoint classification).
Fire 06 00064 g004
Figure 5. Map of potential fire station locations using (a) fire weighting data and (b) emergency service weighting data.
Fire 06 00064 g005
Figure 6. Map of closeness within a search radius of 1870 m from low (cool colors; blue-violet) to high (warm colors; orange-dark red); high values of closeness indicate that the link has good accessibility.
Fire 06 00064 g006
Figure 7. Map showing extension of the location of a fire station from a specific site to a region using the weighting of emergency service data (purple shaded areas are the optimum areas for new fire stations; the closer a new fire station is to a selected location, the better).
Fire 06 00064 g007
Table 1. The q value and weights of points of interest (POI) and visitor throughput for fire suppression and emergency services.
POIVisitor Throughput
qFire suppression0.70 ***0.76 ***
Emergency services0.88 ***0.60 ***
WeightingFire suppression0.480.52
Emergency services0.590.41
*** represents p < 0.001.
Table 2. The q value and weights (q′) of four types of POI for total POI.
Public ServicesOfficesShopsResidences
qPOI0.55 ***0.80 ***0.28 ***0.80 ***
q′0.230.330.110.33
*** represents p < 0.001.
Table 3. The q″ value and weights of four types of POI and visitor throughput for fire suppression and emergency services.
Public ServicesOfficesShopsResidencesVisitor Throughput
q″Fire suppression0.160.230.080.230.76
Emergency services0.200.290.100.290.60
WeightingFire suppression0.110.160.050.160.52
Emergency services0.130.200.070.200.41
Table 4. Correspondence between risk overlay values and risk areas.
Risk Overlay ValueRisk LevelSpatial Distribution %
0.2110–0.2330High risk11.06
0.1887–0.2109Medium-high risk16.82
0.1720–0.1886Medium risk27.65
0.1577–0.1719Medium-low risk26.96
0.1430–0.1576Low risk17.51
Disclaimer/Publisher’s Note: The statements, opinions and data contained in all publications are solely those of the individual author(s) and contributor(s) and not of MDPI and/or the editor(s). MDPI and/or the editor(s) disclaim responsibility for any injury to people or property resulting from any ideas, methods, instructions or products referred to in the content.

