Article

Estimating the Suppression Performance of an Electronically Controlled Residential Water Mist System from BS 8458:2015 Fire Test Data

1
Ashton Fire, This Is the Space, 68 Quay Street, Manchester M3 3EJ, UK
2
OFR Consultants, Sevendale House, Lever Street, Manchester M1 1JA, UK
3
Plumis, Unit 4, Phoenix Trading Estate, Bilton Road, London UB5 7DZ, UK
*
Author to whom correspondence should be addressed.
Fire 2022, 5(5), 144; https://doi.org/10.3390/fire5050144
Submission received: 26 August 2022 / Revised: 14 September 2022 / Accepted: 16 September 2022 / Published: 21 September 2022

Abstract

:
It is commonly assumed in fire modelling that suppression systems can control the heat release rate of a fire. However, many performance-based assumptions are derived from experimental data for sprinklers, and uncertainty remains for their application to water mist systems. In the UK, residential water mist systems are usually tested to the BS 8458:2015 standard, but the heat release rate in these tests is not quantified and focus is instead placed on thermocouple temperatures. This paper details a series of fire tests to the BS 8458:2015 standard for an electronically controlled water mist system. The paper also includes B-RISK zone modelling of these tests to estimate the suppression performance of the system, comparing model outputs to thermocouple test data. Three traditional suppression assumptions, historically derived from experimental data for sprinklers, have been adopted in the zone modelling to examine whether their application following system activation can be extended to the tested water mist system. The work indicates that applying these suppression assumptions remains reasonable in the context of the performance of the tested water mist system, noting the constraints of the test methods in representing a limited number of fire scenarios.

1. Introduction

1.1. Background

In most cases, water is used as the main suppression agent for buildings due to its relative abundance and lack of cost [1], as well as its useful fire extinguishing characteristics such as high specific heat and high latent heat of vaporisation [2]. In the fire safety design of residential buildings, there are different methods used to introduce water droplets into a fire-affected enclosure, with sprinkler systems representing the most commonly employed approach. Water sprays from sprinkler systems suppress a fire by directly wetting and cooling the combusting surface (and any surrounding surfaces), cooling the air by vaporisation (energy absorption) and diluting the air with water vapour. An alternative and more recently developed form of fire suppression system is a water mist system, described by Mawhinney and Back [3] as a system that discharge fine water sprays with droplets no larger than 1 mm (1000 µm). Water mist nozzles therefore produce sprays that have a higher fraction of very fine droplets when compared to a standard sprinkler spray. In contrast to sprinklers, water mist generally relies on the cooling and dilution mechanisms with less support from surface wetting [4].
Typically in a fire engineering assessment it is assumed that suppression systems can control, or reduce, the growth and spread of a fire in some fashion, albeit with differing methods and assumptions being adopted by practitioners. PD 7974-1:2019 [5] suggests suppression systems introduce cooling effects into the enclosure, reducing the severity of a fire. It goes on to acknowledge that this effect is difficult to quantify, but it is “often assumed that the heat release rate [HRR] of the fire remains fixed at the point at which the system is first activated”. This is commonly referred to in industry as a ‘sprinkler-capped’ or ‘sprinkler-controlled’ fire [6], in which the HRR is fixed (‘capped’) to an appropriate steady-state HRR value to represent the control effect of the suppression system, with an example presented in Figure 1 for an idealised αt2 fire growth HRR.
For a design fire impacted by sprinkler suppression, Nystedt [7] suggests that the following correlation can be used: (a) at the time of sprinkler activation, the HRR remains constant for 60 s; (b) following this, the fire decays to 1/3 of its maximum HRR (at the time of sprinkler activation) linearly over a 60 s period; and (c) for the remaining time, the HRR remains constant at 1/3 of the maximum HRR. An example of this is presented in Figure 1. Nystedt suggests that this can be applied for deterministic fire modelling where the maximum HRR is less than 5000 kW, but that “the heat release rate should remain constant at the time of sprinkler activation” for fires which are larger than 5000 kW.
Alternatively, Evans [8] proposed a means of quantifying the impact of sprinkler suppression on the HRR of an unshielded fire using the following exponential decay correlation:
Q ˙ t t act = Q ˙ t act × exp t t act 3 w ˙ 1.85
where Q ˙ t act is the HRR (kW) at the time of system activation ( t act , s), Q ˙ t t act is the decaying HRR following system activation, and w ˙ is the water spray density of the sprinkler (mm/s). The relationship was estimated from wood crib fire experiments for commercial sprinklers. An example of the exponential decay curve is presented on Figure 1, assuming a spray density of 0.07 mm/s (4.2 mm/min), where Evans notes “most of the data analyzed in this study were from experiments in which the sprinkler spray density was greater than 0.07 mm/s” [8]. Evans suggests the correlation provides a “conservative bound” for the minimum expected reduction in the HRR from the suppression of sprinklers, but it does not account for potential variations in the water spray density. Also shown in Figure 1 is a decay curve for a much lower spray density of 0.01 mm/s (0.6 mm/min), which is broadly representative of the local discharge density achieved by the electronically controlled watermist system analysed in this paper. The system is introduced later in Section 1.4.
It is not immediately clear whether these common methods of estimating the impact of sprinklers on the HRR can be applied to alternative suppression methods like water mist, particularly as alternative systems can rely on different physical mechanisms to aid in controlling a fire. To explore this point further, the next section includes a brief review of international standards and experimental literature available on the suppression performance of water mist, with a primary focus on residential design.

1.2. Literature Review

In their review of water mist systems, Liu and Kim [9] indicated that “due to the complex extinguishing processes, the relationship between a fire scenario and the characteristics of a water mist system is not well enough understood to apply a ‘first principles’ approach”. Liu and Kim concluded that a combination of experiments and computational modelling studies are needed to support the development of water mist systems. However, performance-based design documents often provide limited information on the representation of water mist systems. For example, PD 7974-1:2019 [5] is intended to provide practicing engineers in the UK with fire safety guidance on the initiation and development of fire within an enclosure, but it makes no direct reference to water mist.
With particular reference to the effect of water discharge on the HRR, the New Zealand C/VM2 verification method [10] suggests that, for sprinklered buildings, “the fire is expected to be controlled (i.e., with a constant HRR) after the sprinkler activates…”, which aligns with the concept of a sprinkler-controlled fire. However, C/VM2 makes no reference to water mist in its recommendations. VDI 6019-1 [11] details recommendations for determining HRR curves for use in smoke control calculations and, as with C/VM2, it proposes that the HRR and area of a fire can assumed to be constant from the time of activation onwards for a sprinkler system. The Swedish general recommendations on the analytical design of a building’s fire protection, BBRAD [12], proposes that the effects of an automatic fire suppression system can be applied using a method consistent with that described by Nystedt [7], but only makes reference to sprinkler systems when detailing the calculation method. NFPA 92 [13] provides design fire properties to be adopted in smoke management calculation procedures, suggesting that the HRR is permitted to reach a steady HRR based on fire test data or “engineering analysis of fire growth and sprinkler response” and the HRR is permitted to decay based on “analysis of the effect of sprinkler protection on the fuel at the prevailing ceiling height”, again omitting consideration of water mist. In the absence of this information, NFPA 92 does suggest that the HRR curve can be based on “fire test data”, and hence practitioners may gain insight from experimental data available in technical reports and research articles.
Arvidson [14] carried out fire experiments for five different low- and high-pressure commercial water mist systems in a representative residential enclosure, with a nominal water flow range ranging from 8.2 to 36.7 L/min. A series of upholstered chairs were burned within a 3.66 m by 3.66 m by 2.5 m tall enclosure. In initial free burn experiments of the chairs, the HRR was shown to follow a trend between a medium and fast αt2 fire growth rate, reaching a maximum HRR in the region of 400 to 500 kW. However, it appears that the HRR was not measured or estimated during the experiments where the suppression systems were incorporated (i.e., it was only determined in the free burns), and results instead focused on temperatures and carbon monoxide (CO) concentrations. In all instances, the systems were shown to substantially reduce temperatures when compared to those observed in the free burn experiments and, by visual inspection of the graphs presented by Arvidson, the commercial water mist systems generally resulted in similar or lower temperatures than the residential sprinkler systems. In previous residential sprinkler and water mist system experiments carried out by Arvidson and Larsson [15] in 2001 for living room fires, it was observed that a “larger amount of fresh air was drawn to the fire” for a water mist system, increasing the turbulence in the fire plume compared to sprinklers, although temperatures within the enclosure typically reduced once the system activated.
Also related to residential fires, Chow [16] suggested that water mist suppression can be used to target and suppress small fires at an early stage, such as for open kitchen fires in residential buildings. In relation to this topic, Qin et al. [17] undertook experimental studies on suppressing cooking oil fires in kitchens with water mist operation at three different operating pressures (0.2, 0.4, and 0.6 MPa, ranging from larger to finer droplets). They observed that the HRR increased rapidly after discharging the water mist. The increase in the HRR was partly attributed to water droplets colliding with the fuel surface, causing an increase in the fuel surface area. The rate of increase was shown to be inversely proportional to the operating pressure, i.e., larger droplets at a lower pressure produced a greater increase in the HRR. However, in all instances, the HRR quickly decayed following a short peak upon system activation.
There has been some work carried out to model the effect of water mist discharge using zone models, for example that of Vaari [18], and also Li and Chow [19]. The one-zone model developed by Wighus and Brandt [20] included mechanisms of heat transfer to the water spray, and the effect of the oxygen concentration in the enclosure on the HRR of the fire. The model predicts a gradual decrease in HRR as the oxygen concentration limits combustion and this results in a corresponding decrease in the average gas temperature. The decrease in HRR is similar in form to that of the Evans [8] model.
It can be seen from the above discussion that the recommended practices and correlations for suppression performance are largely derived from experimental observations for sprinkler performance and are not necessarily intended for alternative forms of suppression or, at least, it is not explicitly stated whether they can be applied to other systems. Similarly, there appears to be a limited amount of experimental research around the impact of water mist systems on the HRR of a fire when compared to sprinkler systems, particularly for residential building applications, although the research that is available does appear to indicate the effectiveness of these systems in reducing either the HRR of the fire or the gas temperatures of the affected enclosure. Uncertainty therefore remains on whether the fire suppression assumptions commonly applied to sprinklers are transferrable when assessing the performance of water mist systems. This uncertainty becomes even stronger when such systems are more conceptually ‘novel’ and do not necessarily operate in a similar manner to conventional systems, either in their activation methods, nozzle arrangements, and how they introduce water droplets into the fire affected enclosure [21].

1.3. Research Overview and Purpose

As a means of standardising the performance of residential water mist systems for a representative fire hazard, BS 8458:2015 provides a recommended series of fire tests (Annex C). It suggests that these tests are “an important method of demonstrating that the water spray pattern and smaller droplet sizes produced by each specific system are capable of suppressing the test fires and reducing temperatures in the fire test room”. The suppression performance of these tests with respect to the HRR is not quantified, and instead the tests focus on thermocouple temperatures. The thermocouple data provides valuable insight into the capability of the system to control and suppress a fire and can be supported by other observations like the post-test evaluation of fire damage. However, the tests alone do not necessarily provide direct evidence to support the application of the historical sprinkler correlations to alternative forms of suppression, where this can be a point of contention among fire safety practitioners.
To explore the above problem, this paper details a series of BS 8458:2015 fire tests which were undertaken for an electronically controlled water mist system. The fire modelling tool B-RISK [22] has then been used to represent a simplified form of the tests computationally. The aim of the modelling exercise is to attempt to quantify the suppression performance of the water mist system on the HRR of the fire. As the BS 8458:2015 fire tests do not include measurements of the HRR, the outcomes for temperature estimated in the modelling are compared to the thermocouple test data for the different HRR suppression assumptions introduced in Section 1.1. Ultimately, the intent is to provide initial suppression correlations/assumptions for the electronically controlled water mist system which can be built upon in future research. However, in undertaking this exercise, it is acknowledged that the BS 8458:2015 tests only represent a small range of fire scenarios and there will be inherent limitations to their scope of application, and further testing and experimentation is likely needed.
The research in this paper part of ongoing work to explore how electronically controlled water mist systems perform, and how the performance of these systems can be represented in simple fire calculations and models. A separate article [21] has been produced which discusses how the activation time of the system might be replicated using effective values for the response time index (RTI) and conductivity factor (C factor) for an equivalent sprinkler system. Further preliminary work has been undertaken to consider the reliability of the electronically controlled water mist system and how it performs in comparison to conventional sprinklers.

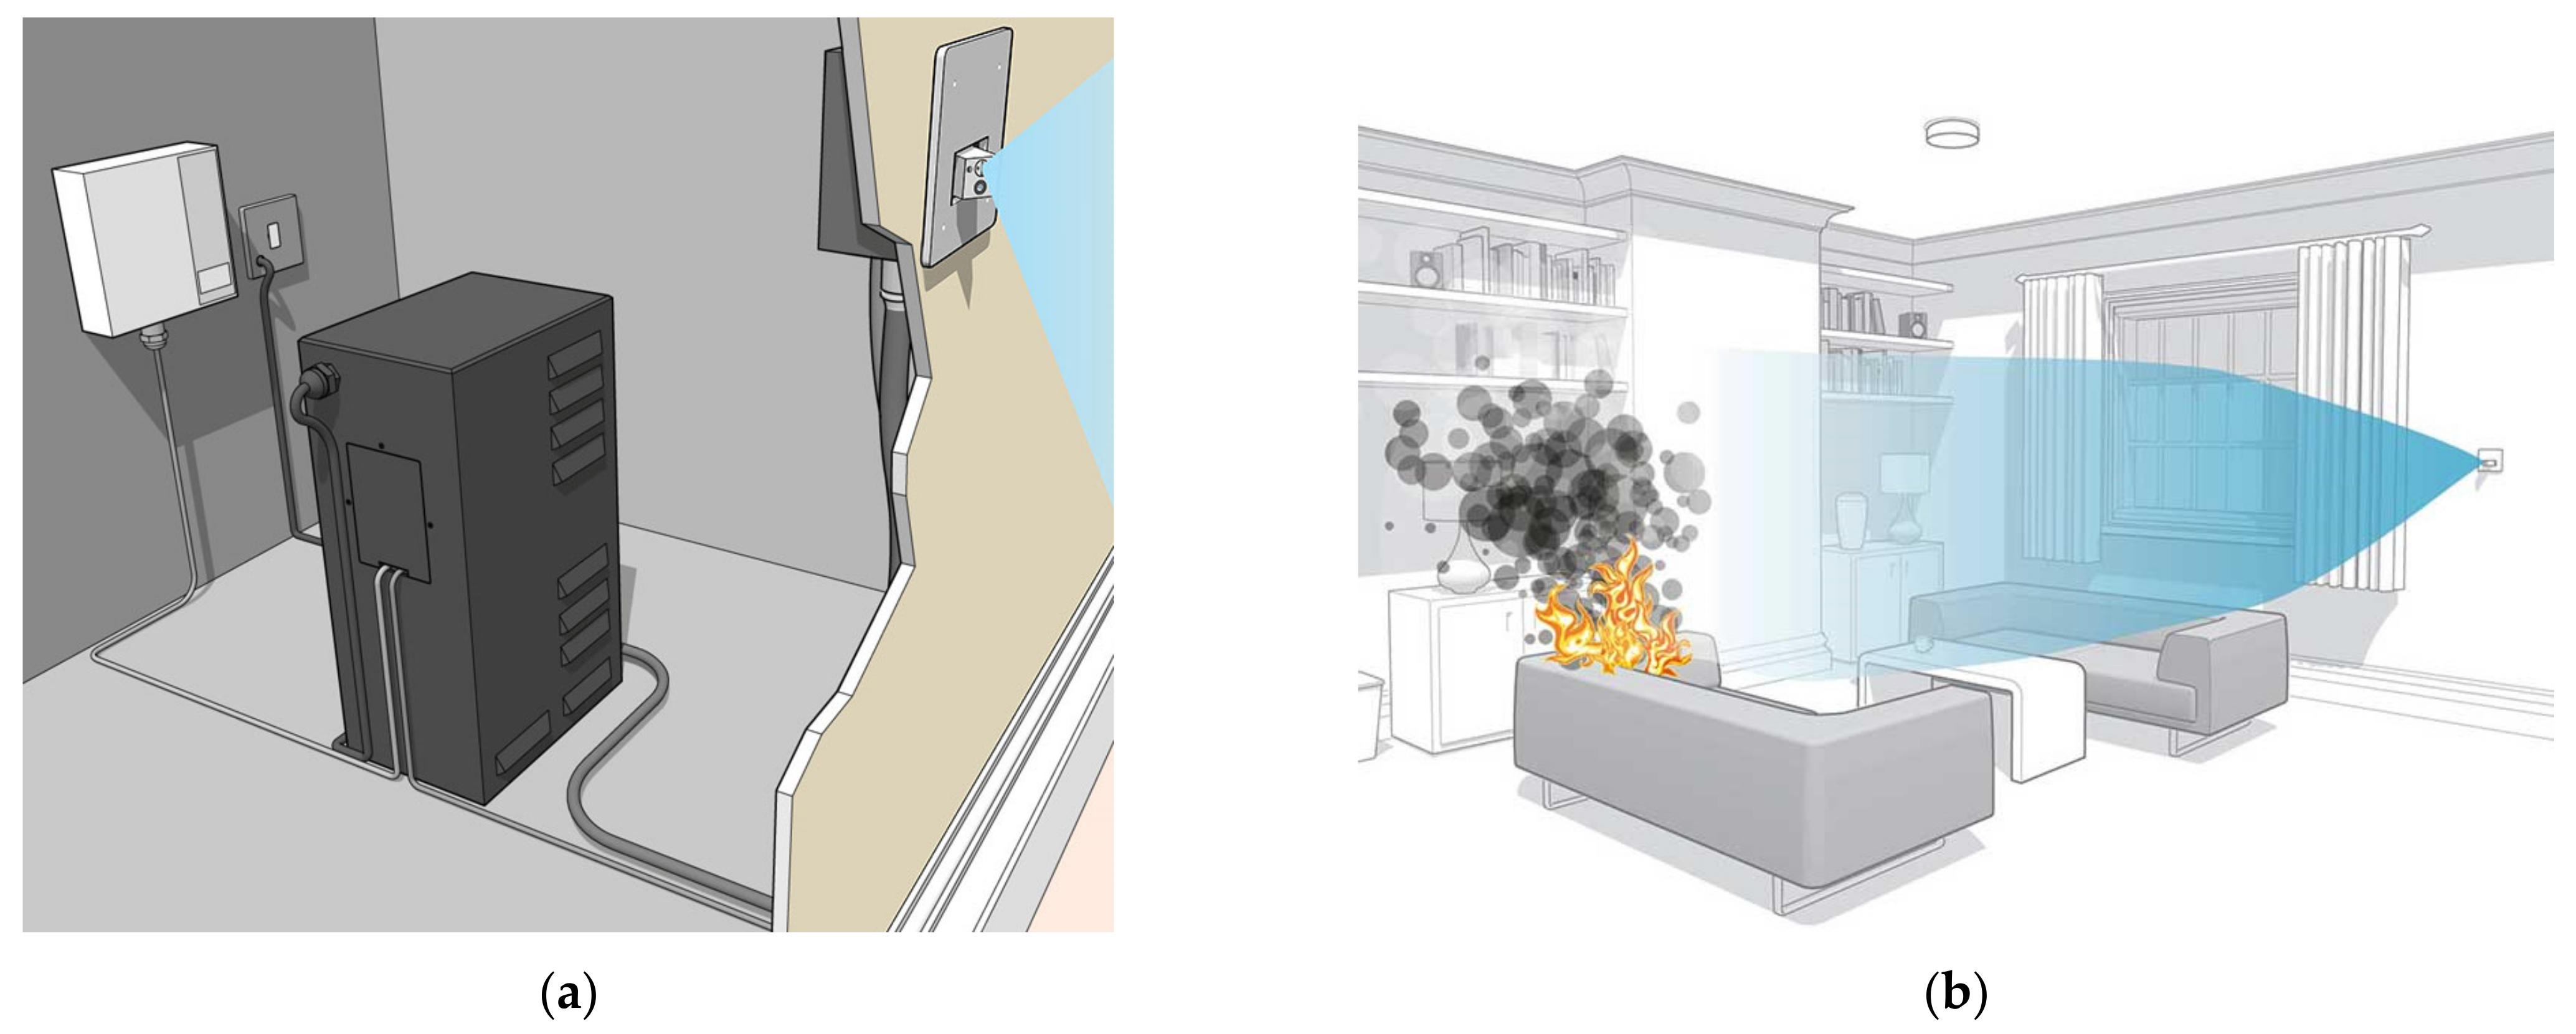
1.4. An Electronically Controlled Water Mist System

The electronically controlled water mist system used in the tests, and detailed in this paper, is designed for residential applications. The system does not operate in the same way as traditional water mist systems but instead is initiated by a wireless combined smoke and heat detector. Once initiated, the system uses an infrared (IR) thermopile sensor embedded within the nozzle head(s) to scan the room for a fire. The IR sensor measures temperature as a function of IR radiation, assessing for high temperature readings or differential increases in temperature between scans. Once the rate of change in temperature exceeds a given threshold, the head is considered to have successfully located a fire and discharges water droplets in its direction. The water is discharged by the activation of a high-pressure pump (Figure 2a), which drives mains-linked water through the nozzle unit (Figure 2b). The spray nozzles for the system are wall-mounted and positioned around light switch height, e.g., 1.45 m from floor level. The nozzle achieves a water rate discharge of around 5.6 L/min with water droplets less than 100 µm in size. Typically only a single nozzle activates within the enclosure and directs its spray towards the fire, rather than spray being distributed throughout the enclosure. As a result, the system does not necessarily achieve a fixed design discharge density (commonly expressed in mm/s or mm/min). Previous studies carried out on the system using pans to collect the water spray have shown that the discharge density varies across the affected area depending on the nozzle location within the enclosure and its discharge direction. The local discharge density can reach up to 0.015 mm/s, with a modal value in the region of 0.01 mm/s. For a given fire incident, the local discharge density will also be influenced by the location of the fire relative to the nozzle head and the interaction of the spray with the fire plume.
For the tests presented in this paper, the system used was the Automist Smartscan Hydra, and the detector was an Apollo 51000 multi-criteria optical smoke and heat wireless system. A more detailed description of the system and its design motivations can be found in Spearpoint et al. [21], with further component information available from the system supplier [23,24] as well as in the design, installation, operation, and maintenance manual [25].

2. BS 8458:2015 Fire Tests

2.1. BS 8458:2015 Annex C

The electronically controlled water mist system was independently tested to Annex C of the British Standard BS 8458:2015 [26]. Annex C of BS 8458:2015 details test procedures of fire tests for water mist systems with automatic nozzles, where the test is deemed a pass should the criteria listed in Table 1 be met. The subsequent sections summarise the various elements of the test procedures.

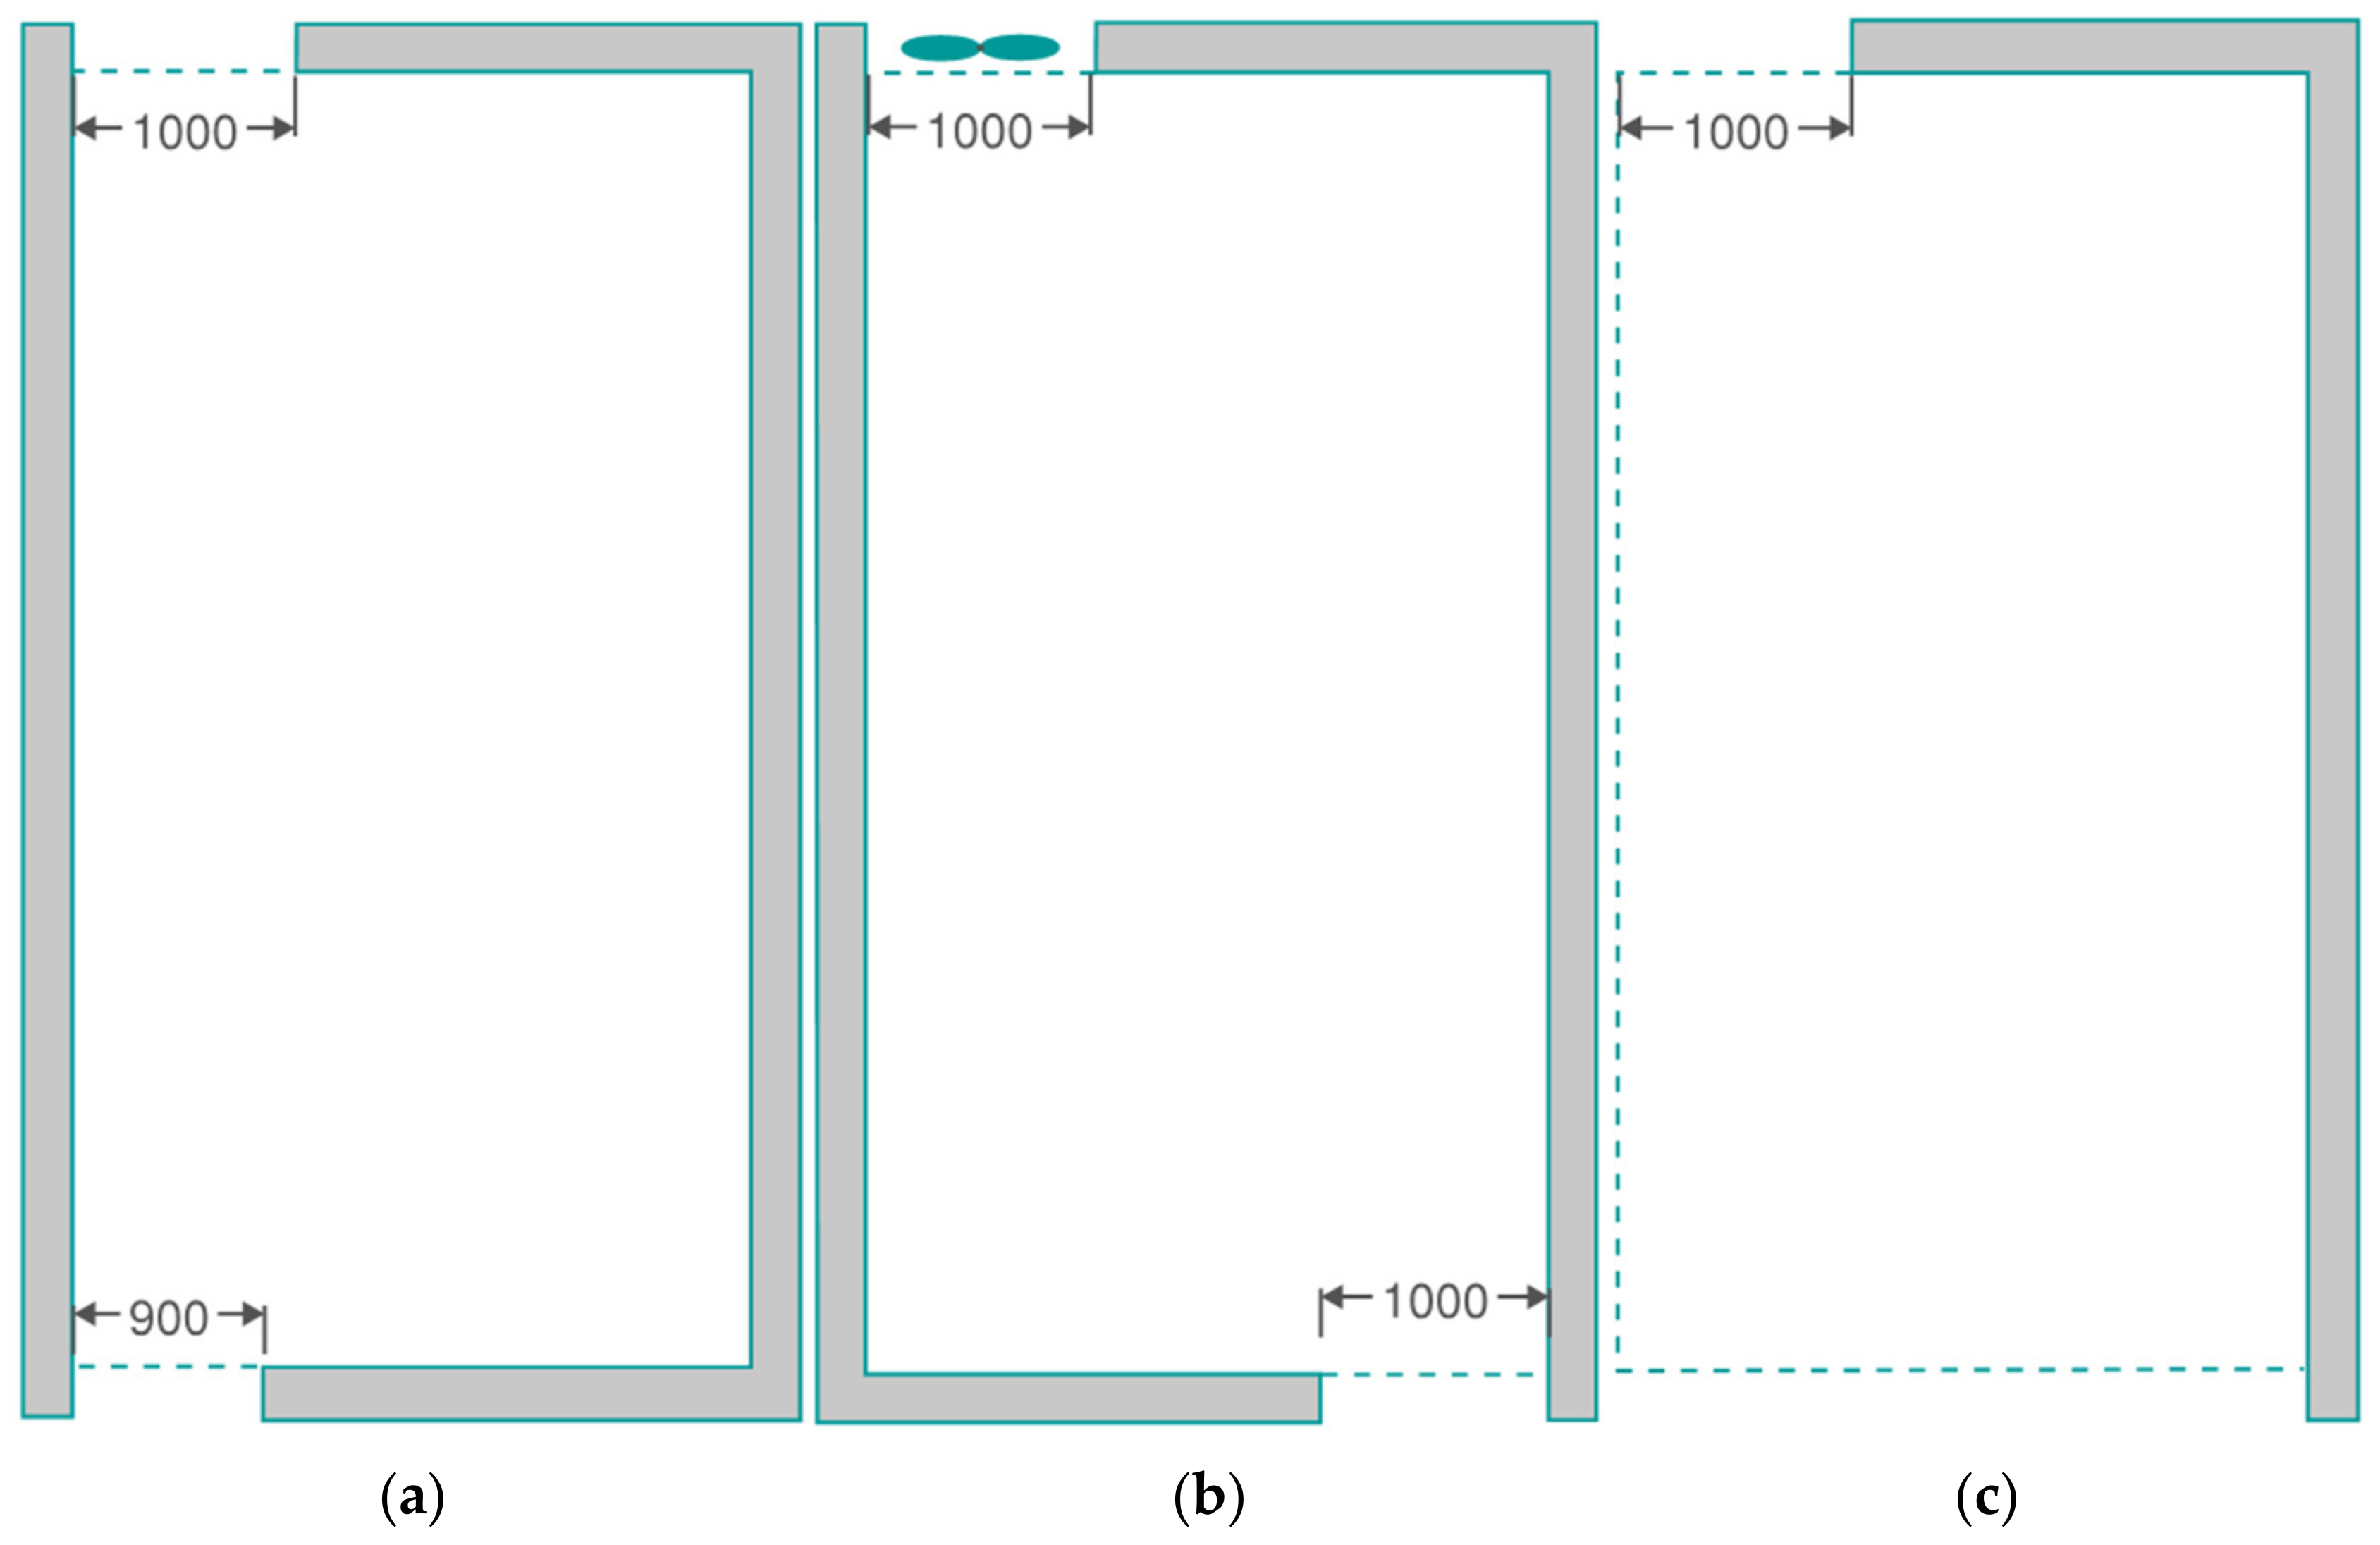
2.2. Enclosure Arrangements

The BS 5458:2015 enclosure is specified as 8 m long by 4 m wide by 2.5 m high. For the test room used in this work the enclosure ceiling and walls were covered by 12.5 mm thick Type F fire-rated plasterboard. The BS 5458:2015 tests cover three physical enclosure arrangement, either incorporating a four-walled enclosure or only two walls. There are two four-walled arrangements, dependent on whether the test incorporates a mechanical fan or not. Each arrangement incorporates full height (2.5 m) openings, as detailed in Figure 3.
For the four-walled arrangement incorporating a fan, BS 5458:2015 specifies a ventilation test be undertaken, i.e., at least one test be repeated with the ambient air achieving a minimum velocity of 1 m/s. This velocity is measured inside the room 1 m above floor level and at a horizontal distance of 1 m from the fan. The fan is 500 mm in diameter and positioned 1 m above floor level, with airflow directed parallel to the floor. For these tests, the fan supplied (‘pushed’) air into the enclosure, rather than extracting from the enclosure. BS 5458:2015 notes that the purpose of this fan is to provide “an assessment of the effect of air flows on the watermist droplets”.

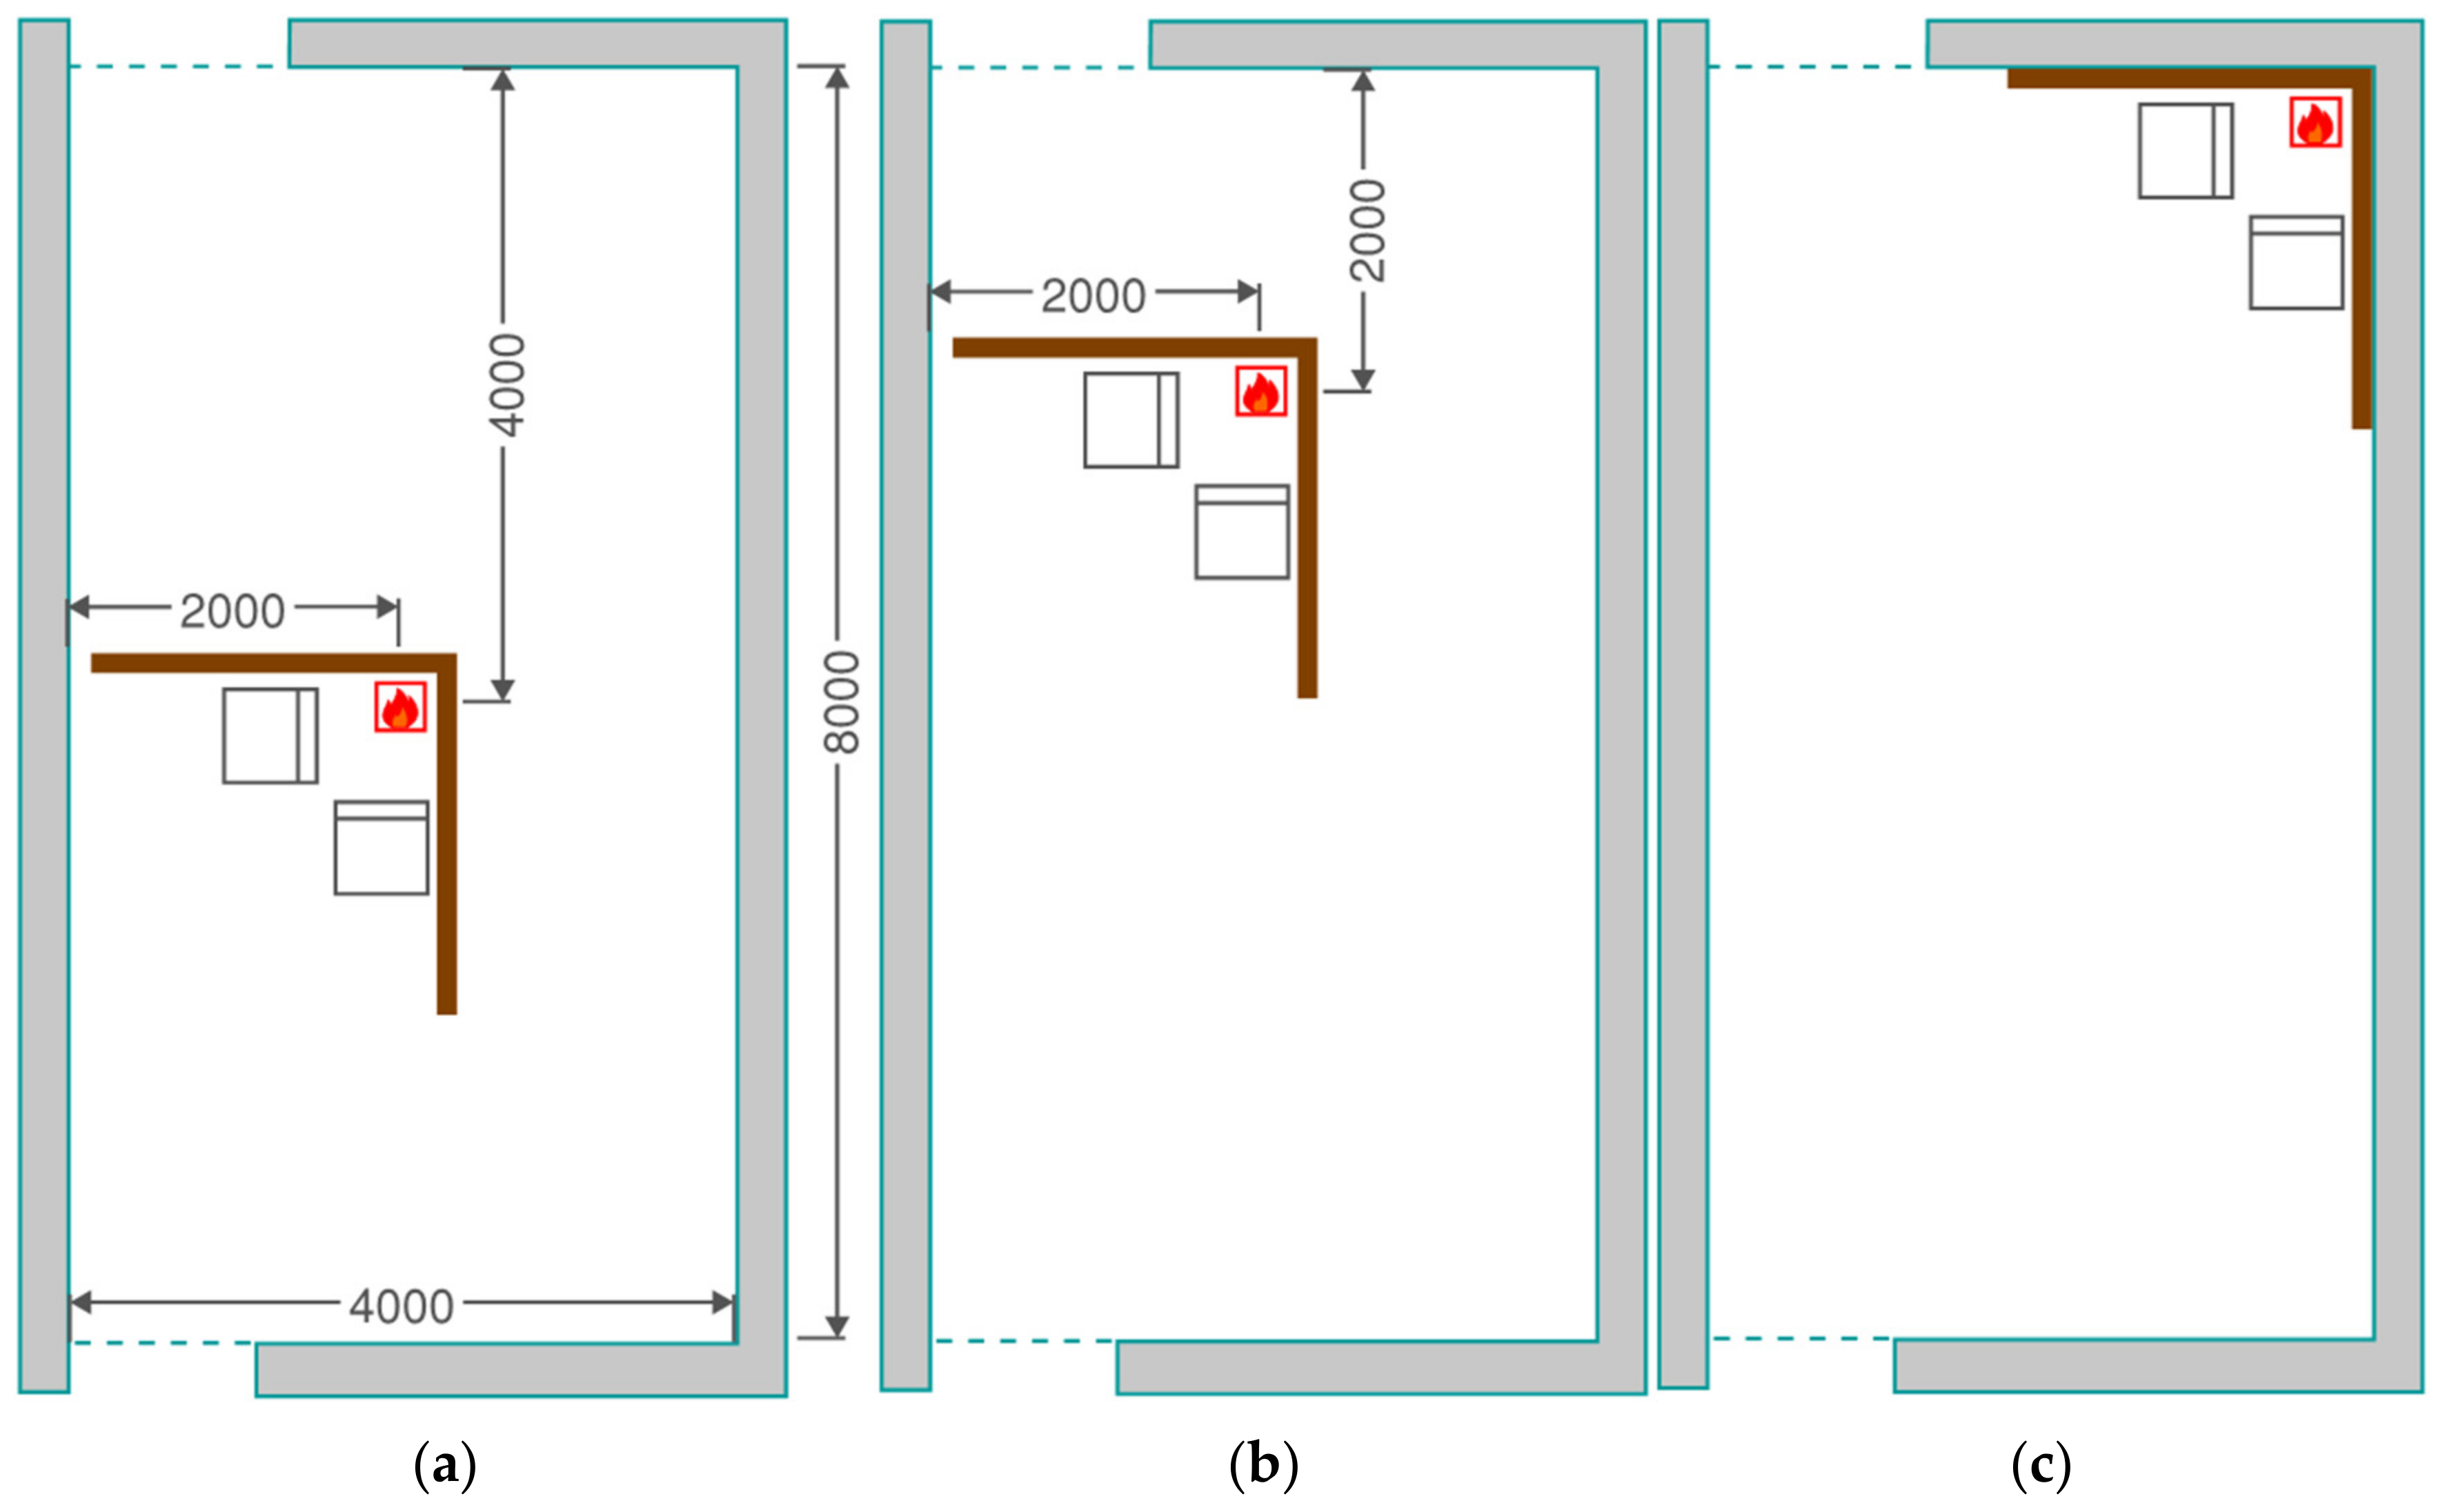
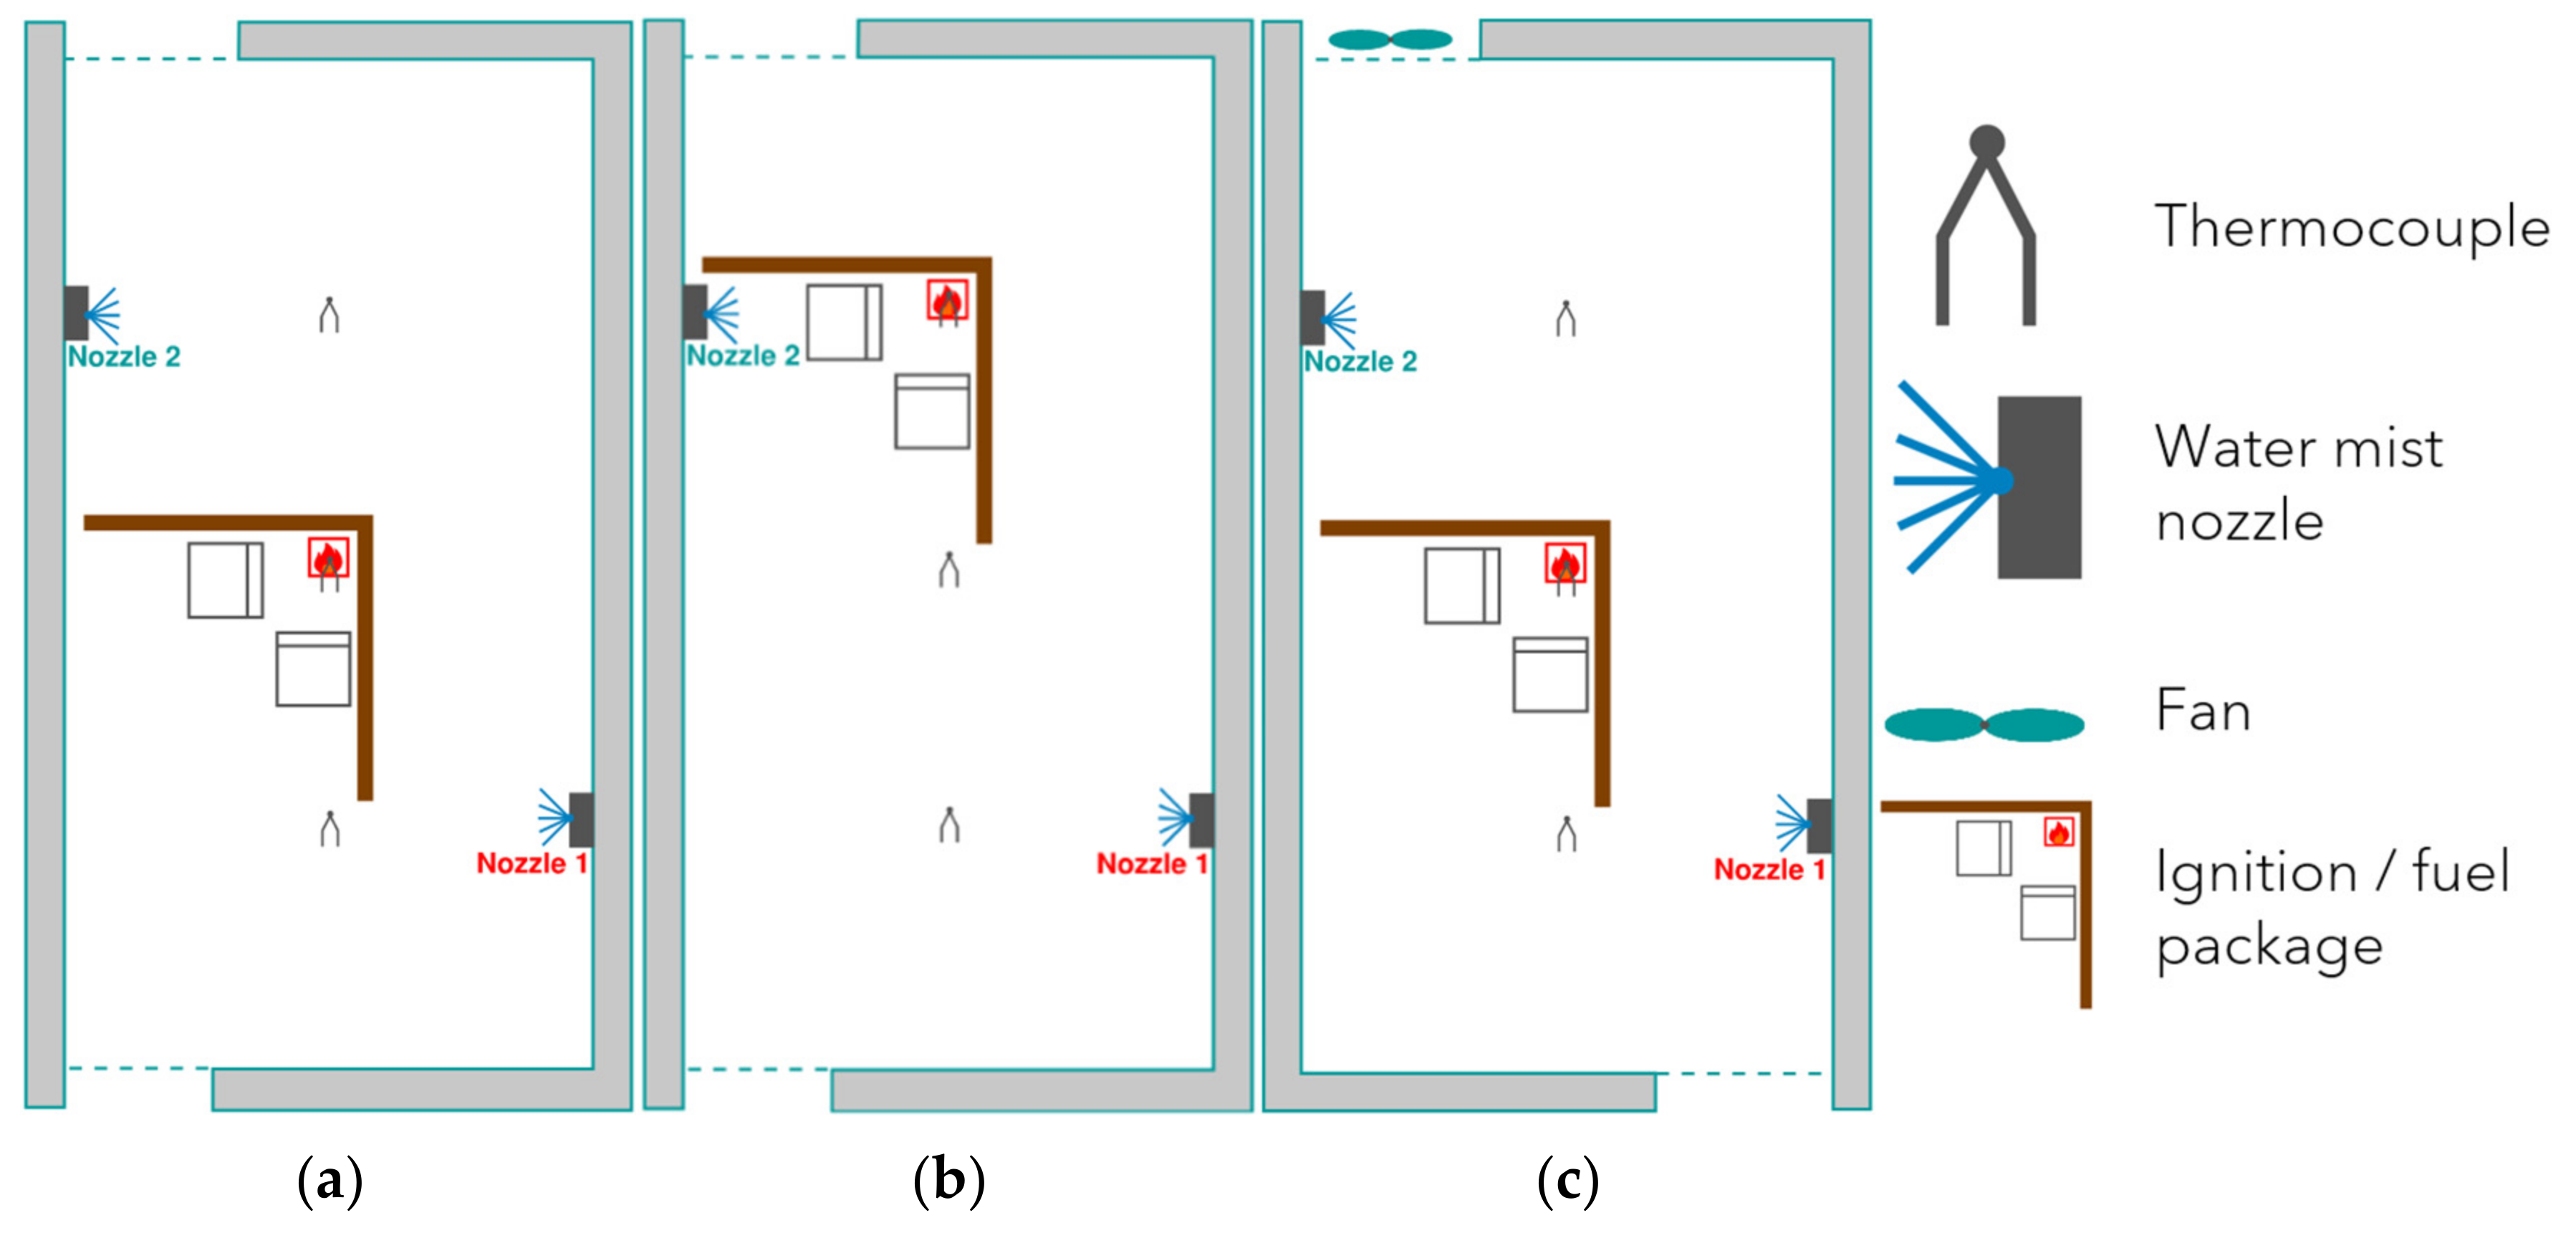
2.3. Fire Locations and Fuel Package

Depending on the test, the fire was placed in three different locations, as indicated in Figure 4. For each of the tests, a fuel package was adopted which comprises an ‘ignition package’ and a ‘fuel package’.
The ignition package is a combination of: a 300 mm wide by 300 mm long by 100 mm high steel tray containing heptane; and a wood crib, with eight layers of wood sticks (collectively 305 mm in each direction), positioned on top of this tray. The fuel package comprises two sheets of polyether foam, 865 mm long by 775 mm wide by 75 mm thick, glued to a sacrificial backing board of the same width and length (with a 12 mm depth). This backing board is then attached to a supporting wooden frame. Two cotton wicks, soaked in heptane, are placed on a fire brick, with 150 mm laid along the edge of the foam sheets below. In addition to the ignition and fuel packages, the test arrangement incorporates 12 mm thick plywood panels, either 2.2 m or 2.4 m in length, and covering a height of either 1.2 m or 2.5 m, depending on the fire location. A more detailed description of the fuel package can be found in BS 8458:2015 [26] and Spearpoint et al. [21].

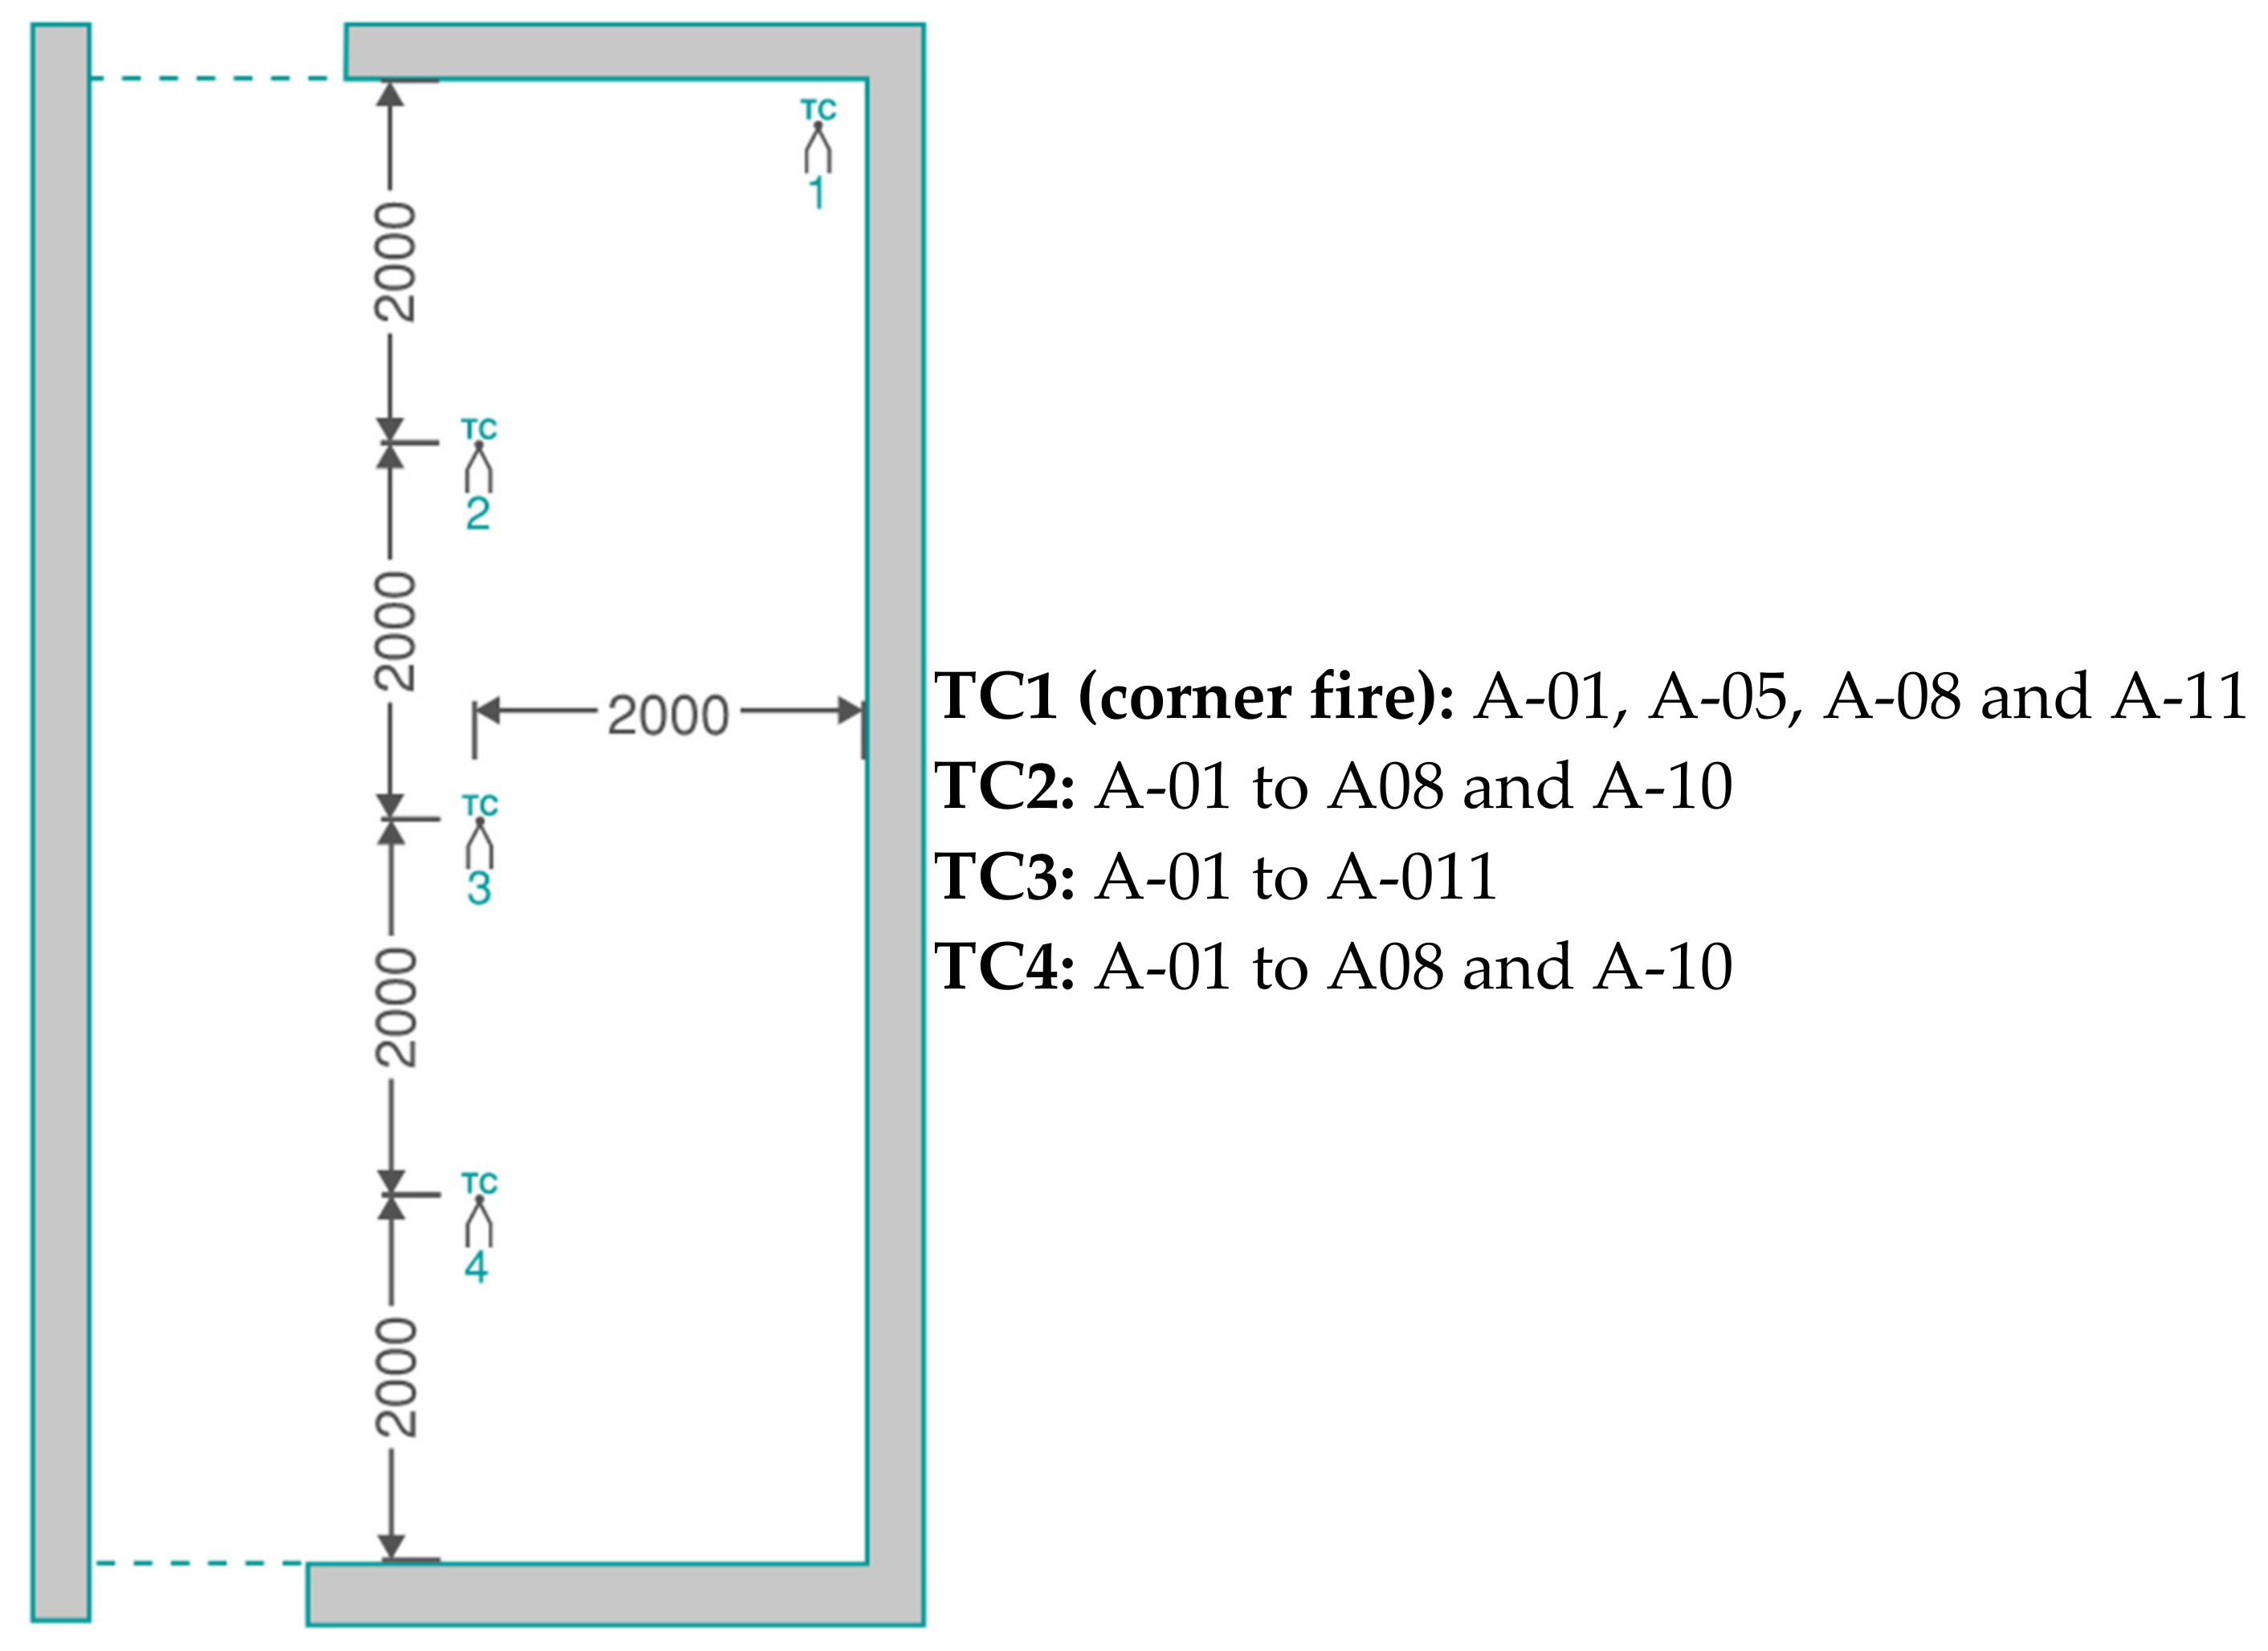
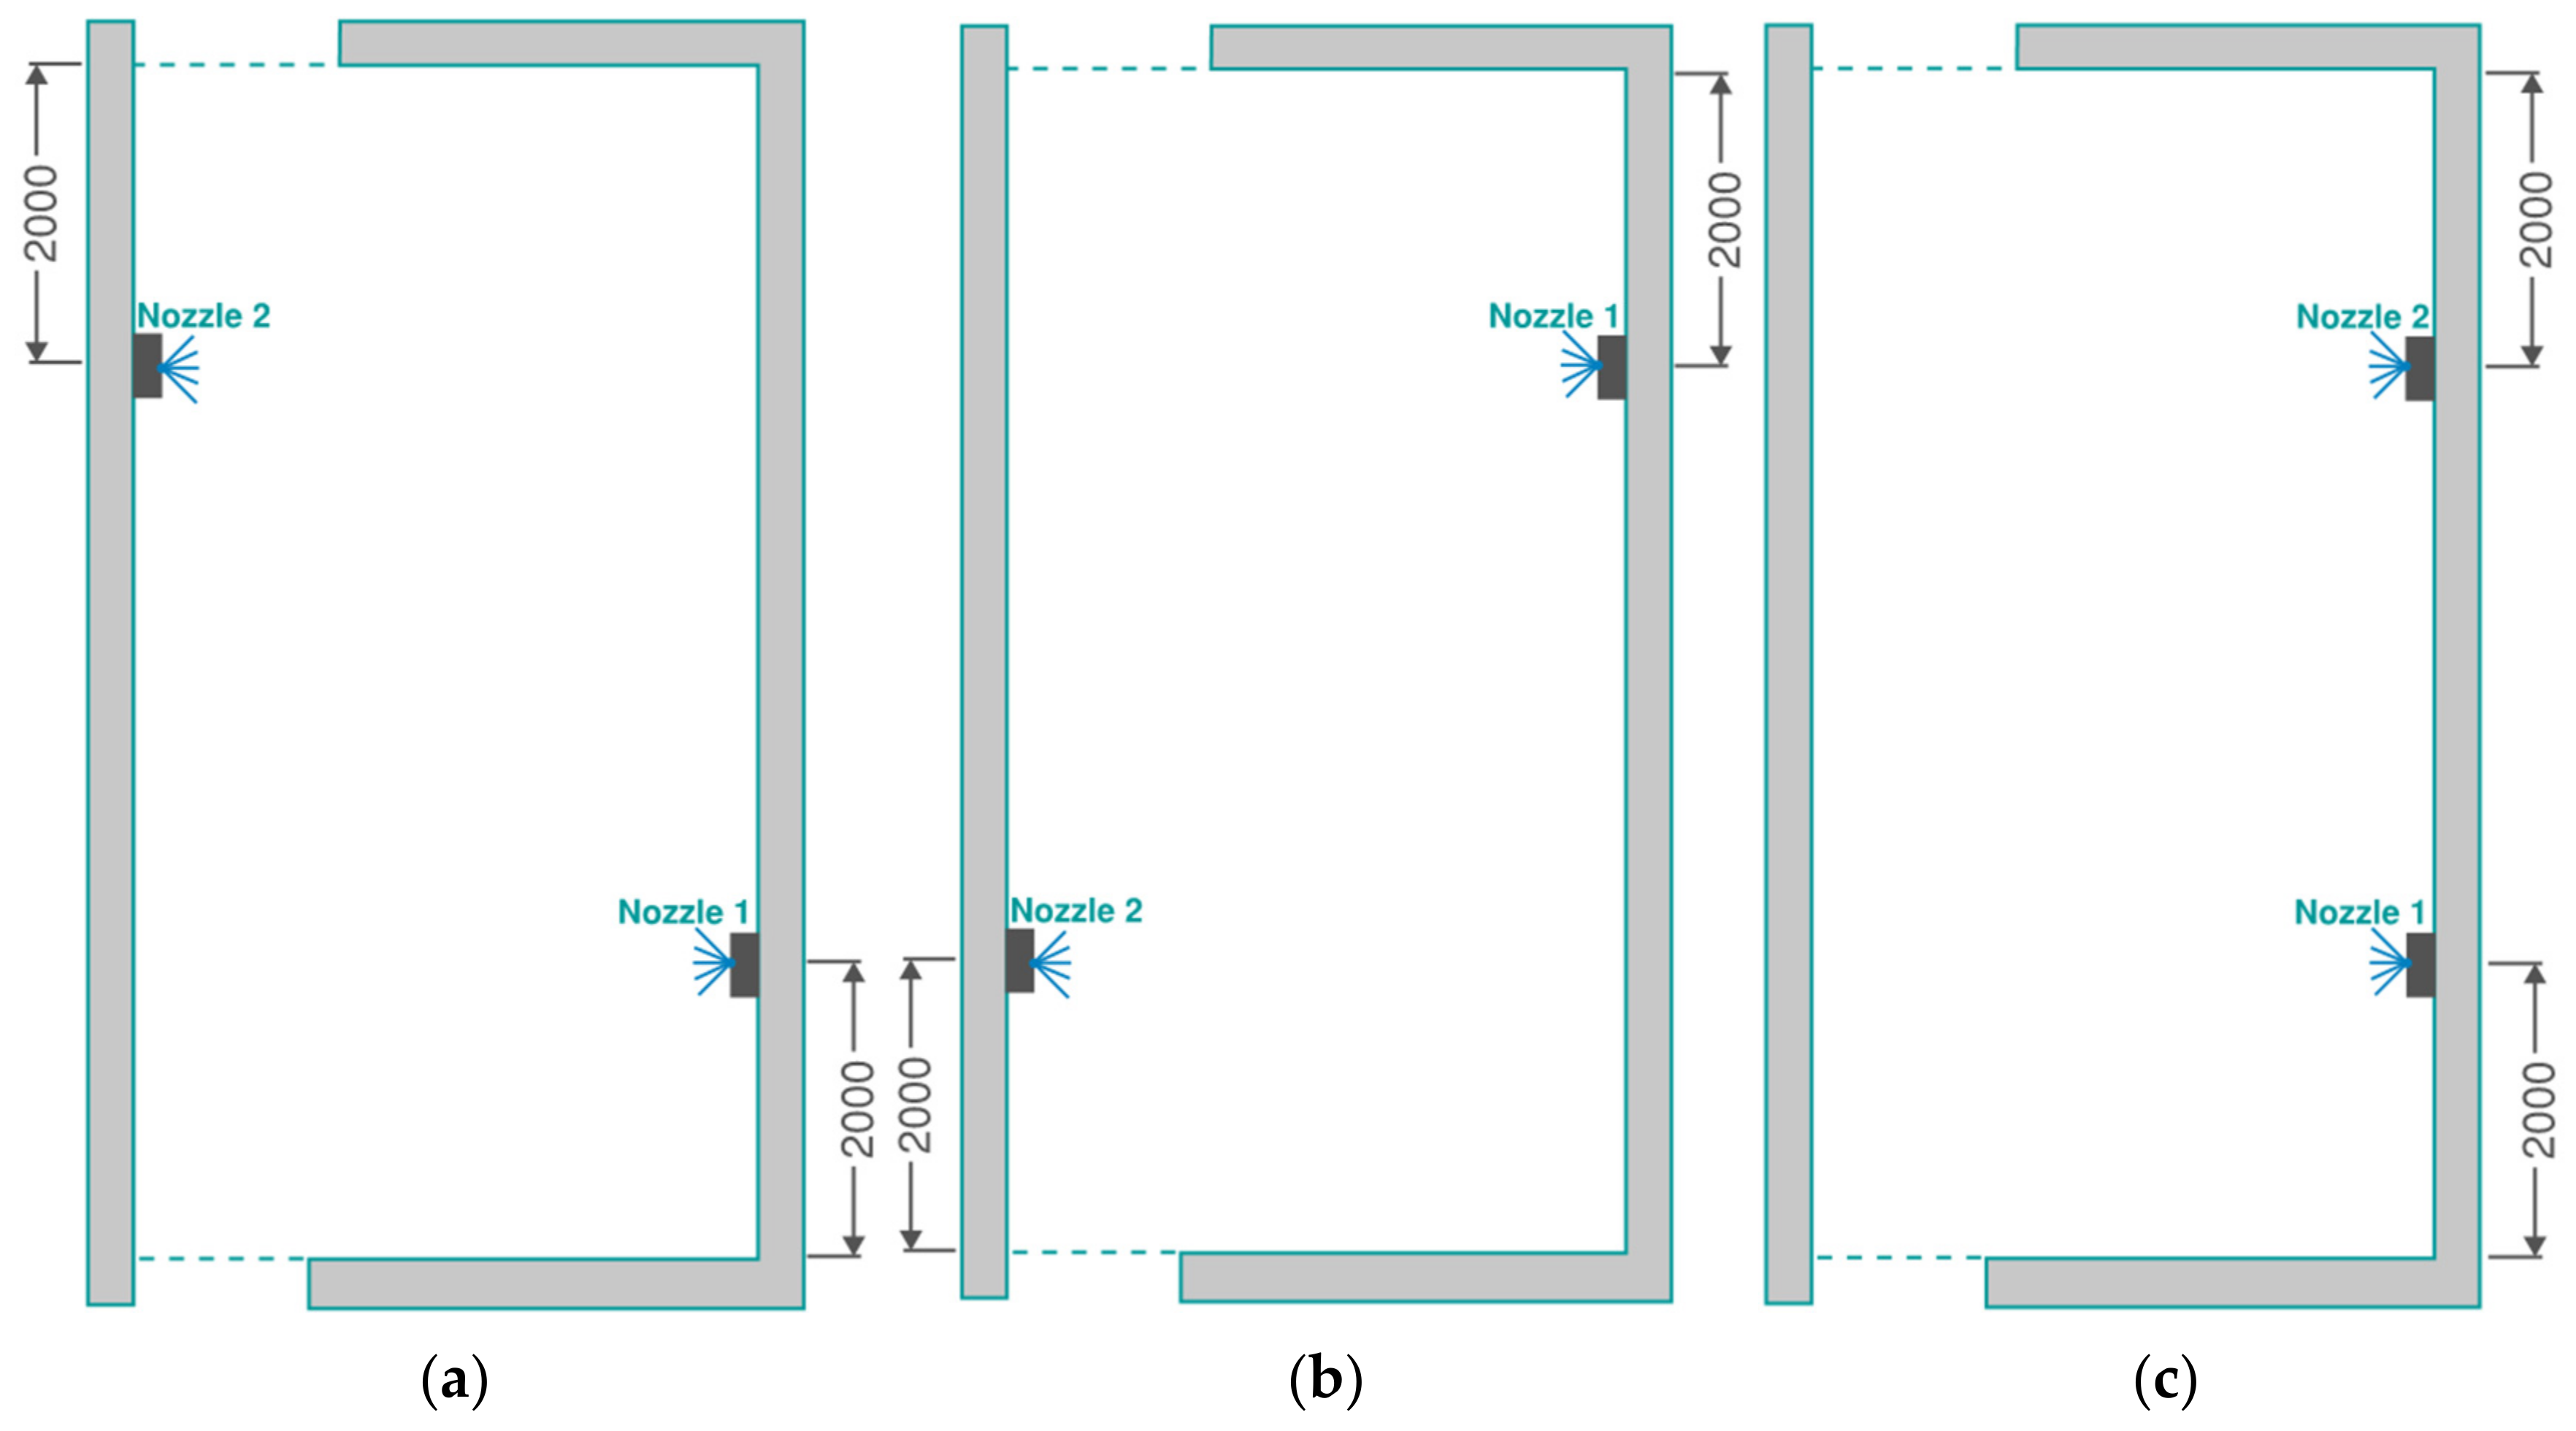
2.4. Thermocouple, Nozzle, and Detector Locations

Depending on the test arrangement, up to four thermocouple (TC) trees were included in the enclosure. These are presented in Figure 5. The thermocouples were positioned 1.6 m from floor level and 75 mm below the ceiling.
Figure 6 provides the three different nozzle arrangements used in the tests, with each arrangement incorporating two nozzles. The nozzles were wall-mounted and positioned along a long wall edge, located 2 m from the nearest perpendicular wall/boundary. All nozzles were positioned 1.45 m from floor level. For each arrangement, an optical smoke and heat wireless detector was located at the centre of the enclosure and used to activate the nozzle scan procedure.

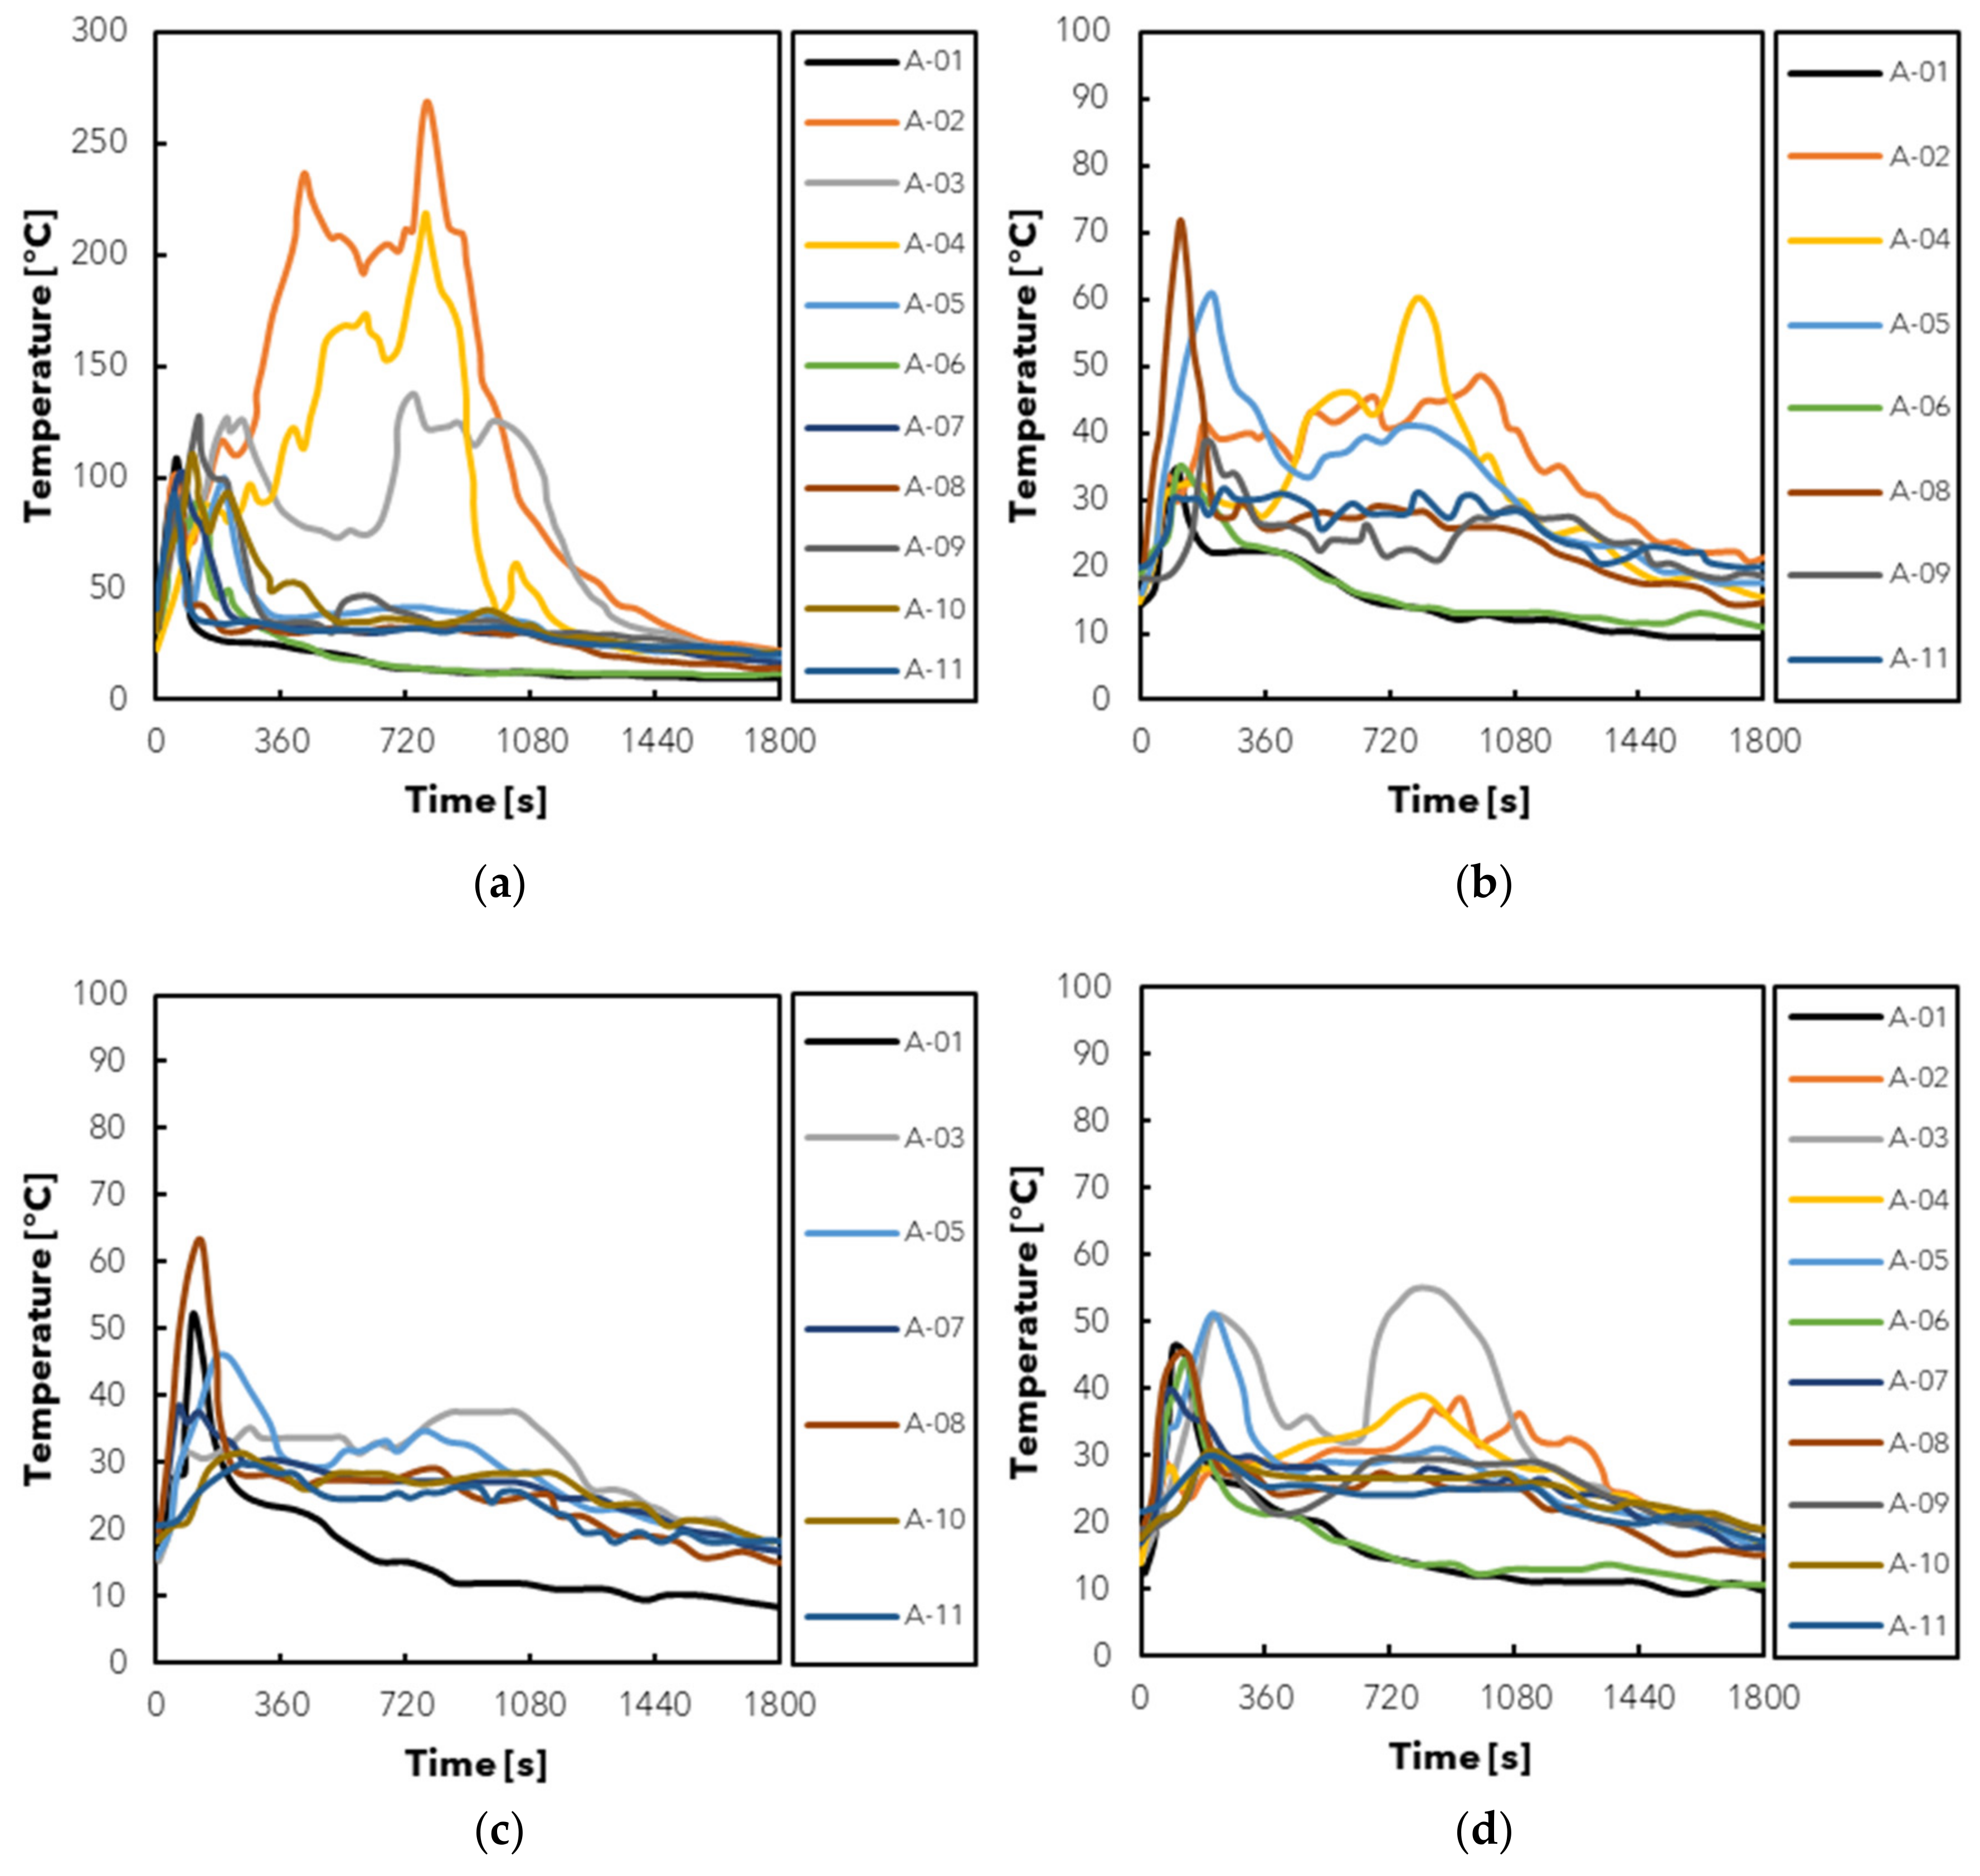
2.5. Fire Test Results

A summary of the 11 tests, in relation to the fire location, room enclosure, nozzle arrangement, presence of a fan, detector activation time, and nozzle activation time, is shown in Table 2.
As noted previously, a focus of the BS 8458:2015 [26] Annex C tests is the thermocouple temperatures observed at 75 mm from the ceiling and 1.6 m above floor level. Figure 7 presents the thermocouple temperatures for each test, separating the thermocouples out depending on their height and proximity to the fuel package. The electronically controlled water mist system was shown to pass the Annex C acceptance criteria for the tested arrangements.
The thermocouple temperatures provide some indication of the variability of the fire growth of the fuel package, as it is unlikely such substantial variations are solely down to the observed system performance for each test. This view is supported from previous discussions detailed by Bill et al. [27], where it is suggested that the ignition and fuel package has the potential to produce a wide range of growth times and maximum HRR values.
There are three tests in the series where greater temperatures are observed for a prolonged period, particularly 75 mm below ceiling level, which are A-02, A-03, and A-04. Observing the time for the first nozzle to activate, these tests are shown to result in an initiation of the system between 54 to 68 s, which is similar to many of the other tests. Therefore, it does not appear that a delay in activation has resulted in the increase in temperature.
Figure 8 presents the specific arrangements of tests A-02 to A-04, with the room enclosure, fire location, and nozzle arrangement shown. For tests A-02 and A-04, which exhibit the highest temperatures presented in Figure 7a, the fire may have been shielded from the direct nozzle spray by the backing board and wooden frame (indicated by the two brown lines at 90° in Figure 8). It is particularly noted that in test A-02, the nozzle furthest from the fire activated rather than the closer nozzle, despite the fire being shielded from the furthest nozzle by the backing board and the closer nozzle having a direct line of sight of the ignition package. While this same shielding behaviour may also have been observed in tests A-09 and A-10, these two tests only incorporated two walls for the enclosure, potentially minimising the build-up of heat. This observation highlights that the direct application of water mist droplets to the fire is an important factor in its suppression, although other benefits such as cooling and dilution will still contribute to a certain extent.

3. Representing the Fire Tests in a Zone Model

3.1. Modelling Tool and Methodology

To represent the fire tests computationally, fire modelling has been undertaken using the zone modelling software B-RISK [22], version 2021.2, developed by the Building Research Association of New Zealand (BRANZ) in Porirua, NZ. B-RISK incorporates a two-zone zone model to calculate fire dynamics, smoke dispersion, and temperature throughout rectilinear enclosures. Further discussion on the validation of B-RISK for application in representing suppression systems can be found in publications by others [28,29,30], including for electronically controlled water mist system nozzles [21].
The purpose of the modelling exercise described in this paper is to determine whether assumptions for suppression typically applied to sprinklers can potentially be extended to the performance of an electronically controlled water mist system. It is recognised that higher fidelity and more precise modelling tools could be used, such as the computational fluid dynamics (CFD) based tool, Fire Dynamics Simulator (FDS) [31]. However, the intent of the exercise is to provide practicing engineers with simple assumptions around the performance of water mist systems, and thus the adoption of complex modelling to explore the problem would introduce a potential layer of complication should engineers wish to extend outcomes to more simple tools. In addition, the value of an output of a model is directly tied to the specification of its inputs. Should these inputs carry with them a high degree of uncertainty, as is the case for both the information available in the BS 8458:2015 fire tests and potential residential fire scenarios [32] when the system is in use, then there is a reasonable argument that a more precise model provides limited additional value. Elms [33] referred to this a ‘consistent crudeness’, with Buchanan [34] applying the concept to structural fire engineering to suggest “there is no point in obtaining highly accurate data for one part of the analysis, with a level of accuracy out of balance with the crudeness of at least the well defined part of the problem”.

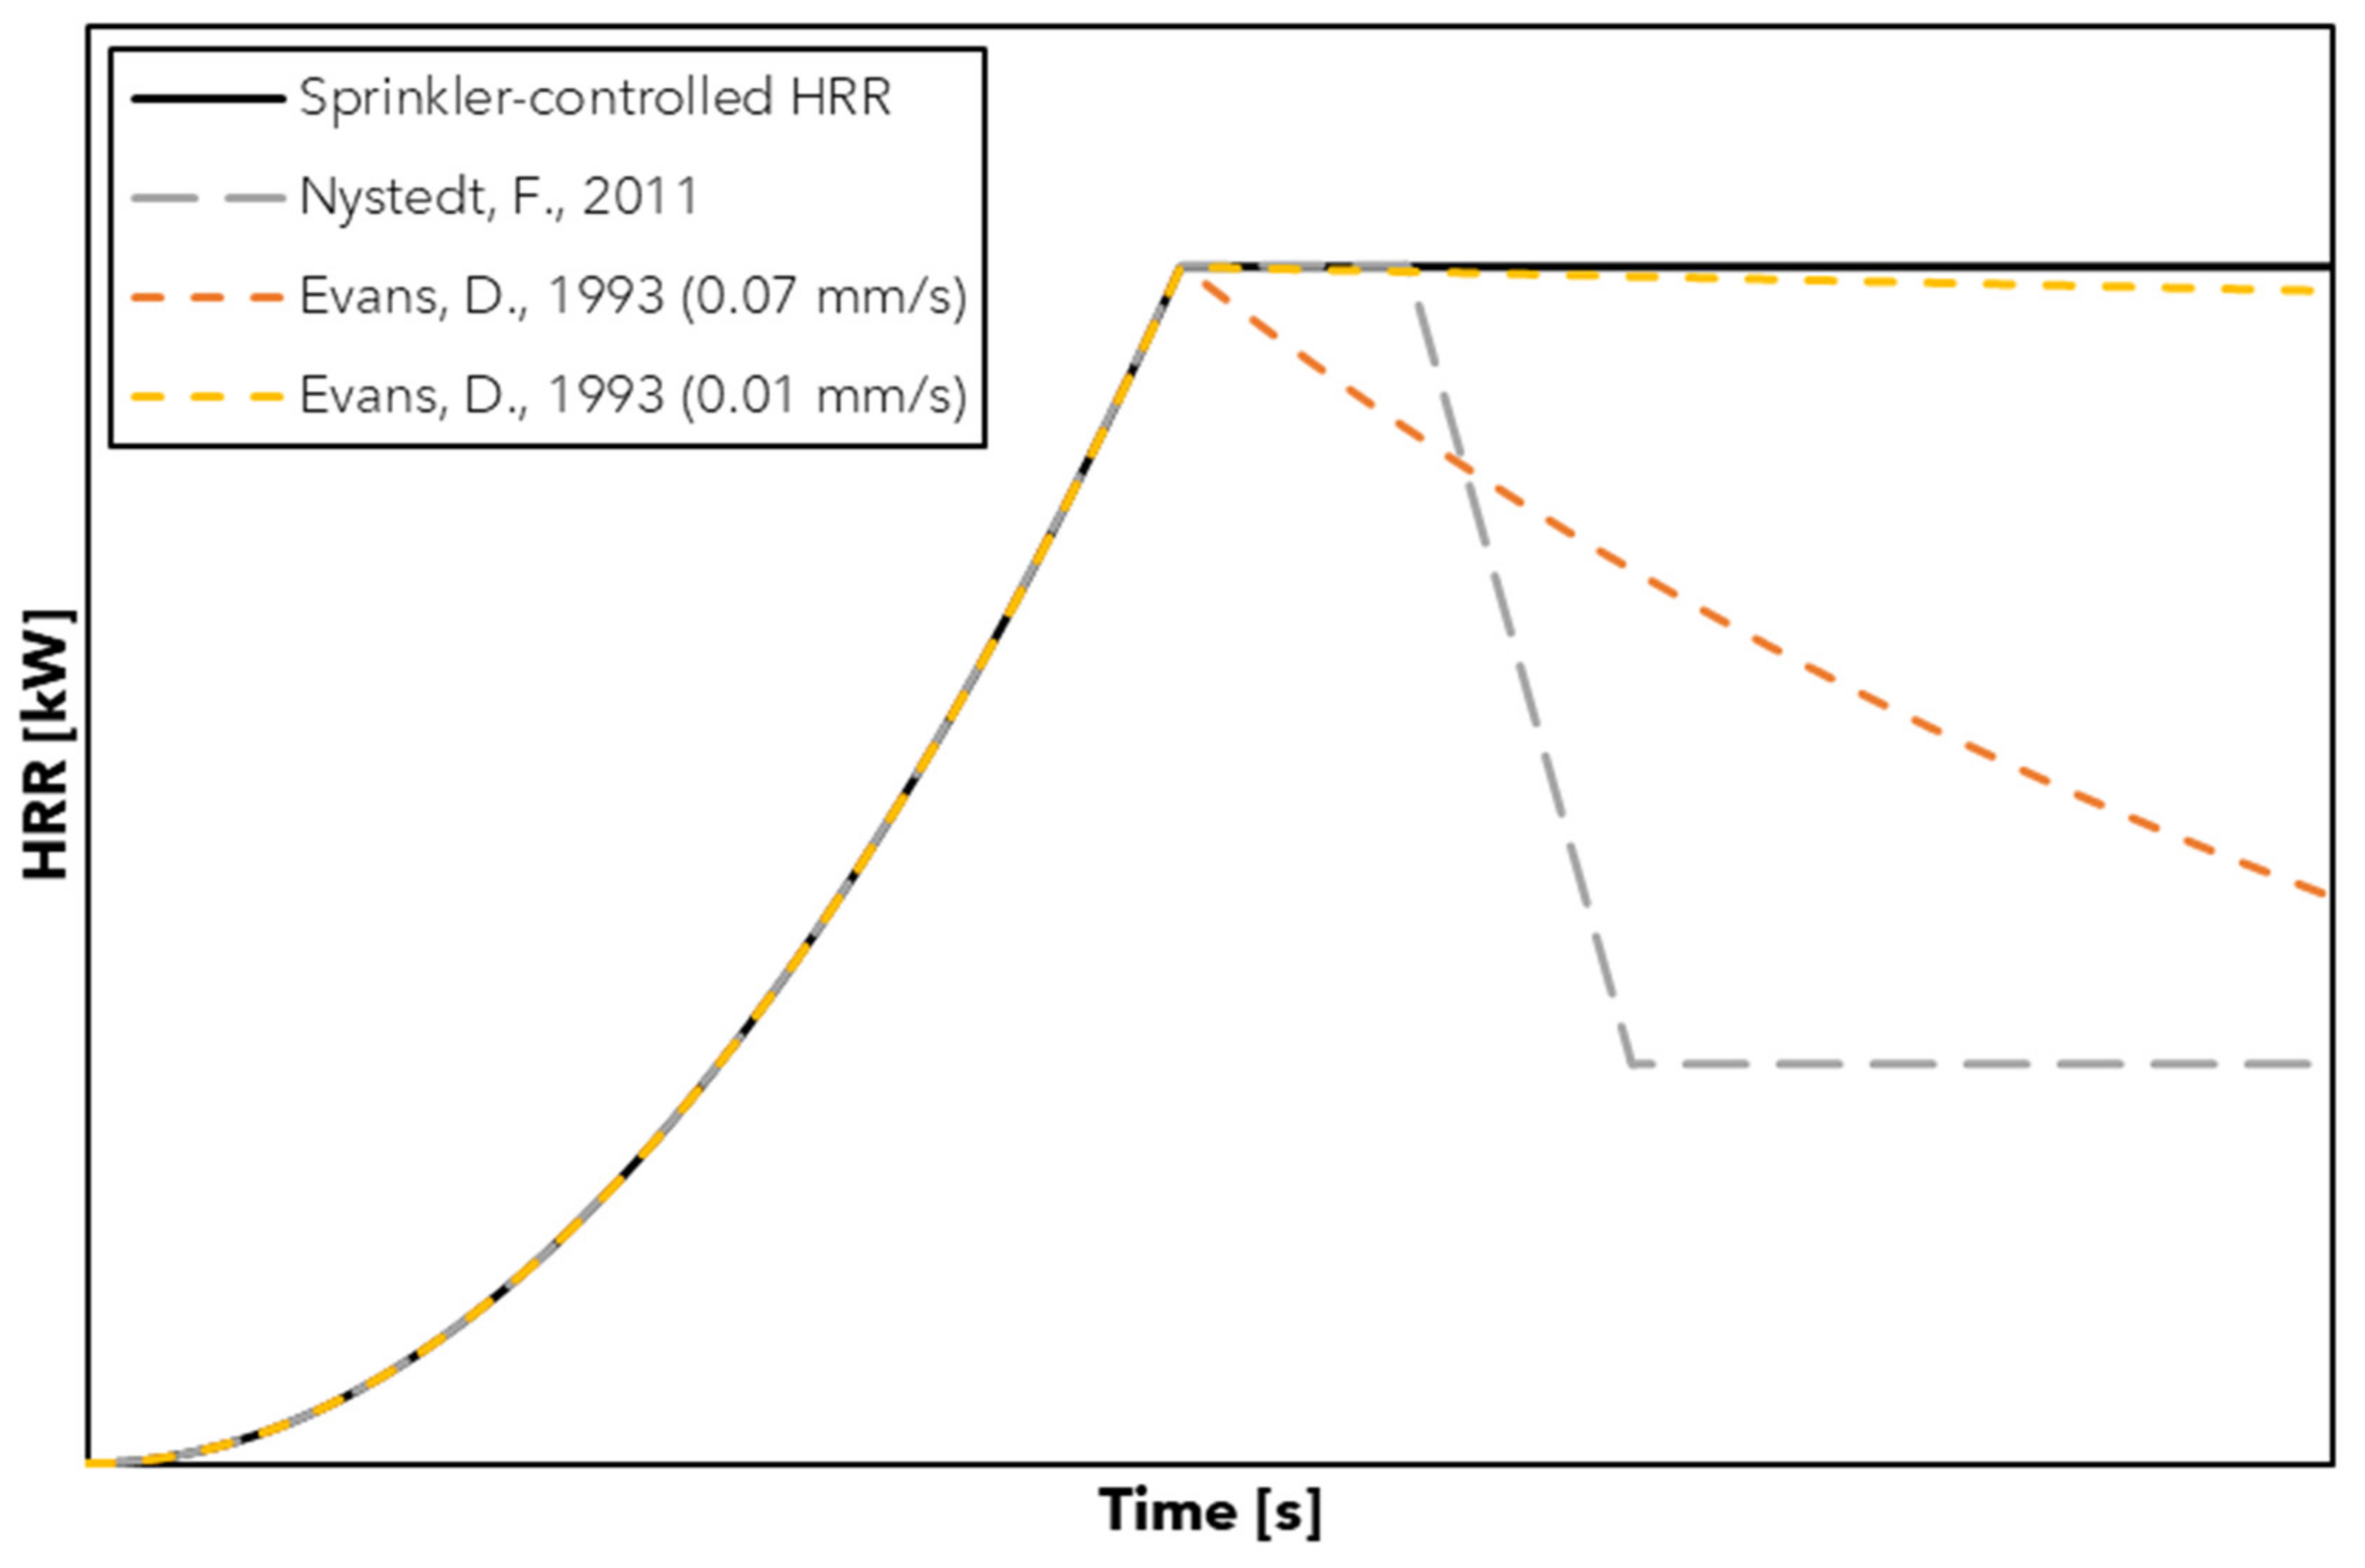
3.2. Water Mist Suppression Performance

The electronically controlled water mist system initiates and begins to scan the room with a thermopile sensor following the activation of a combined smoke and heat detector. It is generally not feasible to represent this type of complex interaction in simple modelling tools and it would remain difficult to quantify in more complex tools, given that the scanning process is reliant on estimating the infrared radiation in some capacity, assessing the rate of change in temperature through the use of elaborate algorithms.
In a separate work, Spearpoint et al. [21] propose that the activation of the electronically controlled water mist nozzles can be represented by thermal sensitivity parameters for an ‘equivalent’ sprinkler system. That is, the system can be represented as a series of ceiling-mounted sprinklers with effective parameters for the RTI and C factor. To achieve this, a comparison was made between system activation times in experiments and activation times estimated in B-RISK zone models. This comparison was undertaken for the BS 8458:2015 tests detailed herein, as well as a separate series of experiments for slow-growing, shielded fires. Spearpoint et al. suggest that the system can be reasonably represented with effective values for the RTI and C factor of 20 m½s½ and 0.25 m½s−½, respectively, with an effective rated temperature of 68 °C and a ceiling offset of 20 mm. For the radial distance, Spearpoint et al. estimated this by using the distance between the centreline of the fire and the detection element (i.e., the nozzle). Therefore, the same approach to representing the system activation has been adopted in the modelling for this paper.
Once the system has activated and began introducing water droplets to the enclosure, consideration needs to be given to the impact suppression has on the HRR. For this, the modelling considers three possibilities, in line with those discussed in the opening of this paper and presented in Figure 1 previously, i.e., a sprinkler-controlled/capped HRR, the Nystedt [7] model, and the Evans [8] model. For the Evans model, a spray density of 0.07 mm/s (4.2 mm/min) has been applied, consistent with the minimum density identified for the majority of experimental data assessed in the original study. This spray density is not intended to be representative of the discharge rate of the water mist system (refer to discussion in Section 1.4) and is only used for the purposes of comparison. If the local discharge density of the system was to be applied to the Evans model, then the decay curve would closely align with the assumption of a sprinkler-controlled fire with a capped HRR (see Figure 1 previously).

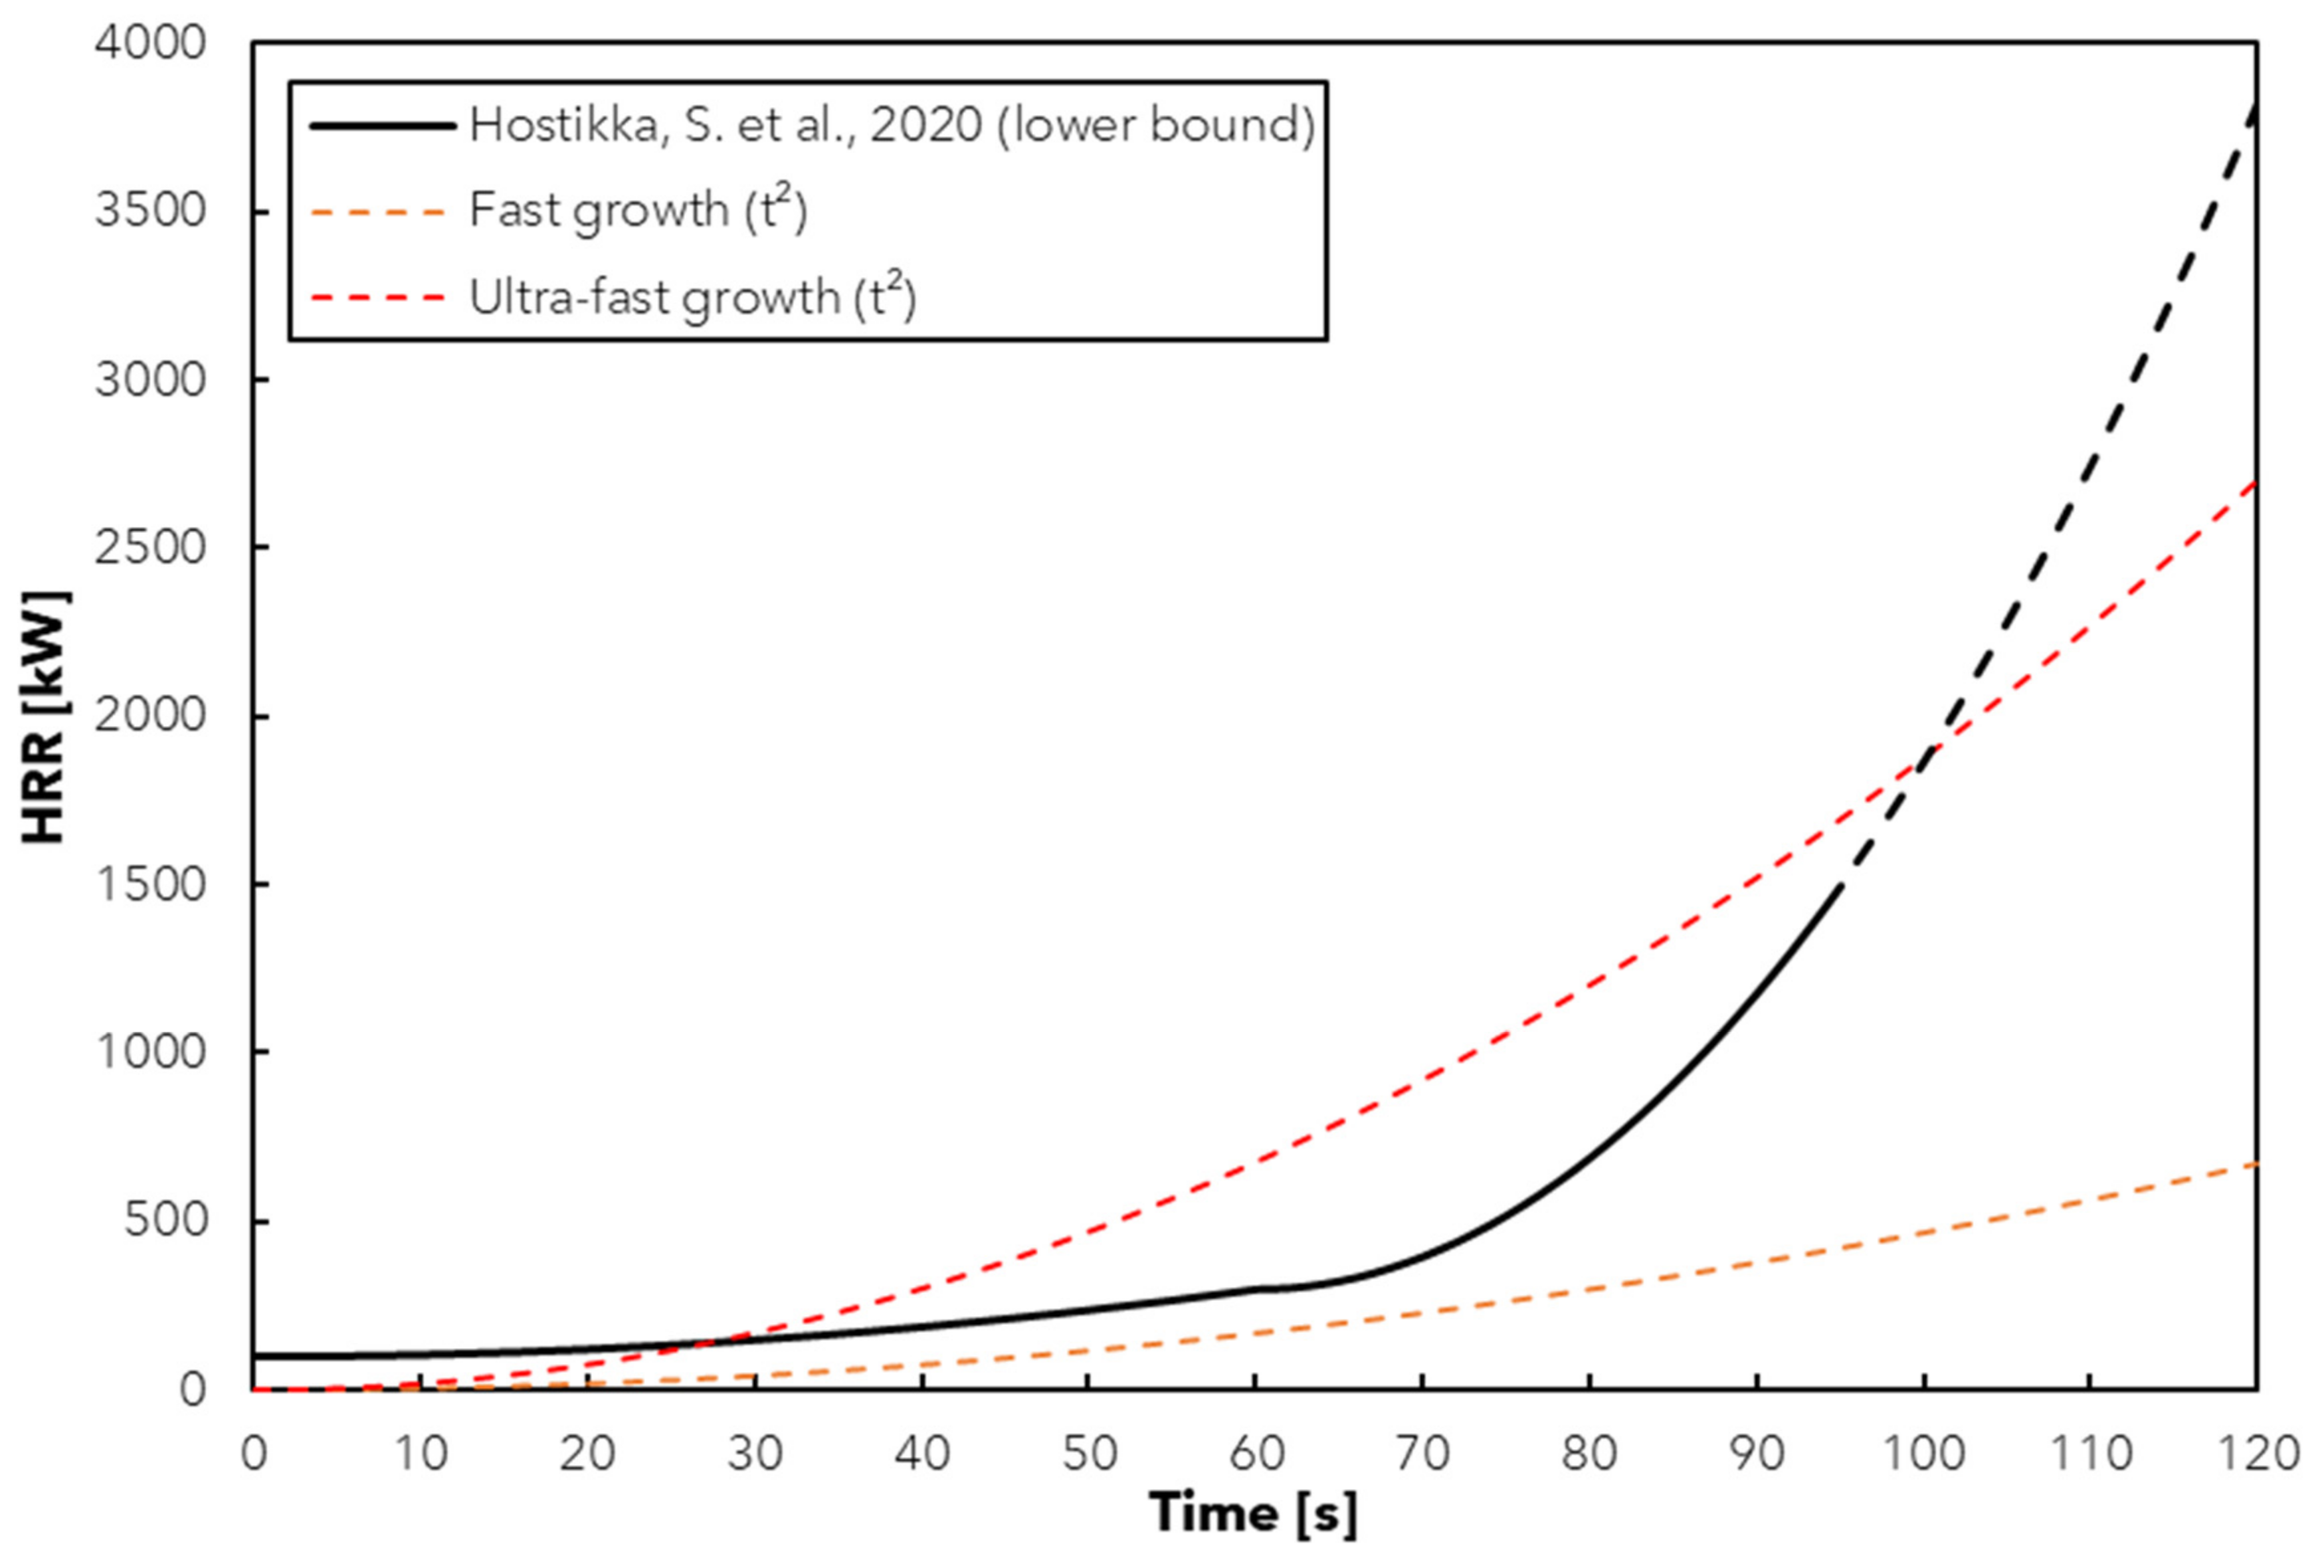
3.3. Defining the Fire Parameters

The HRR for the BS 8458:2015 fire test is neither defined nor measured during the testing procedure. However, Spearpoint et al. [21] make reference to the work of Hostikka et al. [35] to determine a reasonable HRR assumption for representing the test fuel package. Hostikka et al. discuss previous full-scale laboratory measurements by Underwriters Laboratories (UL) in a UL 1626 [36] fire test, where the HRR for the corner fire was described as being initially around 100 kW, increasing in a t2 manner to 300 to 500 kW after 60 s, and then reaching 1500 kW in 80 to 95 s. Spearpoint et al. note that the fuel package used in the UL 1626 fire test is the same as that used in the BS 8458:2015 test. It was proposed that a lower bound HRR relationship from the work of Hostikka et al. be used, as this was shown to provide closest agreement between estimated temperatures in the tests and models. The adopted HRR curve has been reproduced in Figure 9.
For other fire parameters, a value of 22,700 kJ/kg has been adopted for the effective heat of combustion of foam slabs [35], with a soot yield of 0.227 kg/kg and a radiative fraction of 0.46 for polyurethane foam [6]. A burner area of 1.075 m by 1.075 m has been adopted, and is representative of the combined dimensions of the wood crib and two foam slabs attached to the backing board. A 0.4 m elevation is adopted to align with the midpoint of the foam slabs and the top of the wood crib.

3.4. Enclosure Surface Properties

As noted in the test description, wall and ceiling surfaces to the enclosure were covered by 12.5 mm thick Type F fire-rated plasterboard. To represent this in the zone model, gypsum plasterboard properties have been approximated from Hopkin et al. [37], with a thickness of 12.5 mm, a density of 780 kg/m3, a specific heat capacity of 0.095 kJ/kg/K, a thermal conductivity of 0.25 W/m/K, and an emissivity of 0.7.
The slab of the enclosure has been simulated with concrete properties estimated from BS EN 1992-1-2:2004 [38], with a thickness of 100 mm, a density of 2300 kg/m3, a specific heat capacity of 0.9 kJ/kg/K, a thermal conductivity of 1.4 W/m/K, and an emissivity of 0.7.

3.5. Ventilation and Enclosure Openings

The test enclosure arrangements incorporate full height openings. For these openings, a coefficient of discharge of 1 has been applied, with no aerodynamic losses through the opening. This approach aligns with recommendations given in the B-RISK user guide [22] in situations where the top of the opening is flush with the ceiling.
Two of the tests include a mechanical fan blowing air into the enclosure. To represent this fan in the simulations, a volumetric supply flow rate of 0.2 m3/s is assumed, for a velocity at the fan of 1 m/s and a fan area of 0.2 m2. However, the mechanical ventilation is previously shown to have a negligible impact on the observed simulation results [21].

3.6. Estimating the Thermocouple Temperature

The B-RISK zone model does not estimate gas temperatures for a specific location of the domain but instead estimates the temperature uniformly for upper and lower gas layers. Therefore, the layer height estimated from the modelling has been used to determine whether the thermocouples sit within the upper layer or lower layer. For example, where a layer height of 2.3 m has been estimated, then the upper layer temperature (ULT) has been equated to the thermocouple which is 75 mm from the ceiling (i.e., 2.5 minus 0.075 is greater than 2.3). The thermocouples which are 1.6 m from floor level are then equated to the lower layer temperature (LLT).

4. Zone Model Simulation Results and Discussion

4.1. Estimated System Activation Times

As discussed previously, the modelling considers the activation of the system for the HRR presented in Figure 9 by applying the thermal sensitivity parameters and methodology recommended by Spearpoint et al. [21].
Table 3 presents the nozzle activation times in the tests compared to those estimated in the zone modelling, where these times are consistent with those presented in the work of Spearpoint et al. In observing these activation times, it was noted that five of the tests resulted in a comparable match between the measured and simulated activation times, with the corner fire tests (A-01, A-05, and A-08) producing much quicker estimated activation times. It was postulated by Spearpoint et al. that this underprediction was due to the short simulated radial distance from the fire to the nozzle head.
Spearpoint et al. did not include tests A-09 to A-11 in their assessment, as these were two-walled (‘open’) experiments. For tests A-09 and A-10 in particular, a delayed activation time of the system was observed, up to a time of 2 min 16 s. Given that these arrangements resulted in a similar initial detection time from the smoke and heat detector (shown in Table 2 previously), this delay is attributed to the time for the activated nozzle head and thermopile sensor to subsequently identify a fire. As with the corner fire tests, the adopted parameters are shown to produce a relative underestimation in the activation times for these tests. This could be a result of the simplification of the open boundaries and substantial variations in air, smoke, and heat flow in the well-ventilated conditions, where these conditions may have contributed to the delayed activation time in the tests. The general trend for quicker activation times estimated within the simulations may also be influenced by the HRR curve adopted from Hostikka et al. [35], where this curve could generate greater HRRs than those realised in the tests.
Table 3 also includes the maximum HRR for each test, noting that this correlates with the HRR at the time that the system is estimated to first active within the model. After this, the HRR is either capped or decays, depending on the suppression model which is applied. The implications of this assumption on the temperatures estimated within the enclosure are discussed later. The maximum HRRs upon system activation are estimated to range between 118 kW for tests A-05 and A-08 up to 692 kW for test A-09.

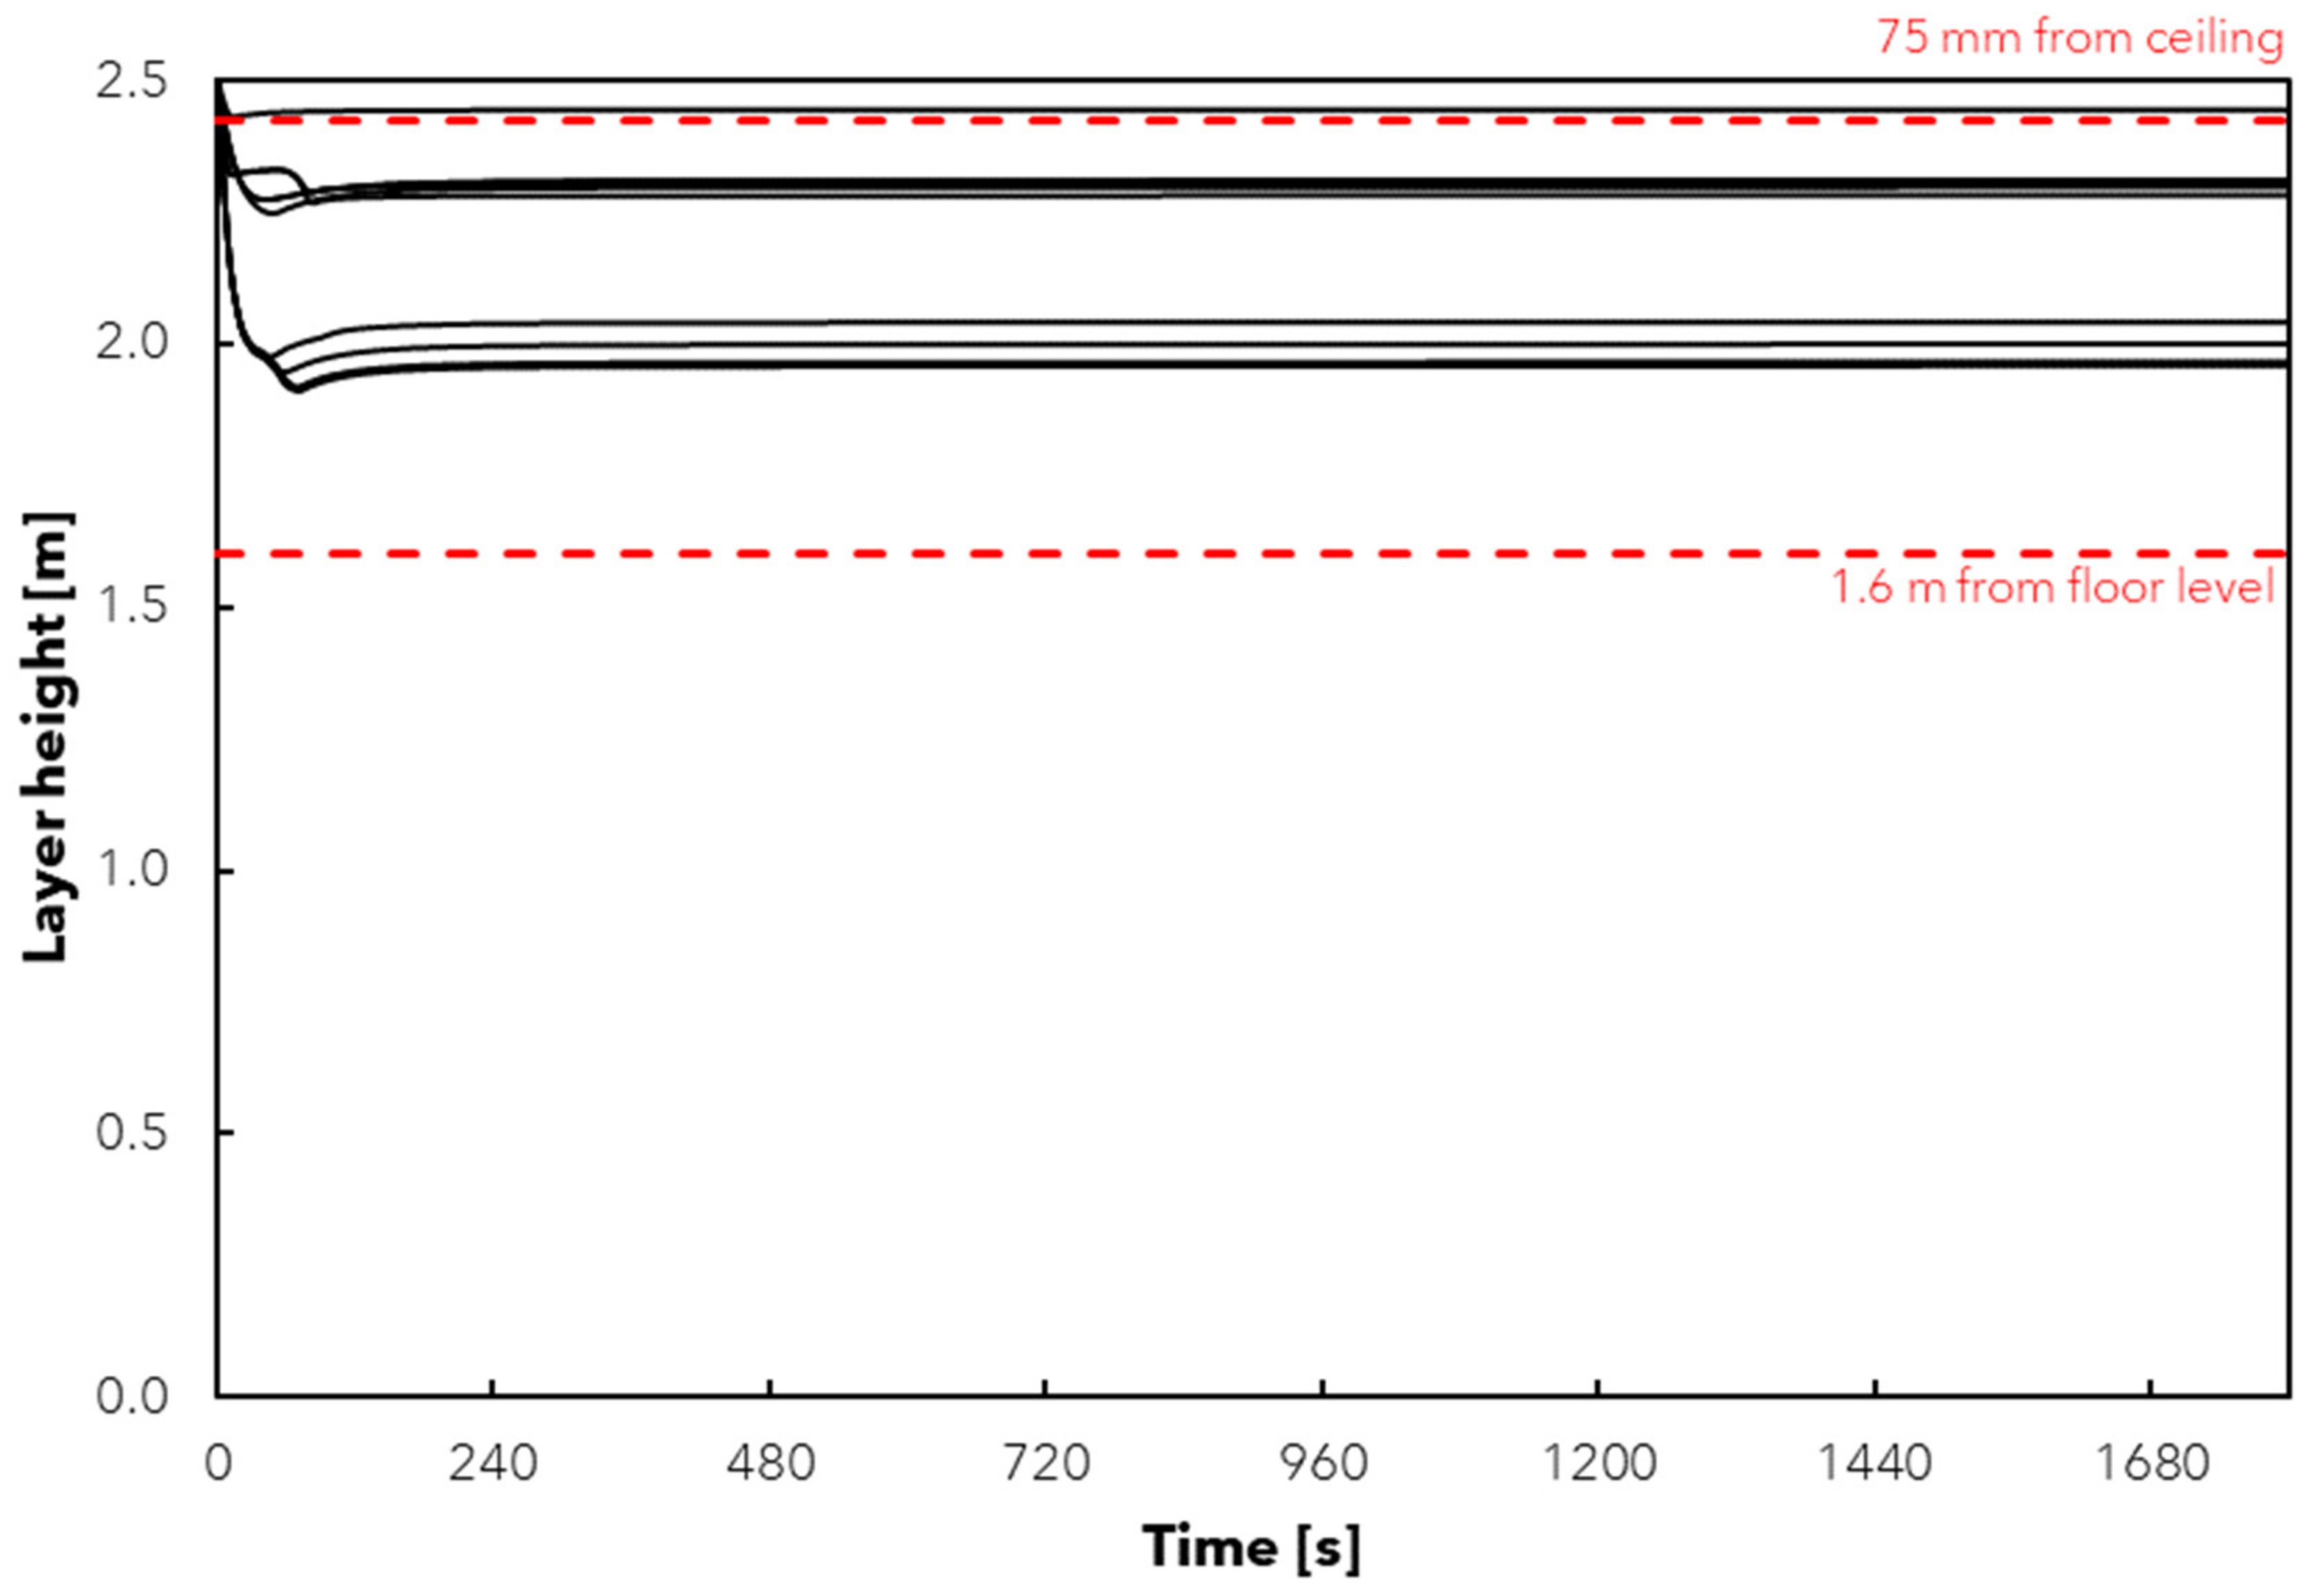
4.2. Estimated Layer Heights

Figure 10 presents the layer heights estimated by B-RISK for each of the 11 simulations for a sprinkler-controlled/capped HRR. As the tests did not provide a means for observing or estimating the smoke layer heights, no experimental comparisons can be made. However, the simulated layer heights have been used to estimate where the thermocouples are likely to sit within the smoke layer. In all but one simulation (Test A-11), the thermocouple positioned 75 mm from the ceiling is estimated to sit within the upper smoke layer, while the thermocouples positioned 1.6 m from floor sit within the lower clear layer. Thus it appears reasonable, for the purposes of this paper, to assume that the ULT is largely representative of temperatures observed 75 mm from the ceiling.

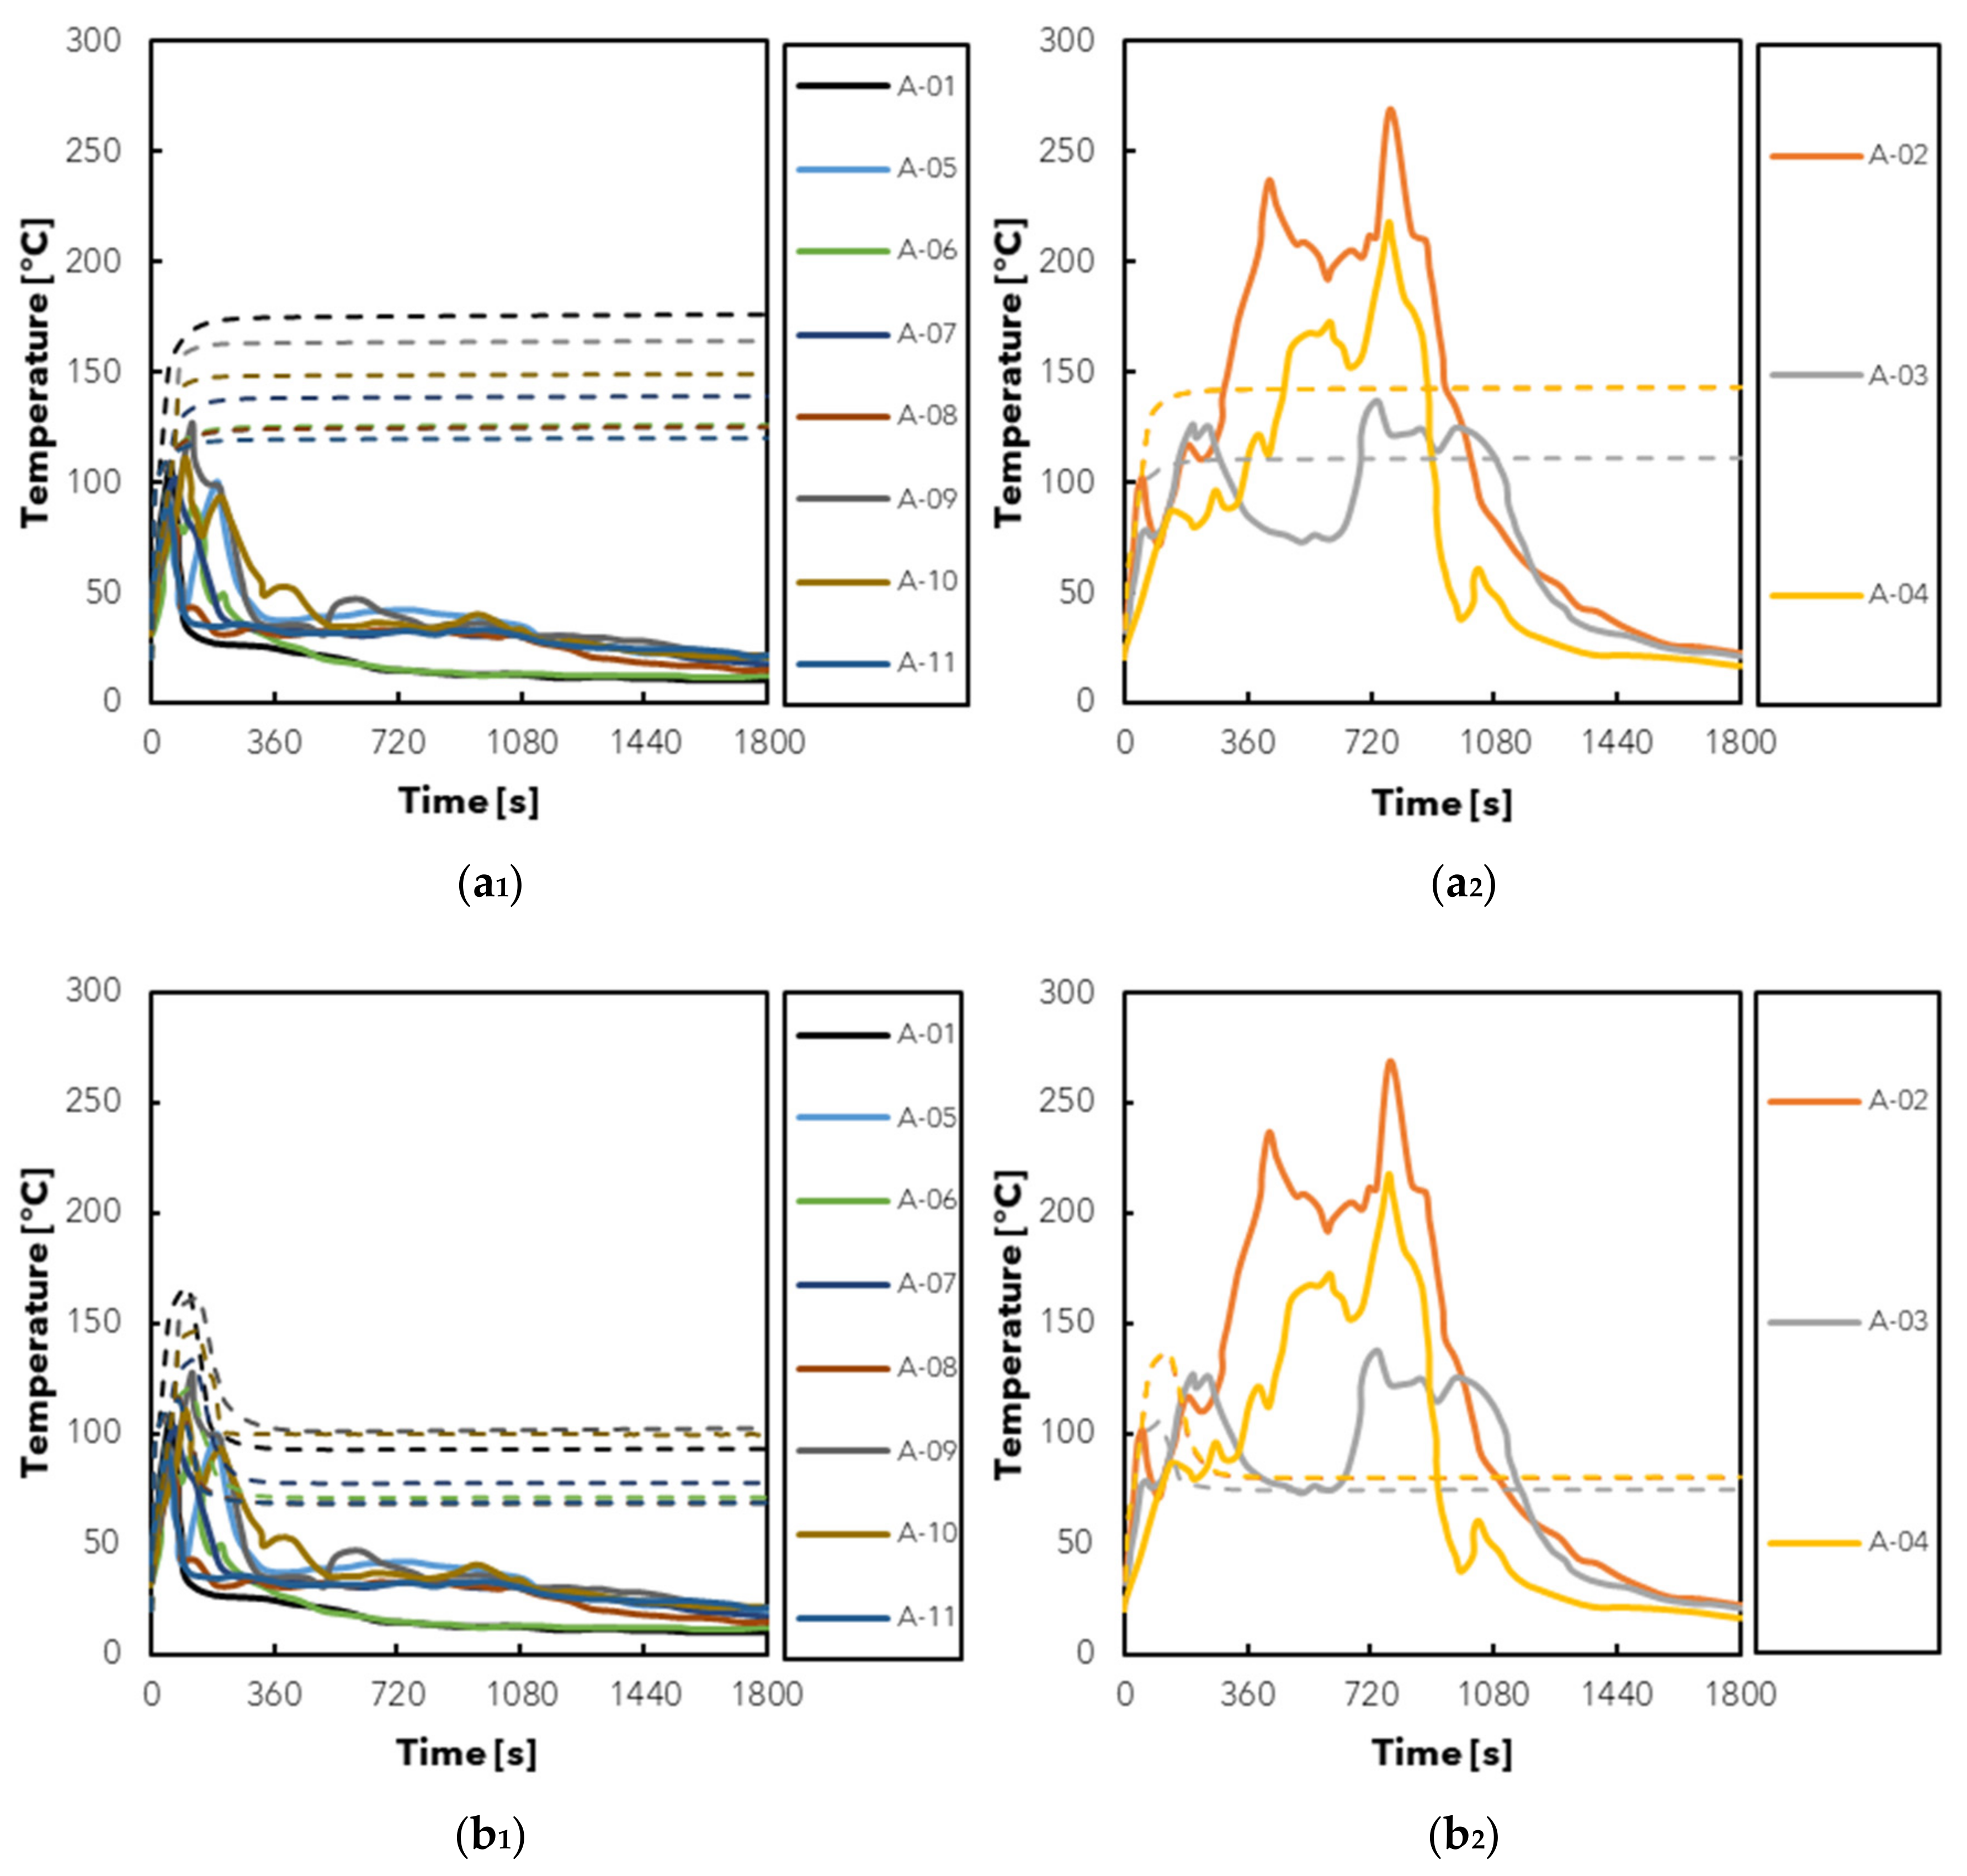
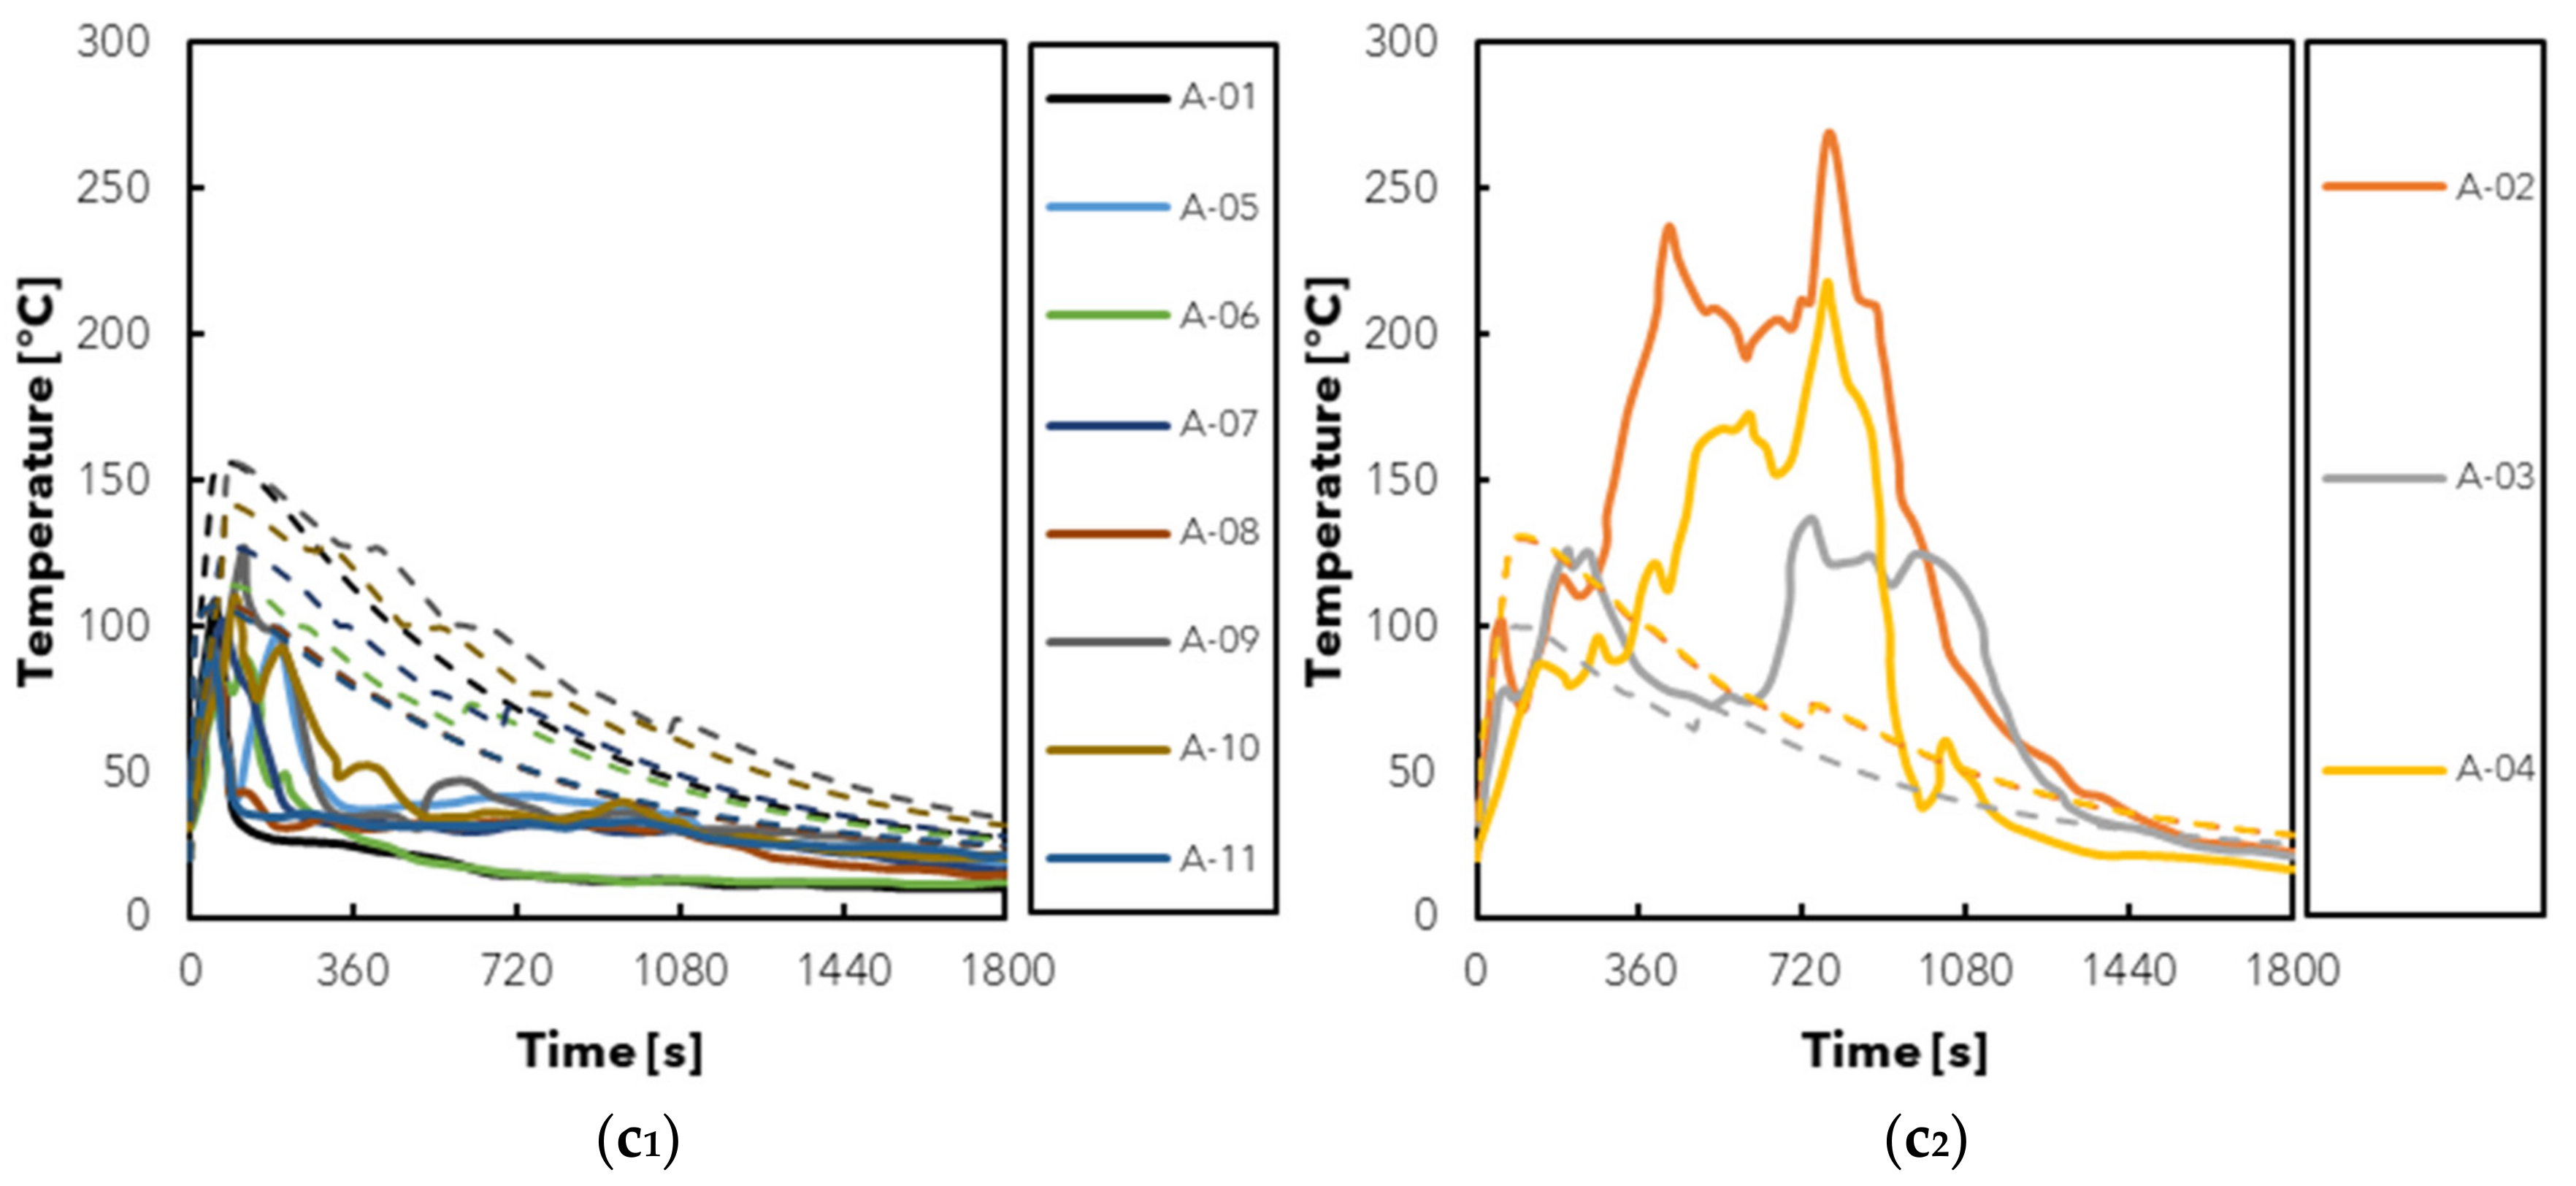
4.3. Estimated Temperatures and Suppression Performance Comparisons

Given the observation that the thermocouple position 75 mm from the ceiling sits within the upper smoke layer, the following section focusses on a comparison between the test data for this thermocouple location and the ULT estimated in the zone modelling.
Figure 11 presents this comparison for the three suppression assumptions, namely: (a) the HRR is capped upon system activation; (b) the HRR decays following the Nystedt [7] model; and (c) the HRR decays following the Evans [8] model. Tests A-02 to A-04 have been presented on separate plots (denoted with subscript 2) as these three tests produced higher temperatures and were not observed to result in a ‘rapid’ decay following system activation compared to the other eight tests (subscript 1).
When considering tests in the A-01 to A-11 group where rapid temperature decay was observed, it appears that assuming the HRR is capped upon system activation is conservative, with the estimated ULT being much greater than observed in the fire test data. In contrast, the peak temperature in the Nystedt model more closely fits the test data although, following the initial decay, temperatures are still estimated to be higher than the test data. Of the three methods, the Evans exponential decay curve appears to most closely align with the test data.
Observing the three tests (A-02 to A-04) where rapid decay was not observed after system activation, the two decay models (Nystedt and Evans) appear quite favourable in comparison to the test data. In this instance, the closest assumption appears to be a sprinkler-controlled HRR, although the maximum temperature is still under-estimated.
Examining the comparisons collectively, it does not appear unreasonable to apply suppression assumptions, historically estimated from sprinkler performance, to the performance of the electronically controlled water mist system assessed in this paper.

4.4. Limitations

In undertaking the tests and modelling presented in this paper, it is acknowledged that there are a number of limitations. The key limitations are mentioned below, noting that the list is not intended to be exhaustive:
  • The BS 8458:2015 fire tests represent a limited range of fire scenarios, albeit with a fire growth rate on the more ‘severe’ side of potential residential fires (in the range of a fast to ultra-fast growing fire). In comparison, Hopkin et al. [39] estimate that a medium growth rate sits close to the 95th percentile of residential fire incidents. Spearpoint et al. [21] noted that the harmonisation of test standards (such as BS 8458:2015, BS 9252:2011 [40], and BS EN 12559-14:2020 [41]) for ‘legacy hazards’ can lead to erroneous assumptions that a system is suitable for a broader range of hazards.
  • The enclosure dimensions for the tests were 8 m long by 4 m wide by 2.5 m high, with the nozzles spaced at a distance of 4 m apart. The electronically controlled water mist system is currently designed to protect an area within 6 m of each nozzle for a 90° radius [25], and therefore a greater number of nozzles would need to be incorporated to achieve adequate coverage for larger enclosures.
  • By representing the water mist nozzles as equivalent to sprinkler heads which are mounted at the ceiling, there are limitations in how these assumptions can then be applied in enclosures with different ceiling heights, e.g., tall and double height spaces. The electronically controlled water mist system incorporates nozzles which are positioned within the enclosure walls at a height of approximately 1.45 m from floor level, and it is designed to discharge water in the direction of the fire rather than in the upper smoke layer. It could be hypothesised that taller ceilings would not significantly slow the system’s activation, or alter its performance, when compared to ceiling-mounted sprinkler heads. However, this would need to be verified through further experimentation.
  • The fire tests and modelling methods do not consider the reliability of the system, i.e., it is assumed the system activates and operates as intended. A common criticism levied against ‘novel’ fire safety systems is the lack of knowledge or availability of data for their reliability and performance. However, it can be difficult to identify a system’s reliability in a practical sense without their frequent inclusion in buildings, since reasonable quantification of reliability usually requires that a system is subject to a number of ‘real’ (i.e., non-experimental) incidents to build an adequate dataset of events. In an attempt to address this issue, preliminary work is underway which considers fault tree analyses and reliability targets for adequate performance of the system in specific applications, such as for open plan apartments and loft conversions.

5. Conclusions

Fire safety guidance documents are provided throughout the world to support performance-based calculations of suppression systems, such as PD 7974-1:2019 [5] in the UK. These documents make reference to different assumptions and practices which can be adopted and applied to the HRR of a fire following the activation of a suppression system. However, many of these recommended practices, such as the sprinkler-controlled fire (with a capped HRR), the Nystedt [7] model, or the Evans [8] model, are derived from experimental observations for sprinkler performance. Whether their application can be considered appropriate for other types of suppression system, such as water mist systems, remains largely unknown.
To explore the topic of suppression performance of water mist, this paper details a series of BS 8458:2015 [26] fire tests undertaken for an electronically controlled water mist system. Thermocouple test data for the fire tests has been compared to a series of B-RISK zone model simulations, where the activation performance of the water mist system has been represented in the models as an ‘equivalent’ sprinkler system, applying the recommended assumptions of Spearpoint et al. [21]. Three different recommended practices for representing suppression of the HRR following system activation have been applied, to observe whether their application can be reasonably extended to the electronically controlled water mist system.
When comparing thermocouple test data to the estimated layer temperatures of the zone modelling output, it has been found that suppression assumptions traditionally applied for sprinklers appear to remain appropriate for the electronically controlled water mist system detailed in this paper. In most cases, the Evans exponential decay model (adopting an equivalent sprinkler spray density of 0.07 mm/s rather than the local discharge density of the system) provides the closest agreement between the models and test data, while the assumption of a controlled fire is shown to be largely conservative. However, for three of the more ‘severe’ fire tests, the assumption of a decaying fire comes across as favourable and a controlled fire is likely more reasonable.
The fire tests considered in this paper represent a limited range of rapid-growth fire scenarios in specific enclosure arrangements. It would therefore be beneficial to undertake further experiments within different enclosure dimensions, which also involve the measurement of the fuel load, e.g., by use of a load cell, to verify that the suppression assumptions remain appropriate for other potential residential arrangements, fuel types, and different fire growth rates.
Finally, it would be useful to investigate whether B-RISK could be modified to include a water mist suppression model such as that proposed by Wighus and Brandt [20] and then compare the experimental results with predictions for the HRR and gas layer temperature.

Author Contributions

Conceptualisation, C.H. and M.S.; Formal analysis, C.H. and M.S.; Investigation, C.H., M.S., Y.M. and W.M.; Methodology, C.H. and M.S.; Visualisation, C.H.; Writing—Original draft, C.H.; Writing—review and editing, M.S., Y.M. and W.M.; Resources, Y.M. and W.M.; Project administration, Y.M. and W.M.; Funding acquisition, Y.M. and W.M. All authors have read and agreed to the published version of the manuscript.

Funding

The experimental work described in this paper was part funded by a Smart Grant through Innovate UK Smart Award, Project 66965.

Institutional Review Board Statement

Not applicable.

Informed Consent Statement

Not applicable.

Data Availability Statement

Data sharing not applicable.

Acknowledgments

The authors would like to acknowledge WarringtonFire for carrying out the BS 8458:2015 tests presented in this paper.

Conflicts of Interest

Authors Y.M. and W.M. are co-founders of Plumis Ltd. Plumis Ltd. are involved in the product development and sale of electronically controlled water mist systems. Ashton Fire Ltd. and OFR Consultants Ltd. are the employers of authors C.H. and M.S., respectively. Ashton Fire Ltd. and OFR Consultants Ltd. have received partial funding from Plumis Ltd. to carry out research in relation to the performance of electronically controlled water mist systems.

Nomenclature

Symbols
Q ˙ Heat release rate, kW
Q ˙ t act Heat release rate at the time of system activation, s
Q ˙ t t act Decaying heat release rate following system activation, s
t Time, s
t act Time of system activation, s
w ˙ Water spray density, mm/s
αFire growth rate, kW/s2
Abbreviations, acronyms, and initialisms
BBRADBoverket’s building regulations general recommendations on the analytical design of a building’s fire protection
BRANZBuilding Research Association of New Zealand
BSBritish Standard
C factorConductivity factor
CFDComputational fluid dynamics
COCarbon monoxide
C/VM2Verification method for New Zealand building code clauses C1–C6
FDSFire Dynamics Simulator
HRRHeat release rate
IRInfrared
LLTLower layer temperature
NFPANational Fire Protection Association
PDPublished Document
RTIResponse time index
TCThermocouple
ULUnderwriters Laboratories
ULTUpper layer temperature
VDIVerein Deutscher Ingenieure

References

  1. Nolan, D.P. Methods of fire suppression. In Handbook of Fire and Explosion Protection Engineering Principles; Nolan, D.P., Ed.; William Andrew Publishing: Oxford, UK, 2011; pp. 211–242. [Google Scholar] [CrossRef]
  2. Fleming, R. Automatic sprinkler system calculations. In SFPE Handbook of Fire Protection Engineering, 5th ed.; Springer: New York, NY, USA, 2016; pp. 1423–1449. [Google Scholar]
  3. Mawhinney, J.; Back, G. Water mist fire suppression systems. In SFPE Handbook of Fire Protection Engineering, 5th ed.; Springer: New York, NY, USA, 2016; pp. 1587–1645. [Google Scholar]
  4. Ruff, G.A.; Urban, D.L.; Pedley, M.D.; Johnson, P.T. Fire Safety. In Safety Design for Space Systems; Musgrave, G.E., Larsen, A.M., Sgobba, T., Eds.; Butterworth-Heinemann: Burlington, VT, USA, 2009; pp. 829–883. [Google Scholar] [CrossRef]
  5. PD 7974-1:2019; Application of Fire Safety Engineering Principles to the Design of Buildings. Initiation and Development of Fire within the Enclosure of Origin (Sub-System 1). BSI: London, UK, 2019.
  6. Hopkin, C.; Spearpoint, M.; Bittern, A. Using experimental sprinkler actuation times to assess the performance of Fire Dynamics Simulator. J. Fire Sci. 2018, 36, 342–361. [Google Scholar] [CrossRef]
  7. Nystedt, F. Verifying Fire Safety Design in Sprinklered Buildings. Department of Fire Safety Engineering and Systems Safety, Lund, 3150. 2011. Available online: https://portal.research.lu.se/ws/files/3912725/1832676.pdf (accessed on 7 February 2022).
  8. Evans, D. Sprinkler Fire Suppression Algorithm for HAZARD; NISTIR 5254; National Institute of Standards and Technology: Gaithersburg, MD, USA, 1993.
  9. Liu, Z.; Kim, A.K. A review of water mist fire suppression systems—Fundamental studies. J. Fire Prot. Eng. 1999, 10, 32–50. [Google Scholar] [CrossRef]
  10. Ministry of Business, Innovation & Employment. C/VM2, Verification Method: Framework for Fire Safety Design, for New Zealand Building Code Clauses C1–C6 Protection from Fire; Amendment 6; New Zealand Government: Wellington, NZ, 2020.
  11. VDI 6019-1; Engineering Methods for the Dimensioning of Systems for the Removal of Smoke from Buildings: Fire Curves, Verification of Effectiveness. Verein Deutscher Ingenieure: Düsseldorf, Germany, 2006.
  12. The Swedish National Board of Housing, Building and Planning’s General Recommendations on the Analytical Design of a Building’s Fire Protection, BBRAD. Boverket. 2013. Available online: https://www.boverket.se/en/start/publications/publications/2013/the-swedish-national-board-of-housing-building-and-plannings-general-recommendations-on-the-analytical-design-of-a-buildings-fire-protection-bbrad/ (accessed on 19 July 2022).
  13. NFPA 92; Standard for Smoke Control Systems. National Fire Protection Association: Quincy, MA, USA, 2021.
  14. Arvidson, M. An Evaluation of Residential Sprinklers and Water Mist Nozzles in a Residential Area Fire Scenario; Research Institutions of Sweden, Borås, Sweden, 2017; RISE Report 2017:04.
  15. Arvidson, M.; Larsson, I. Residential Sprinkler and High-Pressure Water Mist Systems; SP Swedish National Testing and Research Institute: Borås, Sweden, 2001; SP Report 2001:16. [Google Scholar]
  16. Chow, W.K. Heat release rate of an open kitchen fire of small residential units in tall buildings. In Proceedings of the 3rd International Performance Buildings Conference, Purdue, IN, USA, 14–17 July 2014. [Google Scholar]
  17. Qin, J.; Yao, B.; Chow, W.K. Experimental study of suppressing cooking oil fire with water mist using a cone calorimeter. Int. J. Hosp. Manag. 2004, 23, 545–556. [Google Scholar] [CrossRef]
  18. Vaari, J. A study of total flooding water mist fire suppression system performance using a transient one-zone computer model. Fire Technol. 2001, 37, 327–342. [Google Scholar] [CrossRef]
  19. Li, Y.F.; Chow, W.K. A zone model in simulating water mist suppression on obstructed fire. Heat Transf. Eng. 2006, 27, 99–115. [Google Scholar] [CrossRef]
  20. Wighus, R.; Brandt, A. WATMIST—A one-zone model for water mist fire suppression. In Proceedings of the Halon Options Technical Working Conference, Albuquerque, NM, USA, 24–26 April 2001. [Google Scholar]
  21. Spearpoint, M.; Hopkin, C.; Muhammad, Y.; Makant, W. Replicating the activation time of electronically controlled watermist system nozzles in B-RISK. Fire Saf. J. 2022, 130, 103592. [Google Scholar] [CrossRef]
  22. Wade, C.; Baker, G.; Frank, K.; Harrison, R.; Spearpoint, M. B-RISK 2016 User Guide and Technical Manual; Building Research Association of New Zealand: Porirua, NZ, 2016; SR364. [Google Scholar]
  23. Plumis Ltd. Plumis—Intelligent Fire Suppression. Available online: https://plumis.co.uk/ (accessed on 16 April 2022).
  24. Plumis Ltd. Automist Smartscan Hydra BS8458 Fire Sprinkler Performance. 2020. Available online: https://plumis.co.uk/smartscan (accessed on 2 November 2020).
  25. Plumis Ltd. Automist Smartscan Hydra Design, Installation, Operation and Maintenance (DIOM) Manual, version 2.00.0; Plumis Ltd.: London, UK, 2020. [Google Scholar]
  26. BS 8458:2015; Fixed Fire Protection Systems. Residential and Domestic Watermist Systems. Code of Practice for Design and Installation. BSI: London, UK, 2015.
  27. Bill, R.G.; Kung, H.-C.; Anderson, S.K.; Ferron, R. A new test to evaluate the fire performance of residential sprinklers. Fire Technol. 2002, 38, 101–124. [Google Scholar] [CrossRef]
  28. Wade, C.; Spearpoint, M.; Bittern, A.; Tsai, K. Assessing the sprinkler activation predictive capability of the BRANZFIRE fire model. Fire Technol. 2007, 43, 175–193. [Google Scholar] [CrossRef]
  29. Hopkin, C.; Spearpoint, M. Evaluation of sprinkler actuation times in FDS and B-RISK. Int. Fire Prof. J. 2019, 28, 22–27. [Google Scholar]
  30. Hopkin, C.; Spearpoint, M. Numerical simulations of concealed residential sprinkler head activation time in a standard thermal response room test. Build. Serv. Eng. Res. Technol. 2020, 42, 98–111. [Google Scholar] [CrossRef]
  31. McGrattan, K.; Hostikka, S.; McDermott, R.; Floyd, J.; Vanella, M. Fire Dynamics Simulator User’s Guide; NIST SP 1019; National Institute of Standards and Technology: Gaithersburg, MD, USA, 2019. [CrossRef]
  32. Hopkin, C.; Spearpoint, M.; Hopkin, D.; Wang, Y. Using probabilistic zone model simulations to investigate the deterministic assumptions of UK residential corridor smoke control design. Fire Technol. 2022, 58, 1711–1736. [Google Scholar] [CrossRef]
  33. Elms, D.G. Consistent Crudeness in System Construction. In Optimization and Artificial Intelligence in Civil and Structural Engineering: Volume I: Optimization in Civil and Structural Engineering, Topping, B.H.V., Ed.; Springer: Dordrecht, The Netherlands, 1992; pp. 71–85. [Google Scholar] [CrossRef]
  34. Buchanan, A. The Challenges of Predicting Structural Performance in Fires. Fire Saf. Sci. 2008, 9, 79–90. [Google Scholar] [CrossRef]
  35. Hostikka, S.; Veikkanen, E.; Hakkarainen, T.; Kajolinna, T. Experimental investigation of human tenability and sprinkler protection in hospital room fires. Fire Mater. 2020, 45, 823–832. [Google Scholar] [CrossRef]
  36. UL 1626; Standard for Safety for Residential Sprinklers for Fire-Protection Service. 4th ed, Underwriters Laboratories Inc.: Northbrook, IL, USA, 2008.
  37. Hopkin, D.; Lennon, T.; El-Rimawi, J.; Silberschmidt, V. A numerical study of gypsum plasterboard behaviour under standard and natural fire conditions. Fire Mater. 2012, 36, 107–126. [Google Scholar] [CrossRef]
  38. BS EN 1992-1-2:2004+A1:2019; Eurocode 2. Design of Concrete Structures. General Rules. Structural Fire Design. BSI: London, UK, 2005.
  39. Hopkin, C.; Spearpoint, M.; Wang, Y.; Hopkin, D. Design fire characteristics for probabilistic assessments of dwellings in England. Fire Technol. 2019, 56, 1179–1196. [Google Scholar] [CrossRef] [Green Version]
  40. BS 9252:2011; Components for Residential Sprinkler Systems. Specification and Test Methods for Residential Sprinklers. BSI: London, UK, 2011.
  41. BS EN 12259-14:2020; Fixed Firefighting Systems. Components for Sprinkler and Water Spray Systems. Sprinklers for Residential Applications. BSI: London, UK, 2020.
Figure 1. Example suppression models commonly adopted in fire modelling, including a sprinkler-controlled HRR [5], the Nystedt model [7], and the Evans model [8].
Fire 05 00144 g001
Figure 2. Visualisations of the electronically controlled water mist system: (a) controller and pump; and (b) nozzle discharging water.
Fire 05 00144 g002
Figure 3. Enclosure arrangements for the tests: (a) four walls (without fan) [A-01 to A-03 and A-05 to A-06]; (b) four walls (with fan) [A-04 and A-08]; and (c) two walls [A-09 to A-11]. Solid wall obstructions are shown in grey with dashed green lines indicating openings. All dimensions in mm.
Fire 05 00144 g003
Figure 4. Fire locations for the tests: (a) centre 1 [A-02, A-04, A-06 and A-09]; (b) centre 2 [A-03, A-07, and A-10]; and (c) corner [A-01, A-05, A-08, and A-11]. All dimensions in mm.
Fire 05 00144 g004
Figure 5. Test thermocouple locations. All dimensions in mm.
Fire 05 00144 g005
Figure 6. Nozzle arrangements for the tests: (a) arrangement 1 (A-01 to A-04); (b) arrangement 2 (A-05 to A-08); and (c) arrangement 3 (A-09 to A-11). All dimensions in mm.
Fire 05 00144 g006
Figure 7. Thermocouple plots for each test: (a) 75 mm below ceiling; (b) 1.6 m above floor level [closest to fire]; (c) 1.6 m above floor level [centre of enclosure]; and (d) 1.6 m above floor level [furthest from the fire].
Fire 05 00144 g007
Figure 8. Indicative diagram of test arrangements: (a) A-02; (b) A-03; and (c) A-04. The first nozzle to activate is indicated in red text.
Fire 05 00144 g008
Figure 9. HRR relationship adopted for the zone modelling from Hostikka et al. [35]. Dashed black line indicates modelling assumption that the HRR grows beyond 1500 kW.
Fire 05 00144 g009
Figure 10. Layer heights estimated in the zone model simulations for a sprinkler-controlled HRR.
Fire 05 00144 g010
Figure 11. Comparison of thermocouple data (75 mm below ceiling) to ULT (estimated in B-RISK model) for three suppression assumptions: (a1,a2) sprinkler-controlled HRR; (b1,b2) Nystedt model; and (c1,c2) Evans model. Solid lines indicate thermocouple data and dashed lines indicate model estimations. Subscript 1 denotes tests where rapid temperature decay was observed following system activation and subscript 2 where rapid temperature decay was not observed after activation.
Fire 05 00144 g011aFire 05 00144 g011b
Table 1. BS 8458:2015 test criteria.
Thermocouple Location
(Relative to the Ceiling/Floor)
Maximum Allowable Temperature
[°C]
75 mm below the underside of the ceiling320
1.6 m above the floor95
1.6 m above the floor55 (for not more than any 120 s interval)
Note: the maximum allowable temperature is observed up to four thermocouple locations, discussed later.
Table 2. A summary of the 11 test arrangements and nozzle activation times.
Test NumberFire LocationRoom EnclosureNozzle ArrangementFan VentilatedDetector Activation Time [mm:ss]Nozzle Activation Time [mm:ss]
A-01CornerFour wallsArrangement 1No00:3901:24
A-02Centre 1Four wallsArrangement 1No00:3101:08
A-03Centre 2Four wallsArrangement 1No00:2900:54
A-04Centre 1Four wallsArrangement 1Yes00:2801:06
A-05CornerFour wallsArrangement 2No00:3501:14
A-06Centre 1Four wallsArrangement 2No00:2700:58
A-07Centre 2Four wallsArrangement 2No00:3300:52
A-08CornerFour wallsArrangement 2Yes00:3701:06
A-09Centre 1Two wallsArrangement 3No00:2902:12
A-10Centre 2Two wallsArrangement 3No00:2602:16
A-11CornerTwo wallsArrangement 3No00:3300:53
Table 3. Nozzle activation times and maximum HRRs estimated in the zone modelling.
Test NumberNozzle Activation Time
[mm:ss]
Zone Model Nozzle Activation Time
[mm:ss]
Zone Model Maximum HRR
[kW]
A-0101:2400:44208
A-0201:0801:03309
A-0300:5401:39185
A-0401:0601:04316
A-0501:1400:18118
A-0600:5800:50239
A-0700:5200:59293
A-0801:0600:18118
A-0902:1201:20692
A-1002:1601:16551
A-1100:5300:21125
Publisher’s Note: MDPI stays neutral with regard to jurisdictional claims in published maps and institutional affiliations.

