Review

The Phenomenon of a Cathode Spot in an Electrical Arc: The Current Understanding of the Mechanism of Cathode Heating and Plasma Generation

by
Isak I. Beilis
Department of Physical Electronics, School of Electrical Engineering, Faculty of Engineering, Tel Aviv University, Tel Aviv 69978, Israel
Plasma 2024, 7(2), 329-354; https://doi.org/10.3390/plasma7020019
Submission received: 15 February 2024 / Revised: 22 March 2024 / Accepted: 22 April 2024 / Published: 26 April 2024
(This article belongs to the Special Issue Latest Review Papers in Plasma Science 2023)

Abstract

:
A vacuum arc is an electrical discharge, in which the current is supported by localized cathode heating and plasma generation in minute regions at the cathode surface called cathode spots. Cathode spots produce a metallic plasma jet used in many applications (microelectronics, space thrusters, film deposition, etc.). Nevertheless, the cathode spot is a problematic and unique subject. For a long time, the mechanisms of spot initiation, time development, instability, high mobility, and behavior in magnetic fields have been described by approaches that caused some controversy. These spot characteristics were discussed in numerous publications over many years. The obscurity and confusion of different studies created the impression that the cathode spot is a mysterious phenomenon. In the present work, a number of typical representative publications are reviewed with the intention of clarifying problems and contradictions. Two main theories of cathodic arcs are presented along with an analysis of the experimental data. One of the approaches illustrates the cathode heating by Joule energy dissipation (volume heat source, a sharp rise in current density, etc.), nearly constant cathode potential drop, and other certain initial conditions. On the other hand, a study using a mathematically closed approach shows that the spot initiation and development are determined not by electron emission current rise but by a rise in arc power density, affecting heat sources including the energy of ion flux to the cathode (surface heat source).

1. Introduction

Electrical current in metallic conductors is well studied and described by a linear relation between current and applied voltage predicting the state of an electrical circuit [1]. However, when the conductor is interrupted, the electrical current in the gap between two parts of the conductor can be initiated by the electrical breakdown of the gap. When voltage is applied, there are two parts of the conductor, named electrodes; the negatively charged electrode is the cathode, while the other positively charged electrode is the anode. The current continuity in the gap may be supported by electrical discharges of different types depending on the type of surrounding gas, its pressure, current strength, and voltage. At low current (<1 mA) and large voltage (<1 kV), there are Townsend, Corona, and Glow discharges [2,3,4]. When the current increases above approximately 1 A and higher, a discharge appears that is characterized by a low voltage of 10–30 V depending on electrode materials and a high current density, defined as an electrical arc [5,6,7]. The plasma of the discharges is distributed with specific characteristics in the cathode and anode regions, as well as in the interelectrode gap. Such plasmas are known in many applications.
Application Details: The ionic flux from the low-current corona discharge, possessing the features of silent operation and no moving parts, is used for a wide range of applications [8]. The glow discharge is used for illuminating equipment in spectroscopy to analyze the composition of the materials, known as glow-discharge optical emission spectroscopy, as well as for cleaning systems [9,10,11]. Electric arcs are the classic thermal source due to operation at large currents and, therefore, could be used in metallurgy [12,13], powder [14], and welding [15] technological industries. The use of vacuum arcs is the result of this discharge being an excellent source of metal plasma, propagating in the form of highly ionized and high-energy jets [16,17]. The vacuum arc is used for vacuum switches [18], and the metallic plasma is used for thin-film deposition [19], tool coatings [20], ion implantation [21], and spacecraft thrusters [22]. One of the important processes in microelectronics is the production of metal connections between different parts in integrated circuits. These interconnections are in the form of trenches or vias etched in a dielectric material, and they need to be completely filled with metal, which is successfully achieved by using arc plasma [23,24].
Vacuum arc plasma can produce larger deposition rates than sputtering and electrolysis. However, by using a conventional cathodic vacuum arc, the coatings are degraded by macroparticles (MPs) produced as a part of the cathode process [25]. Different modifications are used to reduce the presence of MPs in vacuum arc plasma sources. One approach for them is the fully ionized plasma beam produced by a pulsed (repetition rates are adjustable from more than 100 Hz down to a single pulse) high-current vacuum arc transported through a curved magnetic duct [26].
Magnetically filtering a DC vacuum arc can significantly reduce MP contamination; it also significantly reduces the deposition rate and involves using a complicated and bulky apparatus [19]. To overcome these difficulties, another technique uses arc modes where MP generation is repressed in two types of plasma sources developed in the last few decades. For the first type, a simple electrode configuration is used with a nonexpendable hot refractory anode vacuum arc (HRAVA), which has an open gap between the parallel anode and cathode surfaces. For the second type, a vacuum arc with a blackbody assembly (VABBA) is used, which has an interelectrode cavity enclosed by a hot cup-shaped refractory anode with one or more plasma exit apertures [27]. The plasma flux generated with these techniques is mostly without MPs and produces larger deposition rates than when using magnetic filtering as well as the sputtering and electrolysis methods.
General Problem Formulation: The mentioned arc utilization for wide applications requires a deep knowledge of the mechanism of metallic plasma generation in the arc in order to control the plasma density, expansion, and distribution. Study observations showed that in a vacuum arc, a relatively large power density concentrating at minute areas on the cathode surface, called cathode spots, produces the plasma. A large power density is required in order to localize significant heat of the cathode to temperatures high enough for the generation of a conductive plasma in the vacuum gap. Plasma is produced due to cathode thermal action, electron emission, and metallic atom ionization.
Attempts to understand spot problems have been outlined in different publications over many years. The sometimes doubtful results of different studies create the impression that the cathode spot is a mysterious phenomenon. Below, the typical publications are analyzed in order to present the problems and describe the weakness of the existing theories of cathodic arcs. This will be carried out by numerical estimations, solution of a system of equations, and analysis of experimental data. The main difference in the theoretical approaches is related to the models of cathode spot heat evolution and mechanisms of plasma generation. One of the research groups takes into account specifics of the cathode surface under the primary plasma, high-current electron emission, and Joule heating (volume heat source), resulting in local exploding and new plasma plume formation. Another research group takes into account the cathode heat regime, including the ion energy flux from the primary plasma (surface heat source) and the cathode vapor ionization for cathode plasma reproduction.
In order to understand the mechanism behind the problem indicated above, we briefly consider the experimental data and describe different theoretical models of cathode spot mechanisms (previously covered in detail in Refs. [16,17,19]). The main intent is to explain how an agreement between the measurements and corresponding calculations can be reached. For simplicity, the results will be related to the copper cathode, which has been studied widely in previous studies.

2. Experimental Data

One type of experiment reported the arc characteristics, which are possible to measure relatively precisely. These include electrical data, namely the threshold arc current (1.5 A) [28,29], cathode potential drop (uc = 15 V) [28,29,30], arc voltage (uarc = 20–23 V) [31,32,33], as well as arc plasma data, namely the jet velocity (106 cm/s) [17,31,34], ion energy/unit charge (30–37 eV) [31,33], ion current fraction in arc plasma jet (~0.1) [35,36], and erosion coefficient (Gk = 0.05–0.1 mg/C) including the mass loss in form of ions and macroparticles [36,37,38,39]. High-frequency oscillations of the arc voltage at low arc currents (I < 10 A) were observed [29] as peaks above the cathode potential drop. The oscillation amplitude decreased with the arc current.
The second type of experiment is concerned with the cathode spot phenomenology—the macroscopic spot behavior on the cathode surface. The main observations have been high-speed optical recording of the luminous region of the spot. The cathode spot behavior was investigated for a wide range of experimental conditions, which included the arc current, pressure, and cathode material [37,40,41]. One of the important spot parameters that are widely discussed in the literature is the spot current density. Kesaev [29] reported for Hg a current density of 5 × 10⁴ A/cm2 and some data for spots on film cathodes. A number of investigations used modern high-speed imaging equipment, including the studies by Rakhovsky [37], Djakov and Holmes [42,43], Siemroth et al. [44], Jüttner [45,46,47], Anders et al. [48,49,50], and others, which reported a wide range of values j, from 5 × 10⁴ to 108 A/cm2.
The observations indicate that the spots appeared in different types. At arc initiation in the range of arc current 100–300 A, superfast (up to 103–104 cm/s at the polluted surface) and fast (up to 103 cm/s at the clean surface) moving cathode spots with lifetime < 1 µs appeared on different metallic cathodes [47]. With an increase in current and the presence of a vapor or gas pressure at long arc pulse duration, a low velocity and long lifetime of the spots were observed. Moreover, it was shown that the slowly moving spots appeared 100–200 µs after discharge initiation and more readily with increasing pressure and arc current. Under vacuum, at times greater than 100 µs, a few spots could be located close to one another, producing a low-velocity “group spot”, while other group spots were observed at high velocity in a magnetic field. The spot current on the bulk cathode can be varied up to about 100 A [42,43], in a range of 5–10 A in a fragment of spot, and about 100–300 A in a group spot (at large arc current) consisting of several fragments [37].
Previous studies [28,29,37] have shown that, during motion, the cathode spot can disappear and reappear, and splitting changes the number of spots by separating the new spots away from each other. The experiment ([51] and Figure 6 therein) was carried out for a vacuum arc of 200 A current with an Al cathode and showed spot splitting, indicating different separation distances depending on the splitting time. According to the observation of the distance and time of separation, the estimated spot velocity was 7.6 × 102 cm/s between two spots at 0.33 ms and 6 × 102 cm/s at 1.17 ms from the beginning of the splitting. Figure 1 illustrates the view of the spots obtained in accordance with the methodology described previously [51].
A special type of spot appeared on metallic films deposited on a substrate, which occurred due to operation with low ionized metal atoms (in comparison to oxide films) and very low energy loss by film heat conduction. On films using Cu and Hg cathodes, the spot current was relatively low 0.1–1 A [29].
For a long time, spot types were defined in the literature by numerical names such as 1, 2, 3, etc. [37,44,45,46,47]. However, as it turned out, numerical names repeated the same numbers for different types, confusingly defining the real spot characteristics observed in different physical conditions. Such duplication occurred between spots that appeared on clean or not clean (oxide) cathodes, as well as those spots that appeared under weak vapor pressure caused in the electrode gap by a high-current arc [16].
To overcome this indeterminacy, another spot classification was proposed previously [16], in which instead of numerical names, each spot type was unambiguously described by the spot characteristic observed in typical conditions. Study observations indicate that the spots appeared in different forms, whose types can be defined according to lifetime t, spot current Is, and spot velocity vs. Some principal characteristics of spot types (summarized the above description of the experimental data) are presented in Table 1 including spots that named as superfast (SF), moderate fast (MF), appeared on film cathode (FiS), group (GS) and individual spot (IS) appeared in gas filled gap. Specific types of spots are determined based on arc current, cathode material, and cathode surface characteristics (e.g., oxide film, roughness).

Specific Problem Formulation to Explicitly Understand the Experiments

Study observations show that cathode spots produce characteristic erosion traces on the metal surface, indicating that the cathode was sufficiently hot under the luminous area, which in essence is a plasma radiating due to local electrical energy dissipation. Therefore, the following question arises: What is the cathode spot? In other words, what are the causes that lead to the spot appearing in the form observed experimentally, namely, with a small area, high current density, and high local energy dissipation? These characteristics provide spots with a relatively high cathode temperature, which supports the required intensity of electron emission and dense plasma for spot operation. Let us consider the spot study development to answer the abovementioned question.
Early experimental studies have provided limited information about the behavior of spots, their small sizes, and dramatically very high or low mobility on the cathode surface. Another surprising observation is the observation of extremely high-velocity plasma jets having kinetic energy exceeding the cathode voltage. All the abovementioned surprising observations and the discovery of inexplicable spot motion in an anti-Ampère law direction in a magnetic field, as well as spot appearances in unpredictable different forms, created a somewhat mystic and enigmatic impression about cathode spots. There are a number of reasons for this early limited knowledge. First of all, this is due to imperfections in early techniques related to the temporal and spatial resolution of optical systems and limited techniques for the detection of surface phenomena. On the other hand, our theoretical understanding has been limited due to limited data and a weak understanding of the related plasma phenomena.
After modern diagnostics, which were developed in the second half of the 20th century, new important experimental knowledge about different arc types and cathode spot characteristics emerged [7,29,52]. The improvement in our theoretical understanding has been achieved due to the comprehension of plasma phenomena and considerable development in plasma science [5,53,54,55], including knowledge about elementary particle collisions [56,57,58], heat conduction phenomena in solid bodies [59], the kinetics and rate of metal vaporization [60,61], and the electron emission processes on the cathode surface.
At the same time, theoretical studies are still based on approaches suggesting different models of spot development. In spite of the improvement in the experimental data, an interpretation of the measurements led to essential contradictions, and as such, a description of the near-electrode phenomena is still needed for better understanding. Thus, the main specific problems are related to cathode spot formation with small spot size, understanding the spot features characterized by high mobility, high plasma density, low cathode potential drop, its time dependence, current density, high plasma jet velocity, the existence of different spot types, and the spot motion in a transverse magnetic field.
According to Miller’s review [62], cathode spot theoreticians are divided mainly into two groups based on how they explain the time dependence of the current continuity mechanism. It should be emphasized that, in essence, the main difference between the published theories is the distinction between the models of cathode heating that are described, the plasma–cathode transition (surface source), or the current flowing through some protrusion on a rough cathode surface (volume source). The volume heat source is formed due to Joule energy dissipation, while other surface heat sources are supported by the energy flux flowing from the triggered plasma, namely, the ion and electron energy in the space charge region, and they are generated at the plasma–cathode contact.

3. Evolution of the Spot Theory and Spot Mechanism Understanding

A detailed analysis of the different theoretical approaches was conducted previously [16,17]. In this review, in order to understand and discuss the main questions of the models and present some arguments, we will briefly consider the main publications describing the principles of cathode spot mechanisms.

3.1. General Cathode Phenomena and Mathematical Description

Electrical current is conducted in the vacuum gap when an electrically conductive medium is produced in the gap between electrodes. The primary attempts to explain the nature of the current begin with the hypothesis of charged particle emission from the cathode via electron emission. Electron emission occurs either due to the Richardson law of thermionic emission or electron emission due to a high electric field (derived from Mackeown’s study [63]). Electron emission forming near the cathode surface leads to ionization processes of the cathode vapor. In order to understand the nature of this process, numerous seminal studies were performed in the past century. In 1961, Ecker [64] reviewed numerous studies that proposed cathode evaporation models. All these were earlier attempts to solve the phenomena of strong plasma contraction at the cathode surface, which was observed in experiments in the form of a cathode spot on the basis of electron emission and vapor ionization.

3.2. Vaporization Model: Primary System of Equation with Limited Conditions

In 1961, Lee and Greenwood [65] formulated a system of equations by taking into account cathode heating by ion flux from the cathode plasma, atom evaporation, and cathode electron emission. This initial attempt focused on the description of these cathode processes in a unified approach, leading to a quantitative characterization of the cathode spot phenomenon. In this approach, five important dependent variables are determined, namely, (1) the temperature Ts of the cathode spot, (2) the electric field E at the cathode surface, (3) current density j, (4) the electron current fraction s, and (5) the radius of the circular spot rs. The abovementioned physical processes can be determined from four well-known equations in the following forms:
  • Mackeown’s equation indicates a relation between E, j, s, and the cathode potential drop uc in the cathode [63].
    E = 4 ε 0 j u c 0.5 ( 1 s ) m i 2 e 0.5 s m e 2 e 0.5 0.5
  • The equation of the current density of electrons emitted from the cathode in its general form depends on Ts and E:
    s j = e N x ( ε e , T s ) D ( ε e , E ) d ε e
    where D(E,εe) is the probability that an electron with energy εe will emerge from the metal, and N(εe,T) is the supply function.
  • The energy balance equation takes into account the power input to the cathode spot by ion kinetic and potential energy and the dissipation powers by thermal conduction into the cathode, which is determined by a steady-state solution to the heat conduction equation [59], vaporization determined with the Dushman equation [60], the cooling effect of electron emission, and radiation.
  • All variables are treated as constants over the spot area and it is assumed that the distribution of the current density in the cathode spot is uniform. The following equation of the total spot current Is is used:
    I s = j π r s 2
As the above system of equations does not have a closure, two limiting conditions are used to determine the possible values for the fifth unknown. One is the criterion for the atom–ion balance, i.e., the ion flux cannot exceed the evaporated atom flux. The second limiting condition indicates that the vapor pressure gradient does not exceed the force due to self-magnetic field interactions with the current density. Based on those considerations, the main obtained result indicates that a minimum current is in the order of 2–10 A, and the current density obtained for Cu is 105–106 A/cm2 with the electron current fraction s = 0.5–0.7. The authors indicated that for a cathode material like copper, the atom–ion balance is a more limiting factor than the self-magnetic influence. Due to the necessity of satisfying the energy balance, the current density calculated was very high at the cathode spot on a refractory material, thus increasing the role of the criterion related to the magnetic force.
Ecker [64] paid attention to the problem that too many difficulties and uncertainties occur in describing such a mysterious subject as the cathode spot. Therefore, he instead suggested searching for a possible solution by using relationships that limit the range of possible existing spot parameters. He named this approach the “existence diagram”, or the “E-diagram”, which initially was employed to study the effect of discharge contraction in electrodes [64]. From a large number of dependent variables describing the cathode in a vacuum arc, the cathode temperature in the spot T and the current density j are those of predominant interest, both experimentally and theoretically. Therefore, the diagram is presented in a T-j plane [66,67], as shown in Figure 2. To this end, Equations (1) and (2) are solved together with limiting relations. The first relation indicates that the number of ions produced in the plasma determines the ion flux from the plasma. This is the case when the entire energy of the emitted electrons acquired in the sheath is spent on vapor ionization. This means that the calculated ion current density is maximal, and this relation determines the lower limit of the temperature (Tcc).
The second limiting relation is the atom–ion balance, which determines the upper limit of the ion current density (Tec). The third relation is the cathode energy balance (Tnc). Both the second and third relations were also used previously in [65]. The calculated temperature (Tnc) has an upper limit because the energy accommodation coefficient is assumed to be unity. Figure 2 illustrates an example of the cathode temperature’s dependence on current density variations for the mentioned three cases, bounding a possible area of values T-j. This area is large for a large current (~100 A) but is significantly reduced when the spot current decreases and approaches a point at a specific minimal current, which for Cu is similar to that obtained from the solution in [64]. The calculations were provided for cathode materials with a wide range of thermophysical properties (Cd, Zn, Bi, Sb, Ag, Sn, Cu, Cr, Ni, Fe, Ta, Mo, and W). The E-diagram approach with the T-j area was developed for different input spot characteristics (spot time, cathode potential drop, surface roughness, etc.), which was previously discussed in detail [16]. The problem with this approach is the relatively large bounding area in the T-j plane depending on the arc current and its sensitivity to the cathode material’s properties under a small current (for more detail, see [16]).

4. Explosive Phenomena in Electrical Discharges

A long time ago, a number of researchers started to think that arcing is supported by local explosive phenomena on the cathode surface. Rotshtein [68] considered an analogy between a wire explosion and the spot as an exploding conductor and modeled the generation of spot plasma as a local metal explosion in the spot area. In the second half of the past century, the explosive mechanism was revised due to an enhanced understanding of physical phenomena through electron emission of emitters using high-voltage techniques.

4.1. Exploding Phenomena by High-Voltage Application: Explosive Electron Emission (EEE)

The early studies of electron field emissions (F emissions) during a high-voltage application to a needle-shaped emitter (cathode) showed the destruction of the emitter and transition to an arc. The emission was associated with the Joule overheating of the emitter. A previous study indicated that when the electric field is significantly high, and the current density from a tungsten emitter is continuously increased, the normal emission is terminated by an explosive phenomenon [69]. Flynn [70] studied this explosive phenomenon. He showed that the current density of the electrons emitted from the exploding plasma, expanding with velocity v to the anode (initiating the arcing) in a gap of width d, can be obtained in the framework of the electron space–charge limitation approach as follows:
j   ~   U 3 / 2 ( d v t ) 2
Over time, experimental diagnostic systems were improved with respect to a higher time resolution and nanosecond pulse techniques [71]. Nanosecond experiments with a needle-shaped emitter detected a local luminescence at the cathode, indicating explosion points, plasma formation, and its expansion during a few nanoseconds. As a result, a significant increase in current was observed. It was shown that the electron emission from the cathode during an explosive transition of metal into the plasma determines the rise in the electron current in the gap. This phenomenon was named explosive electron emission (EEE), which was widely investigated [72,73,74,75]. The main result showed a relationship between the time delay td at the moment of tip explosion after voltage application and the current density during the explosion in the following form:
0 t j 2 ( t ) d t = j 2 t d = k exp × 10 9 A 2 s cm 4
It was shown that j2td was constant in a large range of different conditions, and for tungsten, tip kexp = 4; for Cu, it is 4.1, and for other metals, it is in the range of 2.8–1.4. This phenomena of EEE were studied in detail in Ref. [76], which had an important influence on subsequent investigations and the prediction of high-voltage (~up to 100 kV) breakdown processes.

4.2. Explosive Electron Emission Application in the Cathode Spot Mechanism

Two phenomena were used to characterize the cathode spot mechanism. In the early stage, the phenomenon of EEE was assumed to explain the spot periodically appearing as a series of micro-explosions of the tip on the rough portion of non-ideally flat cathode surfaces [77]. The main motivation was based on the transient characteristic of the EEE phenomenon and the periodicity of spot birth and death. However, the phenomenon of EEE was observed in experiments at a high voltage (>30 kV, see above) due to the Joule heating of small spikes for conditions of relatively large gap size compared to the size of the spike (i.e., large field enhancement factor). In the case of a vacuum arc, cathode spots occurred under only about 20–30 V, and the electric field at the cathode surface was significantly smaller with respect to that of a high-voltage application. The calculations showed that the thickness of the space charge region (~0.01 µm) was significantly smaller relative to the protrusion sizes (~1 µm) [16]. Therefore, the field enhancement factor was near zero, and the probability of reaching the critical explosive electric field of Ecr = 108 V/cm was vanishingly small.

4.3. Further Development of the Explosive Approach and Emission Center Formation

At later stages, a modified version of protrusion Joule heating was developed by taking into account the presence of an initial plasma that was already formed by a single explosion as a result of high-current field emission, the breakdown of dielectric inclusion, or some other mechanism. As a result of plasma action, some conditions develop on the surface causing the occurrence of Joule heating, high-current electron emission, and the formation of a new emission center (EC) [78]. To study the parameters of the EC, including its lifetime, the cathode geometry was modeled in two ways: (a) conical protrusion with half angle θ at the top and (b) a crater at a plane surface, i.e., with θ = 90° (Figure 3). A system of equations was considered (in essence, following the approach used in [65] and a different cathode geometry) including the following equations [79]:
  • For simplicity, the heat conduction equation is presented here only with the main term (right side) of Joule heating as the volume source, which is expressed in the following form:
    c γ T t i 2 ( t ) ρ r ( T ) π 2 r 4 ( t )
    where γ is the density of the cathode material, c is the specific heat, and ρr(T) is the resistivity of the cathode;
  • The Mackeown equation for the electric field (Equation (1));
  • The equation of thermionic electron emission with Schottky effect, i(t).
The boundary conditions for the heat conduction equation are described by the energy fluxes transferred by evaporating atoms, electron emission, and the ions transferring from the plasma to the surface. It was assumed that the radius of emission changes from its initial value, which is typically a very small value of R0 = 0.1 µm. The time-dependent increase in the Joule heating intensity of the cathode was supported by an increase in the time-dependent current of thermionic electron emission enhanced by the electric field as well as the increase in the cathode temperature with time. The current extracted from the cathode was specified to be linearly rising with time (dI/dt = const) or a constant value, which was determined as a value limited by the external electric circuit system. The rate of cathode evaporation was determined based on an exponential dependence on the surface temperature. It was noted that, with time, the emission zone increases in size, resulting in a reduction in the current density and, therefore, a reduction in the intensity of the Joule heat source.
In addition, energy is dissipated due to cathode heat conduction, evaporation, and electron emission. As a result, the cathode temperature decreases with time. Therefore, the current ceases, but up to this time, a short-living portion of electrons is generated. This short ejection of the electron portion is defined as an EC (later as ECTON). The results showed that the initial cathode temperature reached more than 30,000 K, and the lifetime of the EC was up to about a few nanoseconds depending on the given limiting arc currents. The current density remained extremely high (~109 A/cm2) during the lifetime of the EC. It was found that the EC at a plane Cu cathode could be developed only at a current rise not lower than 1011 A/s. The calculation shows that for a limiting current of 20 A, the lifetime was about 1 ns, while the EC final radius was r = 0.33 µm and T = 10,000 K.
The above model was improved later [80] using a system of magnetohydrodynamic equations (a system of equations previously developed to describe the mechanism of EEE [81]), calculating the heating of Cu cathode microprotrusions with the radius varying between 0.2 and 0.4 µm for a 3.2 A current, which was determined by an external resistance. Under these conditions, in essence, the initial current density was again significantly large, ~109 A/cm2, and obviously led to a significant increase in the temperature of the protrusion and, therefore, to an intense rise in the thermionic electron emission.
Another study [82] used a similar system of equations but modified the calculations of the current density in the protrusion and the ion current density. For a copper cathode, the following arc parameters were given: a cathode potential drop of 16 V, ion (double charged) ionization potential of 18 eV, high plasma density, and electron temperature. The result contrarily revealed continuous cathode temperature growth. The computation was performed until the maximum temperature in the protrusion reached a critical metal temperature (see also [80]). This is a metal temperature at and above which the vapor of a metal cannot be liquefied, no matter how much pressure is applied; for Cu, it is 8390 K. In this case, the author chose to perform further modeling of the process development expanding it to the explosive phase and the development of the EC.

4.4. Fractal Approach

Anders [17] noted that the cathode spot is a complicated subject, with no simple understanding of its operation, and he suggested considering that “a cathode spot is an assembly of EC showing fractal properties in spatial and temporal dimensions’ captures the essential elements”. It was indicated that spot ignition through explosions and forming an EC might be considered an elementary step. “The assembly of fragments exhibits fractal properties, and the individual steps are the small-scale, short-time cutoffs of spatial and temporal self-similarity”. Fractal theory, first introduced in 1975 by Mandelbrot as an ideal tool for studying applied mathematics, models a variety of phenomena from physical objects. Fractal theory has given rise to a new system of geometry that has had a significant role in physical chemistry, physiology, and fluid mechanics. Of course, it is useful to apply this theory to consider spots’ appearance as an assembly, as well as the initiation and development of this assembly. As the EC model still meets a number not understood using points, the fractal approach can be developed on the basis of some other mechanism of spot appearance. Nevertheless, the following question arises: what is the mechanism (model) that can adequately describe the experimental observation of spots and the mechanism of current continuity in the spot?

4.5. Specifics of the EC Model

Let us consider the assumption used in the abovementioned EC model regarding the initiation of a preliminary explosion to generate a preliminary plasma, initially assuming a very high current density > 107 A/cm2 ([79], ch.22). This assumption is strongly questionable during arc operation with a low cathode potential drop (see below). However, if even such plasma is formed, none of the plasma properties and initial currents are discussed as initial conditions for Equation (6). The fact of a sharp increase in the initial temperature, indicated as more than 30,000 K can be explained that it occurs due to a small initial size R0 = 0.1 µm. In the case of currents of about 10–100 A, indicated as limited value by the electrical circuit, the current density is also very large (j~I/π R02), at 1010–1011 A/cm2. It is certain that such a large current density and increasingly high Joule heating will lead to high cathode temperatures and electron emissions calculated at short time scales. It was suggested [79] that the assumption of a small initial size R0 is associated with the observation size of craters left on the cathode surface after extinguishing the arc. However, such an assumption does not conform to the sizes observed in the arc on bulk cathodes. The most probable diameter of craters measured as a value depending on the arc current is shown in Figure 4, which is obtained using data from Daalder’s measurements [83]. It can be seen that, according to the experiment, the most probable diameter of the craters is significantly larger than the size assumed in the calculations of the above-described EC model. The craters observed for cathodes covered by a thin film (2–100 nm) of two oxide Cu can reach a size of 0.1 µm, but in this case, the current per crater is low, in the range of 6–10 mA [84].
The authors explained that, initially, the EC is strongly overheated because of the sluggishness of the evaporation process. However, the sluggishness phenomenon and its influence were not studied. Note that atoms evaporated in time R0/vth = 10−5 cm/105 cm/s = 10−10 s, i.e., in less time than the lifetime of EC. Moreover, the evaporation process is not important due to, in essence, the assumption of an initially large current density and using evaporation for cooling the EC at the next nanosecond step. It was indicated that the large current density remained 3 × 10⁹ A/cm2 until the end of EC lifetime (1 ns). This conclusion contradicts the results of Rich [85], who showed that Joule heating in the arc cathode spot significantly dominated at current densities larger than 107 A/cm2 and could support enough temperature for cathode vaporization, vapor ionization, and thus, an increase in spot lifetime.
At the same time, as indicated, toward the end of EC lifetime, the cathode temperature (10,000 K) is much larger than its critical temperature (~8390 K, see above). The vapor pressure calculated at such a temperature is a few orders of magnitude larger than that at the boiling temperature (2870 K). As a result, it can be assumed that, at the mentioned temperature, a very large plasma density is generated, which will obviously support the intense heat regime and lengthen the process without forming the EC. In addition, the cathode evaporation flux in the spot region is subsonic [86], and therefore the cathode mass loss, determined in the EC model by sound flux, was overestimated. In this framework, the authors’ conclusion about the negligible role of the energy flux of the ion current is not understandable, as it is considered to be arbitrary in the model. Taking into account the mentioned high temperature, at which the plasma density can reach more than 1021 cm−3, the estimation of the ion current density indicates a significantly large value ji = envT = 1.6 × 10−19 C × 1021 cm−3 × 105 cm/s = 107 A/cm2. Therefore, it is doubtful that the protrusion with the EC can be cooled.
Note that many researchers have described the cathode phenomena by mainly copying the stages of Joule heating and referring to the sources of EEE and EC without a detailed analysis of the explosion mechanism but rather as a known fact (like a black box) related to the existence of cathode spots.
Problems of EC initiation: Let us consider the main problem related to the condition of pre-explosion (assuming EEE initiation) in order to support the continued EC development. One of the approaches is based on the assumption that the initiation of a new micro-explosion occurs due to the effect of geometrical enhancement of the current density arising when a microprotrusion is covered by the plasma (considering a certain ion current density ji for the cathode) that remains from a previous EC. According to the assumption of the explosive model [79], the enhancement coefficient ken is defined as ken = St/Sc, where St is the total surface area of the jet that can be considered a protrusion, and Sc is the contact area through which the current I enters the cathode with a current density of jiSt/Sc. It should be noted that, usually, in practice, the value of ken is not large. In particular, the authors of [87] indicated that this effect is questionable because an estimation based on the measured data does not satisfy the conditions for the explosion of micropoints.
The second method is based on the above-defined current enhancement that was discussed in conjunction with liquid-metal protrusion (named liquid-metal jet), produced at the rim of the craters, which are the cathode erosive structures after the arc is extinguished. A liquid protrusion during its interaction with the cathode plasma proceeds in two stages [79]. According to the model in [79], first, the protrusion was heated by plasma ions, reaching a temperature of 3500–4000 K, which was estimated using a high-ionized plasma density of 1020 cm−3 at an electron temperature of a few eV in the plasma remaining from the previous EC. During the second stage, resistive heating became substantial as the emission current density increased with temperature. After that, it was indicated that the emission current density j at the liquid-metal protrusion reached 108 A/cm2. This current density at the protrusion base was geometrically enhanced further by a factor ken. This factor also depends on the size of the neck generated during the formation of the drop metal jet. The delay time to the jet explosion, td, was estimated as a few nanoseconds from Equation (5), namely, j2td = 109 A2s/cm4, considering j = 109 A/cm2. Note that this time delay was only at the second stage and was obtained assuming an arbitrary value of j. Additionally, Equation (5) was used to describe the explosive electron emission (EEE) of a protrusion under a high voltage at the breakdown stage and not under a low voltage arc. Taking into account the heating process at the first stage, the total time delay is significantly larger; moreover, this stage is questionable. Let us analyze such a possibility of EC initiation.
It should be taken into account that the liquid protrusion at the temperature of 3500–4000 K and the plasma density of 1020 cm−3 significantly changes the geometry under the plasma pressure of P = nkBTe = 100 atm for Te ~1 eV, n = 1020 cm−3, and kB is the Boltzmann constant. Considering F = PS = mdv/dt and taking into account dv~v, dt~t, the velocity of the melting mass m is v = PSt/(γSh). As a result, we can easily roughly estimate the correlation between the velocity v and time t of the melting metal ejection from the spot area in the form of v = 107t/hm. It can be deduced that, for a liquid protrusion of about hm = 1 µm, the velocity reaches about 102–103 cm/s with the time increasing from 1 to 10 ns, respectively. One can conclude that, under this condition, the liquid metal protrusion can vanish (schematically shown in Figure 5 before (left) and after (right) plasma action) before its further temperature increase at the second stage and therefore does not lead to any explosion.
In addition, in order to understand the problem of the mentioned current enhancement, let us quantitatively consider this effect for a cylindrical configuration with radius ren and length hen located at the cathode surface. In this case, the coefficient is ken = St/Sc = (πr2en + 2πrhen)/πr2en = 1 + 2hen/ren. Taking into account a plasma density of 1020 cm−3, and a thermal ion velocity of about 105 cm/s on the surface, the ion current density in the cathode is ji~106 A/cm2. Thus, to reach a current density of 109 A/cm2, which is required to generate a new EC, it is required that ken~103. It is difficult to state that, in most cases, the relation hen/ren will reach such a large value under the abovementioned large plasma pressure. At a lower plasma density, ken will increase, i.e., for 1019 cm−3, the ken value needed is 104, etc.
Drop formation and a neck appearing between the drop and the liquid protrusion were considered to explain the formation of new micro-spikes when studying high-voltage breakdown phenomena [76]. This neck formation was used to estimate the enhancement coefficient of the ion current density to explain the initiation of a new EC [79]. Assuming drop formation at the end of the liquid jet and the neck being generated during drop detachment, the estimations ([79], ch.13) show that ken can reach a significant value at the neck given an arbitrary very low drop radius of 0.02 µm. This idea demonstrates once again the existing strong tendency to establish a condition at all costs upon which to base the explosive model. This condition is determined in spite of the large plasma density and ion current density assumed to exist surrounding the protrusion and the droplet, causing their extensive heating while at the same time neglecting their deformation or destruction due to which any explosion becomes impossible. Probably, under such a condition, the temperature can increase to a high level, which would be enough for spot modeling considering evaporation and ionization processes even in the framework of the simple model presented in [65]. Therefore, it can be suggested that the probability of new EC initiation taking into account only the effect of current enhancement is not large in most cases, especially for materials like Cu and volatile materials.
Charging of dielectric impurities: Another mechanism for new EC initiation under the cathode plasma considers the effect of the charging of a dielectric film on a polluted cathode surface. In this case, the plasma ions moving toward the surface produce an electric field in the film. It was suggested that when the film covers the surface of a cathode with metal microprotrusion under the film, the breakdown of the dielectric film initiates the EC [79]. The charging of a dielectric film has been widely studied [76,88,89]. The thermal and electrical mechanisms of breakdown for different dielectric films were observed. The indicated duration of a breakdown is usually in the µsec range. Hancox [90] studied the breakdown of alumina inclusions of 1 µm size in applied voltages in the range of 300–2000 V, under a low pressure of hydrogen, helium, nitrogen, and argon. He showed that a relatively large time lag of 10 µs before arcing occurred, which did not depend on the applied voltages larger than 300–400 V at an ion current of 3 A/cm2 (plasma density ~1014 cm−3). Taking into account the high applied voltage, the alumina breakdown condition (sufficient electrical field is about 3 × 10⁶ V/cm) was fulfilled and probably one of the possibilities explaining the local heating due to a sufficiently high thermal energy flux, leading to arc ignition.
Minnebaev et al. [91] studied the charging of dielectric targets, such as oxides (SiO2, Al2O3) and organic polymers (Teflon), as well as freely suspended isolated metals, under the influence of irradiation with positive ions (Ar+) with energies of 0.5–10 keV. The dielectric targets were charged to high potentials close to the potential of the ion source. An interesting result was reported: the equilibrium charging potentials of all classes of dielectrics were approximately the same, reaching high energies of bombarding ion values slightly lower than the breakdown voltage of about 106 V/cm.
Borisov et al. [92] experimentally studied the breakdown from a negative electrode placed in an arc discharge plasma in the presence of dielectric films on the electrode. The measurements showed that the breakdown was absent when the applied voltage to the electrode was in the range of 60–80 V. The breakdown occurred, and the delay time decreased from about 1000 to about 30 µs with the voltage increasing from 100 to 200 V, depending on the current of the based arc and the electrode material. Thus, the above studies show that the breakdown of dielectric films on the electrode surface occurs at a relatively high voltage of at least 100–300 V and larger [76].
Now let us consider dielectric inclusions on the surface and the possibility of the formation of the EC. It is obvious that, in the area immediately near the spot operation, all thin dielectric inclusions will be evaporated under a high energy density of the spot. A simple estimation of a time when the cathode protrusion of 1 µm generates a Cu melting temperature of ~103 K is determined as t = cγhTm/jiuc~10−8 s, with c = 0.385 J/g and a plasma density of ~1020 cm−3, i.e., ji = 106 A/cm2. As an example, also for the melting of CuO, it can be deduced that t = 5 × 10⁻⁸ s, with c = 1.08 J/Kg, γ = 6.315, Tm = 1600 K, and size 1 µm. These approximate estimations show that the cathode spot initiation and its motion can occur during the evaporation–ionization process due to a rough Cu surface and also due to the dielectric impurity of the surface.
In addition, even if the breakdown of a dielectric occurred far from the previous spot, any new EC on the surface with a metal microprotrusion could not be initiated under the condition of the low voltage of a vacuum arc (uc~20 V), as postulated in [79]. Under a relatively low plasma density (far from the spot), the electric field, which arises in the sheath on the surface, is far from the value necessary for EC initiation. For example, even at a plasma density of ~1018 cm−3 (or even for an ion current density of ~106 A/cm2 derived from the plasma), the electrical field < 107 V/cm is produced according to Equation (2) in the cathode sheath with a small potential drop (~10 V). This field cannot be significantly enhanced because the space charge layer (or Debye radius ~10−6 cm) is much lower than the protrusion size (~1 µm), which can be accepted as a flat surface. At a lower plasma density, the produced electric field is also lower. Therefore, none of the conditions of the enhancement of the electrical field at the protrusion lead to elevated Joule heating and explosion. Thus, despite many partial estimations and qualitative statements regarding the possibility of new EC ignition by Joule explosions due to dielectric charging and the current density enhancement by the geometric factor are doubtful for a multi-spot regime (in an arc with low uc), excluding the arc initiation resulting from a relatively high-voltage breakdown.

5. Model of Ionization Cathode Vapor and Electron Emission

5.1. Summary Overview of Specific Previous Models

It is understandable that an electrical arc in a vacuum can be sustained when the cathode surface is sufficiently heated in order to serve as an emitter of the electrons and metallic vapor. The necessary large temperature is established by the local energy dissipation. Considering the above approaches, it can be seen that the main difference is in the type of heat source, which is due to the energy flux Q toward the cathode in an area with an effective radius r on the cathode surface or in the volume Joule energy dissipation. In the first case, the radius r with a local high cathode temperature T was determined by body heat conduction according to the relation r~Q/T = 2.6 × 10⁻³ (for I = 10 A, uc = 15 V, and T = 4000 K), which is obviously relatively small because of the requirement for a high level of T. In the second case, the significant cathode temperature was reached at the given local initial current density equal to or above 108 A/cm2 (see above). Nevertheless, in both cases, the main physical processes include electron emission and cathode vaporization in addition to some level of cathode energy balance presenting in different forms. The model with a volume Joule heat source used an initial, very small protrusion or crater radius as an input parameter to reach the high current density. According to the models with surface heat sources like those discussed above [65,66,67] and later developed in many further studies [16], the spot radius can be determined by studying the system of equations. However, in both previous approaches, the number of equations used is always lower than the number of unknowns. Therefore, a number of different arbitrary free parameters were introduced in order to close the mathematical formulation of the physical phenomena in the cathode spot. These parameters can be the crater size, current density, electron current fraction, cathode surface temperature, electron temperature, etc. As a result, the main weakness of both early-developed models (with volume and surface heat sources) is that the employed systems of equations did not allow for the study of the cathode processes self-consistently due to the system being mathematically not closed. Let us formulate a model with a system of equations free of given arbitrarily spot parameters using a closed approach.

5.2. Cathode Spot Description Using a Closed Mathematical Approach: The Kinetic Model

In most cases, the cathode potential drop was used as a given input parameter because it was measured with relatively good accuracy. However, information about this parameter at spot initiation is absent, although some voltage fluctuation is observed during arcing. The cathode evaporation rate was determined with an approach describing the vapor flow from a heated surface by the speed of sound. However, the evaporation flux is subsonic because many of the heavy particles return to the cathode due to the ion current and neutrals [86]. While some early models were improved, they did not consider cathode plasma generation by studying the self-consistent procedure of electron heating and the dependence between cathode temperature, evaporating atoms, and their ionization in a consistent form. Some decades ago, an attempt was made to comprehensively describe the experimental, and theoretical aspects of the cathode phenomena, and the spot parameters, including the cathode potential drop and the rate of cathode erosion in a non-stationary formulation, were determined [16]. Accordingly, the cathode spot we defined in [16] as an arc-constricted region including the local hot cathode area and a dense plasma cloud (with layers of space charge and energy relaxation of the emitted electron beam) supporting the current continuity at the cathode region. Below, we will shortly indicate the principal points for understanding the closed mathematical approach to clarify the spot initiation and mechanism of spot operation. An example of the calculated results is presented in order to discuss and compare the different approaches describing the conditions for the existence and development of spots.

5.3. The Kinetic Study of Cathode Vaporization and Plasma Generation

According to the kinetic model of the cathode spot, the ionized vapor structure near the cathode surface consists of several partially overlapping physical regions separated by characteristic boundaries with corresponding Gasdynamic parameters, temperature T, density n, and velocity v (Figure 6, left and right). The cathode region includes a ballistic region comprising a space charge sheath located between the cathode surface (boundary 1) and its external boundary of the sheath (boundary 2), as well as a non-equilibrium Knudsen plasma layer located between boundary 2 and the external boundary of the Knudsen layer (boundary 3).
A strong electric field is present within the ballistic zone, where the emitted electrons are accelerated, and the energy relaxation of the beam occurs in a region with boundary 4, after which plasma expands until the anode. The equilibrium for heavy particles n0 and electron ne0 densities is determined by the cathode spot temperature Ts. Two heavy particle fluxes (evaporated and returned) are formed in the Knudsen region, determining the plasma velocity v3 at boundary 3. In the electron beam relaxation region, the atoms are ionized by the electrons emitted from the cathode, as well as by plasma electrons, which are heated during electron beam relaxation. The presence of multiple ionizations of the evaporated atoms is determined by the level of the electron temperature.
The physics of the kinetic approach considers electron emission as an evaporation process together with atom vaporization and subsequent atom ionization. This allows for the calculation of the plasma velocity at boundary 3 of the Knudsen layer by using the quasi-neutrality condition. At the sheath’s boundary 2, the plasma electrons return to the cathode, while the ions and the emitted electrons are accelerated with the energy determined by the cathode potential drop euc. The charged particle motion and their generation due to high power dissipation are self-consistently coupled with the potential barrier. Therefore, the corresponding height of the barrier, i.e., uc, as well as the energy fluxes from the plasma to the cathode surface, could be obtained by studying the equations expressing the energy and momentum conservation laws of charge particle fluxes at the abovementioned boundaries, including the Knudsen layer and the space charge layer. In the Knudsen layers 1–3, the evaporated and returned heavy particle fluxes are formed; their difference is the net cathode mass loss flux G(g/s) = m(na3 + ni3)v3, where m = mi = ma is the heavy particle mass.
Initial conditions for arc initiation in vacuum are determined by the presence of an initial plasma, which can arise due to different types (breakdown pulse, contact method, or post plasma) of triggering electrical discharge in the electrode gap. Depending on the triggering type, an initial plasma plume has a different but minimal lifetime τ. Note that the initial plasma density, temperature, degree of ionization, etc. cannot be considered independent of one another, and should be used as varying input parameters to solve the problem. Taking into account this point, i.e., all the initiating plasma parameters should be self-consistent, such plasma parameters were calculated from the cathode spot model assuming that the heat flux and other parameters are constant during a very small initial time τ, depending on the triggering type. Obviously, the plasma density and heat flux to the cathode during a lifetime τ could support the future self-consistent spot development. The estimation showed that the time of Gasdynamic processes was significantly smaller than the thermal phenomena of the cathode, which therefore determined the non-stationarity of spot operation. The system of equations for kinetic cathode vaporization was supplemented by the equations of the cathode energy balance, including the non-stationary 3D heat conduction equation. Also, this system includes the equations of the total spot current, equations for cathode electron emission and the electric field at the cathode surface E, the equation for the plasma electron’s temperature, and Saha’s system of equations. The equations for saturated pressure under a specific cathode temperature supplement this model in order to obtain a complete system of equations. The unknown parameters are cathode temperature Ts and plasma temperature Te, heavy-particle density n0, the degree of ionization α, current density j, the fraction of electron current s, the electrode erosion rate, and the cathode potential drop.

5.4. Numerical Solutions

As an example, in order to demonstrate the characteristic results of the closed approach, a calculation was conducted for a cylindrical protrusion comprising a Cu cathode with its height equal to a radius of R0 = 1 μm (Figure 7) and of R0 = 0.5 μm (Figure 8), for primary plasma times of spot ignition of τ = 10, 30, and 50 ns. The calculation shows the very important specific time dependence of the cathode potential drop uc as well as the cathode spot temperature Ts. It can be seen that uc is significantly large at the first spot initiation time. When τ is 10 ns, uc exceeds (60 V for R0 = 1 μm and 40 V for R0 = 0.5 μm) the values for 30 ns (30 V for R0 = 1 μm and 20 V for R0 = 0.5 μm) and 50 ns (25 V for R0 = 1 μm and 17 V for R0 = 0.5 μm). The potential drop decreases significantly with time, up to a certain value, and then quickly approaches an asymptotic value that is independent of τ. In contrast, the cathode temperature increases from an initial value determined by initial plasma parameters self-consistently with this Ts. Similarly, the temperature and other spot parameters also approach asymptotic values that are independent of τ. As the protrusion sizes are relatively small, the spot current is significantly lower than 1 A.
The heavy particle density is up to 3 × 1020 cm−3, the electron temperature is Te~1–2 eV, the electric field E is (1–2) × 107 V/cm, the cathode spot current density is j = (1–2) MA/cm2, and the electron current fraction is ∼0.75. The degree of ionization α approaches a fully ionized state. The cathode erosion rate is about 50 µg/C at 10 ns, increasing to ~100 µg/C with time. The plasma velocity at the external boundary of the Knudsen layer normalized by the sound speed is in the range of 0.35–0.17, indicating non-free (impeded) plasma flow in the dense region near the surface. The main contribution to the cathode T-F electron current is from thermionic electron emission enhanced by the Schottky effect. The methodology and detailed calculation results of the non-stationary spot parameters were described previously [16] and can be found in the original works for cathode protrusion [93] and for bulk cathode [94].
The significance of the above results is that they highlight the possibility of obtaining interrelated parameters describing interrelated physical phenomena in the cathode body, on its surface, and in dense plasma, and that, importantly, those parameters are complicated to determine unambiguously in an experiment. On the other hand, a number of explicit observations were revealed using the vaporization kinetic model allowing for an understanding of and explaining the measured specific data, which is impossible to understand in the framework of the EC model. Let us consider the following experiments along with a concise description of their interpretation:
  • An observation of different spot types, as presented in Table 1, considered the heating specifics and the kinetics of the evaporating flux. The spot dynamics data, characterized by different spot velocities, lifetimes, and group spots, were understood by studying the cathode heating phenomena, taking into account the specifics of the cathode geometry and surface impurity. In particular, the mechanism of spot association was considered, which appeared to be due to an impeded plasma flow under background pressure, which occurred by filling the expanding plasma in the gap during arcing or by using external low-pressure gas [95].
  • Specific experiments were carried out with a film cathode [29]. The experiments were undertaken to determine the basic features of Cu film cathode spots, in contrast to impurity films on bulk surfaces, for which information about film properties is limited. Features of moving spots were studied with the “signature” method: the spots left a clearly defined erosion trace of a certain width, in which all of the metal thin film was removed from the glass substrates with no signs of disturbance on the glass substrate. No explosion material was observed around the traced region, nor any protrusions that can initiate an explosion. A very low current per spot was measured, ranging from 0.1 to 0.4 A, when the film thickness increased from 0.017 to 0.06 µm.
    The calculations using the vaporization kinetic model for the film cathode [96] showed that the cathode potential drop uc for the Cu film weakly changed with the film thickness, and the calculated value well agree with the low measured value of 11 V [97]. The measured trace width coincides with the calculated spot diameter, and the measured spot velocity well agrees with the calculated value. The important theoretical result is the low power loss obtained due to heat conduction and therefore the low effective voltage of the film cathode. This model prediction allows us to explain the observed low current per spot and the low cathode potential drop, which appeared to be significantly smaller than that for a bulk cathode (15 V [29]).
  • One of the cathode spot problems that should be understood is the spot nature in the Hg cathode, characterized by considerable volatility in comparison to its very low electron emissive ability at any temperature. The explosive model used the electrostatic pulling force on the liquid surface caused by microprotusions due to the Tonks instability [98]. In general, the local electric field at a protrusion tip can be enhanced by some factor over an average electric field. However, firstly, the typical microprotrusion growth time [98] (~1 ms) is large compared to the spot lifetime, for most spot types and especially for the fast spots existing in the Hg cathode. Secondly, the space charge sheath of the average field for the plasma spot is much smaller than the tip, and therefore the field cannot be enhanced [16].
    In the case of volatile materials, a model of a double-layer cathode plasma was developed. The layer adjacent to the cathode surface serves as a “plasma cathode”, supplying electrons to the remaining part of the discharge. The electrons are emitted from a plasma cathode produced by the thermal ionization of the evaporated material. The current continuity at the cathode surface is closed by the ion flux from the adjacent cathode plasma. The model revealed two types of time-dependent solutions with characteristic spot lifetimes of 0.1–1 µs and 100 µs corresponding to the experimentally observed two forms of Hg arc. The theoretical study allowed for the explanation of the observed arc forms: the transitional form with a cathode drop of 18 V appeared at a low current, and fundamental arc forms with a cathode drop of 8.5–10 V appeared when the arc current was sufficient for several spots to exist simultaneously [16].
  • Another well-established experimental observation is the energy losses due to cathode heat conduction per unit current, which is defined by the cathode effective voltage uef. The uef value was determined by measuring the temperature rise in the cathode with the thermocouple at the backside of a cleaned bulk disk. In the case of open cathode–anode gap configuration, arcing times varied up to half a second, and for different cathode materials and arc currents, the measuring uef was 6 V [99]. The time-dependent measurements for closed electrode gap configuration VABBA (see above) showed an interesting result [100]. At the beginning of the arc (when the anode is cold and not influencing the cathode plasma jet expansion), the traditional result was obtained as uef = 6 V. By taking into account the arc time (when the anode is hot, and the cathode plasma jets re-evaporate, increasing the gap plasma density), the measuring uef increased up to 12 V. In order to illustrate the effect of uef increase, the time dependence of the cathode effective voltage uef is presented in Figure 9, which was obtained in accordance with the methodology described previously [100] for an arc sustained between a water-cooled Cu cathode with 30 mm diameter and a cylindrical shower head W anode with a 50 mm outer diameter and 1 mm holes.
    It is difficult to accept that the whole cathode temperature rise, and the increase in the effective voltage shown in Figure 9, were caused by explosive phenomena. It can be assumed that, during protrusion explosions, its accumulated energy is carried away by super high-speed (2 × 106 cm/s) plasma plume at a large distance of 10−3 cm during a short time of 10−9 s, and during the same time, the micro-area in the cathode around the protrusion is cooled by some mechanism. It is reasonable to consider that disk heating occurs due to the heat flux as a consequence of energetic interactions of the cathode plasma with its surface and that the backside temperature is determined based on disk heat conduction. The model that considered such interaction was developed recently, explaining the nature of energy loss by cathode heat conduction and the cathode effective voltage in vacuum arcs [101].
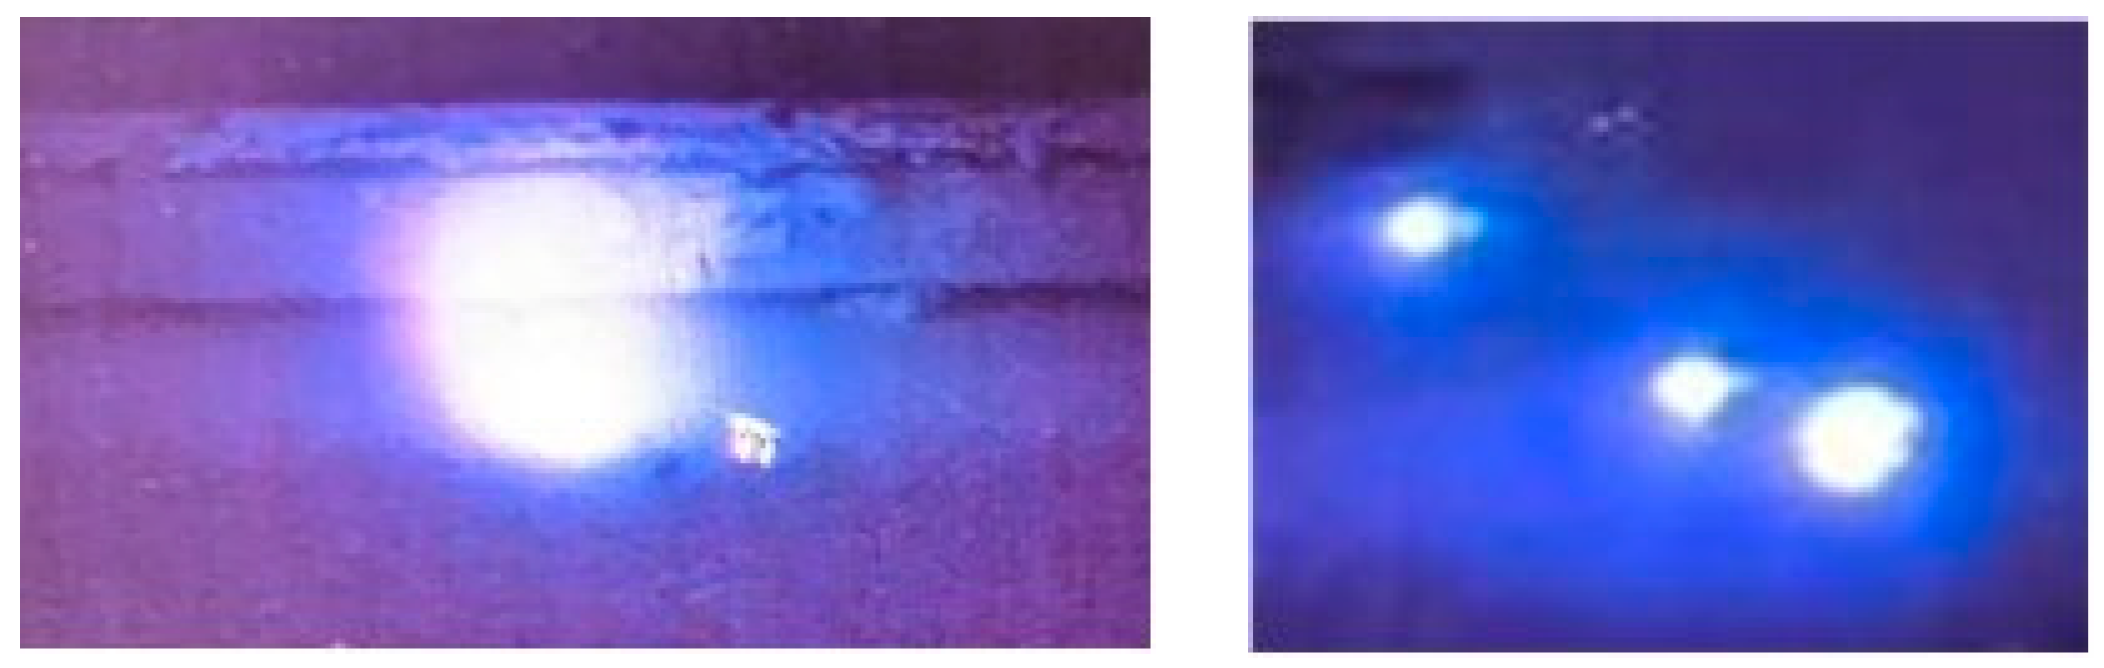
  • Specifics of current–voltage characteristics in high current vacuum by the presence of an axial magnetic field (AMF) were studied. The experiment showed that a high arc voltage, which may lead to an increase in the heat flux on the electrodes, characterized such a high current arc. However, the imposition of an AMF also changes the arc’s current–voltage characteristics [102]. At high currents, the voltage initially decreases as the AMF increases from zero, and then reaches a minimum at a critical value of the AMF, and slowly increases thereafter with a further increase in the magnetic field. This current–voltage behavior with a minimum voltage was previously not understandable and was explained by considering the hydrodynamics of plasma jet expansion from cathode spots as an individual flow from each spot or as the mixing of the jets depending on the presence of AMF [103]. Note that it is difficult to represent any change in the cathode jet structure, which can arise due to any individual nanosecond explosion under an AMF.
    The observed retrograde spot motion, the effect of spots expanding in the form of a ring, [104], and the effect of acute angle can be explained in the case when the adjacent layer to the cathode plasma interacts with the cathode surface and not when the plasma exploded and expanded as a single plume far from the cathode. Figure 10 demonstrates an example of spot expansion in a ring form on an Al cathode obtained in accordance with the methodology described previously [51]. The understanding of these experimental results has recently been detailed [105,106,107].
  • The model [108] of an arc spot on a refractory cathode was developed self-consistently considering the effect of a virtual cathode in order to match the discrepancy between very large electron emissions relative to the low evaporation flux (low neutral density) for a wide range of cathode temperatures. Such an approach took into account the presence of the virtual cathode by only considering the spot development as a self-sustained subject. However, the effect of the virtual cathode cannot be due to limiting the spot current by a current Ic determined by the resistivity of the electrical circuit, when the emissivity of an EC is greater than Ic, as arbitrarily proposed in the model [79].

6. Discussion and Summary

The cathodic arc is one of the important problems of gas discharges. An overview of different mechanisms of the current continuity in the cathode spot of a vacuum arc was presented in this mini-review. Some authors described the cathode spot processes using steady-state equations of cathode energy balance for electron emission, electric field, and the total current. As the system of equations was not closed, some additional arbitrarily given parameters were used to determine the current density and cathode temperature in the spot. The non-stationary spot behavior was studied in other approaches considering the same system of equations except for the equation of cathode heat conduction in transient form, for which the energy balance was taken as a boundary condition. The key to any approach for a theoretical description of the transient cathode phenomenon is the necessity of knowing the initial conditions on the cathode surface and plasma parameters leading to the initiation of cathode processes.
In the explosion model, the initial conditions were given as likely and independent parameters characterized by the plasma density, electron temperature, cathode potential drop, and the size of irregularity (protrusion, crater, or presence of an impurity). In particular, to study the beginning of the spot function, it was assumed that a highly dense plasma remained after the previous EEE. Furthermore, a calculation was conducted for the initial parameters given in the range that required a sharp rise in the cathode temperature, leading to a strong increase in the electron emission current density and intense Joule energy dissipation in the irregularity. Two different interpretations of this result were indicated. The first involved the formation of an electron emission pocket in a short time between when the cathode temperature increases and when it decreases due to cooling by an increase in the energy loss and the heating size area. The electron pocket was named the emission center (EC). The second, contrariwise, similar calculations indicate continuous cathode temperature growth up to some critical value and, therefore, assuming then that an explosion occurs. Similarly, other models were developed and considered critical parameters such as high temperatures or power density necessary to reach explosive action [80].
The main specific modeling of the EC is described as a process of the temporal growth of cathode parameters from some initial conditions leading to a local explosion. According to this model, the observed behavior of the spot as a non-steady phenomenon is assumed to be provided by new cyclic explosions, using the plasma product from previous explosions as initial data. Of course, no real evidence to justify this process exists. Although experimental proof in the case of the cathode spot is not always possible, it is imperative that any contradictions should be also absent.
Therefore, it is worth noting the description of cathode spot development using only the Joule heating of an irregularly employed number of assumptions. Some of these assumptions have weaknesses that were discussed in Section 4.5. A few additional principal points can be indicated that are important for understanding the essence of this approach:
  • Consider the measured maximal spot velocity of 103–104 cm/s, which was observed experimentally (Table 1). In this case, the time of spot location in the range of a spot radius of about 10 µm was about 10−6–10−7 s, while the EC time location was in the nanosecond range, indicating a significantly larger velocity. Thus, here is a discrepancy (modeling the next explosion occurs under the plasma of the previous EC) that indicated an enhanced value observed but a lower spot velocity.
  • The products of explosion may not reproduce the needed plasma parameters because of a very small protrusion size. The estimation showed that the mass of the exploding protrusion was not enough to support the plasma density in order to initiate a new EC, taking into account the high velocity of the expanding product of the explosion.
  • The exploded plasma plume expanded with velocity 2 × 106 cm/s and was removed from the cathode surface at a large distance of ~10−3 cm during the explosion time of 10−9 s. Therefore, the calculating process cannot be self-sustained.
  • In essence, the traditional name “cathode spot”, established are the beginning of the previous century, was renamed “EC”, to which was added the word “TON”. Thus, the new name is “ECTON”, assuming that an explosion is an elementary act in the processes occurring in the cathode spot of a vacuum discharge [79]. However, it is misunderstood and even confusing when interpreting the cathode spot mechanism. This act cannot be considered elementary because too many arbitrarily inputted parameters are taken for the simulation of an ECTON. According to the observed cathode spot dynamics, the spot is a self-sustained phenomenon in which the physical processes continuously support regenerative plasma in contrast to a singular act of an explosion. In addition, many different models were used (by reducing the electron emission upon cooling or, conversely, by reaching an enormous critical cathode temperature), indicating that this process is rather specific and not universal.
It is important to note that any modeling should take into account the experimental fact that cathode spots operate as self-organizing systems with a certain spot size, lifetime, and velocity depending on the flatness or irregularity of the cathode surface. So, in order to support the interrelated cathode spot processes, plasma density reproduction on a sufficient level at each time is necessary. The mechanism of such cathode spot performance is possible to understand using a closed model (Section 5.2 and Section 5.3), which describes cathode heating, electron emission, and plasma generation as mutually dependent processes by a closed self-consistent system of equations. The numerical study of the model revealed an important, never-before-seen result. Unlike the traditional approach with a given constant cathode potential drop uc resulting in a non-limited rise in the current density (in an initially very small area) with time, the closed kinetic model (without arbitrary parameters) showed a weak change in the current density j but a significant variation in the value of cathode potential drop with time.
The weak change in the total current density j, on the one hand, results in a limited ion current density ji by vapor density (even highly ionized), which is determined by the cathode temperatures arising at a level supporting sufficient electron emission current density je. On the other hand, the electron current fraction s = je/j is limited by the electron energy balance in the cathode plasma so that je~ji. Therefore, the total current density remains weakly changed with time, while the increase in the necessary power density for spot development in the initial stage occurs due to the change in the cathode potential drop.
This study indicated that spot development is determined not only by the current density but also, very importantly, by the electrical power density released in the near cathode region, starting from the triggering of the arc at the initial condition when the cathode is at minimal temperature. The non-stationarity of cathode heating requires significant electrical power at the beginning to reach the cathode surface temperature enough for electron emission and vapor density and reproduce the plasma density on a level that will lead to process development. The calculations show that as the initial plasma density and consequently current density cannot be supported by heat sources due to the Joule energy dissipation or ion energy flux, the cathode thermal regime is supported by a significant rise in the cathode potential drop. The growth of uc may be realized by a power supply used to supply the arc burning at the time of triggering. In this case (small τ), the relatively high voltage of the power supply is basically concentrated at the plasma cathode transition characterized by a Debye layer [109]. With time, the cathode temperature increases, and the cathode potential reduces to the typically observed values (Figure 7 and Figure 8).
In the case of a developed arc, the spot displaced on the more favorable state (at larger τ and change in uc to a value close to the experiment; Figure 7 and Figure 8), which is characterized by the spot death or born explaining the observed arc voltage fluctuation. In general, the necessary relatively small increase in power density can be supported by a rise in the spot current. However, the experiment shows that the spot current remained constant, while the number of spots proportionally increased with the growth of the arc current. The specifics of spot displacement depend on the cathode geometry, surface conditions, arc pulse time, life arc, the presence of low pressure in the discharge gap, etc., determining the diversity of spot types [95].

7. Conclusions

  • As the electrical arc is a self-organized discharge, in order to adequately study the interrelated phenomena in the cathode region of a vacuum arc, it is necessary to use the mathematical model formulated in the closed form, i.e., without arbitrarily established parameters.
  • The initial plasma conditions for a transient spot study should be coupled, as it is necessary for the self-consistent simulation of the spot development process. The initial plasma characteristics that are given as parametric independent data including micro-sized current location may yield results that are not consistent with real observable phenomena.
  • At arc ignition, the spot initiation is supported by a rise in electrical power (sharp growth in the cathode potential drop with moderate current density changes), which is obtained using a closed mathematical model. In contrast, no real strong growth of current density was obtained using the approach with arbitrarily given parameters, including the constant cathode potential drop at the moment of cathode spot initiation and its development.

Funding

This research received no external funding.

Conflicts of Interest

The author declares no conflicts of interest.

References

  1. Landau, L.D.; Pitaevskii, L.P.; Lifshitz, E.M. Electrodynamics of Continuous Media, 2nd ed.; Pitaevskii, L.P., Lifshitz, E.M., Eds.; Pergamon Press: Oxford, UK; New York, NY, USA, 1984. [Google Scholar]
  2. Meek, J.M.; Craggs, J.D. Electrical Breakdown of Gases; Clarendon Press: Oxford, UK, 1953. [Google Scholar]
  3. Nasser, E. Fundamentals of Gaseous Ionization and Plasma Electronics; Wiley Series in Plasma Physics; John Wiley and Sons: New York, NY, USA, 1971. [Google Scholar]
  4. Keidar, M.; Beilis, I.I. Plasma Engineering, 2nd ed.; Academic Press: Cambridge, MA, USA; Elsevier: Amsterdam, The Netherlands, 2018. [Google Scholar]
  5. Finkelnburg, W.; Maecker, H. Electrische Bogen und Thermisches Plasma; Handbuch der Physic; Springer: Berlin/Heidelberg, Germany, 1956; Volume XXII, pp. 254–444. [Google Scholar]
  6. Kesaev, I.G. Cathode Processes in the Mercury Arc; Consultants Bureau: New York, NY, USA, 1964. [Google Scholar]
  7. Lafferty, J.M. Vacuum Arcs; John Wiley and Sons: New York, NY, USA, 1980. [Google Scholar]
  8. Qu, J.; Zeng, M.; Dewei Zhang, D.; Yang, D.; Wu, X.; Ren, Q.; Zhang, J. A review on recent advances and challenges of ionic wind produced by corona discharges with practical applications. J. Phys. D Appl. Phys. 2022, 55, 153002. [Google Scholar] [CrossRef]
  9. Mavrodineanu, R. Hollow Cathode Discharges—Analytical Applications. J. Res. Natl. Bur. Stand. 1984, 89, 143–185. [Google Scholar] [CrossRef] [PubMed]
  10. Bogaerts, R. The glow discharge. An exciting plasma. J. Anal. At. 1999, 14, 1375–1384. [Google Scholar]
  11. Canton, A.; Cavazzana, R.; Grando, L.; Spolaore, M.; Zuin, M. Designing high efficiency glow discharge cleaning systems. Nucl. Mater. Energy 2019, 19, 468–472. [Google Scholar] [CrossRef]
  12. Mac Rae, D.R. Plasma reactors for process metallurgy applications. Pure Appl. Chem. 1988, 60, 721–725. [Google Scholar] [CrossRef]
  13. Karimi-Sibaki, E.; Kharicha, A.; Ludwig, A.; Wu, M.; Bohacek, J. A Parametric Study of the Vacuum Arc Remelting (VAR) Process: Effects of Arc Radius, Side-Arcing, and Gas Cooling. Metall. Mater. Trans. B 2020, 51, 222–235. [Google Scholar] [CrossRef]
  14. Bokova, V.M.; Sisa, O.F. Application of an Electric Arc to Produce Metal Powders. Surf. Eng. Appl. Electrochem. 2020, 56, 390–399. [Google Scholar] [CrossRef]
  15. Kah, P.; Latifi, H.; Suoranta, R.; Martikainen, J.; Pirinen, M. Usability of arc types in industrial welding. Int. J. Mech. Mater. Eng. 2014, 9, 15. [Google Scholar] [CrossRef]
  16. Beilis, I.I. Plasma and Spot Phenomena in Electrical Arcs; Springer: Cham, Switzerland, 2020; Volumes 1–2. [Google Scholar]
  17. Anders, A. Cathodic Arcs: From Fractal Spots to Energetic Condensation; Springer: Berlin/Heidelberg, Germany, 2008. [Google Scholar]
  18. Slade, P.G. The Vacuum Interrupter: Theory, Design, and Application, 2nd ed.; CRC Press: Boca Raton, FL, USA, 2021. [Google Scholar]
  19. Boxman, R.L.; Martin, P.J.; Sander, D.M. (Eds.) Handbook of Vacuum Arc Science and Technology; Noyes Publisher: Park Ridge, NJ, USA, 1995. [Google Scholar]
  20. Lugscheider, E.; Knotek, O.; Barimani, C.; Zimmermann, H. Arc PVD-coated cutting tools for modern machining applications. Surf. Coat. Technol. 1997, 91–95, 641–646. [Google Scholar] [CrossRef]
  21. Nikolaev, A.G.; Oks, E.M.; Savkin, K.P.; Yushkov, G.Y.; Brown, I.G. Upgraded vacuum arc ion source metal ion implantation. Rev. Sci. Instrum. 2012, 83, 02A502. [Google Scholar] [CrossRef]
  22. Zolotukhin, D.B.; Daniels, K.P.; Brieda, L.; Keidar, M. Onset of the magnetized arc and its effect on the momentum of a low-power two-stage pulsed magneto-plasma-dynamic thruster. Phys. Rev. 2020, 102, 021203. [Google Scholar] [CrossRef] [PubMed]
  23. Siemroth, P.; Wenzel, C.; Kliomes, W.; Schultrich, B.; Schulke, T. Metallization of submicron tranches and vias with high aspect ratio. Thin Solid Films 1997, 308–309, 455–459. [Google Scholar] [CrossRef]
  24. Monteiro, O.R. Novel metallization technique for filling 100-nm-wide trenches and vias with very high aspect ratio. J. Vac. Sci. Technol. B 1999, 17, 1094–1097. [Google Scholar] [CrossRef]
  25. Daalder, J.E. Components of cathode erosion in vacuum arcs. J. Phys. D Appl. Phys. 1976, 9, 2379–2395. [Google Scholar] [CrossRef]
  26. Witke, T.; Siemroth, P. Deposition of Droplet-Free Films by Vacuum Arc Evaporation—Results and Applications. IEEE Trans. Plasma Sci. 1999, 27, 1039–1044. [Google Scholar] [CrossRef]
  27. Beilis, I.I.; Boxman, R.L. Thin Film Deposition by Plasma Beam of a Vacuum Arc with Refractory Anodes. Ch. In Advances in Thin Films, Nanostructured Materials, and Coatings; Alexander, D.P., Valentine, N., Eds.; Springer: Berlin/Heidelberg, Germany, 2019; pp. 1–17. [Google Scholar]
  28. Kesaev, I.G. Law Governing the Cathode Drop and the Threshold Currents in an Arc Discharge in a Pure Metal. Sov. Phys.-Tech. Phys. 1964, 9, 1146–1154. [Google Scholar]
  29. Kesaev, I.G. Cathode Processes in Electric Arcs; NAUKA Publishers: Moscow, Russia, 1968. [Google Scholar]
  30. Grakov, V.E. Cathode Fall of an Arc Discharge in a Pure Metal. Sov. Phys.-Tech. Phys. 1967, 12, 286–292. [Google Scholar]
  31. Davis, W.D.; Miller, H.C. Analysis of the electrode products emitted by DC arcs in a vacuum ambient. J. Appl. Phys. 1969, 40, 2212–2221. [Google Scholar] [CrossRef]
  32. Plyutto, A.A.; Ryzhkov, V.N.; Kapin, A.T. High speed plasma streams in vacuum arcs. Sov. Phys. JETP 1965, 20, 328–337. [Google Scholar]
  33. Kutzner, J.; Miller, H.C. Integrated Ion Flux Emitted from the Cathode Spot Region of a Diffuse Vacuum-Arc. J. Phys. D Appl. Phys. 1992, 25, 686–693. [Google Scholar] [CrossRef]
  34. Tanberg, R. On the cathode of an arc drawn in vacuum. Phys. Rev. 1930, 35, 1080–1989. [Google Scholar] [CrossRef]
  35. Kimblin, C.W. Vacuum Arc Ion Currents and Electrode Phenomena. Proc. IEEE 1971, 59, 546–555. [Google Scholar] [CrossRef]
  36. Kimblin, C.W. Erosion and Ionization in Cathode Spot Regions of Vacuum Arcs. J. Appl. Phys. 1973, 44, 3074–3081. [Google Scholar] [CrossRef]
  37. Rakhovsky, V.I. Experimental study of the dynamics of cathode spots development. IEEE Trans. Plasma Sci. 1976, 4, 87–102. [Google Scholar] [CrossRef]
  38. Tuma, T.D.; Chen, C.L.; Davies, D.K. Erosion Products from the Cathode Spot Region of a Copper Vacuum Arc. J. Appl. Phys. 1978, 49, 3821–3831. [Google Scholar] [CrossRef]
  39. Daalder, J.E. Erosion and the origin of charged and neutral species in vacuum arcs. J. Phys. D Appl. Phys. 1975, 8, 1647–1659. [Google Scholar] [CrossRef]
  40. Juttner, B.; Puchkarev, V. Phenomenology. In Handbook of Vacuum Arc Science and Technology; Noyes Publications: Park Ridge, NJ, USA, 1995; pp. 73–151. [Google Scholar]
  41. Djakov, B.E. Cathode spot phenomena in low current vacuum arcs on arc cleaned electrode surfaces Spot Dynamics. Contrib. Plasma Phys. 1993, 33, 201–207. [Google Scholar] [CrossRef]
  42. Djakov, B.E.; Holmes, R. Cathode spot structure and dynamics in low-current vacuum arcs. J. Phys. D Appl. Phys. 1974, 7, 569–580. [Google Scholar] [CrossRef]
  43. Djakov, B.E.; Holmes, R. Cathode spot division in vacuum arcs with solid metal cathodes. J. Phys. D Appl. Phys. 1971, 4, 504–509. [Google Scholar] [CrossRef]
  44. Siemroth, P.; Schuke, T.; Witke, T. Investigation of cathode spots and plasma formation of vacuum arcs by high speed microscopy and spectroscopy. IEEE Trans. Plasma Sci. 1977, 25, 571–579. [Google Scholar] [CrossRef]
  45. Achtert, J.; Altrichter, B.; Juttner, B.; Peach, P.; Pusch, H.; Reiner, H.D.; Rohrbeck, W.; Siemroth, P.; Wolf, P. Influence of surface contaminations on cathode processes of vacuum discharges. Beitr. Plasma Phys. 1977, 17, 419–431. [Google Scholar] [CrossRef]
  46. Beilis, I.I.; Djakov, B.E.; Juttner, B.; Pusch, H. Structure and dynamics of high-current arc cathode spots in vacuum. J. Phys. D Appl. Phys. 1997, 30, 119–130. [Google Scholar] [CrossRef]
  47. Jüttner, B. Cathode spots of electric arcs. J. Phys. D Appl. Phys. 2001, 34, R103–R123. [Google Scholar] [CrossRef]
  48. Anders, S.; Anders, A. Emission Spectroscopy of Low-current Vacuum Arcs. J. Phys. D Appl. Phys. 1991, 24, 1986–1992. [Google Scholar] [CrossRef]
  49. Anders, A.; Anders, S.; Jüttner, B.; Botticher, W.; Luck, H.; Schroder, G. Pulsed dye laser diagnostics of vacuum arc cathode spots. IEEE Trans. Plasma Sci. 1992, 20, 466–472. [Google Scholar] [CrossRef]
  50. Anders, A.; Anders, S.; Jüttner, B. Brightness distribution and current density of vacuum arc cathode spots. J. Phys. D Appl. Phys. 1992, 25, 1591–1599. [Google Scholar] [CrossRef]
  51. Beilis, I.I.; Sagi, B.; Zhitomirsky, V.; Boxman, R.L. Cathode spot motion in a vacuum arc with a long roof-shaped cathode under magnetic field. J. Appl. Phys. 2015, 117, 233303. [Google Scholar] [CrossRef]
  52. Raizer, Y.P. Gas Discharge Physics; Springer: Berlin, Germany, 1997. [Google Scholar]
  53. Braginsky, S.I. Phenomena of transferring in a plasma. In Reviews of the Plasma Physics; Leontovich, M.A., Ed.; Consultants Bureau: New York, NY, USA, 1965; Volume 1. [Google Scholar]
  54. Artsimovich, L.A.; Sagdeev, R.Z. Plasma Physics for Physicists; Springer: Berlin, Germany, 1983. [Google Scholar]
  55. Shkarofsky, I.P.; Johnston, T.W.; Bachynski, M.P. The Particle Kinetics of Plasmas; Addison Wesley Publishing Company: Reading, MA, USA, 1966. [Google Scholar]
  56. Granowski, W.L. Der Elektrische Strom Im Gas. B.1. Allgemeine Probleme der Elektrodynamik der Gase; Akademie Ferlag: Berlin, Germany, 1955. [Google Scholar]
  57. McDaniel, E.W. Collision Phenomena in Ionized Gases; John Wiley: New York, NY, USA; London, UK, 1964. [Google Scholar]
  58. Biberman, L.M.; Vorob’ev, V.S.; Yakubov, I.T. Kinetics of Nonequilibrium Low-Temperature Plasmas; Consultants Bureau: New York, NY, USA, 1987. [Google Scholar]
  59. Carslaw, H.S.; Jaeger, J.C. Conduction of Heat in Solids; Clarendon Press: Oxford, UK, 1959. [Google Scholar]
  60. Dushman, S. Scientific Foundation of Vacuum Technique; Lafferty, J.M., Ed.; John Wiley & Sons: New York, NY, USA, 1962. [Google Scholar]
  61. Anisimov, S.I.; Imas, Y.A.; Romanov, S.G.; Khodyko, Y.V. Action of High Power Radiation on Metals; National Technical Information Service: Springfield, VA, USA, 1971.
  62. Miller, H.C. Vacuum Arcs. IEEE Trans. Plasma Sci. 2023, 51, 1585–1594. [Google Scholar] [CrossRef]
  63. Mackeown, S.S. The cathode drop in an electric arc. Phys. Rev. 1929, 34, 611–614. [Google Scholar] [CrossRef]
  64. Ecker, G. Electrode components of the arc discharge. Ergeb. Exakten Naturwiss 1961, 33, 1–104. [Google Scholar]
  65. Lee, T.H.; Greenwood, A. Theory for the cathode mechanism in metal vapor arcs. J. Appl. Phys. 1961, 32, 916–923. [Google Scholar] [CrossRef]
  66. Ecker, G. The existence diagram a useful theoretical tool in applied physics. Z. Naturforschung A 1971, 26, 935–939. [Google Scholar] [CrossRef]
  67. Ecker, G. Zur theorie des vakuumbogens. Beitr. Plasmaphys. 1971, 11, 405–415. [Google Scholar] [CrossRef]
  68. Rothstein, J. The arc spot as a steady state exploding wire phenomena. In “Exploding Wires”, Version 3; Chace, W.G., Moore, H.K., Eds.; Plenum: New York, NY, USA, 1964; pp. 115–124. [Google Scholar]
  69. Dyke, W.P.; Trolan, J.K.; Martin, E.E.; Barbour, J.P. The Field Emission Initiated Vacuum arc I. Experiments Arc Initiation. Phys. Rev. 1953, 91, 1043–1054. [Google Scholar] [CrossRef]
  70. Flynn, P.T.G. The Discharge Mechanism in the High-Vacuum Cold-Cathode Pulsed X-ray Tube. Proc. Phys. Soc. 1956, 69, 748–762. [Google Scholar] [CrossRef]
  71. Kassirov, G.M.; Mesyats, G.A. Breakdown mechanism of short vacuum gaps. Sov. Phys. Tech. Phys. 1964, 9, 1141–1145. [Google Scholar]
  72. Mesyats, G.A.; Proskurovskii, D.I. Explosive electron emission from metallic needles. Sov. Phys JETP Let. 1971, 13, 4–6. [Google Scholar] [CrossRef]
  73. Fursey, G.N.; Vorontsov-Vel’yaminov, P.N. Qualitative model of initiation of a vacuum arc. Sov. Phys. Tech. Phys. 1967, 12, 1370–1382. [Google Scholar]
  74. Bugaev, S.P.; Litvinov, E.A.; Mesyats, G.A.; Proskurovskii, D.I. Explosive Emission of Electrons. Sov. Phys. Usp. 1975, 18, 51–61. [Google Scholar] [CrossRef]
  75. Fursey, G.N. Field Emission and Vacuum Breakdown. IEEE Trans. Electr. Insul. 1985, E–20, 659–679. [Google Scholar] [CrossRef]
  76. Mesyats, G.A.; Proskurovskii, D.I. Pulsed Electrical Discharge in Vacuum; Springer: Berlin, Germany, 1989. [Google Scholar]
  77. Mesyats, G.A. The Role of Fast Processes in Vacuum Breakdown; Phenomena in Ionized Gases: Oxford, UK, 1971; p. 333. [Google Scholar]
  78. Litvinov, A.; Mesyats, G.A.; Parfenov, A.G. The nature of explosive electron emission. Sov. Phys.-Dokl. 1983, 28, 272–273. [Google Scholar]
  79. Mesyats, G.A. Cathode Phenomena in a Vacuum Discharge: The Breakdown, the Spark, and the Arc; Nauka: Moscow, Russia, 2000. [Google Scholar]
  80. Barengolts, S.A.; Mesyats, G.A. Explosive emission processes in thermonuclear facilities with magnetic plasma confinement and in linear electron positron colliders. Phys. Uspekhi 2023, 66, 704–721. [Google Scholar] [CrossRef]
  81. Beilis, I.I.; Garibashvily, I.D.; Mesyats, G.A.; Skvortsov, V.A.; Fortov, V.E. Electromagnetic and gasdynamic of the explosive electron emission processes from metal spikes. In Proceedings of the RXIV-th Internaional Symposium on Discharge and Electrical Insulation in Vacuum, Santa Fe, NM, USA, 17–20 September 1990; pp. 548–551. [Google Scholar]
  82. Uimanov, I.V. A two-dimensional nonstationary model of the initiation of an explosive center beneath the plasma of a vacuum arc cathode spot. IEEE Trans. Plasma Sci. 2003, 31, 822–826. [Google Scholar] [CrossRef]
  83. Daalder, J. Diameter and current density of single and multiple cathode discharges in vacuum. IEEE Trans. Power Syst. 1974, PAS–93, 1747–1758. [Google Scholar] [CrossRef]
  84. Hitchcock, A.H.; Guile, A.E. A scanning electron microscope study of the role of copper oxide layers on arc cathode erosion rates. J. Mater. Sci. 1977, 12, 1095–1104. [Google Scholar] [CrossRef]
  85. Rich, J.A. Resistance heating in the arc cathode spot zone. J. Appl. Phys. 1961, 32, 1023–1031. [Google Scholar] [CrossRef]
  86. Beilis, I.I.; Lyubimov, G.A. Parameters of cathode region of vacuum arc. High Temp. 1975, 13, 1057–1064. [Google Scholar]
  87. Puchkarev, V.F.; Bochkarev, M.B. Cathode spot initiation under plasma. J. Phys. D Appl. Phys. 1994, 27, 1214–1219. [Google Scholar] [CrossRef]
  88. Budenstein, P.P.; Hayes, P.J. Breakdown Conduction in Al-SiO-Al Capacitors. J. Appl. Phys. 1967, 38, 2837–2851. [Google Scholar] [CrossRef]
  89. Klein, N.; Budenstein, P.P. Electrical Pulse Breakdown of Silicon Oxide Films. J. Appl. Phys. 1969, 40, 2728–2740. [Google Scholar] [CrossRef]
  90. Hancox, R. Importance of insulating inclusions in arc initiation. Br. J. Appl. Phys. 1960, 11, 468. [Google Scholar] [CrossRef]
  91. Minnebaev, K.F.; Rau, E.I.; Tatarintsev, A.A. Charging of dielectrics when bombarded with Ar+ ions medium energies. Solid State Phys. 2019, 61, 1090–1093. (In Russian) [Google Scholar] [CrossRef]
  92. Borisov, D.P.; Koval, N.N.; Kreindel, M.Y.; Litvinov, E.A.; Shchanin, P.M. Influence of surface state and voltages for breakdown of the near-electrode ionic layer in the plasma of a vacuum arc. ZhTF 1992, 62, 57–63. (In Russian) [Google Scholar]
  93. Beilis, I.I. Continuous Transient Cathode Spot Operation on a Microprotrusion: Transient Cathode Potential Drop. IEEE Trans. Plasma Sci. 2011, 39, 1277–1283. [Google Scholar] [CrossRef]
  94. Beilis, I.I. Cathode Spot Development on a Bulk Cathode in a Vacuum Arc. IEEE Trans. Plasma Sci. 2013, 41 Pt II, 1979–1986. [Google Scholar] [CrossRef]
  95. Beilis, I.I. Vacuum Arc Cathode Spot Theory: History and Evolution of the Mechanisms. IEEE Trans. Plasma Sci. 2018, 47, 3412–3433. [Google Scholar] [CrossRef]
  96. Beilis, I.I. Arc Spot on Film Cathode Using Kinetic Approach of Plasma Flow. IEEE Trans. Plasma Sci. 2022, 50 Pt 2, 2714–2719. [Google Scholar] [CrossRef]
  97. Grakov, V. Cathode fall in vacuum arcs with deposited cathodes. Sov. Phys.-Tech. Phys. 1967, 12, 1248–1250. [Google Scholar]
  98. Tonks, L. A theory of liquid surface rupture by a uniform electric field. Phys. Rev. 1935, 48, 562–568. [Google Scholar] [CrossRef]
  99. Daalder, J.E. Energy dissipation in the cathode of a vacuum arc. J. Phys. D Appl. Phys. 1977, 10, 2225–2254. [Google Scholar] [CrossRef]
  100. Beilis, I.I.; Koulik, Y.; Boxman, R.L. Effective Cathode Voltage in a Vacuum Arc with a Black Body Electrode Configuration. IEEE Trans. Plasma Sci. 2013, 41, 1992–1995. [Google Scholar] [CrossRef]
  101. Beilis, I.I. Plasma Energy Loss by Cathode Heat Conduction in a Vacuum Arc: Cathode Effective Voltage. Plasma 2023, 6, 492–502. [Google Scholar] [CrossRef]
  102. Agarwal, M.S.; Holmes, R. Arcing voltage of the metal vapor vacuum arc. J. Phys. D Appl. Phys. 1984, 17, 757–767. [Google Scholar] [CrossRef]
  103. Keidar, M.; Schulman, M.B. Modeling the effect of an axial magnetic field on the vacuum arc. IEEE Trans. Plasma Sci. 2001, 29, 684–689. [Google Scholar] [CrossRef]
  104. Agarwal, M.S.; Holmes, R. Cathode spot motion in high-current vacuum arcs under self-generated azimuthal and applied axial magnetic fields. J. Phys. D Appl. Phys. 1984, 17, 743–756. [Google Scholar] [CrossRef]
  105. Beilis, I.I. Vacuum arc cathode spot grouping and motion in magnetic fields. IEEE Trans. Plasma Sci. 2002, 30, 2124–2132. [Google Scholar] [CrossRef]
  106. Beilis, I.I. Mechanism of cathode spot splitting in vacuum arcs in an oblique magnetic field. Phys. Plasmas 2015, 22, 103510. [Google Scholar] [CrossRef]
  107. Beilis, I.I. Vacuum arc cathode spot motion in oblique magnetic fields: An interpretation of the Robson experiment. Phys. Plasmas 2016, 23, 093501. [Google Scholar] [CrossRef]
  108. Beilis, I.I. Model of a steady-state arc spot on a refractory cathode in vacuum. Sov. Tech. Phys. Lett. 1988, 14, 494–495. [Google Scholar]
  109. Beilis, I.I. The nature of high voltage initiation of an electrical arc in a vacuum. Appl. Phys. Lett. 2010, 97, 121501. [Google Scholar]
Figure 1. Cathode spot view before (left) and after splitting (right) and separation of the new spots away from each other for arc current I = 150 A.
Plasma 07 00019 g001
Figure 2. Example of Ecker’s existence diagram in the plane showing the possible values of temperature–current density in the cathode spot.
Plasma 07 00019 g002
Figure 3. Schematic presentation of an emission center on the top of a point cathode (a) and the surface of a plane cathode (b).
Plasma 07 00019 g003
Figure 4. Dependency of the most probable crater diameter on the arc current for a Cu cathode.
Plasma 07 00019 g004
Figure 5. Schematic presentation of liquid protrusion under plasma heating and plasma pressure: before (left) and after (right) plasma action.
Plasma 07 00019 g005
Figure 6. Schematic presentation (left—spot on the protrusion cathode and right—spot on the bulk cathode) of the physical regions according to the kinetic model of the cathode spot. The numbers indicate the boundaries of the regions explained through the text.
Plasma 07 00019 g006
Figure 7. Cathode potential drop and cathode spot temperature as variables dependent on spot time in nanosecond (ns) region with τ as the parameter, which the characterized initial conditions for protrusion size of 1 µm (maximal uc is about 60 V at τ = 10 ns).
Plasma 07 00019 g007
Figure 8. Cathode potential drop and cathode spot temperature as variables dependent on spot time in nanosecond (ns) region with τ as the parameter, which the characterized initial conditions for protrusion size of 0.5 µm (maximal uc is about 40 V at τ = 10 ns).
Plasma 07 00019 g008
Figure 9. Time dependence of effective cathode voltage for W shower anode indicating agreement with traditional measurements of 6 V [99] at the arc’s beginning (when the cold anode did not influence the gap plasma) and an increase in the uef value of up to 11–12 V with time was observed (when the hot anode reflected the early condensed cathode plasma). The line approximates the measured dependence indicated by the points.
Plasma 07 00019 g009
Figure 10. Spots expanding on the cathode in the form of a ring with arc current 200 A.
Plasma 07 00019 g010
Table 1. Spot type classification by their observed characteristics of lifetime, current and velocity and arc conditions.
CharacteristicsKind of Spot MotionArc and Cathode Surface ConditionsRange of Parameters
vs,
cm/s
Is,
A
ts,
μs
Superfast spot FastPollution surface or with contamination103–104≤100.1–10
Moderately fast Cleaned cathode surface ≤103≤10<0.1–10
Film cathode Cathode with metallic films ≥103~0.11–100
Group spotUnder a magnetic fieldup to 103Few of ten1–10
Group spot SlowIn a vacuum≤10100–300102–103
Individual spotsArc with filled gas in electrode gap10–10010≤100
Disclaimer/Publisher’s Note: The statements, opinions and data contained in all publications are solely those of the individual author(s) and contributor(s) and not of MDPI and/or the editor(s). MDPI and/or the editor(s) disclaim responsibility for any injury to people or property resulting from any ideas, methods, instructions or products referred to in the content.

