1. Introduction to Redispatch Models in Real-Time Operation
The expansion of solar and wind generation has been positioned for more than two decades in an energy market with high marginal costs, and in recent times, in the market of ancillary services that use bidding and auction mechanisms linked to conventional hydrothermal generation [
1]. However, the higher the penetration of renewable energies, the greater the uncertainty caused by economic mismatches in real-time operation, leading the system operator to quickly switch on/off plants by means of an economic merit list and, in the worst-case scenario, to execute a dispatch action randomly without mathematical support, based only on plant start/stop times.
The system operator uses unit commitment models prepared with information prior to the effective operating day. Unit commitment allows the mitigation of demand deviations, frequency variations due to the uncertainty of renewable generation and other externalities such as generation restrictions due to high emissions from fossil fuel power plants [
2,
3]. The problem for the system operator is the real-time operation where mismatch scenarios occur in the generation, transmission, and demand system that are not foreseen in the unit commitment model, leaving the unit commitment model expired and unable to support the system operator’s decisions. In several countries in South America, Europe, and Asia, the economic merit list is used as a substitute for unit commitment to reduce the cost overrun gap between scheduled and real-time operation [
4,
5].
However, there are more sophisticated mathematical models such as real-time redispatch, which allow the replacement of the inefficient methods of random plant dispatches and the use of the economic merit list, given the uncertainty of renewable generation [
6], the overload in the transmission system and generation failures [
7]. The redispatch model is the main support for the system operator that helps to optimally execute economic decisions in accessible times for their timely elaboration, modeling, and execution [
8]. Therefore, implementing a redispatch is a novel proposal. A complete redispatch model must be able to dimension the technical and economic constraints and other characteristics of the market, such as the integration of renewable energies, ancillary services, and inertia modeling. In this context, designing a redispatch model is essential to face the environmental security restrictions, because the economic consequences and the stability of the system can be detrimental due to the retirement of thermal power plants if it does not adapt an adequate renewable generation park in its replacement. The importance of renewable generation in terms of system dynamics and stability is fundamental [
9]. Consequently, if current redispatch models do not integrate the uncertainty of renewable generation, the economic effects will be negative [
10]. It is important that the redispatch development can resolve in advance the technical and economic consequences that could be caused in real time by the uncertainty of solar-wind generation due to forecast errors and meteorological adversities such as cloudiness and extreme winds [
11]. For the system operator, the redispatch model should have an anticipatory role and predominate over other scheduled operation models such as the unit commitment and the economic merit list.
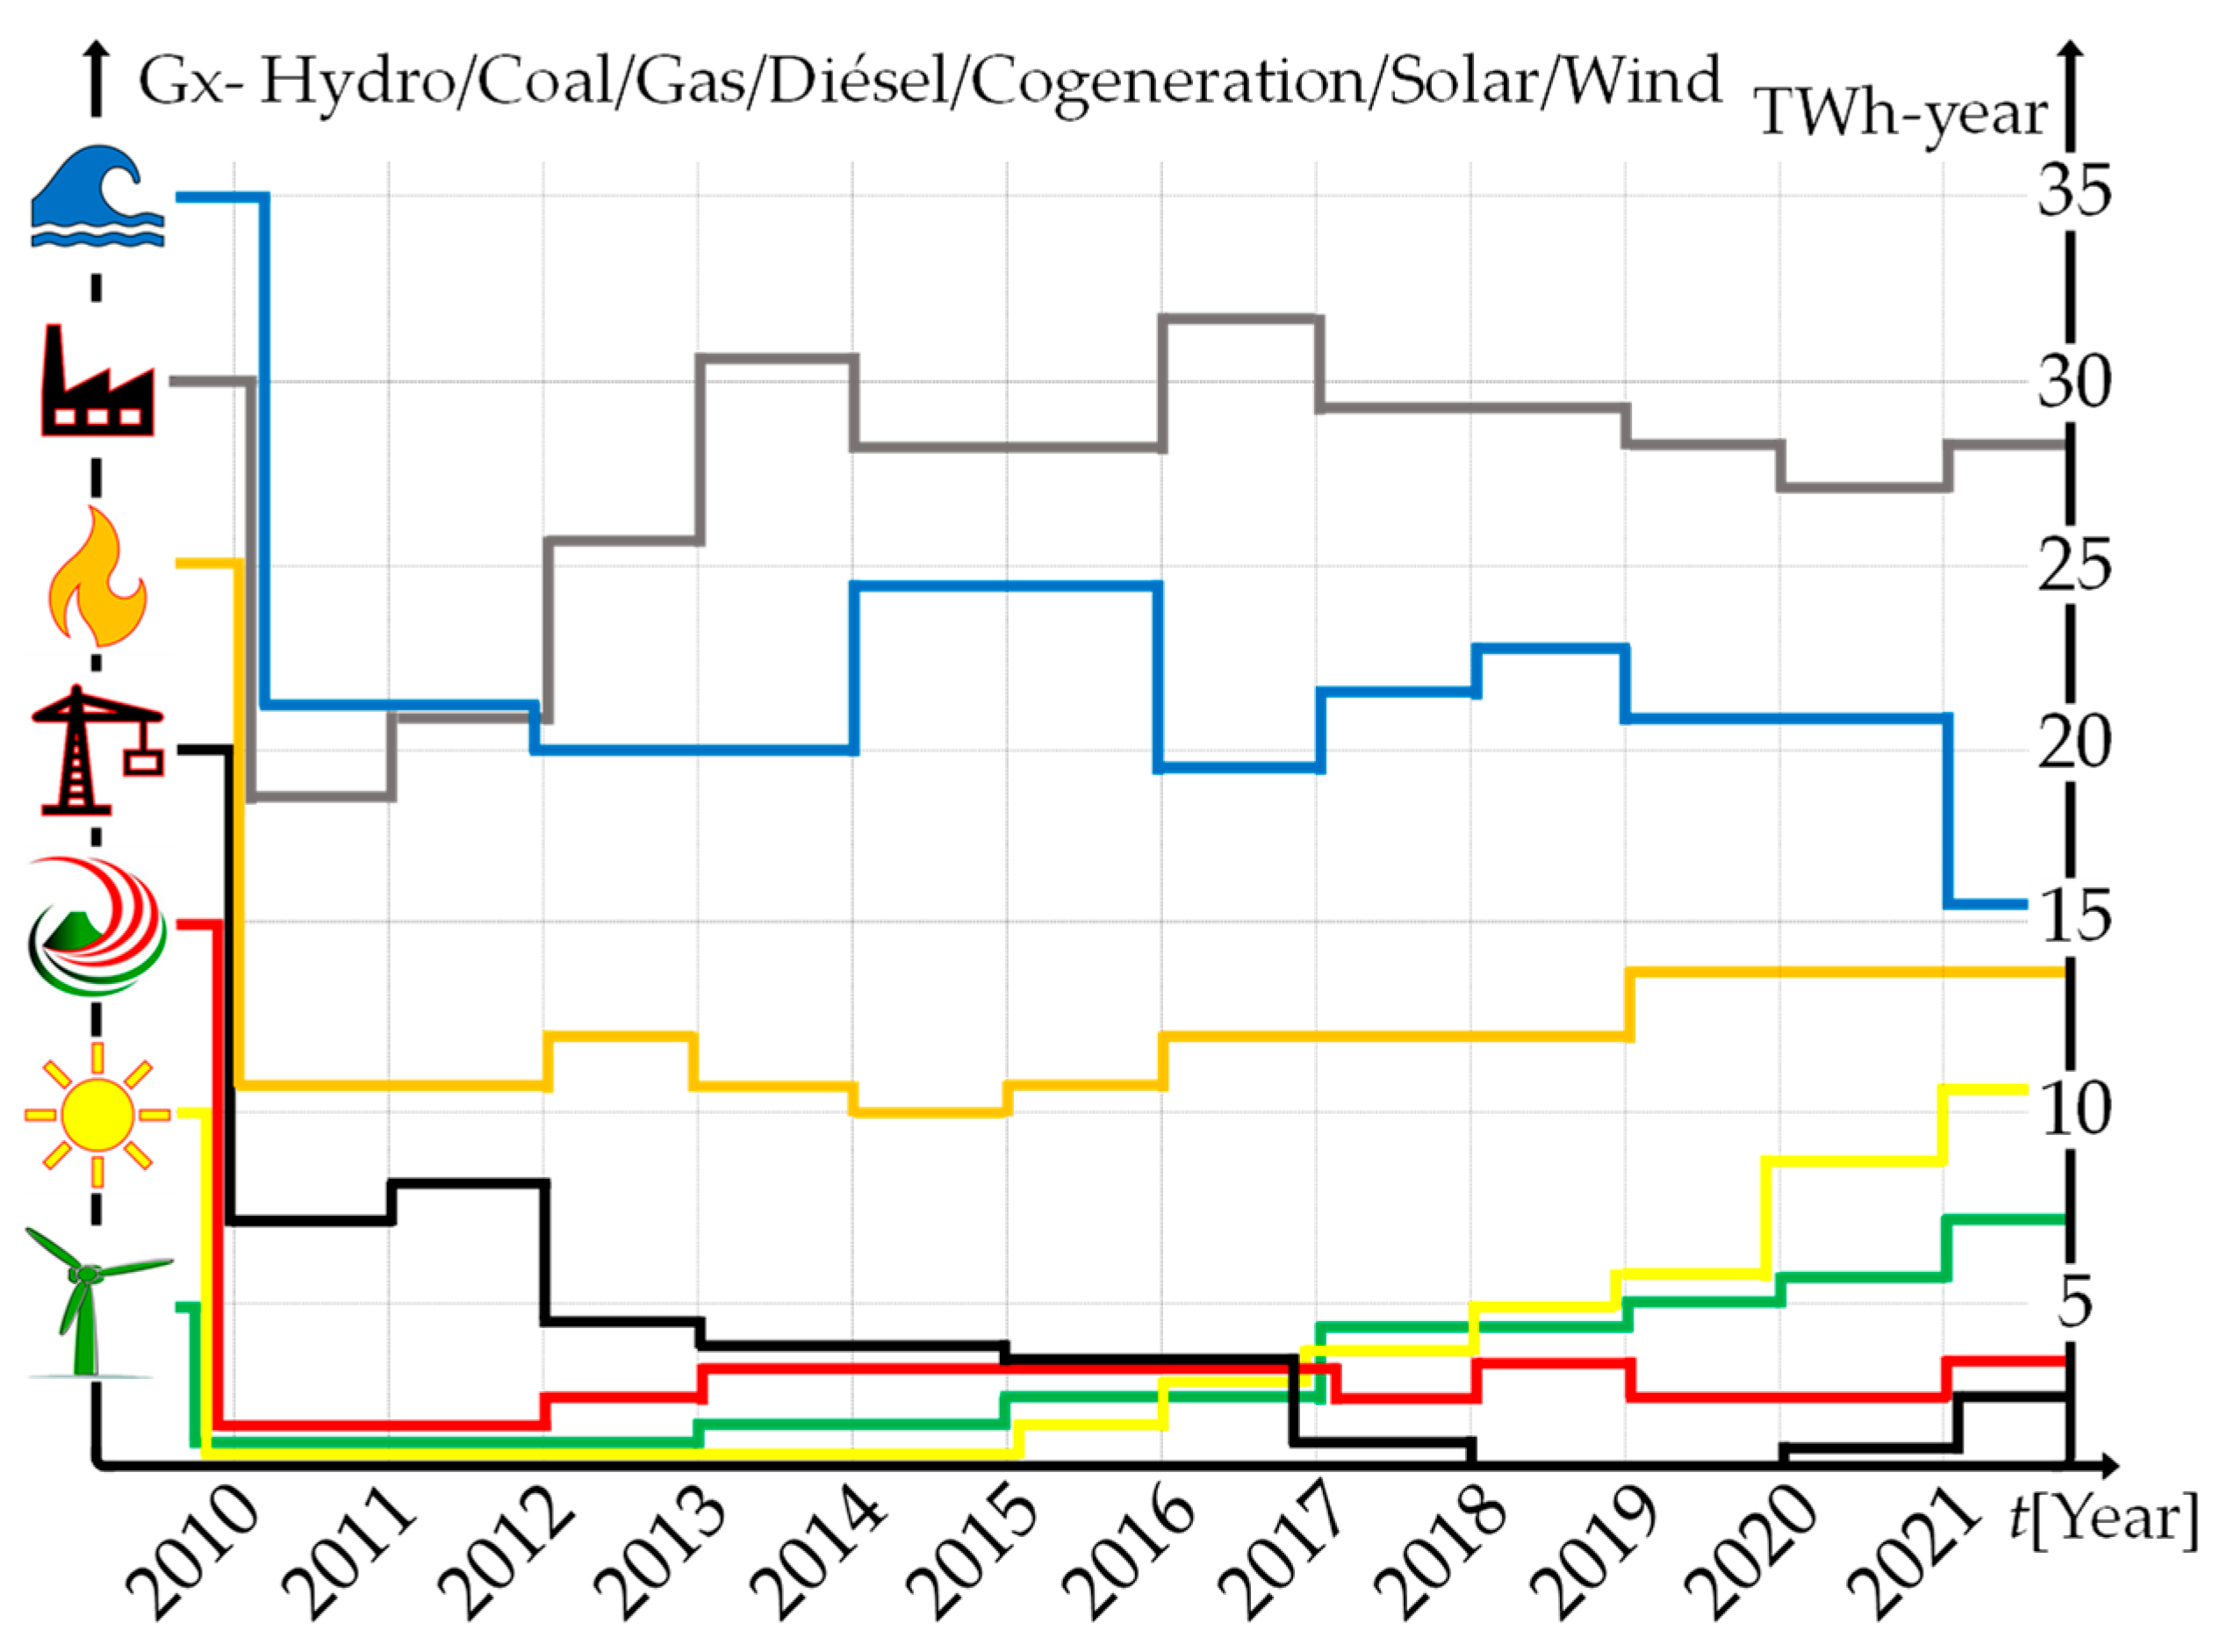
Finally, the main considerations in this redispatch model are the profitability for all available generation plants that supply the demand (
Figure 1) and to integrate a modeling of the gas stock storage for those combined cycle thermal power plants through a correct optimization of the gas resource to avoid monopolistic use by the generating companies. The redispatch model optimizes fuel consumption, which in many of the traditional models is equated to an economic merit list at the maximum value of the power generated as a linearized variable cost, which is why it does not faithfully reflect the variable cost of generation of thermal power plants. Therefore, the heat rate must be adapted to a correct modeling through polynomial equations linked to an operating cost function. In addition, the redispatch model integrates a dynamic constraint called maximum dispatch power and its objective is to avoid undesired low-frequency demand operation due to failures in generation plants. Finally, this redispatch model allows the adaptation of the power reserves of solar-wind renewable generation and their inclusion in the real-time ancillary services market to optimally exercise primary, secondary, and tertiary frequency control.
2. State of the Art of the Redispatch Models in Real-Time Operation
Redispatch is optimal when its modeling and implementation allows for supporting the system operator’s decisions in real time, becoming a powerful operational and market tool. Redispatch is capable of projecting marginal costs and operating costs when there are deviations in the generation, transmission, and demand system. Its development enables covering various technical and economic restrictions of different types of renewable and conventional generation technologies, and it can even be coupled to the ancillary services market.
Most redispatch models limit renewable generation by causing zero-cost energy shedding, to respect n-1 security criteria [
12]. There are also economic papers that model gas networks in detail with their pressure and flow capacities for power generation, considering safety and coupling constraints [
13]. It should be noted that the economic dispatch problem is the faithful reflection of the merit order list which then migrates to a mixed integer linear programming (MILP) unit commitment model using optimal direct current power flow (DC-OPF) [
14,
15]. Other works are devoted to planning redispatch models to mitigate the impact of fault events in gas networks [
16]. Redispatch models have succeeded in integrating load flexibility, as is the case of the German electricity system that uses a zonal pricing mechanism [
17]. In Central and Western Europe, they use redispatch to manage transmission congestion within critical electricity zones using generation bids [
18]. However, the model lacks a systemic dimension, and the aim is to quantify the results of zonal redispatch by testing the developed model in a power system with a larger number of power plants, lines, and busbars [
19]. In situations of a total system blackout, there are works that propose two-stage schemes to predict the risk of a blackout in electric power systems. In the first stage, they model the power islands using a mixed integer nonlinear integer programming model that minimizes the cost of redispatch and unsupplied energy, while in the second stage, a data search technique is refined to predict the risk of separation electrical zones from the rest of the system [
20,
21].
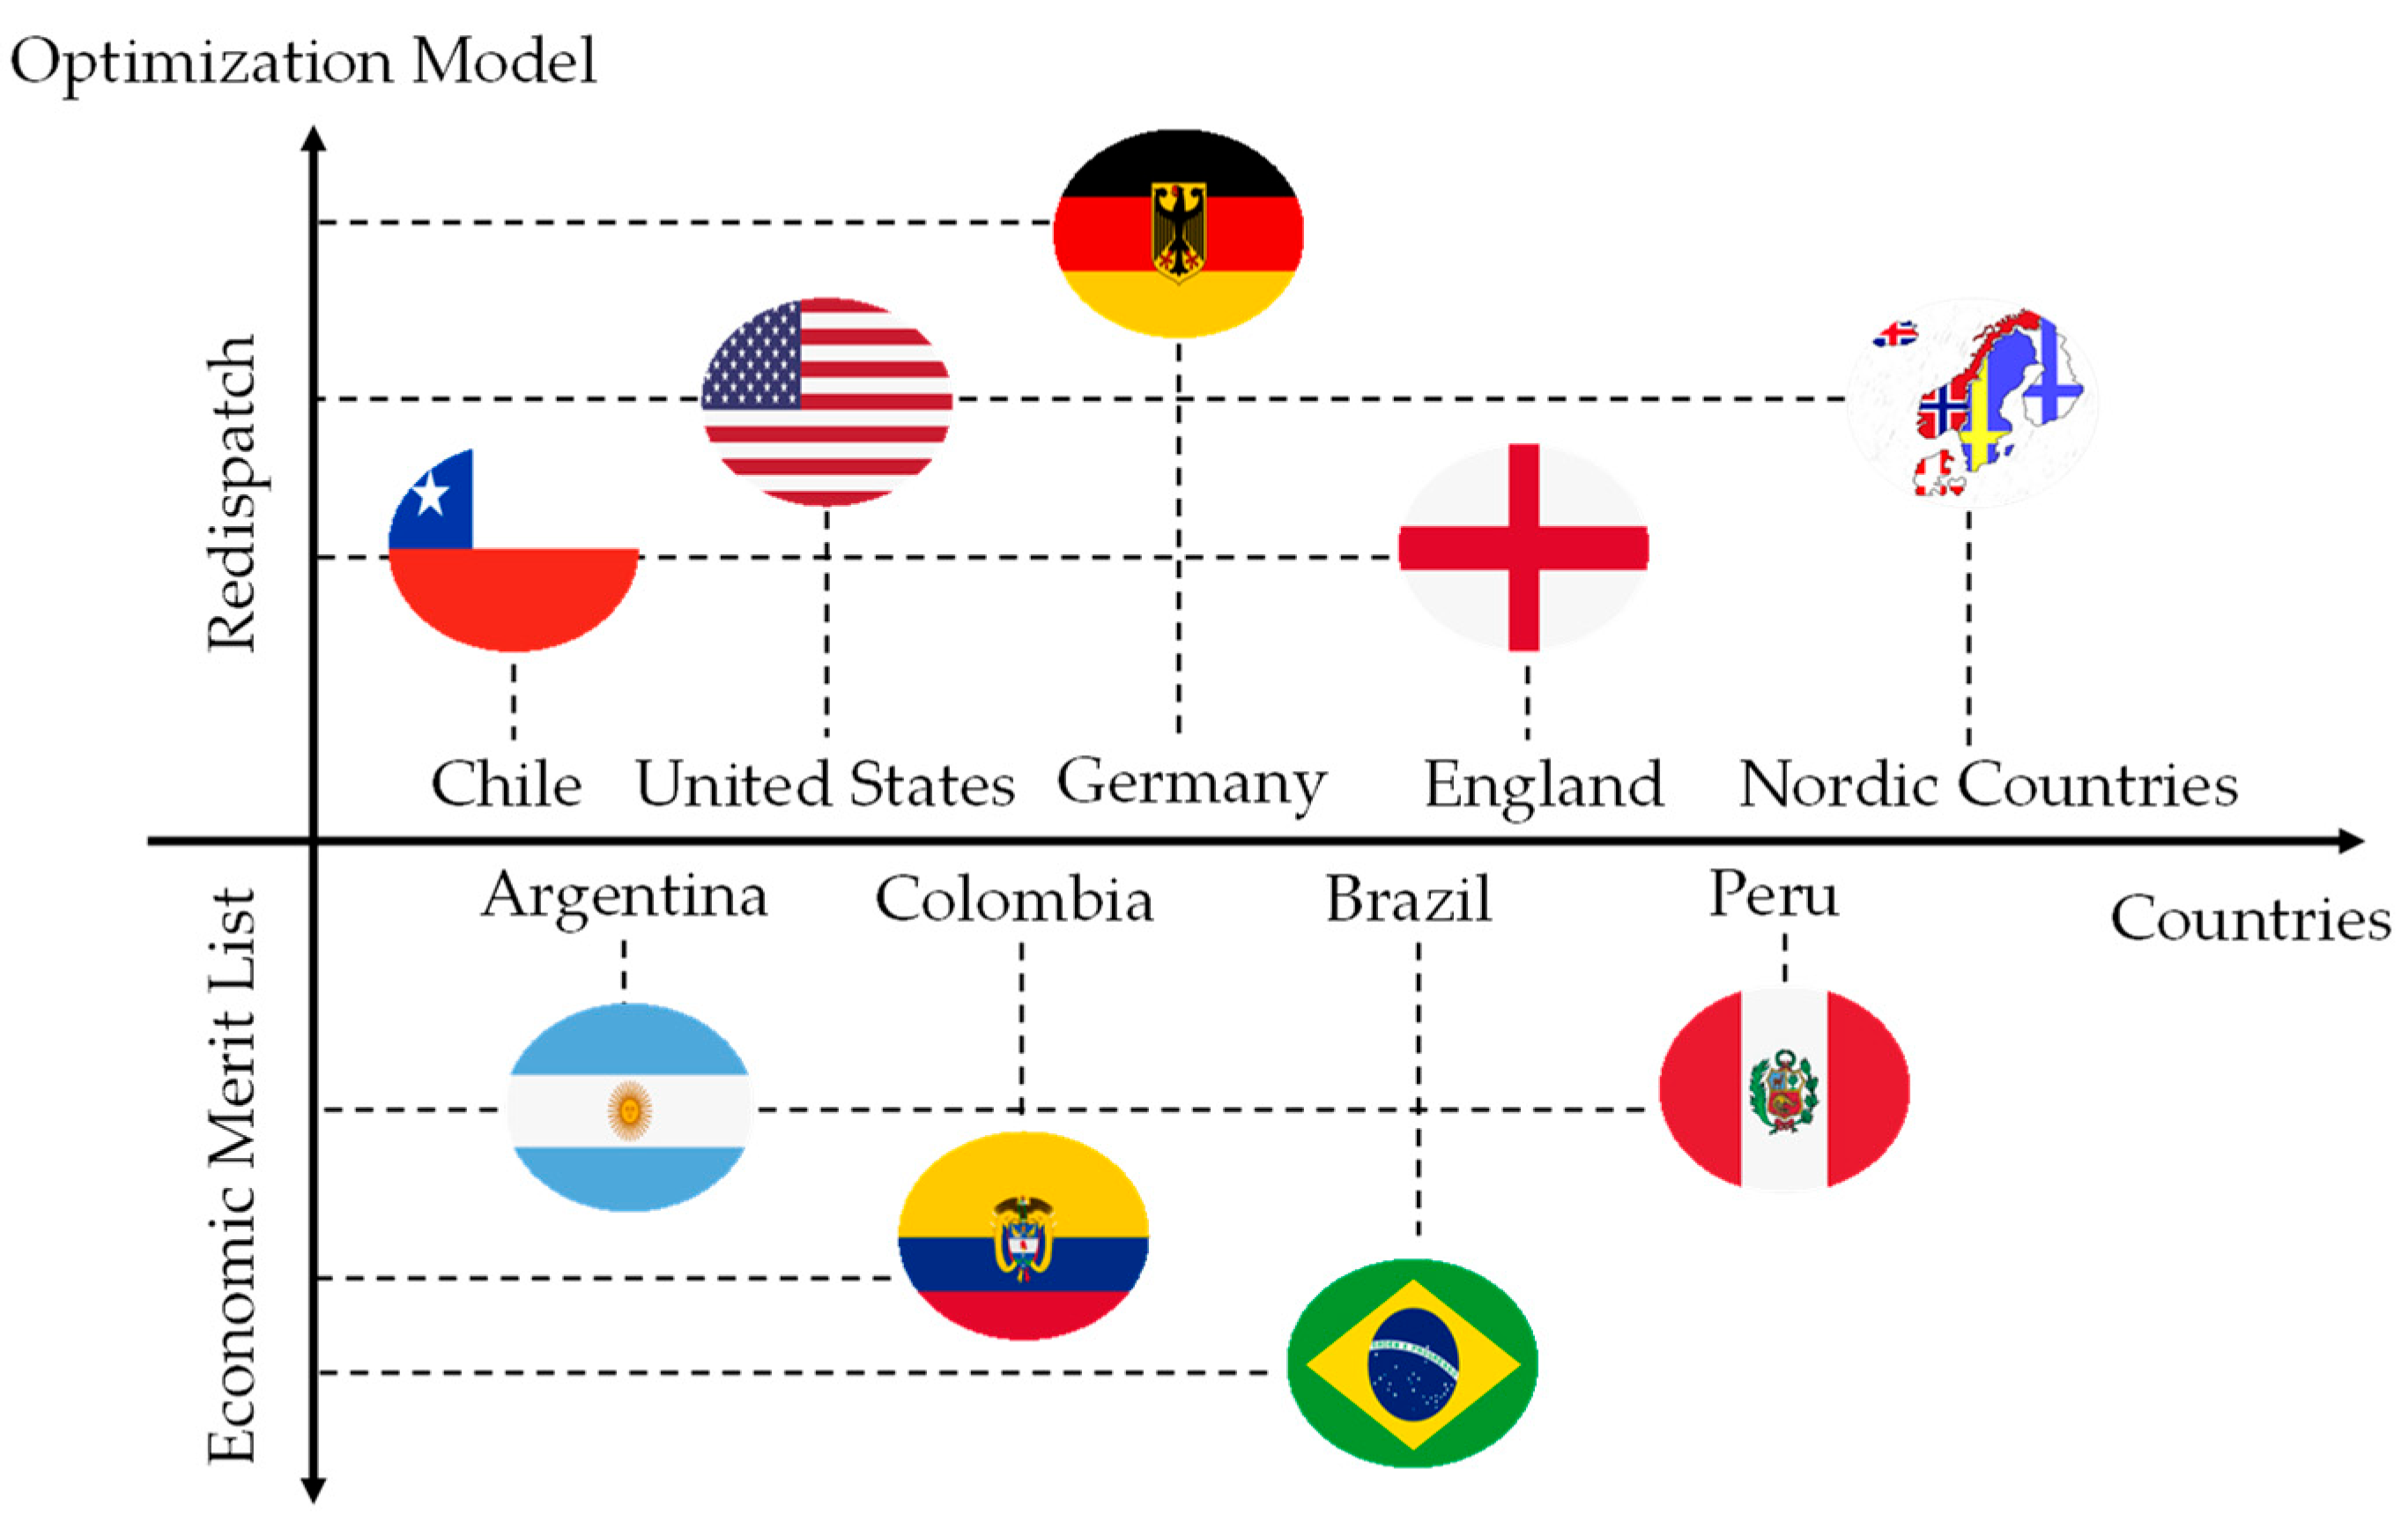
In South America, the most usual method for redispatch models that help mitigate generation system and demand uncertainty is the merit order list power plant pricing model, as shown in
Figure 2. The merit order is a ranking of plants ordered from lowest to highest based on variable generation costs. The merit order list redispatch model uses maximum power prices with demand responding to the price between the market equilibrium for both perfect competition and natural monopoly [
22]. There are other advances called more specific redispatch submodels and targeting the market for ancillary services applied to automatic generation control (AGC) [
23]. At present, transmission lines that do not undergo investments in maintenance, capacity increase, or new expansions cause congestion in power flow and increased losses. System losses is a fictitious demand that increases marginal costs and energy prices. This paper proposes a redispatch model that focuses on loss minimization using an objective function that includes the system loss model to minimize plant dispatches [
24]. The system parameters that generate uncertainty are calculated based on operational results in previous days and actual incoming data through knowledge delivered by the system operator, resulting in a real-time optimization with acceptable timing and solutions [
25]. The simulation of redispatch models has shortcomings in the tuning of technical and economic parameters, caused by the size of the system, high convergence times, and global cost solution far from the optimum value. However, unsupplied energy is one of the most important. For this situation, there are works that focus on the stability before executing the redispatch, where they use a load shedding method using classical neural networks and shallow learning algorithms for a 39-bus system, as in the case of New England, and a 41-bus system in Nordic countries [
26].
Finally, knowledge about redispatch is a problem that is not yet widely mastered. In the literature, it is evident that there is a gap in such models, because redispatch integrates several constraints separately or partially combined (n-1 criteria, renewable integration, load shedding, merit order, gas integration, etc.) that have helped the new way of operating in real-time modern power system markets. However, this work proposes a novel redispatch model, since it brings together most of what other models integrate separately and focuses on linking, in real time, the ancillary services market to establish the necessary reserves for frequency control. It also integrates unique economic and operational constraints such as maximum dispatch power to avoid underfrequency load shedding, polynomial modeling of thermal power plant heat rate [
27,
28,
29,
30,
31,
32,
33,
34], modeling of gas storage stock, and even the operational states of hydro power plants under dry, medium, and wet hydrology conditions. It is expected that this redispatch model can be a reference for other authors, since it specializes in real-time operation matters with different types of generation technologies and exclusive demand conditions in a scientific field with a limited domain.
3. Methodology to Develop and Execute a Redispatch Model in Real-Time Operation
The methodology is executed in real time with a redispatch model that is designed to be tested and applied in any standard test power system and is even adaptable for a real power system of any country. This redispatch methodology is applied in real-time operation through the development of a sequence of theoretical foundations and implementation of mathematical equations, which optimally guide the system operator in the technical and economic actions, during the entire time horizon of higher generation uncertainty and that differentiate it from the rest of the traditional unit commitment and redispatch models.
Mathematically, the redispatch model methodology performs a multinodal optimization for any electrical system, including busbars, lines, transformers, substations, and generators, by means of an objective function that minimizes operating, start-up, outage, and non-supplied energy costs. The redispatch results are obtained with fast convergence times and help the system operator to make timely decisions. Finally, the structure, modeling, and implementation of the redispatch model are novel compared to the classical static economic dispatches and the economic merit list. The redispatch differs by integrating unique technical and economic constraints, such as the polynomial modeling of the heat rate for thermal power plants, modeling of gas volume stock and hydro reservoirs, uncertainty of solar-wind renewable energies, and the maximum dispatch power that avoids underfrequency load shedding.
3.1. Theoretical Methodology Defining the Conceptual Structure of a Redispatch
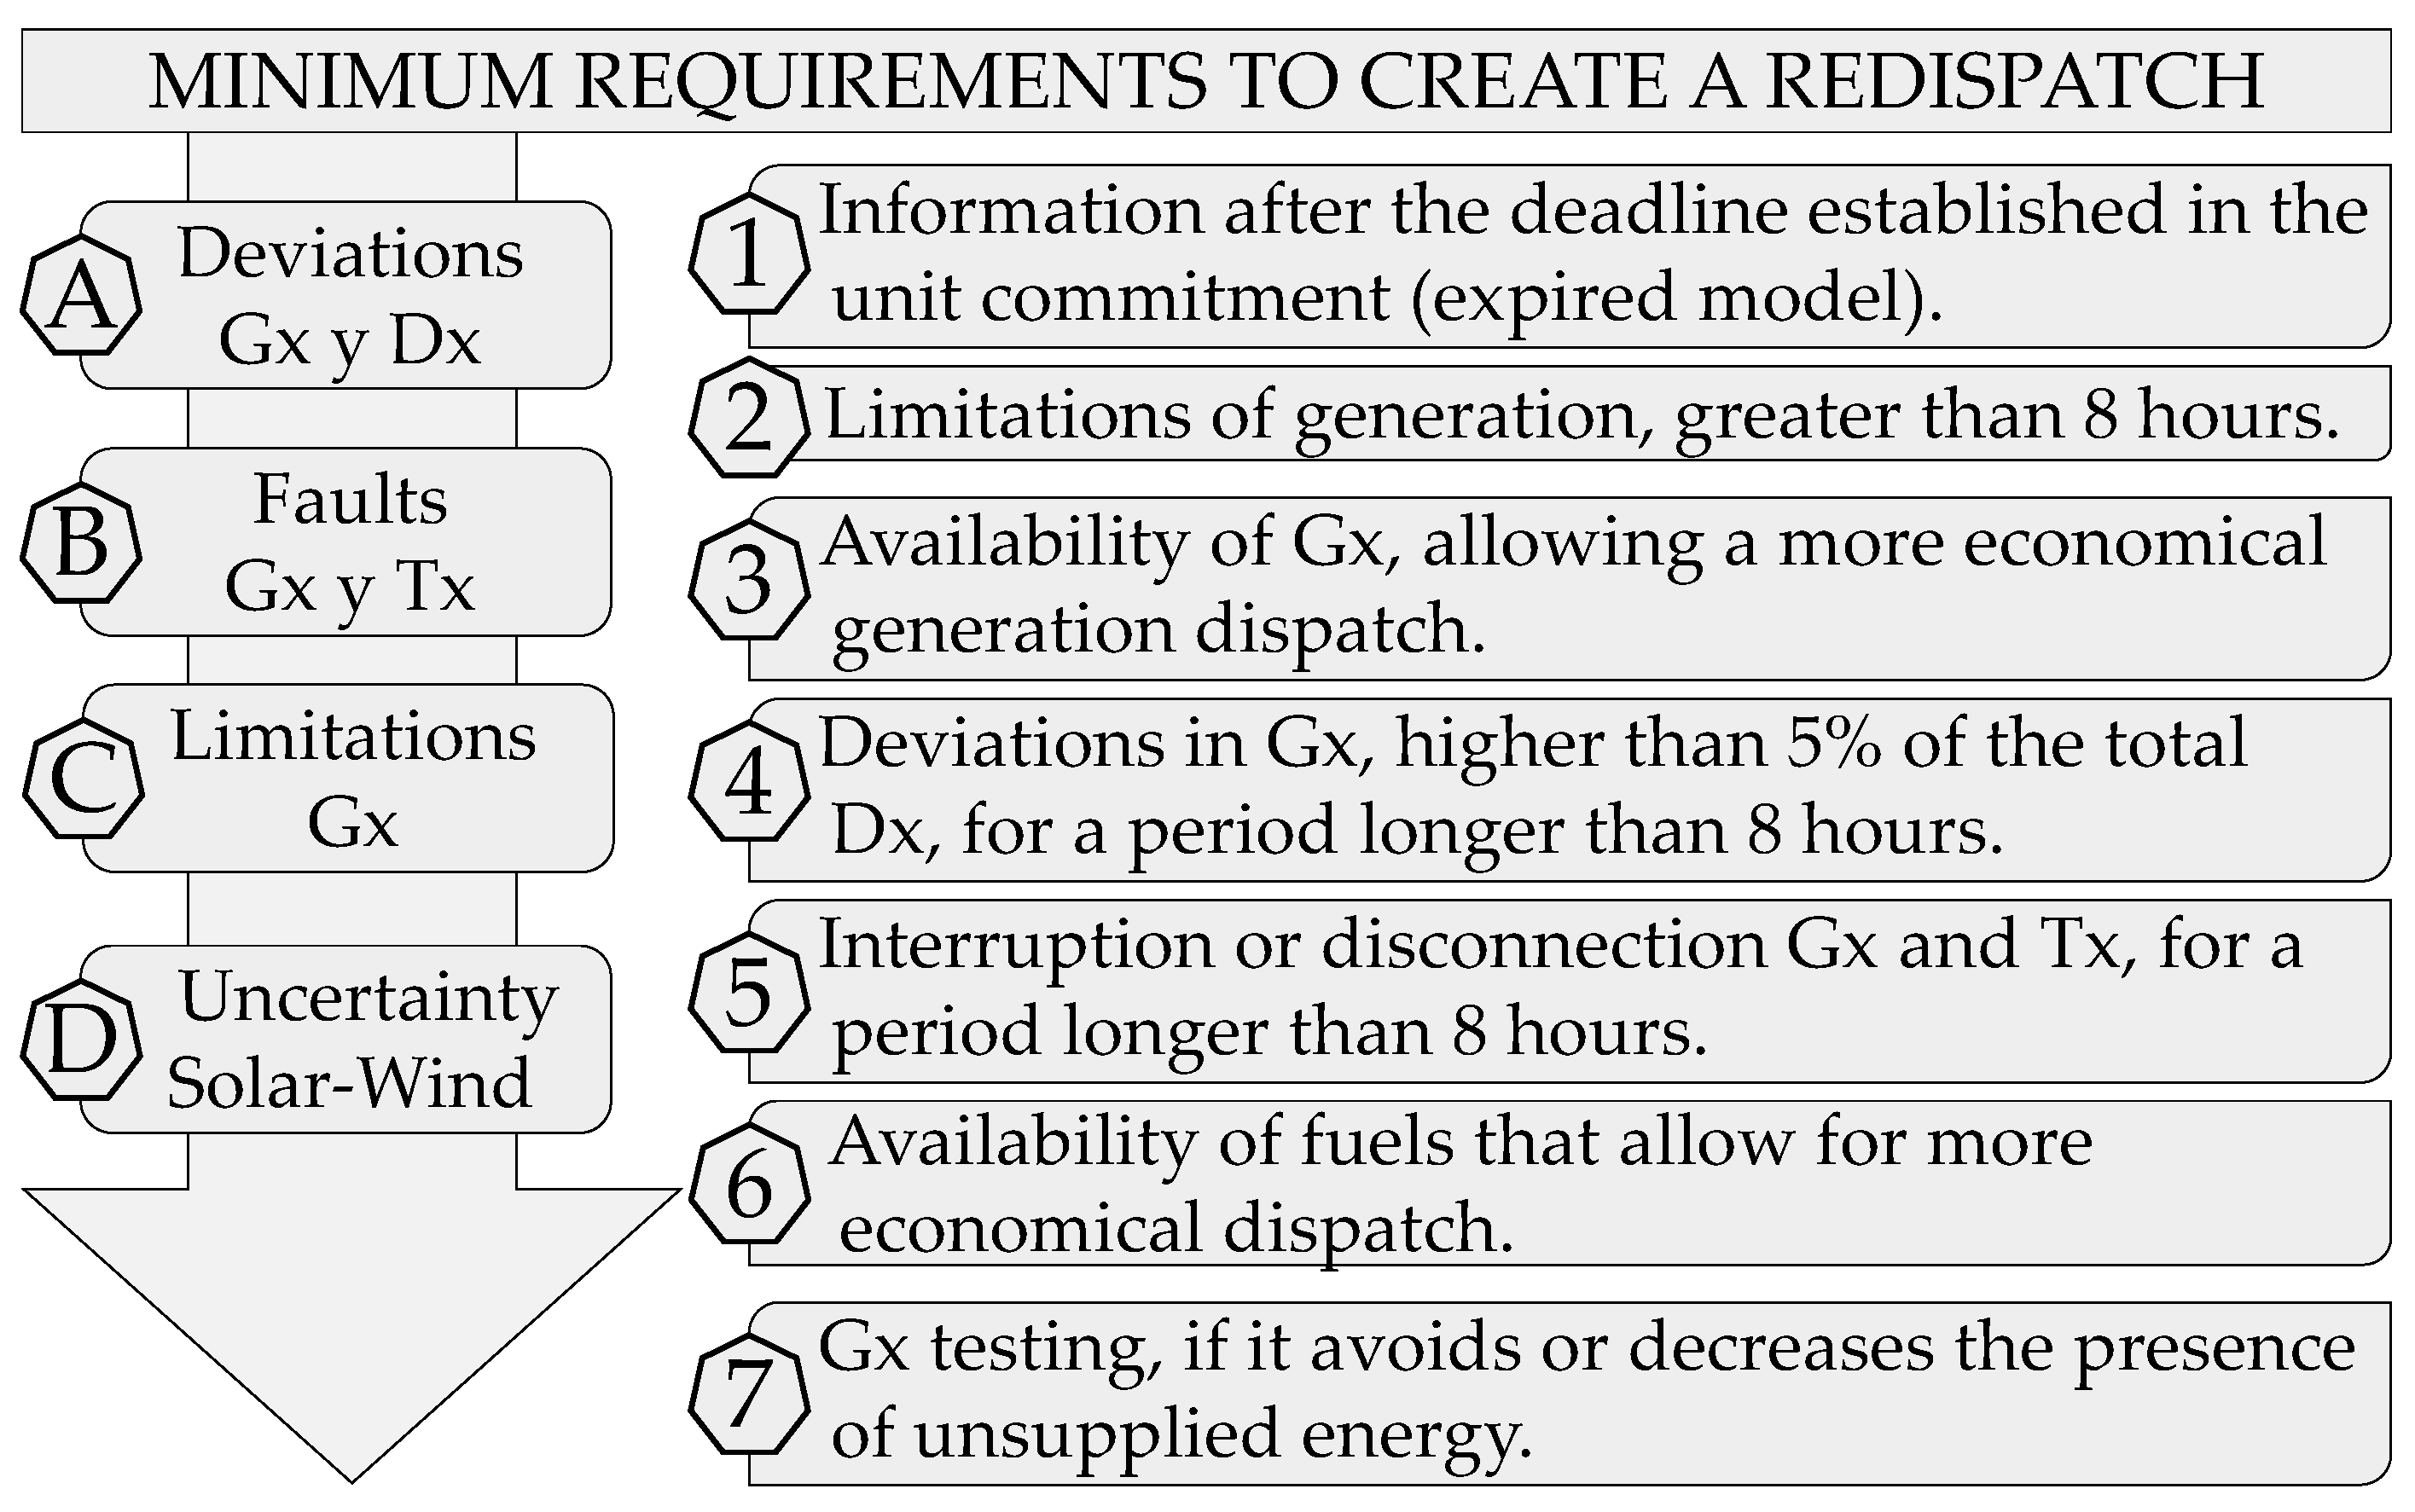
This theoretical methodology is designed to support the system operator’s decision in the optimal execution of a redispatch. However, it is important to emphasize that redispatches must be properly executed according to the system requirements, since their constant random execution without theoretical justification causes the system operator an operational stress that results in a sequence of unforced errors in the dispatches of the plants. Preliminarily, this methodology has a technical structure composed of four symptoms (a, b, c, d) of operating anomalies that must be detected by the system operator before executing a redispatch. Consequently, there are as follows: (a) deviations in generation (Gx) and demand (Dx); (b) fault occurrences in the generation and transmission system (Tx); (c) power limitation in generation plants due to technical causes; (d) uncertainty of solar and wind renewable generation. After detecting at least one of the four technical anomalies that provide preliminary evidence of the need for a redispatch, a more specific analysis is performed, which consists of detecting seven critical system symptoms that determine the final decision to perform a real-time redispatch, as shown in
Figure 3.
The first critical symptom of the system corresponds to the information received in real time by the dispatch and control center (CDC) outside the time limit established in the unit commitment modeling, which immediately causes a deviation in real time. In the second critical symptom, generation limitations of more than 8 h are evidenced. The third critical symptom corresponds to the uncertainty of the availability of generation plants that allow a more economical operation. In the fourth critical symptom, there are deviations in generation higher than 5% of the total demand for a period longer than 8 h. The fifth critical symptom is generation and transmission disconnections for a period of more than 8 h. The sixth critical symptom is the availability of fossil fuels that allow a more economical dispatch. Finally, the seventh critical symptom corresponds to generation plants that are generating in a test state towards the system, considering whether this condition prevents or reduces the presence of unsupplied energy.
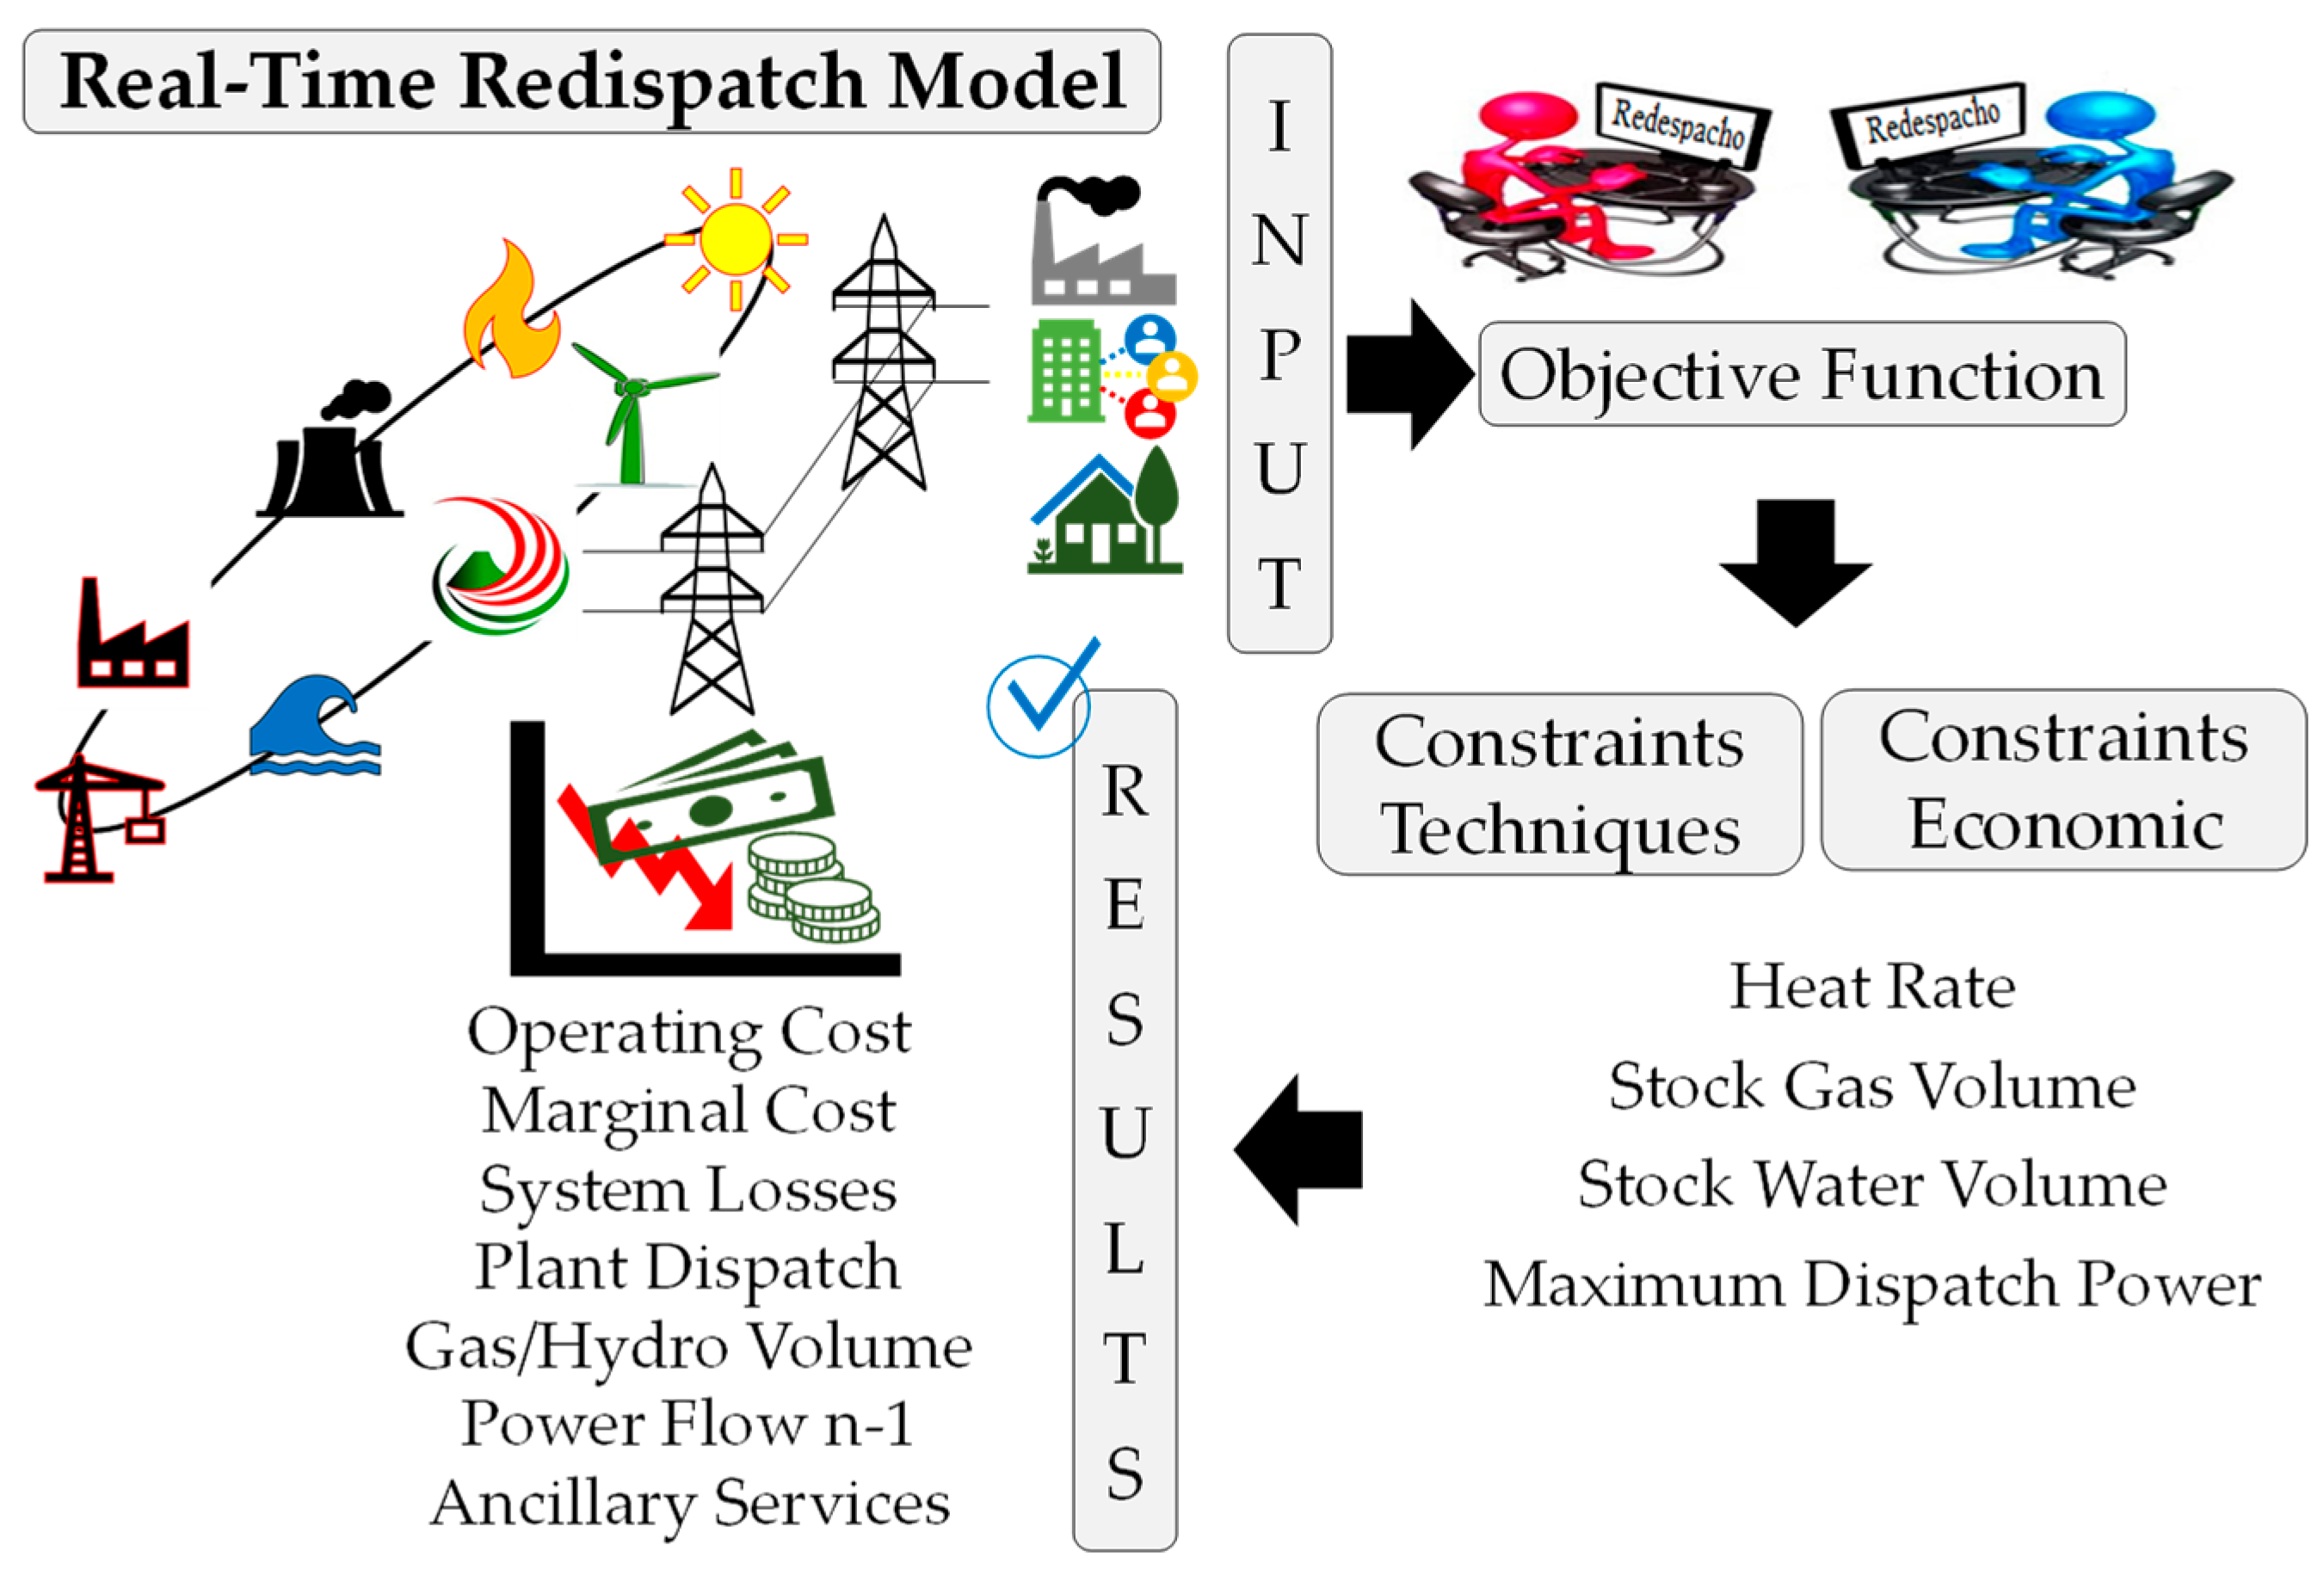
3.2. Mathematical Methodology to Implement the Modeling of a Redispatch
The numerical methodology proposed for the redispatch model corresponds to the implementation of nine mathematical formulations of a technical, economic, and environmental nature, as shown in
Figure 4.
First, there is the objective function that allows minimizing the global cost of redispatch, which depends on the cost of conventional generation, renewable generation, start-up cost, detention cost, and energy not supplied, as shown in Equation (1). Second, we integrate the variable generation cost constraints by a polynomial function of the heat rate, as shown in Equations (2) and (3). Thirdly, three thermal states of the starting costs (hot, warm, and cold) are defined as a function of the on and off times, according to Equations (4)–(8). In fourth place, there are the technical restrictions of the dispatch power between technical minimum and maximum generation, according to Equation (9). Finally, in fifth place is the power balance coupling constraint, according to Equations (10) and (11).
In addition, the main contribution of this work is highlighted and corresponds to the numerical equations of technical and economic constraints from point 3.1.6 to 3.1.9 of this section. Point 3.1.6 of this section describes Equations (12)–(14), which correspond to the primary power reserve, spinning reserve, and cold reserve, intended for frequency control, and directly related to the ancillary services market.
Section 3.2.7 describes a safety constraint called maximum dispatch power to avoid load shedding due to low frequency, as shown in Equation (15). Finally, points 3.1.8 and 3.1.9 of this section correspond to the mathematical modeling of gas volume stock control for thermal power plants and hydro generation storage through a level of control level for large reservoir hydro plants, as shown in Equations (16)–(18).
3.2.1. Real-Time Objective Function Defining the General Mathematical Structure of the Redispatch Model
where the objective function
represents the minimization of the operating costs of the n plants in hour h for conventional generation
and renewable
. In addition, it integrates start/stop costs
/
of the plants with the binary state [1,0], on/off status
, and unsupplied energy
.
3.2.2. Polynomial Definition of Variable Generation Cost as a Function of Heat Rate
where
represents the variable cost of each plant n, which depends on the heat rate
, the polynomial coefficients
, the fuel price
, and the non-fuel variable cost
in the period h.
3.2.3. Three-State Thermal Economic Formulation of Start-Up and Detention Costs
where
is the starting cost and
the stopping cost for the n plants, for the different temperature conditions (hot/warm/cold)
,
,
, considering the on/off times h on/off switch
/
and the minimum on/off times
/
.
3.2.4. Technical Constraint Defining the Minimum and Maximum Power Offset for a Power Plant
where
and
is to the maximum and minimum generation power in (MW) of the n plants in period h.
3.2.5. Coupling Constraint Defining the Balance of Power Generation to Supply Demand and Grid Losses
where
is the power generated by plant n in hour h, to supply
, which is the demand in hour h and the system losses
in hour h. In addition, it must be fulfilled that the minimum power
of all the power plants is less than or equal to the power demand of the system
.
3.2.6. Determination of Power Reserves for Frequency Control and its Relationship to the Complementary Services Market
where power reserves are established by the
as the primary reserve,
is the spinning reserve, and
is the reserve for lowering the generation of the n plants in period h. These primary and secondary power reserves are a function of the dynamic response factor
, maximum power
, and the dispatch power
.
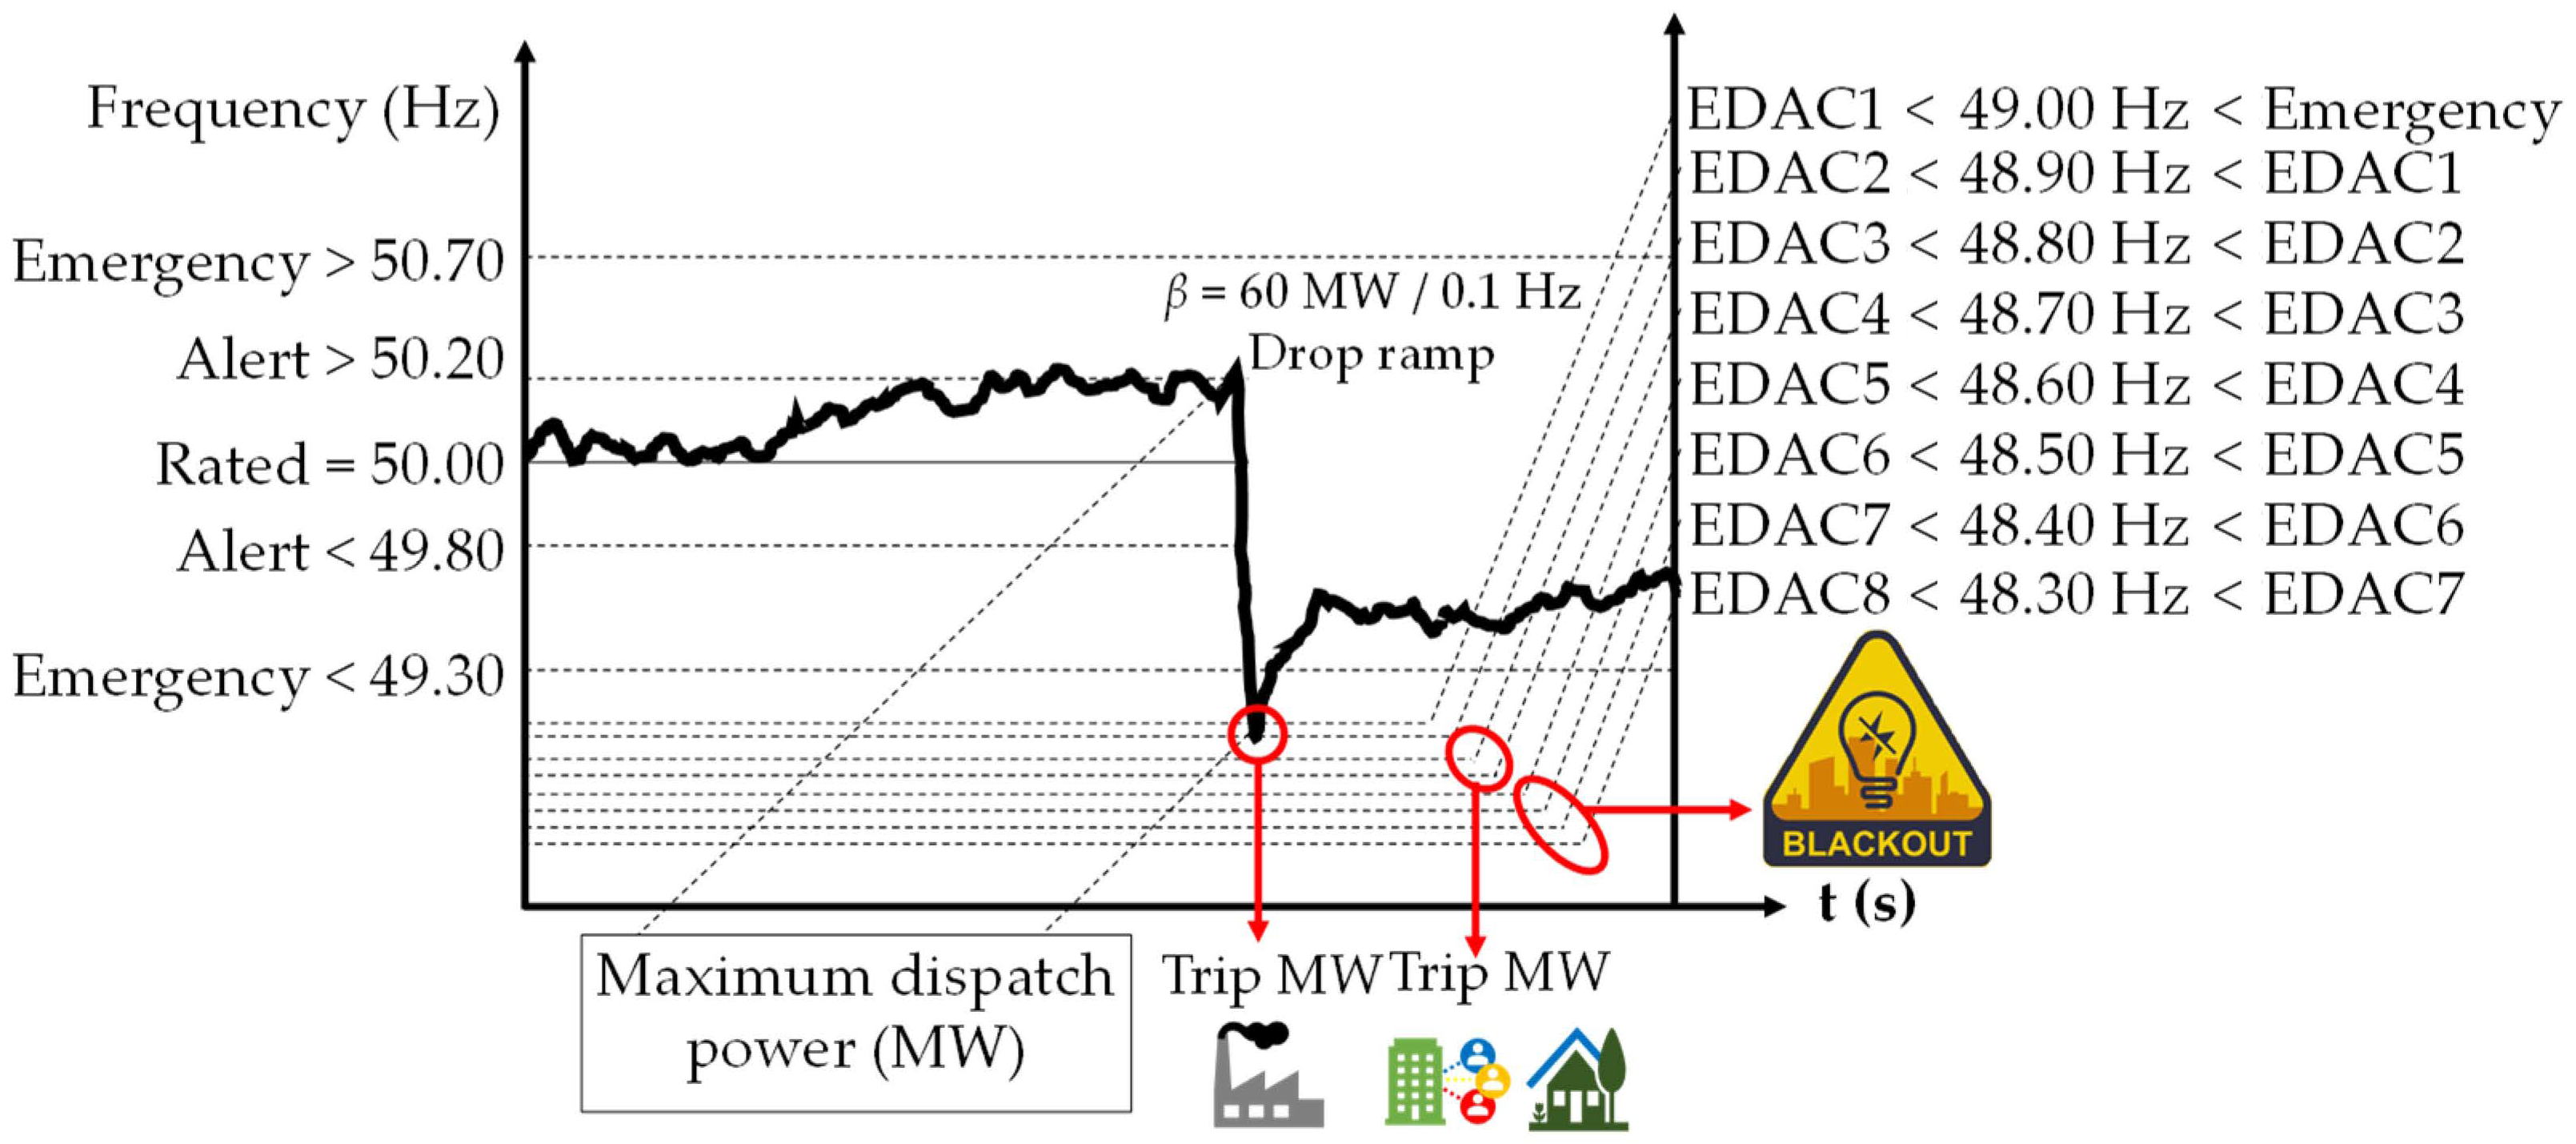
3.2.7. Mathematical Formulation Defining Maximum Dispatch Power for System Security
where
is the maximum dispatch power in (MW) based on the theoretical automatic load disconnection scheme
, real-time automatic load shedding scheme
, and a safety factor
with a value between (0,9) applied in the period h.
The maximum dispatch power is used as a safety parameter that limits any power plant to exploit its generation to the maximum when the safety of the system is put at risk. This work proposes to integrate the maximum dispatch power into the redispatch model to avoid automatic load shedding due to low frequency, as shown in
Figure 5.
3.2.8. Mathematical Formulation for Gas Volume Stock Control for Thermal Power Plants in Combined Cycle and Open Cycle Configuration
where
is the power generated by the n gas-fired power plants and
is the energy generated by n gas-fired power plants, while
is the volume in m
3 of gas per week in a period h and
. is the heat rate in m
3/MWh.
3.2.9. Mathematical Model Defining Water Storage of Reservoir Power Plants by a Level of Height Control
where
is the initial height level of the reservoir and the term
is the final height level of the reservoir measured at (m.s.n.m), while
corresponds to the efficiency of the turbine in MWh/cm, the term
is the tributary of the reservoir transformed to MWh, and
is the daily accumulated energy in MWh-Day.
3.3. Methodology Defining the Process of Simulation and Validation of the Redispatch Model Using Optimization Software
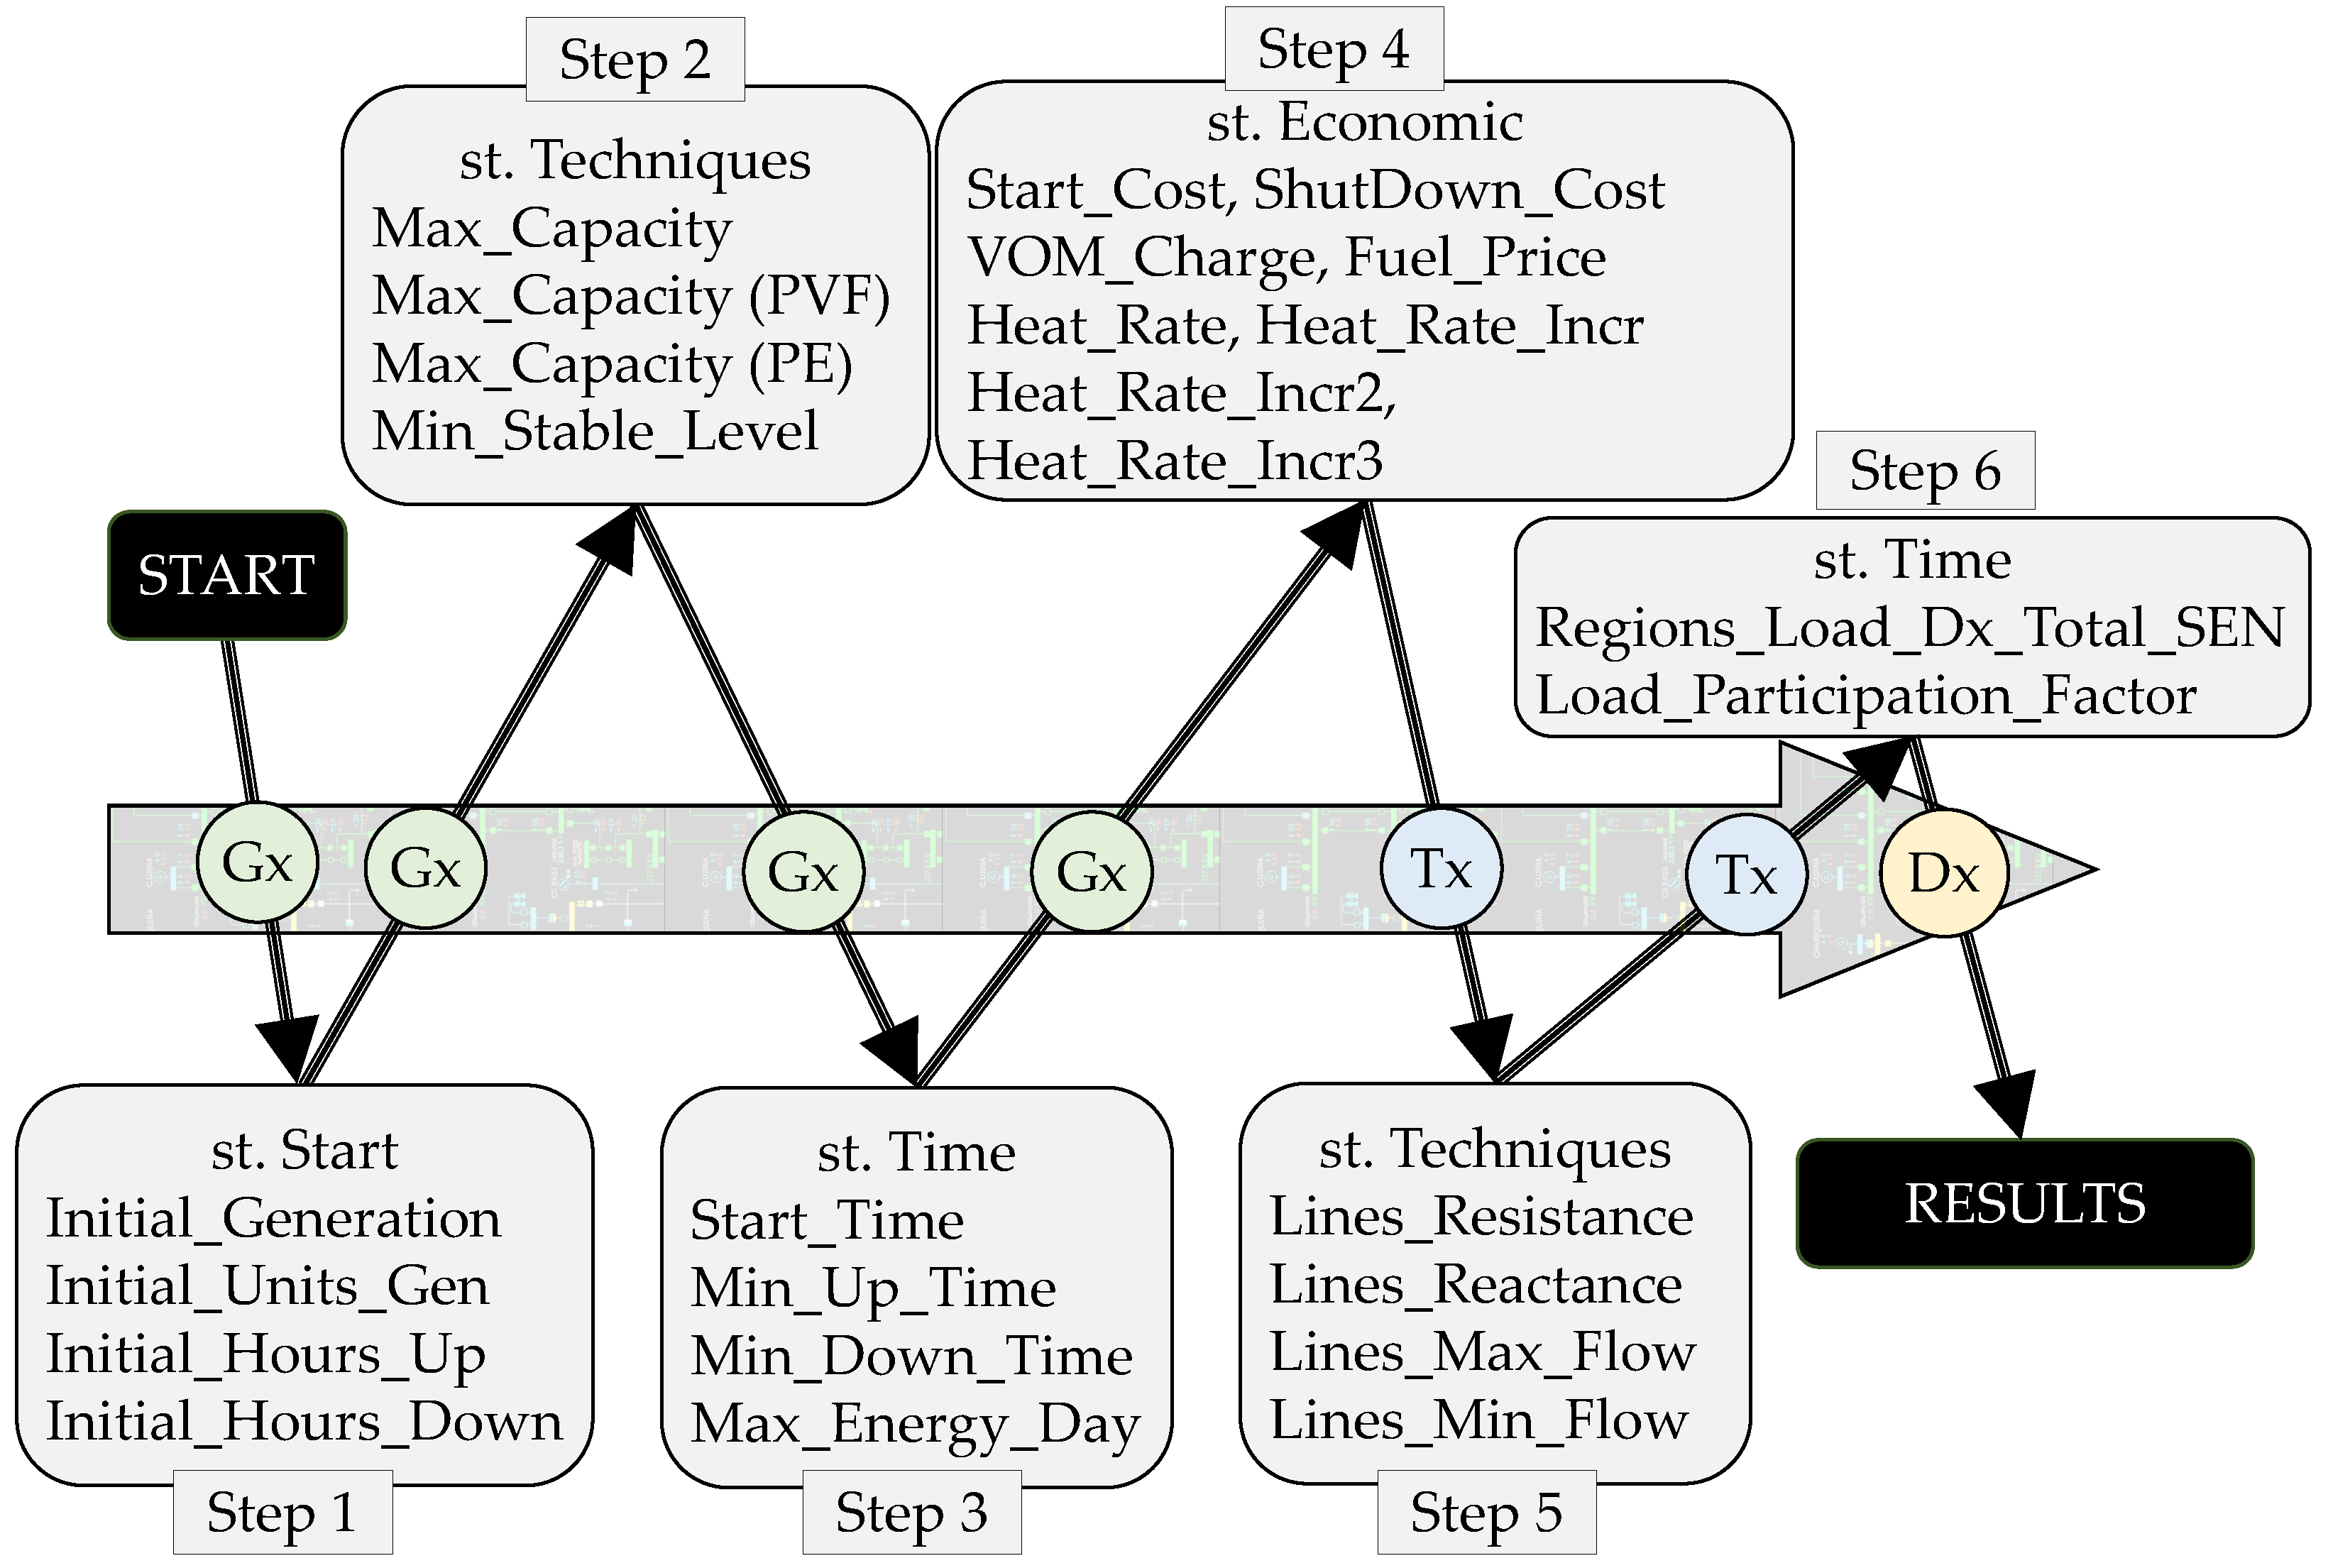
The following methodology is developed to implement a sequence of simulation processes in any optimization software that integrates the theoretical foundations and mathematical expressions required by a redispatch. The modeling structure of a redispatch has a direct coupling axis between generation, transmission, and demand.
Figure 6 shows a sequence of six stages of the simulation from the beginning of a redispatch to its result. From stage one to stage four, it is exclusively the generation segment that integrates initial system state constraints (plant on/off state, power level, on hours and off hours), plant technical constraints (maximum solar and wind generation capacity, maximum power and technical minimums), plant timing constraints (start-up times, minimum operation and shutdown times, maximum available hourly and daily energy), and economic constraints (start-up/shutdown costs, fuel price, operation/maintenance cost and heat rate). Meanwhile, stage five corresponds to the transmission segment, which includes the technical restrictions of line impedance and maximum and minimum limits of power flows. Finally, stage six is the demand segment which includes the time constraints due to the participation factors at each bus and the total demand curve evolution, as shown in
Figure 6.
However, the modeling for this proposed redispatch model is run with PLEXOS software (version 9.000 R8, Energy Exemplar, North Adelaide, Australia, 2022) and the validation of results is tested in a real power system with high penetration of renewable energies, variability of fossil fuels, and climatic consequences due to water deficit. This simulation tool uses an external optimizer to solve the mathematical optimization problem. The optimizer has a general purpose that employs the mixed integer programming method (Branch and Bound).
4. Modeling and Validation of Redispatch through Simulation of Realistic Scenarios of Technical-Economic Impact on Conventional and Renewable Generation
The redispatch model can capture in real time the deviations in generation, demand, and faults in the network that are not included in the unit commitment models. This redispatch model is designed to be tested in any real system or test system and check its validity with the theoretical method and its mathematical formulation. However, it is important to present scientific advances with real electrical power systems to increase the expectations of application in the industry.
4.1. Structure and Design of a Multimodal Electric System That Adapts to the Modeling of a Segmented Redispatch in Generation, Transmission and Demand
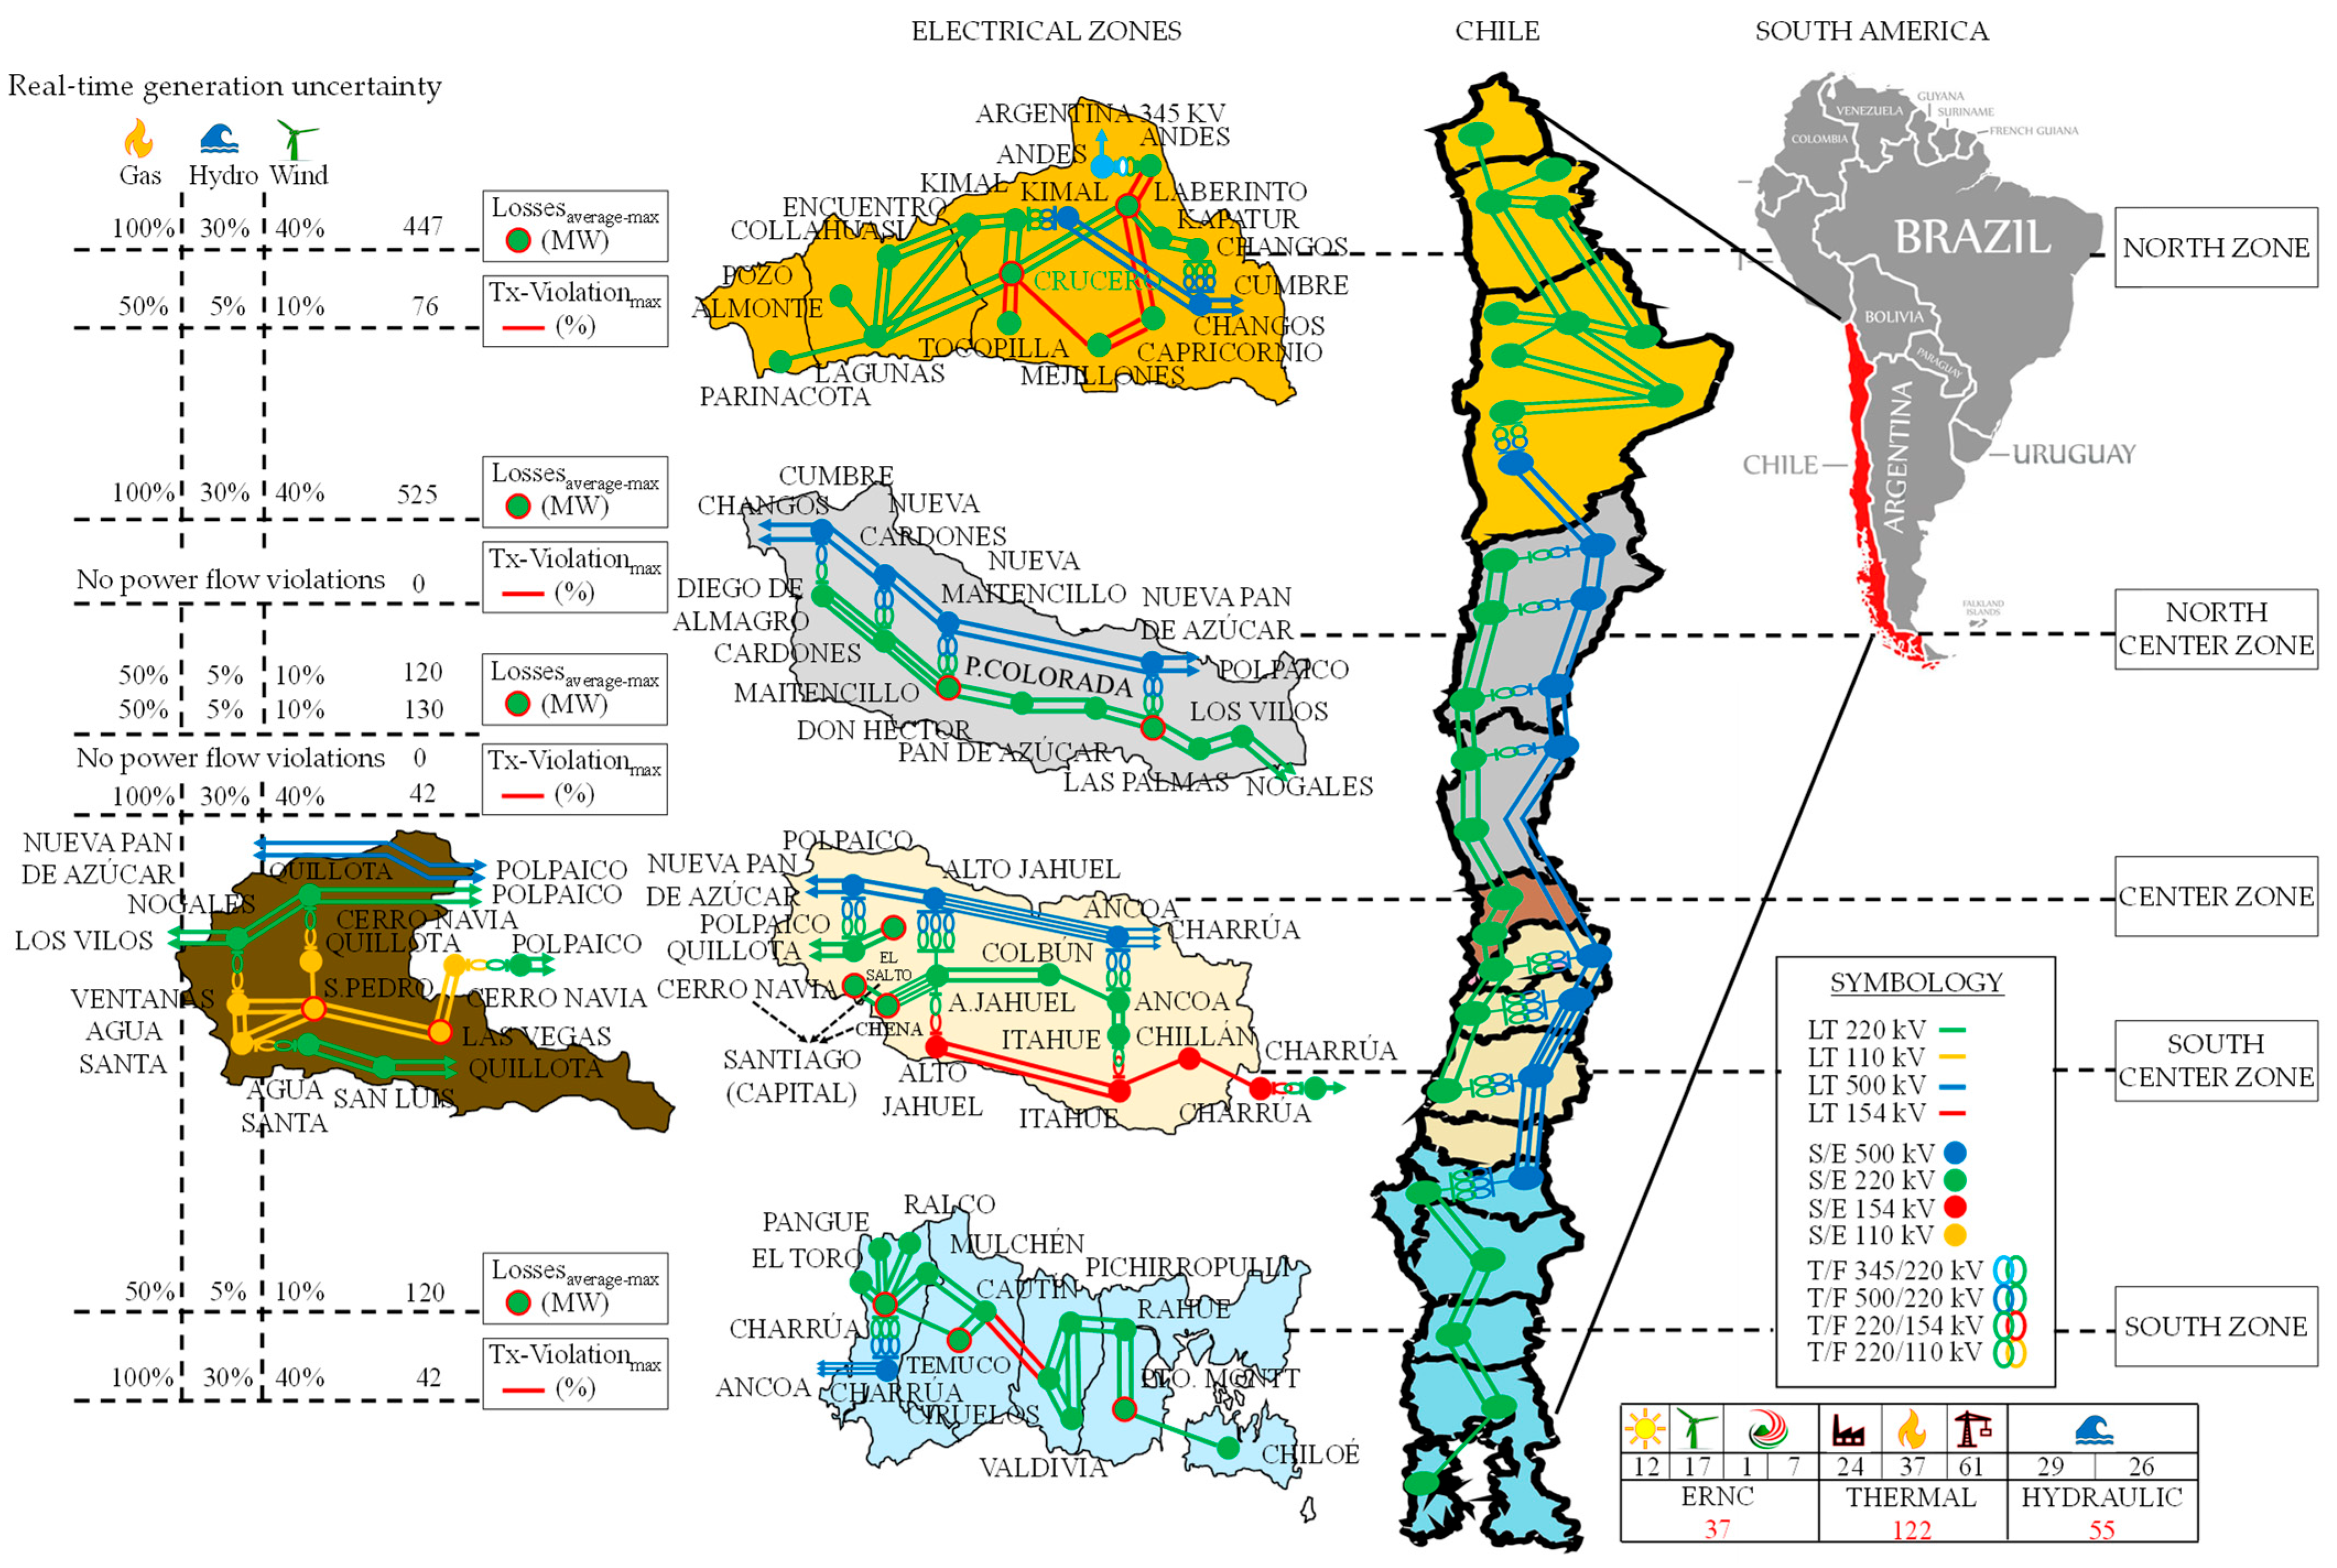
The electrical network designed for the redispatch modeling includes the most relevant facilities of the National Electric System [
35]. Mainly, the number and use of generators, transmission lines, and critical bars of the system are highlighted to strategically guarantee the n-1 security criteria. In this electrical scheme, the generation, transmission, and demand segments are grouped and distributed by electrical zones, as shown in
Figure 7.
The transmission segment is responsible for the exchange of power flow between generation and demand, preserving the n-1 security criterion. The transmission system is a set of elements such as busbars, transformers, voltage levels, and transmission lines. Each of these transmission system elements is characterized by dynamic flexibility in their maximum/minimum power flow capacities and impedance levels.
Table 1 indicates the number of transmission system elements that are integrated into the redispatch model and the impedance modeling flexibility for each component.
Solar, wind, geothermal, cogeneration, coal, gas, diesel, reservoir hydro, and run-of-river hydro power plants are used for redispatch modeling with the ability to relax technical constraints, such as maximum power (P
MAX), minimum power (P
MIN), start time (T
START), minimum operation time (T
ON), and minimum shutdown time (T
DOWN), and economic constraints, such as starting cost (C
START), holding cost (C
DOWN), non-fuel variable cost (CVNC), fuel price (P
FUEL), heat rate (CEN), fuel variable cost (CVC), and generation variable cost (CV), as shown in
Table 2.
Thirdly, there is the modeling of demand, which is characterized by having regulated customers, which are divided into three segments: residential, commercial, and smaller-scale industrial demand. There is also the demand of free customers, which is characterized by covering large consumers, such as mining. It is important to note that the methodology for integrating demand in the redispatch model is based on the participation factors as a percentage of the total demand distributed in each bus of the system, as shown in
Table 3.
4.2. Execution of a Real-Time Redispatch through a Ranking of Technical-Economic Emergencies in Power System Generation
To test the redispatch model, six critical emergency cases of real-time operation are used. These case studies are called real-time extreme scenarios (RTESs) and subject the power system to complex market operation deviating from the normal values of operating cost and marginal cost. The extreme scenarios for each case study of the redispatch model cause severe disruptions in the volume of gas storage, indiscriminate use of water reservoirs, and wind resource forecast errors, according to
Table 4.
4.2.1. Real-Time Extreme Scenario 1: Partial Deviation of Water-Deficit Wind Generation in Reservoir Power Plants Compete with the Unlimited Resource of Coal-Fired Gas-Fired Thermal Power Plants with Higher Variable Generation Costs
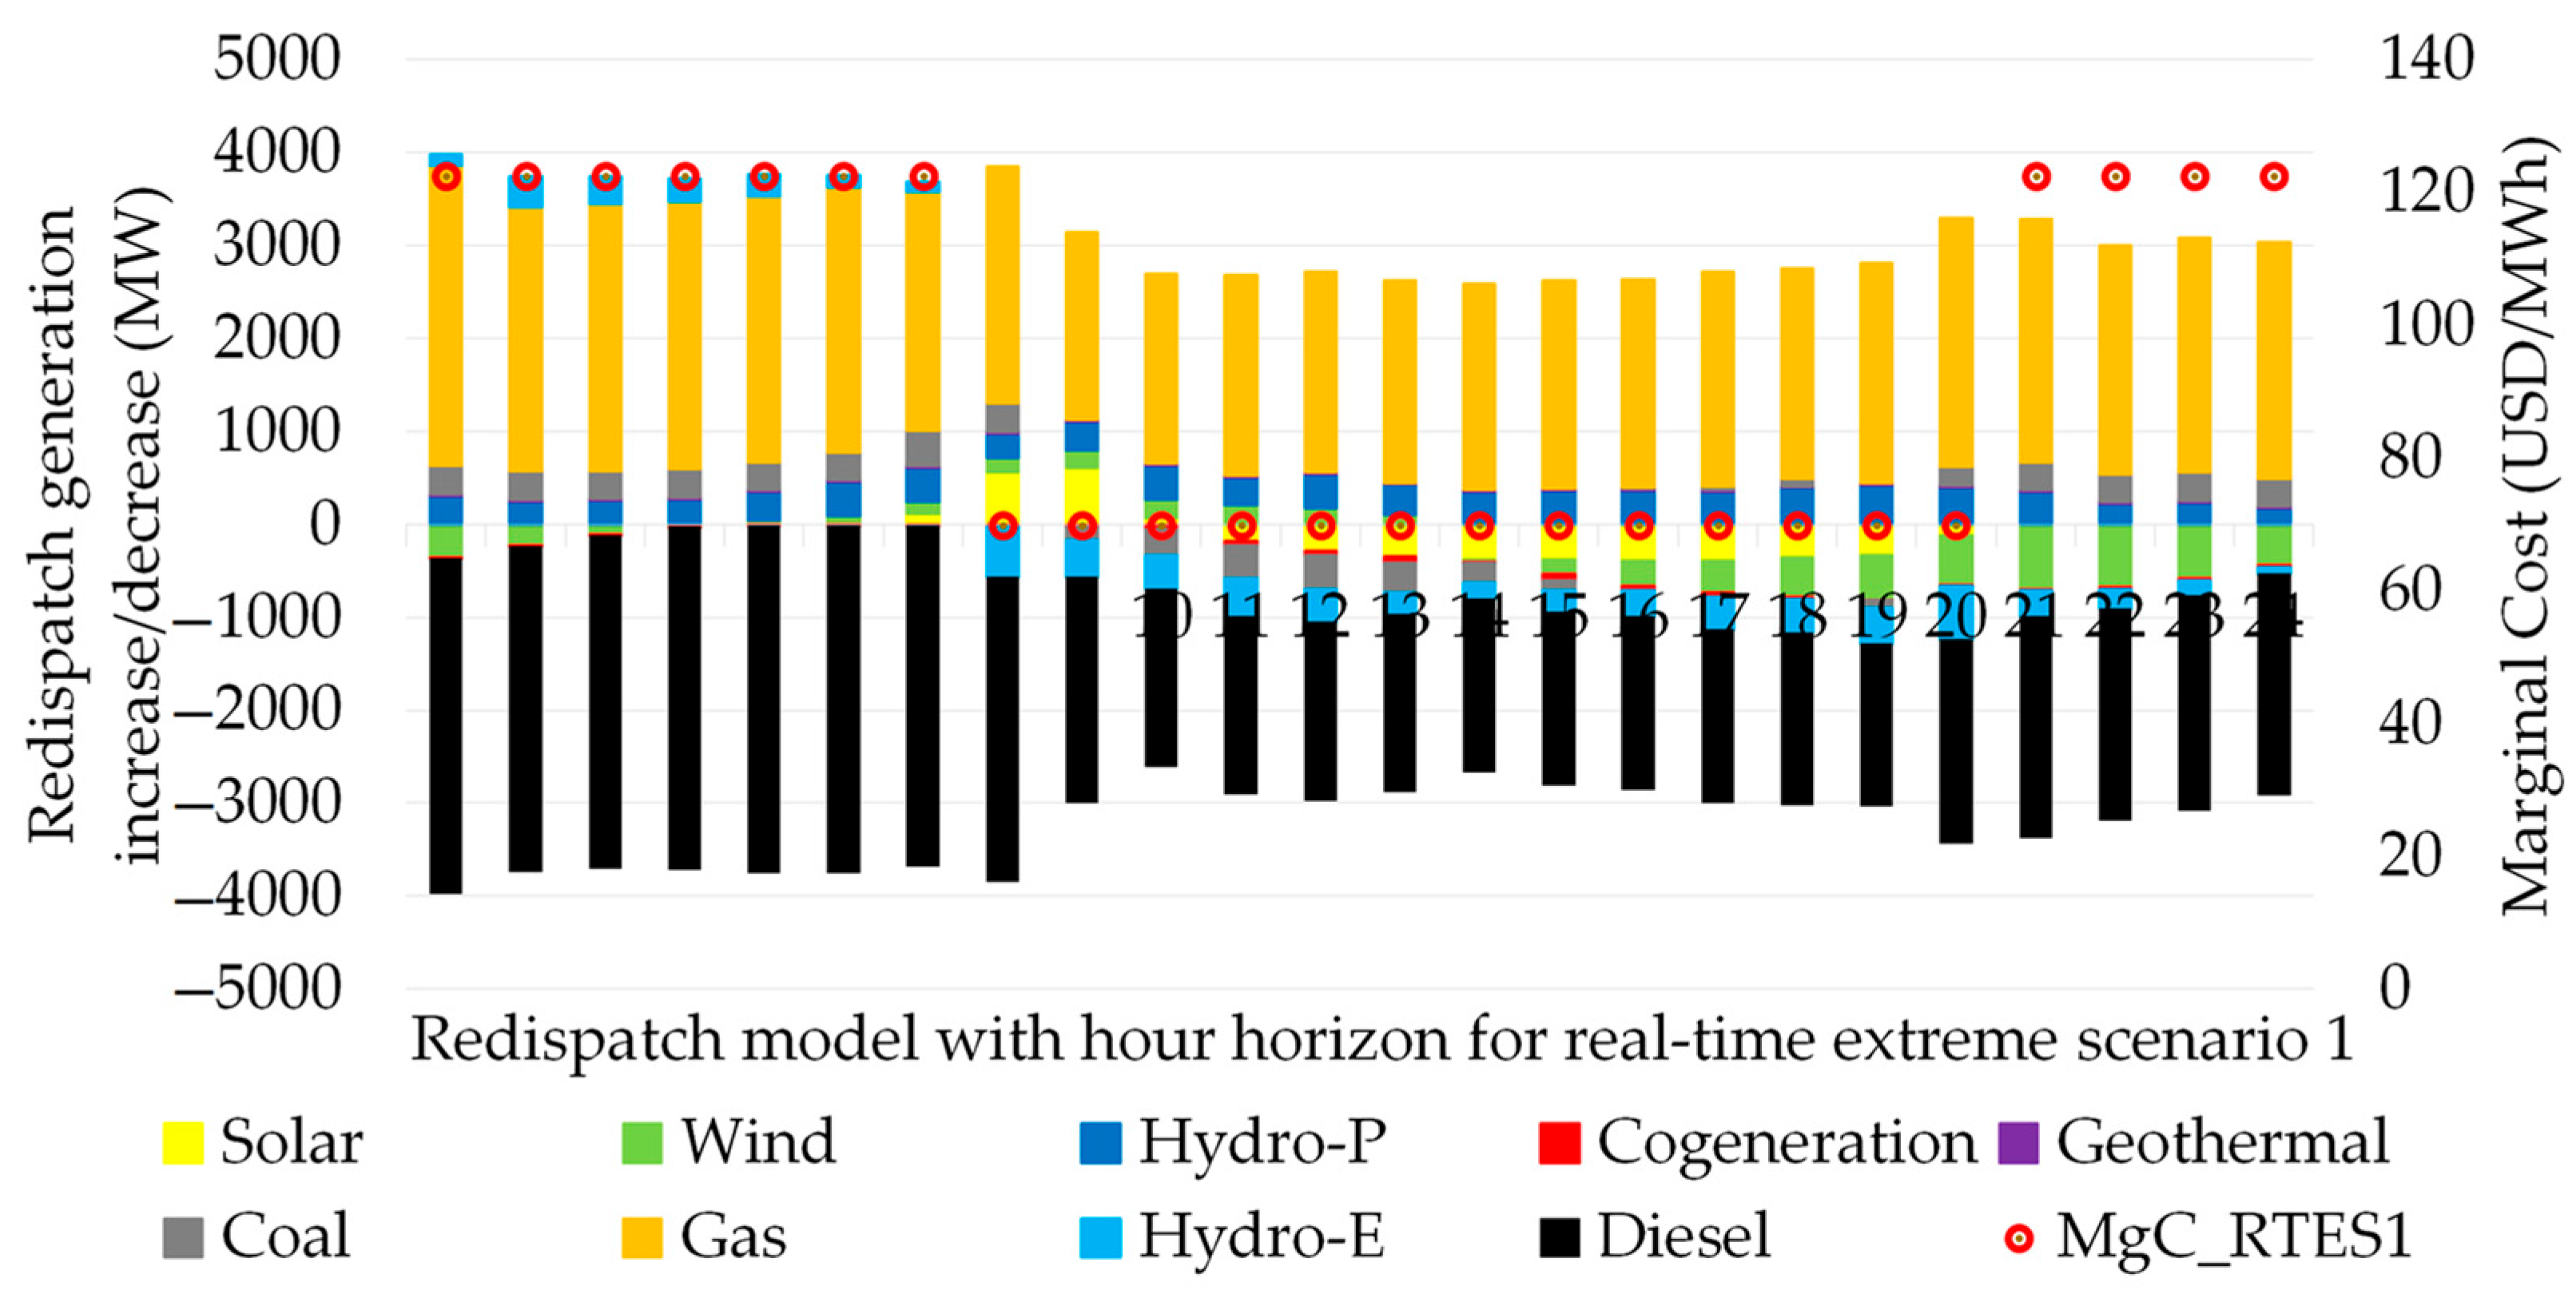
This actual scenario considers the availability of gas-coal thermal generation with 100% gas volume and abundant coal stock. The variability of this real scenario is presented in wind generation with 40% of its programmed forecast, while hydroelectric generation from reservoirs and run-of-river is affected by a hydro reduction for generation of 30% of its programmed forecast, as shown in
Figure 8.
In this situation the redispatch model for real-time extreme scenario 1 is effective with respect to a dispatch of plants using the economic merit list, because
Figure 8 indicates on the primary axis the power increases and decreases in megawatts of the plants used in the redispatch. The gas-fired thermal power plants favorably show an increase in generation ranging from 2200 to 3200 MW. This redispatch allows reducing coal-fired thermal generation by 200 to 300 MW. Diesel-fired thermal generation is reduced by 1900 to 3600 MW. The secondary axis of
Figure 8 shows the marginal costs obtained in the redispatch ranging from 70 to 123 USD/MWh.
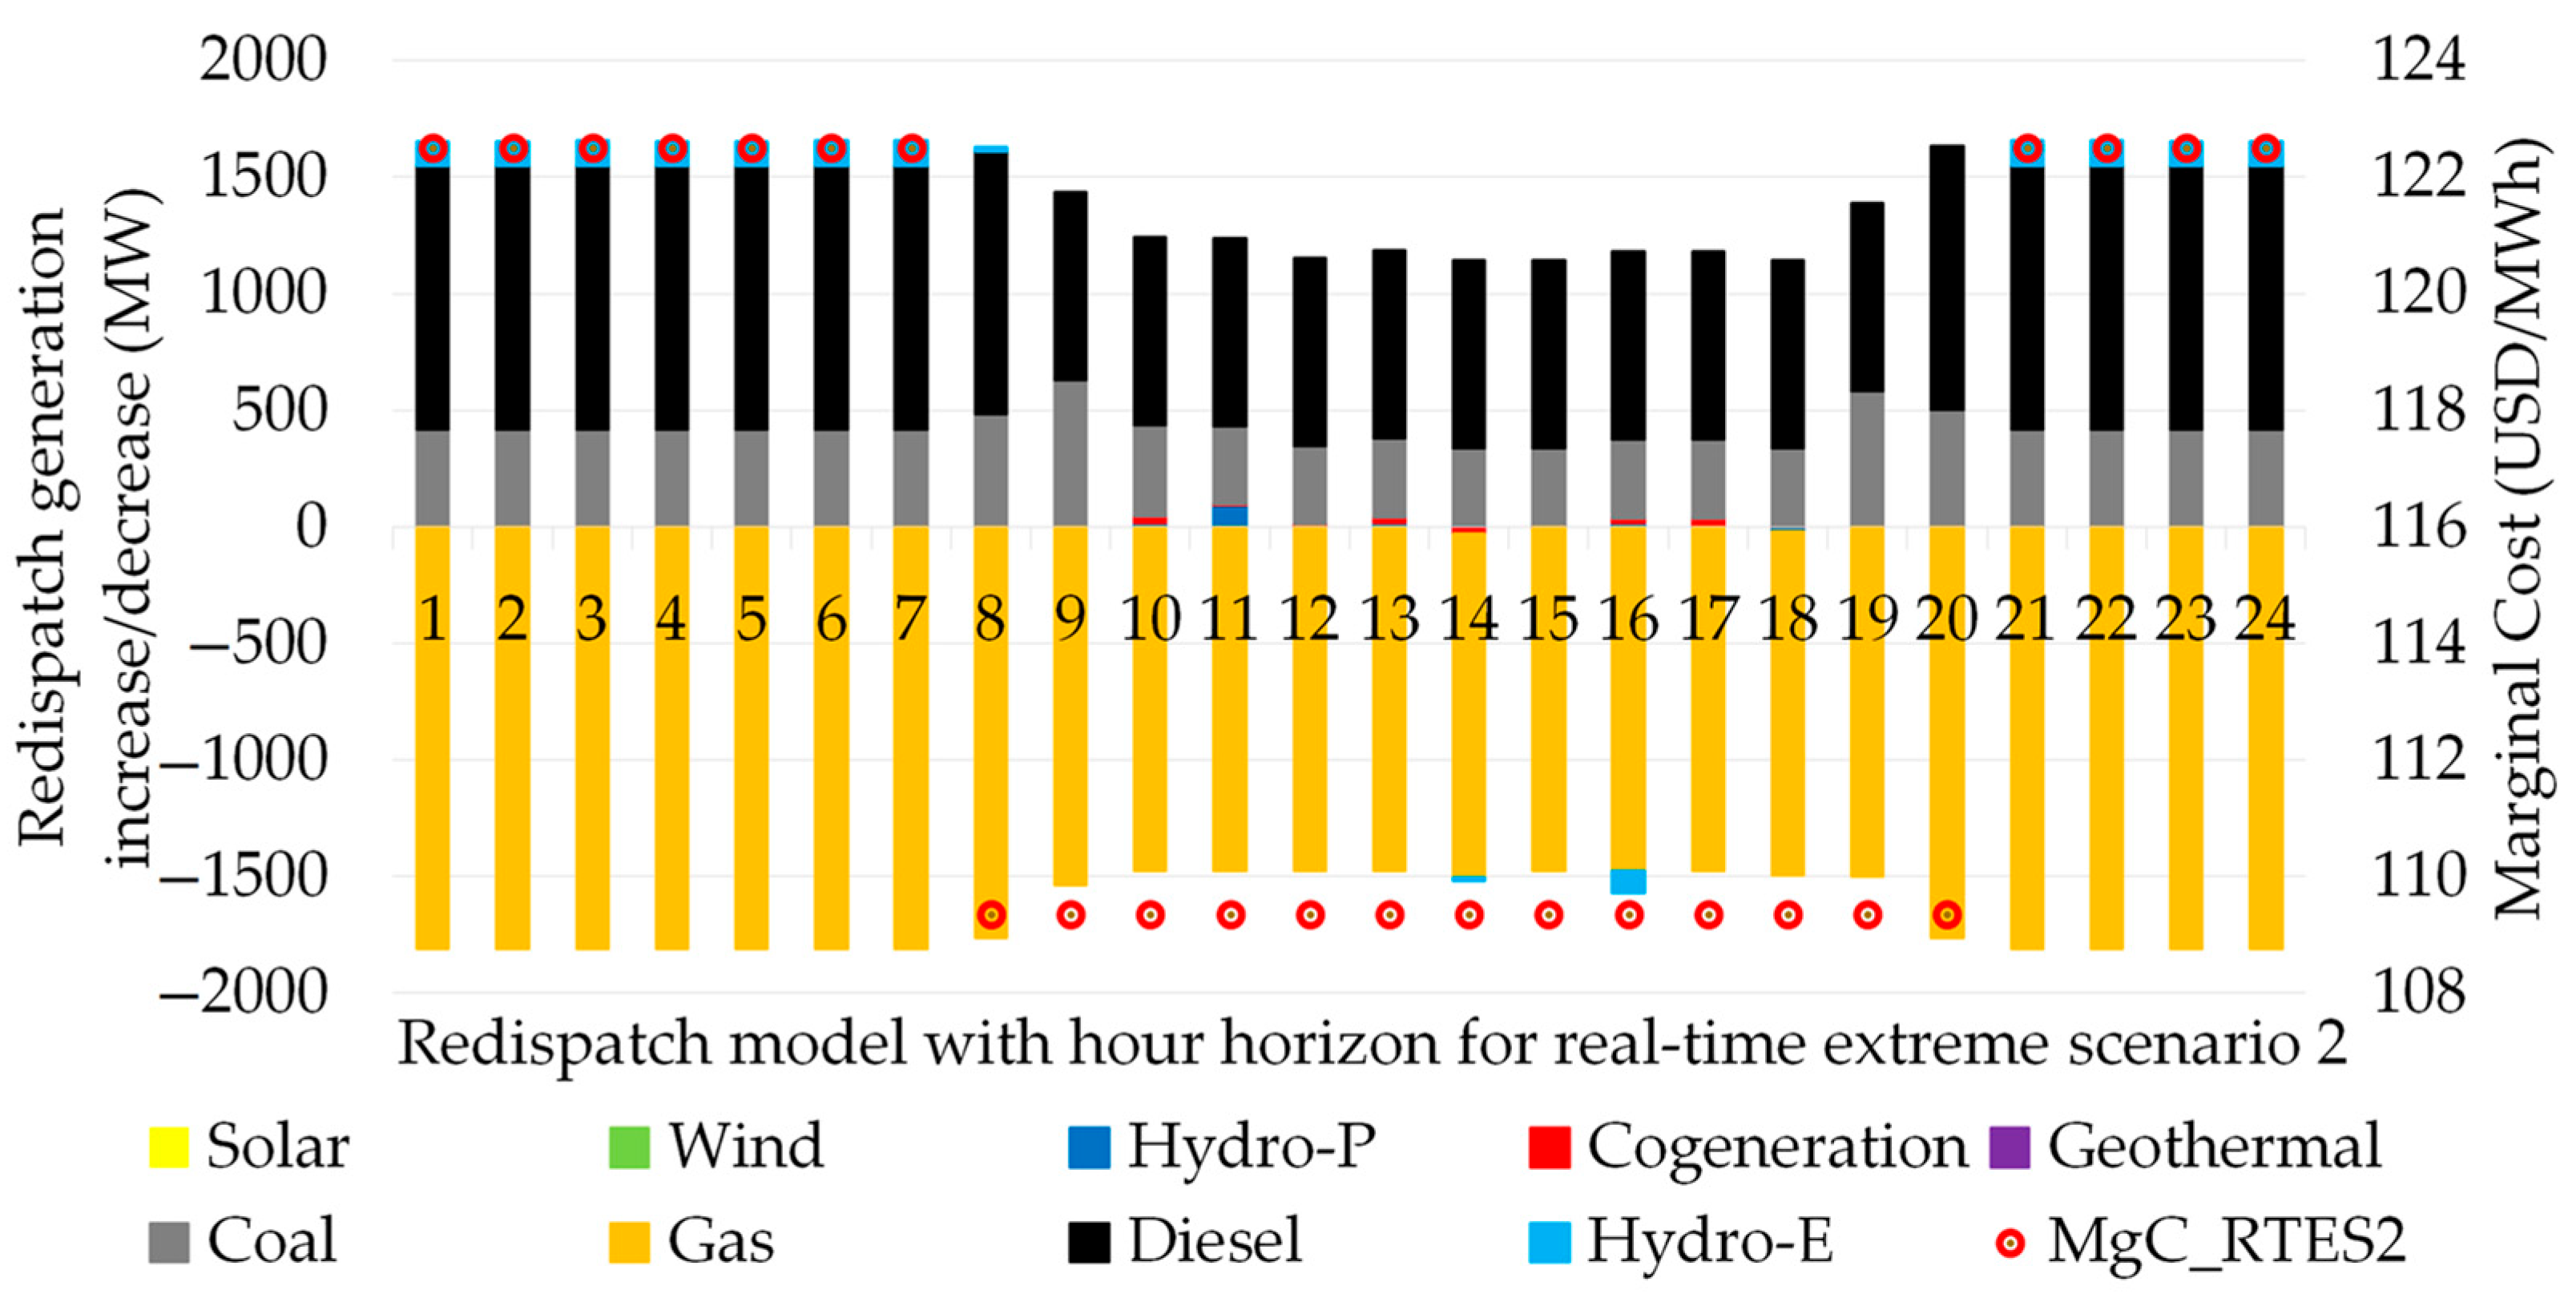
4.2.2. Real-Time Extreme Scenario 2: Lower Gas-Fired Thermal Generation with Partial Gas Volume Stock Causes Dispatch of Diesel Generation at High Marginal Costs
In this real scenario, variability and uncertainty conditions are maintained at 40% for wind generation, hydroelectric generation from reservoirs and run-of-river is at 30% deviation with respect to its programmed inflow, and coal-fired generation has 100% fuel availability and hours of autonomy. However, gas-fired thermal generation presents variability in the storage volume stock by 50%. This consequence immediately causes the appearance of diesel generation to cover the demand, as shown in
Figure 9.
In this situation, the redispatch model for real-time extreme scenario 2 is complex due to the deficit of economic and cleaner generation. However,
Figure 9, on the primary axis, negatively shows the effects of redispatch with increases in diesel thermal generation ranging from 800 to 1120 MW and increases in coal thermal generation ranging from 340 to 580 MW, negatively causing a decrease in gas thermal generation ranging from 1500 to 1800 MW. Finally, the economic consequence can be seen in the secondary axis of
Figure 9, which shows the marginal cost increases obtained in the redispatch, ranging from 109 to 123 USD/MWh.
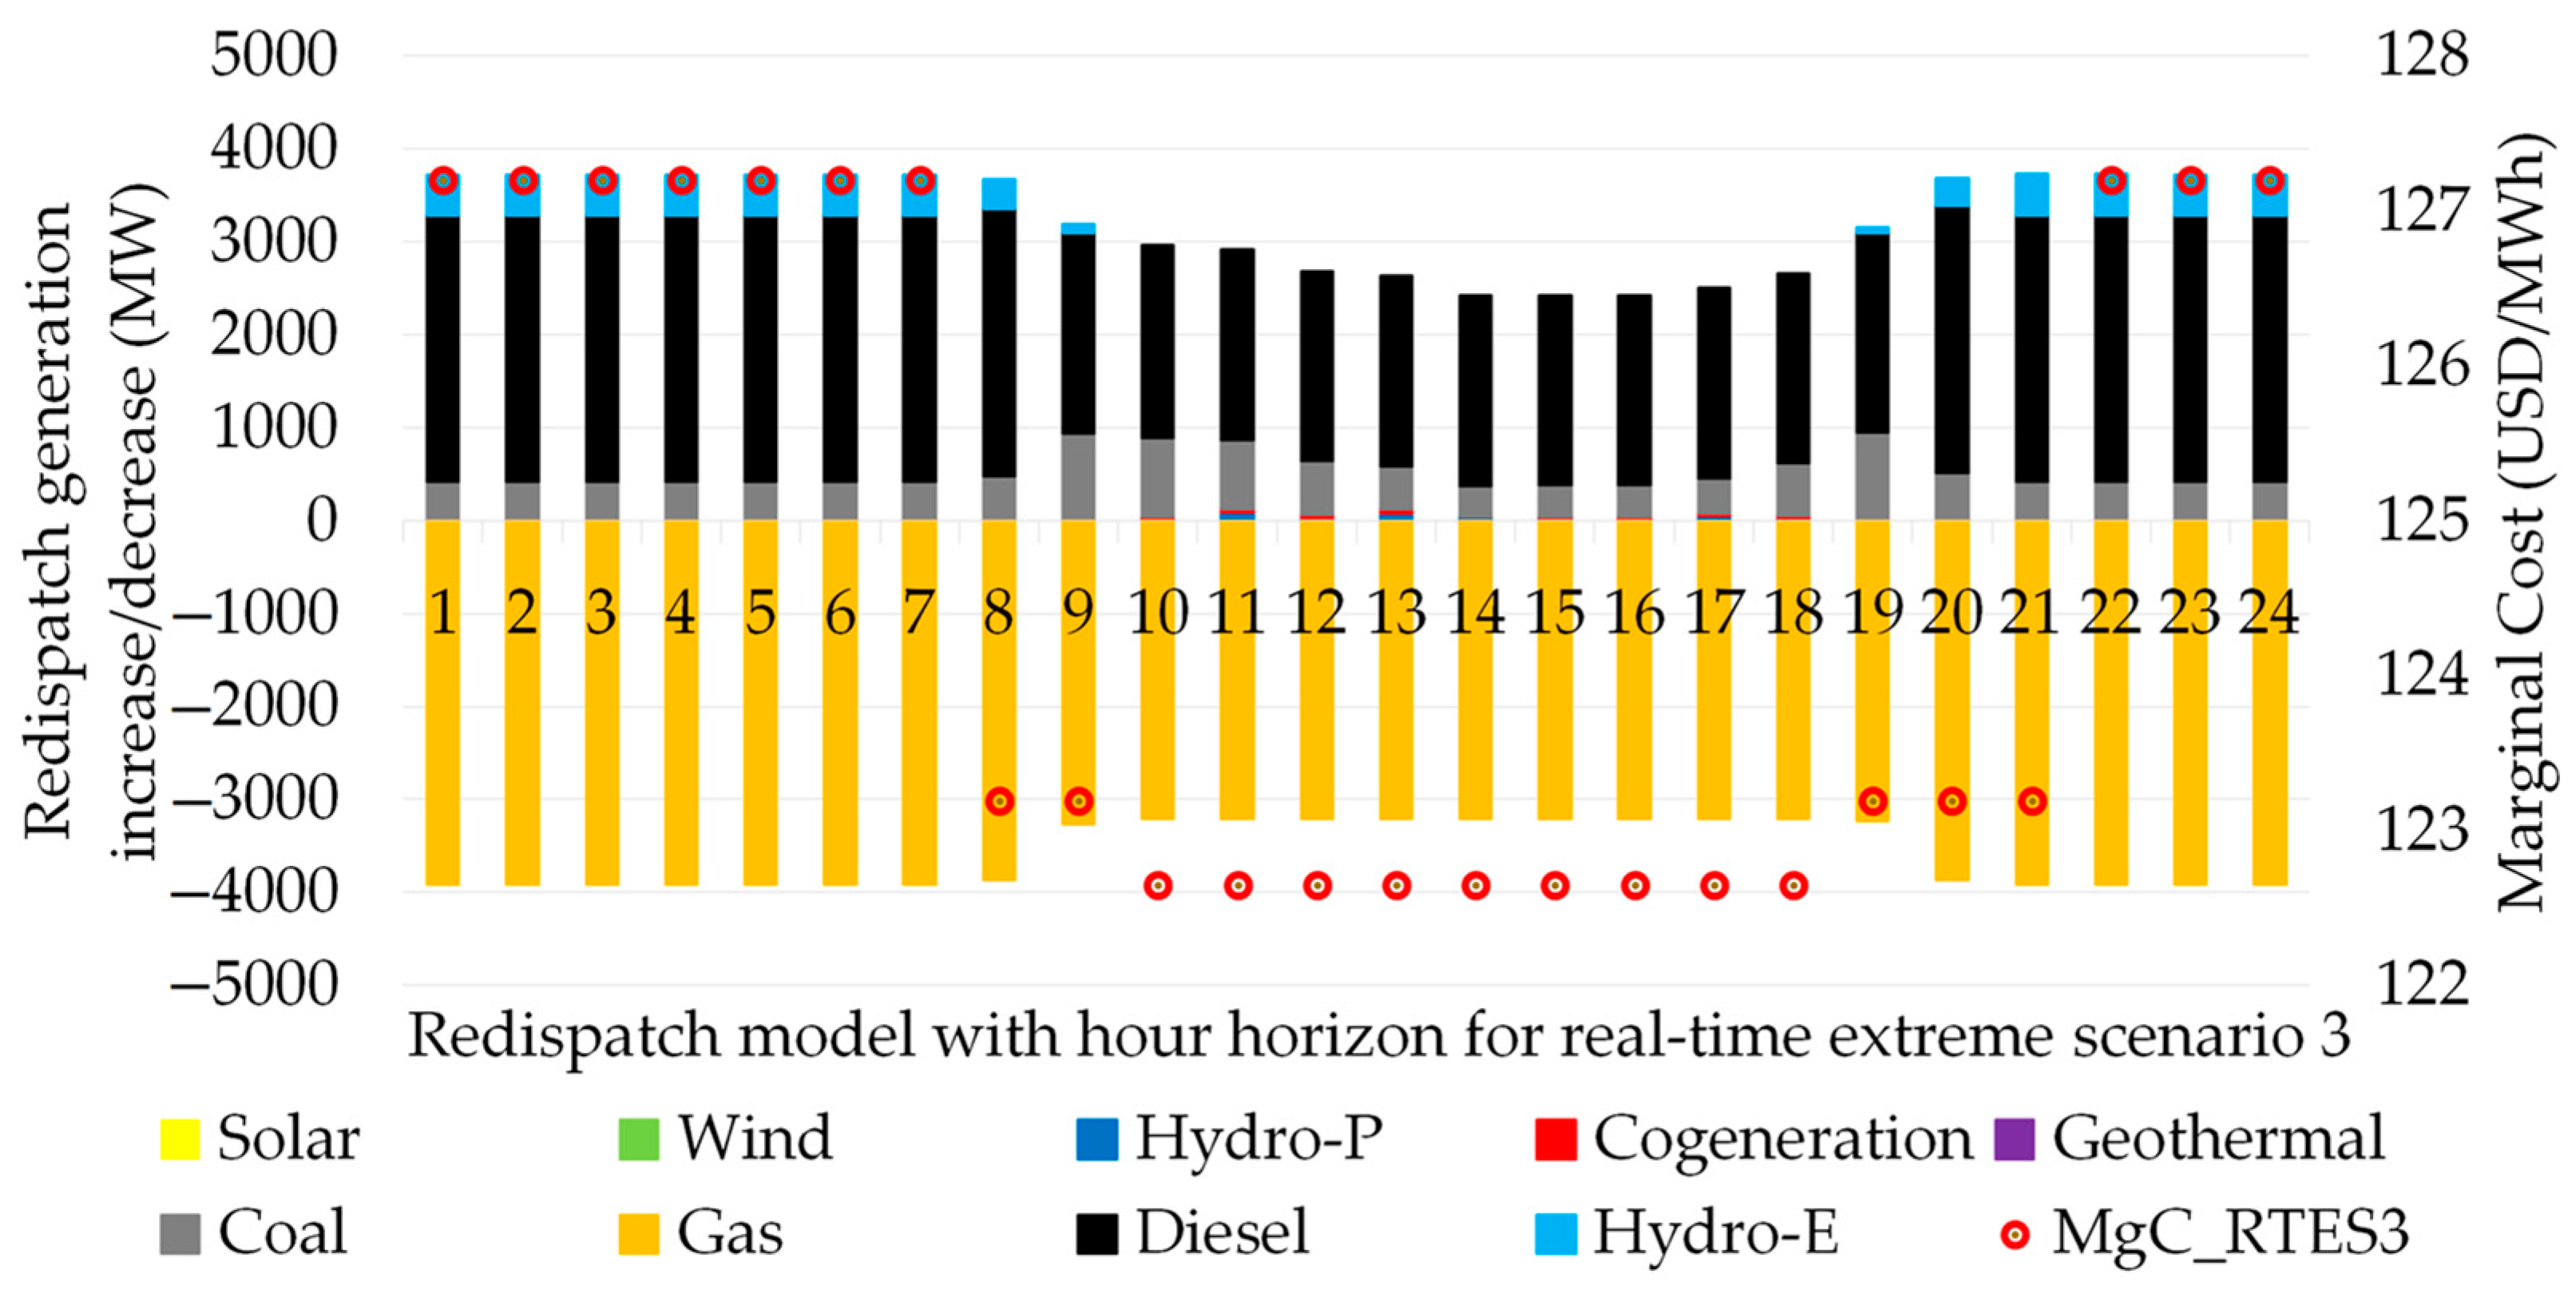
4.2.3. Real-Time Extreme Scenario 3: Non-Supply of Gas Volumes in Stock Causes Forced Withdrawal of Gas-Fired Thermal Generation Complicating Frequency Regulation and Power Reserves
This is a critical real scenario, since it contemplates the null resource of gas volumes for thermal generation, a situation that induces gas-fired thermal generation to change fuel in combined cycles and open cycle gas turbines to generate with diesel. Meanwhile, wind variability remains at 40%, hydro variability remains at 30%, and coal remains operating at 100%, as shown in
Figure 10.
In this situation, the redispatch model for real-time extreme scenario 3 is also complex due to the major shortfall of less-polluting and economical generation. On the primary axis of
Figure 10, the increases in generation with higher costs and higher pollution allow us to negatively visualize the effects of redispatch with increases in diesel-fired thermal generation ranging from 2050 to 2800 MW and increases in coal-fired thermal generation ranging from 480 to 950 MW, negatively causing a decrease in gas-fired thermal generation ranging from 3200 to 3900 MW. Finally, the economic consequence is more severe, since in the secondary axis of
Figure 10, the marginal cost increases obtained in the redispatch range from 123 to 127 USD/MWh.
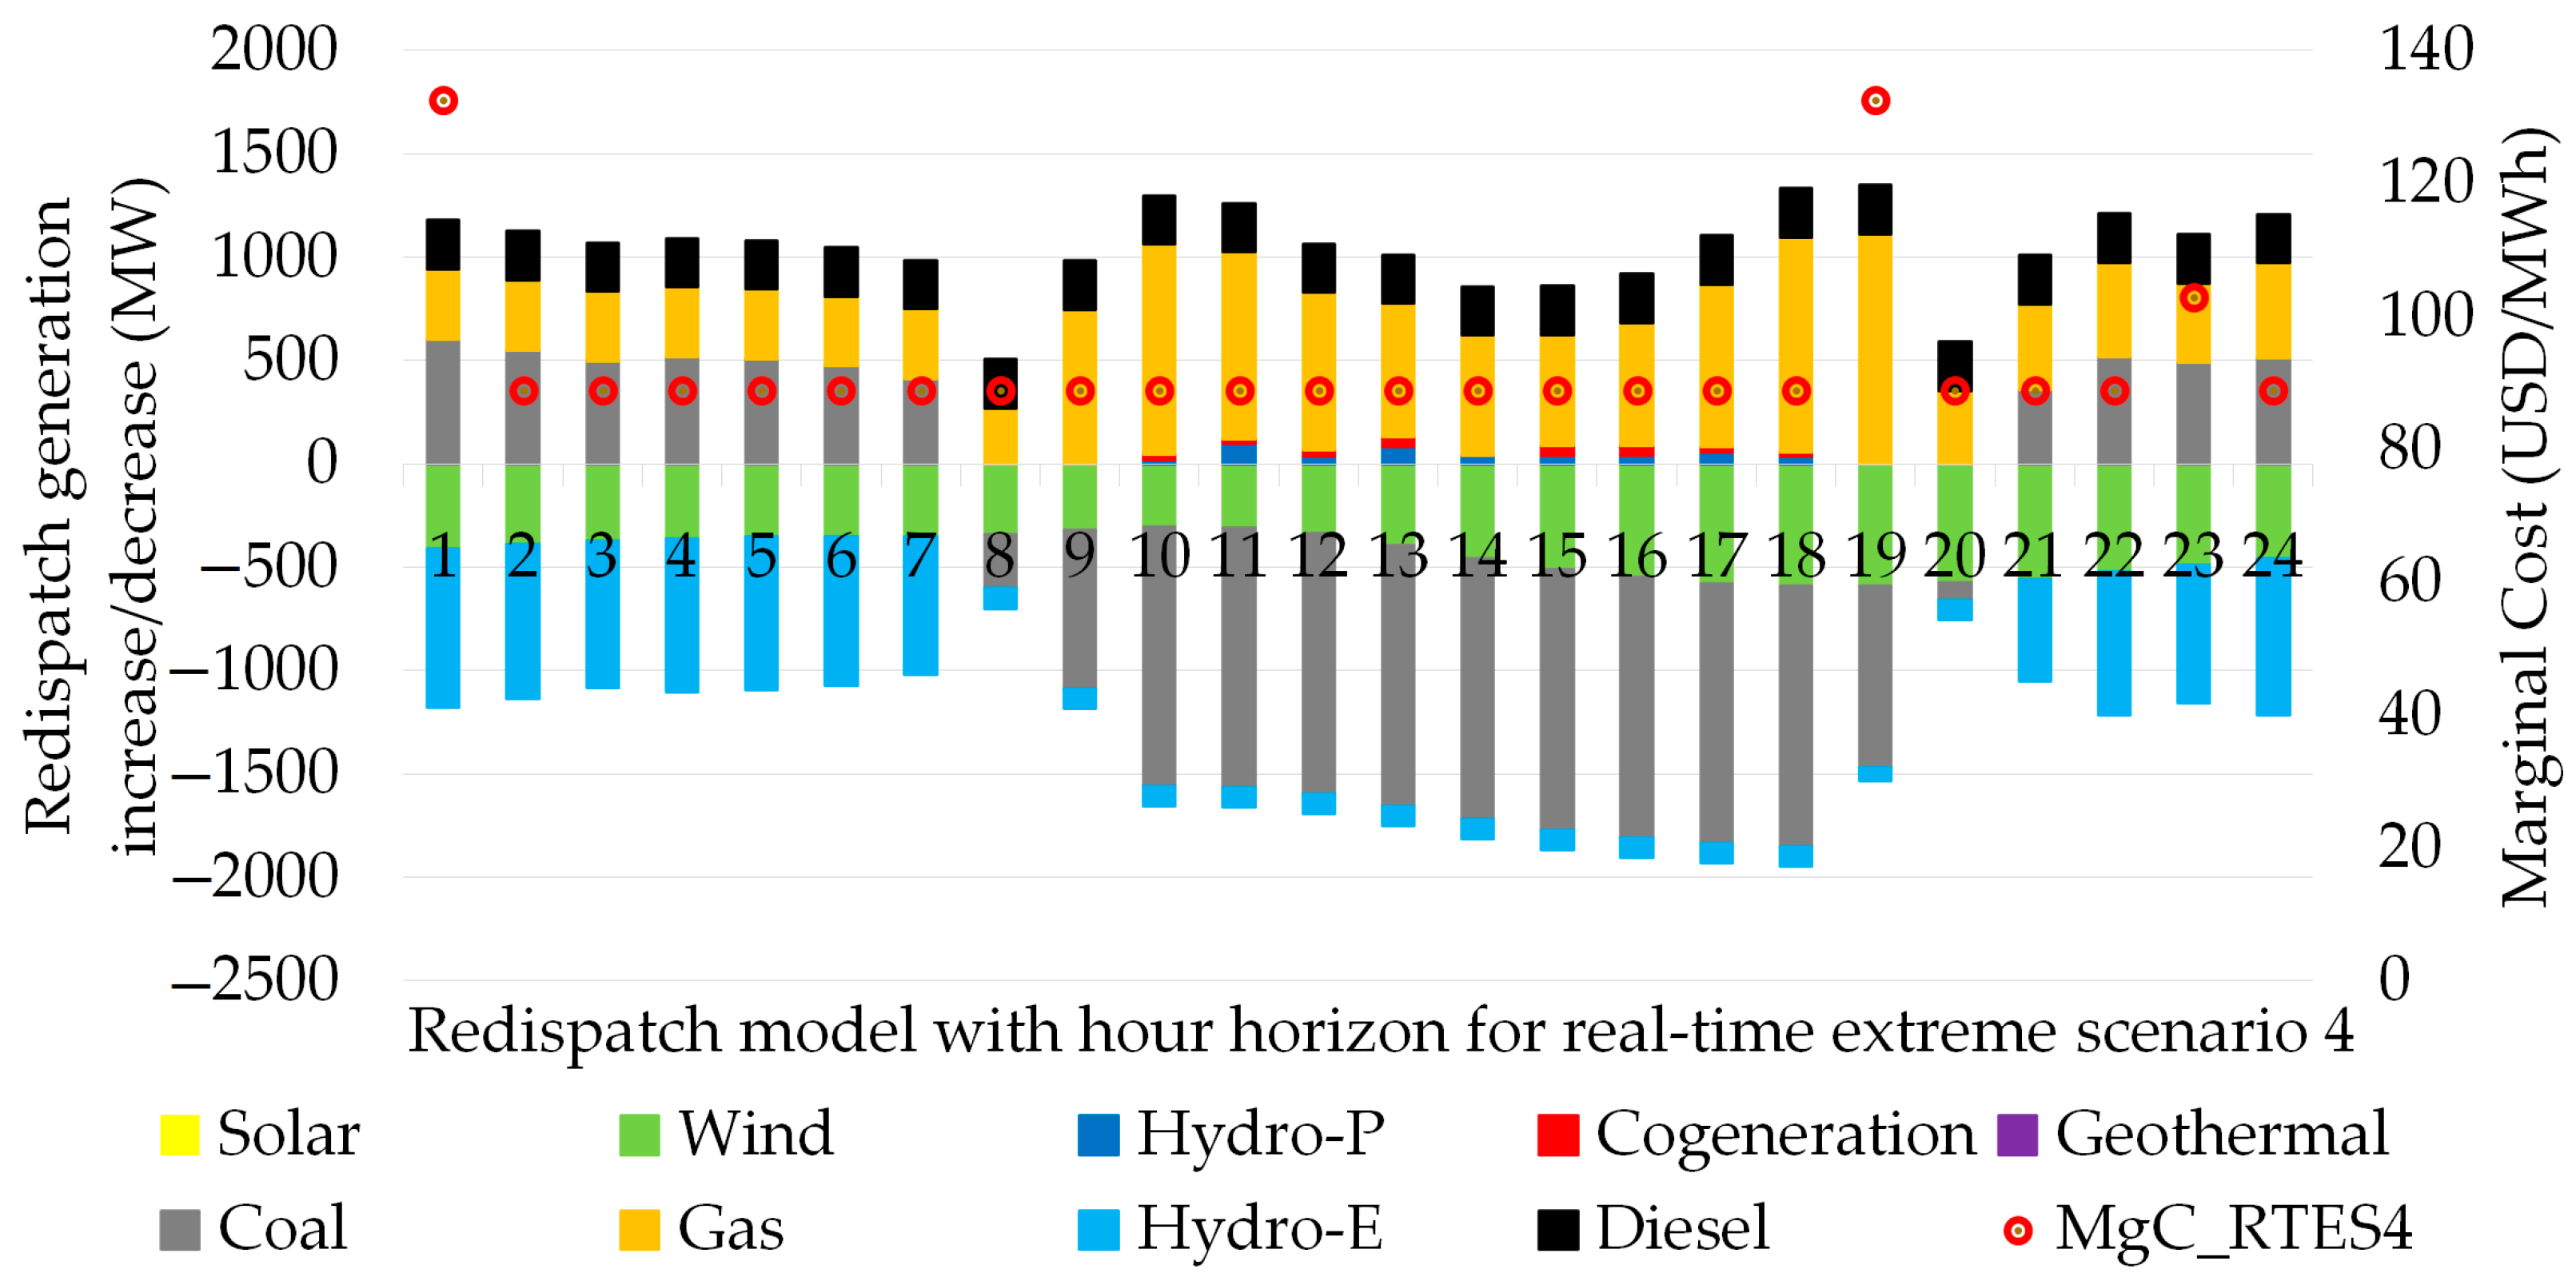
4.2.4. Real-Time Extreme Scenario 4: Depleted Hydroelectric Reservoirs and Scarce Wind Resource Transform a Thermal Generation Predominant Dispatch with High Emissions
This is a very severe real-world scenario that often occurs due to drought weather conditions and inaccurate wind forecasts. However, plant dispatches favor coal-gas thermal generation with 100% fuel availability and hours of autonomy without the need to resort to diesel fuel in large amounts of generation to meet demand, as shown in
Figure 11.
In this situation the redispatch model for real-time extreme scenario 4 is a conservative scenario due to the availability of gas-fired thermal generation. However, the shortfall in hydro and wind generation allows the redispatch model to make use of diesel-fired thermal generation to a lesser extent.
Figure 11 indicates, on the primary axis, the increases in gas-fired thermal generation, ranging from 270 to 1110 MW, while diesel thermal generation shows a slight increase of around 230 MW and coal-fired generation increases from 400 to 600 MW in low and high demand hours. The worst consequence in this scenario is assumed by hydroelectric generation, with a decrease in power ranging from 95 to 770 MW. The secondary axis of
Figure 11 shows the marginal costs obtained in the redispatch, ranging from 89 to 133 USD/MWh.
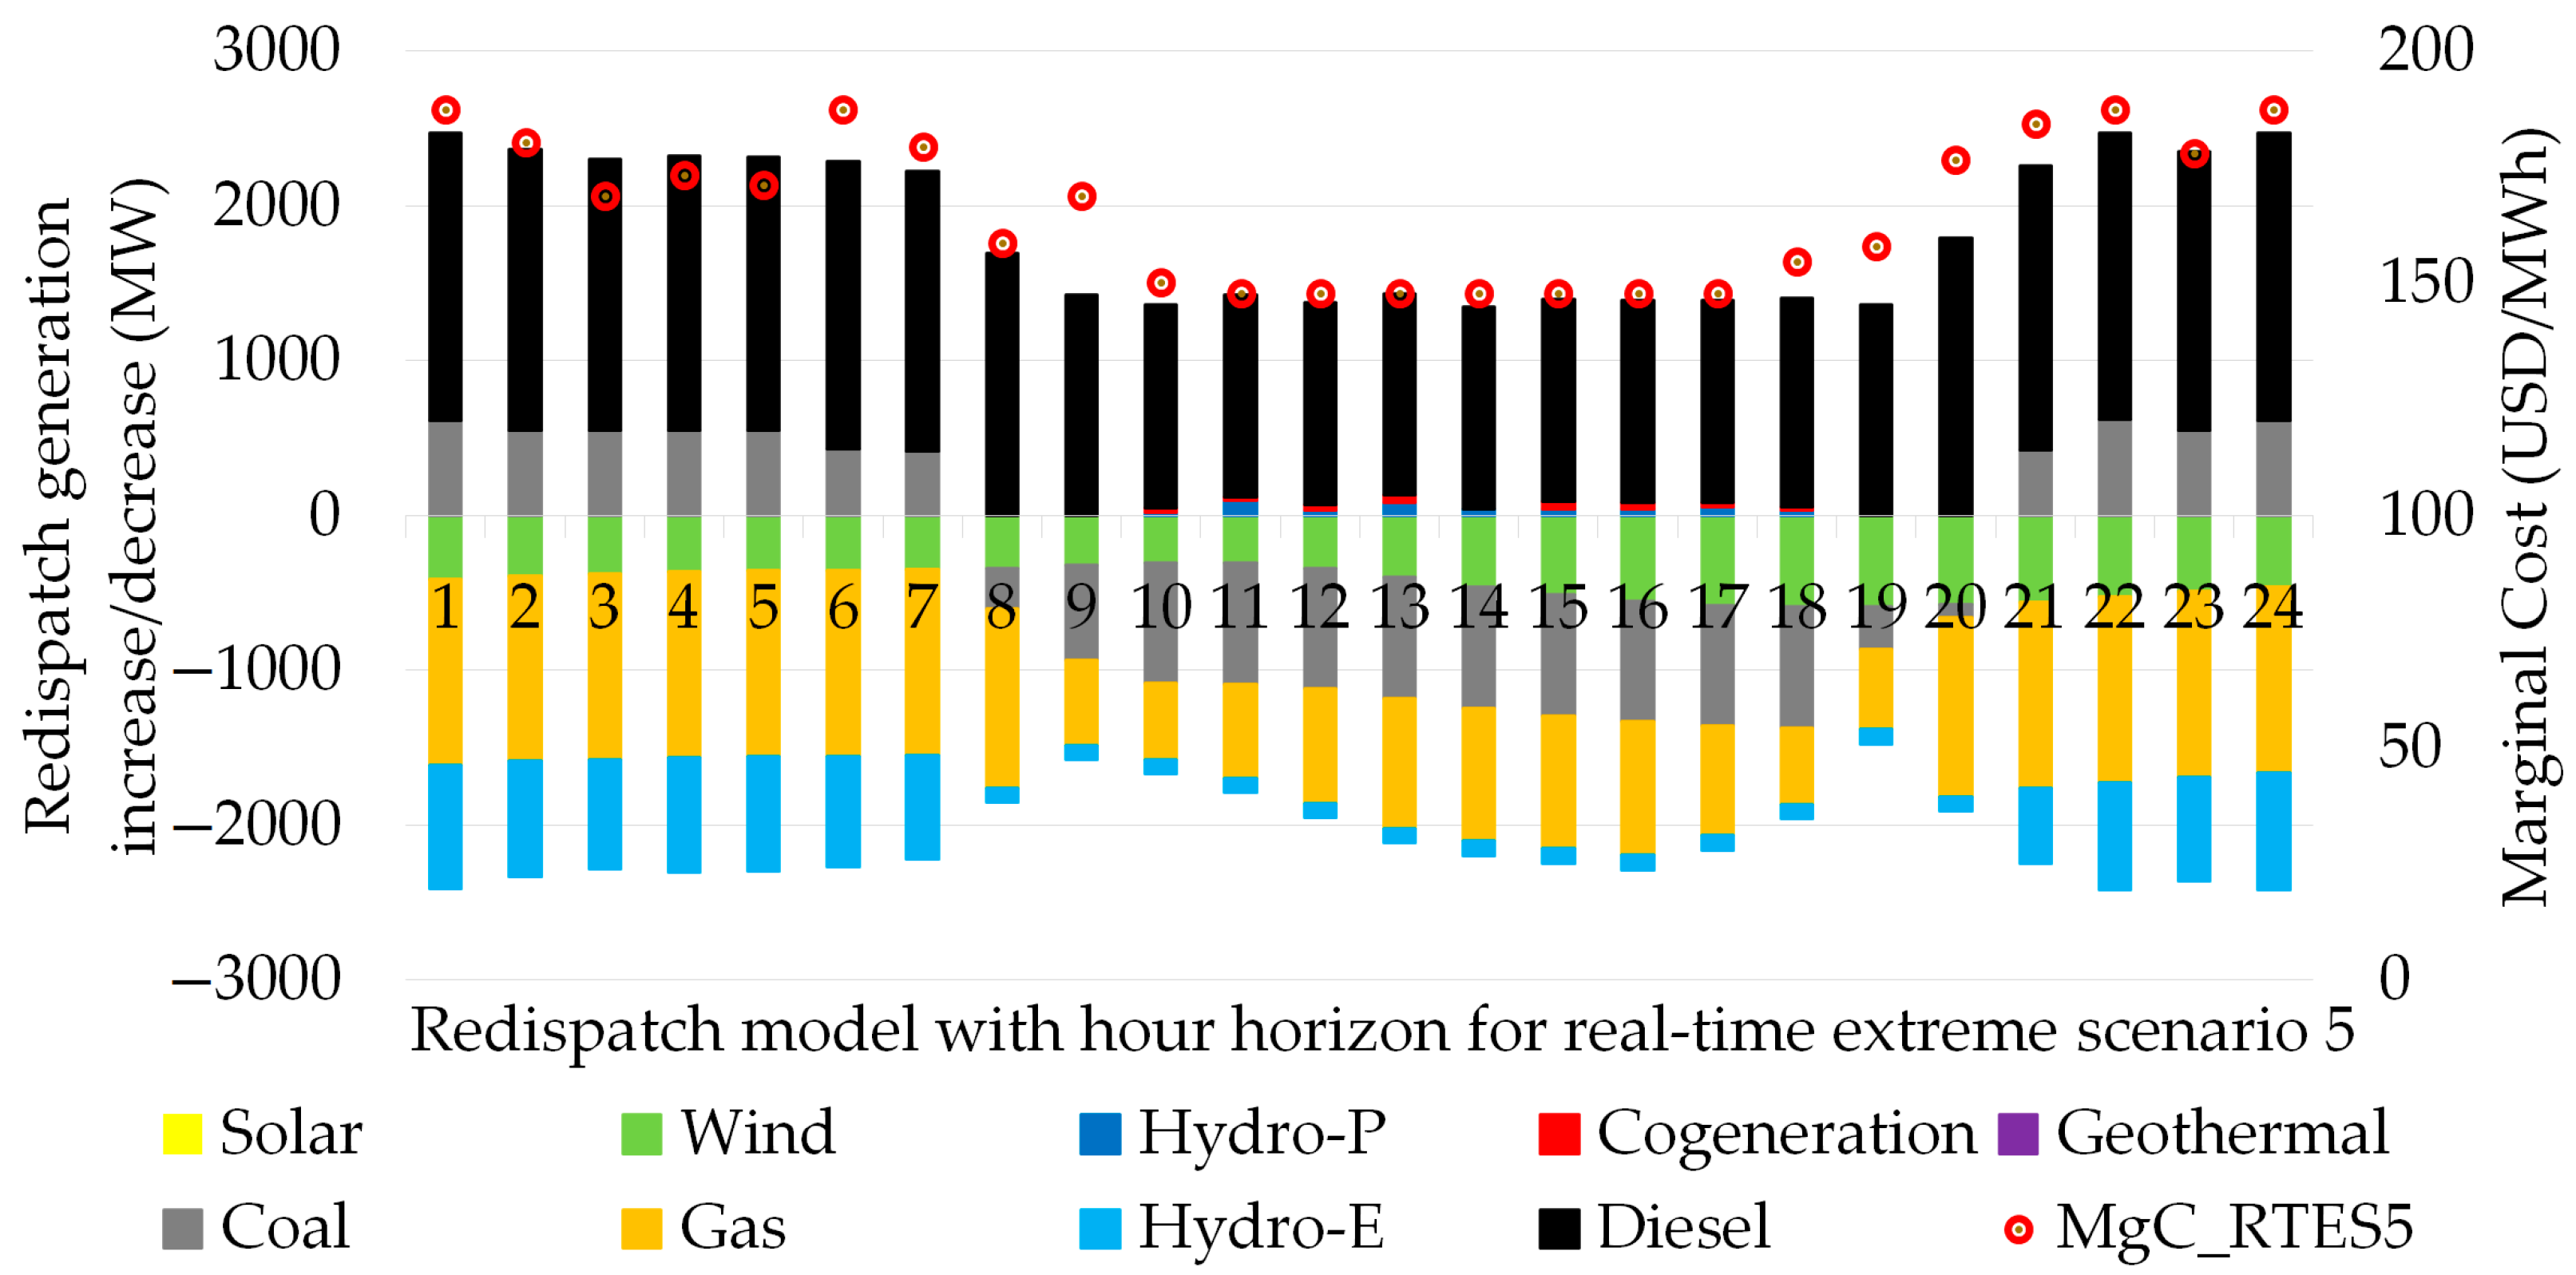
4.2.5. Real-Time Extreme Scenario 5: Regrettable Consolidation of Thermal Generation due to Extreme Energy Emergency That Leaves Hydro and Wind Generation without Dispatch Possibility
This real scenario considers low availability of wind power generation resources of around 10%, and hydroelectric generation from reservoirs is in a depleted state, i.e., with an availability of less than 5%. Gas-fired thermal generation is limited to 50%. However, this is one of the most complex scenarios due to the fact that 100% coal-fired thermal generation and more than 50% diesel generation must be used to supply demand, as shown in
Figure 12.
In this situation the redispatch model for real-time extreme scenario 5 is a critical scenario due to the unavailability of gas-fired thermal generation. In addition, the shortfall of hydro and wind generation allows the redispatch model to make use of diesel thermal generation to a greater extent.
Figure 12 indicates, on the primary axis, the increases in diesel thermal generation, ranging from 1320 to 1850 MW, while coal-fired thermal generation remains between 400 to 600 MW during low and high demand hours. The worst consequence in this scenario is assumed by gas-fired thermal generation, with a decrease in power ranging from 500 to 1200 MW. The economic effects on marginal costs are unfavorably noted for this scenario, since the secondary axis of
Figure 12 shows the marginal costs obtained in the redispatch, ranging from 148 to 188 USD/MWh.
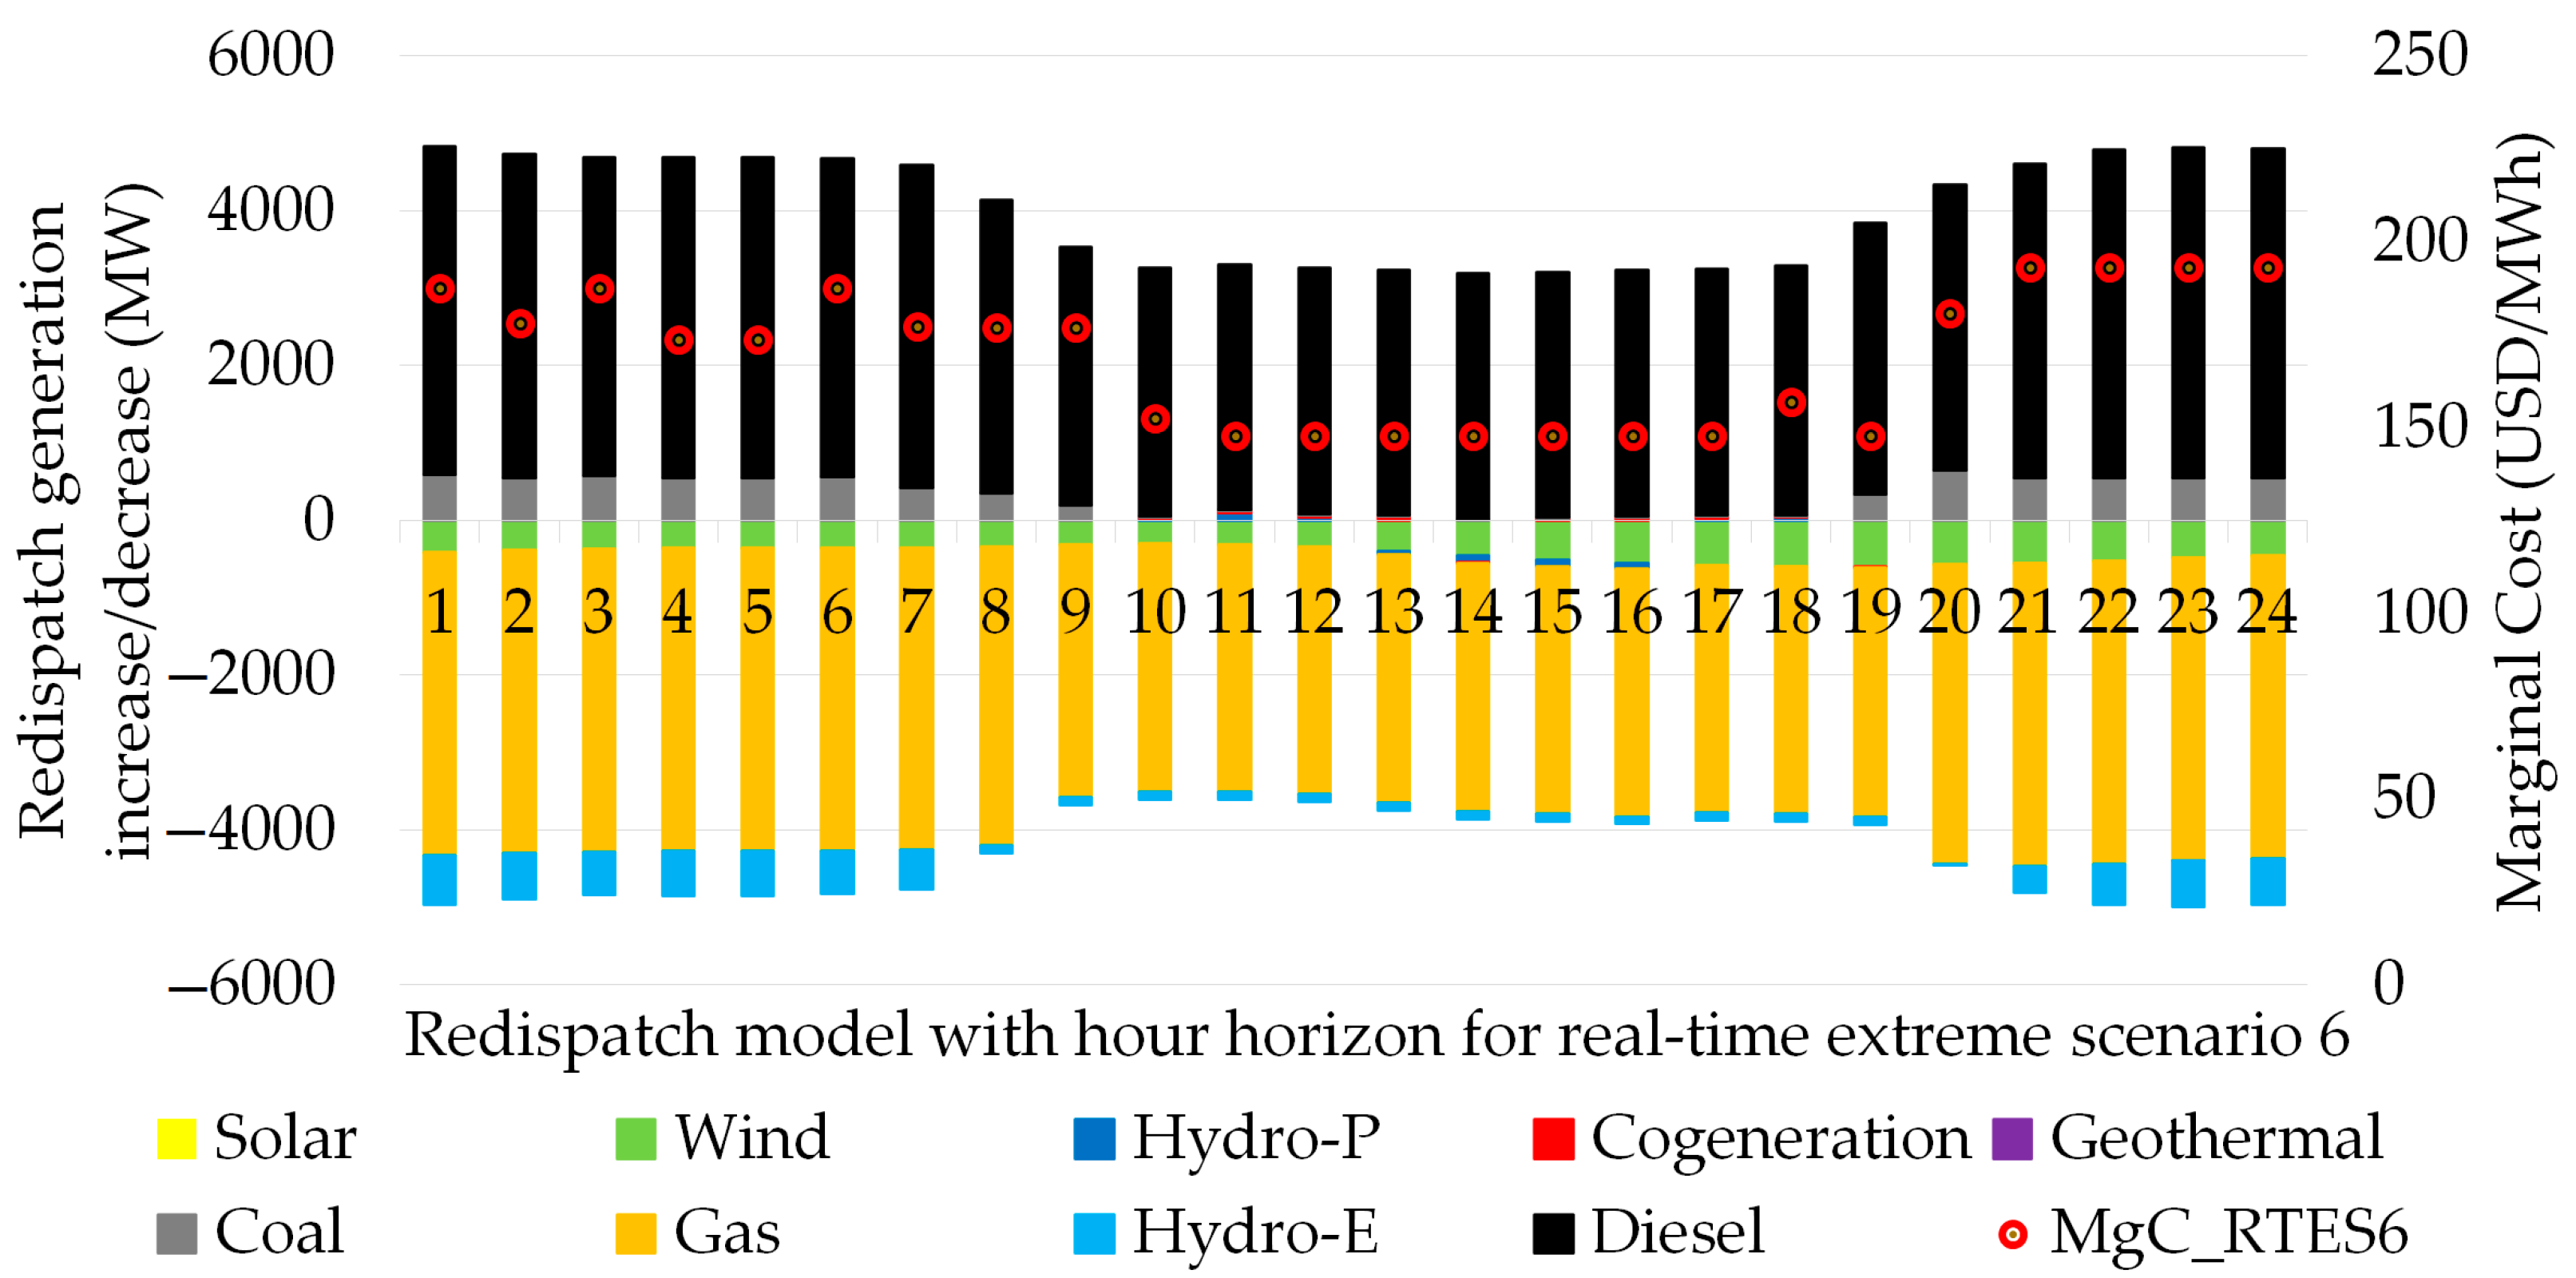
4.2.6. Real-Time Extreme Scenario 6: Decarbonization Stalls with the use of Coal-Fired Generation due to Crisis in Resources Destined for Hydro, Wind and Gas Generation
This is the most extreme real-time scenario, since demand supply is 100% dependent on coal-diesel thermal generation, and emissions and the overall cost of operation increase in the face of zero water, gas, and wind generation forecasts, as shown in
Figure 13.
In this situation, the redispatch model for real-time extreme scenario 6 is the most critical scenario compared to the other five scenarios, due to the total unavailability of gas-fired thermal generation, hydro generation at the limit of drought, and wind generation with forecast errors. Consequently, the redispatch model will be based on a total use of diesel thermal generation with high marginal costs to supply demand. That is,
Figure 13 indicates, on the primary axis, increases in diesel thermal generation ranging from 3175 to 4250 MW, while the worst consequence in this scenario is assumed by gas-fired thermal generation, with a decrease in power ranging from 3200 to 3900 MW. The economic effects on marginal costs are unfavorably noted in this scenario, since the secondary axis of
Figure 13 shows the marginal costs obtained in the redispatch, ranging from 148 to 193 USD/MWh.
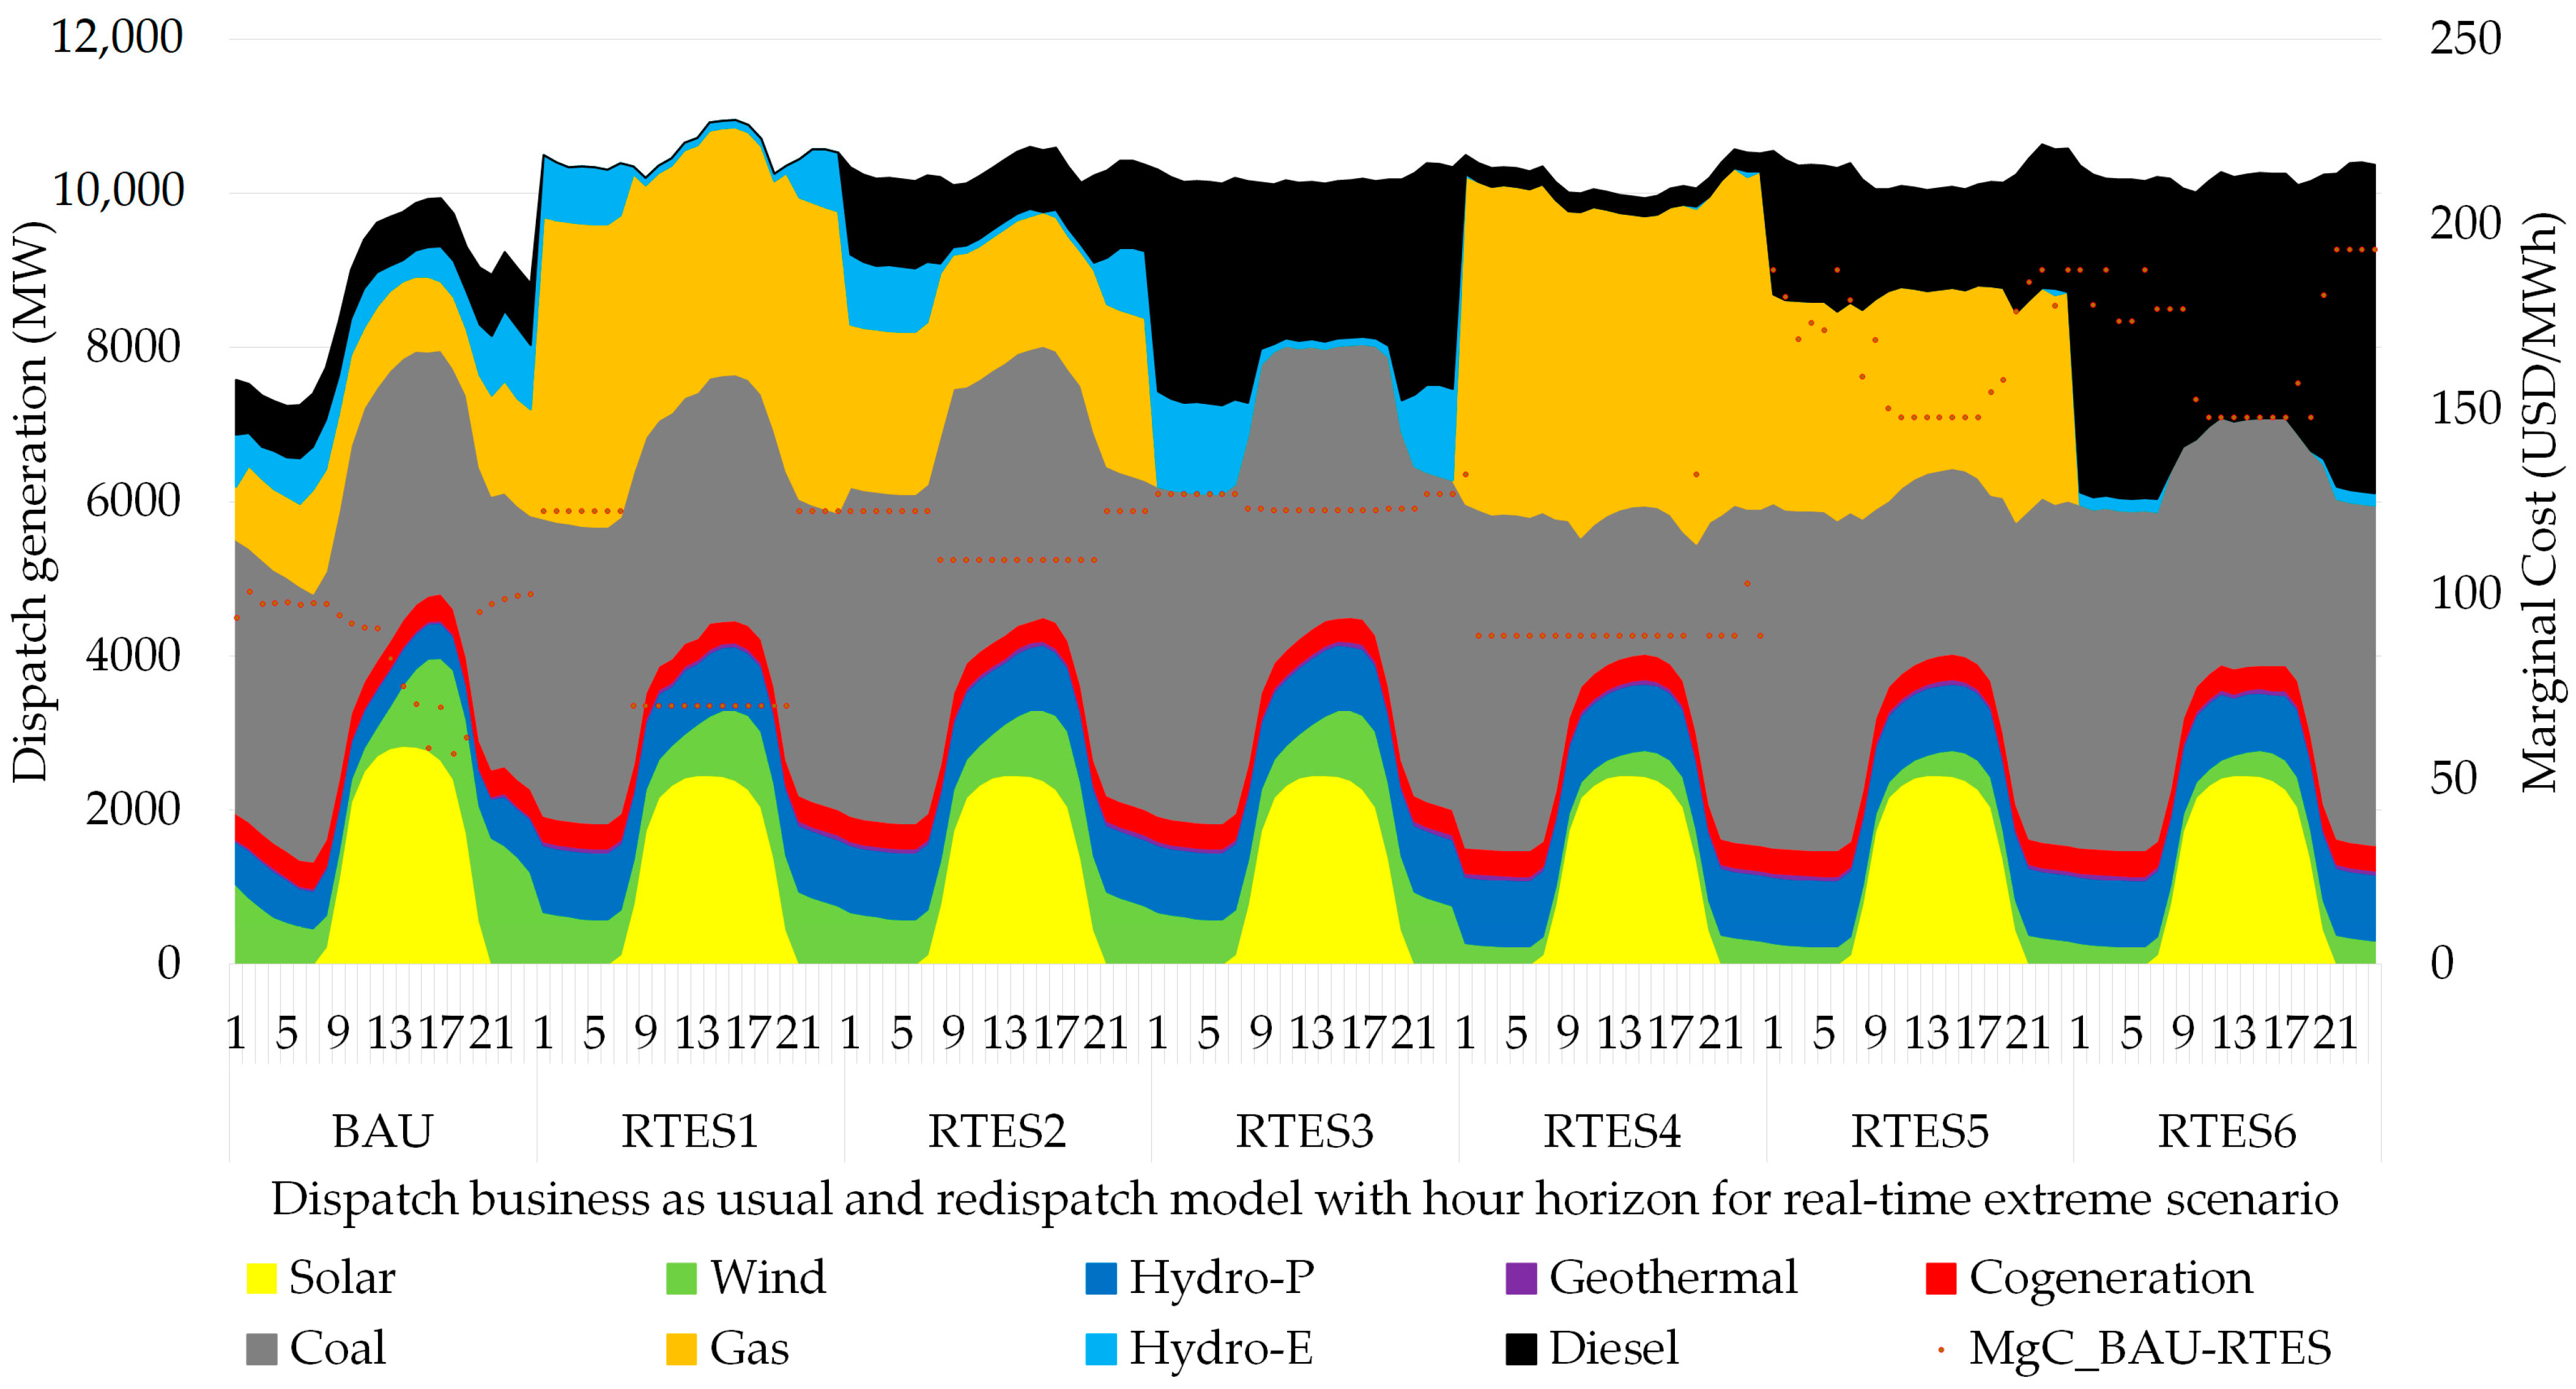
Finally,
Figure 14 shows a summary of the dispatch of plants from a base scenario versus all the results of the redispatch model of the six extreme scenarios in real time that show an economic horizon with an hourly resolution. The results of each extreme scenario indicate the trajectory of marginal costs and total generation dispatch to supply demand due to variations in gas, wind, and hydro generation.
The total economic dispatch of generation is different from the redispatch, because
Figure 14 shows the total of the plants destined to supply the demand while the redispatch indicates the increases and decreases of generation that were not foreseen in the Business as Usual (BAU) model or in the dispatch used with the economic merit list. However, in the primary axis of
Figure 14, as the real-time extreme scenario increases, the dispatches of high-cost plants with higher emissions of pollutant gases increase. In the case of RTES3, RTES5, and RTES6, diesel thermal generation is predominant and marginal costs exceed USD150/MWh, as shown in the secondary axis of
Figure 14. In contrast, for the RTES1, RTES2, and RTES4 scenarios, dispatches of gas-fired thermal generation predominate, becoming a redispatch with lower emissions.
5. Analysis and Discussion of the Results Obtained from the Redispatch Model in Real-Time Operation
The most relevant results of the redispatch model using the real-time extreme scenario are shown below. The advantages and shortcomings of the proposed model are compared with the unit commitment model and the operation of the system using the economic merit list.
Table 5 shows the comparison of the marginal costs of the economic merit list versus the extreme real-time scenarios from number 1 to number 6, showing, in most of the periods of high, medium, and low demand, the optimal value that represents the lowest marginal cost for each simulation scenario. However, the redispatch model delivers non-optimal values of the marginal cost, causing the marginal costs of the merit list to be optimal over the redispatch model in some periods in the simulation horizon. Additionally, the redispatch model indicates the lowest operating costs in all simulation scenarios compared to the merit list, thus validating its implementation. However, the weakness in using the economic merit list is due to the fact that it does not adapt to the immediacy of the system operator to simulate extreme power system conditions with mathematical background support and timely response times.
In summary,
Table 5 and
Figure 15 show the economic results of the redispatch model, such as operating costs (OpC) and marginal cost (MgC) in different demand periods, with a three-day simulation horizon. However, the real scenarios with the best marginal cost are the RTES1, RTES2, and RTES4 scenarios (70 to 89 USD/MWh), which can compete with the unit commitment and economic merit list models. It is also evident from the redispatch model that the overall operating cost of the real-time extreme scenario ranges from 23,739,307 to 25,524,673 USD. Therefore, it is shown that for these scenarios, the overall cost of operation is competitive, as opposed to the overall cost of operation of the actual scenarios using the economic merit list (40,898,179 USD).
However, the most critical real scenarios of RTES3, RTES5, and RTES6 represent a true reflection of the use of coal-diesel thermal generation, where the overall operating costs range from 33,341,278 to 40,592,628 USD, close to the operating cost of the economic merit list (40,898,179 USD) which is evaluated through a base scenario with no variation in the system. From these results, we can deduce that, if we submit the redispatch using the economic merit list for RTES3, RTES5, and RTES6, the overall cost of operation could double.
On the other hand, the lower operating cost of the proposed model (23,739,307 USD) is higher than the unit commitment model due to the fact that the network parameters are adapted to the reality of real-time operation. This shows that the operating cost of a unit commitment model is cheaper (15,804,718 USD). However, the unit commitment model has not been fitted with the actual variable cost functions of the plants, because its modeling is a linear cost function. Instead, the proposed work runs a redispatch model that integrates polynomial functions of the variable costs, which depend on the specific net consumption and the maximum dispatch power. In the real-time extreme scenario, a maximum dispatch power of 1050 MW is recorded without the need to limit generation. As for the convergence times of the redispatch model, it can be stated that they are acceptable (2–5 min) and meet the expectations for decision making in real-time operation, surpassing on a large scale the pre-dispatch model (1 h) and the economic merit list (3 h).
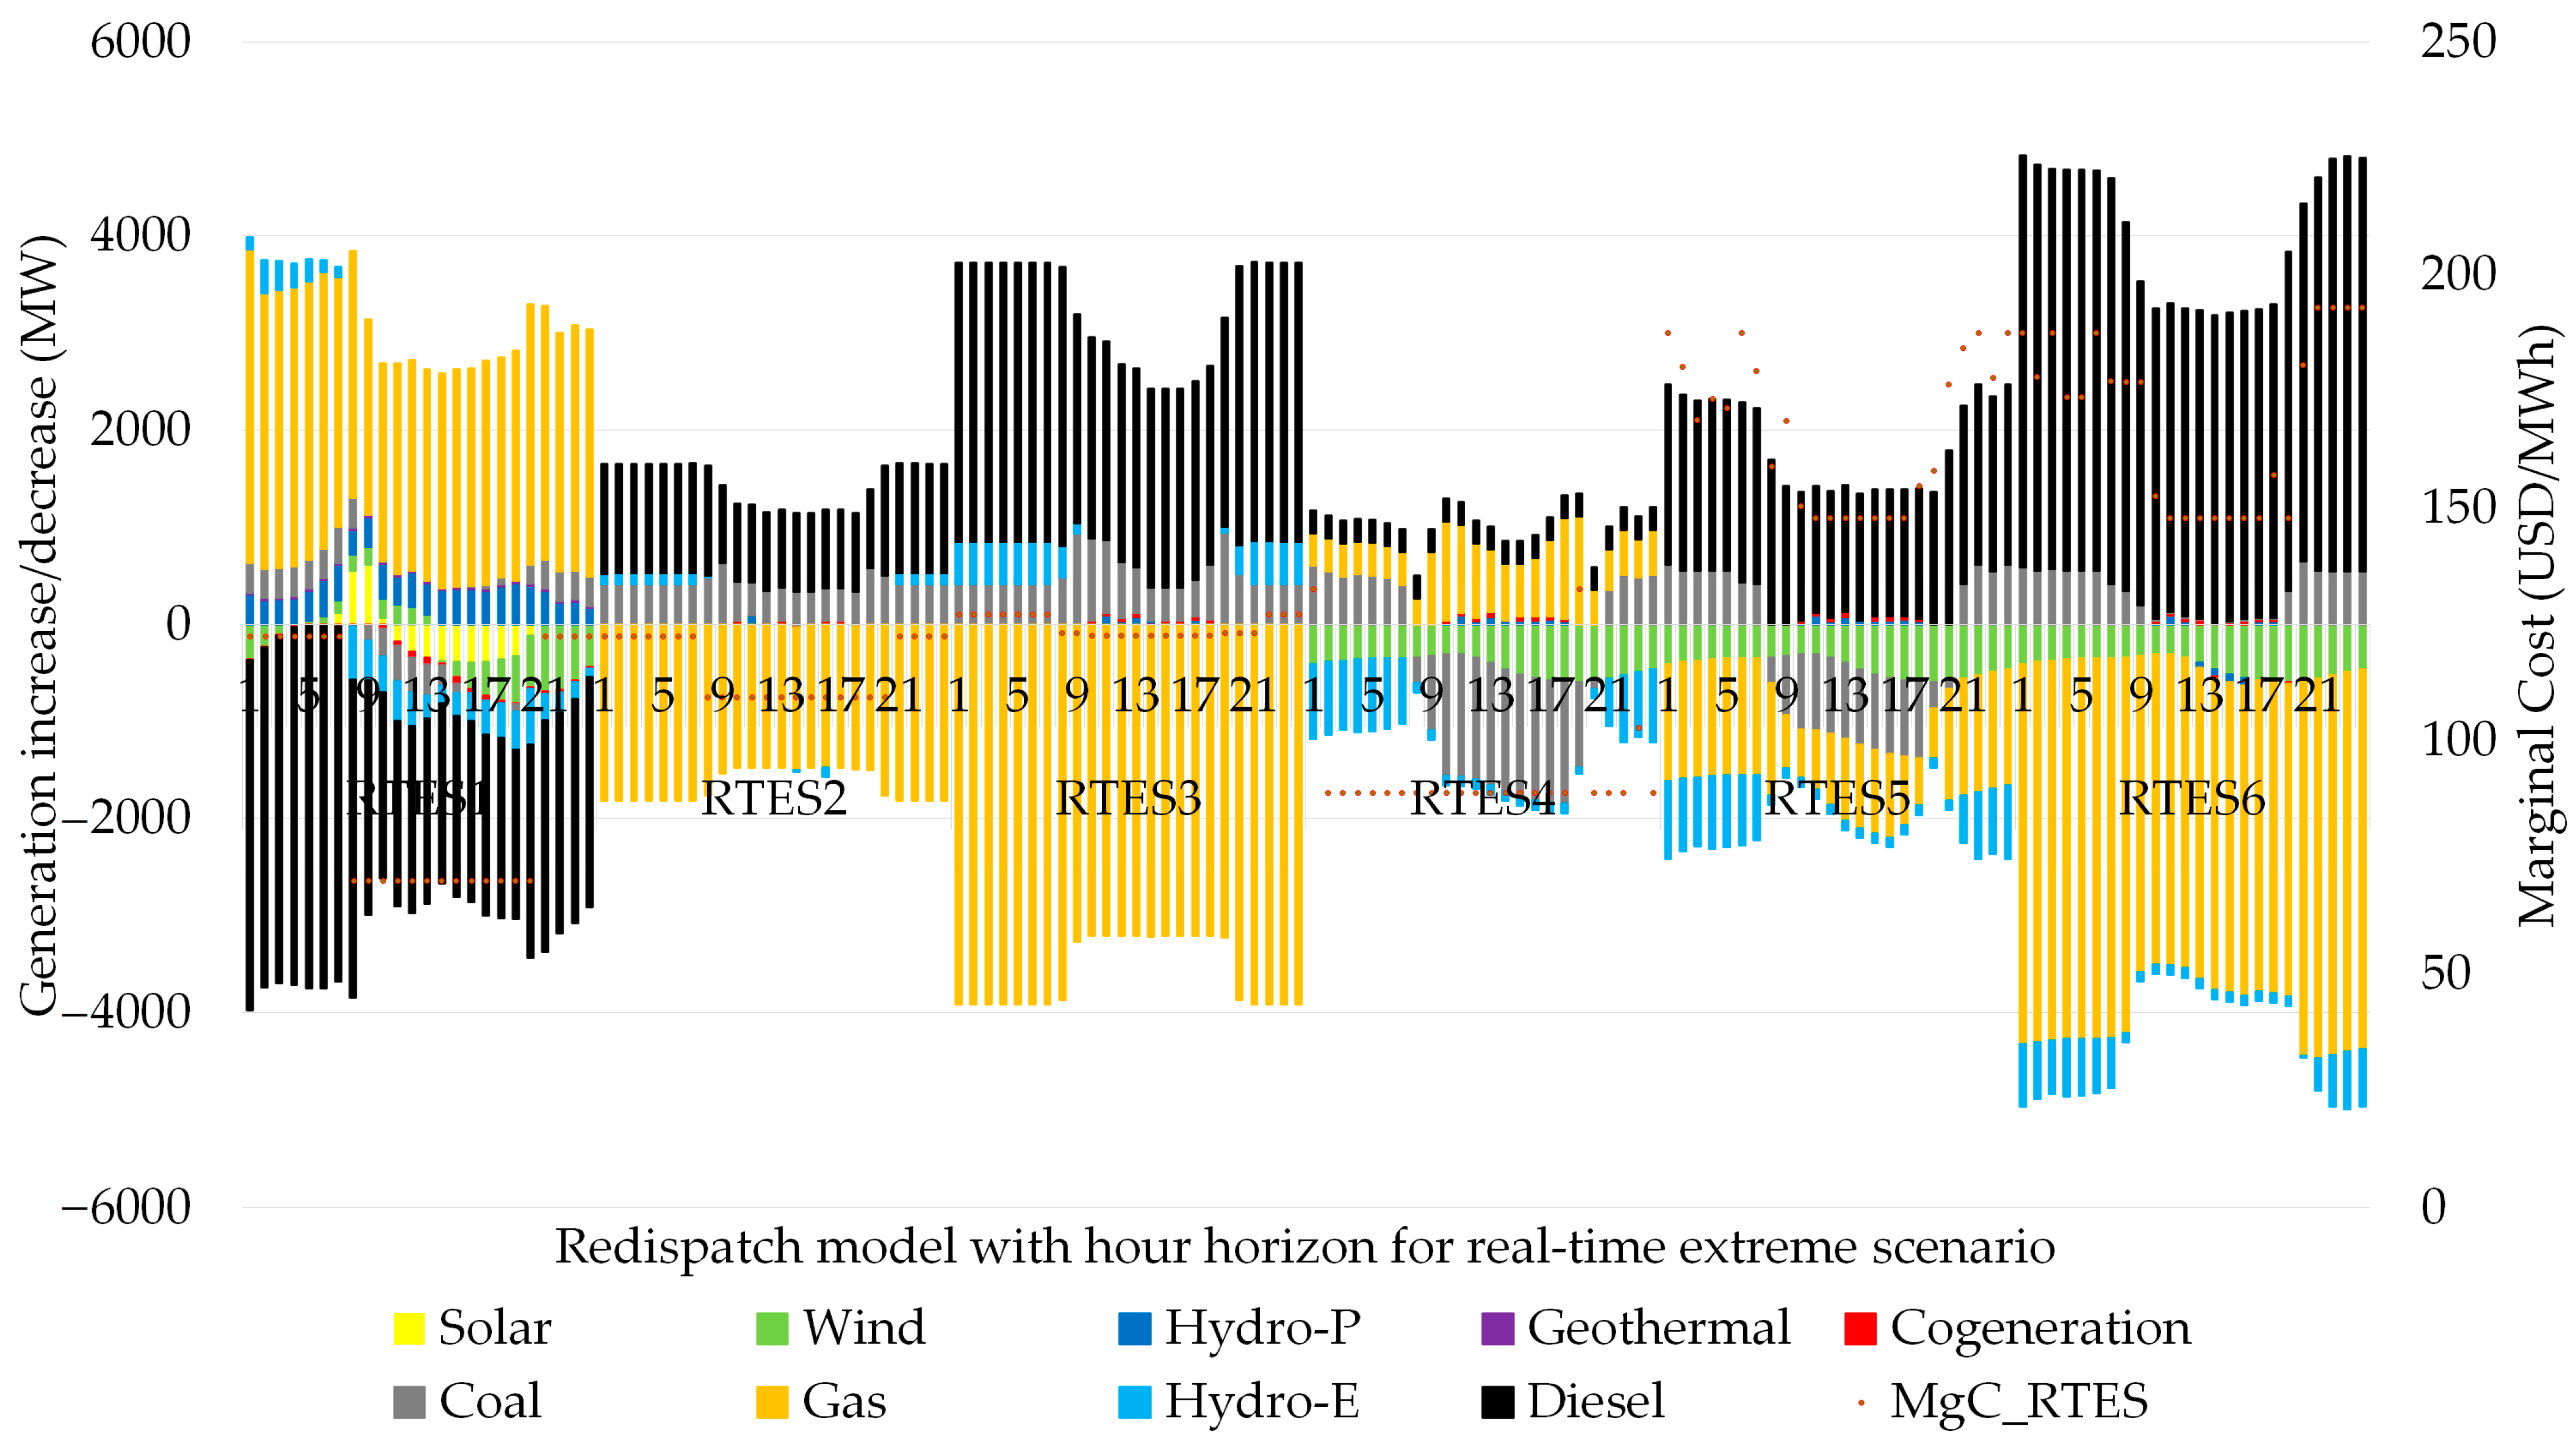
Regarding the dispatches of power plants that modify the initial generation of the unit commitment, for real-time extreme scenarios 1, 3, and 4, gas-fired thermal generation has the largest share, around 3000 MW, with average marginal costs ranging from 94 to 128 USD/MWh, while in real-time extreme scenarios 2, 5, and 6, diesel thermal generation registers the largest increase in power, around 4000 MW, with average marginal costs ranging from 113 to 193 USD/MWh, as shown in
Figure 14.
6. Conclusions and Future Work on the Redispatch Model
The redispatch model developed in this work is successful because it contributes to the decisions made by the system operator over any other method related to the real-time electricity generation market. This redispatch model replaces the traditional and inefficient economic merit list used in several South American countries, allowing us to mitigate the non-optimal results of operating costs due to unjustified dispatches of plants with the economic merit list methodology as the only resource in real-time operation. Therefore, it is necessary to evolve to a more sophisticated redispatch model that adapts to the challenges of real-time operation and market, considering the massive solar-wind renewable generation that Chile and the world are facing, with thousands of megawatts added to conventional generation.
The proposed redispatch model is fast to execute in order to face the daily real-time operation that deviates from the scheduled operation of the unit commitment. The convergence times for the different real case studies to which the redispatch model was subjected are acceptable and the economic results have absolute validity. The system operator can execute, in real time, the decisions of dispatch and retirement of plants optimally, leaving expired the use of the economic merit list that causes serious deviations in the real costs of operation of the system, ranging from 20 to 50%, i.e., in the order of 8 to 20 MUSD, with respect to the proposed redispatch model. As for the convergence times for the different real case studies that the redispatch model was subjected to, they are in the order of 2 to 5 min compared to the long convergence times of the unit commitment models and the merit list, which range from 1 to 3 h in their execution.
Unfortunately, the proposed redispatch model has shortcomings that can be improved as other authors propose modifications to the model. From the operational point of view, it is complex to visualize all the dynamic behavior of an electric system in terms of power flows, angle control, voltage regulation, and systemic inertia, which makes the proposed redispatch model premature in these technical aspects and in need of improvement. On the other hand, the ancillary services market is a parallel market to the energy market based on marginal costs. It is a challenge for future researchers to link the ancillary services market in real time to the redispatch model using the necessary active power reserves for frequency control and voltage control, as is the case of reactive power, taking advantage of the massive resource of solar-wind renewable generation.
Finally, it can be stated that as solar-wind renewable generation continues to increase its generation capacity, most modern power systems in the world will have a decreasing capacity of rotational axis inertia and a deficit in the capacity of power reserves for frequency control. However, the proposed redispatch model replaces the traditional and inefficient economic merit list and the system operator can execute real-time dispatch and retirement decisions in an optimal way, leaving the use of the economic merit list, that causes serious deviations in real operating costs, out of date. Therefore, the future challenge of this work focuses on integrating these new markets of ancillary services into the redispatch model, where responsibility in the short term must be assumed by solar-wind generation to displace conventional thermal generation in order to ensure an effective energy transition worldwide.


