
Unsupervised Learning Approach for Anomaly Detection in Industrial Control Systems


Abstract
:1. Introduction
- Heterogeneous system anomaly detection: First, we have developed a methodology that can identify anomalies with unique protocols or complex communication methods in systems composed of devices from different vendors. It is highly adaptable to different ICS environments because it does not rely on pre-labeled data or predefined descriptions.
- Leverage restricted network data: We leverage internal data from restricted networks, recognizing the sensitivity and security concerns within ICS networks. Our research focuses on developing techniques that utilize only the internal data accessible within restricted networks. This capability is essential for detecting system changes and anomalies using data that would otherwise be inaccessible for security analysis.
- Proactive anomaly response: Our research aims to facilitate the early detection of anomalous changes within the ICS, providing operators with timely information. This allows for quick and informed responses to potential problems before they can escalate into actual damage, strengthening the proactive defense mechanisms within industrial environments.
2. Related Work
2.1. Anomaly Detection in Industrial Control Systems
2.2. Recent Approaches to the Study of Anomaly Detection in Industrial Control System
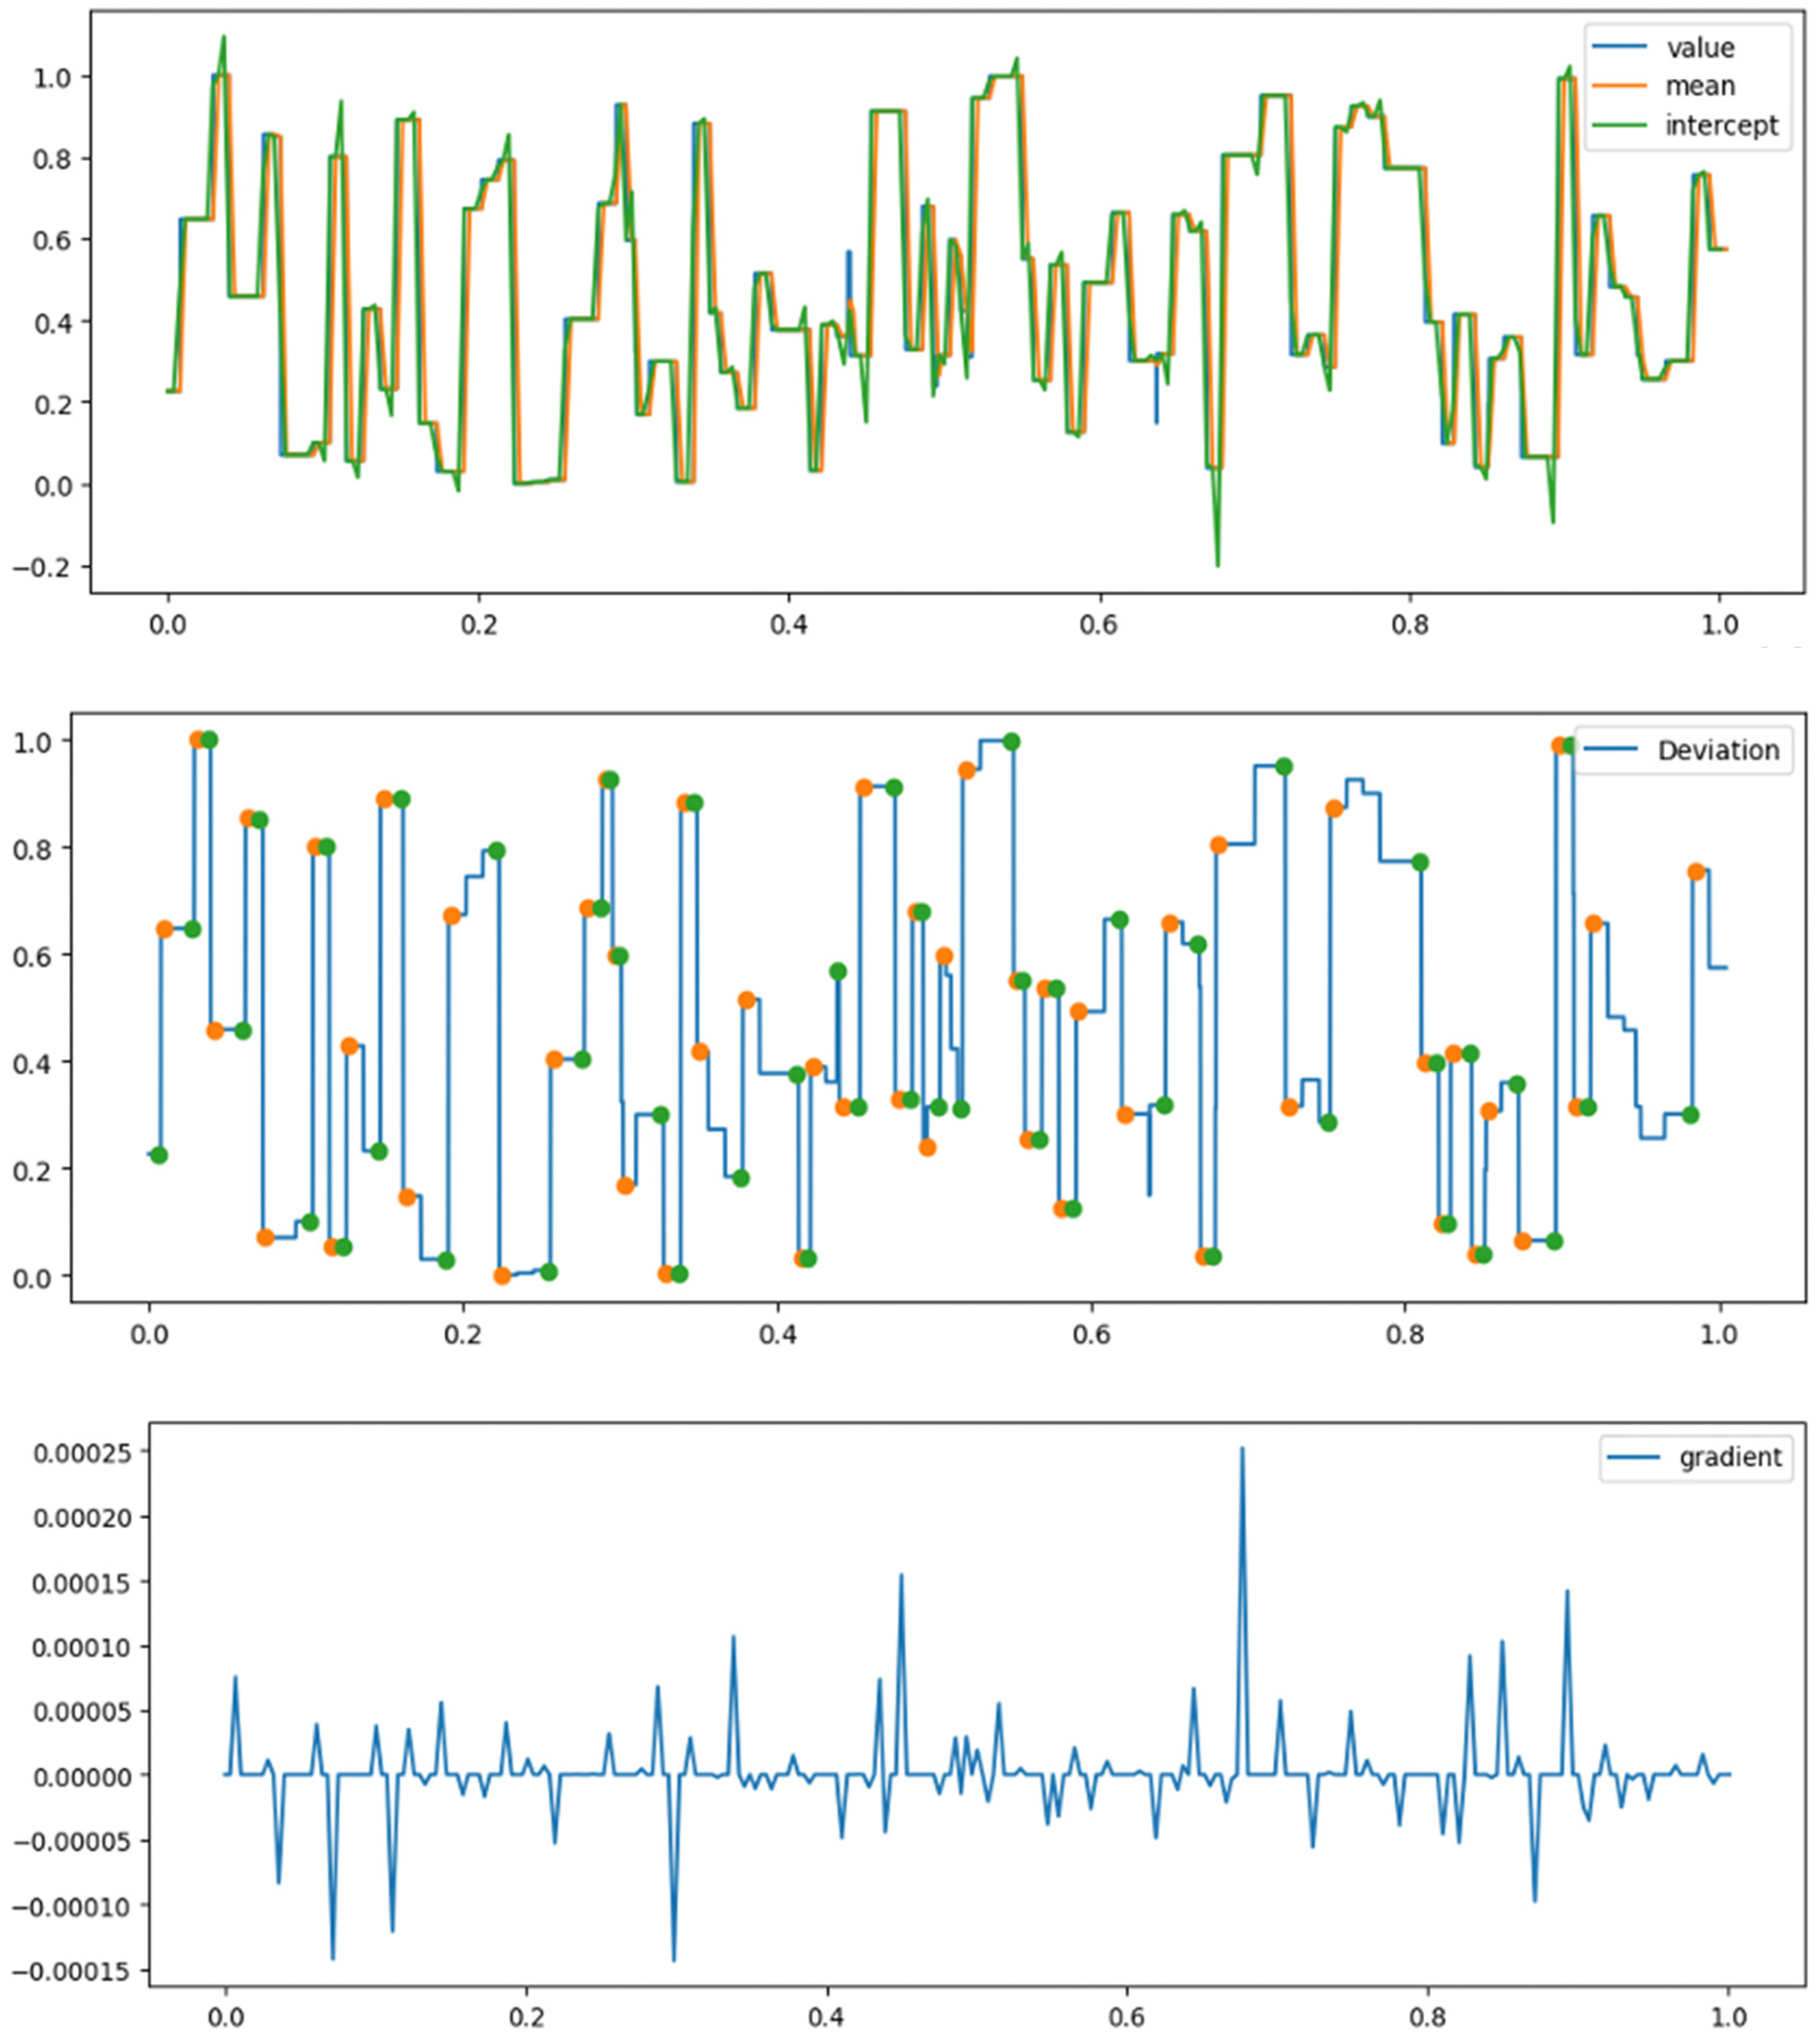
- Data-driven tag analysis: The model in this study analyzes operational data from industrial control systems to accurately identify tags of abnormal operation. To do so, we introduce a novel methodology to identify the misbehavior of a particular device by defining its rate of change. This technique enables us to successfully identify complex anomalies that are difficult to detect using traditional methods.
- Informatization of cluster changes: This research identifies tagged clusters and communicates their changes to control network operators, enabling a rapid response. This process allows security professionals to identify relevant sensors and contribute to the creation of a stable and secure industrial control system environment.
3. Proposed Method
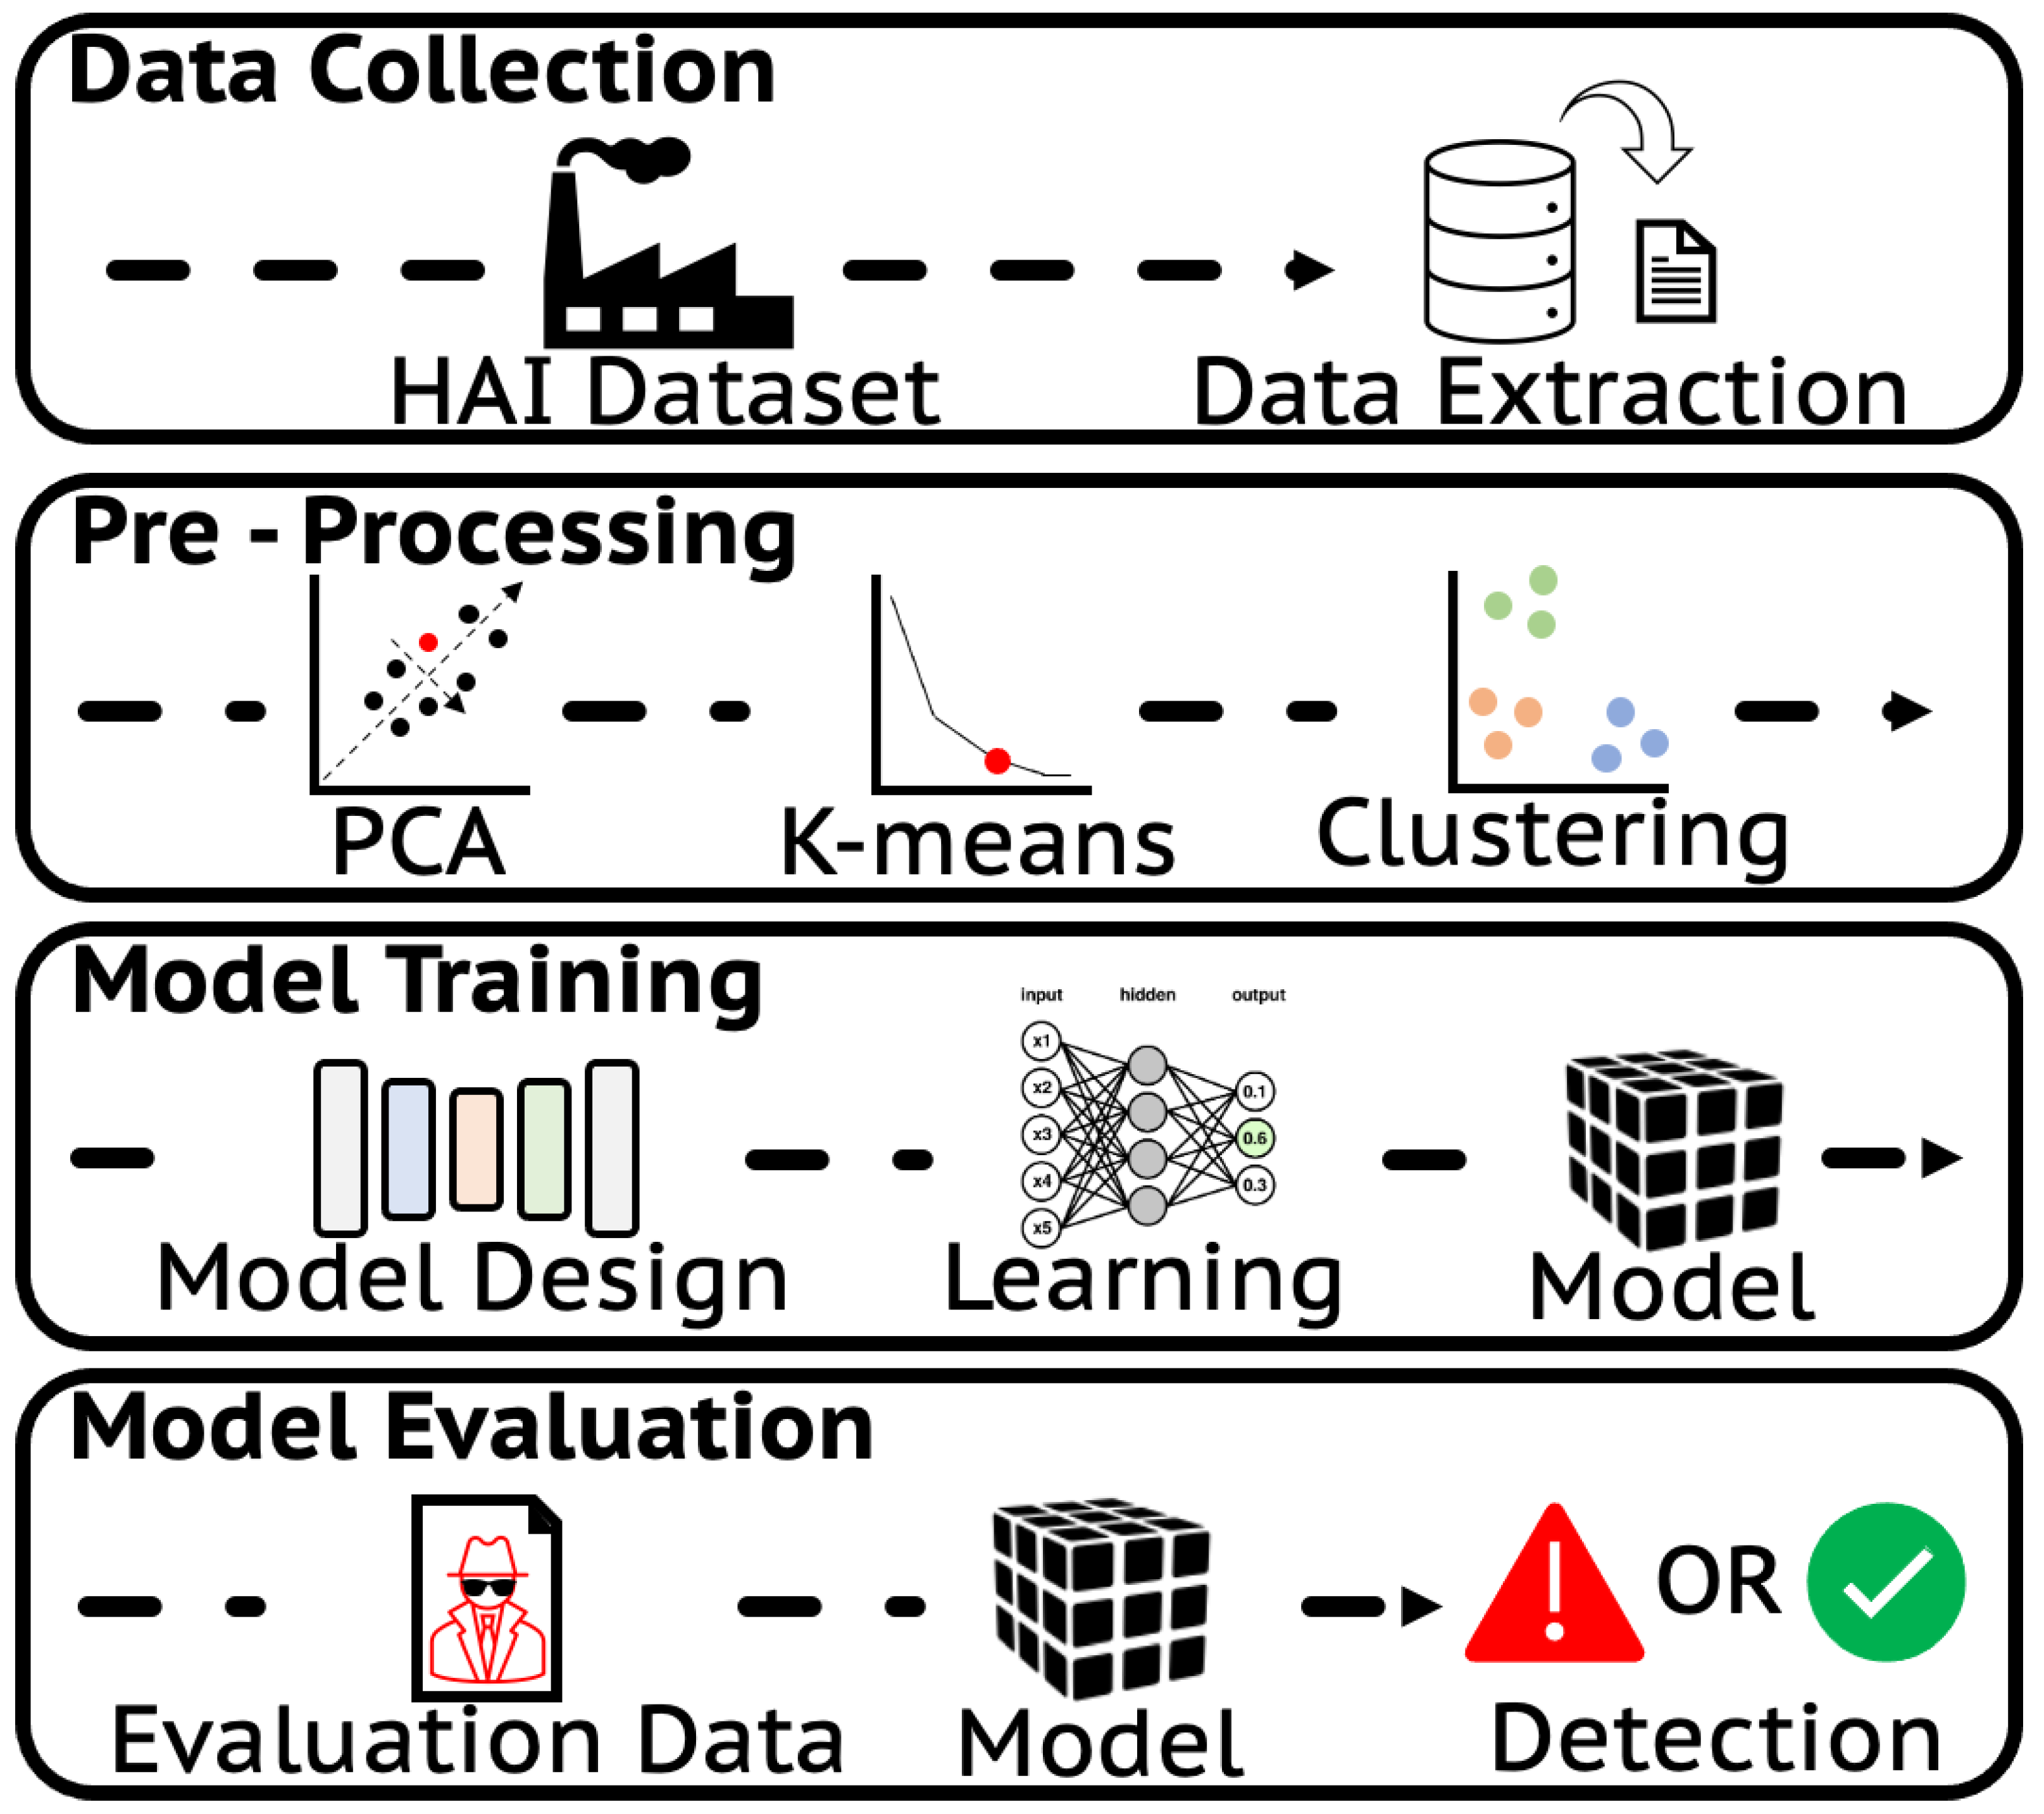
3.1. Overview of the Proposed Approach
3.2. The Dataset
3.3. Data Preparation
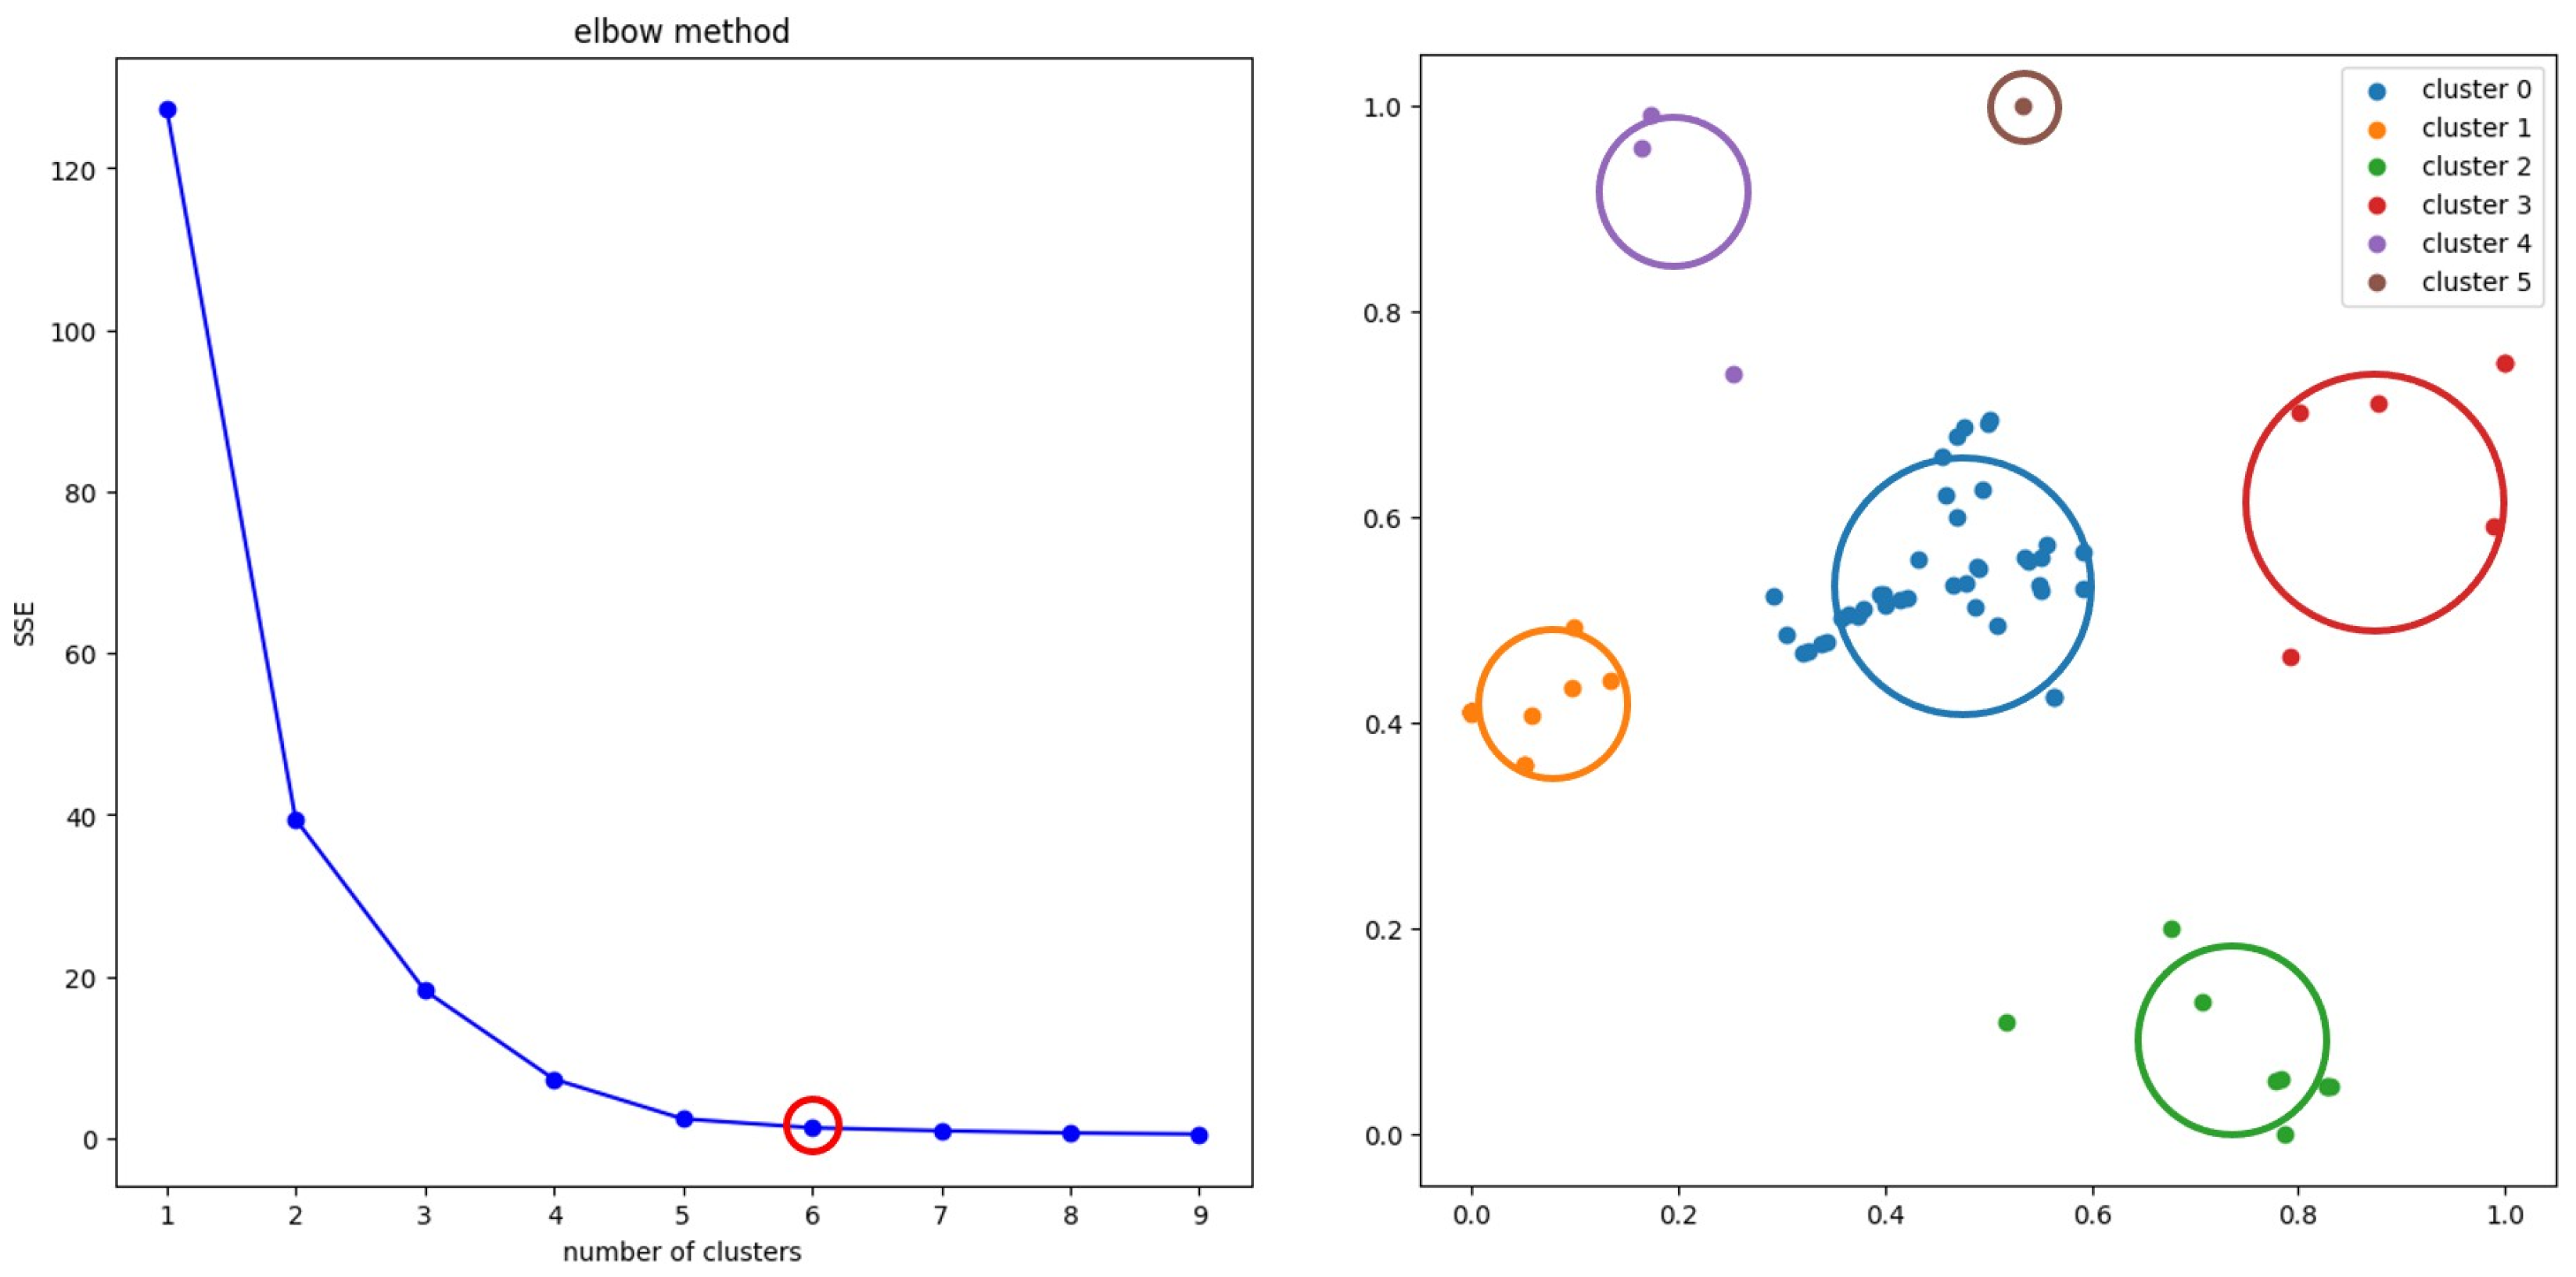
3.3.1. Implementing Cluster Segmentation
3.3.2. Preparation of the Input Data
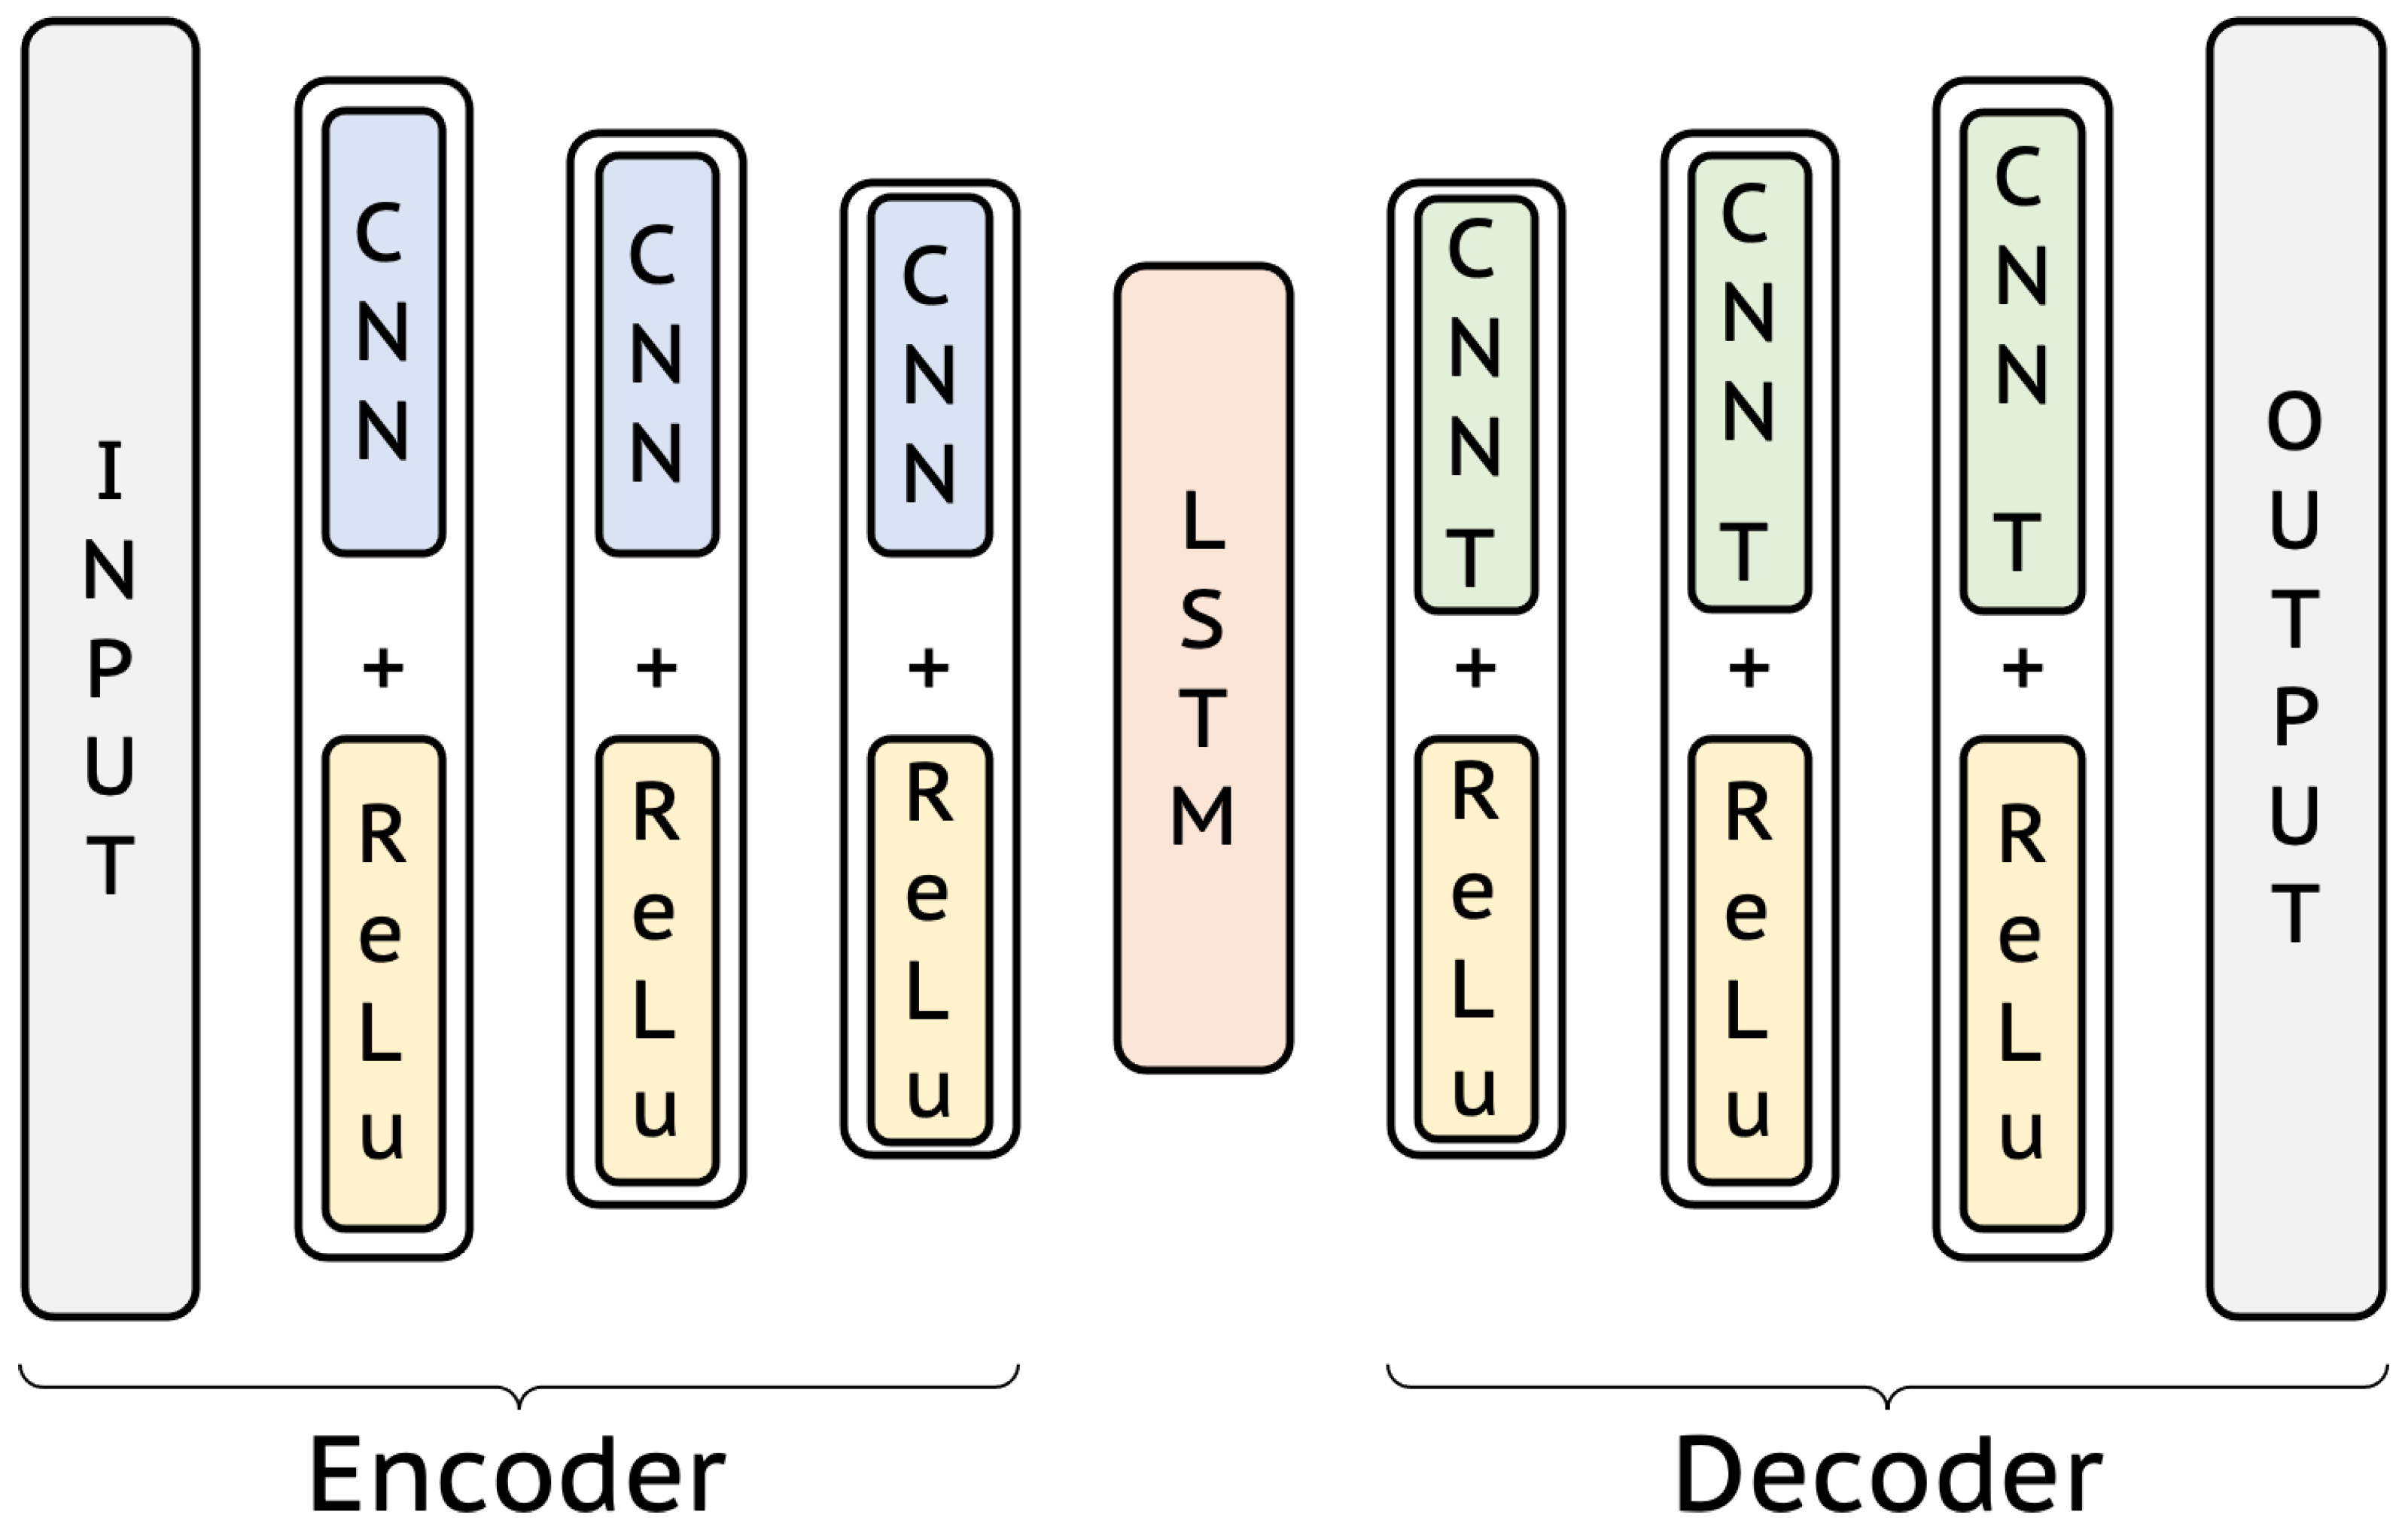
3.3.3. Design the Model Framework
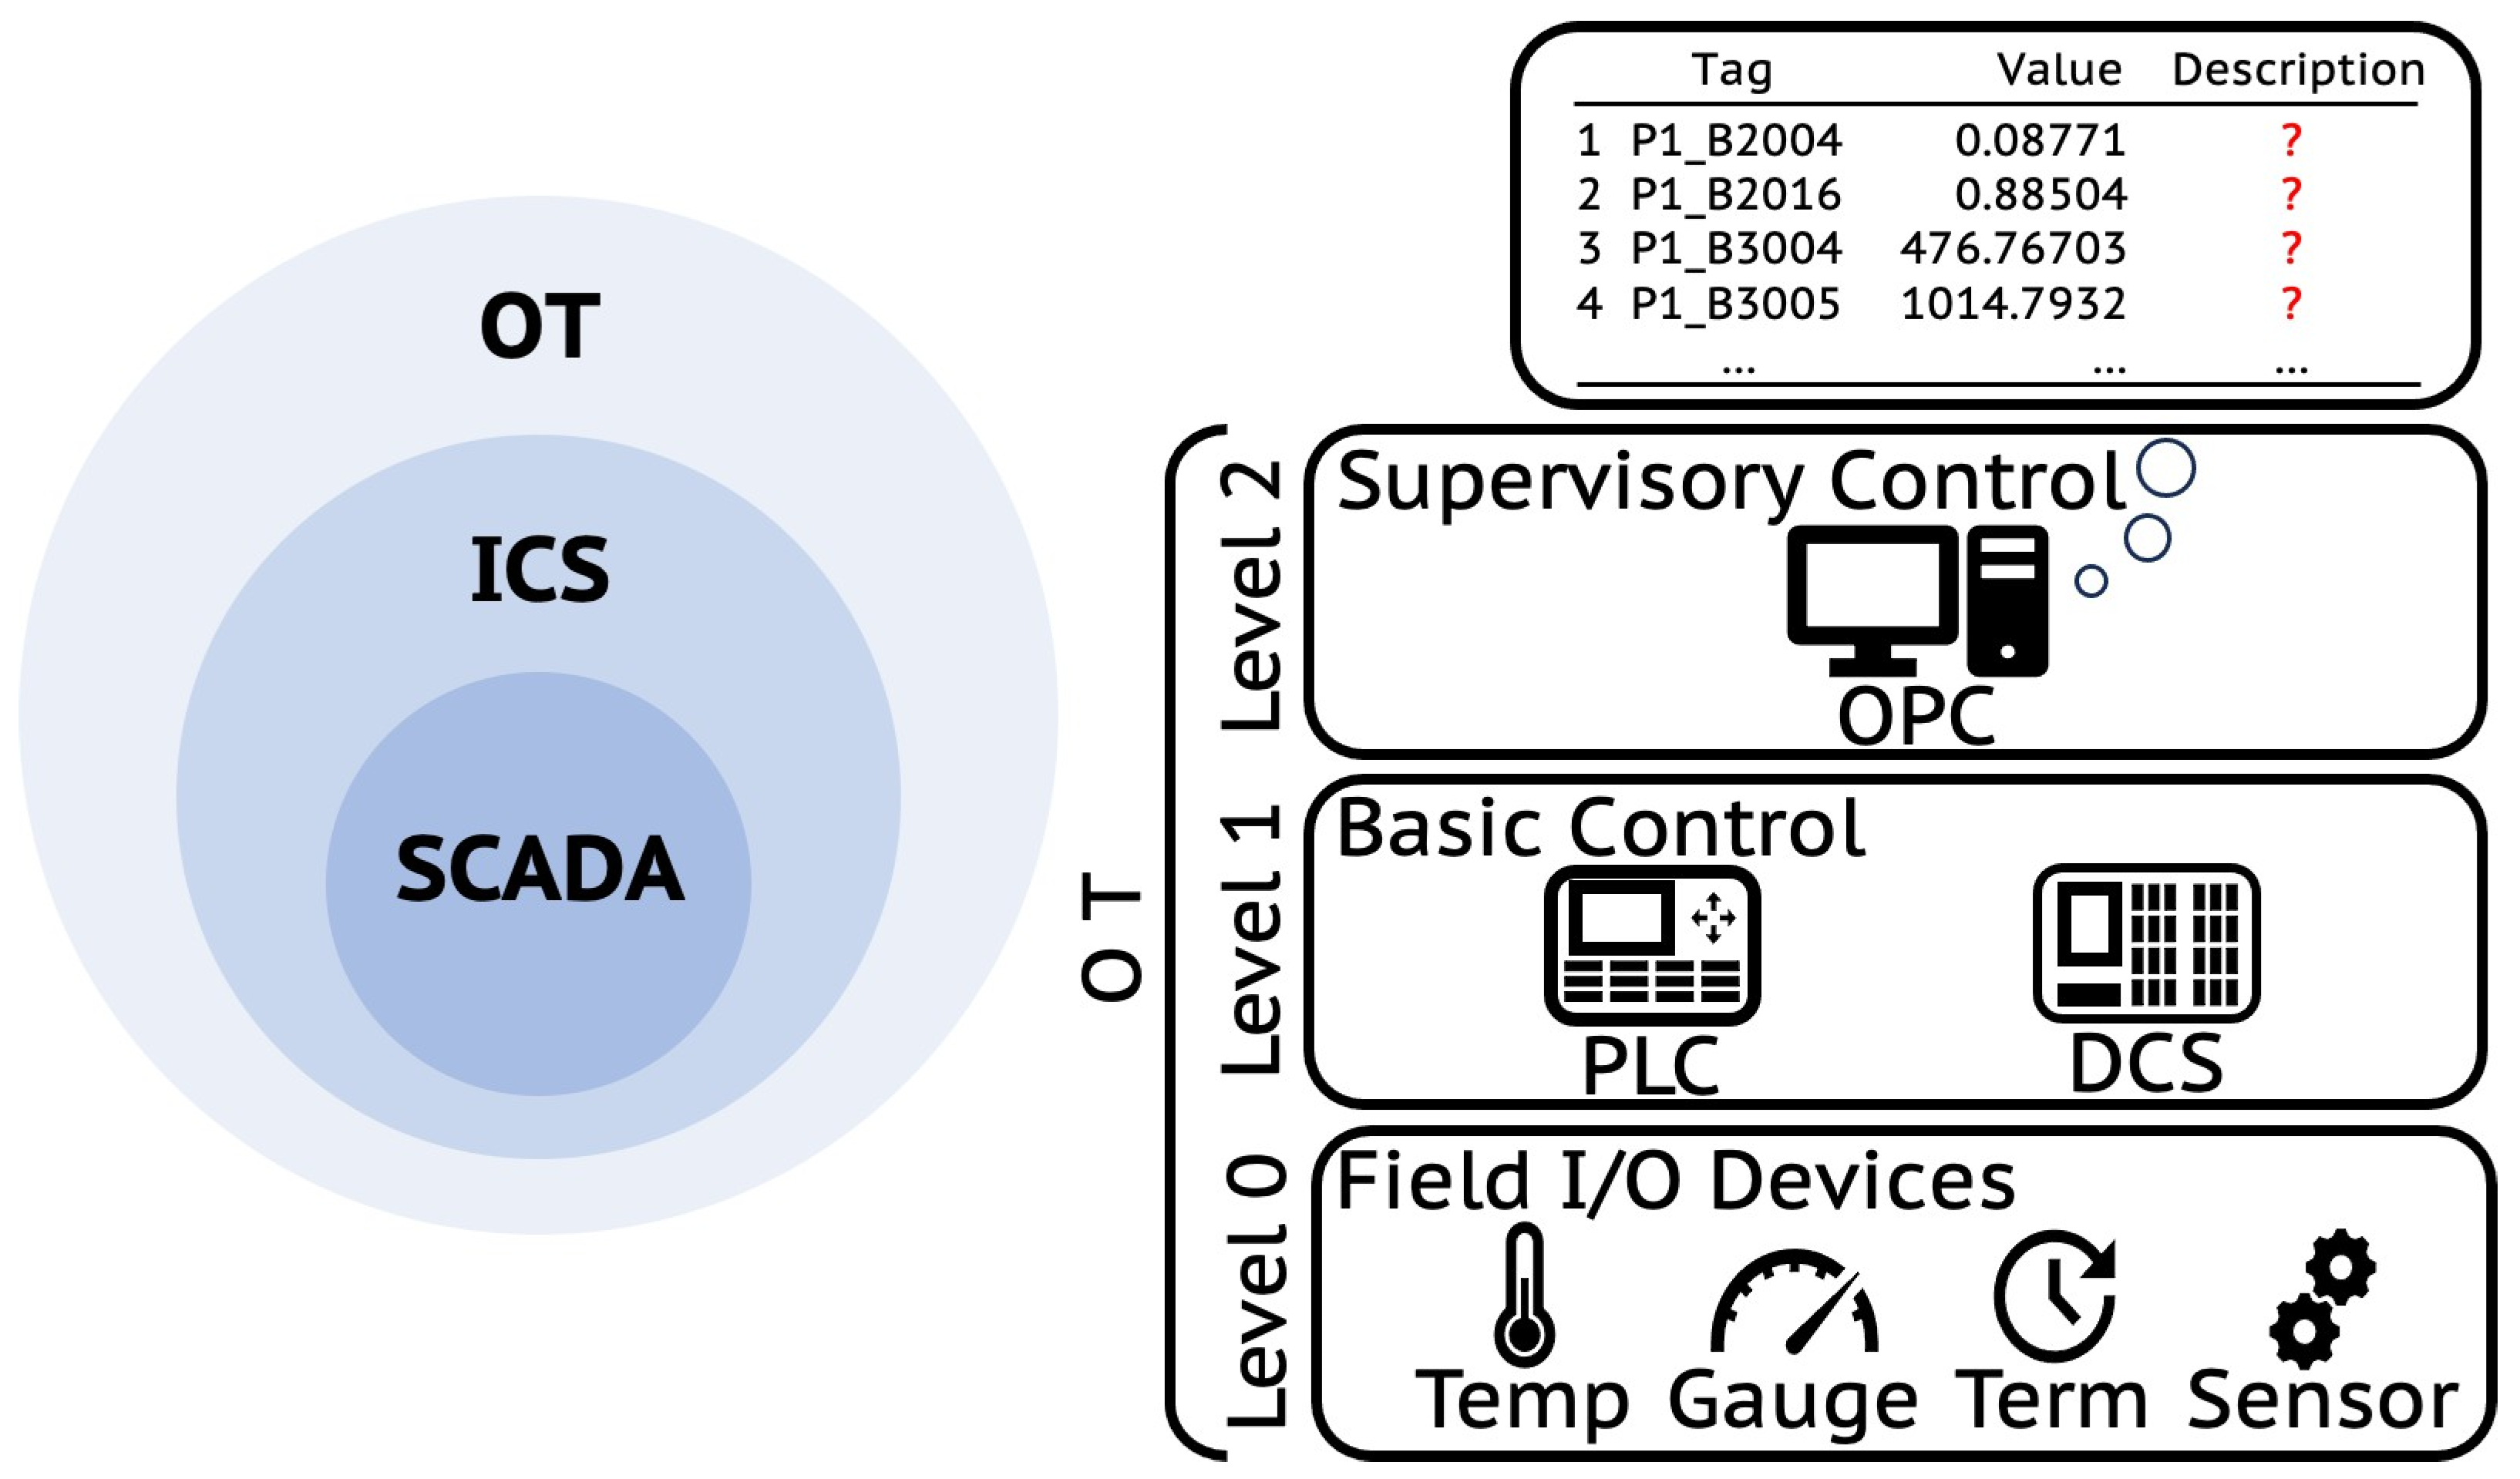
- Input layer: In this study, each tag obtained by clustering was used as input data. It was assumed that all tags had no explanation, but they can be processed simultaneously because different data such as temperature, pressure, and flow were clustered.
- Output layer: The output layer of the model was designed to detect abnormal behavior. The output layer reconstructed the input data, compared it to the original data, and generated an abnormal behavior score. At this point, if the abnormal behavior score exceeded a certain threshold, it was considered abnormal and would inform you of the name, value, and time of occurrence of the tag.
- Activation functions and singularities: ReLU was used in the model to increase the nonlinearity of the model and to increase computational efficiency. Loss used the Mean Squared Error and the learning speed of the Adam optimizer was generally set to 0.001.
3.3.4. Tag-Cluster Detection Classification Model
3.4. Evaluation Metrics
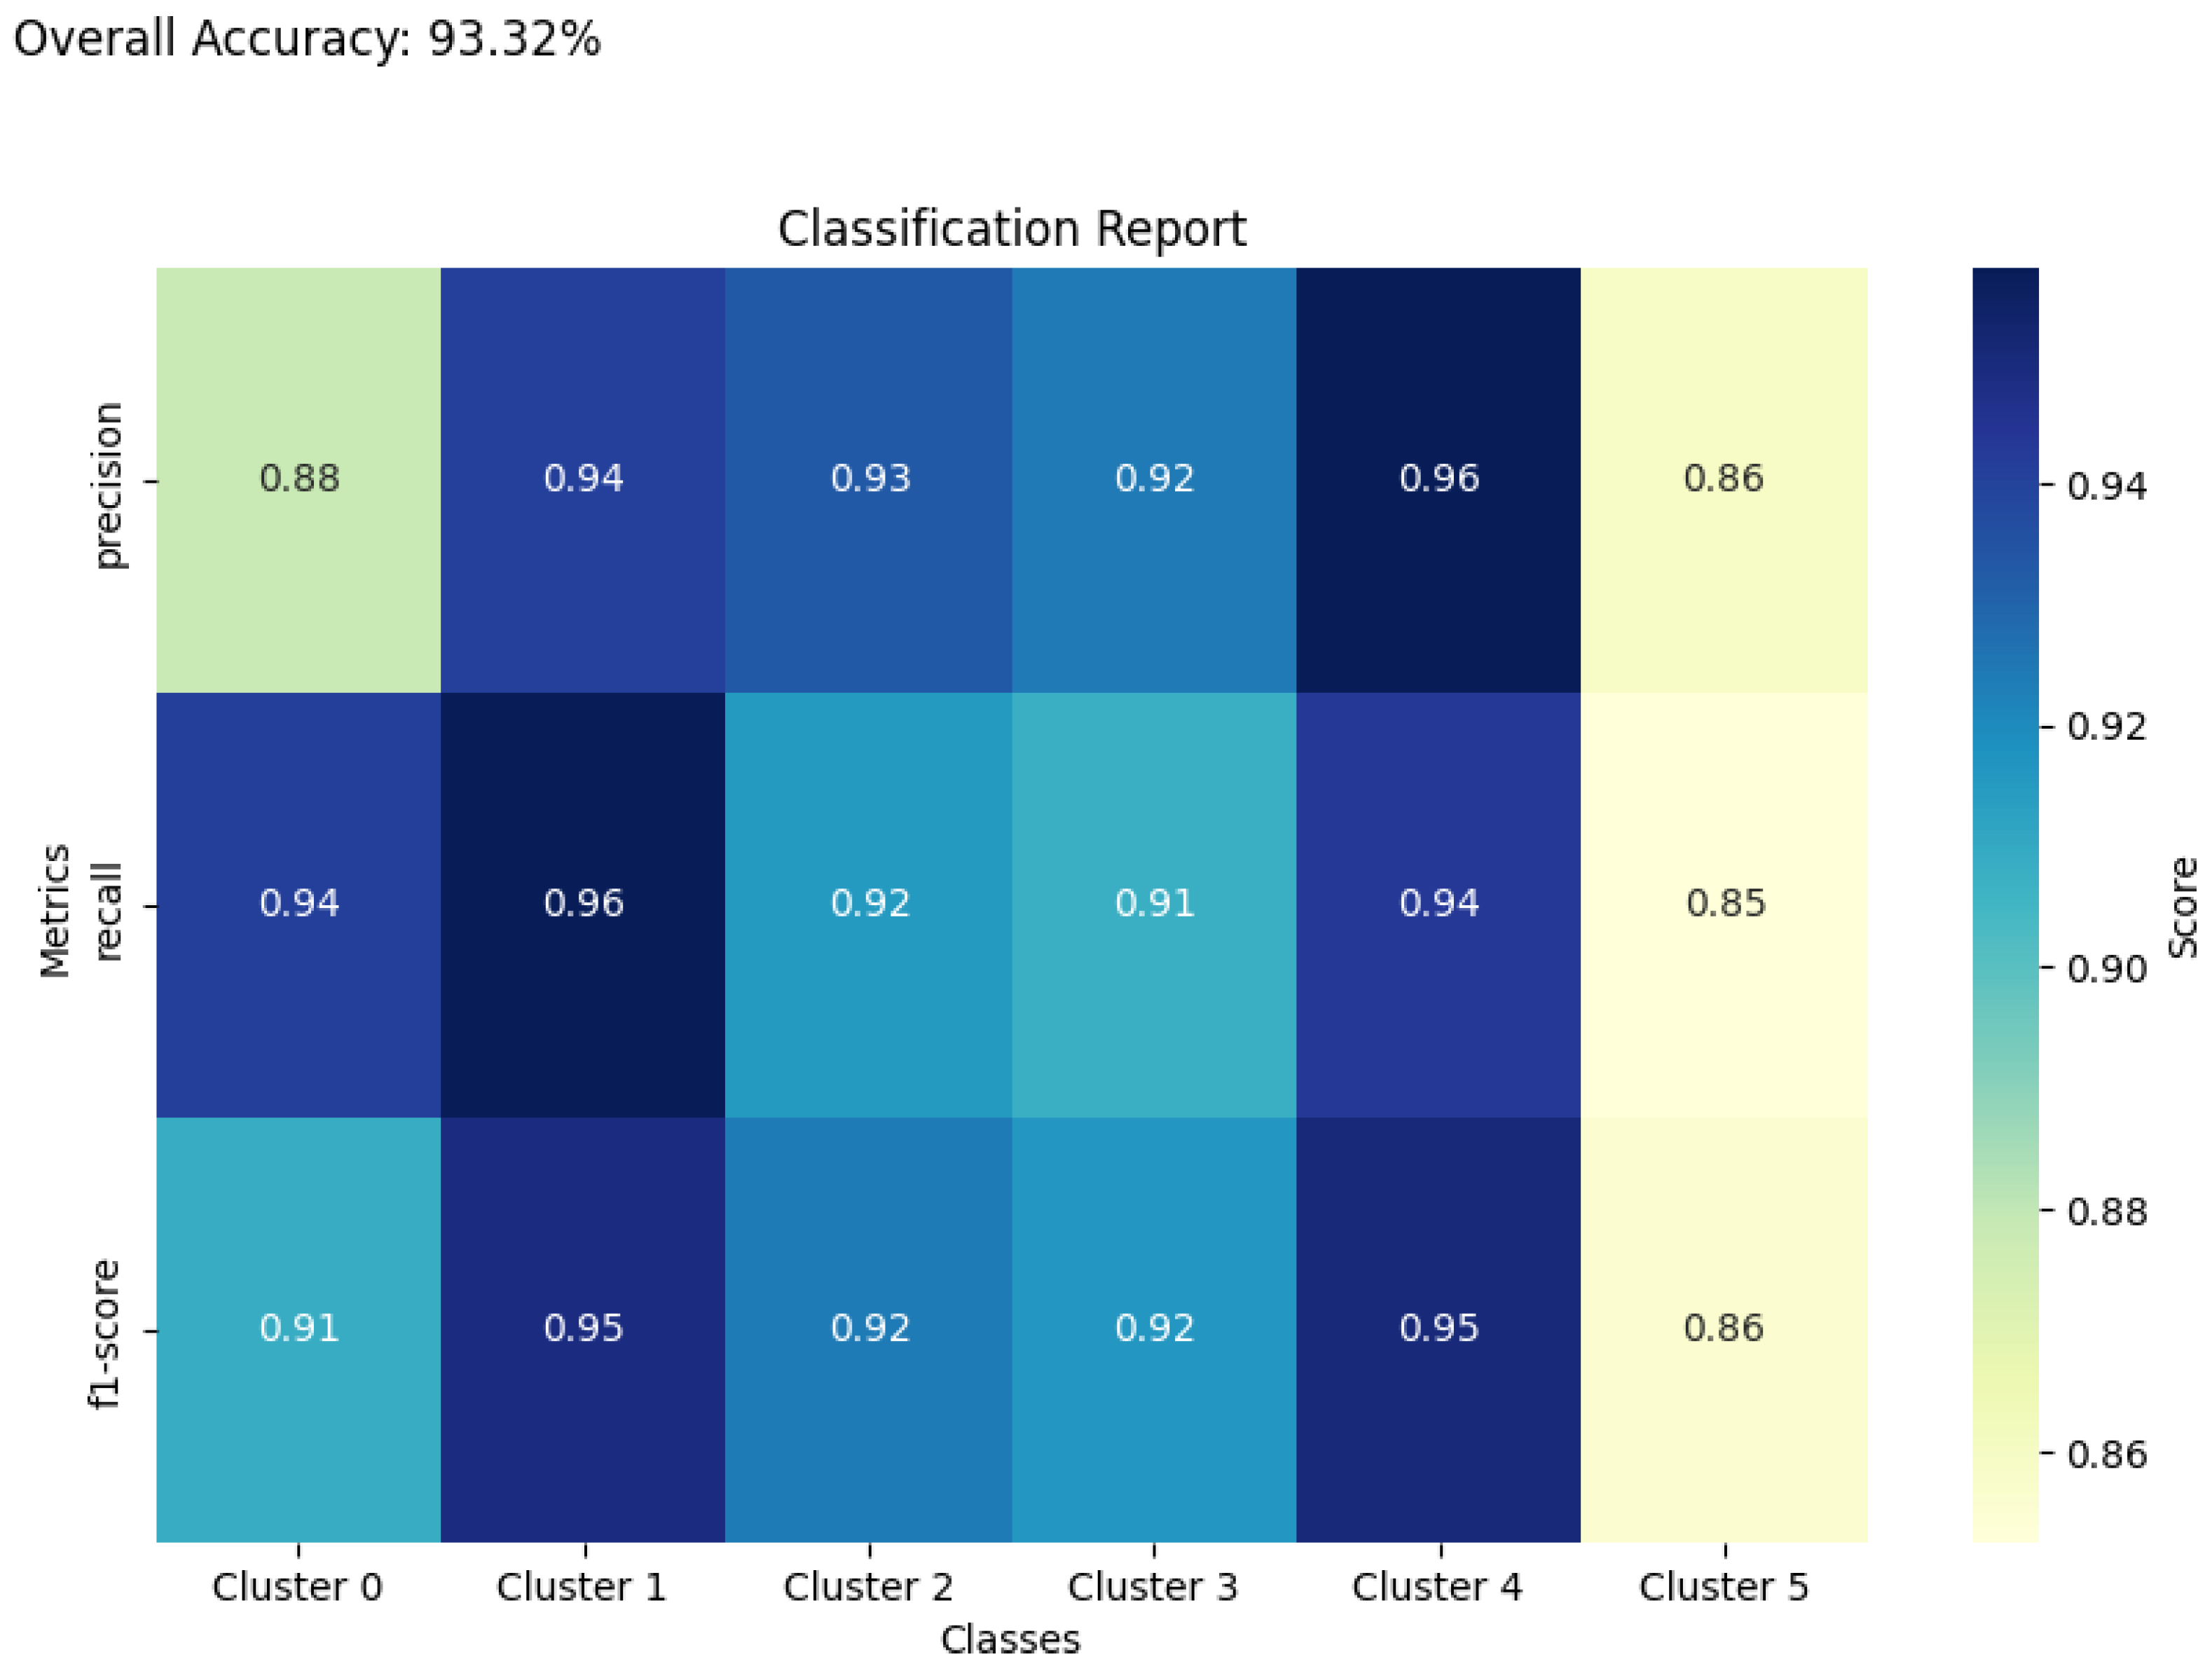
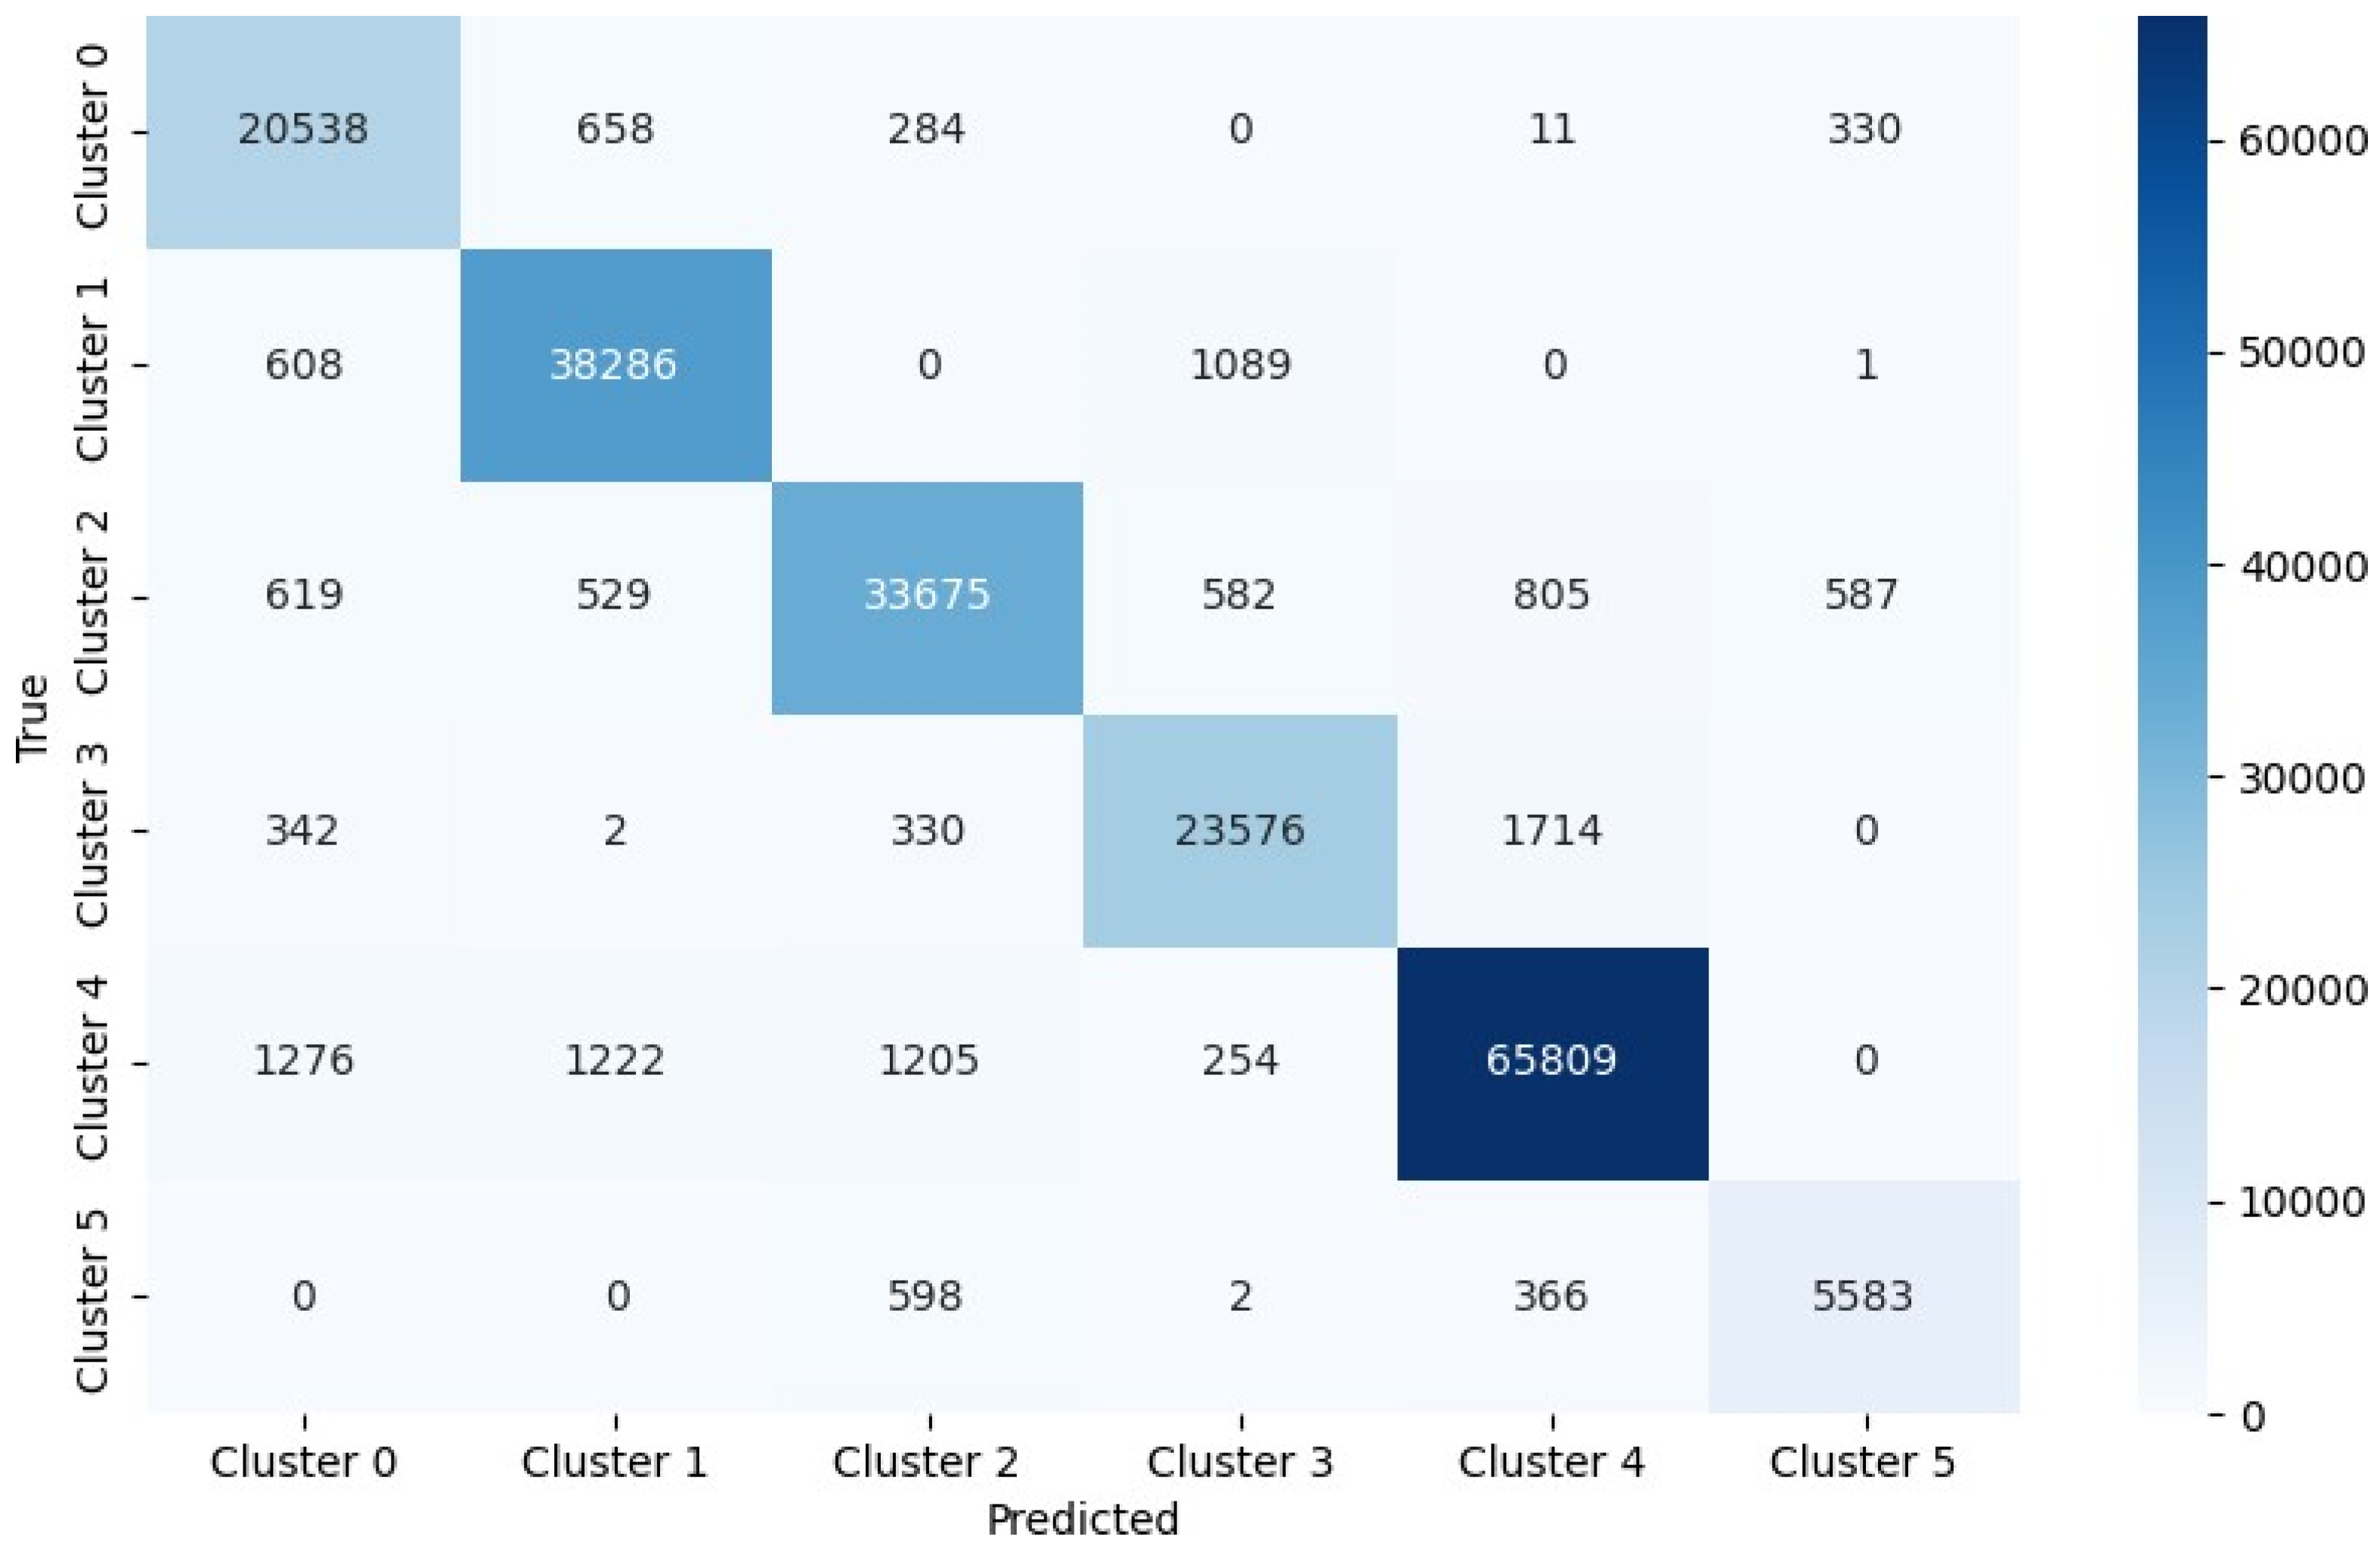
- Performance metrics: Basically, we used the confusion matrix to calculate the number of true positives, true negatives, false positives, and false negatives. From this, we derived statistical metrics such as accuracy, precision, and recall to evaluate the performance of the model.
- Validation methodology: To increase the reliability of our performance metrics, we modeled the case of a hacking threat by assuming abnormal situations and adding intentional error data. We can evaluate how our anomaly detection model handles these situations.
4. Experiment and Evaluation
4.1. Classification and Confusion Matrix
4.2. Abnormal Behavior Detection Experiment
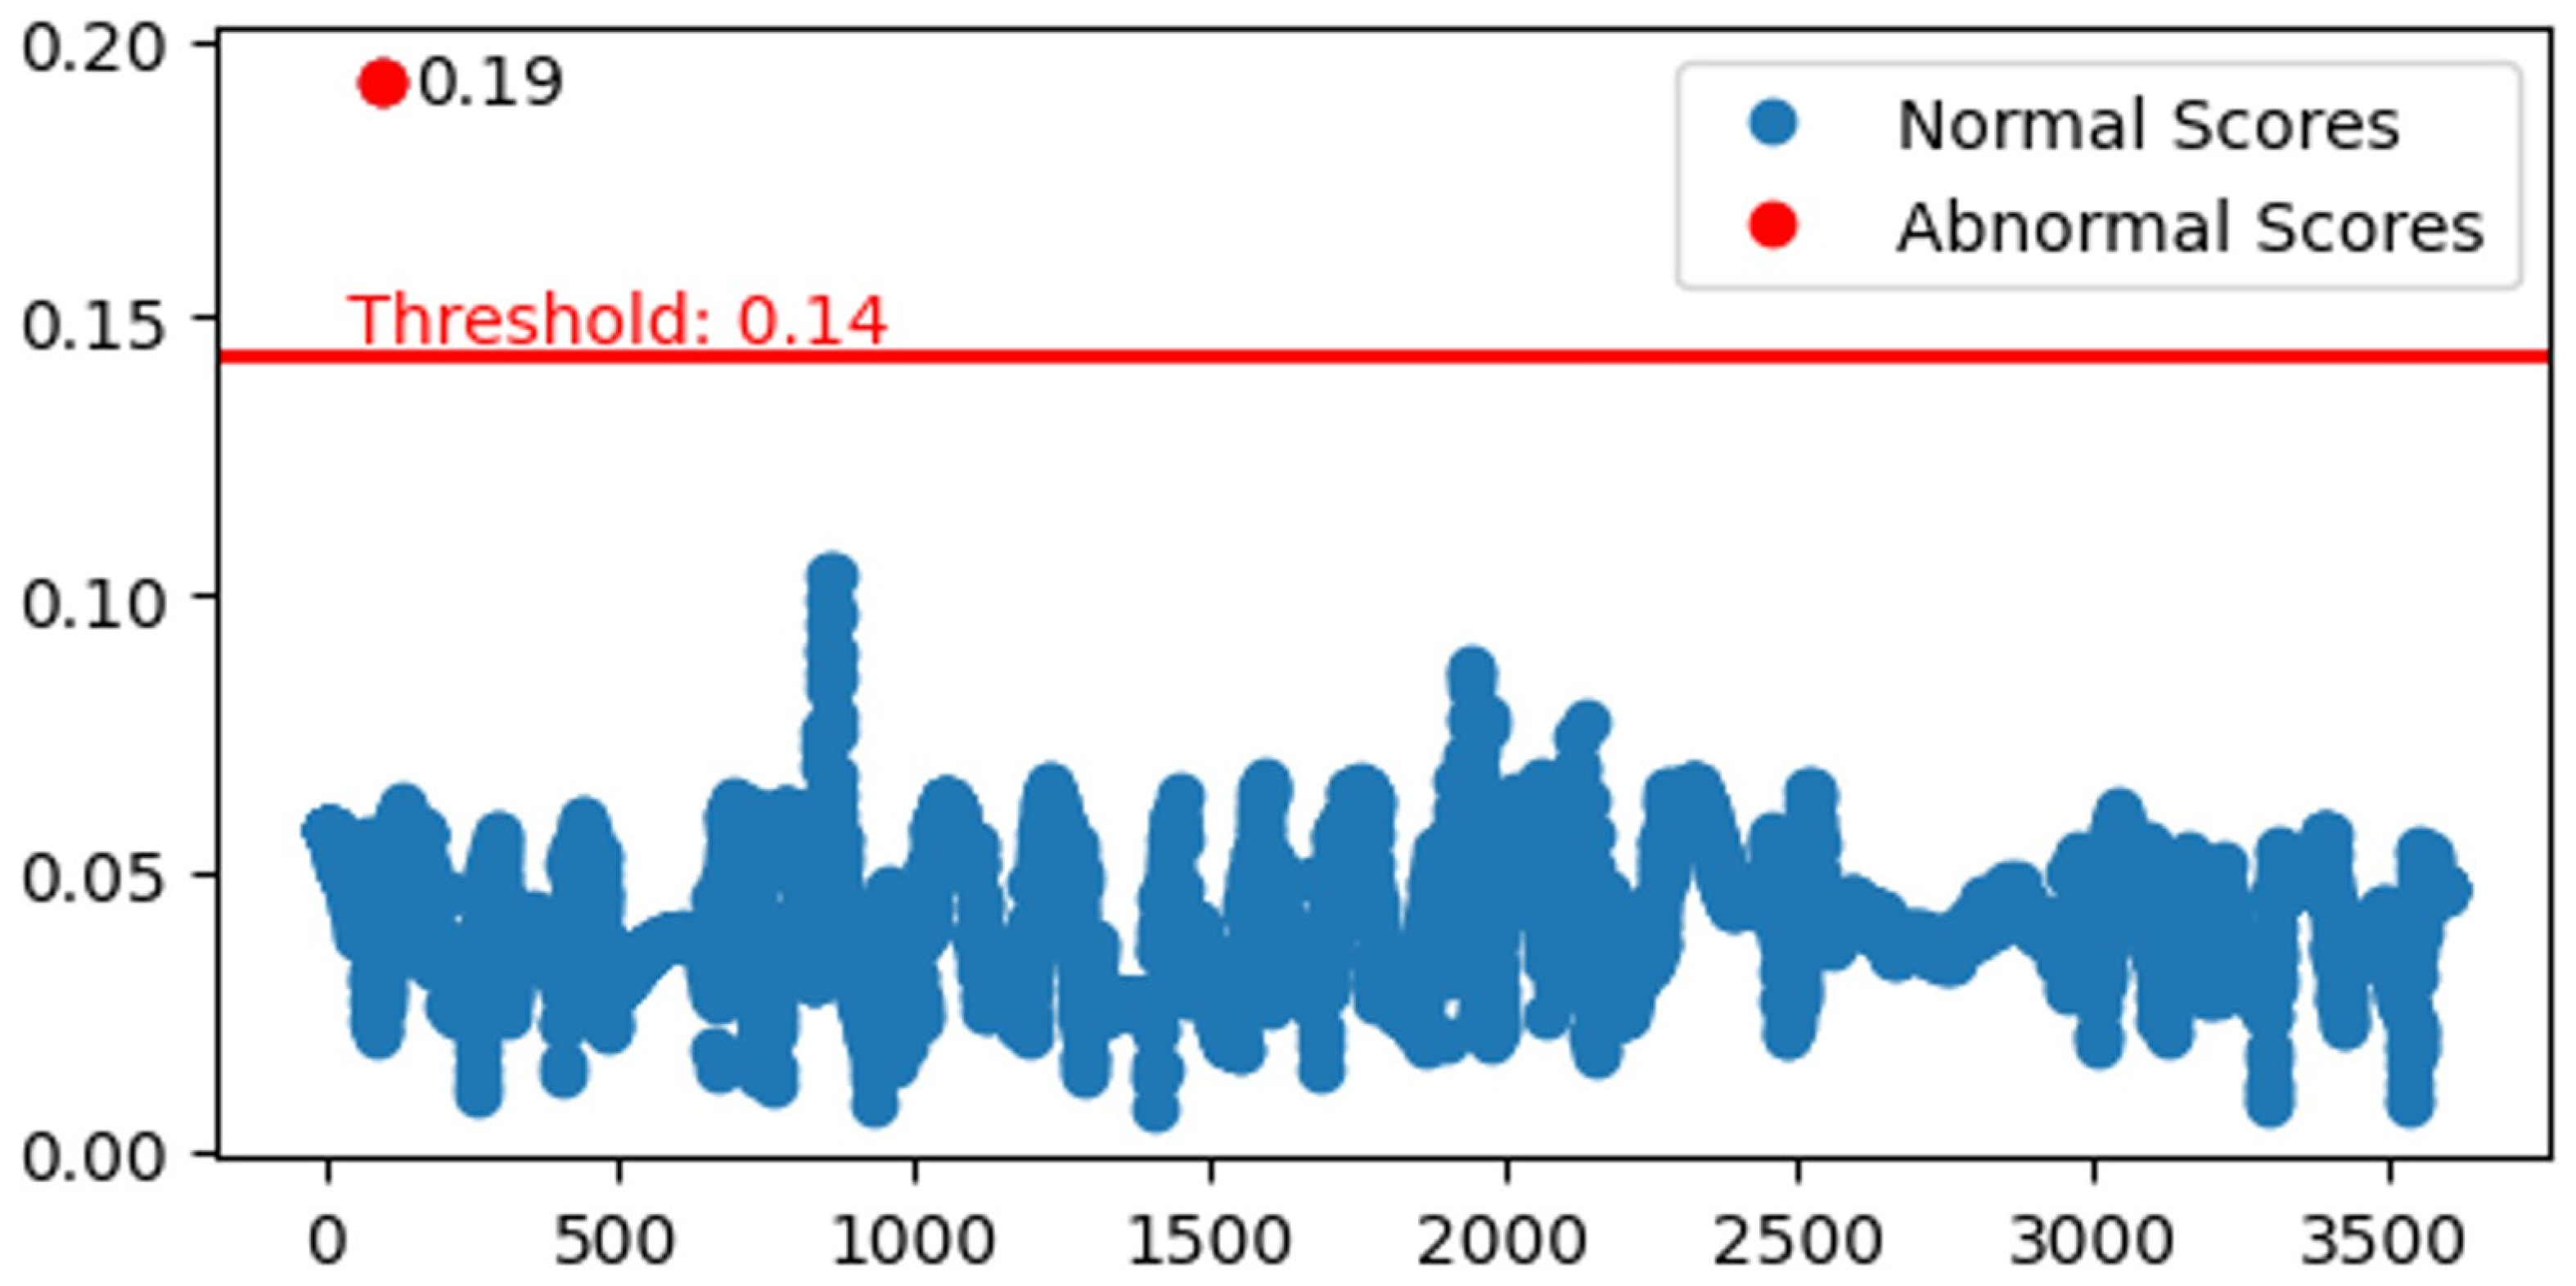
4.2.1. Single-Variable Abnormal Behavior
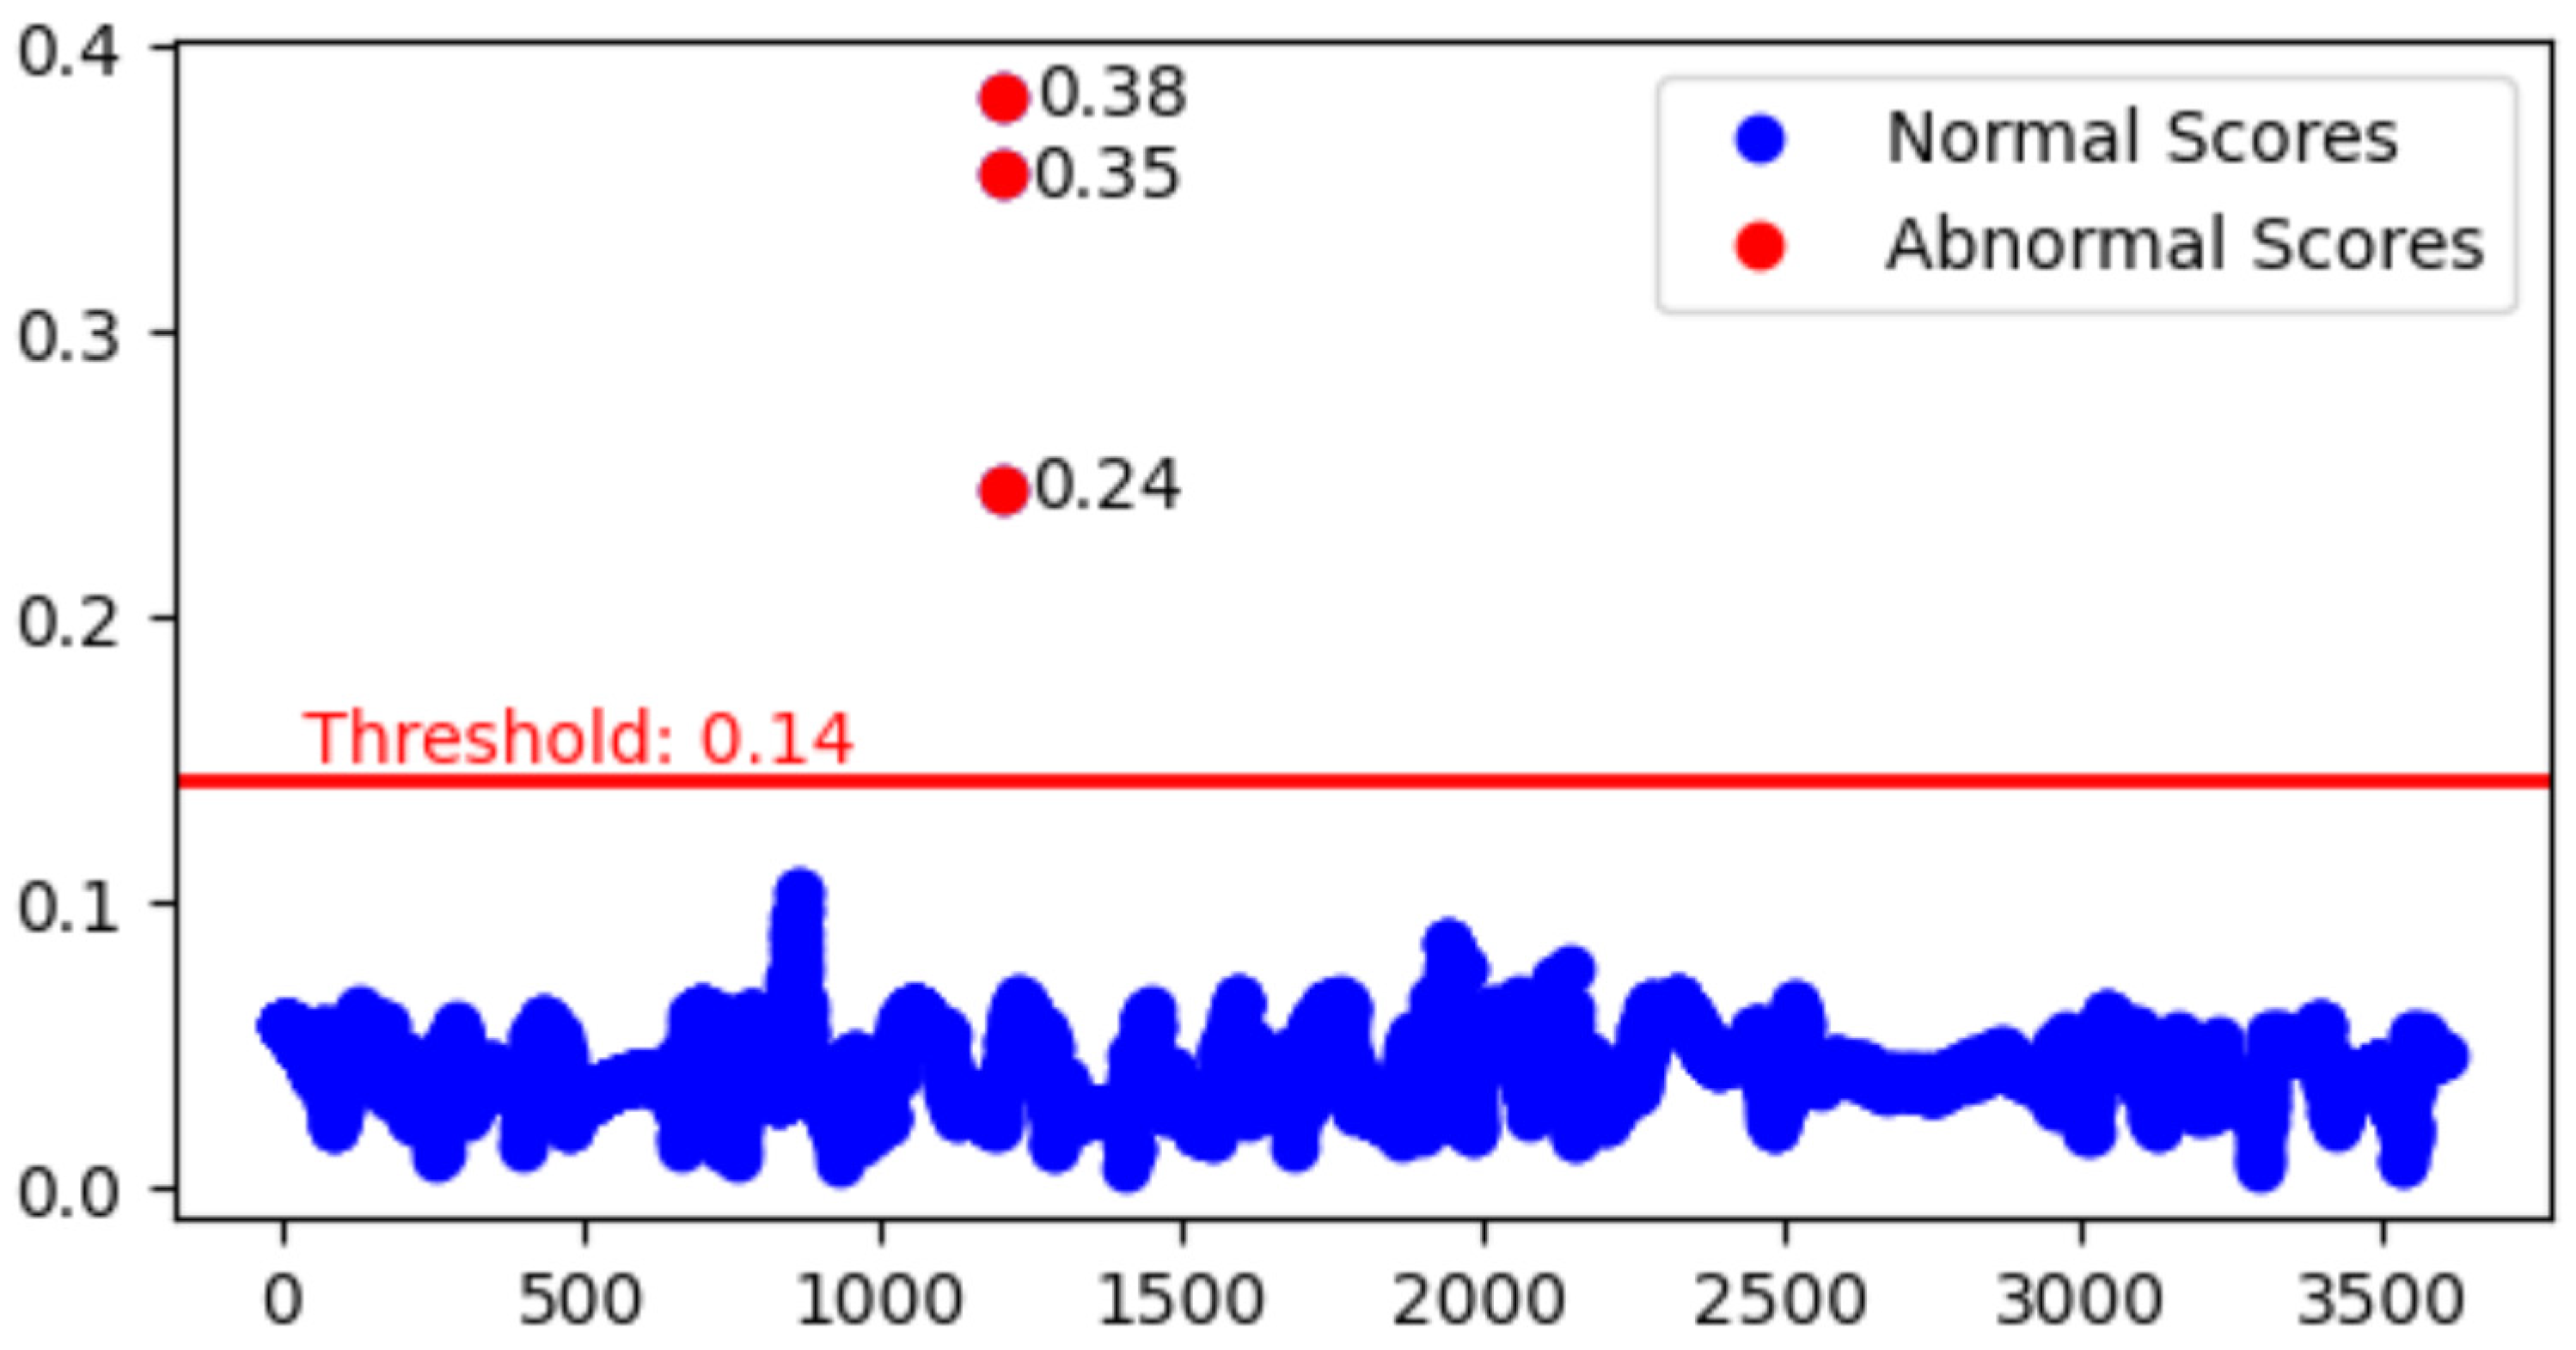
4.2.2. Multivariate-Variable Abnormal Behavior
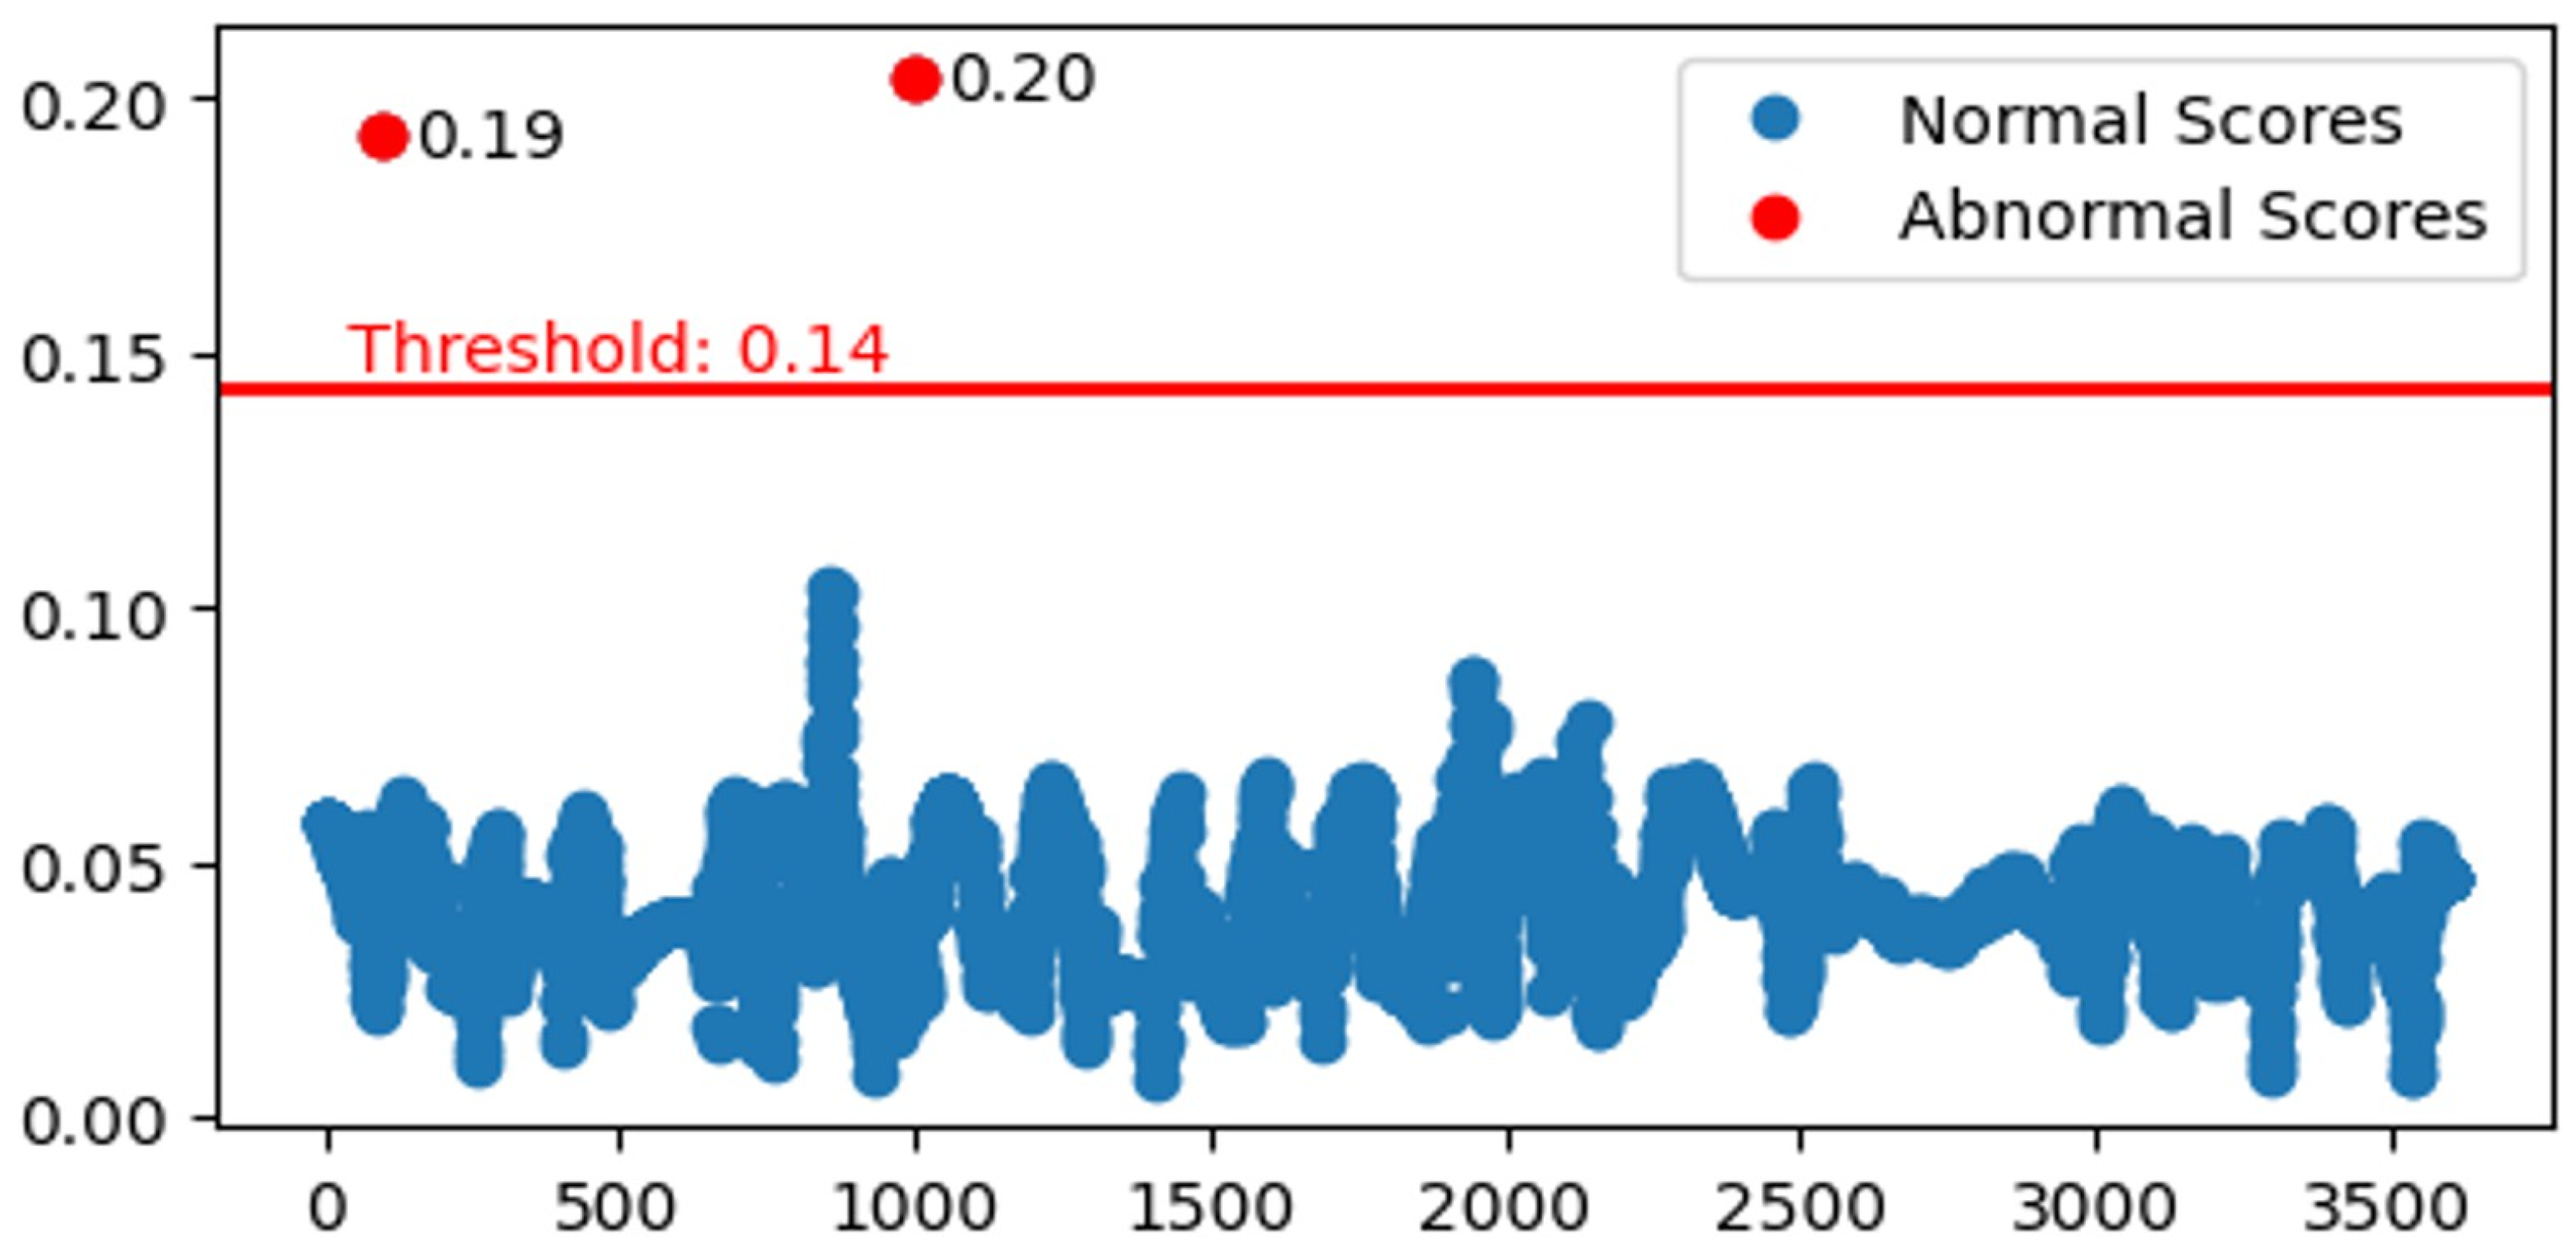
4.2.3. One-Variable Abnormal Behavior
5. Conclusions
Author Contributions
Funding
Data Availability Statement
Conflicts of Interest
References
- Fausto, A.; Gaggero, G.B.; Patrone, F.; Girdinio, P.; Marchese, M. Toward the integration of cyber and physical security monitoring systems for critical infrastructures. Sensors 2021, 21, 6970. [Google Scholar] [CrossRef] [PubMed]
- Wang, Z.; Song, H.; Watkins, D.W.; Ong, K.G.; Xue, P.; Yang, Q.; Shi, X. Cyber-physical systems for water sustainability: Challenges and opportunities. IEEE Commun. Mag. 2015, 53, 216–222. [Google Scholar] [CrossRef]
- Stouffer, K.; Falco, J.; Scarfone, K. Guide to industrial control systems (ICS) security. NIST Spec. Publ. 2011, 800, 16. [Google Scholar]
- Tuptuk, N.; Hailes, S. Security of smart manufacturing systems. J. Manuf. Syst. 2018, 47, 93–106. [Google Scholar] [CrossRef]
- Nachreiner, F.; Nickel, P.; Meyer, I. Human factors in process control systems: The design of human–machine interfaces. Saf. Sci. 2006, 44, 5–26. [Google Scholar] [CrossRef]
- Ralston, P.A.; Graham, J.H.; Hieb, J.L. Cyber security risk assessment for SCADA and DCS networks. ISA Trans. 2007, 46, 583–594. [Google Scholar] [CrossRef] [PubMed]
- de Brito, I.B.; de Sousa, R.T., Jr. Development of an open-source testbed based on the modbus protocol for cybersecurity analysis of nuclear power plants. Appl. Sci. 2022, 12, 7942. [Google Scholar] [CrossRef]
- Evancich, N.; Li, J. Attacks on industrial control systems. In Cyber-Security of SCADA and Other Industrial Control Systems; Springer: Berlin/Heidelberg, Germany, 2016; pp. 95–110. [Google Scholar]
- Jin, M.; Lavaei, J.; Johansson, K.H. Power grid AC-based state estimation: Vulnerability analysis against cyber attacks. IEEE Trans. Autom. Control 2018, 64, 1784–1799. [Google Scholar] [CrossRef]
- Rajkumar, V.S.; Ştefanov, A.; Presekal, A.; Palensky, P.; Torres, J.L.R. Cyber attacks on power grids: Causes and propagation of cascading failures. IEEE Access 2023, 11, 103154–103176. [Google Scholar] [CrossRef]
- Cheminod, M.; Durante, L.; Valenzano, A. Review of security issues in industrial networks. IEEE Trans. Ind. Inform. 2012, 9, 277–293. [Google Scholar] [CrossRef]
- Dzung, D.; Naedele, M.; Von Hoff, T.P.; Crevatin, M. Security for industrial communication systems. Proc. IEEE 2005, 93, 1152–1177. [Google Scholar] [CrossRef]
- Lindsay, J.R. Stuxnet and the limits of cyber warfare. Secur. Stud. 2013, 22, 365–404. [Google Scholar] [CrossRef]
- Hao, W.; Yang, T.; Yang, Q. Hybrid statistical-machine learning for real-time anomaly detection in industrial cyber-physical systems. IEEE Trans. Autom. Sci. Eng. 2021, 20, 32–46. [Google Scholar] [CrossRef]
- Lezzi, M.; Lazoi, M.; Corallo, A. Cybersecurity for Industry 4.0 in the current literature: A reference framework. Comput. Ind. 2018, 103, 97–110. [Google Scholar] [CrossRef]
- Audibert, J.; Michiardi, P.; Guyard, F.; Marti, S.; Zuluaga, M.A. Usad: Unsupervised anomaly detection on multivariate time series. In Proceedings of the 26th ACM SIGKDD International Conference on Knowledge Discovery & Data Mining, Virtual, 6–10 July 2020; pp. 3395–3404. [Google Scholar]
- Zhu, B.; Joseph, A.; Sastry, S. A taxonomy of cyber attacks on SCADA systems. In Proceedings of the 2011 International Conference on Internet of Things and 4th International Conference on Cyber, Physical and Social Computing, Dalian, China, 9–22 October 2011; pp. 380–388. [Google Scholar]
- Kim, B.; Alawami, M.A.; Kim, E.; Oh, S.; Park, J.; Kim, H. A comparative study of time series anomaly detection models for industrial control systems. Sensors 2023, 23, 1310. [Google Scholar] [CrossRef] [PubMed]
- Inoue, J.; Yamagata, Y.; Chen, Y.; Poskitt, C.M.; Sun, J. Anomaly detection for a water treatment system using unsupervised machine learning. In Proceedings of the 2017 IEEE International Conference on Data Mining Workshops (ICDMW), New Orleans, LA, USA, 18–21 November 2017; pp. 1058–1065. [Google Scholar]
- Putchala, M.K. Deep Learning Approach for Intrusion Detection System (ids) in the Internet of Things (iot) Network Using Gated Recurrent Neural Networks (gru). Master’s Thesis, Wright State University, Dayton, OH, USA, 2017. [Google Scholar]
- Du, Y.; Huang, Y.; Wan, G.; He, P. Deep Learning-Based Cyber–Physical Feature Fusion for Anomaly Detection in Industrial Control Systems. Mathematics 2022, 10, 4373. [Google Scholar] [CrossRef]
- Goh, J.; Adepu, S.; Tan, M.; Lee, Z.S. Anomaly detection in cyber-physical systems using recurrent neural networks. In Proceedings of the 2017 IEEE 18th International Symposium on High Assurance Systems Engineering (HASE), Singapore, 12–14 January 2017; pp. 140–145. [Google Scholar]
- Mokhtari, S.; Abbaspour, A.; Yen, K.K.; Sargolzaei, A. A machine learning approach for anomaly detection in industrial control systems based on measurement data. Electronics 2021, 10, 407. [Google Scholar] [CrossRef]
- Catillo, M.; Pecchia, A.; Villano, U. A Deep Learning Method for Lightweight and Cross-Device IoT Botnet Detection. Appl. Sci. 2023, 13, 837. [Google Scholar] [CrossRef]
- Liu, J.; Wang, X.; Xie, F.; Wu, S.; Li, D. Condition monitoring of wind turbines with the implementation of spatio-temporal graph neural network. Eng. Appl. Artif. Intell. 2023, 121, 106000. [Google Scholar] [CrossRef]
- Pang, J.; Pu, X.; Li, C. A hybrid algorithm incorporating vector quantization and one-class support vector machine for industrial anomaly detection. IEEE Trans. Ind. Inform. 2022, 18, 8786–8796. [Google Scholar] [CrossRef]
- Wolsing, K.; Thiemt, L.; Sloun, C.V.; Wagner, E.; Wehrle, K.; Henze, M. Can industrial intrusion detection be simple? In Proceedings of the European Symposium on Research in Computer Security, Copenhagen, Denmark, 26–30 September 2022; pp. 574–594. [Google Scholar]
- Park, H.; Choi, Y.J. Frequency-Based Representation of Massive Alerts and Combination of Indicators by Heterogeneous Intrusion Detection Systems for Anomaly Detection. Sensors 2022, 22, 4417. [Google Scholar] [CrossRef] [PubMed]
- Kim, J.; Shin, J.; Park, K.W.; Seo, J.T. Improving Method of Anomaly Detection Performance for Industrial IoT Environment. Comput. Mater. Contin. 2022, 72, 5377–5394. [Google Scholar] [CrossRef]
- Xue, F.; Yan, W. Multivariate time series anomaly detection with few positive samples. In Proceedings of the 2022 International Joint Conference on Neural Networks (IJCNN), Padua, Italy, 18–23 July 2022; pp. 1–7. [Google Scholar]
- Gaggero, G.B.; Caviglia, R.; Armellin, A.; Rossi, M.; Girdinio, P.; Marchese, M. Detecting cyberattacks on electrical storage systems through neural network based anomaly detection algorithm. Sensors 2022, 22, 3933. [Google Scholar] [CrossRef] [PubMed]
- Shin, H.K.; Lee, W.; Yun, J.H.; Kim, H. HAI 1.0: HIL-Based Augmented ICS Security Dataset. In Proceedings of the 13th USENIX Conference on Cyber Security Experimentation and Test, Berkeley, CA, USA, 10 August 2020; USENIX Association: Berkeley, CA, USA, 2020. [Google Scholar]
- Maseer, Z.K.; Yusof, R.; Bahaman, N.; Mostafa, S.A.; Foozy, C.F.M. Benchmarking of machine learning for anomaly based intrusion detection systems in the CICIDS2017 dataset. IEEE Access 2021, 9, 22351–22370. [Google Scholar] [CrossRef]


| Reference | Proposed | Method | Difference to Our Research |
|---|---|---|---|
| Catillo et al. [24] | CPS-GUARD | Based on a single semi-supervised autoencoder and outlier detection techniques | Focus on detection models based on Attack type |
| Liu et al. [25] | ST-GNN | Dynamic graph modeling approach based on prior knowledge | Focus on anomaly detection after filtering out data noise |
| Pang et al. [26] | VQ-OCSVM | Network intrusion detection based on hybrid algorithms | Focus on improving network intrusion detection rates |
| Wolsing et al. [27] | SIMPLE-IID | Intrusion detection based on four simple IIDs (min-max, gradient, steady-time, and histogram) | Focus on improving industrial intrusion detection rates |
| Park et al. [28] | XGBOOST | Based on alert aggregation intrusion detection system | Focuses on attack detection for this model of IDS by integrating many alerts |
| Kim et al. [29] | LSTM | Correlation-coefficient-clustering-based performance improvement techniques | Focus on improving detection rates in simulated environments |
| Xue et al. [30] | Deep SAD | A joint learning approach that integrates regularity representation learning and normalization from a small number of abnormal samples | Focus on improving intrusion detection performance |
| Gaggero et al. [31] | Neural Network AutoEncoder | Detects cyberattacks on battery electric storage systems (BESSs) in microgrid using neural network-based autoencoders. | Focus on outliers in electrical measurements |
| Timestamp | P1_B2004 | P1_B2016 | P1_B3004 | P1_B3005 | … | P4_ST_TT01 | Attack |
|---|---|---|---|---|---|---|---|
| 11 July 2021 10:00:00 | 0.08771 | 0.88504 | 476.76703 | 1014.79321 | … | 27170 | 0 |
| 11 July 2021 10:00:01 | 0.08771 | 0.88619 | 476.76703 | 1014.79321 | … | 27171 | 0 |
| 11 July 2021 10:00:02 | 0.08771 | 0.88836 | 476.76703 | 1014.79321 | … | 27170 | 0 |
| 11 July 2021 10:00:03 | 0.08771 | 0.89214 | 476.76703 | 1014.79321 | … | 27171 | 0 |
| Cluster_Count | Cluster_Size |
|---|---|
| 0 | 41 |
| 1 | 26 |
| 2 | 9 |
| 3 | 6 |
| 4 | 3 |
| 5 | 1 |
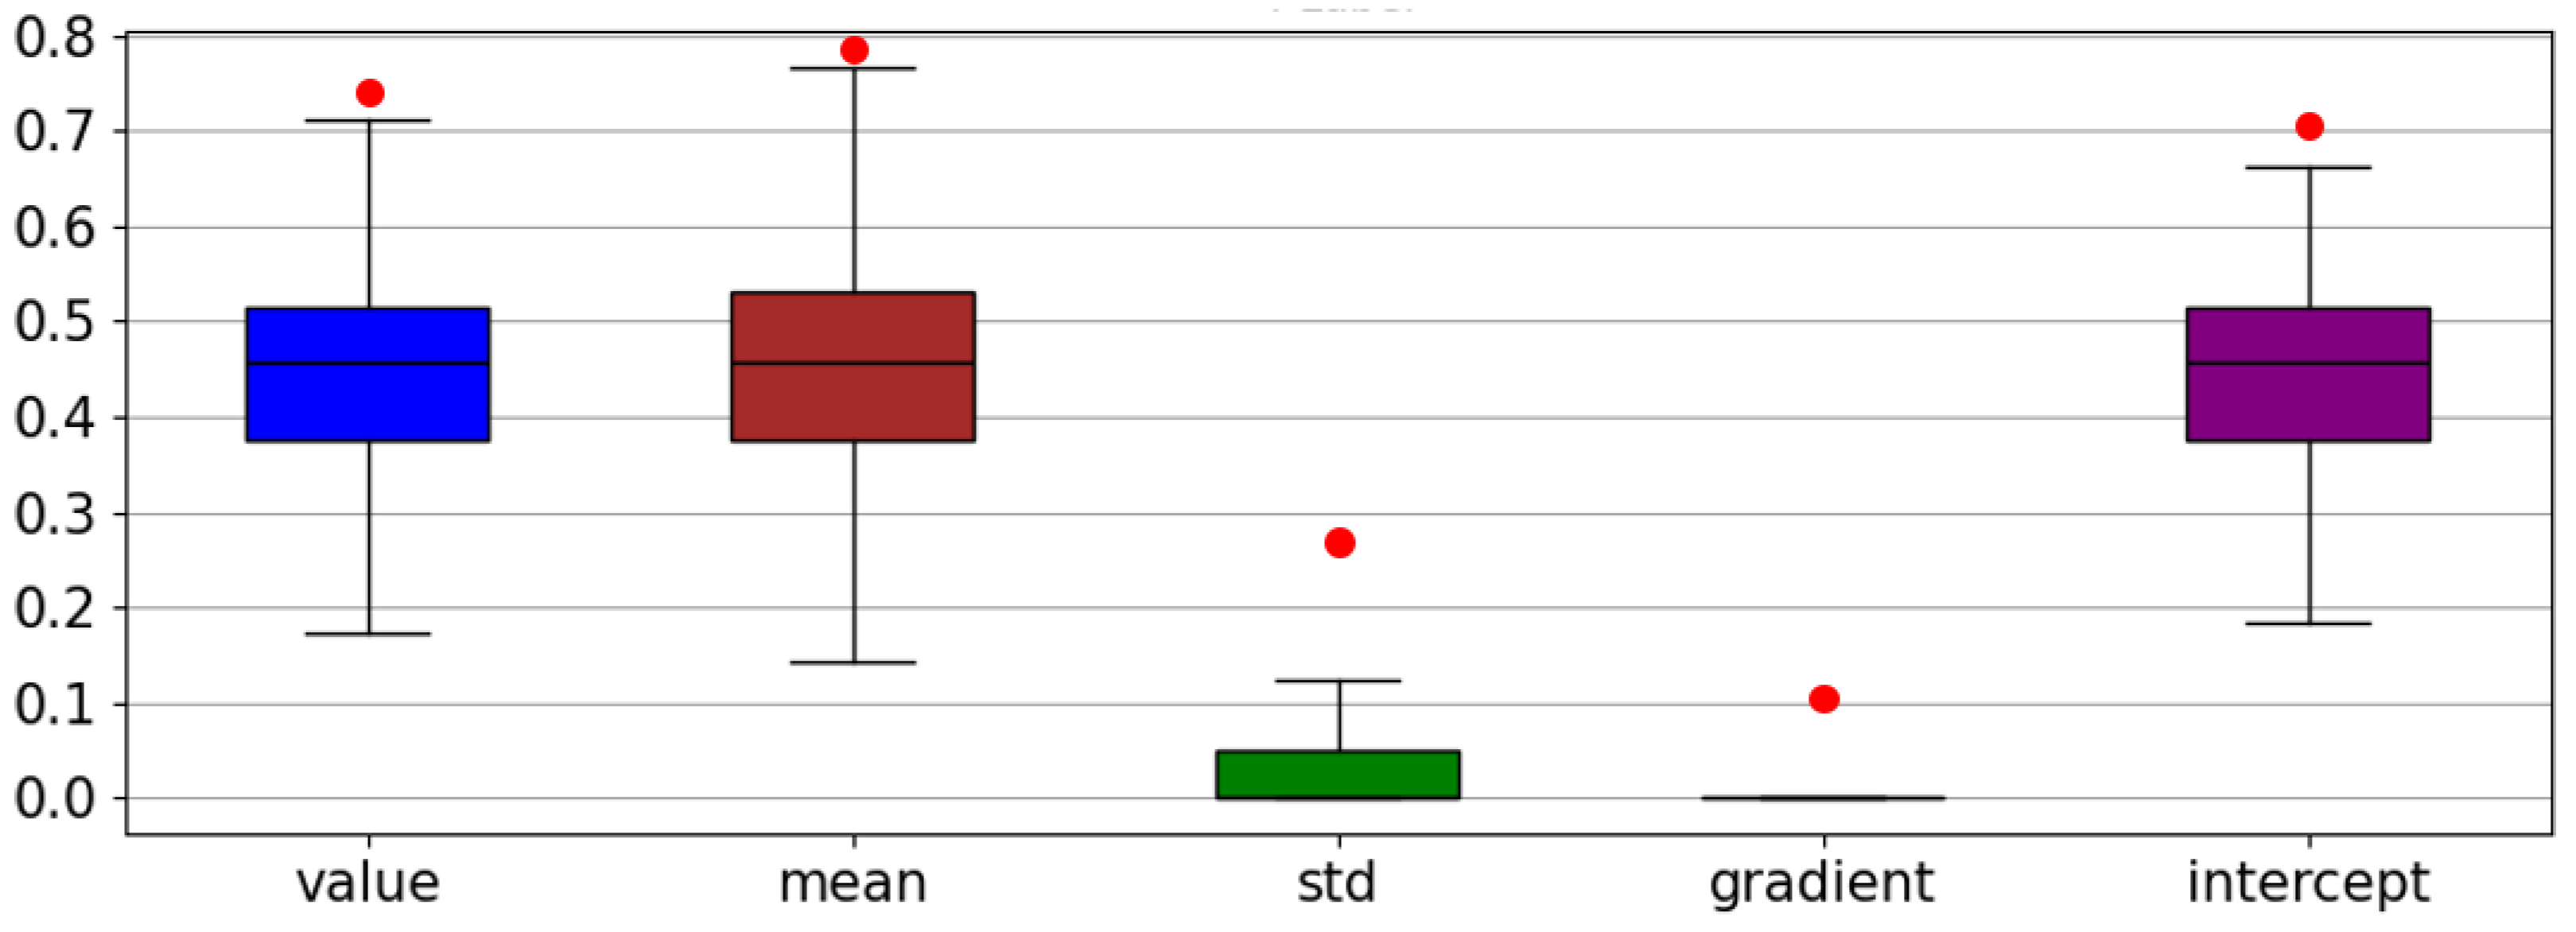
| Value | Mean | Std | Gradient | Intercept | Cluster | |
|---|---|---|---|---|---|---|
| 0 | 0.0299 | 0.0299 | 0.0000 | 0.0000 | 0.0000 | 1 |
| 1 | 0.0282 | 0.0291 | 0.0011 | 0.0000 | 0.0000 | 1 |
| 2 | 0.0293 | 0.0292 | 0.0008 | 0.0000 | 0.0000 | 1 |
| 3 | 0.0317 | 0.0307 | 0.0023 | 0.0000 | 0.0000 | 1 |
| … | … | … | … | … | … | … |
| Tag Name | Timestamp | Value |
|---|---|---|
| P1_B3005 | 11 July 2021 10:19:58 | 7014.7932 |
| P1_B3005 | 11 July 2021 10:19:59 | 10,014.7932 |
| P1_B3005 | 11 July 2021 10:20:00 | 11,014.7932 |
| Tag Name | Timestamp | Value |
|---|---|---|
| P1_B2004 | 11 July 2021 10:01:38 | 5000.08771 |
| P1_B3004 | 11 July 2021 10:16:38 | 5000.36264 |
| Tag Name | Timestamp | Value |
|---|---|---|
| P1_B2004 | 11 July 2021 10:01:38 | 5000.08771 |
Disclaimer/Publisher’s Note: The statements, opinions and data contained in all publications are solely those of the individual author(s) and contributor(s) and not of MDPI and/or the editor(s). MDPI and/or the editor(s) disclaim responsibility for any injury to people or property resulting from any ideas, methods, instructions or products referred to in the content. |
© 2024 by the authors. Licensee MDPI, Basel, Switzerland. This article is an open access article distributed under the terms and conditions of the Creative Commons Attribution (CC BY) license (https://creativecommons.org/licenses/by/4.0/).
Share and Cite
Choi, W.-H.; Kim, J. Unsupervised Learning Approach for Anomaly Detection in Industrial Control Systems. Appl. Syst. Innov. 2024, 7, 18. https://doi.org/10.3390/asi7020018
Choi W-H, Kim J. Unsupervised Learning Approach for Anomaly Detection in Industrial Control Systems. Applied System Innovation. 2024; 7(2):18. https://doi.org/10.3390/asi7020018
Chicago/Turabian StyleChoi, Woo-Hyun, and Jongwon Kim. 2024. "Unsupervised Learning Approach for Anomaly Detection in Industrial Control Systems" Applied System Innovation 7, no. 2: 18. https://doi.org/10.3390/asi7020018