Article

Increasing the Efficiency of Emulsion Crystallization in Stirred Vessels by Targeted Application of Shear and Surfactant

Institute for Thermal Process Engineering, Karlsruhe Institute of Technology, 76131 Karlsruhe, Germany
*
Author to whom correspondence should be addressed.
Colloids Interfaces 2023, 7(4), 68; https://doi.org/10.3390/colloids7040068
Submission received: 15 October 2023 / Revised: 15 November 2023 / Accepted: 28 November 2023 / Published: 30 November 2023
(This article belongs to the Special Issue Recent Advances on Emulsions and Applications: Volume II)

Abstract

:
Emulsions containing crystalline dispersed phases hold significant importance in pharmaceutical, chemical, and life science industries. The industrial agitation and storage of these emulsions can prompt crystallization effects within the flow field, intersecting with the primary nucleation mechanisms. Notably, contact-mediated nucleation, in which subcooled droplets crystallize upon contact with a crystalline particle, and shear-induced crystallization due to droplet deformation, are both conceivable phenomena. This study delves into the crystallization processes of emulsions in a 1 L stirred vessel, integrating an ultrasonic probe to monitor droplet crystallization progression. By scrutinizing the influence of the flow field and of the emulsifiers stabilizing the droplets, our investigation unveils the direct impact of enhanced rotational speed on accelerating the crystallization rate, correlating with increased energy input. Furthermore, the concentration of emulsifiers is observed to positively affect the crystallization process. Significantly, this pioneering investigation marks the first evaluation of emulsion crystallization considering the overlapping nucleation mechanisms seen in industrial production of melt emulsions. The findings offer valuable insights for more systematic control strategies in emulsion crystallization processes, promising more efficient and sustainable industrial practices by enabling targeted application of shear and surfactants.

Graphical Abstract

1. Introduction

Emulsions are commonly used in the cosmetic, pharmaceutical, petroleum, and textile industries, as well as in metal processing, soil remediation, and in washing and cleaning processes; for an overview see [1,2]. This wide use shows the need to understand the processes occurring in emulsions, such as the crystallization of the dispersed phase, not only during production and storage but during formulation. The latter emulsions are referred to as melt emulsions, and are commonly produced through the so-called melt emulsification process [3]. The dispersed phase of an oil-in-water emulsion consists of liquid oil or wax, and is finely dispersed as droplets in the continuous aqueous phase. Emulsions are thermodynamically unstable and tend to segregate due to the comparatively high positive free energy (interfacial tension) of the droplet interface. Processes that lead to phase separation include creaming, aggregation, phase inversion, coalescence, and Ostwald ripening; see for example [4,5]. The addition of emulsifiers is necessary to increase the stability of the emulsions. After the addition of an emulsifier to the continuous aqueous phase of an emulsion, the emulsifier molecules diffuse to the interfaces available (air-water and oil-water) and adsorb there. The additional added surfactant monomers form associates (micelles) at a surfactant concentration above the critical micelle concentration ( c m c ) [6].
The droplets of a stable emulsion start to crystallize when subcooled below their melting point. The material of the dispersed phase shows altered crystallization behavior compared to the bulk phase of the same material. In the bulk phase, primary heterogeneous nucleation takes place predominantly due to catalytically acting impurities (active nucleation centers, ANCs). These impurities are distributed in an emulsion to isolated volumes, leading to droplets with and without ACNs [7]. As a result, primary homogeneous nucleation dominates the crystallization process [8], which takes place at significantly lower temperatures than bulk phase nucleation.
Additionally, secondary nucleation mechanisms must be taken into account in non-quiescent, stirred melt emulsions, as the emulsion is exposed to shear (shear-induced nucleation) and because liquid and crystallized droplets (particles) exist side by side and may contact each other (contact-mediated nucleation, CMN). These secondary nucleation mechanisms take place at lower subcooling than primary nucleation mechanisms due to their lower energy barrier. They are desirable in industrial applications because less energy and time must be expended [9].
It is important that all droplets are crystallized at the end of the production step in order to finally achieve a stable suspension. This minimizes undesired effects during storage, such as (partial) coalescence, which would ultimately lead to the loss of applicability of the product.
Contact-mediated nucleation is a mechanism that can occur in stirred emulsions when a subcooled liquid droplet comes into contact with a particle. This mechanism is used to explain the distinct acceleration of nucleation through stirring, which was observed by Dickinson et al. [10]. Hindle et al. [11] noted an acceleration of the crystallization of seeded cocoa butter emulsions with increasing stirrer speed based on the increase of the kinetic constant k CMN , finding that the kinetic constant of an emulsion stirred at a stirrer speed of 250 min−1 exceeded the kinetic constant of a quiescent emulsion. On the contrary, Vanapalli and Coupland [12] could not find a correlation between the nucleation rate and the shear rate. They studied emulsions of n-hexadecane in water seeded with particles in a concentric rheometer with an integrated ultrasonic measurement technique at a shear rate of γ ˙ = 0 200   s 1 . Studies by Abramov et al. [13] using a rheometer showed no accelerating effect of shear on the crystallization. Instead, complete inhibition of the crystallization of n-hexadecane droplets was observed at an applied shear rate of γ ˙ 1250 s 1 . We studied the crystallization of sheared n-hexadecane emulsions in a Taylor–Couette reactor using rheo-nuclear magnetic resonance (NMR) measurement techniques in a previous work, and observed a maximum of the kinetic constant k CMN at γ ˙ = 150   s 1 [14].
Shear-induced nucleation and CMN occur simultaneously, and contribute differently to nucleation progress depending on the process parameters [9]. The mechanism of shear-induced nucleation is derived from the field of polymer crystallization. During the crystallization of polymer melts, shearing results in the regular arrangement of monomer chains, which favors crystallization in preferential morphology [15,16]. This mechanism has been suggested by Yang et al. [17] as a possible explanation for the acceleration of the crystallization of castor oil droplets observed. In addition, Wang et al. [18] described a promoting effect of shear on the nucleation rate of waxy crude oil emulsion gels.
Additionally, the concentration of the emulsifier has an influence on the CMN. When a particle and a subcooled liquid droplet are targeted for collision in a microchannel, the presence of emulsifier micelles in the continuous phase hinders the CMN. We proved previously that steric inhibition of the droplet approach occurs due to the micelles, which are highly spatially restricted in the microchannel [19,20]. By contrast, McClements et al. [21] observed an acceleration of nucleation with increasing emulsifier concentration. This was confirmed by Dickinson et al. [10] in their experiments on n-hexadecane emulsions with different emulsifiers. They used a few milliliters of emulsion in cuvettes and ultrasonic measurement technology to determine the solid content of the droplets. There was no steric hindrance by the micelles and droplet movement in the emulsions. Regardless of the chemical nature of the emulsifier, the presence of seed crystals/particles provided a significant increase in the nucleation rate. Regarding scalability, to the best of our knowledge, no studies of the crystallization kinetics have yet been performed on larger emulsion volumes in stirred vessels.
Therefore, the primary objective of this study is to explore the potential for enhancing efficiency in the crystallization of melt emulsions within a stirred vessel. Specifically, this research aims to investigate the impact of increased energy input on the crystallization process, hypothesizing faster crystallization by modulating shear and surfactant concentration. This innovative exploration marks the first evaluation of emulsion crystallization considering the overlapping nucleation mechanisms observed in industrial melt emulsion production. The results obtained herein offer significant insights, empowering more targeted application of shear and surfactants in industrial processes. This strategic approach holds promise for more sustainable practices, facilitating a reduction in both power consumption and process time.

2. Materials and Methods

Regarding our experiments, an n-hexadecane-in-water emulsion was used, with 5 wt% n-hexadecane (Hexadecane ReagentPlus®, Sigma-Aldrich, St. Louis, MO, USA; purity: 99%) as the dispersed phase and varying concentrations of Tween®20 (TW20, Sigma-Aldrich, St. Louis, MO, USA) as the surfactant. The continuous phase was water (OmniaTap, stakpure GmbH, Niederahr, Germany; electrical conductivity: 0.057 μ S cm−1). A premix of the continuous phase and the surfactant was prepared using a magnetic stirrer (RCT basic, IKA Werke, Staufen im Breisgau, Germany) at 700 rpm (vessel volume V vessel = 1 L) and room temperature for 1 min. Subsequently, n-hexadecane was added. One of the two emulsions used was prepared with a gear-rim dispersing machine (IKA® T25 digital, ULTRA-TURRAX®, Staufen im Breisgau, Germany) at 20,000 rpm (13.3 m s−1 tangential speed) for 5 min at room temperature (Emulsion I). The other emulsion was prepared using an inclined blade stirrer (four blades, stirrer diameter 59 mm) at 2000 rpm (6.18 m s−1 tangential speed) for 10 min at room temperature (Emulsion II).
The droplet size distribution (DSD) of the emulsions (Figure 1a) was determined using a Mastersizer 3000e (Malvern Panalytical, Malvern, UK). A reflection index of 1.433 and an adsorption index of 0.05 was set for the measurements. The spherical form of the droplets was confirmed by microscopic examinations (digital microscope VHX-7000, Keyence, Osaka, Japan) (Figure 1b).
The melting point of the emulsified oil phase (n-hexadecane) was evaluated using differential scanning calorimetry (DSC) measurements (DSC 204 cell, Netsch, Selb, Germany) with a cooling and heating rate of 2 K min−1. The peak maximum was used to estimate the melting temperature of n-hexadecane and was found to be ϑ m = 18.6 K ± 0.2 K for all emulsions.
The double-jacketed stirred vessel used for the crystallization experiments was a laboratory stirred vessel made of borosilicate glass (HWS Labortechnik, Mainz, Germany) with a capacity of V vessel = 1 L. The plastic lid had recesses for the four baffles, the four temperature probes, the ultrasonic probe with a reflector plate, and the stirrer. The stirrer (Hei-TORQUE Expert 100, Heidolph Instruments GmbH & CO. KG, Schwabach, Germany) was equipped with a six-blade disk stirrer (Rusthon turbine) and allowed a stirring speed of 10 to 2000 min−1.
The temperature of the stirred vessel was recorded by four temperature probes (Pt100, ES Electronic Sensor GmbH, Heilbronn, Germany) positioned at different immersion depths at intervals of 10 s (software: DAQami, Version 4.2.1 Measurement Computing GmbH, Bietigheim-Bissingen, Germany). The stirred vessel was thermostated by a 35% ethylene glycol–water mixture. Two thermostats (Lauda Eco RE 1050 G (temperature constancy of ±0.02 K) and Lauda Eco E 10, Lauda, Lauda-Königshofen, Germany) were used to control the temperature of the mixture to guarantee fast cooling rates.
The dimensions of the stirred vessel, the stirring element, and the specifications according to DIN 28131 [22] are listed in Table 1.
The stirred vessel met all the requirements of the DIN standard [22] except for the distance between the tank bottom and the stirring element and the integration of the temperature sensors and ultrasonic probe. The stirred tank was insulated with ArmaFlex (Armacell GmbH, Münster, Germany) insulation on the shell and bottom sides.
All experiments in the stirred vessel started well above the melting point temperature of n-hexadecane at a temperature of 23 °C. The emulsion was cooled to a constant subcooling with a cooling rate of 1 K min−1. As soon as the temperature within the vessel was stable, the progress of the droplet crystallization was tracked. The subcooling at which the experiments took place was varied.
The degree of the crystallization of the emulsion was measured as follows: an ultrasonic transducer was used to determine the speed of sound v. The latter propagates at different speeds depending on the medium, which is why the determination of the solid fraction of the n-hexadecane droplets in the emulsion is possible with the aid of Urick’s equation (Equation (1)). Further information and the derivation of Urick’s equation can be found in [23,24]. In addition, it needs to be considered that the speed of sound is depends on the temperature T. The degree of crystallization in the dispersed phase is quantified by the solid fraction ξ , which represents the ratio of the number of solid particles n s to the total number of particles and droplets n l .
ξ ( t , T ) = n s ( t ) n s ( t ) + n l ( t ) = v 2 ( T ) v l 2 ( T ) v s 2 ( T ) v l 2 ( T ) .
Here, v l describes the speed of sound in the emulsion with a fully liquid dispersed phase and v s describes that in a suspension with only solid particles as the dispersed phase.
The calculation of v is based on the transit time t * required by the ultrasound signal to travel the defined distance s between a reflector plate and the probe (Equation (2)).
v = 2 · s t * .
An ultrasonic GS200 echoscope (GAMPT mbH, Merseburg, Germany) was used to determine the speed of sound. The connected ultrasonic probe was used as both the receiver and transmitter of the ultrasonic signals. This probe, with a frequency of 2 MHz, has a high axial resolving power and low attenuation. It was positioned at the height of the disk stirrer to avoid deposition of solid droplets on the probe due to dead zones in the flow. The emitted signal was reflected by an aluminum plate (20 × 20 × 3 mm) which was positioned at a distance of s = 20 mm from the probe. The emitted and received signals were amplified by 5 dB using the echoscope to compensate for the propagation losses of the sound signal. The recording of the measurement signals of the echoscope was accomplished with the help of a Matlab script (Version 2021b, MathWorks, Inc., Natick, MA, USA) used to determines the sound velocity at intervals of 10 s.
Equation (1) is applicable if there is no scattering of the sound signal at the phase boundary. The wavelength of the ultrasonic signal is 690–728 μ m, and is much larger than the diameters of the droplets of the two emulsions; thus, scattering can be excluded. The ultrasonic signal, emitted at 10 s intervals, passes through the volume element of the emulsion, which is located between the probe and the reflector plate at the time of measurement. The radial flow of the emulsion varies the number of droplets located between the probe and the reflector plate, meaning that the remaining volume of the emulsion is represented differently. Consequently, the measured sound velocities differ slightly despite the same content of solids, which means that the calculated content of solids is subject to fluctuations. The following graphs of the content of solids were calculated using Origin software (OriginPro 2021b, OriginLab Corp., Northampton, MA, USA) and smoothed using the moving average method over 15 data points.
Hysteresis curves were recorded and the temperature dependency was determined by fitting an exponential decay model to the experimental data (Figure 2, Equation (3)).
v s / l = A s / l · e x p ϑ ¯ b s / l + v s / l , 0 .
Here, ϑ ¯ denotes the mean temperature within the vessel. To calculate ϑ ¯ , the temperatures recorded by the four sensors were averaged. The parameters A s , l and b s , l pertain to the exponential decay model, while v s / l , 0 represents the initial speed of sound for a fully solid or liquid dispersed phase at the onset of the fitting process, serving as the offset.

3. Results

3.1. Melting Temperature

The melting temperature of the dispersed phase of an n-hexadecane-in-water emulsion ϑ m , h e x was determined using DSC measurements as ϑ m , h e x = 18.6 ± 0.2 °C. This value corresponds to the melting temperature of the pure bulk phase [25]. We found that the melting and crystallization temperature of the emulsion with the smaller droplets (Emulsion I) is the same as that of Emulsion II. It does not depend on the thermal history or the emulsifier quantity. This conclusion was reached by McClements and Dungan [26], who concluded that in the case of an unstirred emulsion, the free emulsifier quantity in the aqueous phase has no influence on the nucleation temperature.
As the properties of Emulsion I remained constant during the crystallization process, the same emulsion was used for several crystallization experiments. Coalescence was noticed for Emulsion II during the melting process in the DSC as well as during the DSD measurements (compare Figure 1); therefore, a fresh emulsion was used for each crystallization experiment.

3.2. Models for Describing Droplet Crystallization in Stirred Emulsions

To the best of our knowledge, no models have yet been developed to describe the crystallization of emulsions in a stirred vessel. Such a model is needed to describe the overlapping effects of primary nucleation, shear-induced nucleation, and CMN.
A first model of the time-dependent solid fraction d ξ d t of subcooled liquids was established by Turnbull [27,28,29]. Dickinson along with McClements and coworkers proved the general application of this model for describing d ξ d t for oil-in-water emulsions [10,30,31,32,33,34]. The nucleation rate J prim in emulsions for primary nucleation at a constant subcooling can be estimated by modelling d ξ d t . New nuclei are formed exclusively in liquid droplets; therefore, J prim is proportional to the fraction of remaining liquid droplets ( 1 ξ ) and decreases as the crystallization time progresses:
d ξ d t = k prim · ( 1 ξ ) .
The kinetic constant for primary nucleation k prim can be expressed as a function of J prim [11]. If homogeneous nucleation takes place inside the volume of the droplet, k prim is proportional to the droplet volume V d and is provided by
k prim = J prim · V d = J prim · x 3 · π 6 ,
where x hereby represents the droplet diameter.
Solving the differential Equation (4) with the assumption that at time t 0 = 0 there are no solid droplets present ( ξ ( t 0 ) = 0 ) leads to
ξ ( t ) = 1 exp ( k prim · t ) .
This model is referred to as the 1Exp-model. It does not consider the DSD.
The nucleation volume is not constant, and each droplet size class exhibits a changing nucleation rate due to the different induction times; therefore, the DSD must be considered as well [35]:
ξ ( t ) = 1 0 q 3 , 0 ( x ) · exp ( k prim · t ) d x
where q 3 , 0 ( x ) is the volumetric density distribution of the droplet diameter at the beginning of crystallization. Large droplets crystallize at lower subcooling than small droplets; therefore, the density distribution of the liquid droplets changes as crystallization progresses. This temporal change of the density distribution is described by
ξ ( t ) = 1 0 1 ξ ( t 0 ) · q 3 , t , 0 ( x ) exp J prim V d ( x ) ( t t 0 ) d x .
The crystallization of emulsions due to acceleration by means of the number of catalytic impurities N imp can be described by [11]:
ξ ( t ) = ξ m · J prim , 0 · V d · t 1 + J prim , 0 · V d · t
with
ξ m = 1 exp ( V d · N imp ) .
Here, J prim , 0 refers to the initial nucleation rate.
Contrary to the primary nucleation kinetics, CMN can be described by [32]
ξ t = k CMN · ξ · ( 1 ξ ) .
Here, k CMN represents the kinetic constant for CMN, in analogy to k prim .
None of the presented models have been able to describe ξ ( t ) for stirred vessel crystallization with satisfactory accuracy ( R 2 > 0.85) for all subcoolings tested.
Assuming a superposition of primary and secondary nucleation mechanisms, a model with a time-dependent nucleation rate J 3 Exp would be required for the description of ξ ( t ) . Therefore, we chose a statistical approach and modified Equation (6) (1Exp model) for this purpose as follows, based on the Weibull probability density function:
ξ ( t ) = 1 ( 1 ξ 0 ) exp k 3 Exp , 0 α ( t t 0 ) α .
In the following, this approach is referred to as the 3Exp-model. The first fitting parameter α (sometimes called the shape parameter) describes the temporal change of the nucleation rate. A nucleation rate decreasing over time is expressed by α < 1 and a nucleation rate increasing over time by α > 1 . For α = 1 , the 3Exp-model equals the 1Exp-model with a constant nucleation rate [36]. The second fitting parameter, k 3 Exp , 0 , is the kinetic constant for the emulsion crystallization in the stirred vessel at time t = 0 , and is referred to as the scale parameter of the Weibull distribution. The third parameter, ξ 0 , denotes the solid fraction of the dispersed phase at t = 0 . The time-dependent nucleation rate is calculated using
J 3 Exp ( t ) = J 3 Exp , 0 · t α 1 .
Equation (12) is valid under the condition that the emulsion droplets have the same droplet size. If the droplet size is distributed, this is calculated analogously to Equation (8) via
ξ ( t ) = 1 0 1 ξ ( t 0 ) · q 3 , t , 0 ( x ) exp J 3 Exp ( t ) V d ( x ) α ( t t 0 ) α d x .
The 3Exp model is applied to characterize the progressive increase in solid fraction within the emulsion droplets during their crystallization within the stirred vessel. Specifically, we emphasize two distinct nucleation rates. First, J 3 Exp , 0 represents the initial nucleation rate. This rate assumes the absence of CMN due to the unavailability of solid particles that could induce nucleation. Thus, J 3 Exp , 0 is solely influenced by either primary or shear-induced nucleation. Second, J 3 Exp , 5000 denotes the nucleation rate at 5000 s after reaching a constant subcooling state. Here, we anticipate that CMN will predominantly influence the nucleation process. A comprehensive discussion elaborating on this aspect is provided in the subsequent data evaluation.
For the evaluation of the CMN, the following needs to be taken into account. A collision between a particle and a liquid droplet must happen for the the CMN to occur; however, a successful inoculation process must occur as well [11]. Because the CMN does not take place every time a particle collides with a liquid droplet, the inoculation efficiency is defined, which is derived from coalescence theory according to [37]. The inoculation efficiency is influenced by three factors: the collision rate h coll , the contact force F coll , and the contact time t coll .
h coll depends on the volume-based number of liquid and solid droplets n l and n s :
h coll ( x s , x l ) = n s n l β l , s
The volume-based number of solid droplets n s is calculated with
n s = ξ π 6 x s 3
and the number of liquid droplets with
n l = 1 ξ π 6 x l 3 .
The collision kernel β l , s is calculated regarding the flow regime (laminar, turbulent, or transient). The equations used to calculate the collision kernel include the respective droplet sizes of the particles x s and droplets x l ; therefore, the collision rate depends on the droplet size.
The collision kernel of a laminar flow is defined as
β lam , l , s = 4 3 γ ˙ mean x l 2 + x s 2 3
and the collision kernel of a turbulent flow as
β turb , l , s = 1.3 ε ν x l 2 + x s 2 3 .
We suggested earlier that the fraction of collisions that trigger secondary nucleation can be described by the nucleation efficiency λ CMN and the kinetic constant k CMN [38]:
λ CMN = k CMN β l , s · ( n s + n l ) .
According to the coalescence theory [37], the rate of secondary nucleation J CMN can be determined by multiplying the nucleation efficiency by the collision rate [39]:
J CMN = λ CMN · h coll .

3.3. Impact of Surfactant Concentration

Crystallization tests were carried out for both emulsions with different subcooling at variable emulsifier concentrations. d ξ d t 
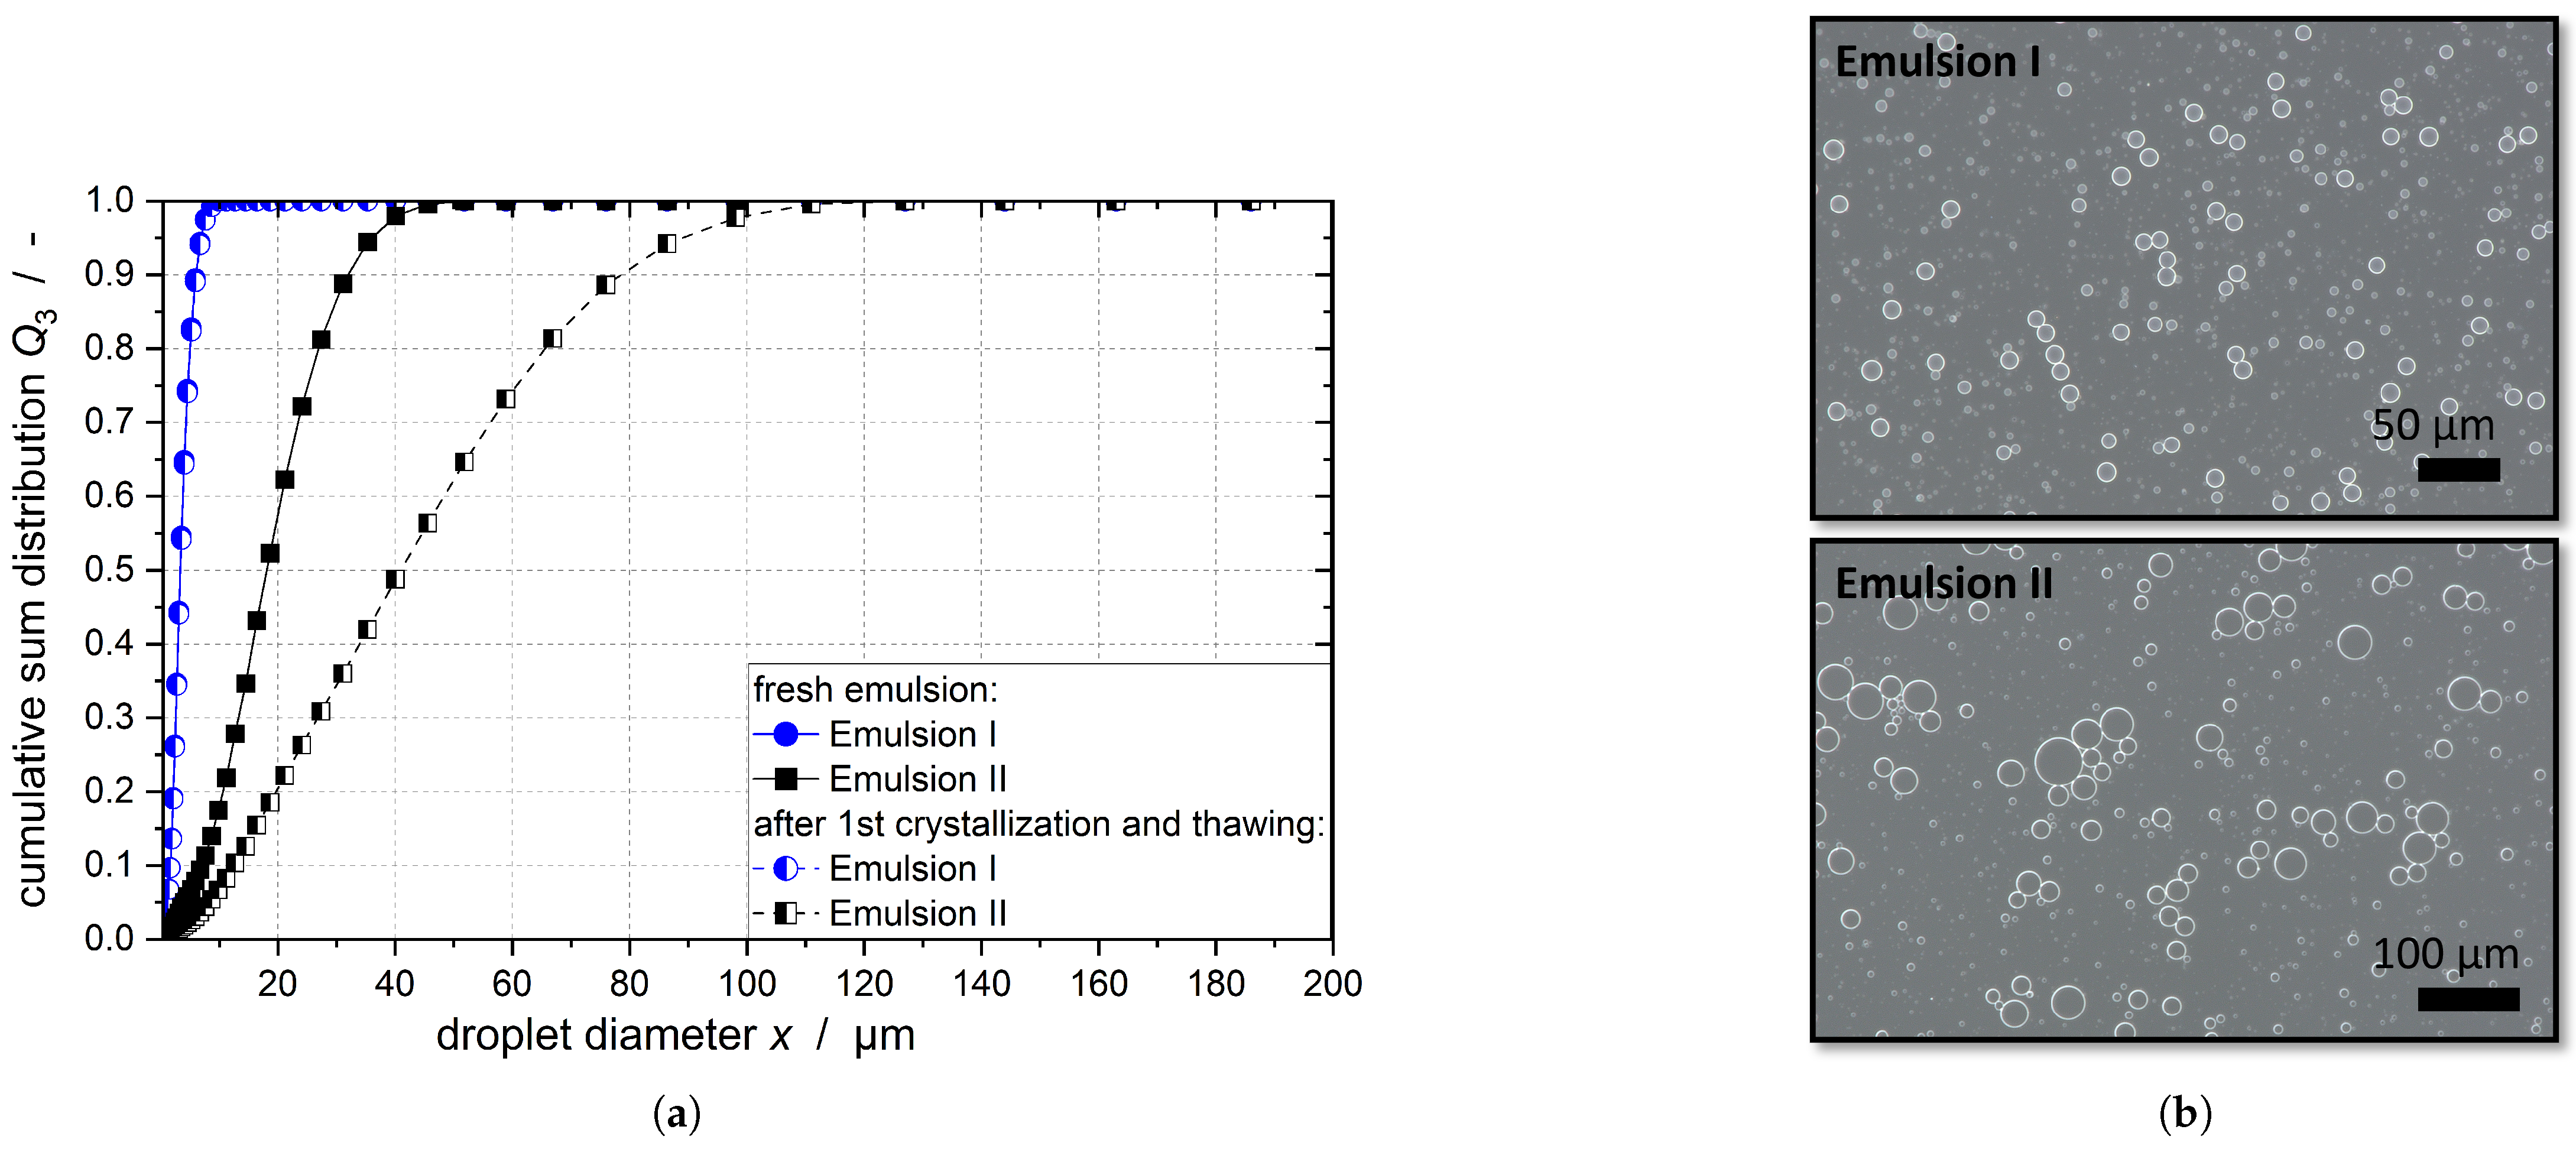
was recorded using an ultrasonic sensor, and the solid fraction was calculated according to Urick [23] (Equation (1)).
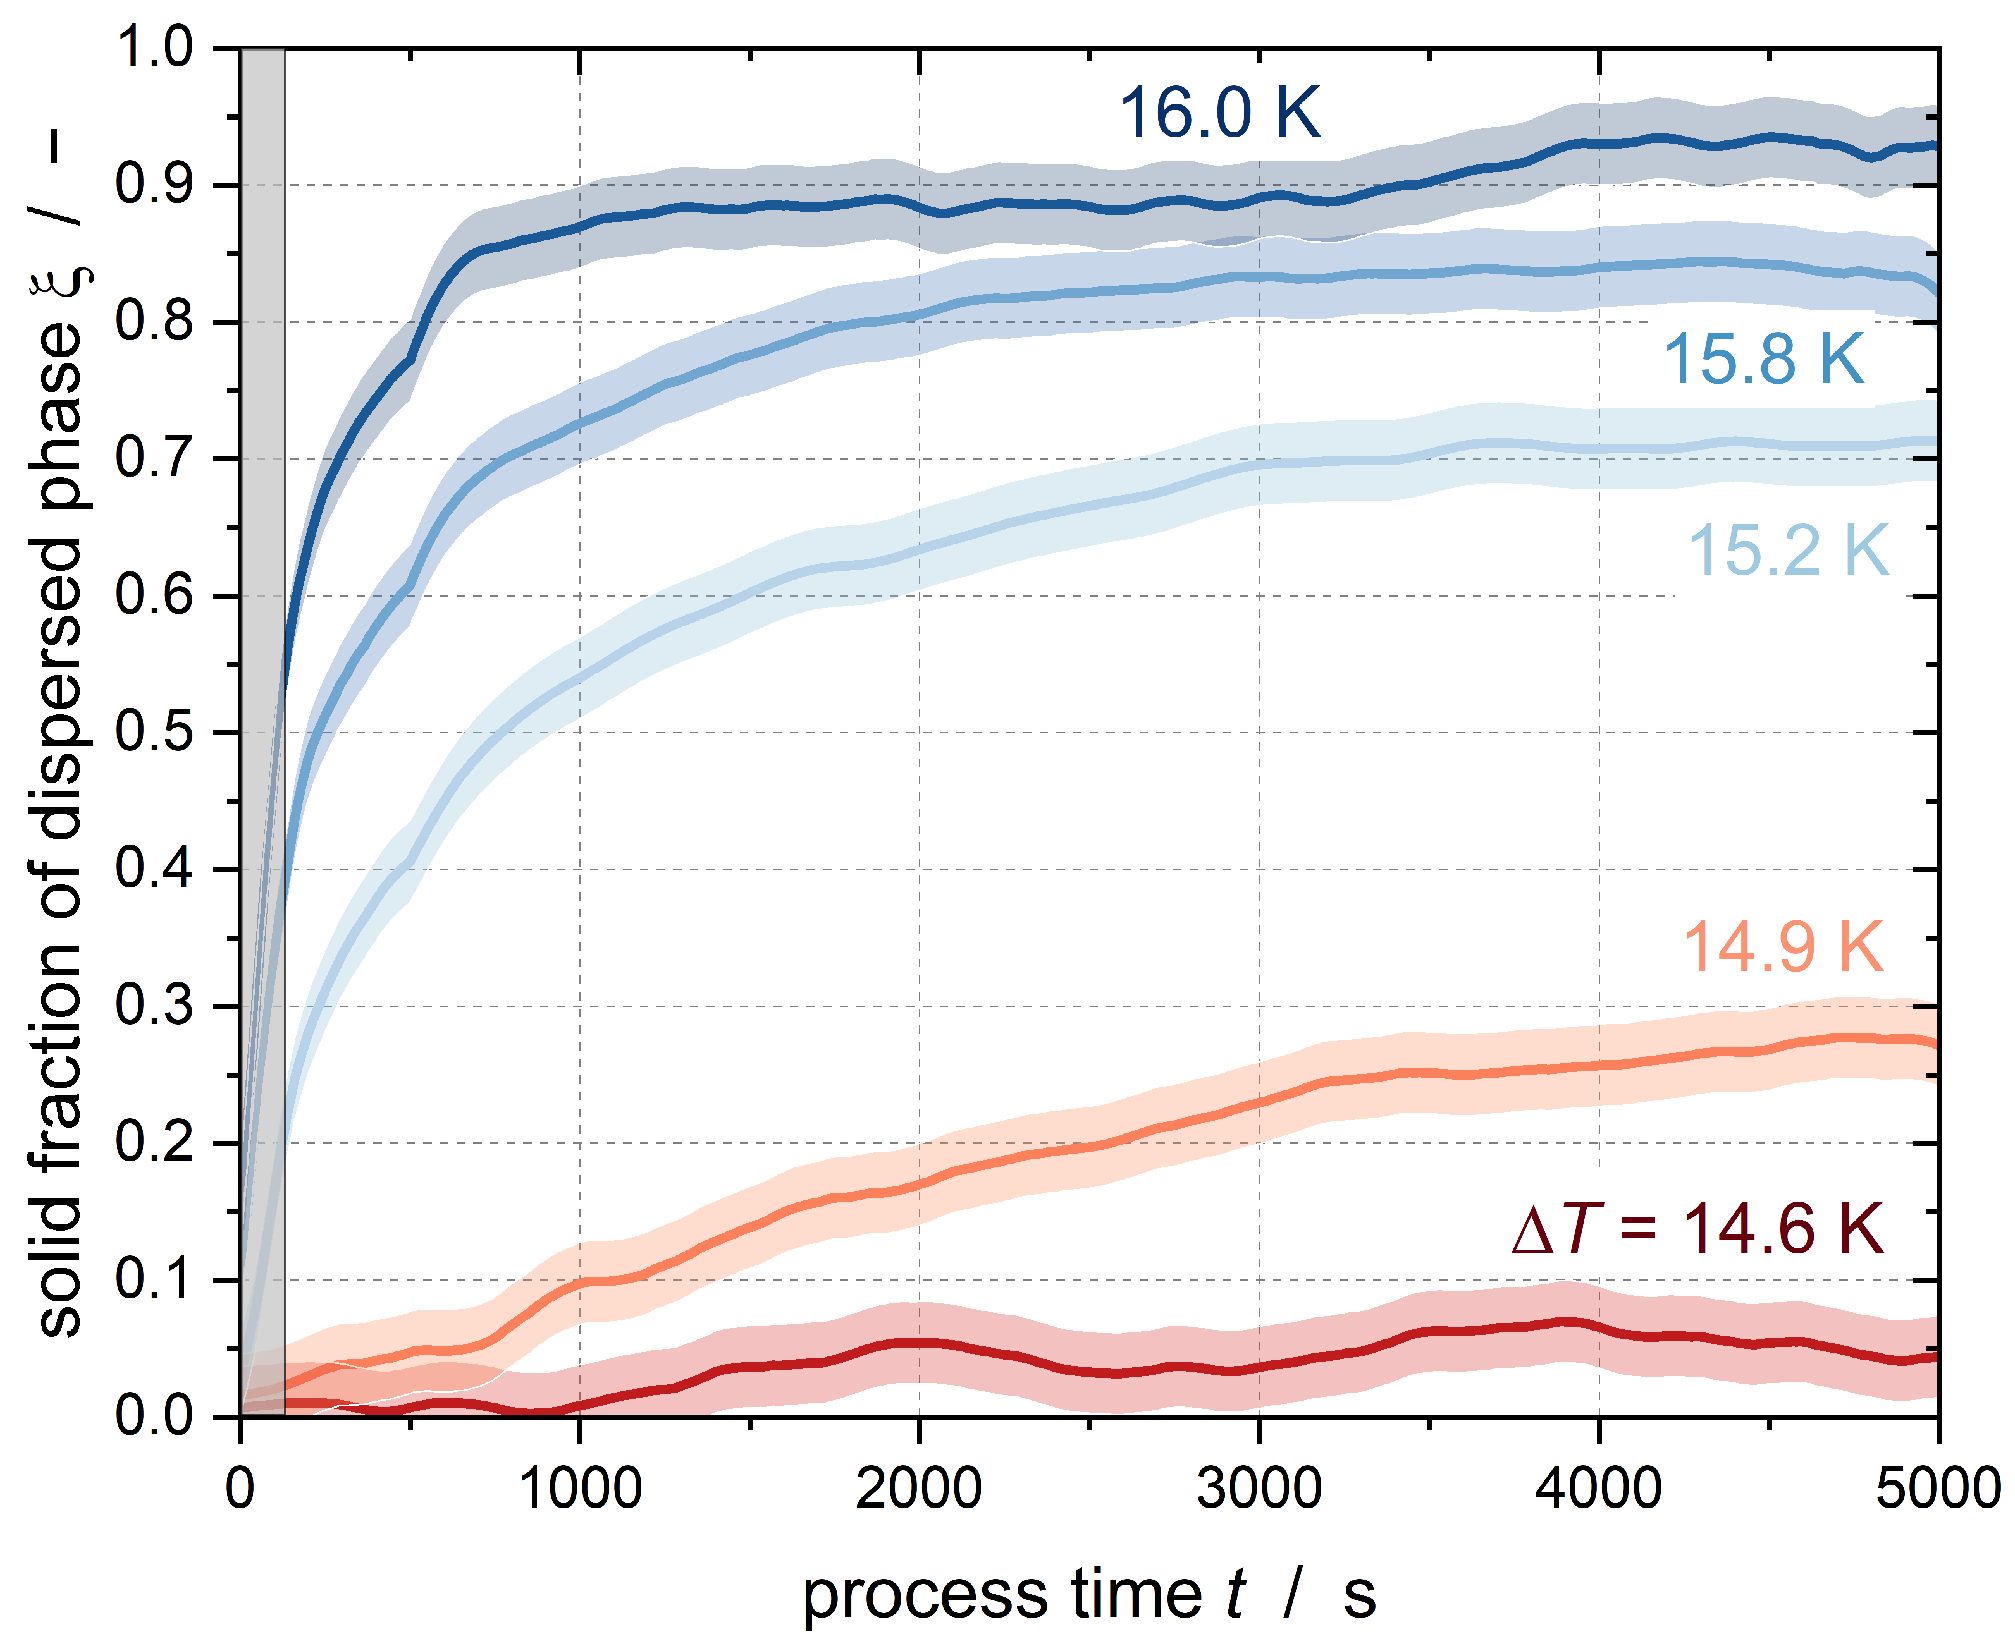
Figure 3 shows the results of the crystallization experiments with Emulsion I at N = 350 min −1 (equaling a mean energy dissipation ε ¯ of 0.37 W kg−1) for c ˜ TW 20 = 16 mol m−3. The gray area represents the time at which a constant temperature had not yet been fully established. The error intervals of the results shown in this publication are the result of three repeated tests of two subcoolings per emulsion. The variations were then applied to all other subcoolings. The 95% confidence interval for the solid fraction of the n-hexadecane droplets was calculated as ±0.03 for Emulsion I and ±0.05 for Emulsion II.
Figure 3 shows different curve shapes. In the case of high subcooling, there is a sharp increase in the solid content in the stirred tank immediately after reaching constant subcooling. This abrupt increase is due to heterogeneous or homogeneous nucleation in the large droplets of the emulsion. Primary homogeneous nucleation is typically observed in the initial phase of a crystallization process without seed crystals, and decreases after the formation of sufficient crystals [9]. Droplets with a larger volume have a higher probability of primary nucleation than small droplets. This is because the induction time for primary nucleation is reduced due to a higher probability of the formation of growable clusters in a larger volume [29]. Therefore, the large droplets already crystallize due to homogeneous nucleation, whereas no stable clusters can be formed in the small droplets and the subcooled droplets do not change their aggregation state.
The slope of the curve decreases after the fast increase at t → 0, although the fraction of solids continues to increase in the course of further measurement. This slower increase is due to secondary nucleation. The collision of the already solidified droplets with the still-liquid subcooled droplets results in CMN, meaning that some droplets crystallize that may not crystallize by pure homogeneous nucleation at the given subcooling. Moreover, the efficiency of the CMN reaches a maximum when there are equal numbers of liquid and solid droplets, i.e., a solid fraction of ξ = 0.5 is reached. As the solid fraction continues to increase, the efficiency decreases because the probability of a liquid droplet colliding with a particle is reduced. In addition, the nucleation triggered by the shear of the droplets in the flow field is another nucleation-triggering mechanism. A statement about the occurrence of shear-induced nucleation cannot be made based on tests at an identical stirrer speed (and identical shear rate). If homogeneous nucleation does not occur at the beginning of the process time due to insufficient subcooling, there is no discernible jump in the course of the solids content; instead, crystalline nuclei are formed in the emulsion droplets by heterogeneous or shear-induced nucleation, which can be seen from the constant slow increase in the solids content. As soon as particles are present, CMN takes place.
Although a constant subcooling was set for approximately 90 min, none of the curves shown here reached a solid content of ξ = 1, i.e., not all droplets were crystalline. One possible reason for this is that the experimental period was too short. Hindle et al. [11] achieved complete crystallization of stirred n-hexadecane emulsions only after an experimental period of 16 days. The slightly positive slope of ξ after 90 min in Figure 3 suggests that if the experiments were conducted for a longer period of time, then complete crystallization of the emulsion by secondary nucleation would be possible.
Conclusions can be drawn about the influence of the emulsifier concentration on nucleation by combining the curves at the same stirring speed and subcooling. 
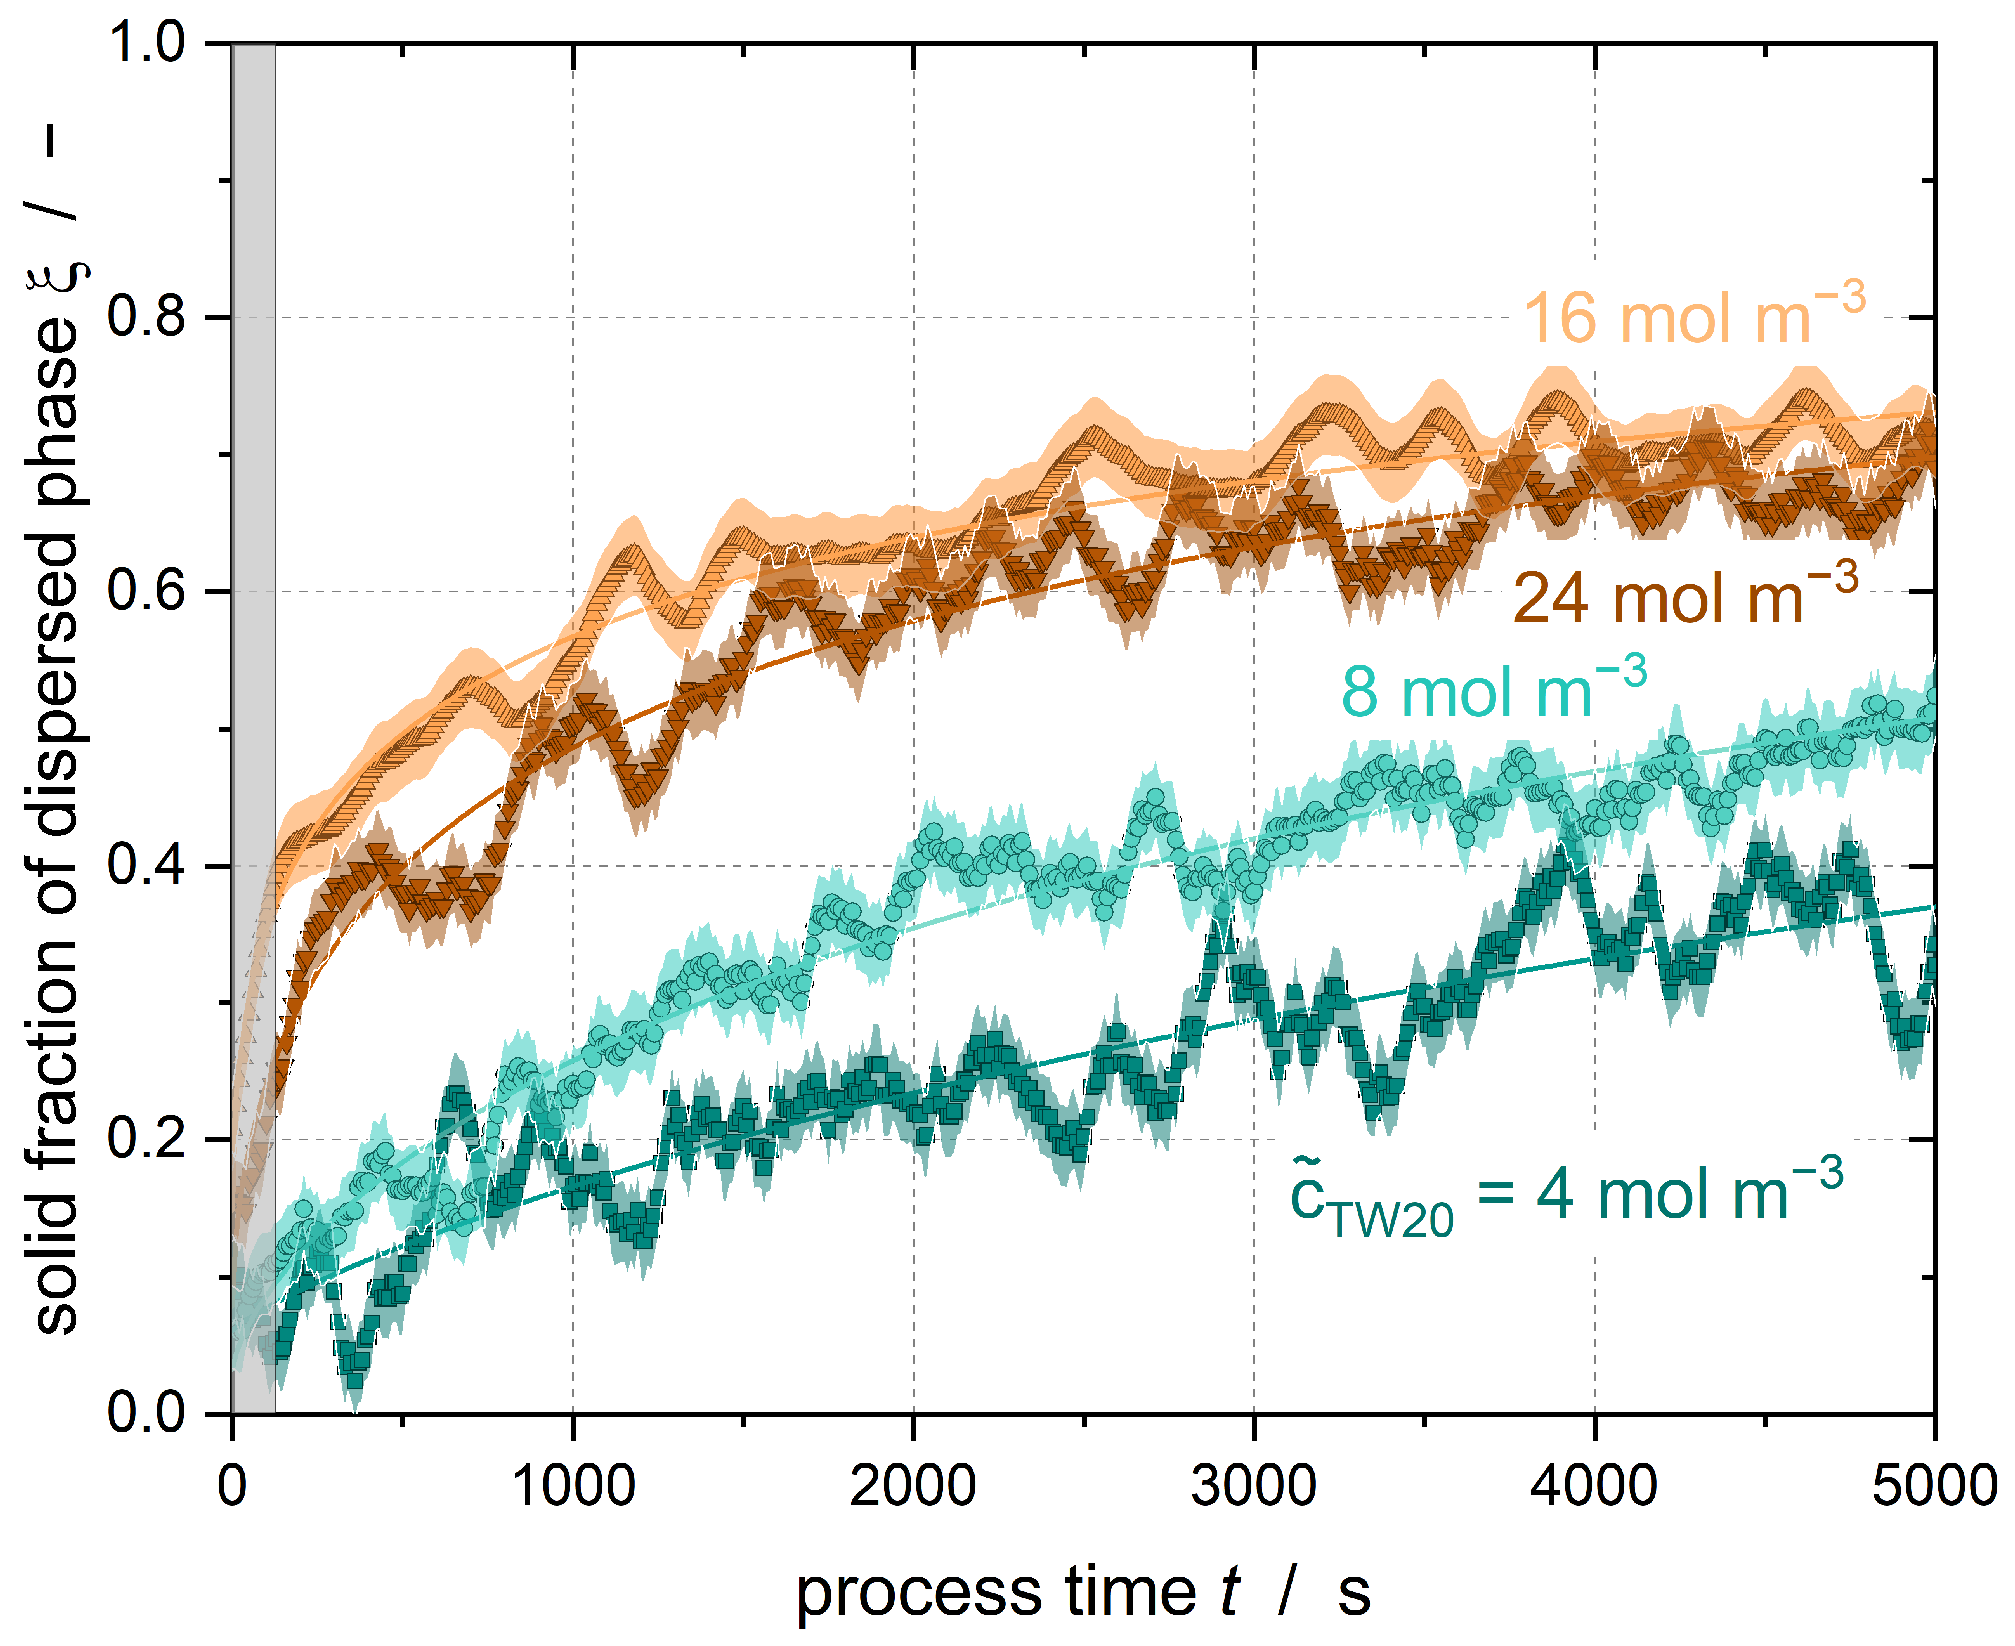
Figure 4 shows the solid content of Emulsion I at varying emulsifier concentrations. The test conditions were identical for all curves shown.
Figure 4 shows that the solid content increases faster with increasing emulsifier concentration. After 5000 s, the solid content of the emulsion with c ˜ TW 20 = 24 mol m−3 is ξ = 0.66 and that with c ˜ TW 20 = 16 mol m−3 is ξ = 0.71, while the emulsion with c ˜ TW 20 = 8 mol m−3 has a solid content of ξ = 0.50 and that with c ˜ TW 20 = 4 mol m−3 is ξ = 0.39. Thus, the crystallization of the emulsions is accelerated with increasing emulsifier concentration. Whether further acceleration of crystallization by increasing the emulsifier concentration of c ˜ TW 20 ≥ 16 mol m−3 is possible cannot be determined from the data shown here. It is possible that the underlying mechanism reaches a plateau or maximum state with respect to further increases in the surfactant concentration.
The 3Exp-model (Equation (14)) was fitted to the experimental data (the line shown in Figure 4). 
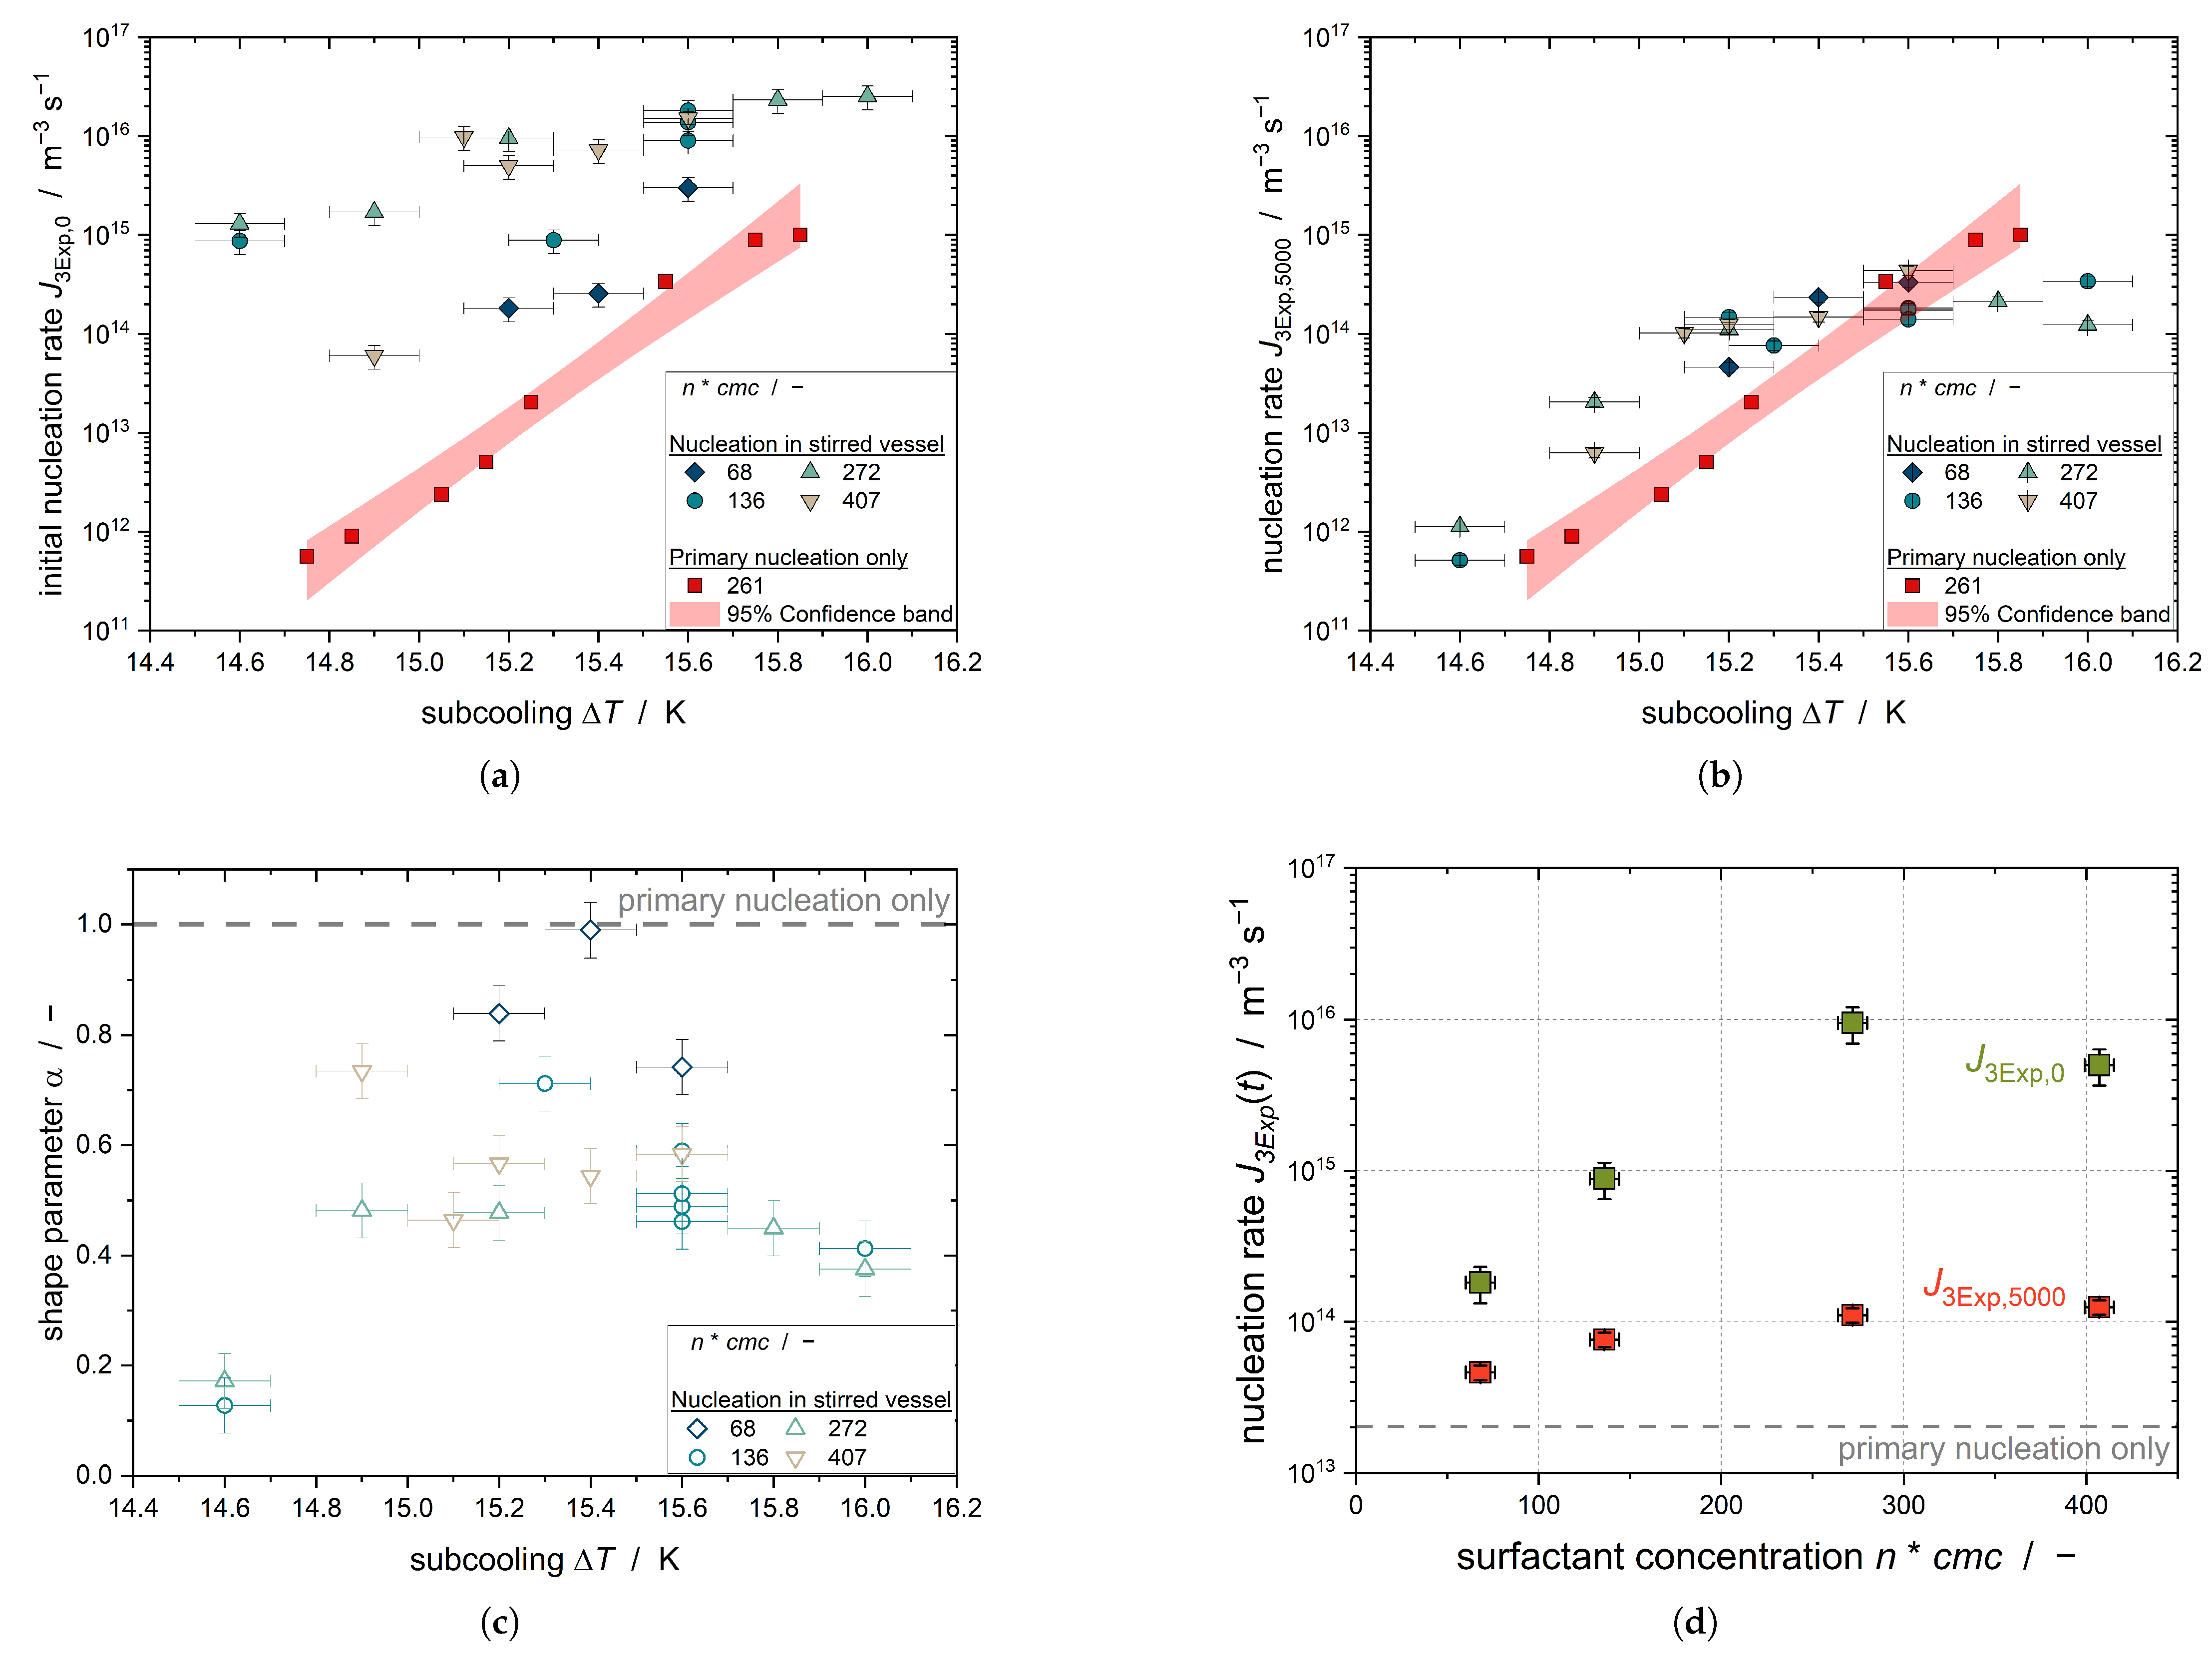
Figure 5 shows the initial nucleation rate J 3 Exp , 0 , the shape parameter α of the 3Exp-model, and the nucleation rate after 5000 s J 3 Exp , 5000 for the subcoolings investigated for all tested surfactant concentrations. Additionally, the primary nucleation rate J prim is shown. J prim was determined using spectroscopic NMR measurements according to [38]. By fitting the time-dependent solid fraction of the emulsion droplets according to Equation (8), J prim was determined for Emulsion I without the influence of shear at a given subcooling.
The plot shows that the nucleation rate increases with increasing subcooling, and as such with increase in the driving force of crystallization. This relationship is evident for all emulsifier concentrations. Furthermore, J 3 Exp , 0 increases with increasing emulsifier concentration. This confirms the relationship seen in Figure 4 that the initial steep increase in the solid content of n-hexadecane droplets is dependent on the emulsifier concentration. Comparison with J prim clearly shows that J 3 Exp , 0 is higher than J prim for all experiments in the stirred tank due to secondary nucleation. The difference between the purely primary nucleation and the nucleation in the stirred tank decreases with increasing subcooling, as the primary nucleation at high subcooling is the dominant nucleation mechanism in the emulsion droplets.
The time variation of the nucleation rate is expressed by the shape parameter α . Figure 5c shows that α < 1 for all subcooling and TW20 concentrations; thus, the nucleation rate of all settings decreases with time. Regarding c ˜ TW 20 = 4 mol m−3, α takes the highest value, i.e., for the lowest emulsifier concentration, the time decrease in the nucleation rate is the smallest. The two values for T = 14.6 K are very small compared to the rest of the values, with α < 0.2, which is due to the fact that the two curves are poorly fitted by the 3Exp-model (with a goodness of fit of R 2 < 0.1). The application of second-order kinetics would be more appropriate for these experiments, as presumably primary nucleation does not occur with the low subcooling and secondary nucleation is present.
The nucleation rate after 5000 s, calculated from α and J 3 Exp , 0 using Equation (13), shows that the nucleation rate in the stirred tank approaches the purely primary nucleation rate. Observation of the fits at different emulsifier concentrations shows that the nucleation rate increases with the free emulsifier concentration in the aqueous phase; thus, the solid fraction of the n-hexadecane droplets increases more strongly. Consequently, a nucleation-promoting mechanism of the micelles must exist.
Dickinson et al. [10] found through a variation of emulsifier concentrations and types that there was an increase in nucleation frequency with increasing emulsifier concentration independent of the chemical nature of the emulsifier. Only CMN was observed, primary nucleation was excluded, and no shear was applied. The authors determined the kinetics constant k CMN at T = 12.6 K using the second-order kinetics. The corresponding nucleation rate J CMN was determined taking the droplet volume into account. When the TW20 concentration was increased from c ˜ TW 20 = 6 mol m−3 to c ˜ TW 20 = 18 mol m−3, the nucleation rate increased from J CMN = 6.41 · 10 13 m−3s−1 to J CMN = 1.96 · 10 14 m−3s−1, which is slightly lower than the nucleation rate determined in this work without inoculation crystals. In addition, the emulsions were not stirred and the mass fraction of the hexadecane was 12.5% above the mass fraction of this work, which is 5%.
McClements and Dungan [26] observed an increase in the nucleation frequency with increasing emulsifier concentration in an n-hexadecane-in-water emulsion with TW20 as the surfactant. They used n-hexadecane-in-water emulsions with an n-hexadecane mass fraction of 30%, which they studied at T = 12.6 K. When increasing c ˜ TW 20 = 2 mol m−3 to c ˜ TW 20 = 14 mol m−3, the emulsions showed an increase in the nucleation rate from J CMN = 9.72 · 10 13 m−3s−1 to J CMN = 2.82 · 10 14 m−3s−1. The authors mentioned a lowering of the interfacial tension with increasing emulsifier concentration, the template effect, and depletion flocculation as possible reasons for this increase [26]. The possibility of accelerated nucleation due to lower interfacial tension can be excluded for the emulsions used in this work, as the emulsifier concentration of all emulsions was clearly above the c m c ; thus, the increase of interfacial surfactant molecules should be negligible [40]. The template effect is the acceleration of nucleation due to the similarity of the hydrophobic surfactant tail and the dispersed phase. When the similarity is increased, the likeliness of the dispersed phase crystallizing is increased as well, because the tails increase the structure of the dispersed phase and consequently lower the energy barrier needed to overcome nucleation [41]. Because n-hexadecane molecules and the hydrophobic part of TW20 molecules have low structural similarity, the promotion of crystallization due to the template effect can be excluded as the reason for the acceleration of nucleation [42].
McClements and Dungan [26] put forward their own explanatory approach involving depletion flocculation. They excluded the influence of the emulsifier concentration on nucleation in the individual droplets, as their DSC measurements showed no dependence of the crystallization and melting behavior on the emulsifier concentration. Instead, the authors suspected changed approach behavior on the part of the solid and liquid droplets resulting from the micelle-free volumes around the droplets. If two emulsion droplets approach each other and the micelle-free volumes overlap, this state is energetically more favorable due to the reduced common volume without micelles. This state is mentioned as being energetically more favorable. A biopolymer must be present in the continuous phase that forms a network for this effect to occur in TW20-stabilized emulsions. Thus, depletion flocculation can be ruled out for the emulsions studied in this work, which lacked a a biopolymer.
We showed in our previous study of the interfacial occupancy of liquid and solid droplets that there are fewer TW20 molecules on the surface of a crystalline n-hexadecane droplet than on a liquid droplet [43]. During crystallization, TW20 molecules desorb from the interface. The results of our small-angle X-ray scattering (SAXS) measurements indicated that n-hexadecane molecules were entrapped in the center of TW20 micelles [43]. While these nanodroplets occupy a small volume, they have a very large surface area and are present in great numbers. When these small droplets crystallize, they contribute strongly to the CMN, as the collision frequency is increased. The subcooling of T 13 K required for homogeneous nucleation in nanodroplets with a diameter of x = 10 nm was achieved in all experiments conducted in this work [44]. The nanodroplets had such a small volume that the increase in the solid fraction during the crystallization of the nanodroplets due to the change in the sound velocity was probably not measurable. Because no further acceleration of nucleation is evident when increasing the emulsifier concentration from c ˜ TW 20 = 16 mol m−3 to c ˜ TW 20 = 24 mol m−3, it is reasonable to assume that the number of nanodroplets has reached its maximum and that the equilibrium distribution has been reached.

3.4. Impact of Shear on Crystallization

We have shown previously that laminar shear can be used to trigger crystallization up to a specific shear rate [14]. At this shear rate, the crystallization efficiency reaches its maximum depending on, inter alia, the fraction of the dispersed phase and the shear flow (laminar, turbulent). However, not only the CMN is impacted by shear; as has already been described for polymer solutions, shear can trigger crystallization by increasing the structure of the molecules and consequently decreasing the energy barrier. Whereas the impact of shear on the droplet increases with increasing stirring rate, and should fasten the droplet crystallization without any limitations, the CMN might reach a maximum at a given shear rate and lose its ability to promote the crystallization progress of the dispersed phase. We assume that the impact of shear on the droplets, referred to in the following as shear-induced nucleation, should be especially visible at the beginning of the crystallization of the bigger droplets. Therefore, J 3 Exp , 0 is used to evaluate the impact of shear-induced nucleation. The CMN needs solid particles which have already been formed in order to occur; thus, J 3 Exp , 5000 is used to determine the possibility of fastening the crystallization of the dispersed phase via CMN.
J 3 Exp , 0 
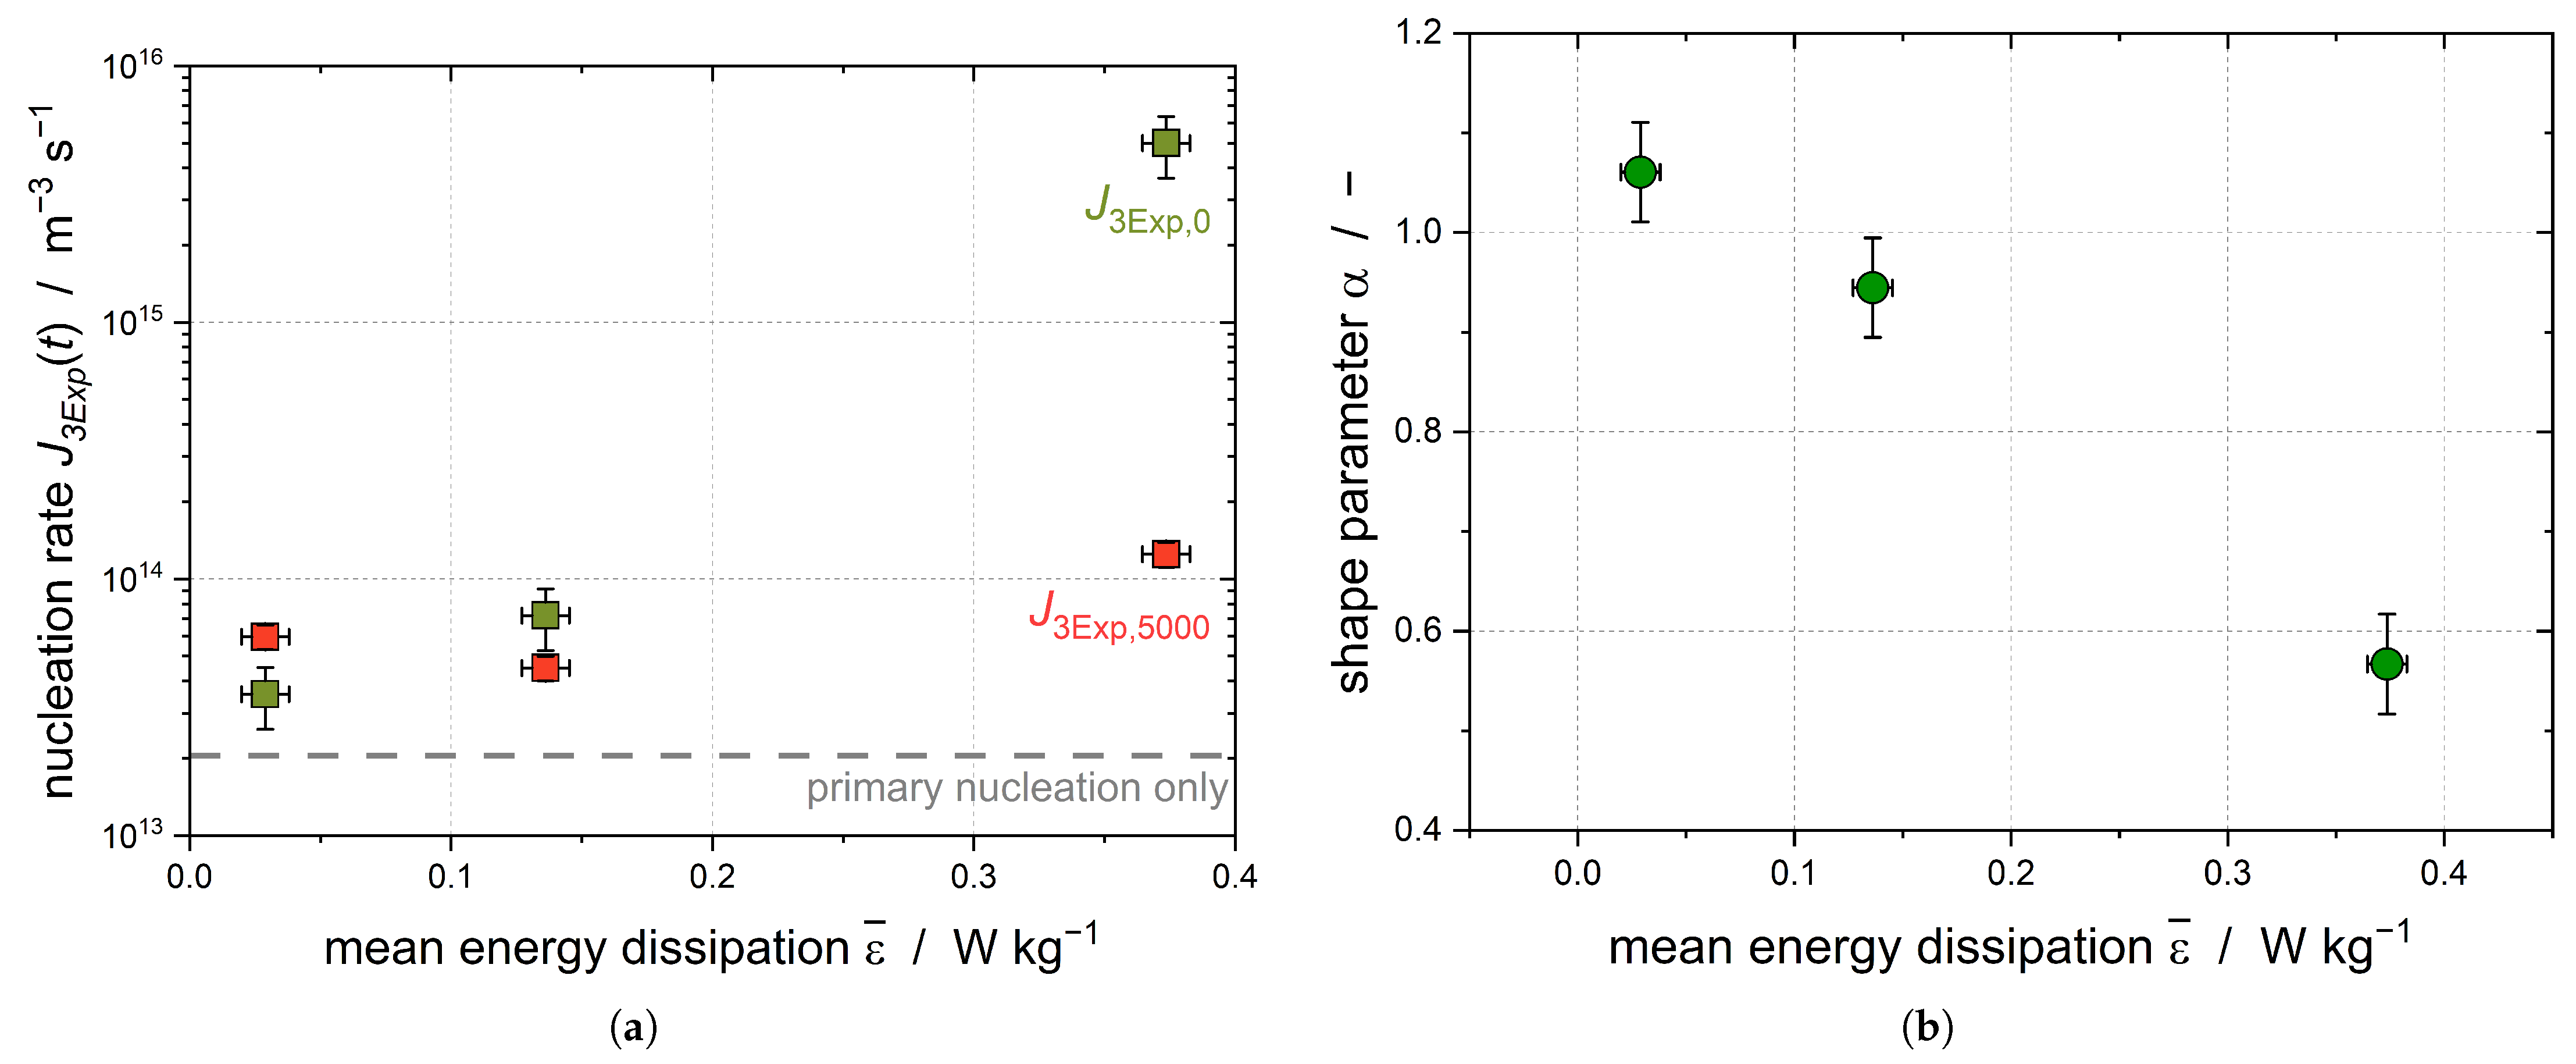
increases with increasing stirring rate, and as such with increasing mean energy dissipation (Figure 6a). Because the subcooling was kept constant for all experiments, this increase can show the impact of the shear-induced nucleation, as primary nucleation should be independent of the applied shear.
As the stirring rates increase, the shear parameter α diminishes, leading to a growing disparity in the nucleation rates over the course of the experiment (Figure 6b). In order to guarantee that the higher energy input did not lead to a better temperature homogeneity, the temperature difference of the four integrated temperature sensors was compared and found to be independent of the stirring rate. It can be assumed that CMN is primarily responsible for the increase in the solid droplet fraction at later process times (t > 2000 s), leading to J 3 Exp , 5000 = J CMN .
The CMN is mainly influenced by three factors: the collision frequency h coll , contact time, and contact force. Whereas h coll and the contact force increase with increasing ε ¯ , the contact time decreases simultaneously. This is why an increasing application of shear forces does not necessarily result in a faster crystallization progress of the dispersed phase. We were able the show in previous works that the crystallization kinetic factor for the laminar Couette flow increases with increasing mean shear rate up to a maximum, after which the contact time becomes limiting and the complete crystallization of the dispersed phase requires longer process times [14,38]. The shear field in the stirred vessel is widely distributed; therefore, droplets and particles move to different relative velocities independent of their location in the vessel itself. This provides an explanation of why there was no limitation of the contact time detectable in these experiments.
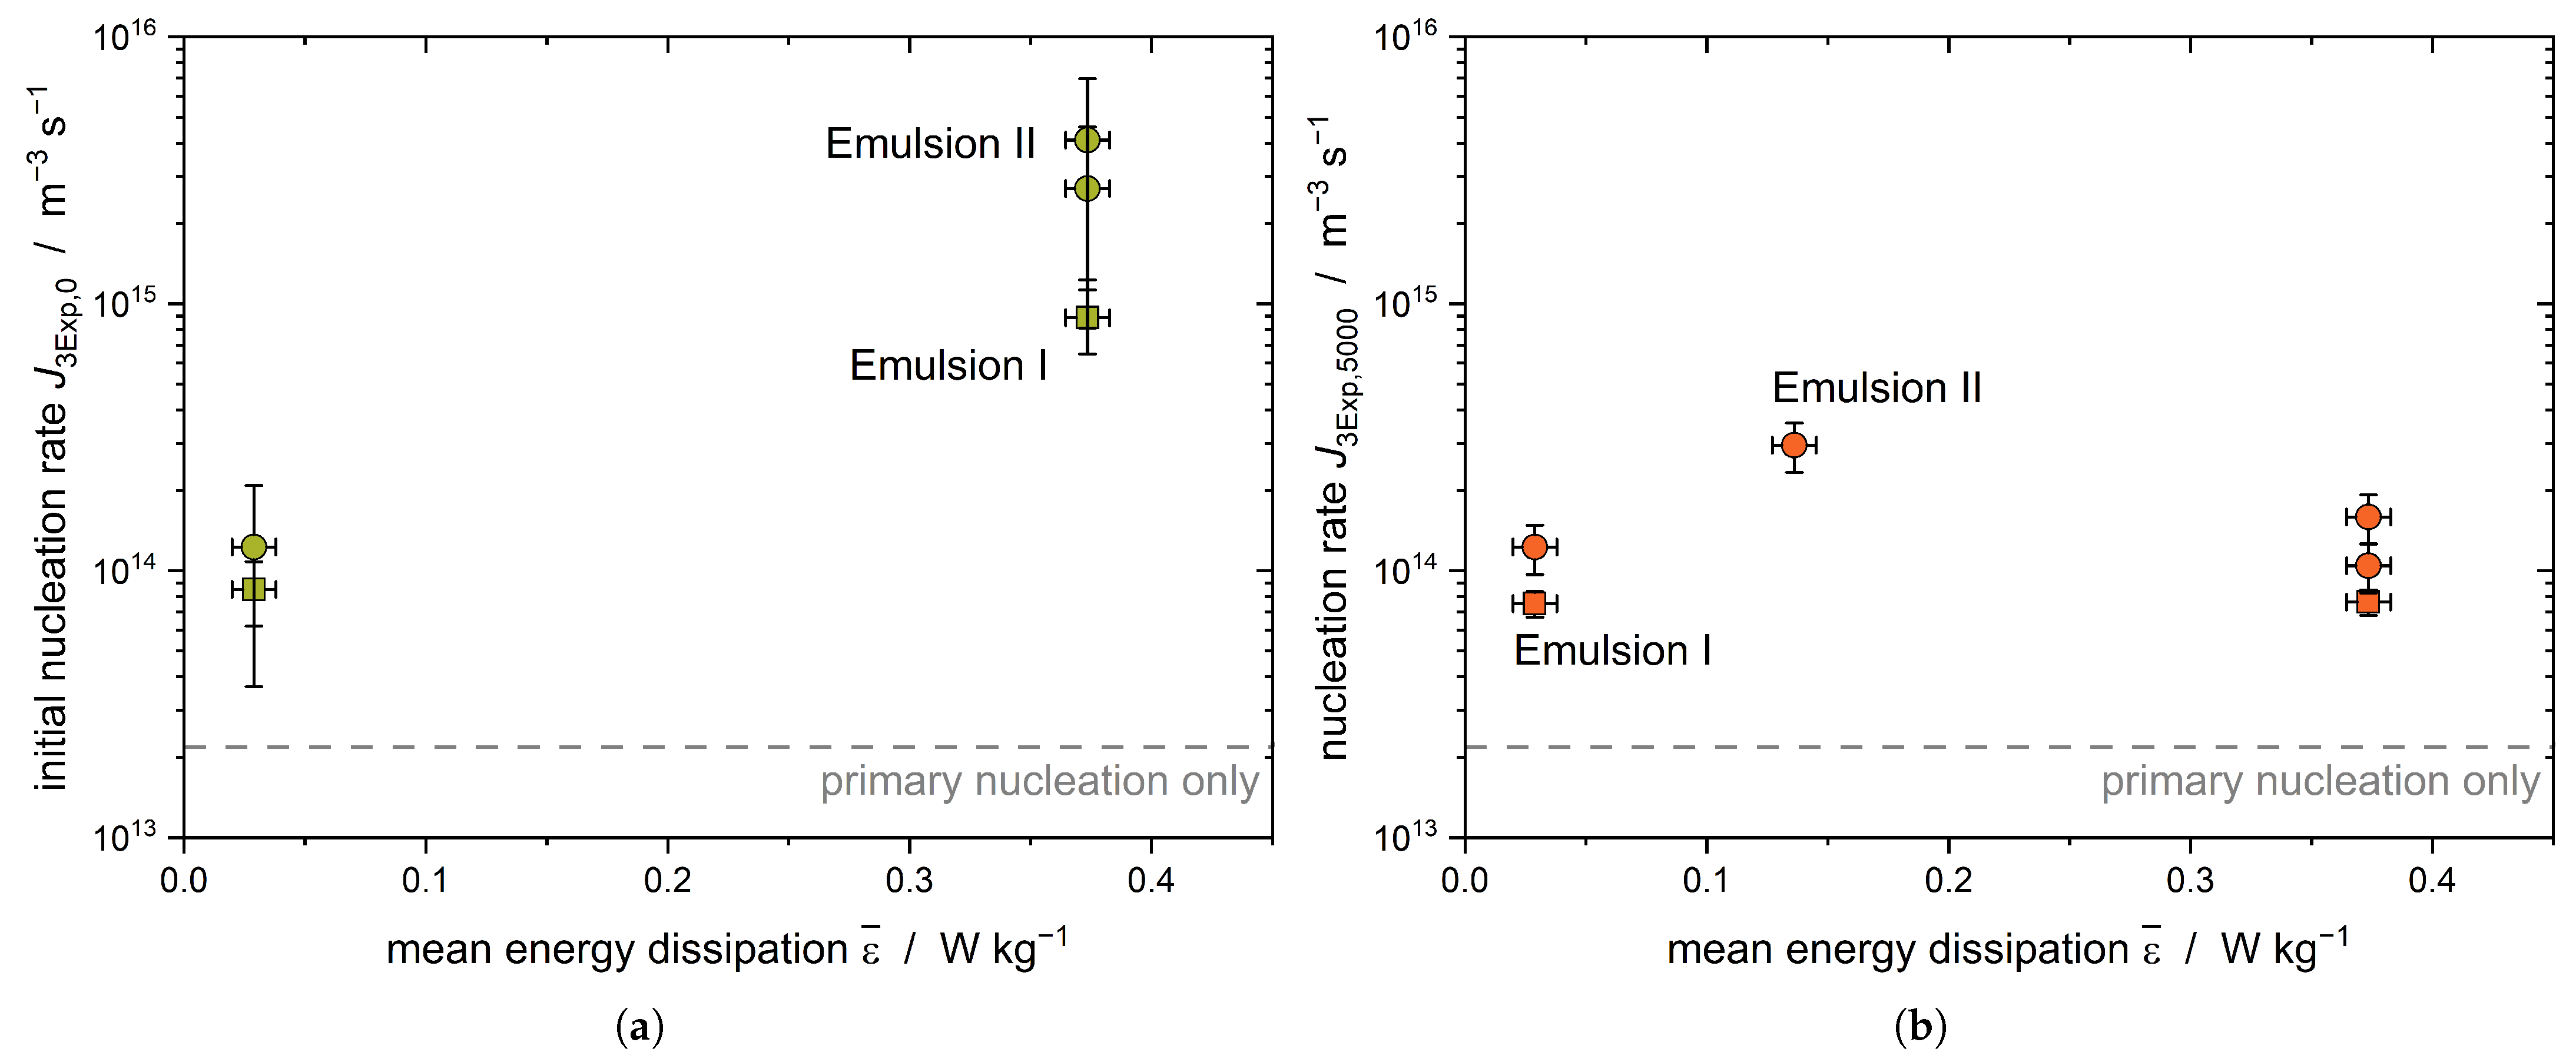
A second emulsion with a bimodal DSD was used to further investigate the effect of shear-induced nucleation. As larger droplets are exposed to higher deforming forces, an increase in J 3 Exp , 0 must be visible (Figure 7a).
A clear increase in the initial nucleation rate J 3 Exp , 0 with increasing energy dissipation rate is evident for Emulsion II ( x 50 , 3 = 14.8 μ m). The crystallization of the latter is triggered by the shearing of the large droplets; therefore, an increase in the nucleation rate is evident. When increasing the energy dissipation rate from ε ¯ = 0.03 W kg−1 to ε ¯ = 0.38 W kg−1, this effect is less pronounced for Emulsion I, as only smaller droplets are present compared to the droplet sizes in Emulsion II. The nucleation rate of Emulsion II after 5000 s decreases to about the same value as the nucleation rate of Emulsion I (Figure 7b). Assuming that the largest droplets of Emulsion II crystallized due to shear during the first part (up to 2000 s) of the crystallization process, shear-induced nucleation no longer plays a major role at later process times (t > 2000 s) and CMN dominates the secondary fraction of the crystallization kinetics.
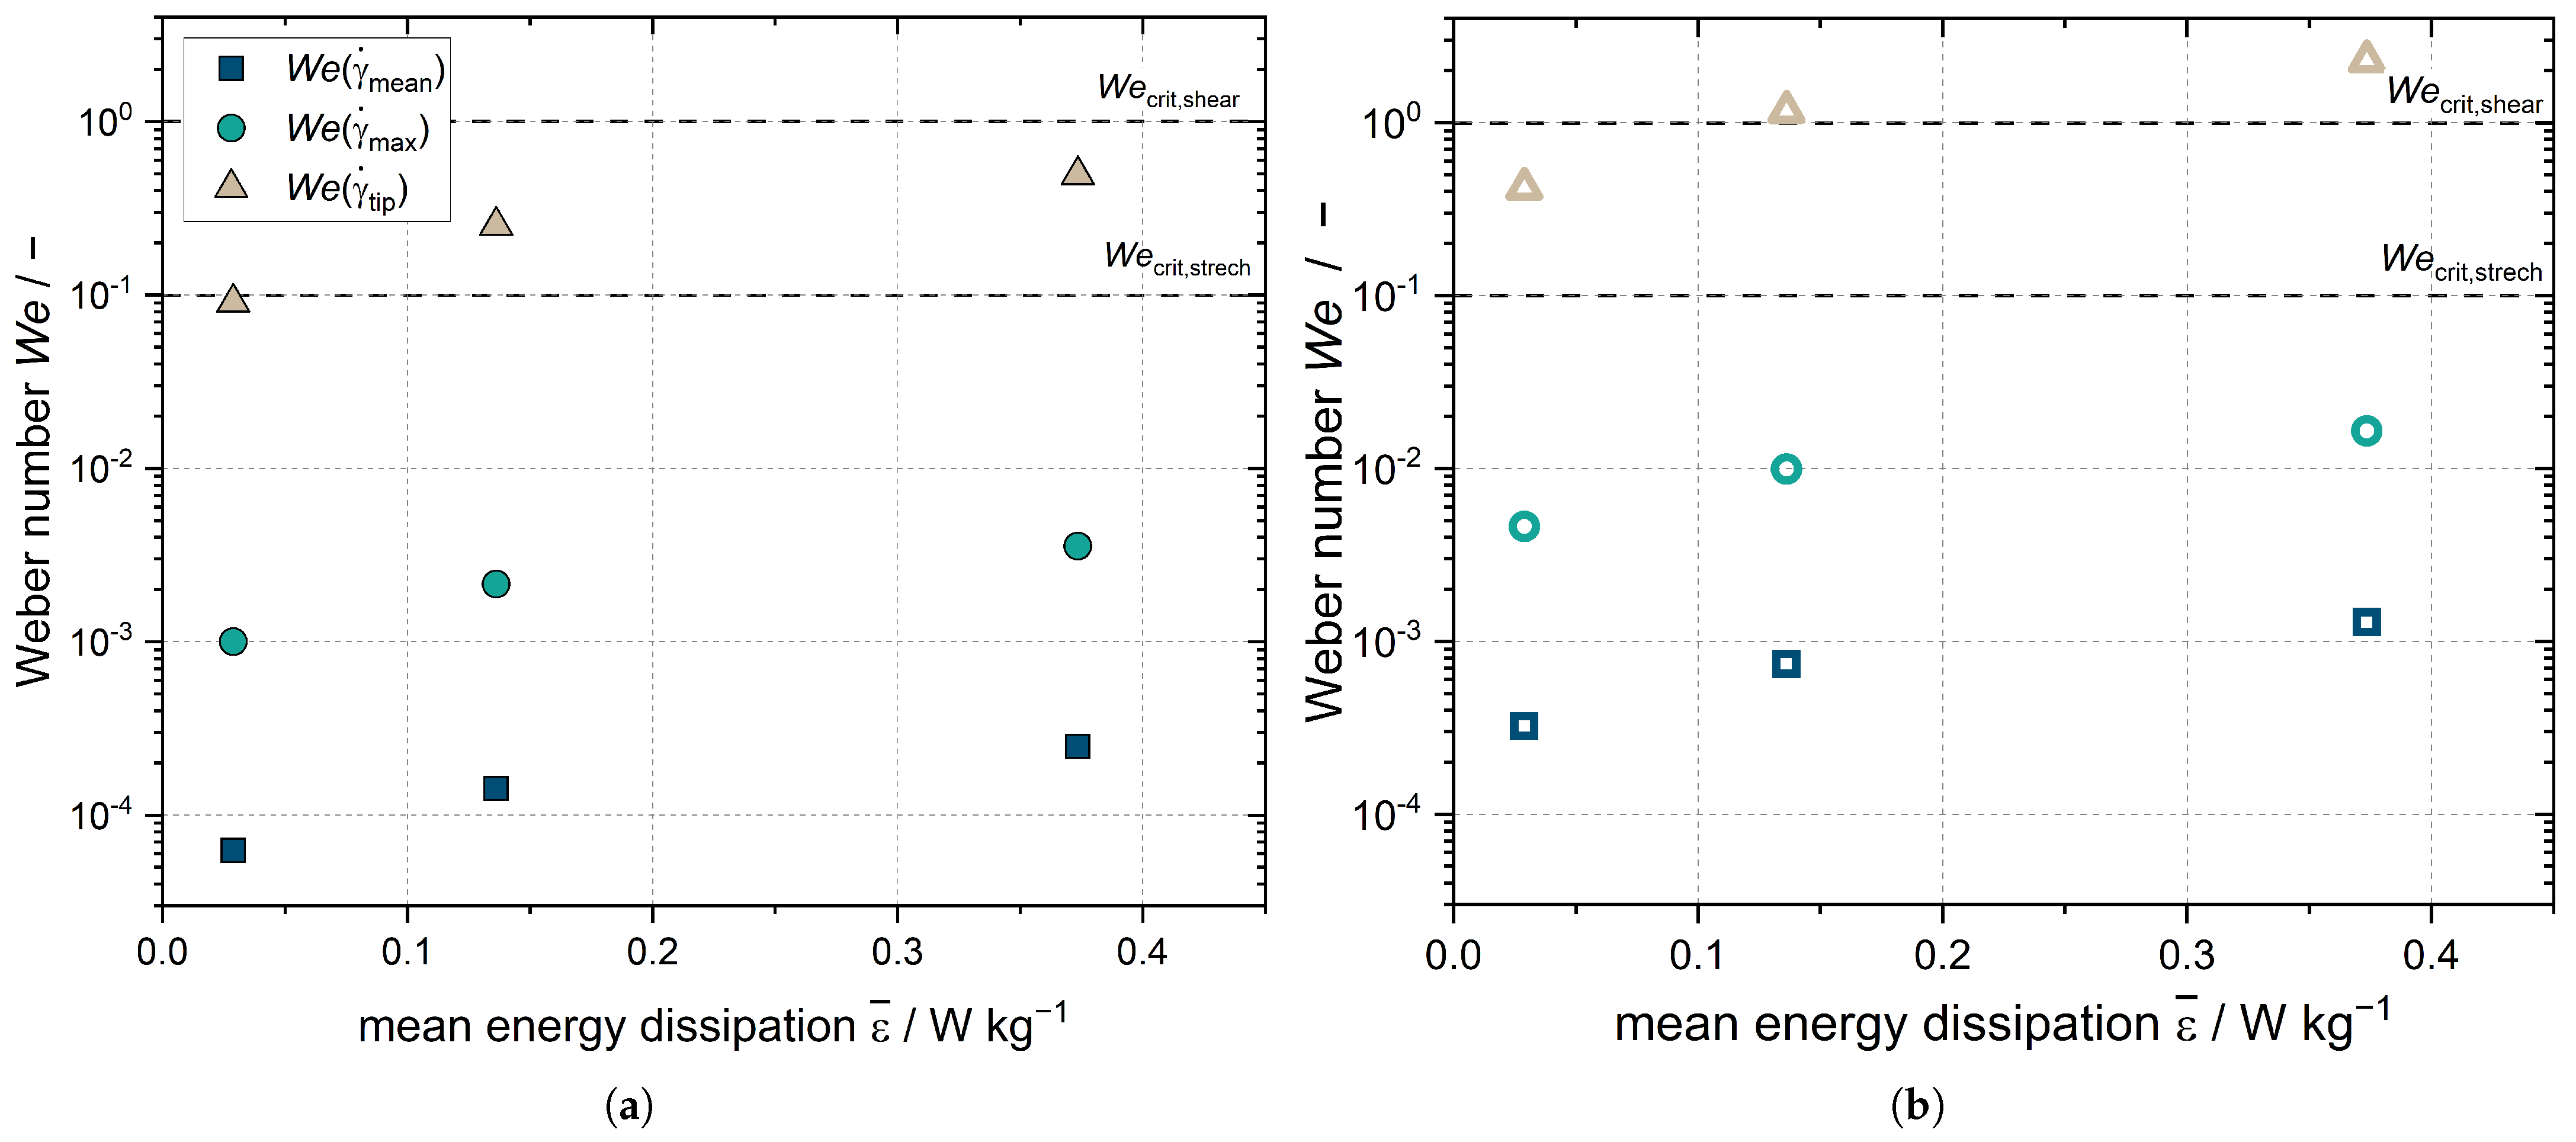
To assess the impact of shear on the droplets, the analysis involves defining the deformation of the droplets through a dimensionless parameter known as the Weber number ( W e ). This numerical value represents the ratio between the disruptive hydrodynamic forces and the stabilizing force of surface tension. Thus, the W e number serves as an indicator to determine whether kinetic or surface tension energy plays a dominant role. In the context of a spherical droplet, the W e number can be calculated by comparing the droplet’s kinetic energy to its surface energy. The W e number is calculated according to Equation (22):
W e = η c · γ ˙ · x / 2 γ ll .
where η c refers to the viscosity of the continuous phase and γ ll to the interfacial tension of the liquid–liquid interface of the droplet. If W e > W e crit , droplet breakup occurs. Droplet breakup for n-hexadecane-in-water systems with a viscosity ratio between the dispersed phase ( η d ) and the continuous phase of η d η c 3.8 occurs in a laminar stretching flow for W e numbers above the critical stretching W e number W e crit , strech 0.1 and in a laminar shear flow above the critical shear W e number W e crit , shear 1 [45]. However, the W e number is only applicable to the laminar flow case [46], which does not exist at any of the three stirrer speeds studied here. Laminar flow regions may exist locally in the stirred tank; thus, the W e number is used for a lower estimate of the droplet deformation in the stirred tank. Due to the local velocity and shear peaks in a turbulent flow, it is possible that the real shear velocities are above the ones calculated and that droplets may be locally deformed more than the W e number predicts. The maximum droplet deformation is present for the largest droplet fraction, which is x = 9.86 μ m for Emulsion I regardless of the emulsifier concentration. The largest droplet diameter for Emulsion II is x = 45.60 μ m for all emulsifier concentrations studied. The W e number, and consequently the deformation of the droplets, increases with the increasing energy dissipation rate resulting from increasing stirrer speed (Figure 8).
W e ( γ ˙ tip ) is the W e number for droplets that are in close proximity to the rotating stirrer blade. This is higher for Emulsion I (Figure 8a) for the highest stirrer speed set and is higher for Emulsion II (Figure 8b) than the critical W e number W e crit , strech 0.1 for all settings. However, this coefficient is only applicable for laminar flow conditions, which do not exist in the vicinity of the stirrer. Reliable statements about the size reduction of the droplets in the stirred tank cannot be made based on the W e 
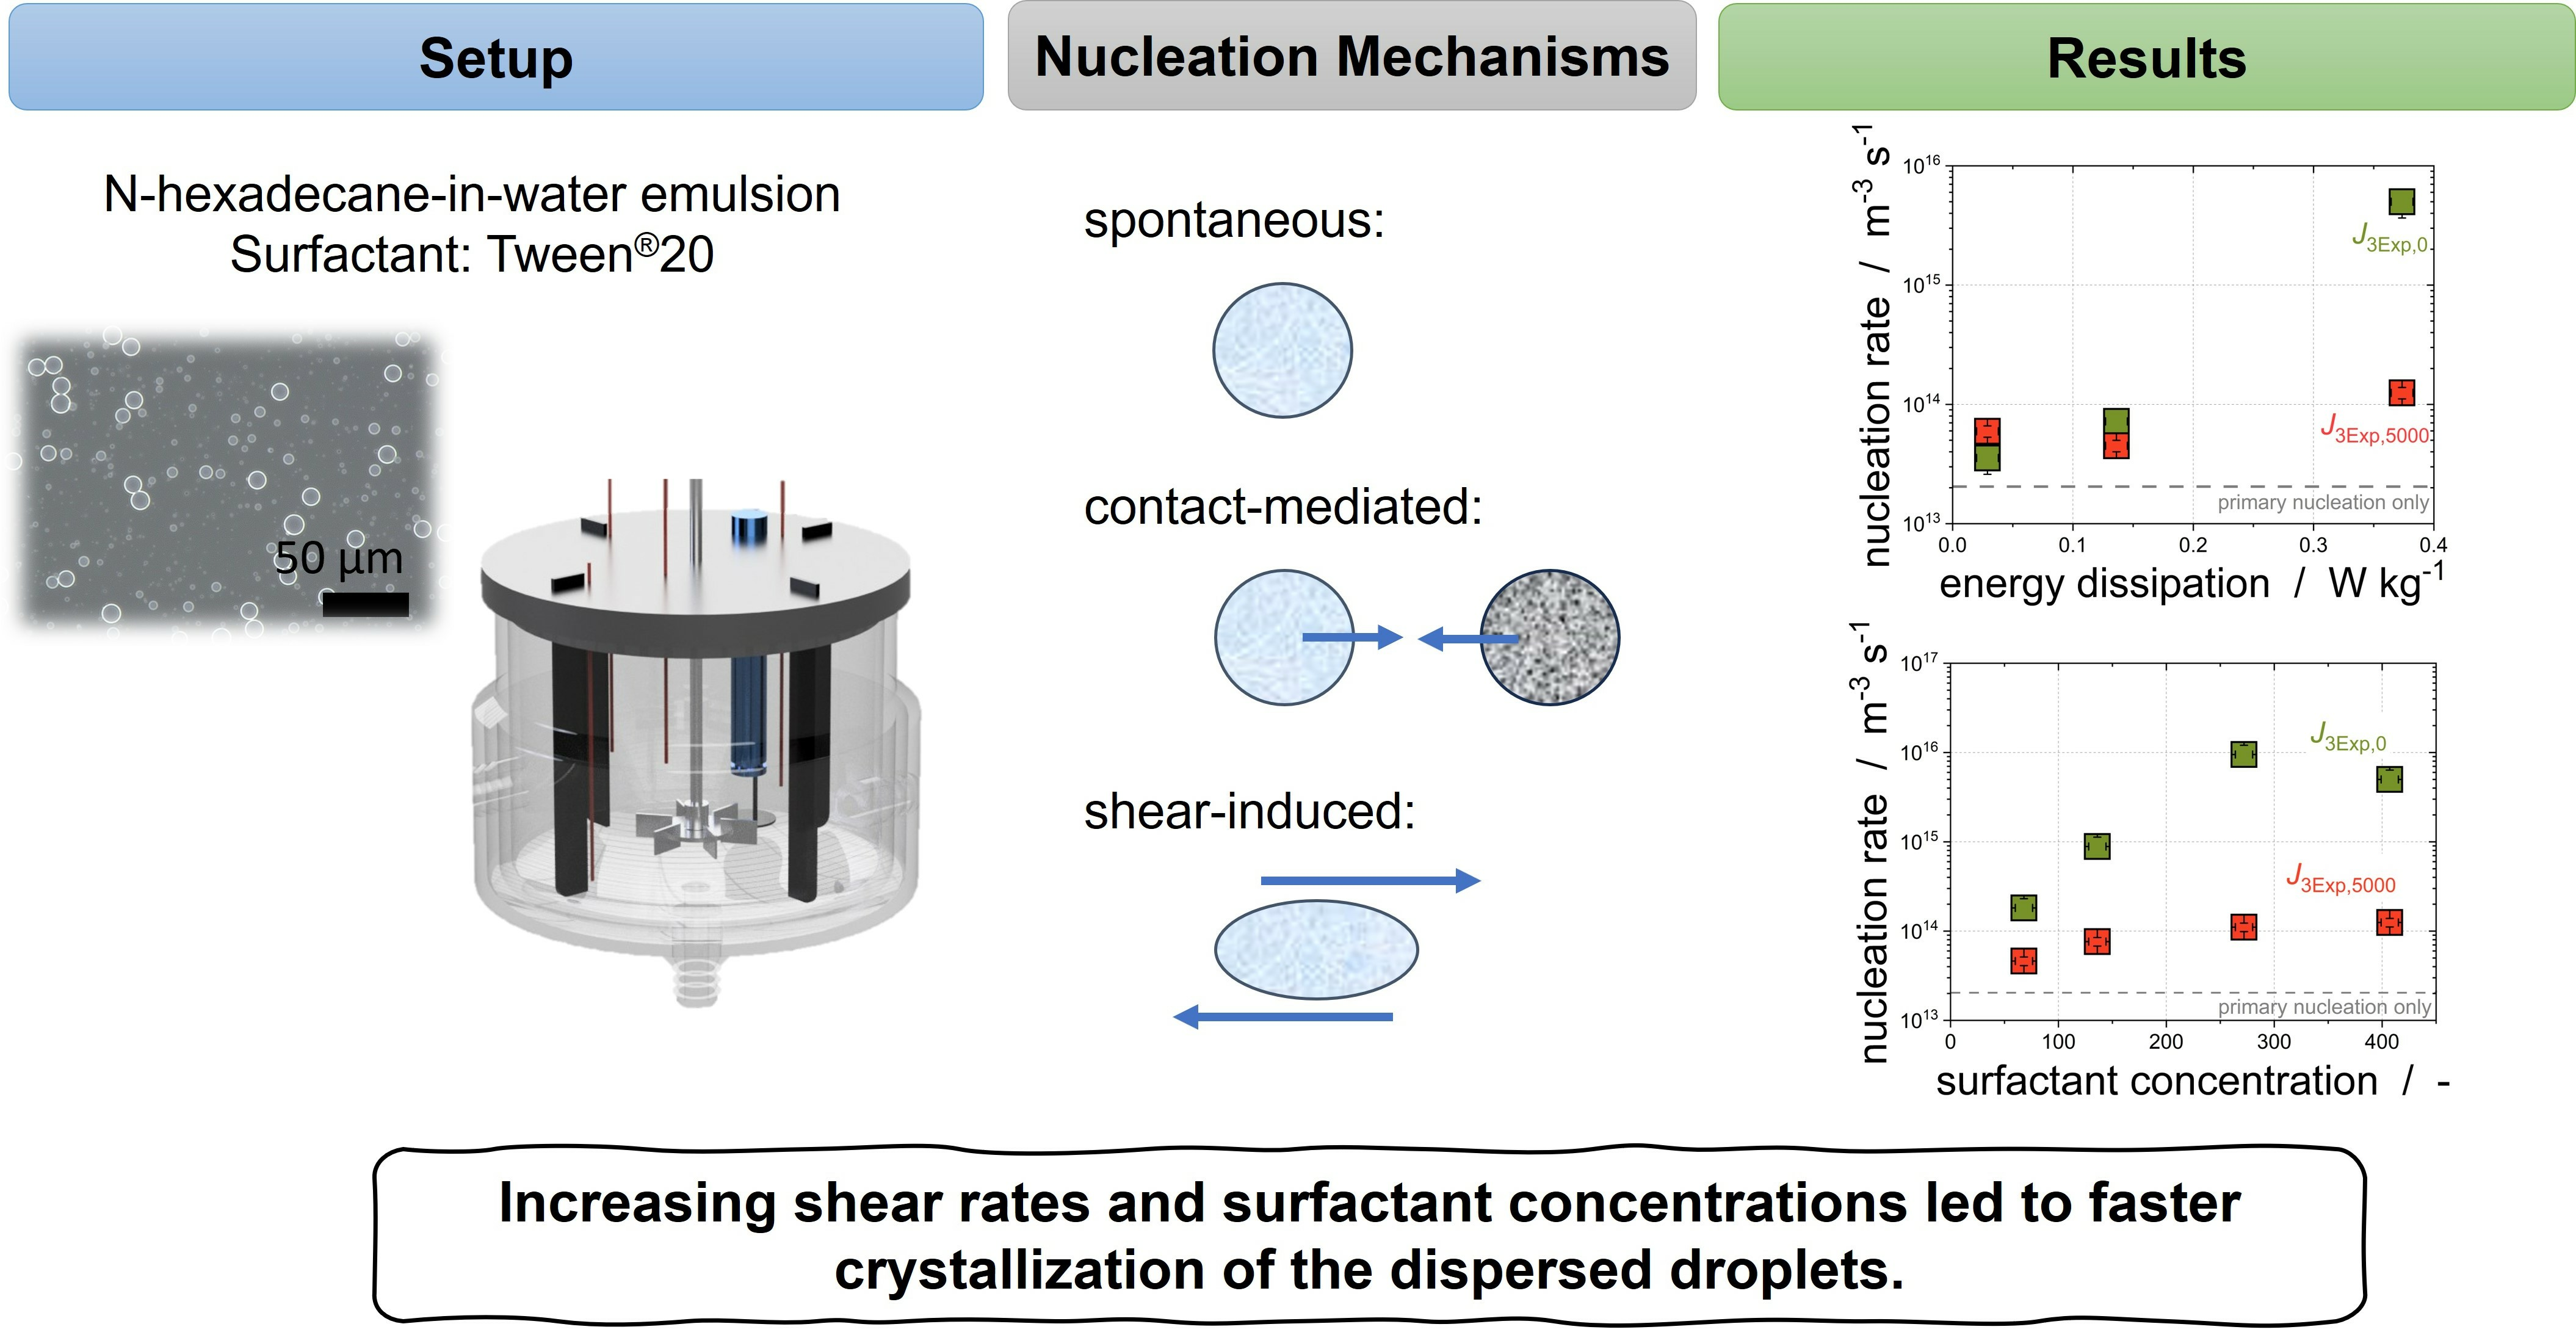
number, and numerical simulations are needed; however, the measurements of the DSD of Emulsion I after crystallization showed no change in the droplets sizes (compare Figure 1). In the case of Emulsion II, the DSD even increased after crystallization as coalescence of the melted droplets took place (compare Figure 1). The W e numbers for the mean and maximum shear rates in the stirred volume W e ( γ ˙ mean ) and W e ( γ ˙ max ) , respectively, were significantly below the critical W e numbers and the W e number at the stirrer tip. Thus, while the flow in the stirred vessel deforms the droplets, it does not crush them in the process. The acceleration of crystallization is due to shear and CMN, and does not result from the change in DSD.
In addition, the size of the micro-eddies for the turbulent flow must be considered. The average size of the micro-eddies λ micro for ε ¯ = 0.37 W kg−1 is ≈95 μ m, which is double the size of the largest droplets in the two emulsions. Only droplets which are larger or the same size as λ micro are exposed to deformation forces; therefore, the DSD should not be changed by means of λ micro [47]. However, fluctuations of the velocity may impact the DSD. The droplets can start to oscillate and reach the droplet resonant frequency through fast changes of the local velocity, which can be given in stirred tanks, resulting in droplet breakage [48].

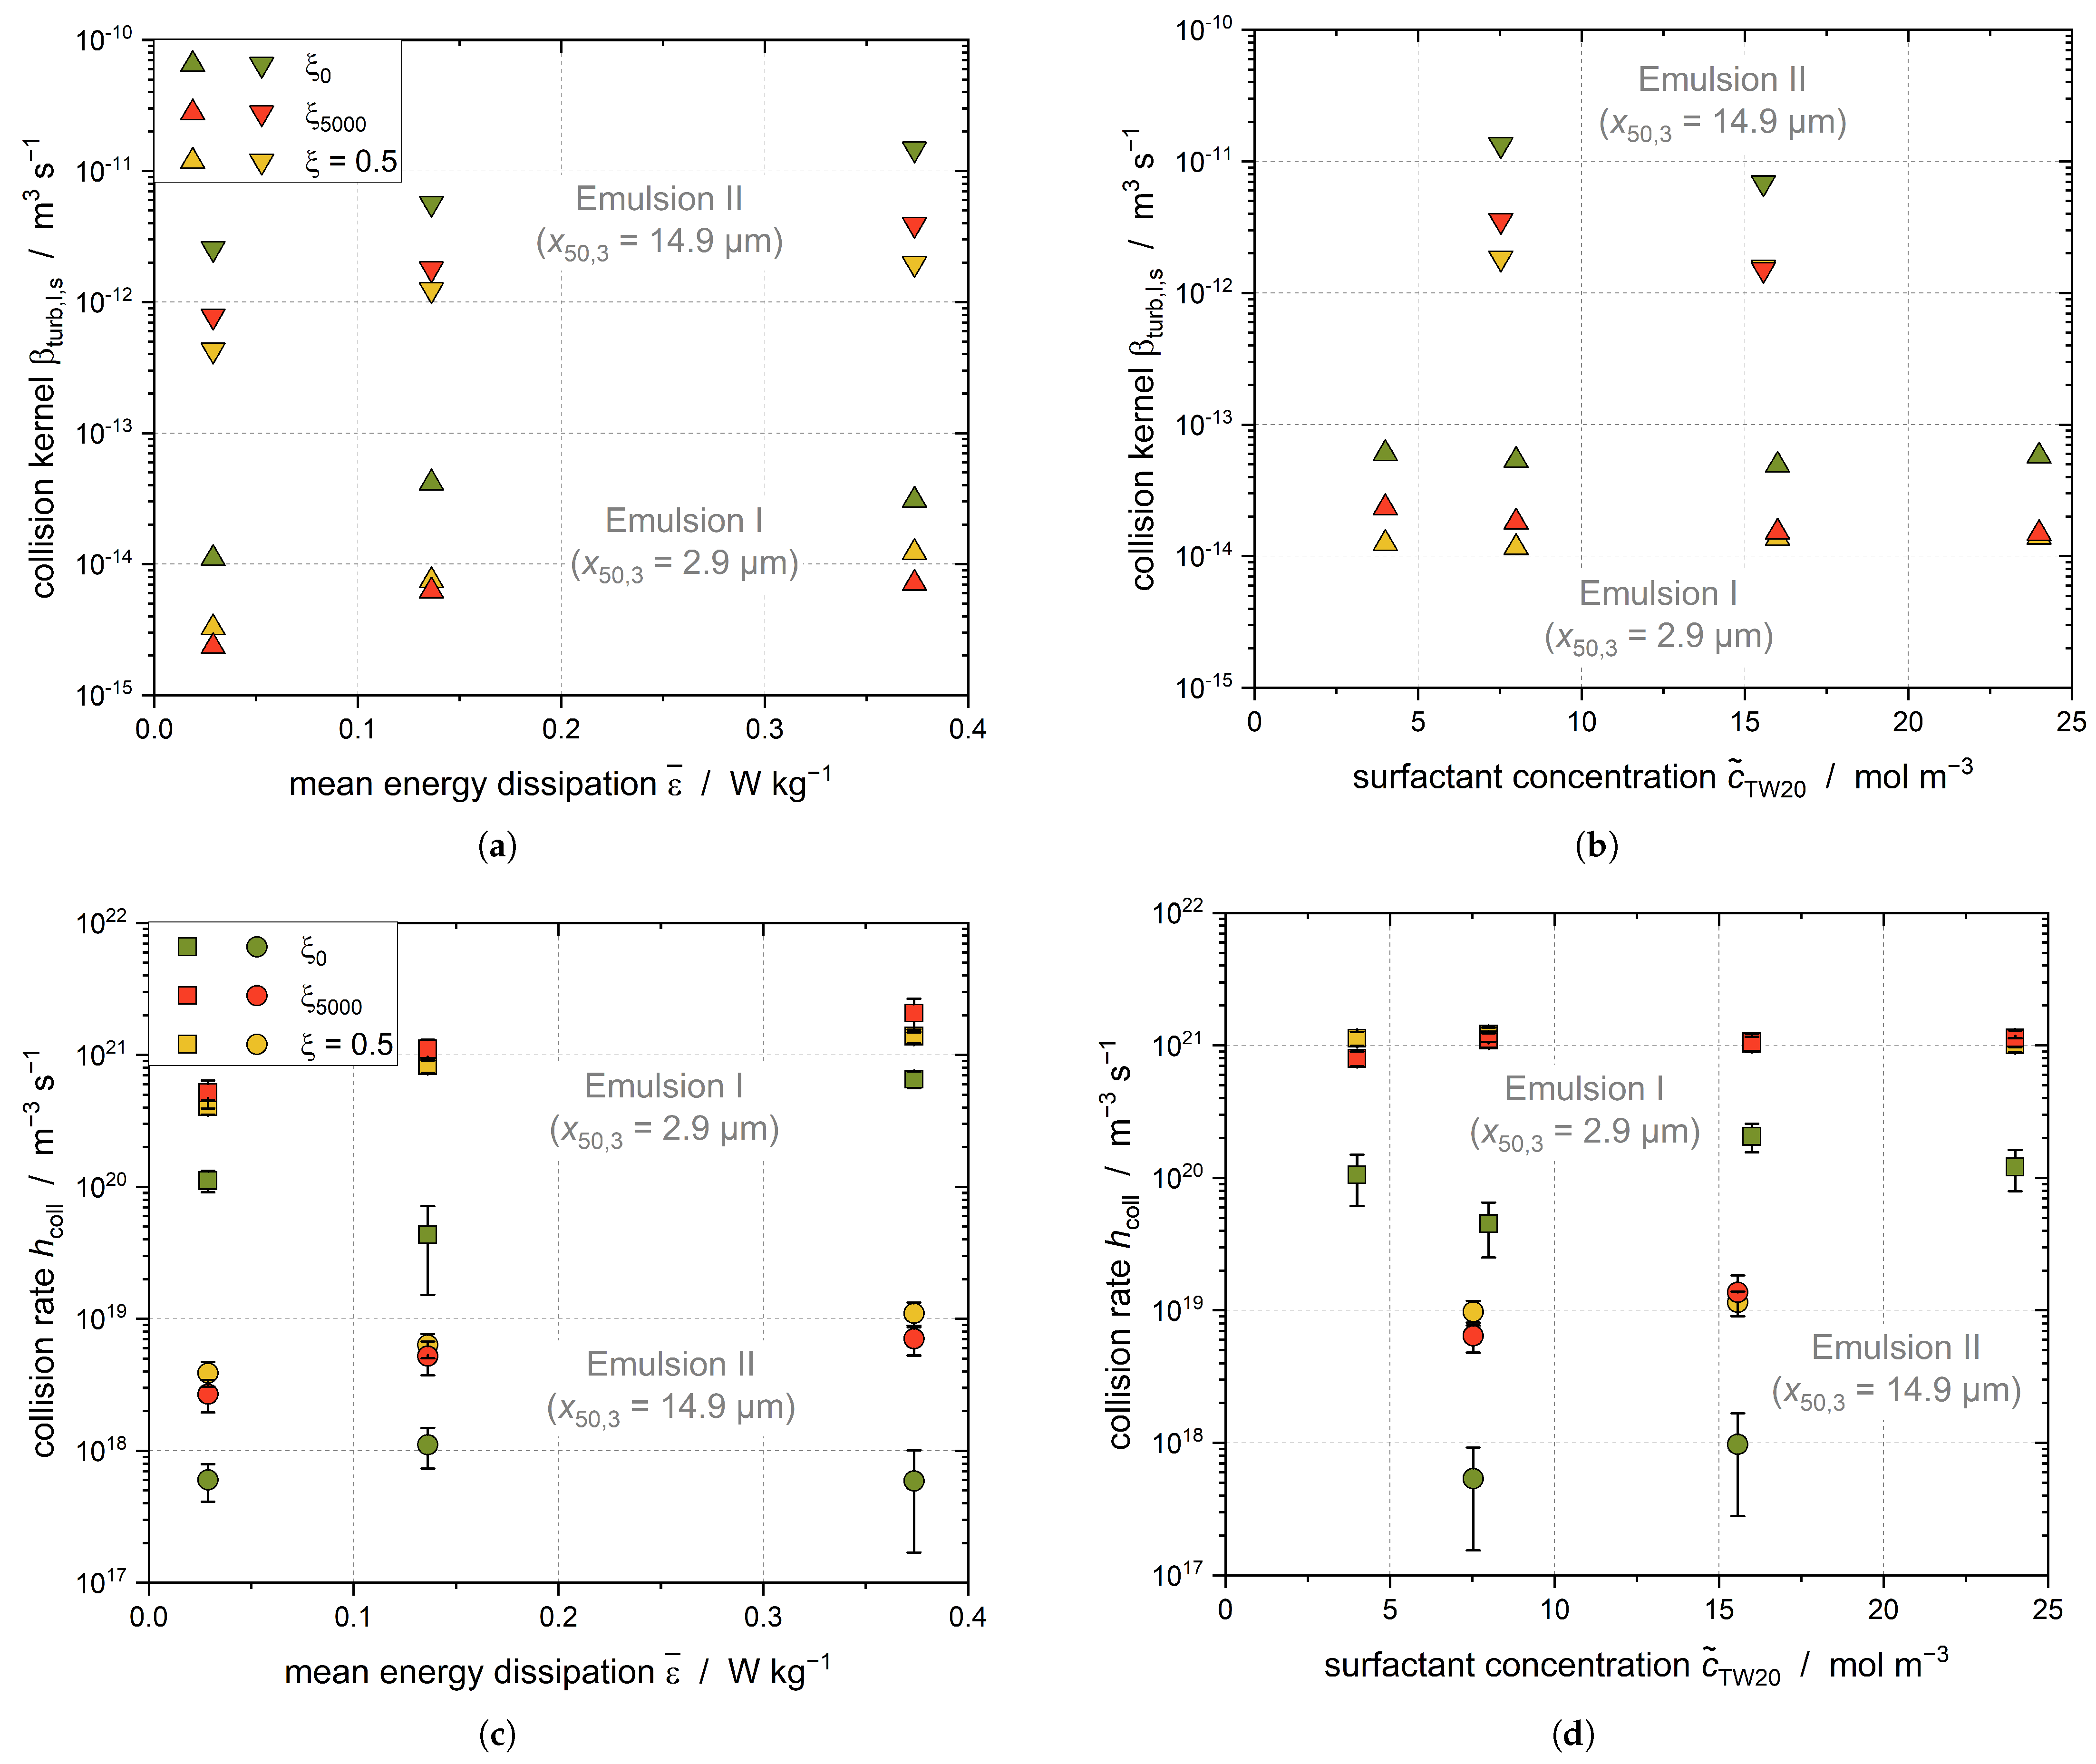
3.5. Collision Kernel, Collision Rate, and Collision Efficiency

The flow regime in the stirred tank is transient or turbulent for the studied settings; thus, Equation (19) is used to calculate the collision kernel. The required droplet sizes of the liquid and solid droplets, respectively x l and x s , were estimated using the measured DSD and the solid content of the dispersed phase determined at three different process times: (1) t = 0 s ( ξ 0 ); (2) t = 5000 s ( ξ 5000 ); and (3) t( ξ = 0.5) (Figure 9).
The collision kernel β l , s in the stirred tank increases with increasing energy dissipation rate and stirrer speed. The solid fraction increases and the size of the remaining liquid and the solid droplets decreases during the crystallization process. Therefore, the collision kernel of the droplets decreases as the crystallization time progresses, as shown by comparison of the collision kernels at t = 0   s and t = 5000   s . The initial droplet sizes of the emulsions did not change significantly with the increasing TW20 concentration; therefore, the collision kernel does not depend on the emulsifier concentration. Due to the larger droplets, the collision kernels for Emulsion II are correspondingly higher for all stirrer speeds and TW20 concentrations.
The collision rate h coll increases with the increasing energy dissipation rate and stirrer speed because the collision kernel increases. According to Equation (15), the collision rate depends on the number of liquid and solid droplets, which in turn is determined by the droplet and particle size. Both emulsions used in this work had the same disperse phase fraction while differing in their droplet size, and consequently in their number of droplets. Accordingly, the collision rate is higher in Emulsion I than Emulsion II at all settings due to the higher number density of liquid and solid droplets.
The collision rate after t = 5000 s is higher than at the beginning of the crystallization process, as the volume-based number density of particles increases with the increasing solid fraction. The result when multiplying both number densities reaches a maximum at ξ = 0.5. The magnitude of the collision kernel is much smaller than the magnitude of the number densities; therefore, the temporal decrease of the collision kernel does not affect the collision rate.
There is no dependency of the collision rate from the TW20 concentration visible for Emulsion I and II, which is in accordance with expectations; the initial droplet size does not differ for any TW20 concentrations tested for these emulsions, meaning that there should not be any impact of the DSD on h coll at any time. Nonetheless, only the data from Emulsion I are interpreted in the following, as Emulsion II always had to be prepared from scratch for each test and breakage of the droplets could not be ruled out during the tests. This also explains the larger uncertainties for Emulsion II.
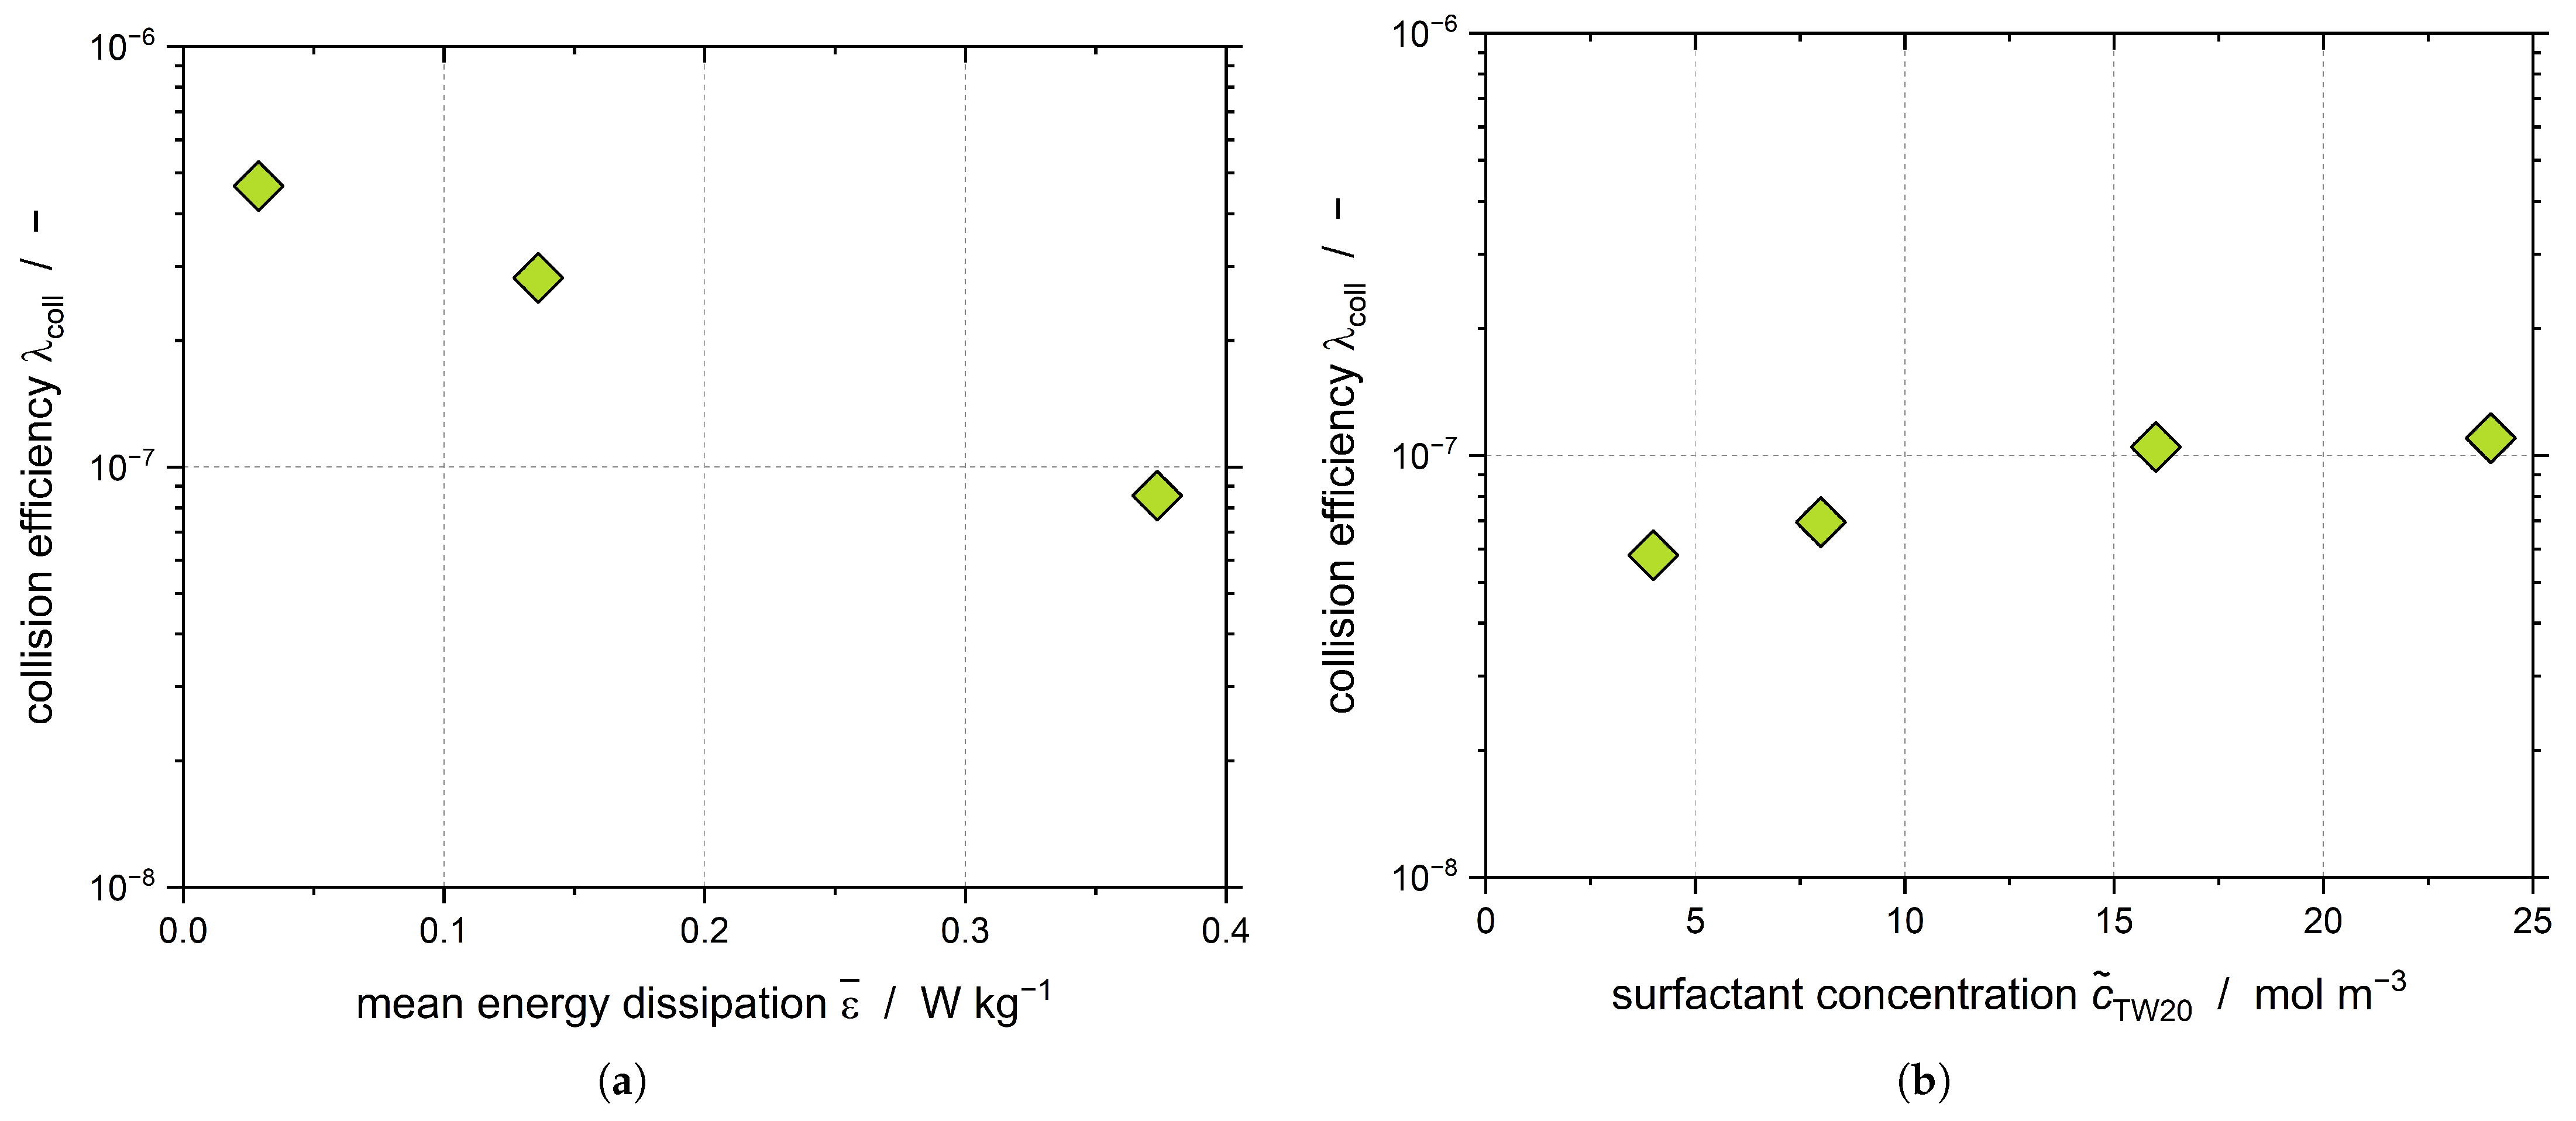
Assuming that CMN only takes place for t > 5000 s and that both primary and shear-mediated nucleation can be neglected, the collision efficiency of the CMN λ CMN can be evaluated (Figure 10).
We proved in our previous work that λ CMN decreases when increasing ε ¯ (Figure 10a), which is in good agreement with the data presented here [38]. As has been mentioned previously, increasing c ˜ TW 20 led to an increase of J 3 Exp , 5000 (Figure 4), whereas the evaluation of h coll did not show a dependency of h coll from c ˜ TW 20 (Figure 9c), as the DSD stayed the same. Therefore, the positive influence of the nanoparticles formed during the crystallization process must be visible in the collision efficiency λ coll (Figure 10b). However, it should be noted that the collisions occurring between nanoparticles and droplets were not considered in the calculation of h coll . Thus, the visible increase supports the hypothesis that the CMN not only takes place between droplets and particles but between nanoparticles and droplets.
Overall, it can be concluded that a higher energy input (increasing ε ¯ ) leads to higher nucleation rates; however, considering the increasing collision rate, the general efficiency of the collision decreases. If the obtained results are transferred to the industrial production of emulsions, the new findings can now be used to assess whether an increase in the power input with the given faster crystallization of the dispersed phase can compensate for the otherwise longer cooling phase. Moreover, the increase in ε ¯ is one option to guarantee a complete crystallization of the dispersed phase in case further subcooling is either too expensive or simply not feasible. This can be the case when tap water is used for cooling, as the maximum subcooling is limited by the temperature of tap water.

4. Conclusions

The influence of a turbulent flow on the course of crystallization of an oil-in-water emulsion was studied using ultrasound. In order to make our experiments comparable to the industrial manufacturing process of melt emulsions, the subcooling and energy input were varied. We found that none of the classical models for describing the crystallization kinetics could be applied, as a superposition of different nucleation mechanisms occurred. In addition to homogeneous primary nucleation due to the applied subcooling, shear-induced nucleation and CMN were detected. Our proposed 3Exp-model (Weibull model) was used to fit the time-dependent solid fraction of the emulsion droplets. It exhibited the highest fit quality ( R 2 > 0.95 ) for all of our experiments compared to other models described in the literature (e.g., 1Exp, 2Exp, …).
We were able to show for the first time in a stirred vessel that an increase in the mean energy dissipation (up to ε ¯ = 0.37 W kg−1) and of the micelle concentration in the continuous aqueous phase (up to c ˜ TW 20 mol m−3, equals 407 · c m c ) led to faster crystallization kinetics (up to two orders of magnitude), and consequently to shorter process times before complete crystallization of the dispersed phase. However, collision efficiency decreased as the number of collisions increased, even with higher energy input. Shear-induced nucleation was detected, especially at the beginning of crystallization, at large droplets sizes, and at high shear, and in addition to primary nucleation represented the main mechanism by which the first solid particles were formed. These were then required for CMN in the further crystallization process.
In conclusion, the findings of this study offer valuable insights for the application of our results to the industrial production of emulsions. Specifically, our research provides a foundation for evaluating the potential benefits of increasing power input in response to accelerated crystallization of the dispersed phase. This strategy may effectively offset the otherwise prolonged cooling phase, thereby optimizing the emulsion production process. Industrial emulsion production processes can be enhanced by acknowledging and leveraging these findings to achieve more efficient and reliable outcomes.

Author Contributions

Conceptualization, G.K.; methodology, G.K.; software, G.K.; validation, G.K. and L.E.; formal analysis, G.K. and L.E.; investigation, G.K. and L.E.; resources, M.K.; data curation, G.K. and L.E.; writing—original draft preparation, G.K. and L.E.; writing—review and editing, M.K.; visualization, G.K.; supervision, M.K. All authors have read and agreed to the published version of the manuscript.

Funding

This research received no external funding.

Institutional Review Board Statement

Not applicable.

Informed Consent Statement

Not applicable.

Data Availability Statement

All required data are included in the paper. Further data can be made accessible upon request.

Acknowledgments

We appreciate the invaluable support from the workshop staff at the Institute of Thermal Process Engineering, whose contributions were essential to the successful completion of this work. Furthermore, we acknowledge the experimental contributions made by Judith Klemm (Institute for Thermal Process Engineering). We acknowledge support by the KIT-Publication Fund of the Karlsruhe Institute of Technology.

Conflicts of Interest

The authors declare no conflict of interest.

Abbreviations

The following abbreviations are used in this manuscript:
cmccritical micelle concentration
CMNcontact-mediated nucleation
collcollision
critcritical
DSCdifferential scanning calorimetry
DSDdroplet size distribution
Expexponential
hexn-hexadecane
lliquid
lamlaminar
NMRnuclear magnetic resonance
primprimary
R e Reynolds number
ssolid
SAXSsmall-angle X-ray scattering
turbturbulent
TW20Tween20
W e Weber number

References

  1. Försters, T.; von Rybinsky, W. Applications of Emulsions. In Modern Aspects of Emulsion Science; Binks, B.P., Ed.; The Royal Society of Chemistry: London, UK, 1998. [Google Scholar]
  2. Hong, J.; Wang, Z.; Li, J.; Xu, Y.; Xin, H. Effect of Interface Structure and Behavior on the Fluid Flow Characteristics and Phase Interaction in the Petroleum Industry: State of the Art Review and Outlook. Energy Fuels 2023, 37, 9914–9937. [Google Scholar] [CrossRef]
  3. Köhler, K.; Hensel, A.; Kraut, M.; Schuchmann, H.P. Melt emulsification—Is there a chance to produce particles without additives? Particuology 2011, 9, 506–509. [Google Scholar] [CrossRef]
  4. Robins, M.; Hibberd, D. Emulsion Flocculation and Creaming. In Modern Aspects of Emulsion Science; Binks, B.P., Ed.; The Royal Society of Chemistry: London, UK, 1998. [Google Scholar]
  5. Kabalnov, A. Coalescence in Emulsions. In Modern Aspects of Emulsion Science; Binks, B.P., Ed.; The Royal Society of Chemistry: London, UK, 1998. [Google Scholar]
  6. Walstra, P.; Smulders, P. Emulsion Formation. In Modern Aspects of Emulsion Science; Binks, B.P., Ed.; The Royal Society of Chemistry: London, UK, 1998. [Google Scholar]
  7. Kloek, W.; Walstra, P.; van Vliet, T. Nucleation kinetics of emulsified triglyceride mixtures. J. Am. Oil Chem. Soc. 2000, 77, 643–652. [Google Scholar] [CrossRef]
  8. Coupland, J.N. Crystallization in emulsions. Curr. Opin. Colloid Interface Sci. 2002, 7, 445–450. [Google Scholar] [CrossRef]
  9. Agrawal, S.G.; Paterson, A.H.J. Secondary Nucleation: Mechanisms and Models. Chem. Eng. Commun. 2015, 202, 698–706. [Google Scholar] [CrossRef]
  10. Dickinson, E.; Kruizenga, F.J.; Povey, M.J.; van der Molen, M. Crystallization in oil-in-water emulsions containing liquid and solid droplets. Colloids Surf. A Physicochem. Eng. Asp. 1993, 81, 273–279. [Google Scholar] [CrossRef]
  11. Hindle, S.A.; Povey, M.J.W.; Smith, K. Kinetics of Crystallization in n-Hexadecane and Cocoa Butter Oil-in-Water Emulsions Accounting for Droplet Collision-Mediated Nucleation. J. Colloid Interface Sci. 2000, 232, 370–380. [Google Scholar] [CrossRef]
  12. Vanapalli, S.A.; Coupland, J.N. Emulsions under shear—The formation and properties of partially coalesced lipid structures. Food Hydrocoll. 2001, 15, 507–512. [Google Scholar] [CrossRef]
  13. Abramov, S.; Berndt, A.; Georgieva, K.; Ruppik, P.; Schuchmann, H.P. Investigation of the influence of mean droplet size and shear rate on crystallization behavior of hexadecane-in-water dispersions. Colloids Surf. A Physicochem. Eng. Asp. 2017, 529, 513–522. [Google Scholar] [CrossRef]
  14. Kaysan, G.; Schork, N.; Herberger, S.; Guthausen, G.; Kind, M. Contact-mediated nucleation in melt emulsions investigated by rheo-nuclear magnetic resonance. Magn. Reson. Chem. 2022, 60, 615–627. [Google Scholar] [CrossRef]
  15. Lagasse, R.R.; Maxwell, B. An experimental study of the kinetics of polymer crystallization during shear flow. Polym. Eng. Sci. 1976, 16, 189–199. [Google Scholar] [CrossRef]
  16. Mykhaylyk, O.O.; Chambon, P.; Impradice, C.; Fairclough, J.P.A.; Terrill, N.J.; Ryan, A.J. Control of Structural Morphology in Shear-Induced Crystallization of Polymers. Macromolecules 2010, 43, 2389–2405. [Google Scholar] [CrossRef]
  17. Yang, D.; Hrymak, A.N.; Kamal, M.R. Crystal Morphology of Hydrogenated Castor Oil in the Crystallization of Oil-in-Water Emulsions: Part II. Effect of Shear. Ind. Eng. Chem. Res. 2011, 50, 11594–11600. [Google Scholar] [CrossRef]
  18. Wang, Z.; Bai, Y.; Zhang, H.; Liu, Y. Investigation on gelation nucleation kinetics of waxy crude oil emulsions by their thermal behavior. J. Pet. Sci. Eng. 2019, 181, 106230. [Google Scholar] [CrossRef]
  19. Kaysan, G.; Rica, A.; Guthausen, G.; Kind, M. Contact-Mediated Nucleation of Subcooled Droplets in Melt Emulsions: A Microfluidic Approach. Crystals 2021, 11, 1471. [Google Scholar] [CrossRef]
  20. Kaysan, G.; Hirsch, T.; Dubil, K.; Kind, M. A Microfluidic Approach to Investigate the Contact Force Needed for Successful Contact-Mediated Nucleation. Colloids Interfaces 2023, 7, 12. [Google Scholar] [CrossRef]
  21. McClements, D.J. Ultrasonic determination of depletion flocculation in oil-in-water emulsions containing a non-ionic surfactant. Colloids Surfaces Physicochem. Eng. Asp. 1994, 90, 25–35. [Google Scholar] [CrossRef]
  22. DIN 28131; Deutsches Institution fuer Normung. Agitators and Baffles for Agitator Vessels. Types, Terms and Main Dimensions. Deutsches Institution fuer Normung: Berlin, Germany, 1992.
  23. Urick, R.J. A Sound Velocity Method for Determining the Compressibility of Finely Divided Substances. J. Appl. Phys. 1947, 18, 983–987. [Google Scholar] [CrossRef]
  24. Pinfield, V.J.; Povey, M.J.; Dickinson, E. The application of modified forms of the Urick equation to the interpretation of ultrasound velocity in scattering systems. Ultrasonics 1995, 33, 243–251. [Google Scholar] [CrossRef]
  25. Safety Data Sheet for n-Hexadecane. Available online: https://www.merckmillipore.com/DE/de/product/msds/MDA_CHEM-820633?Origin=PDP (accessed on 15 August 2023).
  26. McClements, D.J.; Dungan, S.R. Effect of Colloidal Interactions on the Rate of Interdroplet Heterogeneous Nucleation in Oil-in-Water Emulsions. J. Colloid Interface Sci. 1997, 186, 17–28. [Google Scholar] [CrossRef]
  27. Turnbull, D. Formation of Crystal Nuclei in Liquid Metals. J. Appl. Phys. 1950, 21, 1022–1028. [Google Scholar] [CrossRef]
  28. Turnbull, D. Kinetics of Solidification of Supercooled Liquid Mercury Droplets. J. Chem. Phys. 1952, 20, 411–424. [Google Scholar] [CrossRef]
  29. Turnbull, D.; Cormia, R.L. Kinetics of Crystal Nucleation in Some Normal Alkane Liquids. J. Chem. Phys. 1961, 34, 820–831. [Google Scholar] [CrossRef]
  30. McClements, D.; Dickinson, E.; Dungan, S.R.; Kinsella, J.E.; Ma, J.G.; Povey, M.J. Effect of Emulsifier Type on the Crystallization Kinetics of Oil-in-Water Emulsions Containing a Mixture of Solid and Liquid Droplets. J. Colloid Interface Sci. 1993, 160, 293–297. [Google Scholar] [CrossRef]
  31. McClements, D.J.; Dungan, S.R.; German, J.B.; Simoneau, C.; Kinsella, J.E. Droplet Size and Emulsifier Type Affect Crystallization and Melting of Hydrocarbon-in-Water Emulsions. J. Food Sci. 1993, 58, 1148–1151. [Google Scholar] [CrossRef]
  32. Dickinson, E.; Ma, J.; Povey, M.J.W. Crystallization kinetics in oil-in-water emulsions containing a mixture of solid and liquid droplets. J. Chem. Soc. Faraday Trans. 1996, 92, 1213. [Google Scholar] [CrossRef]
  33. McClements, D.J.; Han, S.W.; Dungan, S.R. Interdroplet heterogeneous nucleation of supercooled liquid droplets by solid droplets in oil-in-water emulsions. J. Am. Oil Chem. Soc. 1994, 71, 1385–1389. [Google Scholar] [CrossRef]
  34. McClements, J.D.; Dickinson, E.; Povey, M. Crystallization in hydrocarbon-in-water emulsions containing a mixture of solid and liquid droplets. Chem. Phys. Lett. 1990, 172, 449–452. [Google Scholar] [CrossRef]
  35. Perepezko, J.H.; Höckel, P.G.; Paik, J.S. Initial crystallization kinetics in undercooled droplets. Thermochim. Acta 2002, 388, 129–141. [Google Scholar] [CrossRef]
  36. Sear, R.P. Quantitative studies of crystal nucleation at constant supersaturation: Experimental data and models. CrystEngComm 2014, 16, 6506–6522. [Google Scholar] [CrossRef]
  37. Chesters, A.A. The modelling of coalescence processes in fluid-liquid dispersions: A review of current understanding. Chem. Eng. Res. Des. 1991, 69, 259–270. [Google Scholar]
  38. Kaysan, G.; Spiegel, B.; Guthausen, G.; Kind, M. Influence of Shear Flow on the Crystallization of Organic Melt Emulsions – A Rheo–Nuclear Magnetic Resonance Investigation. Chem. Eng. Technol. 2020, 43, 1699–1705. [Google Scholar] [CrossRef]
  39. Liao, Y.; Lucas, D. A literature review on mechanisms and models for the coalescence process of fluid particles. Chem. Eng. Sci. 2010, 65, 2851–2864. [Google Scholar] [CrossRef]
  40. Bąk, A.; Podgórska, W. Interfacial and surface tensions of toluene/water and air/water systems with nonionic surfactants Tween 20 and Tween 80. Colloids Surf. A Physicochem. Eng. Asp. 2016, 504, 414–425. [Google Scholar] [CrossRef]
  41. Elfgen, R.; Hollóczki, O.; Kirchner, B. A Molecular Level Understanding of Template Effects in Ionic Liquids. Accounts Chem. Res. 2017, 50, 2949–2957. [Google Scholar] [CrossRef] [PubMed]
  42. Spiegel, B. Kristallisation in Emulsionen. Ph.D. Thesis, Karlsruhe Institute of Technology, Karlsruhe, Germany, 2019. [Google Scholar]
  43. Kaysan, G.; Kräling, R.; Meier, M.; Nirschl, H.; Guthausen, G.; Kind, M. Investigation of the surfactant distribution in oil-in-water emulsions during the crystallization of the dispersed phase via nuclear magnetic resonance relaxometry and diffusometry. Magn. Reson. Chem. 2022, 60, 1131–1147. [Google Scholar] [CrossRef]
  44. El Rhafiki, T.; Kousksou, T.; Jamil, A.; Jegadheeswaran, S.; Pohekar, S.D.; Zeraouli, Y. Crystallization of PCMs inside an emulsion: Supercooling phenomenon. Sol. Energy Mater. Sol. Cells 2011, 95, 2588–2597. [Google Scholar] [CrossRef]
  45. Schuchmann, H.P.; Danner, T. Emulgieren: Mehr als nur Zerkleinern. Chem. Ing. Tech. 2004, 76, 364–375. [Google Scholar] [CrossRef]
  46. Walstra, P. Physical Chemistry of Foods; Food Science and Technology; Marcel Dekker: New York, NY, USA, 2003; Volume 121. [Google Scholar]
  47. Hinze, J.O. Fundamentals of the hydrodynamic mechanism of splitting in dispersion processes. AIChE J. 1955, 1, 289–295. [Google Scholar] [CrossRef]
  48. Tjaberinga, W.J.; Boon, A.; Chesters, A.K. Model experiments and numerical simulations on emulsification under turbulent conditions. Chem. Eng. Sci. 1993, 48, 285–293. [Google Scholar] [CrossRef]
Figure 1. (a) Droplet size distribution shown as a cumulative sum distribution for Emulsion I and II immediately after emulsion production and after one crystallization and thawing cycle. Note that the two curves for Emulsion I exhibit an overlap, indicating that no change occurred in the DSD. (b) Microscopic pictures of Emulsion I (top) and Emulsion II (bottom). Note the different scale bars.
Colloids 07 00068 g001
Figure 2. Hysteresis of the speed of sound recorded during the cooling and heating of an emulsion. Both the melting and the crystallization of the droplets are visible. The dashed lines represent the exponential model that was fitted to the data (Equation (3)).
Colloids 07 00068 g002
Figure 3. Time-dependent evolution of the solid fraction of the dispersed phase of Emulsion I at different subcoolings T . An increase in the subcooling, and consequently a lower absolute temperature, led to faster crystallization of the droplets (Emulsion I, ε ¯ = 0.37 W kg−1, c ˜ TW 20 = 16 mol m−3). Here, ξ = 0 refers to an emulsion with only liquid droplets, whereas ξ = 1 represents an emulsion with only solid particles as the dispersed phase (=suspension).
Colloids 07 00068 g003
Figure 4. Increase of solid fraction of the dispersed phase with process time (at constant subcooling) when using different surfactant concentrations (Emulsion I, ε ¯ = 0.37 W kg−1, T = 15.2 K ± 0.1 K).
Colloids 07 00068 g004
Figure 5. (a) The initial nucleation rate J 3 Exp , 0 ; (b) the nucleation rate after 5000 s J 3 Exp , 5000 ; and (c) the shape parameter α for an emulsion with x 50 , 3 = 2.9 μ m for TW20 concentrations with increasing subcooling. The nucleation rates for primary nucleation only are presented in red. The 95% confidence interval of the primary nucleation data is provided when fitting them with a linear fit in the presented semi-logarithmic plotting. (d) J 3 Exp , 0 and J 3 Exp , 5000 at a constant subcooling of T = 15.2 ± 0.1 K. All data points presented here refer to Emulsion I. All parameters presented in (ad) were determined by fitting the 3Exp model (Equation (14)) to the time-dependent solid fraction of the dispersed phase.
Colloids 07 00068 g005
Figure 6. (a) Initial nucleation rate J 3 Exp , 0 and nucleation rate after 5000 s J 3 Exp , 5000 ; (b) shape parameter α for Emulsion I stabilized with 407 · c m c TW20 ( ε ¯ = 0.37 W kg−1, c ˜ TW 20 = 24 mol m−3, T = 15.2 K ± 0.1 K).
Colloids 07 00068 g006
Figure 7. Comparison of (a) the initial nucleation rate J 3 Exp , 0 and (b) the nucleation rate after 5000 s J 3 Exp , 5000 for Emulsion I ( x 50 , 3 = 2.9 μ m, square) and Emulsion II ( x 50 , 3 = 14.8 μ m, circle) ( ε ¯ = 0.37 W kg−1, c ˜ TW 20 = 7.2–7.9 mol m−3, T = 15.2 K ± 0.1 K).
Colloids 07 00068 g007
Figure 8. Weber numbers for Emulsion I (a) and Emulsion II (b) calculated according to Equation (22).
Colloids 07 00068 g008
Figure 9. The collision kernel β turb , l , s as a function of (a) the energy dissipation rate ε ¯ and (b) the TW20 concentration c ˜ TW 20 . The collision rate h coll is shown as a function of (c) the energy dissipation rate and (d) the TW20 concentration c ˜ TW 20 .
Colloids 07 00068 g009
Figure 10. The collision efficiency λ CMN of Emulsion I as a function of (a) the energy dissipation rate ε ¯ and (b) the TW20 concentration c ˜ TW 20 .
Colloids 07 00068 g010
Table 1. Dimensions of the stirred vessel and the stirring element with specifications according to DIN 28131 [22].
DIN 28131Value
diameter stirred vessel d 1 / m m -150
diameter stirring element d 2 / m m ≈(0.3 to 0.4 ) · d 1 50=0.33 · d 1
width of stirrer blades b 1 / m m ≈0.25 · d 2 12=0.24 · d 2
height of stirrer blades h 1 / m m ≈0.2 · d 2 10=0.2 · d 1
distance of stirring element to tank bottom h 2 / m m ≈1 · d 2 28=0.56 · d 2
width of baffles b 2 / m m ≈0.1 · d 1 15=0.1 · d 1
tank wall spacing of baffle b 3 / m m ≈0.02 · d 1 3=0.02 · d 1
number of stirrer blades z 1 /- 6 6
number of baffles z 3 /- 2 4
Disclaimer/Publisher’s Note: The statements, opinions and data contained in all publications are solely those of the individual author(s) and contributor(s) and not of MDPI and/or the editor(s). MDPI and/or the editor(s) disclaim responsibility for any injury to people or property resulting from any ideas, methods, instructions or products referred to in the content.

