Article

A Molecular View of the Surface Pressure/Area Per Lipid Isotherms Assessed by FTIR/ATR Spectroscopy

Applied Biophysics and Food Research Center (Centro de Investigaciones en Biofisica Aplicada y Alimentos, CIBAAL, Laboratory of Biointerphases and Biomimetic Systems, National University of Santiago del Estero and CONICET), RN 9-Km 1125, Santiago del Estero 4206, Argentina
*
Author to whom correspondence should be addressed.
Colloids Interfaces 2022, 6(4), 54; https://doi.org/10.3390/colloids6040054
Submission received: 5 September 2022 / Revised: 3 October 2022 / Accepted: 8 October 2022 / Published: 11 October 2022
(This article belongs to the Special Issue Biocolloids and Biointerfaces)

Abstract

:
The macroscopic behavior of a lipid monolayer in terms of packing and compressibility properties is classically obtained from surface pressure/area per molecule isotherms. Molecular interpretations trying to fit the II/A curves have been attempted by molecular dynamics. In this regard, the simulation is performed by introducing parameters accounting for the lipid-lipid interaction in the monolayer plane. However, water, as an essential component of the interfacial phenomena, is not explicitly included in terms of molecular arrays. This drawback appears to be a consequence of the lack of experimental evidence that may complement the macroscopic view with the microscopic features. In this work, we propose that II/A curves can be reproduced from microscopic molecular data obtained with FTIR/ATR spectroscopy. The changes in surface pressure, in fact, changes in the surface tension of the lipid–water interphase, can be related to the acyl regions exposed to water and evaluated by the ratio of isolated-to-connected CH2 populations. In turn, the area changes correspond to the variations in the primary and secondary hydration shells of the phosphate region. The isolated/connected CH2 ratio represents the extension of the non-polar region exposed to water and is linked to the resulting water surface tension. The area per lipid is determined by the excluded volume of the hydration shells around the phosphate groups in correlation to the carbonyl groups. The derivative of the frequencies of the -CH2 groups with respect to the water content gives an insight into the influence of water arrangements on the compressibility properties, which is important in understanding biologically relevant phenomena, such as osmotic stress in cells and the mechanical response of monolayers. It is concluded that the water population distributed around the different groups dominates, to a great extent, the physical properties of the lipid membranes.

1. Introduction

Lipid monolayers spread on an air-aqueous solution are one of the systems most frequently used to study the physicochemical properties of lipid membranes [1,2,3].
In such a system, compression of the monolayer is achieved by displacing a mobile barrier and registering the surface pressure increase, which is defined by the difference between the surface tension of pure water (γ°) and the surface tension with the lipids (γ):
II = γ° − γ.
The classical interpretation of the II/area per molecule is found by considering the lipids as a bidimensional gas. In this regard, the molecular interpretation is derived considering lipid-lipid interactions as in a real gas [3,4].
However, the description of the lipid membrane under such an approach does not take into account that lipids interact with the water phase and that such interactions disregard water as an active component of the lipid monolayer [4].
A theoretical frame in terms of the thermodynamics of irreversible processes (TIP) has explicitly introduced water-lipid and lipid–water interactions which reflect a more realistic picture of the lipid monolayer. Moreover, this approach allows the comparison of the properties with other biomimetic systems such as bilayers in lipid vesicles [4].
A correlation of that thermodynamic behavior with the molecular view was proposed along with the calculation of activity coefficients which reflect the degrees of freedom of water molecules assessed by the measurement of water polarization [5,6].
However, a direct measure of the water-lipid interaction at the molecular level that could account for the macroscopic behavior of the monolayer has not been evaluated.
Recent molecular dynamics studies have concluded that water can organize in a region of around 12 Å thick, from the first 3–4 C atoms in the acyl chains and beyond the phosphate groups, depending on the groups bound to it (choline, ethanolamine, glycerol, etc.) [7]. In this regard, a series of papers based on SAXS analysis has shown that water stabilizes in a region beyond the carbonyl groups [8,9]. Details of the hydration in the interphase at a molecular level have been obtained by FTIR/ATR spectrometry. It has been shown that CO, PO and CH2 residues of the lipids have different patterns of hydration according to chain length and saturation [10]. Moreover, it has been determined that the hydration of these sites is nonindependent, which denotes that the water dynamics, in terms of the exchange of hydration and confined water, contribute to cooperative and synergic phenomena [10].
Biological function depends on a delicate interplay between the biomolecule, e.g., a lipid molecule, and its water-based environment [11]. Consequently, the assignment of a functional role to the membrane hydration needs details for the structural features in correlation to the thermodynamic response [12,13,14]. Details of the surface structure and topography in connection with its thermodynamic state and response would be important in understanding the effects of different biologically relevant compounds on membrane behavior.
A way to evaluate this correlation is to analyse the surface pressure/molecular area in monolayers, in correspondence with microscopic data obtained by FTIR spectroscopy.
It is expected that the thermodynamics and mechanical properties of lipid monolayers would have their molecular counterpart highlighting the interaction of water with the different chemical residues, such as polar groups PO and CO and non-polar -CH2 groups, in the acyl chains.
With this base, the purpose of this paper is to give molecular insight into water organization congruent with the thermodynamic properties emerging from the surface pressure/area curves. In particular, the relationship of surface tension with water properties. FTIR analysis reports the behavior of acyl chains and phosphate groups along hydration and dehydration processes that may mimic the expansion and compression of monolayers.
The results indicate that at different levels of hydration, the lipid–water interaction is modulated by the different exposure of the acyl chains to water, which may explain the variation in the surface tension in compression–expansion processes.

2. Materials and Methods

2.1. Lipids and Chemicals

1,2-dipalmitoyl-sn-glycero-3-phosphocholine (DPPC-16:0) was purchased from Avanti Polar Lipids Inc. (Alabaster, AL). The purity of the lipid was higher than >99% as checked by FTIR and UV spectroscopies. Stocks of phospholipid solutions in chloroform were quantified by determining inorganic phosphorus. Aqueous solutions were prepared with ultrapure water (conductivity = 0.002–0.010 mS cm−1) obtained from an OSMOION 10.2 water purification system (APEMA, Buenos Aires, Argentina).

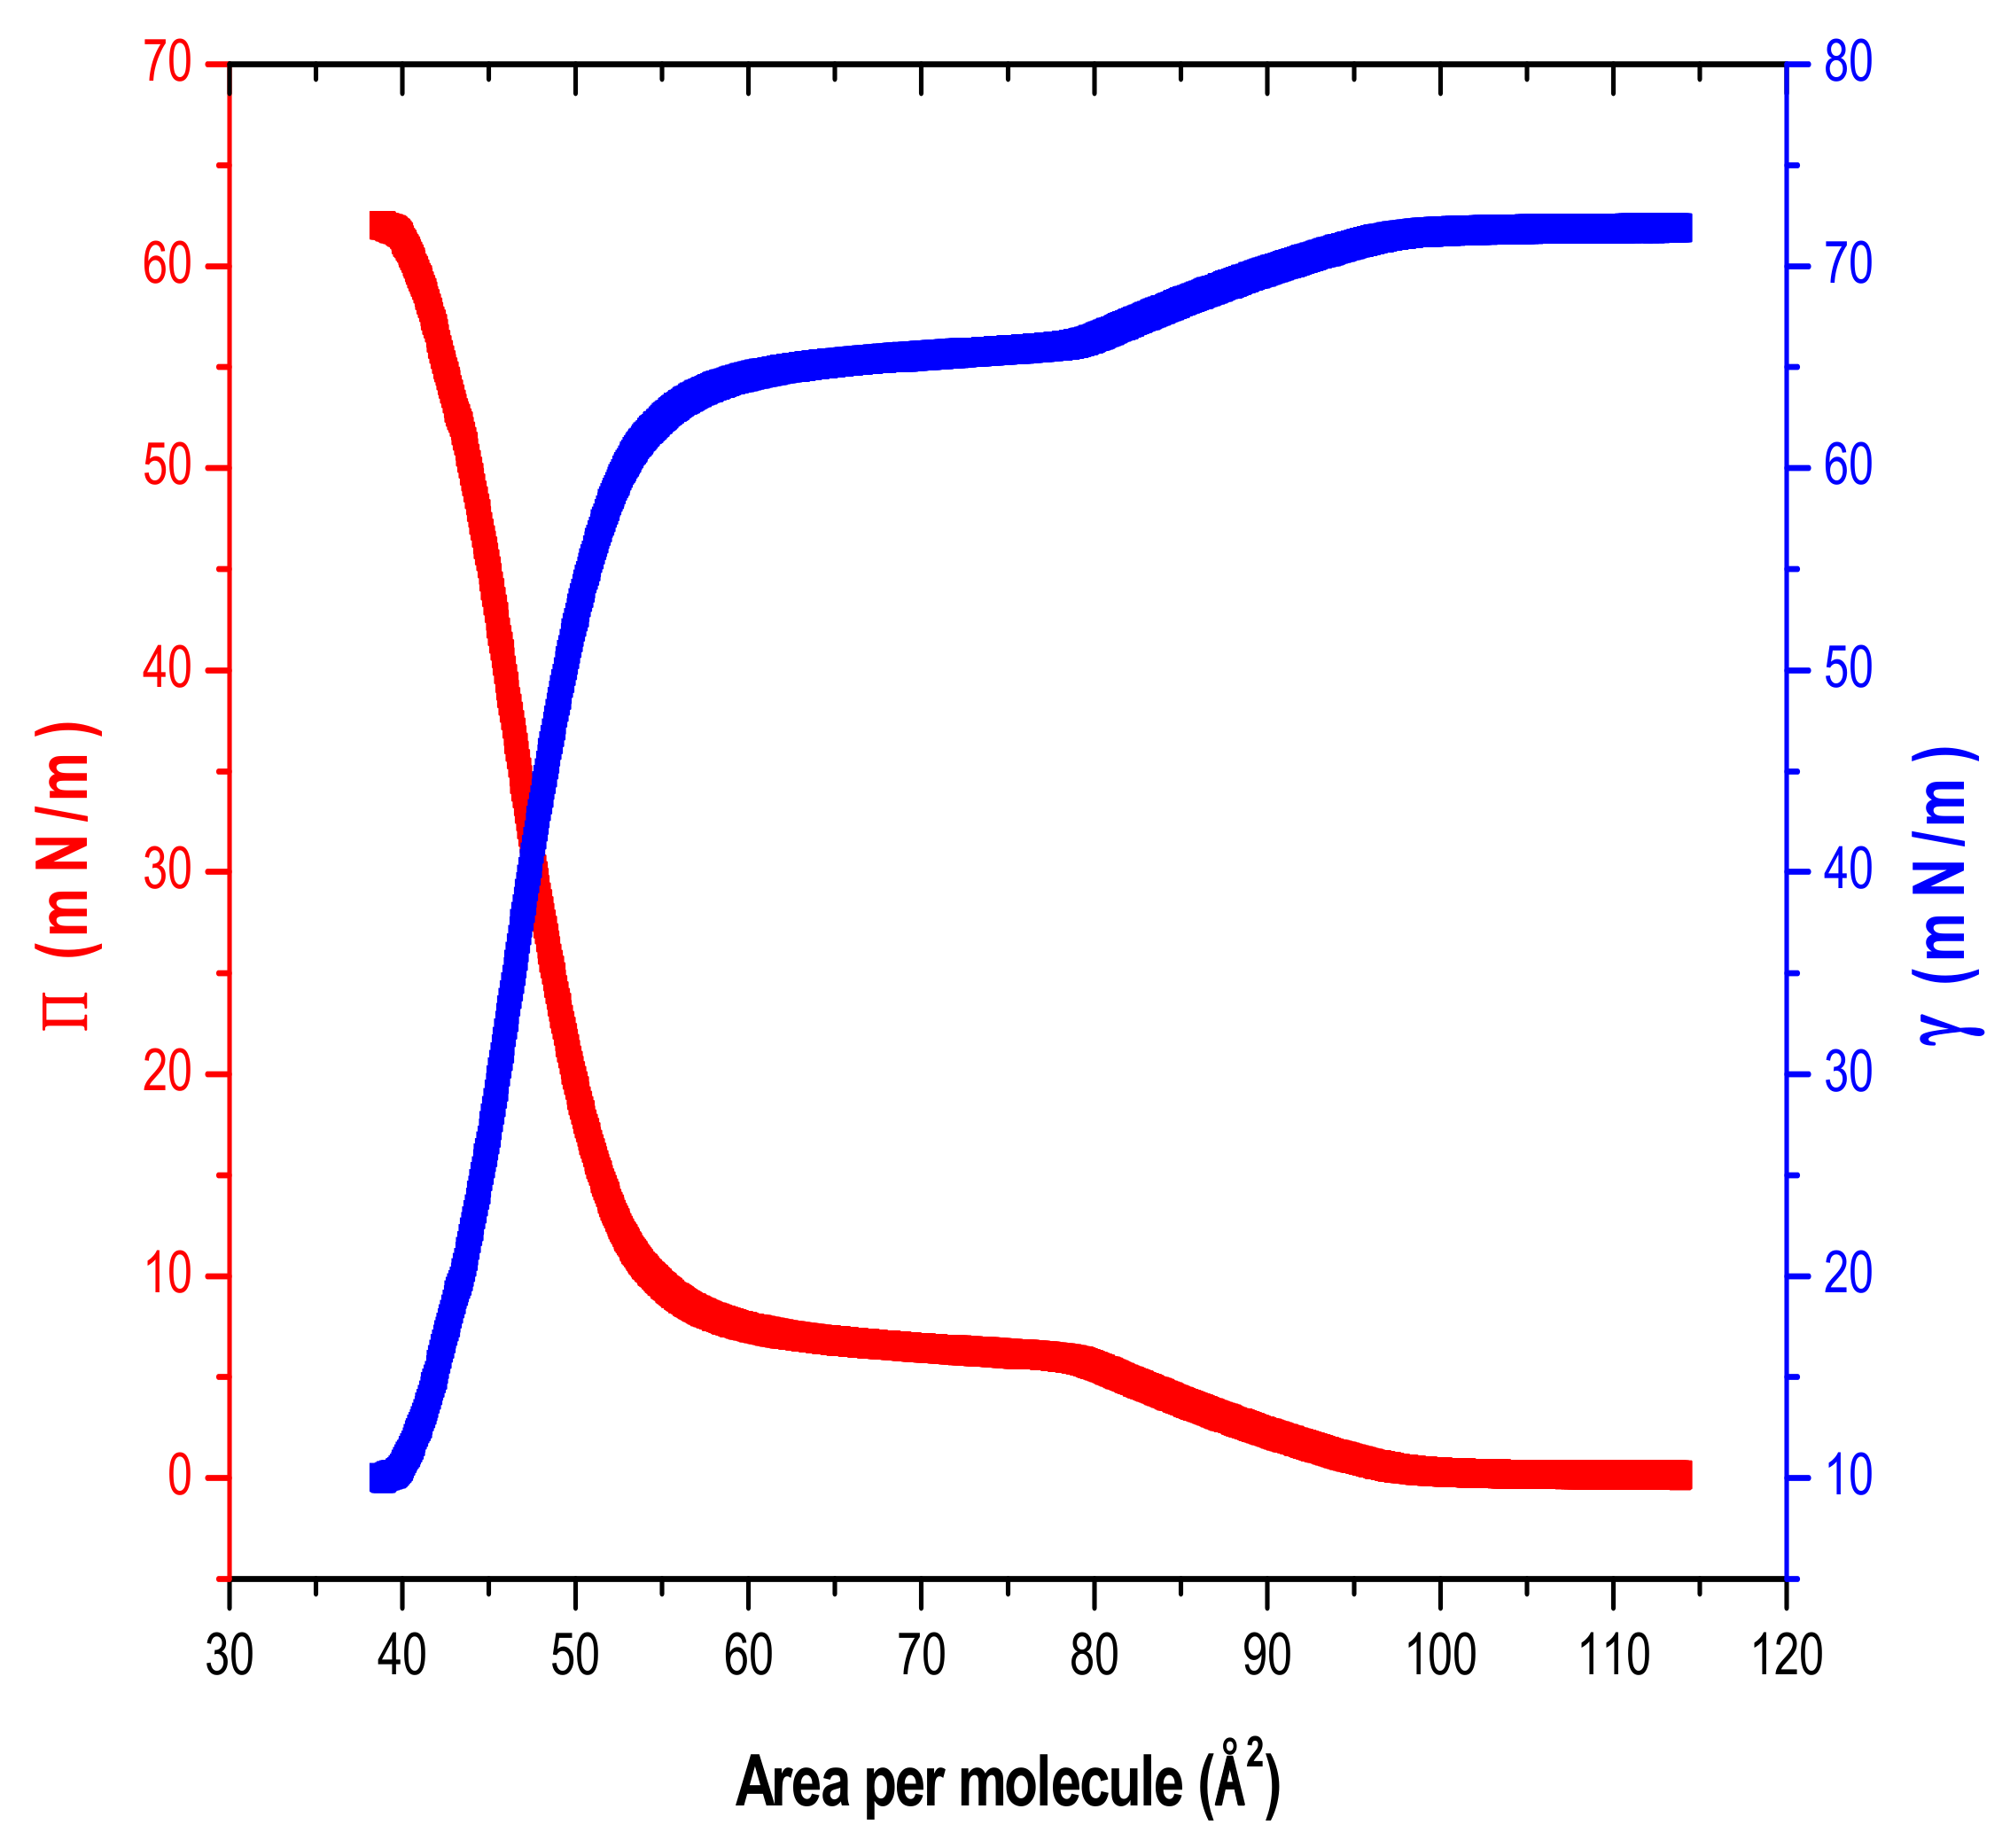
2.2. Surface Pressure vs. Area per Molecule of Lipid Monolayers

Changes in the surface pressure vs. area curves were obtained in a KSV NIMA LB trough (surface area = 240.00 cm2), using a PT Wilhelmy plate (39.24 mm2) as a sensor. The surface of the Teflon trough containing the aqueous solution (subphase) was exhaustively cleaned, and the platinum probe was flamed until glowing red hot before each assay. In all assays, a fixed volume of 1 mM KCl solution (pH 5) was added, checking that the borders of the meniscus were even around the whole perimeter. The whole equipment was enclosed in an acrylic box to minimize water evaporation and to avoid contamination from the environment during the study.
Accurate volumes of 2mM lipid solution in chloroform were spread on the aqueous solution surface using a Hamilton micro syringe. The lipids were allowed to stabilize for long enough to ensure the complete evaporation of the chloroform. After stabilization, the total area of the trough was varied by compression at a constant rate of 2 mm/min with a mobile barrier. In order to define the surface pressure/water activity pairs at each area, the rate of compression was accurately controlled.

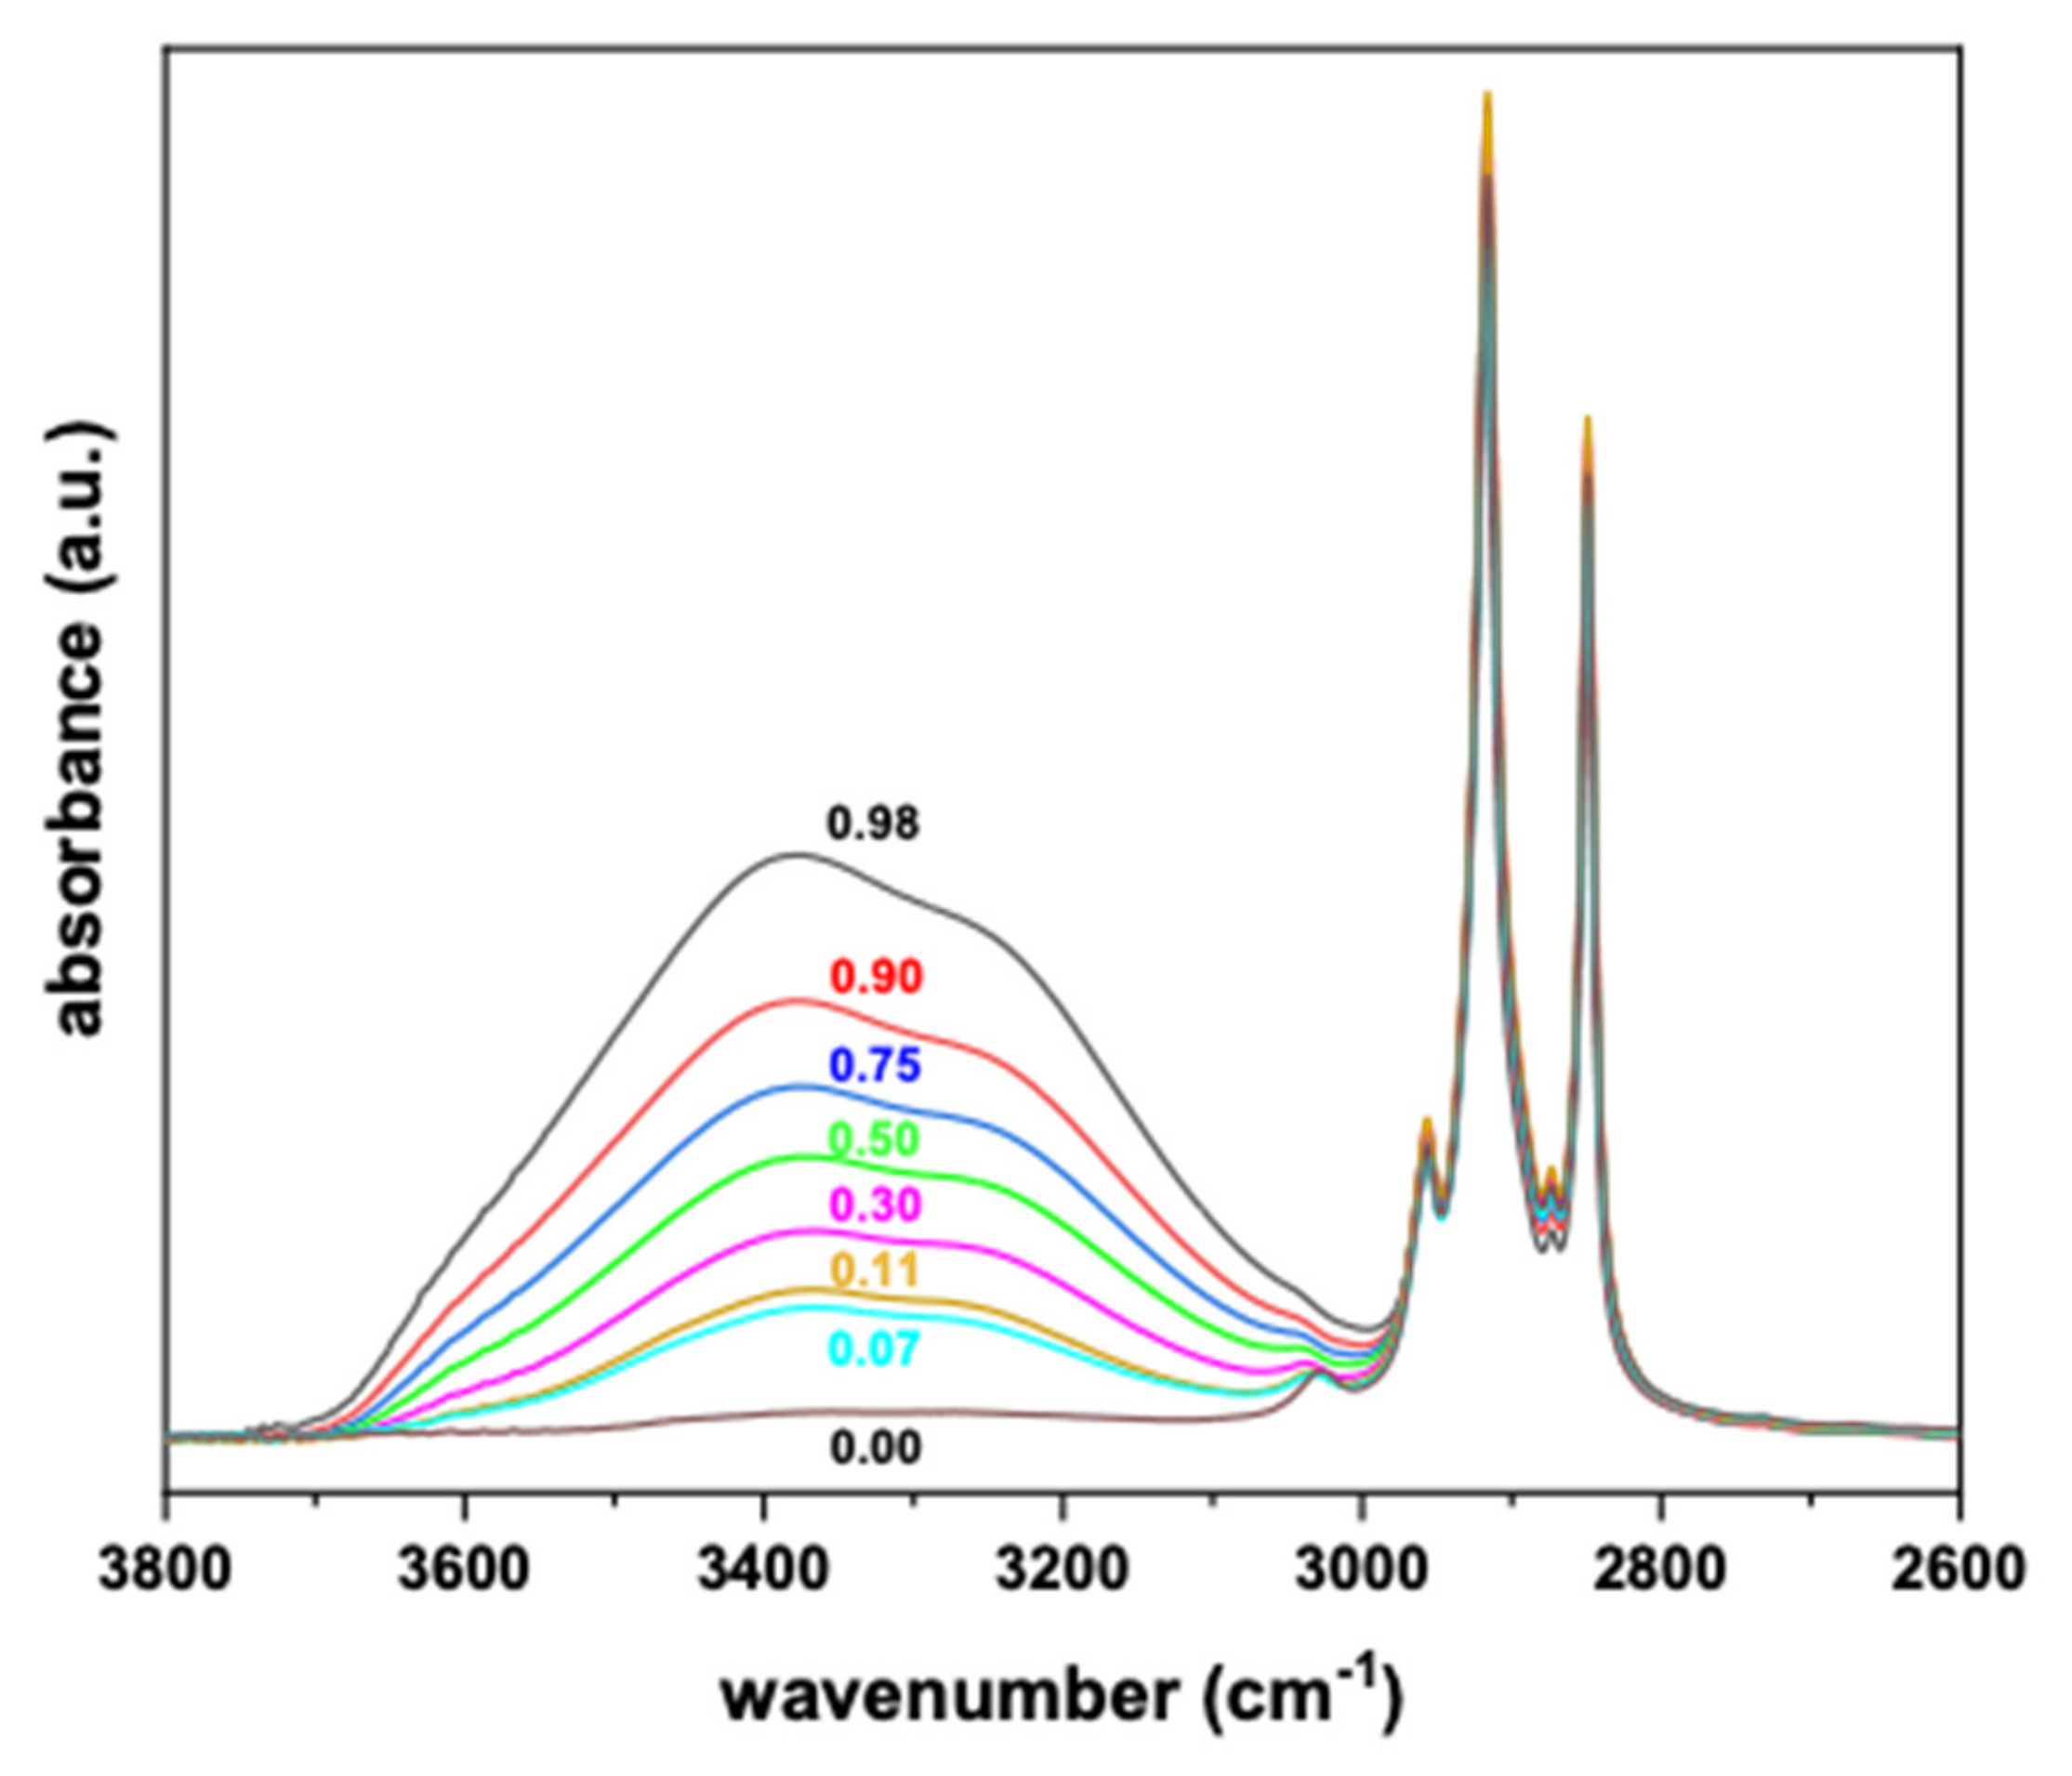
2.3. ATR-FTIR Spectroscopy
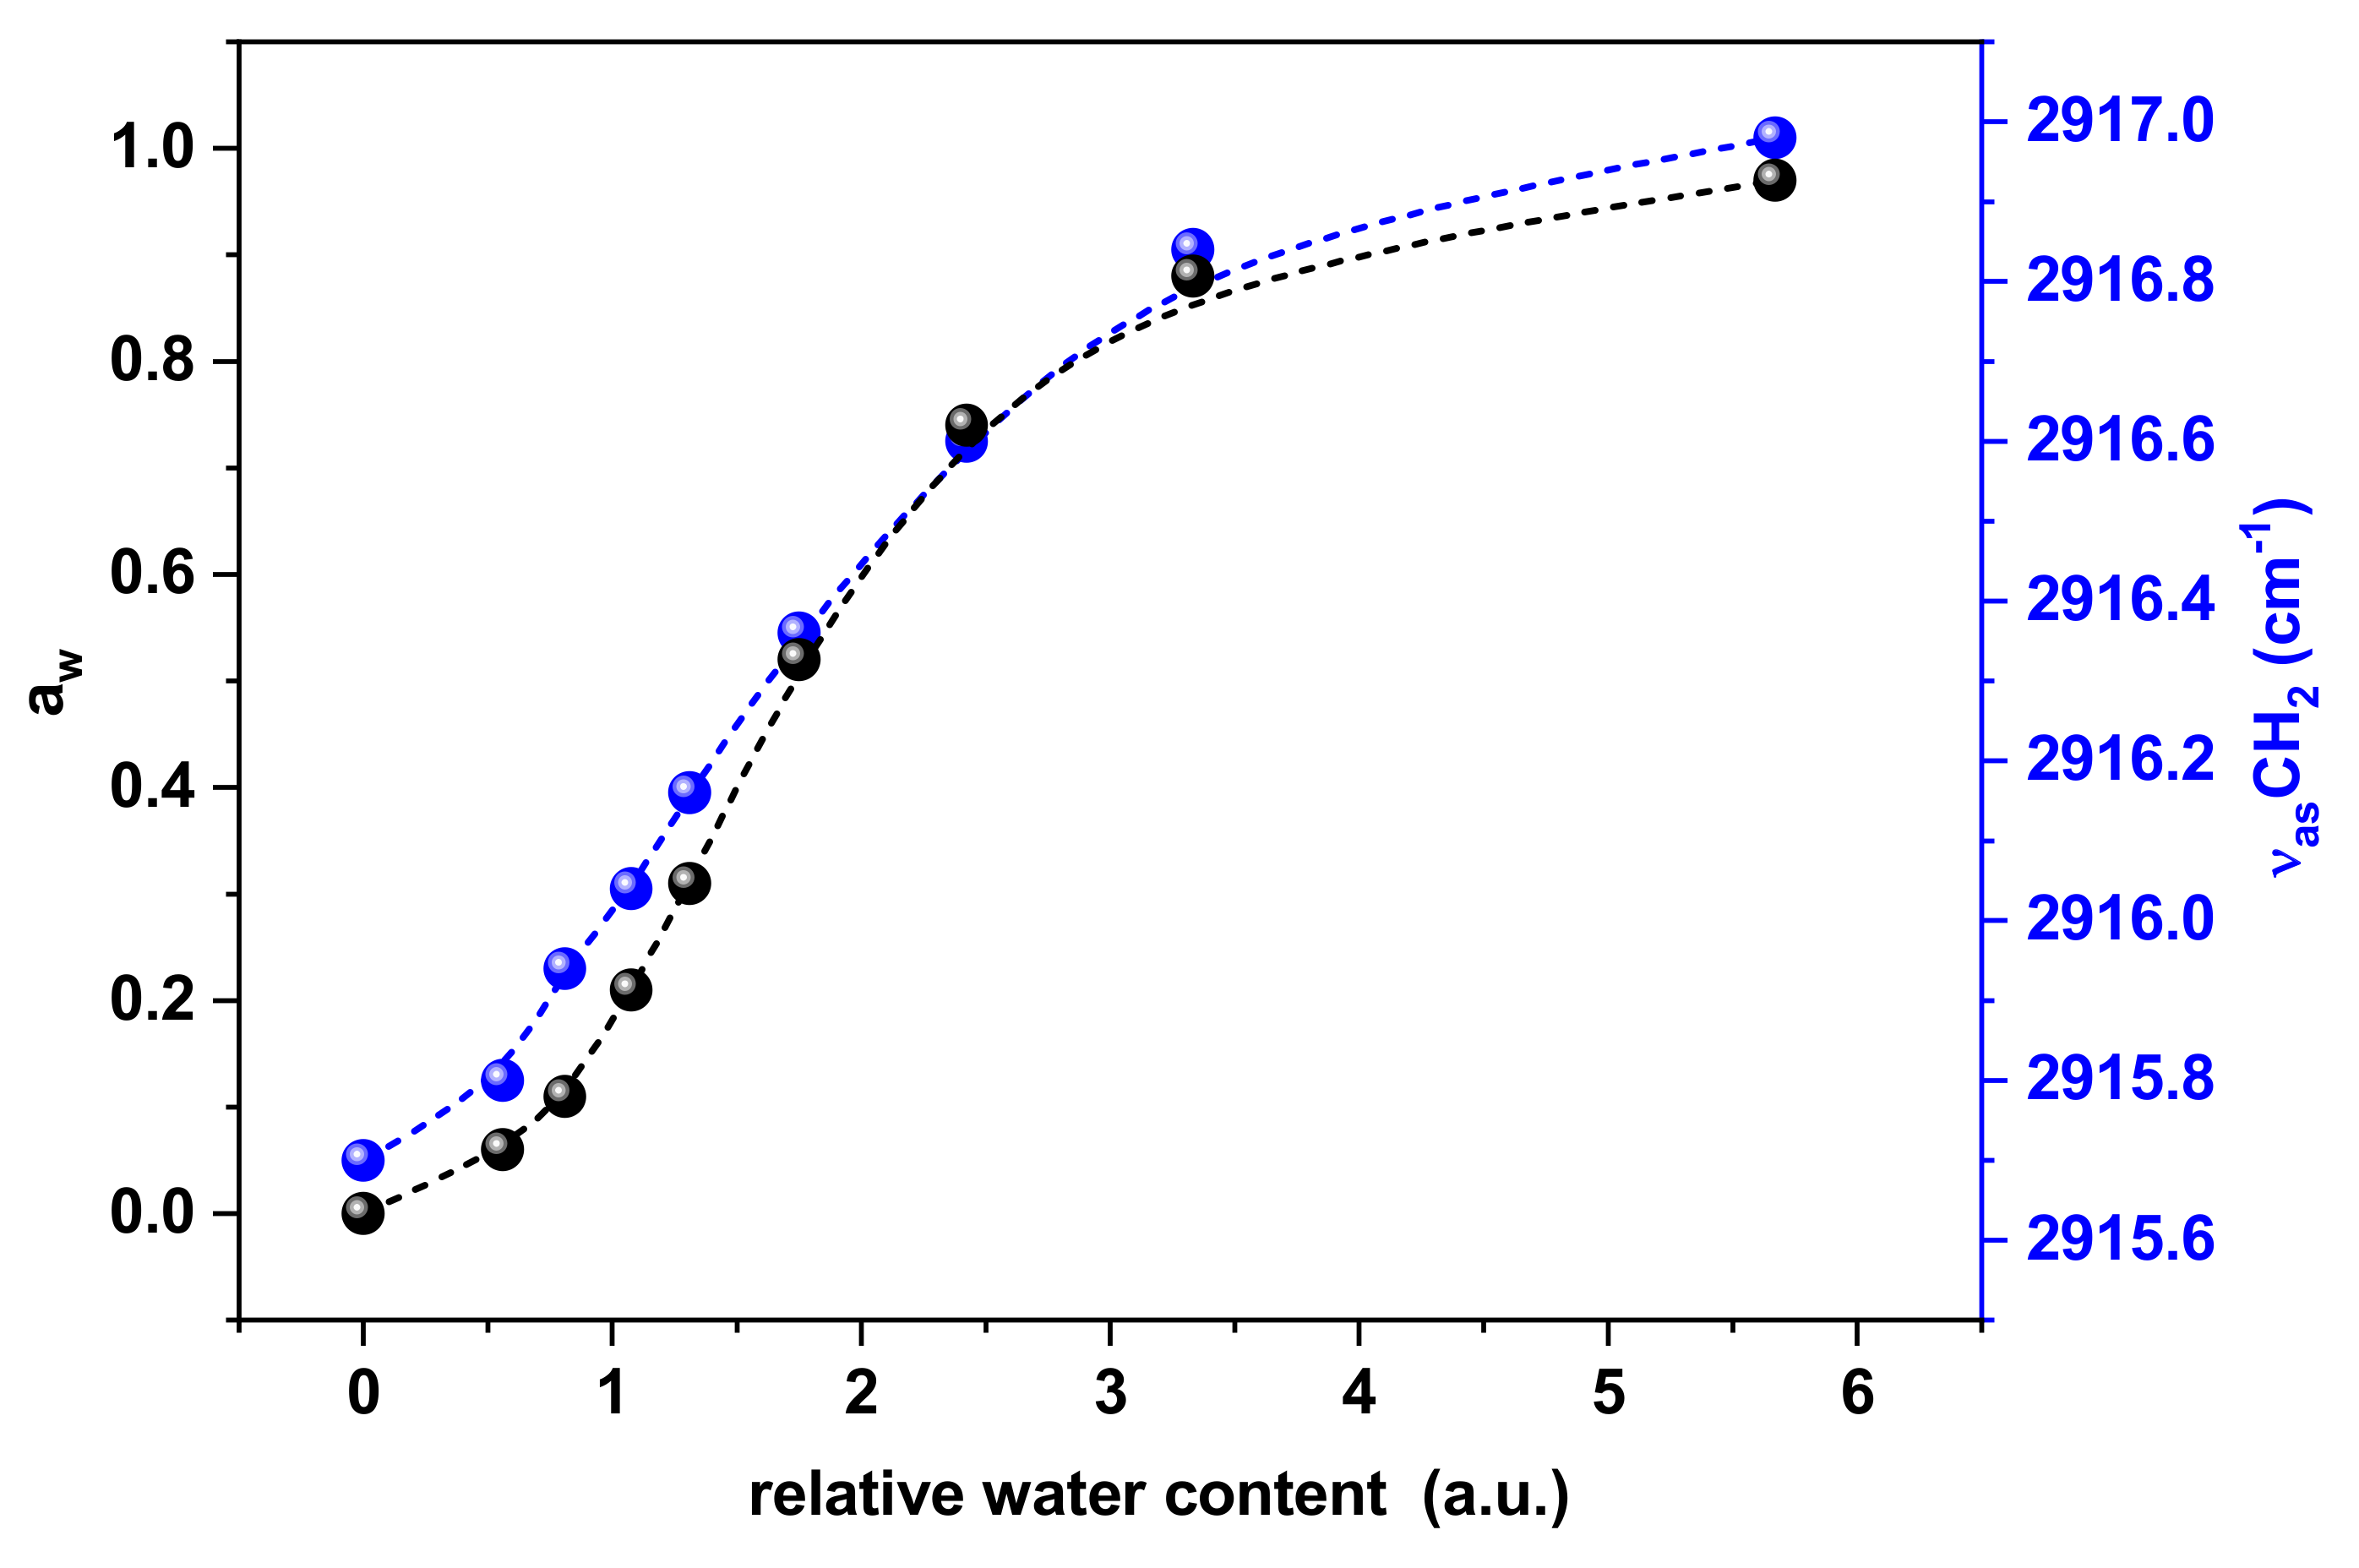
All Attenuated Total Reflection ATR-FTIR spectra were obtained in a Thermo Scientific (Waltham, MA, USA) 6700 spectrometer (assembled with an ATR accessory and a deuterated triglycine sulfate (DTGS) KBr detector, connected to a dry air circulation system to avoid the interference of water vapor and carbon dioxide.
Water activity and temperature control:
Samples were equilibrated in a closed receptacle with an atmosphere of saturated salt solutions at a known vapor pressure and control temperature.
In order to ensure the water activity values given by the saturated salt solutions, a Novasina Thermoconstanter water activity meter sensor was placed in a self-made aluminum chamber, sealed to assure the equilibrium between the sample and saturated solutions. The samples were allowed to stabilize at each relative humidity [15,16,17].
Droplets (2 µL) of each suspension were placed on a diamond crystal (45° incident angle), coupled/assembled in a self-made aluminum chamber to control the temperature using an externally circulated bath.
Data were obtained after 64 scans per sample at a 2 cm−1 resolution corresponding to the average of three independent assays for each setting of humidity and temperature.
Spectra were analyzed with Omnic Software (version 9.1.24) and the Microcal Origin program (version 8.5). This software mathematically processed the spectra, and the peak maxima were determined by the Omnic to find peak function routine, resulting in an accuracy of 0.1 cm−1 which gives statistically reliable data [18,19].
The relative water content parameter was obtained from Figure 1 using the relationship between the –OH stretching band area of water (3700–3000 cm−1) and the methyl and methylene stretching bands (3000–2800 cm−1).
R e l a t i v e   w a t e r   c o n t e n t = w a t e r O H   s t r e t c h i n g   b a n d   a r e a m e t h y l   a n d   m e t h y l e n e   s t r e t c h i n g   b a n d   a r e a

3. Results

Surface Tension and Water Activity Curves
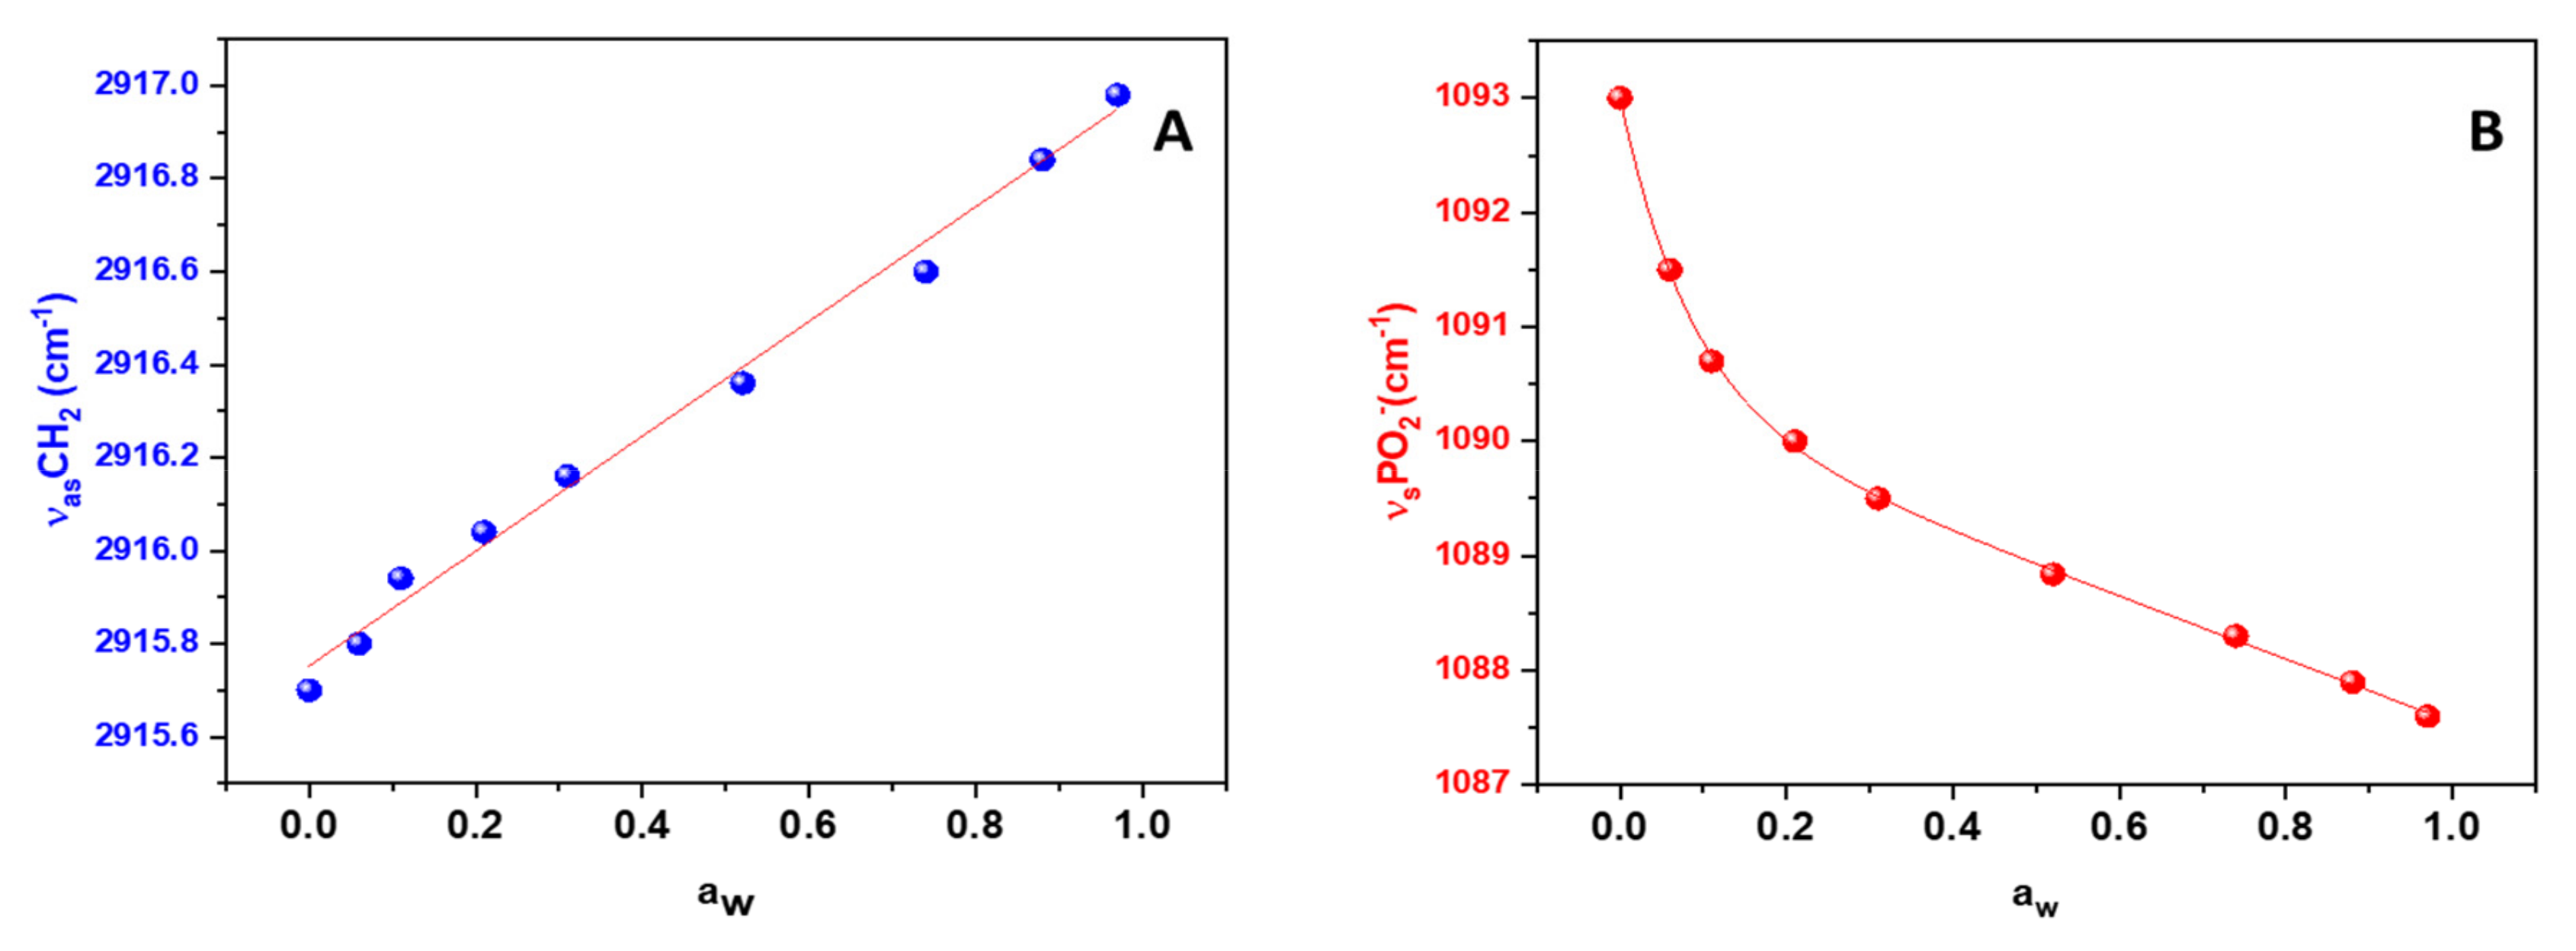
The classical surface pressure/area per lipid is shown in Figure 2 for DPPC below the critical temperature (Tc). It is observed that in the range between 50 and 80 A2, surface pressure remains constant due to the coexistence of liquid expanded and liquid condensed phases. The critical temperature is the transition between liquid expanded and liquid condensed phases where coexistence is not observed.
In the same Figure, the changes in the surface tension at different areas are plotted considering that the relationship between surface pressure and surface tension is given by:
π = γ° − γ.
The surface tension is a more specific thermodynamic property that reflects the surface free energy. The increase in the surface tension with the increase in the area indicates the exposure of water on the surface since the lipid concentration decreases. At higher areas, the influence of the lipid is null and thus surface tension equals that of pure water.
In terms of structural parameters, analogous curves can be derived from the adsorption isotherm of water to lipids (Figure 3). It is observed that the water activity increased to 1 (pure water) with the water content of the membrane.
It is observed that the aw data overlaps with that corresponding to the ν CH2 frequency. This shows a linear variation of CH2 frequency with aw.
In order to avoid any artifact occurring in the reading of the spectral bands, the analysis of vasCH2 frequencies at different hydration degrees was performed using deuterated water (where the O-D stretching band is situated at lower wavenumbers than CH2 bands). Thus, measurements in the CH region can be decoupled from the water bands. These controls showed that at higher hydrations, the CH2 frequencies exhibited higher values in D2O or H2O, demonstrating that water content at different water activities affects the hydrocarbon region without fitting artifacts.
The data are shown as Supplementary Material (Figure S1).
The correspondence between the effect on the acyl chains and water activity is better visualized in Figure 4A in which aw varies linearly with the frequency change in the CH2 groups. However, this correspondence is not observed in the phosphate groups (Figure 4B). This means that the physical changes produced by the water on the membrane can be sensed directly through the evaluation of the CH2 frequencies, i.e., the groups near which the water structure is reinforced. In contrast, the hydration of PO2, where water is tightly bound and abandoning the water structure network, shows a complex behavior.
The derivative of the surface tension curve in Figure 2, plotted as a function of area per molecule, denotes a maximum at 45 Å2 below Tc (Figure 5A). A similar trace is obtained when the derivative of the aw data (part B) and -CH2 frequency data (part C) from Figure 3 are plotted as a function of the water content.

4. Discussion

Surface Tension and CH2 Exposure:

According to the present results, the behavior of a lipid monolayer isotherm measured by surface tension can be reasonably interpreted in molecular terms if the frequency of the CH2 groups is considered. The ν CH2 frequency is related to the constant force of the CH bond (k) by the following equation:
ν = 1 2 π k µ
where µ is the reduced mass.
It has been shown previously that the frequency corresponding to the -CH2 groups increases with temperature or water content, which reflects a strengthening of the -CH bonds. This is interpreted to be due to the separation of the -CH2 groups of adjacent lipids by the presence of water. Therefore, two -CH2 populations can be noted: one connected (in contact without water) and the other one isolated (water interposed between chains) [14].
Thus, the strength of the bond is affected by the intermolecular interaction between chains, i.e., of the distance between the CH2 groups, which is concomitant with the increase in organized water along the chains, visualized macroscopically by an increase in surface tension.
The inspection of Figure 2 and Figure 3 indicates that at the highest area, aw = 1, the frequency νCH2 attains the maximum values, reflecting the major ratio of isolated CH2 populations. In this case, the value of surface tension corresponds to pure water (γ° = 72 dynes/cm).
Alternatively, at the lowest areas, aw = 0, and no water between chains is present, representing the maximum value of connected populations, given by the minimum value of frequency. At this point, the surface tension approaches zero asymptotically.
In consequence, the surface tension is directly related to the distance between chains.
The derivative of surface tension gives a maximum of 45 Å2. This corresponds to a water content of around 1.5 in the νCH2 and aw plots.
The minimum area achieved at the collapse pressure corresponds to the head group with the first hydration shell, c.a. 40 Å2. The difference in 5 Å2 would correspond to water interposed between chains at the inflection point. This implies a distance of 1.26 Å, i.e., the distance is roughly one layer of water molecules.
Therefore, one water molecule occupies the space between the -CH2 of adjacent chains. That is why there is a direct correspondence between water activity and -CH2 frequencies (Figure 3). In the absence of water, all -CH2 populations are connected, i.e., the distance between chains is minimum and -CH2 interaction is maximized. Therefore, the νCH2 reaches its minimum values when the chains are in the liquid condensed state. When water is interposed between the chains, those populations are reduced at the expense of the increase in the isolated population, meaning that the CH2-CH2 interaction is the minimum, i.e., liquid expanded state.
This picture is in complete agreement with the former ideas of Trauble, who postulated that water occupies kinks formed between the acyl chains [20].
This molecular picture denotes that the decrease in the frequency variation is a measure of the water exposure of the acyl chains.
As water facing non-polar regions reinforces its structure, a change in water surface tension is expected. The higher exposure, the higher the surface tension.
A great deal, in this regard, should be analyzed in terms of how the surface tension varies with the number of water molecules. A value of 72 dynes/cm is for bulk water in which the resulting force normal to the surface is produced by a great number of water molecules underneath the surface [21,22]. It is unclear if this picture is valid for a few water molecules between non-polar surfaces.
The structural arrangements and cohesion forces between the residues and molecules exposed to water reflect the surface free energy, i.e., the surface tension.
The resulting total surface tension in the monolayer is found to be the sum of the terms of opposing signs. It is the result of nonsaturated valence bonds. For instance, a four-coordinated water molecule is at its minimum of free energy in the bulk. However, those on the surface have less than 4 -H bonds, therefore, with the ability to saturate them with other molecules. The effect of water activity on the membrane structure can be measured directly by FTIR/ATR spectroscopy [10,14,17,23].
This is the picture at the surface of the water, but the orientation and number of -H bonds remaining unsaturated between the lipids give a complex landscape for surface activity. Headgroup–water interactions are identified, on average, as attractive, and immobilize water molecules while the chain region tends to expand the bilayer due to the expansion of the network by the reinforcement of tetracoordinated molecules [23]. However, chain-chain interactions are enhanced by the entropic contribution due to water disruption [24].
As the lipid concentration in the monolayer varies at constant lipids with the available area, the change in the molar fraction of lipids is equivalent to the change in the molar fraction of water. Thus, the area per lipid determines the water activity that can be varied by displacing the barrier.
There are different indications about the perturbation of water properties beyond the so-called interfacial water or the first water hydration layer. This supports the view that in confined membrane environments, water structure can be different to that in bulk [25]. At this point, it becomes clear that the presence of water will alter the molecular interaction between the lipids at different stages of the surface compression curves.
However, it is imperative to know the behavior of surface tension in confined regions between lipids, that is, the minimum amount of water with the propensity to react to bioeffectors. On the other hand, it would be of interest to evaluate the maximum area at which water between lipids becomes indistinguishable from a free water surface, thermodynamically speaking.
This analysis provides a new view of the thermodynamic properties of lipid membranes in correlation to molecular interactions that may be important for understanding the behavior of biological membranes as a complex system [26,27,28].
In conclusion, the analysis of the derivative of frequencies of the -CH2 groups with respect to the water content allows for an insight into the influence of compressibility properties of lipid membranes in terms of water arrangements, a point that may be important in understanding biologically relevant phenomena, such as osmotic stress in cells and the mechanical response of monolayers.
In particular, the water populations distributed around the different membrane groups appear to be of importance in terms of their dynamic properties.

Supplementary Materials

The following supporting information can be downloaded at: https://www.mdpi.com/article/10.3390/colloids6040054/s1, Figure S1: (a) Stretching bands of CH2 CH3 groups in the presence of D2O. (b) Correspondence of asymmetric and symmetric CH2 stretching bands with aw.

Author Contributions

Investigation: E.A.D. and M.A.F.; Methodology: A.S.R. and J.P.C. All authors have read and agreed to the published version of the manuscript.

Funding

This work was supported with funds from Agencia Nacional de Promoción Científica y Tecnológica, PICT 2015-1111, PICT 2020-0522; CONICET (PIP 604, PIO 010) and PID UNSE 23/A164.

Institutional Review Board Statement

Study did not require ethical approval.

Informed Consent Statement

Informed consent was obtained from all subjects.

Acknowledgments

EAD and MAF are members of the Research Career of CONICET (Consejo Nacional de Investigaciones Científicas y Tecnológicas de la República Argentina). JPC and ASR are the recipients of fellowships from CONICET (Argentina).

Conflicts of Interest

Authors declare no conflict of interest.

References

  1. Marsh, D. Lateral pressure in membranes. Biochim. Biophys. Acta-Rev. Biomembr. 1996, 1286, 183–223. [Google Scholar] [CrossRef]
  2. Duncan, S.L.; Larson, R.G. Comparing experimental and simulated pressure-area isotherms for DPPC. Biophys. J. 2008, 94, 2965–2986. [Google Scholar] [CrossRef] [Green Version]
  3. Wolfe, D.H.; Brockman, H.L. Regulation of the surface pressure of lipid monolayers and bilayers by the activity of water: Derivation and application of an equation of state. Proc. Natl. Acad. Sci. USA 1988, 85, 4285–4289. [Google Scholar] [CrossRef] [Green Version]
  4. Frias, M.; Disalvo, E. Breakdown of classical paradigms in relation to membrane structure and functions. Biochim. Biophys. Acta-Biomembr. 2020, 1863, 183512. [Google Scholar] [CrossRef]
  5. Pinto, O.; Disalvo, E. A new model for lipid monolayer and bilayers based on thermodynamics of irreversible processes. PLoS ONE 2019, 14, e0212269. [Google Scholar] [CrossRef] [Green Version]
  6. Pinto, O.A.; Bouchet, A.M.; Frias, M.A.; Disalvo, E.A. Microthermodynamic interpretation of fluid states from FTIR measurements in lipid membranes: A Monte Carlo study. J. Phys. Chem. B 2014, 118, 10436–10443. [Google Scholar] [CrossRef]
  7. Calero, C.; Franzese, G. Membranes with different hydration levels: The interface between bound and unbound hydration water. J. Mol. Liq. 2019, 273, 488–496. [Google Scholar] [CrossRef]
  8. Tristram-Nagle, S. Use of X-ray and neutron scattering methods with volume measurements to determine lipid bilayer structure and number of water molecules/lipid. In Membrane Hydration; Springer: Berlin, Germany, 2015; pp. 17–43. [Google Scholar]
  9. Nickels, J.D.; Katsaras, J. Water and Lipid Bilayers. In Membrane Hydration; Springer: Berlin, Germany, 2015; pp. 45–67. [Google Scholar]
  10. Rosa, A.S.; Cejas, J.P.; Disalvo, E.A.; Frías, M.A. Correlation between the hydration of acyl chains and phosphate groups in lipid bilayers: Effect of phase state, head group, chain length, double bonds and carbonyl groups. Biochim. Biophys. Acta-Biomembr. 2019, 1861, 1197–1203. [Google Scholar] [CrossRef]
  11. Ball, P. Water as an active constituent in cell biology. Chem. Rev. 2008, 108, 74–108. [Google Scholar] [CrossRef]
  12. Jendrasiak, G.L. The hydration of phospholipids and its biological significance. J. Nutr. Biochem. 1996, 7, 599–609. [Google Scholar] [CrossRef]
  13. Milhaud, J. New insights into water–phospholipid model membrane interactions. Biochim. Biophys. Acta-Biomembr. 2004, 1663, 19–51. [Google Scholar] [CrossRef]
  14. Disalvo, E.A.; Bouchet, A.M.; Frias, M.A. Connected and isolated CH2 populations in acyl chains and its relation to pockets of confined water in lipid membranes as observed by FTIR spectrometry. Biochim. Biophys. Acta 2013, 1828, 1683–1689. [Google Scholar] [CrossRef] [Green Version]
  15. Young, J.F. Humidity control in the laboratory using salt solutions—A review. J. Appl. Chem. 1967, 17, 241–245. [Google Scholar] [CrossRef]
  16. O’brien, F. The control of humidity by saturated salt solutions. J. Sci. Instrum. 1948, 25, 73. [Google Scholar] [CrossRef]
  17. Rosa, A.S.; Disalvo, E.A.; Frias, M.A. Water behaviour at the phase transition of phospholipid matrixes assesed by FTIR. J. Phys. Chem. B 2020, 124, 6236–6244. [Google Scholar] [CrossRef]
  18. Rosa, A.S.; Cutro, A.C.; Frias, M.A.; Disalvo, E.A. Interaction of Phenylalanine with DPPC Model Membranes: More Than a Hydrophobic Interaction. J. Phys. Chem. B 2015, 119, 15844–15847. [Google Scholar] [CrossRef]
  19. Wolkers, W.F.; Oldenhof, H.; Glasmacher, B. Dehydrating phospholipid vesicles measured in real-time using ATR Fourier transform infrared spectroscopy. Cryobiology 2010, 61, 108–114. [Google Scholar] [CrossRef]
  20. Disalvo, E.A.; Pinto, O.A.; Martini, M.F.; Bouchet, A.M.; Hollmann, A.; Frias, M.A. Functional role of water in membranes updated: A tribute to Trauble. Biochim. Biophys. Acta 2015, 1848, 1552–1562. [Google Scholar] [CrossRef] [Green Version]
  21. Defay, R.; Prigogine, I.; Bellemans, A. Surface Tension and Adsorption; Wiley: Hoboken, NJ, USA, 1966. [Google Scholar]
  22. Marčelja, S.; Radić, N. Repulsion of interfaces due to boundary water. Chem. Phys. Lett. 1976, 42, 129–130. [Google Scholar] [CrossRef]
  23. Alarcón, L.M.; Frías, M.d.; Morini, M.A.; Sierra, M.B.; Appignanesi, G.A.; Disalvo, E.A. Water populations in restricted environments of lipid membrane interphases. Eur. Phys. J. E 2016, 39, 94. [Google Scholar] [CrossRef]
  24. Miyazaki, K.; Schweizer, K.; Thirumalai, D.; Tuinier, R.; Zaccarelli, E. The Asakura–Oosawa theory: Entropic forces in physics, biology, and soft matter. J. Chem. Phys. 2022, 156, 080401. [Google Scholar] [CrossRef]
  25. Chattopadhyay, M.; Krok, E.; Orlikowska, H.; Schwille, P.; Franquelim, H.G.; Piatkowski, L. Hydration Layer of Only a Few Molecules Controls Lipid Mobility in Biomimetic Membranes. J. Am. Chem. Soc. 2021, 143, 14551–14562. [Google Scholar] [CrossRef]
  26. Wiggins, P. Life depends upon two kinds of water. PLoS ONE 2008, 3, e1406. [Google Scholar] [CrossRef]
  27. Disalvo, E.; Lairion, F.; Martini, F.; Almaleck, H.; Diaz, S.; Gordillo, G. Water in biological membranes at interfaces: Does it play a functional role? Anales de la Asociación Química Argentina. Asoc. Química Argent. 2004, 92, 1–22. [Google Scholar]
  28. Disalvo, E.A.; Frias, M.A. Water state and carbonyl distribution populations in confined regions of lipid bilayers observed by FTIR spectroscopy. Langmuir 2013, 29, 6969–6974. [Google Scholar] [CrossRef]
Figure 1. FTIR spectra of DPPC between 3800 and 2700 cm−1 equilibrated at different water activities denoted by different colors at 25 °C.
Colloids 06 00054 g001
Figure 2. Surface pressure (red line) and surface tension (blue line) vs. area per molecule for DPPC below the critical temperature.
Colloids 06 00054 g002
Figure 3. Water activity (black dots) and CH2 frequency (blue dots) at different water content.
Colloids 06 00054 g003
Figure 4. Correspondence of water activity with (A) ν CH2 frequency, and (B) ν PO2 frequency at different water content.
Colloids 06 00054 g004
Figure 5. (A) Derivative of the surface tension vs. area per molecule curve below Tc; (B) Derivative of the aw vs. water content curve below Tc; (C) Derivative of the CH2 frequency vs. water content curve below Tc.
Colloids 06 00054 g005
Publisher’s Note: MDPI stays neutral with regard to jurisdictional claims in published maps and institutional affiliations.

