Article

Phospholipids and Hyaluronan: From Molecular Interactions to Nano- and Macroscale Friction

1
Division of Surface and Corrosion Science, Department of Chemistry, School of Engineering Sciences in Chemistry, Biotechnology and Health, KTH Royal Institute of Technology, SE-100 44 Stockholm, Sweden
2
RISE Research Institutes of Sweden, Division of Bioscience and Materials, SE-114 86 Stockholm, Sweden
3
Stockeld Dreamery, Research and Development Group, SE-171 65 Stockholm, Sweden
4
Institute of Mathematics and Physics, UTP University of Science and Technology, al. Kaliskiego 7, 85-796 Bydgoszcz, Poland
5
Engineering Pedagogics, School of Engineering Sciences in Chemistry, Biotechnology and Health, KTH Royal Institute of Technology, SE-100 44 Stockholm, Sweden
*
Author to whom correspondence should be addressed.
Colloids Interfaces 2022, 6(3), 38; https://doi.org/10.3390/colloids6030038
Submission received: 1 June 2022 / Revised: 14 June 2022 / Accepted: 15 June 2022 / Published: 23 June 2022
(This article belongs to the Special Issue Biocolloids and Biointerfaces)

Abstract

:
Phospholipids and hyaluronan are two key biomolecules that contribute to the excellent lubrication of articular joints. Phospholipids alone and in combination with hyaluronan have also displayed low friction forces on smooth surfaces in micro- and nanosized tribological contacts. In an effort to develop aqueous-based lubrication systems, it is highly relevant to explore if these types of molecules also are able to provide efficient lubrication of macroscopic tribological contacts involving surfaces with roughness larger than the thickness of the lubricating layer. To this end, we investigated the lubrication performance of hyaluronan, the phospholipid 1,2-dipalmitoyl-sn-glycero-3-phosphocholine (DPPC), and mixtures of these two components using glass surfaces in a mini-traction machine. We compared our data with those obtained using flat silica surfaces in previous atomic force microscopy studies, and we also highlighted insights on hyaluronan–phospholipid interactions gained from recent simulations. Our data demonstrate that hyaluronan alone does not provide any lubricating benefit, but DPPC alone and in mixtures with hyaluronan reduces the friction force by an order of magnitude.

1. Introduction

The energy consumption due to friction and the associated costs for overcoming friction and wear of materials are enormous. For instance, Holmberg and Erdemir found in their analysis that 23% of global energy consumption is spent in tribological contacts, where 20% is utilized for overcoming friction and 3% for replacing worn materials [1]. Another issue from the sustainability perspective is that the most efficient lubrication systems are oil-based. It would thus be of high interest to find renewable and/or aqueous lubrication systems that can perform equally well or better than oil-based ones in at least some applications. For water-based systems, the temperature needs to be below the boiling point of water, and the pressure in the lubricating contact should not be too high. When looking into the possibility of using aqueous lubrication systems, one can find inspiration from how lubrication is achieved in nature. In fact, we do not need to go further than to our own body to find an awe-inspiring example. In mammalian articular joints, aqueous-based lubrication allows close to frictionless motion of cartilage covered bone ends that can in some cases maintain high performance for up to one hundred years, even though the cartilage surface is fragile and soft. Interestingly, due to the nanostructure of cartilage, where slow flow of water [2] affects the mechanical response [3], the measured Young’s modulus depends on the measurement speed as well as size and shape of the indenter. For instance, it was found that for plane-ended indenters, the measured apparent Young’s modulus increased from 0.1 MPa at a load of 1 N to 1.5 MPa at a load of 4 N. The corresponding values for a spherical-ended indenter were 0.1 MPa at a load of 0.4 N, increasing to 1.4 MPa at a load of 1.8 N [4]. A similar value of 2.6 MPa was obtained on the microscale using AFM, whereas much lower values centred around 0.02 MPa were obtained by AFM measurements using sharp AFM tips [5]. These latter measurements examined the surface elastic modulus while the deformed area was small, meaning that water more easily could flow out of the deformed area.
The measured friction coefficient in cartilage–cartilage experiments falls in the range 0.003–0.25 [6,7] up to pressures of 25 MPa. Above this pressure, cartilage may be damaged [8]. The excellent lubrication is currently understood by consideration of two concepts: lubrication synergy and hydration lubrication. Lubrication synergy arises from interactions between different molecules that together provide better performance than either of the single components [9,10,11,12,13]. Synergies can arise from different mechanisms. For instance, one type of molecular species can orient another molecule at the interface in such a way that it adopts conformations that allow favourable lubrication performance. This type of synergy has been observed between cartilage oligomeric matrix protein (COMP) and lubricin, where COMP allows lubricin to bind strongly and orient favourably at the sliding surfaces [14]. Another type of synergy arises between hyaluronan (HA) and phospholipids. In this case, it has been reported that hyaluronan allows large amounts of phospholipids to accumulate at the surface [15,16,17], and phospholipid-HA composite layers have been shown to have better stability than pure phospholipid layers at high hydrostatic pressures [18,19]. The fact that the structures that provide lubrication synergy are spontaneously self-assembled is important, as it gives rise to a self-healing ability [16,20], i.e., if the lubricating layer is worn off, it can spontaneously reform again.
The biomolecules that are implicated as important biolubricants include phospholipids, linear polysaccharides such as hyaluronan, as well as glycoproteins with bottle-brush structure where a protein backbone is decorated with a high density of relatively short oligosaccharide side chains. Examples of the latter are mucins and lubricin. Clearly, the biolubricants have vastly different structures, where the only common feature is the presence of functional groups that interact strongly with water. For example, the headgroup region of the phospholipids and the hydroxyl groups of the poly- and oligosaccharide chains are all strongly hydrophilic. This leads us to the hydration lubrication mechanism, as first envisaged by Klein and co-workers [21,22,23]. The strong binding of water molecules prevents dehydration of the hydrophilic groups and retains a water layer between the sliding surfaces. As water molecules can rapidly exchange with each other, this layer remains easily sheared, and this facilitates low friction forces.
Early efforts to mimic the lubrication performance of synovial joints were inspired by lubricin and thus focused on the use of bottle-brush polymer structures. Commonly, such molecular structures were designed to contain cationic groups that allowed strong anchoring to negatively charged surfaces, and hydrophilic side chains of, e.g., poly(ethylene oxide) that facilitated low friction forces via the hydration lubrication mechanism [24,25,26,27,28]. More recent efforts are focused on mixtures of hyaluronan and phospholipids [29,30], as well as on hydrogels that incorporate phospholipids [31,32].
In this work, we explored the use of phospholipids and phospholipid–hyaluronan mixtures as lubricants for macroscopic glass surfaces that are hard and rough. In order to gain insight on the difference in the lubrication performance at the macroscale and nanoscale, we also recapitulated previous measurements of the lubrication performance at the nanoscale for these systems. The nanoscale measurements utilized silica surfaces that, like the glass used here, have a high content of surface silanol groups and thus surface chemistry similar to that of glass. In addition, we report insights gained from simulations on phospholipid bilayer–hyaluronan interactions to highlight how these two components may provide lubrication synergies.

2. Materials and Methods

2.1. Materials and Solution Preparation

The phospholipid 1,2-dipalmitoyl-sn-glycero-3-phosphocholine (DPPC) with purity >99% was purchased from Avanti Polar Lipids. Hyaluronan, HA, in sodium hyaluronate form was received as a gift from Novozymes, Denmark. It had a mean weight average molecular weight of 6.2 × 10⁵ g/mol and a polydispersity characterized by Mw/Mn = 1.9 as determined by asymmetric flow field-flow fractionation. Chloroform (99.97%) was bought from Fisher Chemicals, Stockholm, Sweden, and phosphate-buffered saline (PBS) was obtained from Sigma-Aldrich, Stockholm, Sweden. The 0.01 M phosphate buffer with pH 7.4 also contained 0.137 M NaCl and 0.0027 M KCl. All solutions were prepared using deionized Milli-Q water (Millipore, Stockholm, Sweden) with resistivity larger than 18 MΩ∙cm at 25 °C.
Dispersions of small DPPC vesicles in PBS were prepared as follows. First, DPPC powder was dissolved in chloroform to the concentration of 5 mg/mL. Then, 12 mL of this solution was transferred into a 100 mL round-bottom flask for vacuum rotary evaporation (Heidolph, Schwabach, Germany) at 40 rpm and pressure of 300 mbar, while the water bath used for evaporation was kept at 55 °C. This left a thin DPPC film on the flask wall after chloroform evaporation. After the rotary evaporation, the flask was put into a vacuum oven (Binder VD 53, city, Tuttlingen, Germany) at 25 °C overnight to remove residual chloroform. The resulting DPPC film was dispersed in PBS, pH 7.4, to obtain a 1mg/mL DPPC dispersion. The DPPC dispersion was placed into an ultrasonic bath (Bandelin Sonorex Digitec, with frequency 50–60 Hz) at 55 °C and sonicated for about 4–5 h until the dispersion became almost transparent. The ready dispersion of DPPC vesicles was kept refrigerated until the day of use, but no longer than 1 week. Shortly before use, the DPPC vesicle solution was sonicated again at 55 °C for about 1 h and kept in a water bath at 55 °C until used the very same day. The DPPC vesicle size distribution was characterised after the final sonication.
The HA solution was prepared by dissolving sodium hyaluronate powder in PBS to the concentration of 1 mg/mL, assisted by heating to 55 °C and gentle stirring.
A mixture of DPPC and HA was prepared by slowly adding equal volumes of 55 °C warm solutions of 1 mg/mL DPPC and 1 mg/mL HA solutions into a beaker that was then gently vortexed.

2.2. Molecular Modelling

The dimeric structural elements of hyaluronan (PubChem) [33] were assembled to obtain one chain with 8 dimeric units, giving a chain with molecular weight of about 3 kDa. The model of the DPPC bilayer was adopted from Yeghiazaryan et al. [34]. This model DPPC bilayer contained 288 phospholipids, which were properly equilibrated in the simulation prior to adding the HA molecule at the membrane surface. Periodic boundary conditions were applied to create an “infinite” bilayer. The time step was set to 2 fs. The TIP3P water model [35] was used together with the AMBER03 force field [36]. For the isobaric-isothermal ensemble (NPT), all-atom simulations were performed under the same conditions: temperature 310 K (physiological), pH = 7.0 and 0.9% NaCl aqueous solution (56 Na+ cations and the corresponding number of anions to achieve electroneutrality). Simulations were carried out for 45 ns to collect the data from the system’s equilibrium state, which was reached after approximately 25 ns. The Berendsen barostat [37] and thermostat with a relaxation time of 1 fs were used to maintain constant pressure and temperature. To minimize the influence of rescaling, YASARA does not use the strongly fluctuating instantaneous microscopic temperature and pressure to rescale velocities at each simulation step (classic Berendsen thermostat). Instead, the scaling factor is calculated according to Berendsen’s formula from the time average temperature.

Hydrogen Bond Identification

We utilized the YASARA definition of a hydrogen bond, where it is regarded to be formed when the hydrogen bond energy is greater than 6.25 kJ/mol, which is 25% of the optimum value of 25 kJ/mol [38]. The following formula yields the bond energy in kJ/mol as a function of the hydrogen-acceptor distance and two scaling factors:
E H B = 25 · 2.6 m a x D i s H A , 2.1 0.5 · S c a l e D H A · S c a l e H A X
where the first scaling factor depends on the angle formed by Donor-Hydrogen-Acceptor, and the second scaling factor is derived from the angle formed by Hydrogen-Acceptor-X, where the X stands for the atom covalently bound to the acceptor.
Both scaling factors change linearly from 0 to 1 as follows:
S α = θ 2 α θ 2 θ 1
The values of the angles have been presented in the work of Beldowski et al. [39].
The structures of the repeating dimeric unit of hyaluronan and of DPPC are shown in Figure 1. The oxygen atoms are numbered and used when describing hydrogen bond formation between hyaluronan and DPPC.

2.3. Atomic Force Microscopy

Friction forces between a silica colloidal probe and a silica surface in the presence of DPPC, and in some cases also hyaluronan, were determined at the nanoscale using atomic force microscopy. The AFM utilized was a Multimode Nanoscope III Pico Force (Bruker, Billerica, MA, USA). The colloidal probe was glued to tipless cantilevers (CSC12-F, MicroMasch, Tallinn, Estonia) using a two-component epoxy glue (Huntsman, Duxford, UK), an Eppendorf Micromanipulator 5171 and a Nikon Optiphot 100S microscope. Measurements were carried out in a fluid cell (MTFML, Bruker, Billerica, MA, USA) at a temperature of about 47 °C, i.e., above the chain melting temperature of DPPC. At each load, the friction force was determined as the surfaces were sliding against each other forwards and backwards 10 times at the same position, using a sliding distance of 1 µm and a sliding speed in the range of 400 nm/s−1 µm/s in different experiments. Further details can be found in previous publications [15,16,17].

2.4. Mini-Traction Machine

A Mini-Traction Machine (MTM) from PCS Instruments, UK, was used for investigating friction forces and friction coefficients between glass surfaces lubricated by DPPC and/or HA. The friction forces were measured between a borosilicate glass ball with diameter of 19.05 mm (3/4″) and a borosilicate glass disc with diameter of 50 mm, which were produced by PCS Instruments and designed specifically for MTM measurements. The MTM instrument was used in full sliding mode, in which the ball was kept immobile (“pin-on-disc” instrument setting) and the disc was rotating. The ball and disc were first cleaned with 2 wt% Deconex 20 NS-x for 1 h, rinsed with Milli-Q water and ethanol, and then treated with air plasma for 5 min. Lubricant solution, 15 mL, was poured into the MTM reservoir, and adsorption was allowed to proceed for at least 15 min (DPPC) or at least 30 min (hyaluronan and DPPC–hyaluronan mixtures) prior to measurements. The sliding speed was set to 10 mm/s. Three loads were applied in the sequence 5 N, 10 N and again 5 N. The friction coefficient was recorded for 5 min at each load. The experiments were performed at 47 °C, i.e., at the same temperature as used in the AFM experiments, if not otherwise stated.

2.5. Dynamic Light Scattering

Dynamic light scattering measurements (Zetasizer, Malvern Instruments, Malvern, UK) were used to determine the hydrodynamic size distribution of the DPPC vesicles used as lubricants in the MTM measurements. The typical hydrodynamical diameter of the vesicles was found to be 50–60 nm, which is slightly lower than the 70 nm reported previously [15].

2.6. Profilometry

A profilometer was employed to measure the surface roughness of the silica disc used in MTM measurements. The profilometer used was a DektakXT Stylus Profiler produced by Bruker, Billerica, MA, USA, In the profilometer, a diamond stylus is used to trace the surface profile.

3. Results

3.1. Molecular Modelling of Interactions between HA and DPPC

We have investigated molecular interactions between hyaluronan and DPPC bilayers in aqueous solutions using molecular dynamics simulations [39]. The simulations allowed us to identify hydrogen bonding sites, direct and water-mediated, between HA and the headgroup of DPPC as well as hydrophobic interaction sites. In this section, we repeat the main findings from the simulation, and refer the interested reader to our previous publication [39] for additional details.
Our simulations indicated affinity between HA molecules and the DPPC bilayer. HA was adsorbed at the DPPC bilayer surface throughout the simulation by hydrophobic interactions and formation of hydrogen bonds.
As seen in Figure 2, hydrogen bonds between HA and the DPPC bilayer are preferentially formed by the hydroxyl oxygens HA-O1, HA-O2, and HA-O10, with some H-bonds also involving HA-O8 (hydroxyl group), HA-O3 (ether group), and HA-N (amide group). Thus, the hydroxyl oxygens of HA that can donate a hydrogen atom participate in most direct hydrogen bonds with DPPC. The HA-O10 participates in most hydrogen bonds, as it experiences the least steric hindrance. The most prominent hydrogen bond acceptors of the phospholipid are DPPC-O3 and DPPC-O4, associated with the phosphate group. However, we also observed some H-bonds with DPPC-O6 and DPPC-O8, located next to the acyl chains. Thus, it is clear that HA partly penetrates the headgroup region of the DPPC bilayer. Some direct hydrogen bonds, marked as dashed greenish lines, are illustrated in the middle part of Figure 2, and water-mediated hydrogen bonds are illustrated in the same manner in the bottom part of Figure 2.
Hydrophobic contacts between CH2 and CH3 groups of HA and DPPC were also found during the simulation. In fact, the number of hydrophobic contacts was found to be an order of magnitude larger than the number of hydrogen bonds [39]. Thus, hydrophobic contacts are essential for the HA–DPPC association, and we suggest that the hydrogen bonds formed between DPPC and HA mainly contribute to the stability of the structure by compensating for lost hydrogen bonds with water when the HA molecule is close to the DPPC bilayer surface.

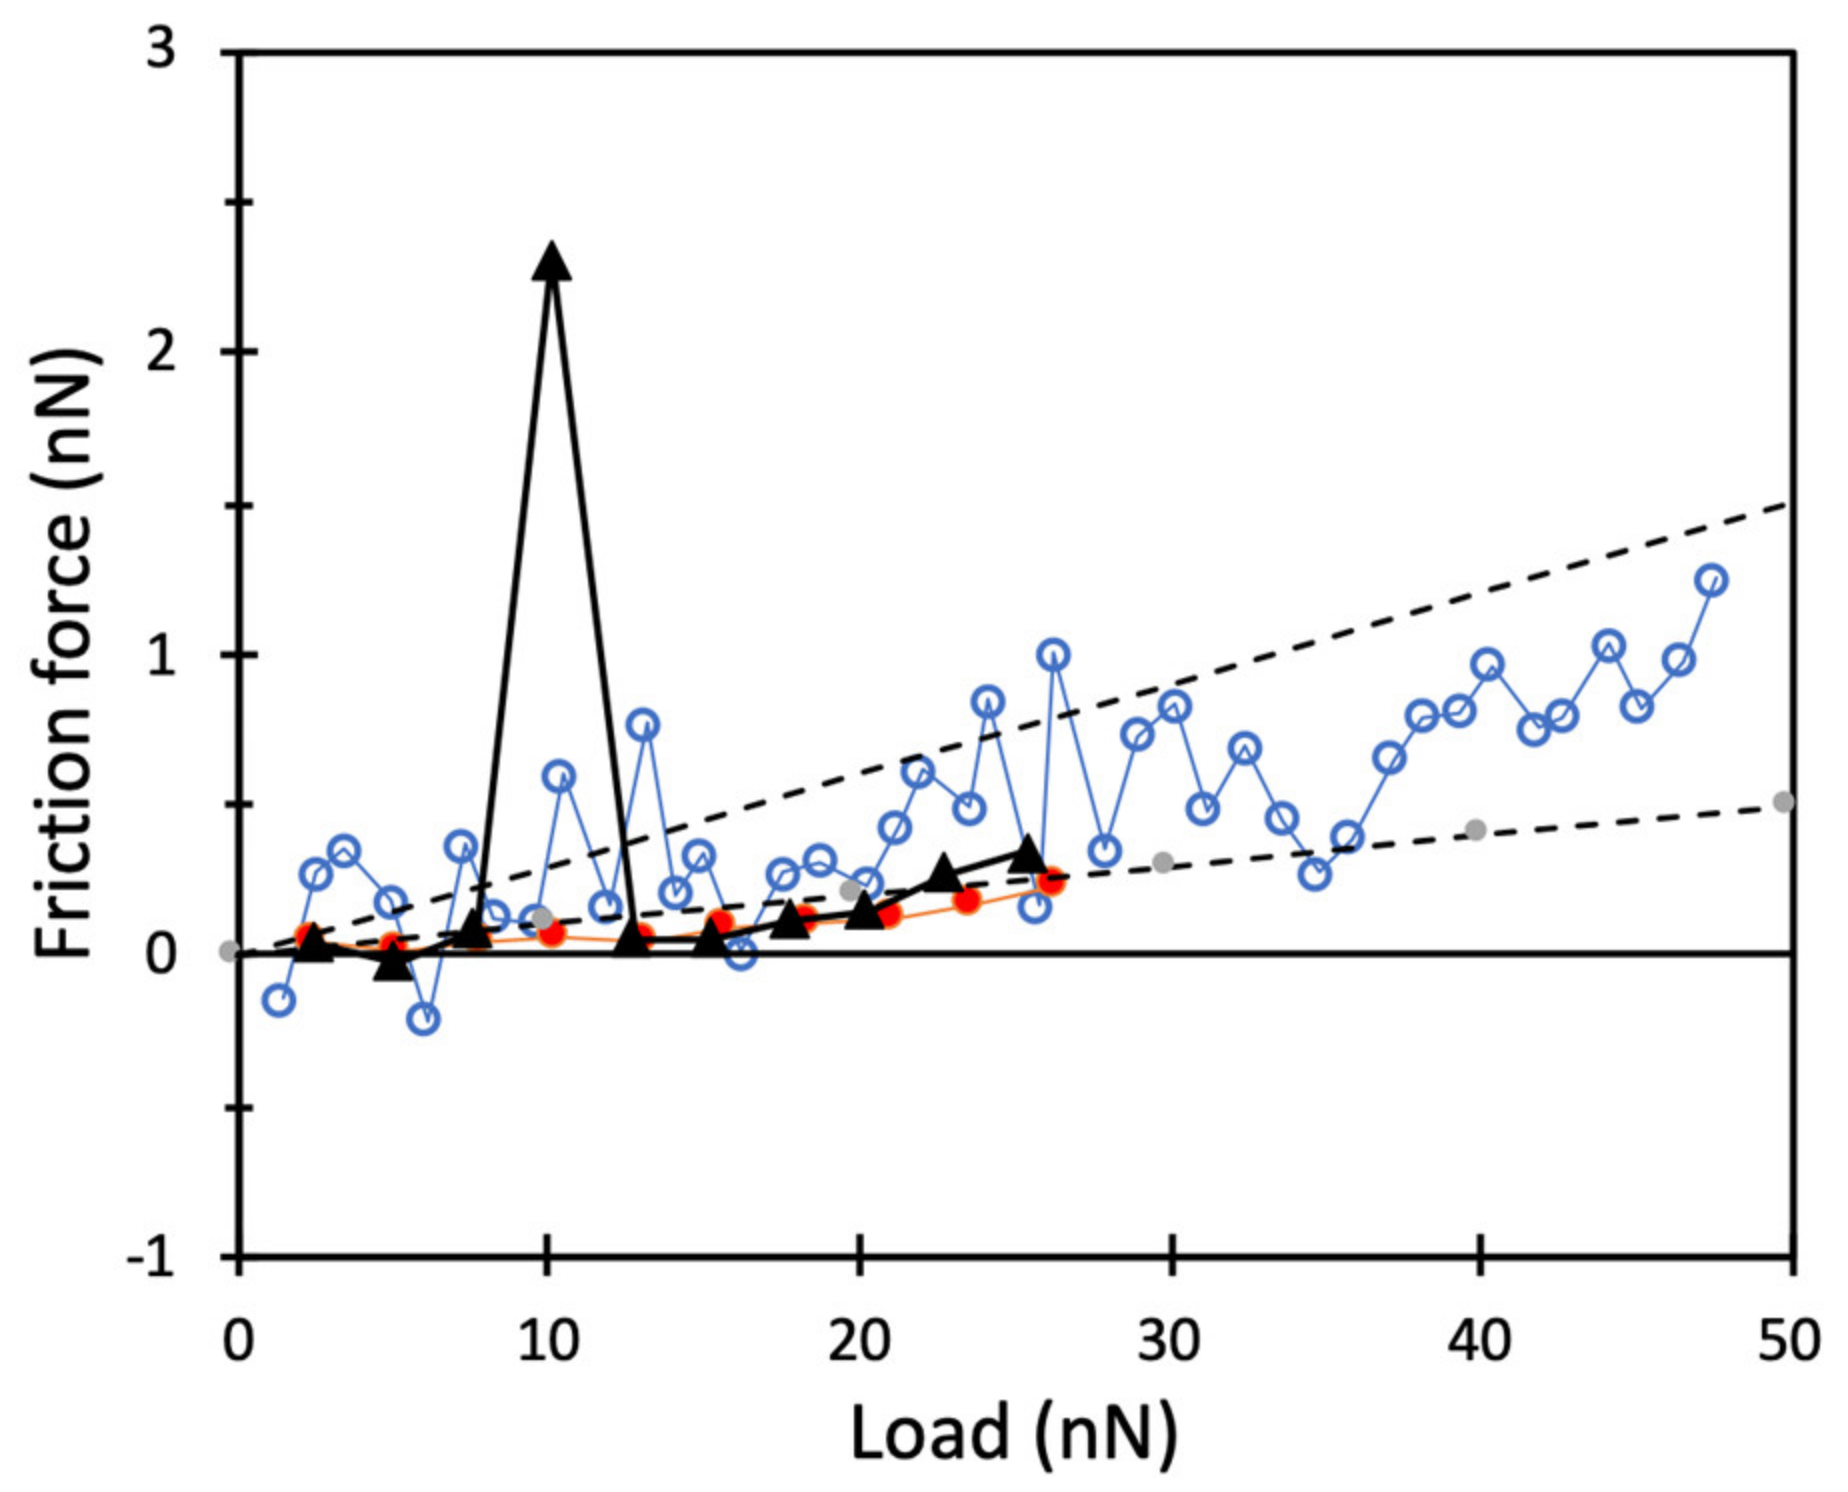
3.2. Nanoscale Friction

The nanoscale friction forces between silica surfaces coated with a DPPC bilayer and in the presence and absence of hyaluronan have been studied with AFM and reported previously [15,16,17]. Some relevant findings are summarized here to allow easy comparison with the friction results at the macroscale as reported in the Section 3.3. As illustrated in Figure 3, the friction force between DPPC bilayer coated surfaces was very low. The friction coefficient was in the range 0.01–0.03 up to the highest load explored, which corresponded to a pressure of about 50 MPa. Even lower friction coefficients have been reported for phospholipid vesicles on mica up to a pressure of 3–5 MPa [40]. The low friction force was due to the strong hydration of the DPPC headgroup, which supported a short-range repulsive hydration force. Thus, the hydration lubrication mechanism [20,21] was operative, where a thin separating water layer strongly bound to the phospholipid headgroup was nevertheless easily sheared, thus sustaining low friction forces.
Adsorption from an aqueous mixture of DPPC and hyaluronan likewise gave rise to low friction forces with a friction coefficient below 0.01 (Figure 3), which is similar to what is found in synovial joints [41]. However, the undisturbed structure of the adsorbed DPPC–hyaluronan layer was less homogeneous than that achieved with DPPC alone, as revealed by gentle AFM imaging in aqueous solution [17]. This has some consequences for the friction force, as illustrated in Figure 3. Here, one can notice one sudden friction peak at a load of 10 nN, after which the friction force returns to a very low value. Such friction peaks have been assigned to sudden structural changes in the adsorbed layer due to the combined action of load and shear, which presumably leads to formation of DPPC bilayer structures separated by easily sheared water layers [19]. These structural changes give rise to energy dissipation that shows up as a peak in the friction force data. More information about the boundary lubrication of DPPC in the absence and presence of hyaluronan can be found in our previous works [11,15,16,17]. We note that the synergistic effect reported for DPPC mixed with hyaluronan at the nanoscale was related to the ability of hyaluronan to facilitate accumulation of DPPC at the surfaces [15,16], whereas the actual friction force was similar in the absence and the presence of hyaluronan.

3.3. Macroscale Friction

It was far from obvious that the very low friction forces found at the nanoscale in AFM measurements also could be achieved at the macroscale. This was due to the fact that the adsorbed layer, including the hydration layer that facilitated the low friction force, was only a few nm thick. In this section, we report the macroscale friction results obtained using a mini-traction machine. In these measurements, we utilized glass surfaces that were similar to the silica surfaces used in the nanoscale friction measurements evaluated with AFM. The glass surfaces utilized in the MTM measurements were relatively fragile, so, unlike in the AFM measurements, we needed to consider wear of the substrate surfaces, which limited the load that could be applied. First, we determined the friction forces in the PBS solution. Next, friction forces in the presence of the two lubricants, hyaluronan and DPPC, separately were evaluated. As the last step, we explored a combination of DPPC and hyaluronan to learn if there were any synergistic or antagonistic lubrication effects at the macroscale.

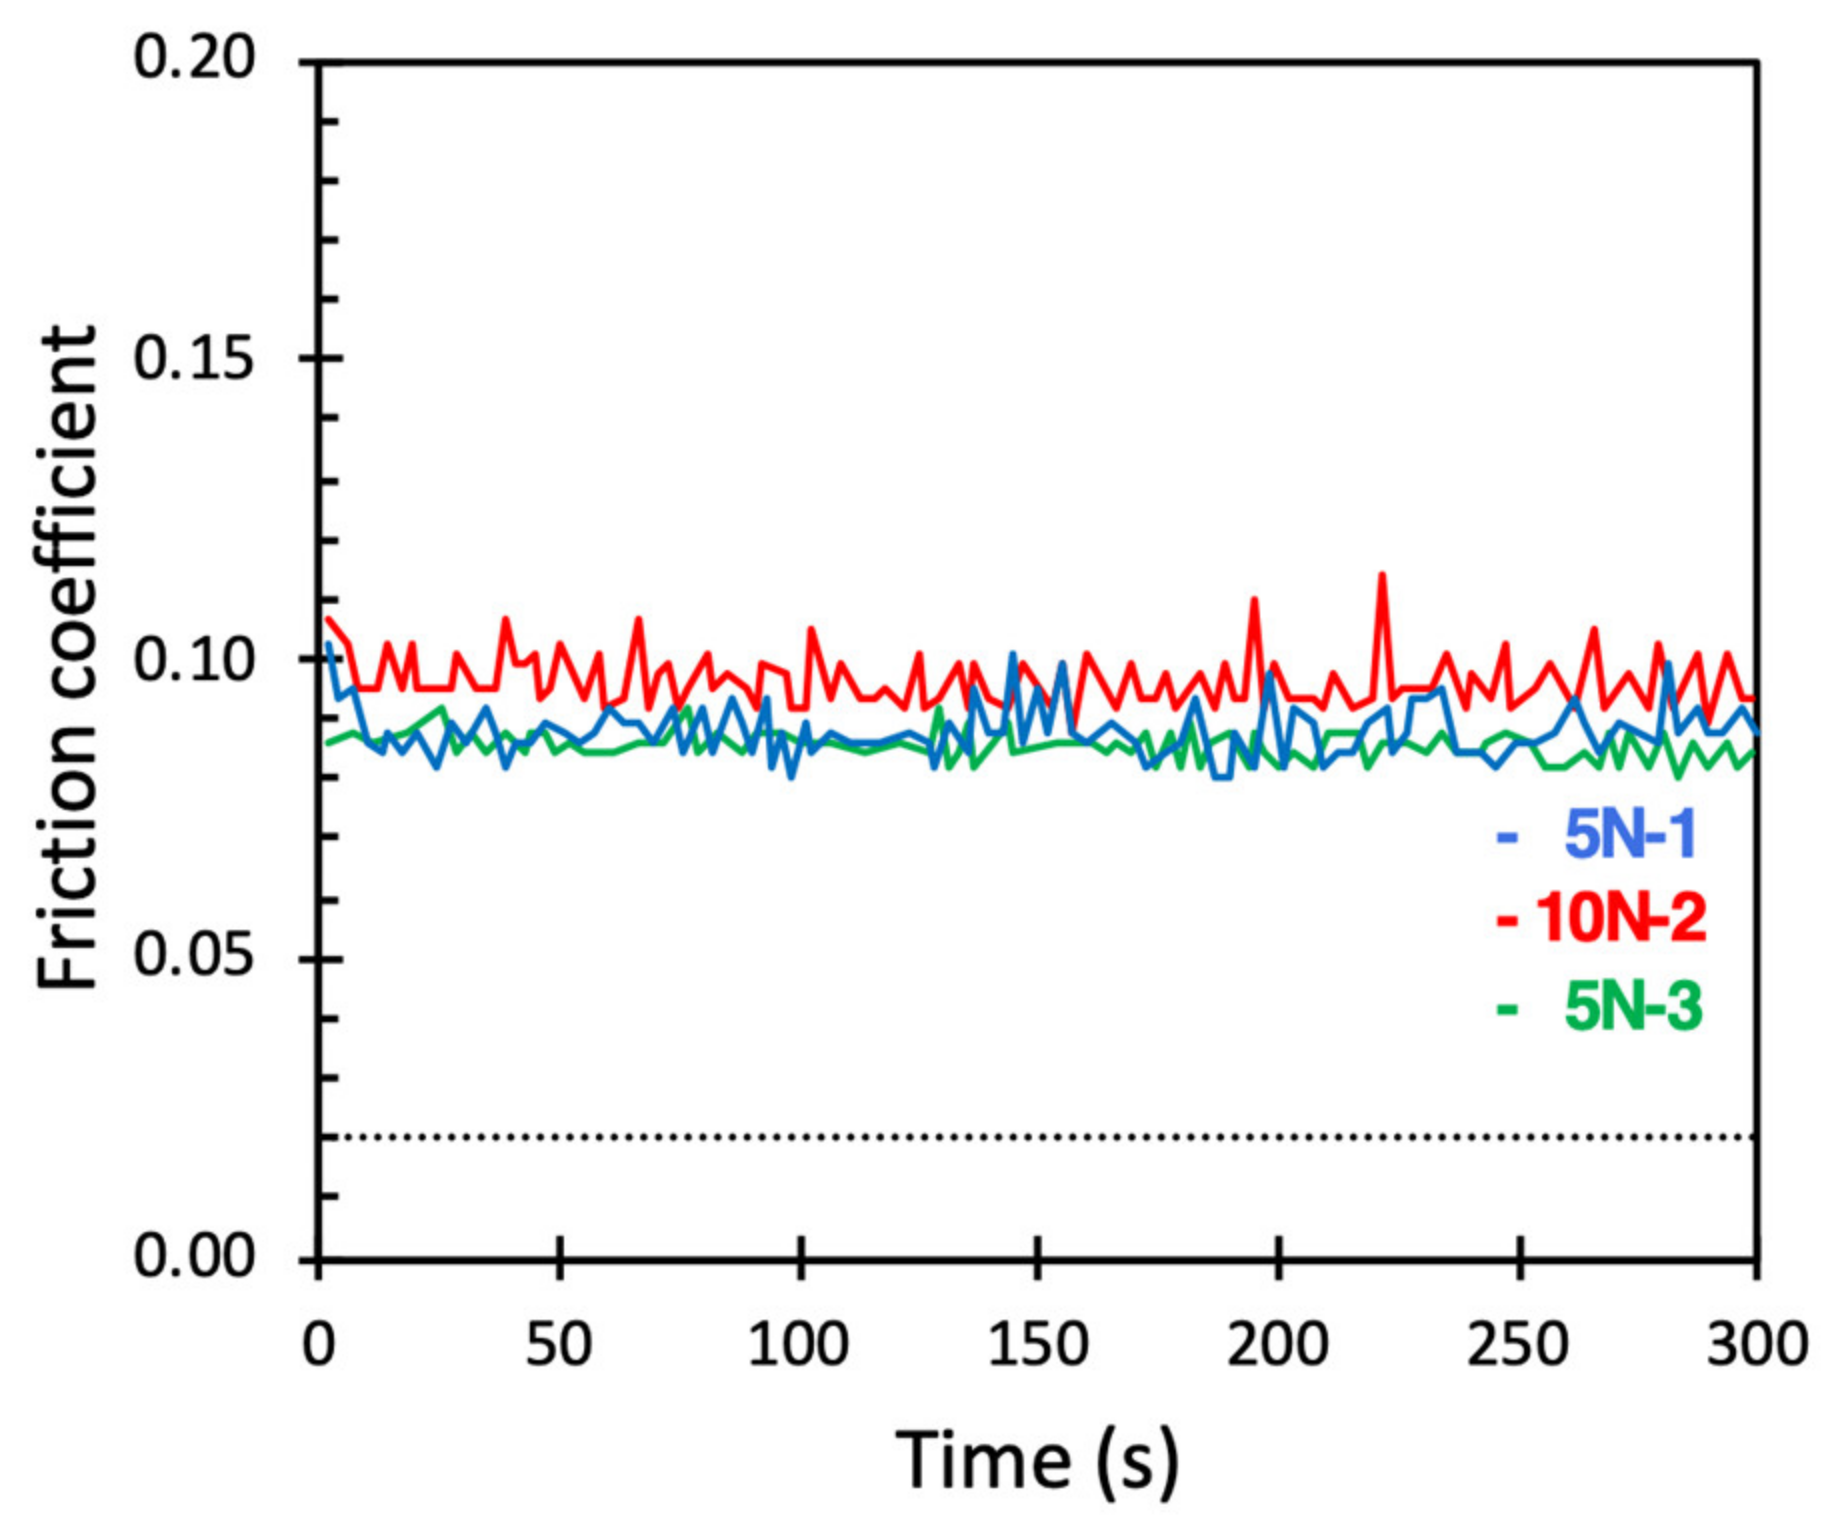
3.3.1. Friction in PBS Solution in Absence and Presence of Hyaluronan

The friction coefficients obtained in phosphate buffered saline solution are reported in Figure 4, left. Here we first used a load of 5 N, then increased the load to 10 N, and finally again evaluated the friction at the load of 5 N. The friction coefficient was in all cases high, slightly above 1, and this was the baseline that the biolubricants needed to improve.
The addition of 0.5 mg/mL hyaluronan to the PBS solution had essentially no effect on the friction forces, as evident by comparing the data reported in the two panels of Figure 4. This was expected since hyaluronan does not adsorb to silica surfaces as judged by quartz crystal microbalance measurements [15].

3.3.2. Friction in PBS Solution Containing DPPC Vesicles

DPPC vesicles readily adsorb to silica surfaces, where they break to form a bilayer coating [15]. Thus, when the borosilicate ball and disc were bathed in the 0.5 mg/mL DPPC vesicle containing PBS solution, DPPC bilayer formation on both surfaces occurred. Thus, if the wear resistance of these layers is sufficient, one would expect a change in friction force compared to that observed in pure PBS solution. Indeed, the data reported in Figure 5 showed a friction coefficient of about 0.1 both at a load of 5 N and 10 N. Thus, the presence of DPPC in the form of bilayers on the surface with the reservoir of DPPC vesicles in the surrounding solution resulted in a reduction in the friction force by an order of magnitude. Even though this was a significant friction reduction, the magnitude of the friction force recorded in the MTM experiment was significantly larger than found by AFM. We will come back to this observation in the Section 4.
From the data reported in Figure 5, we note that the friction coefficient remained low throughout the experiment, suggesting that the lubricating DPPC bilayer remained intact. This was rather surprising since the DPPC bilayers were held together by weak intermolecular forces. To gain further insight into the stability of the layer during sliding under load, we carried out experiments where the DPPC vesicle solution was allowed to adsorb on the surfaces for at least 15 min. Next, the DPPC vesicle solution was replaced by a pure PBS solution while keeping the surfaces under water at all times. Thus, we now had a DPPC bilayer on the surfaces but no DPPC vesicles in the solution. The results of these measurements are reported in Figure 6.
During the first measurement at a load of 5 N, the friction coefficient was initially well below that of the bare surfaces. However, the friction coefficient increased with time, and large amplitude stick-slip events were observed. After about 250 s, the friction became similar to that observed for the bare substrates. The subsequent measurements at a load of 10 N and again at 5 N were indistinguishable from what was observed for bare surfaces (compare Figure 4 and Figure 6). Clearly, the adsorbed DPPC bilayer rapidly wore off due to the combined action of load and shear. The fact that the friction remained low for a prolonged time when vesicles were present in solution (Figure 5), but not in the absence of such vesicles (Figure 6), emphasized the importance of self-healing. Clearly, the DPPC layer suffered from wear (Figure 6). However, in the presence of DPPC vesicles in the solution, DPPC adsorption to the worn areas rapidly occurred, allowing for sustained low friction. Such self-healing properties are feasible when the lubricating layer is formed by a spontaneous self-assembly process. Interestingly, on the nanoscale, self-healing of DPPC bilayers was also observed for preadsorbed layers on silica, i.e., in the absence of DPPC vesicles in solution [16]. This was presumably due to the much smaller wear scar in AFM measurements.

3.3.3. Friction in PBS Solution Containing DPPC Vesicles and Hyaluronan

Adsorbed layers formed from solutions containing both DPPC vesicles and hyaluronan were less homogeneous than those formed by DPPC vesicles alone [17]. Nevertheless, low friction forces were obtained at the nanoscale, except for sudden peaks occurring as the layers reorganized (see Figure 3). The same experiment carried out at the macroscale using the MTM instrument is reported in Figure 7.
The first measurement at a load of 5 N initially gave a relatively high friction coefficient with marked stick-slip amplitudes (see Figure 7). With time, the friction force decreased and the stick-slip behaviour became less pronounced. This differed from the much smoother curve and lower friction observed for DPPC alone (Figure 5). When the load was increased to 10 N, a similar behaviour was observed, i.e., the friction coefficient decreased with time, and some large friction peaks were observed. However, when the load was decreased again to 5 N, a consistent low friction was observed with a magnitude similar to that obtained with DPPC alone. Thus, after a run-in period where the layer restructured and presumably became more homogeneous with DPPC bilayer structures on the surface, a low friction force was also obtained in the solutions containing mixtures of DPPC and hyaluronan. This was qualitatively similar to the observations at nanoscale. However, at nanoscale, the peaks in the friction force due to restructuring of the layer occurred less frequently due to the smaller surface area probed. Again, the value of the friction coefficient at the nanoscale was significantly lower than that on the macroscale.
We also performed experiments where first a composite layer of DPPC and hyaluronan was formed by adsorption from a solution containing 0.5 mg/mL DPPC vesicles and 0.5 mg/mL hyaluronan. Next, the bulk solution was replaced by PBS, and then the friction forces were evaluated. Thus, in this case we had a preadsorbed layer of DPPC and hyaluronan, but these molecules were absent in bulk solution. The data obtained (Figure 8) were rather similar to those recorded for DPPC bilayers in PBS solution (Figure 6). The first measurement at a load of 5 N started with a low friction force. However, as the layer eroded, pronounced stick-slip peaks were observed, and after about 200 s, the friction coefficient was very similar to that obtained for bare surfaces in PBS solution. Thus, also for composite layers of DPPC and hyaluronan, it was essential to have the lubricants present in solution to achieve self-healing properties and a sustained low friction force.

3.3.4. Effect of Temperature

AFM measurements at the nanoscale resulted in low friction coefficients, ≤0.02, between surfaces coated with DPPC bilayers in the temperature interval 25 °C to 52 °C [16]. We note that X-ray reflectivity measurements have shown that supported DPPC bilayers were in the gel phase up to 39 °C and in the liquid disordered state at 55 °C [16], and free hydrated DPPC bilayers were in the liquid disordered state above 41 °C [42]. Thus, it appears that the state of the acyl chains had no major impact on the lubricating ability at the nanoscale even though it has been reported that the more brittle gel phase is more prone to wear failure at high loads [16].
Likewise, no major impact of the temperature in the range 25–52 °C on the friction coefficient was observed on the macroscale in experiments with the MTM instrument (see Figure 9). Thus, we conclude that low friction forces can be achieved with DPPC vesicle solutions both above and below the transition temperature to the liquid disordered phase also on the macroscale.

4. Discussion

It is far from easy to compare measurements of friction forces at the nanoscale and at the macroscale. The main reason for this is that the different techniques that were utilized have different restrictions on the loads and sliding speeds that can be applied. The roughness of the surfaces used was also different. In Table 1, we summarize the conditions used in the AFM and MTM measurements. It should be noted that in the MTM, the lowest possible load was applied, and in the AFM, weak springs were needed in order to accurately determine the weak friction forces, which limited the load that could be applied.
The data given for the AFM measurements are typical values, and they can vary somewhat in different studies. However, it is clear that the sliding speed and the applied load were orders of magnitude larger in the MTM than in the AFM.

4.1. Conversion of Force to Pressure

The conversion of load to pressure was calculated using the Hertz model [43,44], which is appropriate for elastic deformations under conditions when the adhesion force is low compared to the applied force. The calculations utilized the following equations:
E = 2 ( 1 υ 2 ) E 1
a = 3 R F 4 E 1 3
P = F π a 2
In the calculations, we used the elastic modulus (E = 72 GPa) and Poisson’s ratio (v = 0.17) appropriate for silica. Here, a is the radius of the contact formed as a result of the load, R the radius of the ball, and F the load applied normal to the surface. The pressure, P, calculated here is the average pressure over the contact area. In reality, the pressure varies over the contact area, and, of course, the pressures at the asperity contacts are significantly higher. Nevertheless, we note that the pressure applied was high compared to the maximum pressure that the mammalian synovial joint can withstand (≈25 MPa) [8]. We also see from Table 1 that the pressure in the macroscale measurements in MTM was a factor of 3 to 4 higher than the maximum pressure utilized in the nanoscale measurements employing AFM.
We also estimated the dimensionless Hersey number (He) according to:
H e = V η L / 2 a
Here, V is the sliding speed, η the liquid viscosity, and L/2a the load per unit length of contact. The very low values of the Hersey number in both MTM and AFM, combined with relatively low surface roughness, suggest that measurements were performed in the boundary lubrication regime.

4.2. Comparison of Microscale and Macroscale Friction Data

Amontons’ first rule of friction states that the friction force, Ff, is proportional to the normal force (load) applied to the sliding surfaces:
F f = µ F
This agrees fairly well with the nanoscale measurements shown in Figure 3 and with the observation that the friction coefficient (µ) was the same (Figure 4) or similar (Figure 5) at a load of 5 N and 10 N in the macroscale measurements. However, Equation (7) is not a law of nature, and many deviations from this rule are observed, e.g., when there is a strong adhesion between the sliding surfaces [45] or when the main energy dissipating mechanism changes with load [10,28,46].
One reason why the friction coefficient in the presence of DPPC was higher in the macroscale measurements, 0.08–0.1 in Figure 4, than in the nanoscale measurements, 0.01–0.03 in Figure 3, could thus be that the main energy dissipative mechanism was different. In the nanoscale measurements, the hydration lubrication mechanism was operative, and sliding occurred in the water layer separating the very flat DPPC bilayer-coated surfaces [16]. A low friction coefficient was also observed on the macroscale, suggesting that hydration lubrication still played a major role. However, the higher pressure and the rougher surface (see Table 1) used in these measurements suggested the possibility that the adsorbed lubricant layer may constantly be destroyed and reformed, which would add an additional energy dissipative mechanism. If this were the case, then DPPC bilayer-coated surfaces in the MTM measurements would rapidly wear off and lose their lubrication performance if DPPC was not present in the bulk phase. Indeed, this is exactly what we observed, as reported in Figure 6 and Figure 8. In contrast, in AFM measurements the bilayer of DPPC was not destroyed under the loads reported in Figure 3, but this occurred at higher pressures [16]. Thus, we identified the additional energy dissipative mechanism in the MTM measurements as being due to erosion and reformation of the lubricating layer.
We note that favourable lubrication in the macroscopic MTM measurements was achieved with DPPC bilayers of thickness of about 4 nm even though the rms roughness of the surface was about a factor of 3 larger than the thickness of the lubricating layer. In aqueous lubrication studies at the nanoscale with bottle-brush polymer lubricants, it was also noted that friction forces increased with increasing surface roughness, where the roughness was created by surface attachment of 12 nm silica spheres [26].

4.3. Improved Lubrication with Time

In tribo-engineering applications, it is commonly observed that a certain time is required before a stable low friction force is established. This is often referred to as “run-in”. The run-in is caused by several mechanisms, including initial wear of the sliding surfaces, changes in surface composition and microstructure, surface reactions and formation of tribofilms [47]. In this work, we also observed a run-in period when mixtures of DPPC and hyaluronan were used as lubricants. This was due to structural rearrangements of the lubricating layer due to the combined action of load and shear. In particular, the large aggregates that initially were found on the surface [17] were suggested to be converted to bilayer-like structures that sustained low friction forces due to the hydration lubrication mechanism. A clear illustration of this is seen in Figure 7, where an initial high and erratic friction with time developed into a low and stable lubrication performance.
We note that in a work of Drummond et al. [48], it was observed that the friction between triblock copolymers strongly anchored to molecularly smooth mica surfaces was higher when the layer had nanoscale roughness compared to when the layer was smooth. For the strongly surface-attached triblock copolymers, no change in friction with time was noted, suggesting that the structural inhomogeneity remained under load and shear. This is clearly different compared to our case, where weak intramolecular forces holding the surface-attached hyaluronan–DPPC aggregates together were easily broken, which allowed for structural rearrangements during the run-in period.
A run-in period is commonly observed also in other aqueous lubrication systems, including thin polysaccharide layers, where sliding leads to conformational changes of the polymer layer [49]. Run-in periods are also observed in aqueous systems without polymers, as can be exemplified by water-phosphoric acid mixtures [50], where a tribofilm develops with time, and in aqueous solutions containing nanosheets of black phosphorus [51], where the sheets presumably align with time.

4.4. Synergies between DPPC and Hyaluronan

It is now a common understanding that the excellent lubrication in synovial joints is not due to one particular molecule, but rather due to synergies between several biolubricants [9,12,14,52]. Similar lubrication synergies are also common between synthetic molecules used for aqueous lubrication [10,53,54]. On the nanoscale, a synergy in lubrication between DPPC and hyaluronan has been described, and this is also seen in Figure 3. This synergy is related to the interactions between DPPC and HA, as described in the beginning of this article and in more detail elsewhere [39]. It has also been noted that larger amounts of lubricants can accumulate on the surfaces when both DPPC and hyaluronan are present compared to DPPC alone [17]. Further, DPPC–hyaluronan layers are more stable under high hydrostatic pressure than DPPC layers alone [18].
In this work, we explored DPPC vesicle solutions both in the presence and in the absence of hyaluronan. After a run-in period, both systems provided similar friction coefficients. Thus, the synergies observed on the molecular level did not translate into a synergistic effect at the macroscale. This further implies that the stabilizing effect of hyaluronan was insufficient to significantly prevent wear and reformation of the lubricating layer. This is also observed in Figure 6 and Figure 8, where erosion of preadsorbed DPPC–hyaluronan layers (Figure 8) occurred on the same time scale as for DPPC layers alone (Figure 6).

4.5. Aqueous Lubrication

In the context of developing less harmful industrial processes, it would be beneficial to replace oil-based lubricants with aqueous lubrication systems. This seems to be feasible in low-temperature/low-pressure applications. In this work, we found inspiration from the lubrication of synovial joints, where phospholipids and hyaluronan are important biolubricants. On the surfaces we tested, the hyaluronan alone did not provide any benefit, whereas DPPC alone or in combination with hyaluronan reduced the friction coefficient by one order of magnitude up to a temperature of more than 50 °C (Figure 9) and a pressure of up to just above 200 MPa (Table 1). Thus, in applications where such mild conditions are used, phospholipid-based aqueous lubrication systems may be a useful alternative. Therefore, it is worthwhile to further explore this in more detail and also consider issues such as wear and corrosion.
Other aqueous lubrication systems that have been inspired by biolubricants are bottle-brush polyelectrolytes, mimicking the overall structure of lubricin and mucins. The most studied of these synthetic bottle-brush polyelectrolytes contain cationic groups that provide strong anchoring to negatively charged surfaces and hydrophilic side chains that facilitate the hydration lubrication mechanism [24,25,27,28,46,55]. For instance, in the work of Liu et al., friction coefficients of 0.03–0.04 up to a pressure of 50 MPa were achieved [28]. That work also summarized data from several other studies of bottle-brush polyelectrolytes in terms of achieved friction coefficients and explored pressure ranges.
Another approach that attained very favourable lubrication in aqueous media was to utilize nanosized sheets of black phosphorus modified by reaction with sodium hydroxide [51]. After a run-in period, a friction coefficient of well below 0.01 was observed up to pressures slightly above 900 MPa. This excellent performance was attributed to strongly bound water, i.e., to the hydration lubrication mechanism. Such favourable lubrication was even achieved on rough surfaces (rms ≈ 190 nm). In another work, Li and co-workers reported similarly very low friction forces after a run-in period in aqueous phosphoric acid solutions at low pH up to a pressure of 1.6 GPa [50]. This was attributed to formation of a hydrogen-bonded network of phosphoric acid hydrates on the sliding surfaces. Taken together, the results reported for aqueous lubrication systems indeed suggest that they might be an alternative to oil-based lubrication for low-temperature/low-to-moderate pressure applications.

5. Conclusions

We investigated the lubrication performance of solutions of hyaluronan, the phospholipid DPPC, and mixtures of the two on macroscopic rough glass surfaces using a mini-traction machine. We found a friction coefficient of about 0.1 for both DPPC alone and DPPC–hyaluronan mixtures at pressures of up to 200 MPa. This friction coefficient was an order of magnitude lower than that found in pure buffer solution. In contrast, the solution with hyaluronan alone did not provide any lubrication benefit and thus performed no better than the buffer solution. These observations were qualitatively similar to what has been observed on flat silica surfaces in nanoscopic experiments performed by AFM. However, quantitatively, we noted an order of magnitude higher friction coefficients on the rough surfaces at macroscale compared to those on the smooth surfaces at nanoscale.
For mixtures of hyaluronan and DPPC, the favourable lubrication is achieved after a run-in period under which the initially heterogeneous layer restructures, presumably into DPPC bilayer structures separated by easily sheared water layers. Similar, but less pronounced, restructuring effects have previously been observed in nanoscale experiments. In particular, in our macroscale experiments, we found no synergistic effects between hyaluronan and DPPC, but such effects could possibly occur at higher pressures as hyaluronan has a stabilizing effect on DPPC bilayers.
Experiments with preadsorbed layers, i.e., in absence of the lubricants in bulk solution, demonstrated a rapid deterioration in lubrication performance as the lubricating layer was eroded. The strong contrast between measurements in the presence and absence of lubricants in solution provided evidence for a self-healing ability of the lubricating layer when the lubricants were present in solution. Thus, in this case, it was clear that once the layer was worn off, it rapidly reformed by adsorption from solution to provide stable low friction. We suggest that the higher friction coefficient observed for the macroscopic and rough surfaces, compared to reported results for smooth surfaces in nanoscopic contact, was partly related to energy dissipation during erosion and reestablishment of the lubricating layer. Of course, the higher surface roughness itself also contributed to this observation.
The order of magnitude reduction in friction in the presence of DPPC and DPPC–hyaluronan mixtures on surfaces with roughness larger than the thickness of the adsorbed layer is promising for the use of these components as aqueous lubricants in low-temperature applications up to pressures of a few hundred MPa. Thus, we suggest that aqueous lubrication systems have high potential in selective applications, but that the issues related to wear performance and possible corrosion effects have to be considered.

Author Contributions

S.L. Major part of experimental work, L.M. Experimental design and part of manuscript preparation, P.B. Modelling experiments, part of manuscript writing, P.M.C. Major part of manuscript writing. A.D. Conceptualization, experimental design and manuscript writing. All authors have read and agreed to the published version of the manuscript.

Funding

This research received no external funding.

Institutional Review Board Statement

Not applicable.

Informed Consent Statement

Not applicable.

Data Availability Statement

Not applicable.

Acknowledgments

This research has been supported by BN-WTiICh-11/2022 of the Bydgoszcz University of Science and Technology. The authors are grateful to Damian Ledziński for granting access to the computing infrastructure built in the projects No. POIG.02.03.00-00-028/08 ‘PLATON—Science Services Platform’ and No. POIG.02.03.00-00-110/13 ‘Deploying high availability, critical services in Metropolitan Area Networks (MANHA)’.

Conflicts of Interest

The authors declare no conflict of interest.

References

  1. Holmberg, K.; Erdemir, A. Influence of tribology on global energy consumption, costs and emissions. Friction 2017, 5, 263–284. [Google Scholar] [CrossRef]
  2. Torzilli, P.A.; Dethmers, D.A.; Rose, D.E. Movement of interstitial water through loaded articular cartilage. J. Biomech. 1983, 16, 169–179. [Google Scholar] [CrossRef]
  3. Eschweiler, J.; Horn, N.; Rath, B.; Betsch, M.; Baroncini, A.; Tingart, M.; Migliorni, F. The biomechanics of cartilage—An overview. Life 2021, 11, 302. [Google Scholar] [CrossRef] [PubMed]
  4. Töyräs, J.; Lyyra-Laitinen, T.; Niinimäki, M.; Lindgren, R.; Nieminen, M.T.; Kiviranta, I.; Jurvelin, J.S. Estimation of the Young’s modulus of articular cartilage using an arthroscopic indentation instrument and ultrasonic measurement of tissue thickness. J. Biomech. 2001, 34, 251–256. [Google Scholar] [CrossRef]
  5. Stilz, M.; Raiteri, R.; Daniels, A.U.; VanLandingham, M.R.; Baschong, W.; Aebi, U. Dynamic elastic modulus of porcine articular cartilage determined at two different levels of tissue organization by indentation-type atomic force microscopy. Biophys. J. 2004, 86, 3269–3283. [Google Scholar] [CrossRef] [Green Version]
  6. Forster, H.; Fischer, J. The influence of loading time and lubricant on the friction of articular cartilage. Proc. Inst. Mech. Eng. 1996, 210, 109–119. [Google Scholar] [CrossRef]
  7. Schmidt, T.A.; Gastelum, N.S.; Nguyen, T.; Schumacher, B.L.; Sah, R.L. Boundary lubrication of articular cartilage. Role of synovial fluid constituets. Arthritis Rheum. 2007, 56, 882–891. [Google Scholar] [CrossRef]
  8. Spahn, G.; Wittig, R. Spannungs- und Bruchverhalten des gesunden Gelenkknorpels under axialer Belastung. Eine biomechanische Untersuchung. Zentralbl. Chir. 2003, 128, 78–82. [Google Scholar] [CrossRef]
  9. Seror, J.; Zhu, L.; Goldberg, R.; Day, A.J.; Klein, J. Supramolecular synergy in the boundary lubrication of synovial joints. Nat. Commun. 2015, 6, 6497. [Google Scholar] [CrossRef]
  10. Dedinaite, A.; Claesson, P.M. Synergies in lubrication. Phys. Chem. Chem. Phys. 2017, 19, 23677–23689. [Google Scholar] [CrossRef] [Green Version]
  11. Dedinaite, A.; Wieland, D.C.F.; Beldowski, P.; Claesson, P.M. Biolubrication synergy: Hyaluronan-phospholipid interactions at interfaces. Adv. Colloid Interface Sci. 2019, 274, 102050. [Google Scholar] [CrossRef]
  12. Briscoe, W.H. Aqueous boundaty lubrication: Molecular mechanisms, design strategy and terra incognita. Curr. Opin. Colloid Interf. Sci. 2017, 27, 1–8. [Google Scholar] [CrossRef] [Green Version]
  13. Lin, W.; Klein, J. Recent progress in cartilage lubrication. Adv. Mater. 2021, 33, 2005513. [Google Scholar] [CrossRef]
  14. Raj, A.; Wang, M.; Liu, C.; Ali, L.; Karlsson, N.G.; Claesson, P.M.; Dedinaite, A. Molecular synergy in biolubrication: The role of cartilage oligomeric matrix protein (COMP) in surface-structuring of lubricin. J. Colloid Interface Sci. 2017, 495, 200–206. [Google Scholar] [CrossRef]
  15. Wang, M.; Liu, C.; Thormann, E.; Dedinaite, A. Hyaluronan and phospholipid association in biolubrication. Biomacromolecules 2013, 14, 4198–4206. [Google Scholar] [CrossRef]
  16. Wang, M.; Zander, T.; Liu, X.; Liu, C.; Raj, A.; Wieland, D.C.F.; Garamus, V.M.; Willumeit-Römer, R.; Claesson, P.M.; Dedinaite, A. The effect of temperature on supported dipalmitoylphosphatidylcholine (DPPC) bilayers: Structure and lubrication performance. J. Colloid Interface Sci. 2015, 445, 84–92. [Google Scholar] [CrossRef] [Green Version]
  17. Raj, A.; Wang, M.; Zander, T.; Wieland, D.C.F.; Liu, X.; An, J.; Garamus, V.M.; Willumeit-Römer, R.; Fielden, M.L.; Claesson, P.M.; et al. Lubrication synergy: Mixture of hyaluronan and dipalmitoylphosphatidylcholine (DPPC) vesicles. J. Colloid Interface Sci. 2017, 488, 225–233. [Google Scholar] [CrossRef] [Green Version]
  18. Zander, T.; Wieland, D.C.F.; Raj, A.; Wang, M.; Nowak, B.; Krywka, C.; Dedinaite, A.; Claesson, P.M.; Garamus, V.M.; Schreyer, A.; et al. The influence of hyaluronan on the structure of a DPPC-bilayer under high pressures. Colloids Surf. B 2016, 142, 230–238. [Google Scholar] [CrossRef]
  19. Lin, W.; Liu, Z.; Kampf, N.; Klein, J. The role of hyaluronic acid in cartilage boundary lubrication. Cells 2020, 9, 1606. [Google Scholar] [CrossRef]
  20. Sorkin, R.; Kampf, N.; Zhu, L.; Klein, J. Hydration lubrication and shear-induced self-healing of lipid bilayer boundary lubricants in phosphatidylcholine dispersions. Soft Matter 2016, 12, 2773–2784. [Google Scholar] [CrossRef]
  21. Klein, J. Hydration lubrication. Friction 2013, 1, 1–23. [Google Scholar] [CrossRef] [Green Version]
  22. Cao, Y.; Klein, J. Lipids and lipid mixtures in boundary layers: From hydration lubrication to osteoarthritis. Curr. Opin. Colloid Interface Sci. 2022, 58, 101559. [Google Scholar] [CrossRef]
  23. Raviv, U.; Klein, J. Fluidity of bound hydration layers. Science 2002, 297, 1540–1543. [Google Scholar] [CrossRef] [Green Version]
  24. Drobek, T.; Spencer, N.D. Nanotribology of surface-grafted PEG layers in an aqueous environment. Langmuir 2008, 24, 1484–1488. [Google Scholar] [CrossRef]
  25. Perry, S.S.; Yan, X.; Limpoco, F.T.; Lee, S.; Müller, N.; Spencer, N.D. Tribological properties of poly(L-lysine)-graft-poly(ethylene glycol) films: Influence of polymer architecture and adsorbed conformation. ACS Appl. Mater. Interfaces 2009, 1, 1224–1230. [Google Scholar] [CrossRef]
  26. Ramakrishna, S.N.; Espinosa-Marzal, R.M.; Naik, V.V.; Nalam, P.C.; Spencer, N.D. Adhesion and friction properties of polymer brushes on rough surfaces: A gradient approach. Langmuir 2013, 29, 15251–15259. [Google Scholar] [CrossRef]
  27. Pettersson, T.; Naderi, A.; Makuska, R.; Claesson, P.M. Lubrication Properties of Bottle-Brush Polyelectrolytes: An AFM Study on the Effect of Side Chain and Charge Density. Langmuir 2008, 24, 3336–3347. [Google Scholar] [CrossRef]
  28. Liu, X.; Thormann, E.; Dedinaite, A.; Rutland, M.; Visnevskij, C.; Makuska, R.; Claesson, P.M. Low Friction and High Load Bearing Capacity Layers Formed by Cationic-block-Non-Ionic Bottle-Brush Copolymers in Aqueous Media. Soft Matter 2013, 9, 5361–5371. [Google Scholar] [CrossRef] [Green Version]
  29. Lin, W.; Mashiah, R.; Seror, J.; Kadar, A.; Dolkart, O.; Pritsch, T.; Goldberg, R.; Klein, J. Lipid-hyaluronan synergy strongly reduces intrasynovial tissue boundary friction. Acta Biomater. 2019, 83, 314–321. [Google Scholar] [CrossRef]
  30. Hilšer, P.; Sucha’nkova’, A.; Mendova’, K.; Elešič Filipič, K.; Daniel, M.; Vrbka, M. A new insight into more effective viscosupplementation based on the synergy of hyaluronic acid and phospholipids for cartilage friction reduction. Biotribology 2021, 25, 100166. [Google Scholar] [CrossRef]
  31. Lin, W.; Kluzek, M.; Iuster, N.; Shimoni, E.; Kampf, N.; Goldberg, R.; Klein, J. Cartilage-inspired, lipid-based boundary-lubricated hydrogels. Science 2020, 370, 335–338. [Google Scholar] [CrossRef] [PubMed]
  32. Huang, S.; Wang, B.; Zhao, X.L.; Li, S.; Liang, X.; Zeng, R.; Li, W.; Wang, X. Phospholipid reinforced p(AAm-co-AAc)/Fe3+ hydrogel with ultrahigh strength and superior tribological performance. Tribol. Int. 2022, 168, 107436. [Google Scholar] [CrossRef]
  33. Kim, S.; Thiessen, P.A.; Bolton, E.E.; Chen, J.; Fu, G.; Gindulyte, A.; Han, L.; He, J.; Shoemaker, B.A.; Wang, J.; et al. PubChem substance and compound databases. Nucleic Acid Res. 2016, 44, D1202–D1213. [Google Scholar] [CrossRef] [PubMed]
  34. Yeghiazaryan, G.A.; Poghosyan, A.H.; Shahinyan, A.A. Structural and dynamical features of hydrocarbon chains of dipalmitoylphosphatidylcholine (DPPC) molecules in phospholipid bilayers: A molecular dynamics study. New Electron. J. Nat. Sci. 2005, 1, 44–50. [Google Scholar]
  35. Neria, E.; Fischer, S.; Karplus, M. Simulation of activation free energies in molecular systems. J. Chem. Phys. 1996, 105, 1902–1921. [Google Scholar] [CrossRef]
  36. Duan, Y.; Wu, C.; Chowdhury, S.; Lee, M.C.; Xiong, G.; Zhang, W.; Yang, R.; Cieplak, P.; Luo, R.; Lee, T.; et al. A point-charge force field for molecular mechanics simulations of proteins based on condensed-phase quantum mechanical calculations. J. Comput. Chem. 2003, 24, 1999–2012. [Google Scholar] [CrossRef]
  37. Berendsen, H.J.C.; Postma, J.P.M.; van Gunsteren, W.F.; DiNola, A.; Haak, J.R. Molecular dynamics with coupling to an external bath. J. Chem. Phys. 1984, 81, 3684–3690. [Google Scholar] [CrossRef] [Green Version]
  38. Krieger, E.; Dunbrack, R.L., Jr.; Hooft, R.W.; Krieger, B. Assignment of protonation states in proteins and ligands: Combining pKa prediction with hydrogen bonding network optimization. Methods Mol. Biol. 2012, 819, 405–421. [Google Scholar]
  39. Beldowski, P.; Yuvan, S.; Dedinaite, A.; Claesson, P.M.; Pöschel, T. Interactions of a short hyaluronan chain with a phospholipid membrane. Colloid Surf. B 2019, 184, 110539. [Google Scholar] [CrossRef]
  40. Sorkin, R.; Dror, Y.; Kampf, N.; Klein, J. Mechanical stability and lubrication by phosphatidylcholine boundary layers in the vesicular and in the extended lamellar phases. Langmuir 2014, 30, 5005–5014. [Google Scholar] [CrossRef]
  41. Gale, L.R.; Coller, R.; Hargreaves, D.J.; Hills, B.A.; Crawford, R. The role of SAPL as a boundary lubricant in prosthetic joints. Tribol. Int. 2007, 40, 601–606. [Google Scholar] [CrossRef]
  42. Koynova, R.; Caffrey, M. Phases and phase transitions of the phophatidylcholines. Biochim. Biophys. Acta—Rev. Biomembr. 1998, 1376, 91–145. [Google Scholar] [CrossRef]
  43. Hertz, H. Über die berührung fester elastischer Körpen. J. Reine Angew. Math. 1881, 92, 156–171. [Google Scholar]
  44. Attard, P.; Parker, J.L. The Deformation and Adhesion of Elastic Bodies in Contact. Phys. Rev. A 1992, 46, 7959–7971. [Google Scholar] [CrossRef]
  45. Yoshizawa, H.; Chen, Y.-L.; Israelachvili, J. Fundamental mechanisms of interfacial friction. 1. Relation between adhesion and friction. J. Phys. Chem. 1993, 97, 4128–4140. [Google Scholar] [CrossRef]
  46. Rosenberg, K.J.; Goren, T.; Crokett, R.; Spencer, N.D. Load-induced transitions in the lubricity of adsorbed poly(L-lysine)-g-dextran as a function of polysaccharide chain density. ACS Appl. Mater. Interfaces 2011, 3, 3020–3025. [Google Scholar] [CrossRef]
  47. Blau, P.J. On the nature of running-in. Tribol. Int. 2005, 38, 1007–1012. [Google Scholar] [CrossRef]
  48. Drummond, C.J.; Rodriguez-Hernandez, J.; Lecommandouz, S.; Richetti, P. Boundary lubricant films under shear: Effect of roughness and adhesion. J. Chem. Phys. 2007, 126, 184906. [Google Scholar] [CrossRef]
  49. Gourdon, D.; Lin, Q.; Oroudjev, E.; Hansma, H.; Golan, Y.; Arad, S.; Israelachvili, J. Adhesion and stable friction provided by a subnanometer-thick monolayer of a natural polysaccharide. Langmuir 2008, 24, 1534–1540. [Google Scholar] [CrossRef]
  50. Li, J.C.M.; Zhang, C.; Luo, J. Superlubricity behavior with phosphoric acid-water network induced by rubbing. Langmuir 2009, 27, 9413–9417. [Google Scholar] [CrossRef]
  51. Wang, W.; Xie, G.; Luo, J. Superlubricity of black phosphorous as lubricant additive. ACS Appl. Mater. Interfaces 2018, 10, 43203–43210. [Google Scholar] [CrossRef] [PubMed]
  52. Dedinaite, A. Biomimetic lubrication. Soft Matter 2012, 8, 273–284. [Google Scholar] [CrossRef]
  53. Dedinaite, A.; Pettersson, T.; Mohanty, B.; Claesson, P.M. Lubrication by organized soft matter. Soft Matter 2010, 6, 1520–1526. [Google Scholar] [CrossRef]
  54. Dedinaite, A.; Claesson, P.M. How synergistic aqueous lubrication is mediated by natural and synthetic molecular aggregates. IOP Conf. Ser. Mater. Sci. Eng. 2019, 500, 012030. [Google Scholar] [CrossRef]
  55. Yan, X.; Perry, S.S.; Spencer, N.D.; Pasche, S.; De Paul, S.M.; Textor, M.; Lim, M.S. Reduction of friction at oxide interfaces upon polymer adsorption from aqueous solutions. Langmuir 2004, 20, 423–428. [Google Scholar] [CrossRef]
Figure 1. The structure of hyaluronate (top) and DPPC, (bottom). Hyaluronan consists of repeating units of D-glucuronic acid, GCU, and N-acetyl-D-glucosamine, NAG. Hyaluronan predominantly exists in anionic hyaluronate form at the pH found in the synovial fluid where the hydrogen on O6 is released. The numbers are assigned to the oxygen atoms and used when discussing hydrogen bond formation between specific atoms.
Colloids 06 00038 g001
Figure 2. Top: Map of number of HA–DPPC hydrogen bonds between different atom classes in HA shown on the y-axis and DPPC shown on the x-axis in NaCl solution (see Figure 1). These are all the H-bonds found during the simulation after equilibration (the last 20 ns of the simulation). Copyright (2019), with permission from Elsevier [39]. Middle: A snapshot illustrating hydrogen bonds (green dashed lines) between HA (represented by ball-stick model) and DPPC (represented by stick model). Atoms are presented by colours as follows: oxygen—red, carbon—turquoise, hydrogen—white, phosphorus—yellow, nitrogen—dark blue. Bottom: A snapshot illustrating water-mediated hydrogen bonds (green dashed lines) between HA and DPPC. In the middle and bottom panels, parts of the HA and DPPC structures are hidden for better visualization of hydrogen bonds inside the complex.
Colloids 06 00038 g002
Figure 3. Friction force as a function of normal load. Data for DPPC bilayers on silica (unfilled circles) as well as for an adsorbed layer formed after 40 min adsorption from a 155 mM NaCl solution containing 0.5 mg/mL DPPC and 0.5 mg/mL hyaluronan, followed by rinsing (red filled circles). Additionally illustrated is one friction measurement depicting high friction force at a normal force of 10 nN (black triangles). The temperature was 47 °C. The upper and lower dashed lines have a slope of 0.03 and 0.01, respectively.
Colloids 06 00038 g003
Figure 4. Friction coefficient between borosilicate surfaces across PBS solution (left panel) and across PBS solution containing 0.5 mg/mL HA (right panel) as a function of time. Numbers 1, 2 and 3 displayed after the load (5 N or 10 N) report the order in which the load was applied.
Colloids 06 00038 g004
Figure 5. Friction coefficient between macroscopic borosilicate surfaces across PBS containing 0.5 mg/mL DPPC vesicle dispersions. Numbers 1, 2 and 3 displayed after the load (5 N or 10 N) report the order in which the load was applied. The dotted line corresponds to a friction coefficient of 0.02, similar to what was observed for DPPC bilayers at the nanoscale.
Colloids 06 00038 g005
Figure 6. Friction coefficient between borosilicate surfaces carrying a preadsorbed DPPC bilayer across PBS solution. Numbers 1, 2 and 3 displayed after the load (5 N or 10 N) report the order in which the load was applied.
Colloids 06 00038 g006
Figure 7. Friction coefficient between borosilicate surfaces across a DPPC/HA mixture as a function of time. The DPPC concentration was 0.5 mg/mL and the HA concentration was also 0.5 mg/mL. Two sets of experiments are shown. Numbers 1, 2 and 3 displayed after the load (5 N or 10 N) report the order in which the load was applied. The black dotted line corresponds to the friction coefficient of 0.02, similar to that observed at the nanoscale.
Colloids 06 00038 g007
Figure 8. Friction coefficient between borosilicate surfaces carrying a preadsorbed DPPC–HA composite layer across PBS solution. Numbers 1, 2 and 3 displayed after the load (5 N or 10 N) report the order in which the load was applied.
Colloids 06 00038 g008
Figure 9. The friction coefficient as a function of temperature measured in MTM in pure PBS solution and in PBS containing HA or DPPC vesicles at concentrations of 0.5 mg/mL.
Colloids 06 00038 g009
Table 1. Comparison of conditions during macroscale and nanoscale friction measurements.
MTMAFM
Ball diameter (mm)19.050.010
Rms roughness (nm)12.9 *0.2 **
Load (N)5 and 10up to 5 × 10⁻⁸
Sliding speed (mm/s)100.002
Average pressure (MPa)160 and 210up to 54
Contact area (µm2)3000 and 49009.3 × 10−4
Hersey number2 × 10−10 and 1 × 10−108 × 10−10
* Measured with stylus profilometer; ** Measured with AFM.
Publisher’s Note: MDPI stays neutral with regard to jurisdictional claims in published maps and institutional affiliations.

