Article

Optimization of Isotactic Polypropylene Nanocomposite Content of Tungsten Carbide for Material Extrusion 3D Printing

by
Amalia Moutsopoulou
1,
Markos Petousis
1,
Nikolaos Michailidis
2,3,
Nikolaos Mountakis
1,
Apostolos Argyros
2,3,
Vassilis Papadakis
4,5,
Mariza Spiridaki
1,
Chrysa Charou
1,
Ioannis Ntintakis
1 and
Nectarios Vidakis
1,*
1
Department of Mechanical Engineering, Hellenic Mediterranean University, 71410 Heraklion, Greece
2
Physical Metallurgy Laboratory, Mechanical Engineering Department, School of Engineering, Aristotle University of Thessaloniki, 54124 Thessaloniki, Greece
3
Centre for Research & Development of Advanced Materials (CERDAM), Center for Interdisciplinary Research and Innovation, Balkan Centre, 10th Km Thessaloniki-Thermi Road, 57001 Thessaloniki, Greece
4
Department of Industrial Design and Production Engineering, University of West Attica, 12244 Athens, Greece
5
Institute of Electronic Structure and Laser of the Foundation for Research and Technology-Hellas (IESL-FORTH)—Hellas, 70013 Heraklion, Greece
*
Author to whom correspondence should be addressed.
J. Compos. Sci. 2023, 7(9), 393; https://doi.org/10.3390/jcs7090393
Submission received: 17 August 2023 / Revised: 7 September 2023 / Accepted: 13 September 2023 / Published: 15 September 2023
(This article belongs to the Special Issue Feature Papers in Journal of Composites Science in 2023)

Abstract

:
In this study, innovative nanocomposite materials for material extrusion (MEX) 3D printing were developed using a polypropylene (PP) polymer with tungsten carbide (WC) nanopowder. The raw materials were converted into filaments using thermomechanical extrusion. The samples were then fabricated for testing according to the international standards. Extensive mechanical testing was performed on the 3D-printed specimens, including tensile, impact, flexural, and microhardness assessments. In addition, the impact of ceramic additive loading was examined. The thermal and stoichiometric characteristics of the nanocomposites were examined using thermogravimetric analysis, energy-dispersive X-ray spectroscopy, differential scanning calorimetry, and Raman spectroscopy. The 3D-printed shape, quality, and fracture process of the specimens were examined using scanning electron microscopy. The results showed that the filler significantly enhanced the mechanical characteristics of the matrix polymer without reducing its thermal stability or processability. Notably, the highest level of nanocomposite mechanical responsiveness was achieved through the inclusion of 6.0 and 8.0 wt. % fillers. The 10.0 wt. % loading nanocomposite showed significantly increased microhardness, indicating a possible high resistance to wear.

1. Introduction

A variety of techniques for building 3D objects are referred to collectively as “additive manufacturing or processing” (AM) [1,2] due to the layer-by-layer procedure followed for building parts from 3D digital geometrical data [3,4,5]. Compared with conventional production techniques, this technology’s main benefits are faster cycle times and lower costs [6]. Additionally, the value of AM becomes increasingly obvious as product complexity increases [7]. Consequently, AM offers considerable advantages to both customers and industries, including automotive [8,9,10], aerospace [11,12,13], and biotechnology [14,15,16,17] sectors.
Thermoplastics are in increasing demand across a range of industries, including the automotive and electronics sectors, owing to their lightweight, simple-to-process nature, and affordable price [18]. Recently, high-performance polymers in pure or composite forms have also been investigated for use in advanced applications, thereby expanding the field of 3D printing [19,20]. The heated extrusion process utilized in the fused filament fabrication (FFF) method solidifies a polymer extruded via a nozzle to create a three-dimensional object [21]. The operator must properly set up several process parameters before the 3D printing process begins, including the part orientation (PO), layer thickness (LT), and temperature (chamber, nozzle, and bed), to produce 3D printing results successfully and accurately [22,23,24,25,26,27]. In FFF, the optimization of process parameters is a widely sought-after research area [28,29]. However, by selecting the optimal set of process variables through parameter analysis, the characteristics of a part can only be improved to a certain extent [30]. This is because of the limitations of the fundamental material characteristics of the raw thermoplastic materials utilized in the FFF process [31].
The filament composition, in combination with the 3D printing settings, directly influences the mechanical characteristics of 3D-printed specimens [32]. Exploring innovative filament materials that can be used to create components of superior quality and broaden applications is crucial as the procedure parameter analysis improves. There is potential for the evaluation of composite materials, particularly polymeric matrix composites, as feasible alternatives to employing pure thermoplastics as filament materials [31]. Researchers have used different additives, such as particles and fibers, with thermoplastic polymers to generate composite materials in filament forms with exceptional characteristics [33]. Research is directed in different directions, according to the requirements of each application. Owing to their distinct characteristics and accessibility, composite materials for FFF filaments have gained substantial attention over the years [24,34]. To enable successful 3D printing utilizing the FFF technique, several elements must be considered while creating composite filaments, such as meeting particular specifications, including the glass transition temperature, melting temperatures, ductility, crystallinity, viscosity, and tensile qualities [31]. The adherence of the polymer and additives is also essential to the quality of the composite. Choosing the proper matrix and enhancement combinations is crucial for the production of composite filaments because it affects a variety of component characteristics, such as bonding and void content [35].
One commonly used commodity polymer with a wide range of applications is polypropylene (PP) [36,37]. It is widely utilized as a matrix material in numerous industrial applications, especially in the automobile industry. PP is frequently used in the production of parts, including covering panels, vehicle door sides, and interior coverings for cars [38]. Owing to its high heat resistance, excellent strength and manufacturing properties, nontoxic nature, insulation, and affordability, PP plastic has long been a common material in daily life [39]. However, mechanical improvement is still needed for polypropylene to expand its use as an engineering material [40,41,42,43]. One of the most common solutions to this problem is fiber-reinforced polypropylene [44,45,46,47,48]. Short carbon-fiber-enhanced polypropylene (SCF/PP) composites were developed and suggested by Rezaei et al. to replace steel bonnets. They found that the characteristics of the SCF/PP composite, which included 10.0 wt. % SCF were equivalent to those of carbon steel [49].
Ceramic composites are also attractive because they combine relatively high strength and low crack-resistant features and are becoming more prevalent across a variety of industries [50,51]. Owing to their superior mechanical performance, ceramics are popular for demanding applications, such as in the coating of cutting tools [52]. Additionally, owing to their high hardness, wear resistance, and temperature stability, carbide ceramics are frequently used in numerous applications, such as cutting and drilling tools, providing efficient and accurate machining of numerous materials across a variety of industrial applications [52]. Tungsten carbide (WC) is among the most promising ceramic materials because of its strength, high hardness, good chemical stability, low density, high stiffness, and upgraded elasticity at high temperatures [53]. The mechanical characteristics of composite materials have been reported to be improved with the inclusion of tungsten carbide nanoparticles [54,55]. Owing to the high hardness of tungsten carbide, this composite displays outstanding wear resistance and strength [56]. A composite that results from adding tungsten carbide reinforcement to the matrix also provides better mechanical characteristics, making it very suitable for applications in which hardness, strength, and wear resistance are important considerations [57]. The addition of tungsten carbide (WC) nanoparticles to epoxy polymer nanocomposites has been shown to alter their mechanical and physical characteristics. The results showed that, with a particle loading of 2 wt. %, both tensile and flexural strength were improved. However, a reduction in the mechanical characteristics was observed when the particle percentage was further increased [58].
The incorporation of ceramic fillers in material extrusion (MEX) 3D printing (3DP) has demonstrated a notable ability to substantially enhance the performance of polymeric matrices. This enhancement has been investigated and documented in studies involving acrylonitrile butadiene styrene (ABS) [11] and medical-grade polyamide 12 (PA12) [59]. The observed increase in tensile strength, attributed to the reinforcing impact, ranges from slightly below 20% to over 45% [59]. In MEX 3D printing, WC has been used as a reinforcement agent for acrylonitrile butadiene styrene (ABS) polymer with impressive results, especially in the microhardness of nanocomposites with a loading of 10.0 wt. % [60].
In this study, the mechanical characteristics of PP-based composites enhanced with tungsten carbide particles were investigated. The purpose of this study was to develop nanocomposites with enhanced mechanical performance comparable to that of the MEX 3D printing technique. The hypothesis was to evaluate the reinforcement effect of the WC nanoparticles on the PP polymeric matrix. We also sought to assess the mechanical and thermal properties of the samples. A detailed series of thermomechanical experiments was carried out on both the 3D-printed objects and the fabricated filaments to comprehensively evaluate the mechanical behavior of the newly discovered compounds. According to ASTM regulations, these tests allowed for a thorough examination of the mechanical properties of the materials at various temperatures and stress levels. Thermogravimetric analysis (TGA), which measures weight fluctuations with temperature and offers information on the thermal stability and degradability of the materials, was utilized to evaluate the thermal stability of the generated composites at high temperatures. Moreover, the chemical structures of the substances were examined using Raman spectroscopy and energy-dispersive spectroscopy (EDS) to identify and describe the specific components contained in the samples. In addition, scanning electron microscopy (SEM) was used to inspect the surface microstructure of the 3D-printed items and filaments. To better understand the surface characteristics and structural qualities of the materials, this study focuses on understanding how the amount of tungsten carbide influences the quality and shape of the finished products.

2. Materials and Methods

A schematic of the investigational process utilized to create the specimens for testing and the subsequent examination of their rheological, morphological, mechanical, and thermal characteristics can be found in the Supplementary Materials (Figure S1).

2.1. Materials

Nanocompounds were fabricated from raw materials using a material extrusion procedure. KRITILEN PP, a coarse powder purchased from Plastika Kritis S.A. (Heraklion, Crete, Greece), was used as the matrix material in this study. According to the manufacturer’s datasheet, polypropylene is supplied in the form of an unstabilized, free-flowing powder. However, the exact particle size is not determined. According to the manufacturer’s datasheet, the melting temperature derived from the differential scanning calorimetry (DSC) is 161 °C.
The PP polymer was mixed with a tungsten carbide additive to create nanocomposites. WC nanopowder, obtained from Nanographi, located in Ankara, Turkey, has a purity level of 99.9%. Its particle size ranges between 150 and 200 nm, while its specific surface area measures from 1.5 to 2.0 m2/g. Notably, it possesses a true density of 15.7 g/cm3, a high melting point of 2870 °C, and is characterized by its hexagonal crystal phase.

2.2. Development of Nanocompounds

Field-emission SEM (JSM-IT700HR, Jeol Ltd., Tokyo, Japan) was used to inspect the WC nanopowder. Figure 1 displays the outcomes of the SEM, EDS elemental analysis, and EDS mapping investigations employed to ascertain the morphological and chemical composition (EDS was performed using the same SEM apparatus). When the elemental composition of WC powder was examined, it was found to include large quantities of tungsten (W) and carbon (C), as shown by the separate peaks in the EDS data in Figure 1B. Unexpectedly, oxygen (O) (approximately 1.62% of the total mass) was also detected. This oxygen most likely originated from the moisture that was present during the examination. According to the EDS graph, elemental analysis of the WC particles and ingredients specified in the producer’s powder formulation was carried out. Additionally, the SEM images, as shown in Figure 1C,D, corroborated the form of the WC particles. Figure 1E illustrates the EDS map of the tungsten (W) element in the WC particles, which indicates that it is uniformly distributed throughout the particles, with only a few tiny gaps or isolated areas, suggesting minor variations in W concentration or areas without particles in the observation area.
The raw ingredients underwent a crucial drying procedure at 60 °C for 24 h before fabricating the nanocomposites. This process was essential to eliminate any remaining moisture and to ensure the excellent quality and integrity of the final nanocomposites. After drying, the first step in the fabrication process was to prepare nanocomposites with different amounts of fillers. The WC filler was combined with raw PP thermoplastic material at concentrations of 2.0, 4.0, 6.0, 8.0, and 10.0 percent. A high-wattage (500 W) blender operating at 23 °C was initially used to scatter WC nanoparticles within the PP polymer. While the blender was running at 4000 rpm for 30 min, each mixture comprising a specific concentration of the raw components (WC and PP) was stirred. The resulting mixtures underwent an additional drying cycle in the subsequent phase. It should be noted that to specify the filler loadings prepared herein, nanocomposites were prepared with 2 wt. % filler loading. Mechanical tests were also conducted. Then, nanocomposites were prepared and tested as the filler loading was increased by 2 wt. %. This process continued, and the experiments were stopped when the mechanical performance started to constantly decrease in the prepared nanocomposites. The saturation of the filler had a negative effect on the mechanical response of the composites, and this was the outcome in most of the tests with the highest filler loading (10.0 wt. %). Therefore, no further increase in filler loading was attempted, as it would provide no useful information.
A two-step approach was used to obtain the best possible distribution of WC filler in the matrix material. First, a Noztek Pro (Noztek, Shoreham, UK) extruder was used to combine the pure materials. In this thermomechanical extrusion process, the materials are mixed inside the chamber with the screw of the extruder and converted into a nanocomposite filament. Filaments were produced for each nanocomposite. The filaments were then processed using a shredder manufactured by 3devo (located in Utrecht, The Netherlands) to produce pellets. These pellets were subsequently subjected to a second extrusion procedure using a 3D Evo composer (from 3devo located in Utrecht, Netherlands), which had a screw with a geometry intended for effective material blending. The result of this operation was the production of a filament appropriate for the FFF 3DP method. Then, filaments with a nominal diameter of 1.75 mm were prepared. Identical extrusion parameters were used for all PP/WC compounds and pure PP. Preliminary tests were performed to determine these conditions. Zones 1 and 4 of the heating system in the extruder chamber were maintained at 195 °C, while zones 2 and 3 were adjusted to a constant temperature of 205 °C. For filament extrusion, the screw rotation speed was 3.0 rpm, and the fan speed was 45%. A schematic of the filament production process in the extruder is presented in Supplementary Materials (please see Figure S2).

2.3. Manufacturing the 3D-Printed Specimens

The two extrusion processes were used to fabricate filaments of PP/WC nanocomposites and a pure PP polymer, which were used to assess the mechanical characteristics of the composites. An Intamsys Funmat HT 3D printer (manufactured by Intamsys, Shanghai, China) was used to produce 3DP specimens utilizing the filaments obtained from the extrusion process. The 3D printer parameters were defined before 3D printing by running tests on the Intamsuite software platform. For each experiment, the specimens were required to meet the dimensional requirements outlined in relevant ASTM standards. A relevant standard was applied to each mechanical test. A summary of the 3D printing settings, specimen shapes, and 3D printing infill patterns is shown in Figure 2.

2.4. Assessing Thermal and Rheological Characteristics

TGA was carried out in a nitrogen environment using Perkin Elmer Diamond equipment (Waltham, MA, USA). The goal was to determine the extent to which the composite materials retained their structural integrity at high temperatures. Part of the analysis involved observing the weight loss as the temperature progressively rose from ambient temperature to 550 °C at a rate of 10 °C/min. A nitrogen atmosphere was used for all the measurements throughout the analysis. TGA measurements were conducted according to the ASTM E1131 standard and the literature [61]. The literature suggests temperatures of up to 600 °C for polymers; however, we used 550 °C in this study because the PP polymer was fully decomposed at this temperature. WC nanoparticles have a melting point of 2867 °C; therefore, TGA is not expected to be affected by the temperature range applied.
Differential scanning calorimetry (DSC) measurements were also performed using a Discovery Series DSC-25 device manufactured by TA Instruments (New Castle, DE, USA). The DSC analysis temperature cycle consisted of an initial rise to 300 °C, a drop to 25 °C, and a final rise to the starting temperature in a cyclic range of 25–300–25 °C. The specimens were heated at a constant rate of 15 °C/min during the measurements. Differential scanning calorimeter measurements were conducted following ASTM D3418. Because the nominal melting point of the PP polymer is approximately 160 °C, there is no point in applying temperatures higher than 300 °C, and the temperature range is from room temperature to 300 °C and cooling to room temperature again. This is common practice, as indicated in the literature [62].
Furthermore, two parallel plates, namely a temperature-controlled environmental test chamber and a DHR-20 Rheometer from TA Instruments (specifically, Discovery Hybrid Rotational Rheometer, New Castle, DE, USA), were used for the rheological analysis. The objective was to evaluate the flow behavior of the polymer through a hole with predetermined dimensions under particular pressure and temperature conditions. Each data point during the tests was logged for ten seconds to prevent overheating or other problems.

2.5. Evaluation Using Raman Spectroscopy

Measurements for Raman Analysis were performed under laboratory conditions using a LabRAM-HR Raman Spectrometer (HORIBA Scientific, Kyoto, Japan) with a laser module with 90 mW of power at 532 nm irradiated samples. Microscopic excitation and imaging were achieved using a 50× Olympus objective lens (LMPlanFL N) with a Numerical Aperture and a 10.60 mm working distance.
The resulting laser energy on the sample was 2 mW utilizing a 5.0% neutral density filter, the Raman spectral resolution was approximately 2.0 cm−1, and the imaging resolution was measured to be 1.7 μm horizontally and 2.0 μm axially. The spectral acquisition range was between 50 and 3900 cm−1 with a 5 s exposure time per point and five accumulations. All irradiated areas were visually inspected using a microscope for any discoloration or degradation.

2.6. Quality Evaluation of the Filaments

Researchers completed several experiments before using the filaments created for 3D-printed test samples. These tests were used to assess the tensile strength, diameter, and surface structure of the filaments. A closed-loop system of controls was used to constantly monitor the filament diameter during its production to ensure compliance with requirements, employing a 3devo Composer extruder from 3devo, Utrecht, The Netherlands. Additionally, the diameter was measured at random cross-sections after the production of the filaments using a digital caliper. The tensile strength of the filaments was assessed using an Imada MX-2 device (Imada Inc., Northbrook, IL, USA). The experiments were performed at a constant speed of 10.0 mm per minute, with the samples held firmly in the apparatus using conventional grips. Testing was carried out on five samples of each composite.

2.7. Mechanical Evaluation

Ambient conditions were maintained at 23 °C and 55% humidity during all tests. During the testing process, the consistency of the results may be affected by environmental consistency. The 3D-printed specimens in terms of characteristics such as strength, toughness, and capacity of deformation were evaluated using a range of tests following ASTM standards. These experiments were performed to comprehensively evaluate the fundamental mechanical characteristics of these materials.
Five samples of PP composites with WC particles were prepared and subjected to a variety of tests using different instruments and guidelines. An Imada MX-2 machine, which was provided by Imada Inc. (Northbrook, IL, USA), was used for tensile testing along with standard grips. In the flexural test, the Imada MX2 apparatus was used in a three-point bending arrangement with a support span of 52 mm and a strain rate of 10 mm/min. Charpy notched samples were used for the impact tests, which were conducted using a Terco MT-220 apparatus (Kungens Kurva, Sweden). A height of 367 mm was used to remove the hammer. An InnovaTest-300 apparatus (from Maastricht, The Netherlands) was used to measure the microhardness. Vickers tip measurements were performed with a 200 gF load over 10 s for each measurement. All mechanical properties determined from the data derived from the experiments were calculated following the instructions of the corresponding standards. The toughness was calculated using the stress–strain curve. This is the area below the curve, which is the energy absorbed by the material during the test. It was calculated as the integral of stress vs. strain for each specimen tested, and the average value and deviation for each case studied were then calculated [63].

2.8. Morphology and Structure of 3D-Printed Specimens

The shape and structure of the 3D-printed materials were examined using a field-emission scanning electron microscope (JSM-IT700HR) provided by Jeol Ltd. (Tokyo, Japan). A 20 kV voltage and high vacuum were used. Scanning electron microscopy was used to capture images of the samples at various magnifications, closely observing the fractured and side surfaces of the gold-sputtered specimens.

3. Results

3.1. Results from Raman Spectroscopy

The Raman spectra of raw PP and PP/WC mixtures are shown in Figure 3. Table 1 lists the associated Raman peaks from the pure PP specimens found in the literature. No clear differences were observed with the addition of tungsten carbide to the pure PP samples.

3.2. Thermogravimetric and Differential Scanning Calorimetric Analysis

Figure 4A shows the TGA plots, which indicate how the weight loss varies with temperature for both the composites under study and pure PP. These graphs provide important details regarding the thermal properties and disintegration patterns of the material. According to the findings displayed in Figure 4A, the integration of WC particles did not affect the PP material’s thermal stability. At approximately 390 °C, all composites began to show acute weight loss (except for the 10 wt. % nanocomposite). The unfilled PP showed a response at a slightly lower temperature than that of the nanocomposites. The increase in the filler loading in the nanocomposites shifted the temperature at which the acute weight loss occurred to slightly higher values. This was more intense for the 10.0 wt. % nanocomposite, which starts to drastically decompose at about 450 °C. Figure 4A bar graphs show the weight remaining after TGA. These quantities agree with the WC amount (concentration) of each nanocompound. The results of the DSC investigation are shown in Figure 4B. The addition of WC nanoparticles negligibly changed the phase-change temperature of the unfilled PP. It should be mentioned that the melting temperature derived with DSC in the study was very close to the nominal melting temperature of the PP polymer provided in its datasheet. This indicates that the results of this study are reliable.

3.3. Rheometric Assessment

The viscosity and stress of the samples are displayed on logarithmic axes versus the shear rate in Figure 5A. As the shear rate increased, the viscosity generally decreased for all samples, suggesting a non-Newtonian, pseudoplastic, or shear-thinning tendency [74]. The rheological charts in Figure 5A show that the viscosity decreases as the shear rate increases. The mobility and intermolecular relationships of the polymer chains can be affected by an increase in the WC content, which can reduce the viscosity of the compounds at higher shear rates. At low shear rates, the unfilled PP polymer had a lower viscosity than that of the nanocomposites. As the shear rates increased, this changed, and 4.0, 6.0, and 8.0 wt. % nanocomposites had lower viscosity than the unfilled PP thermoplastic, as shown in the graphs. However, these outcomes should also be correlated with MFR measurements to be conclusive.
The melt flow rate (MFR) of each sample is shown in Figure 5B as a function of the additive weight percentage. Comparing the PP/WC composites and pure PP, it was found that the raw PP had the greatest MFR. The correlation of lower viscosity with a greater MFR suggests that the viscosity of the WC nanoparticles included in the composites overall decreased. This finding is consistent with the rheological charts (especially at lower shear rates), which showed that the inclusion of WC nanoparticles reduced the viscosity and, in turn, increased the MFR.

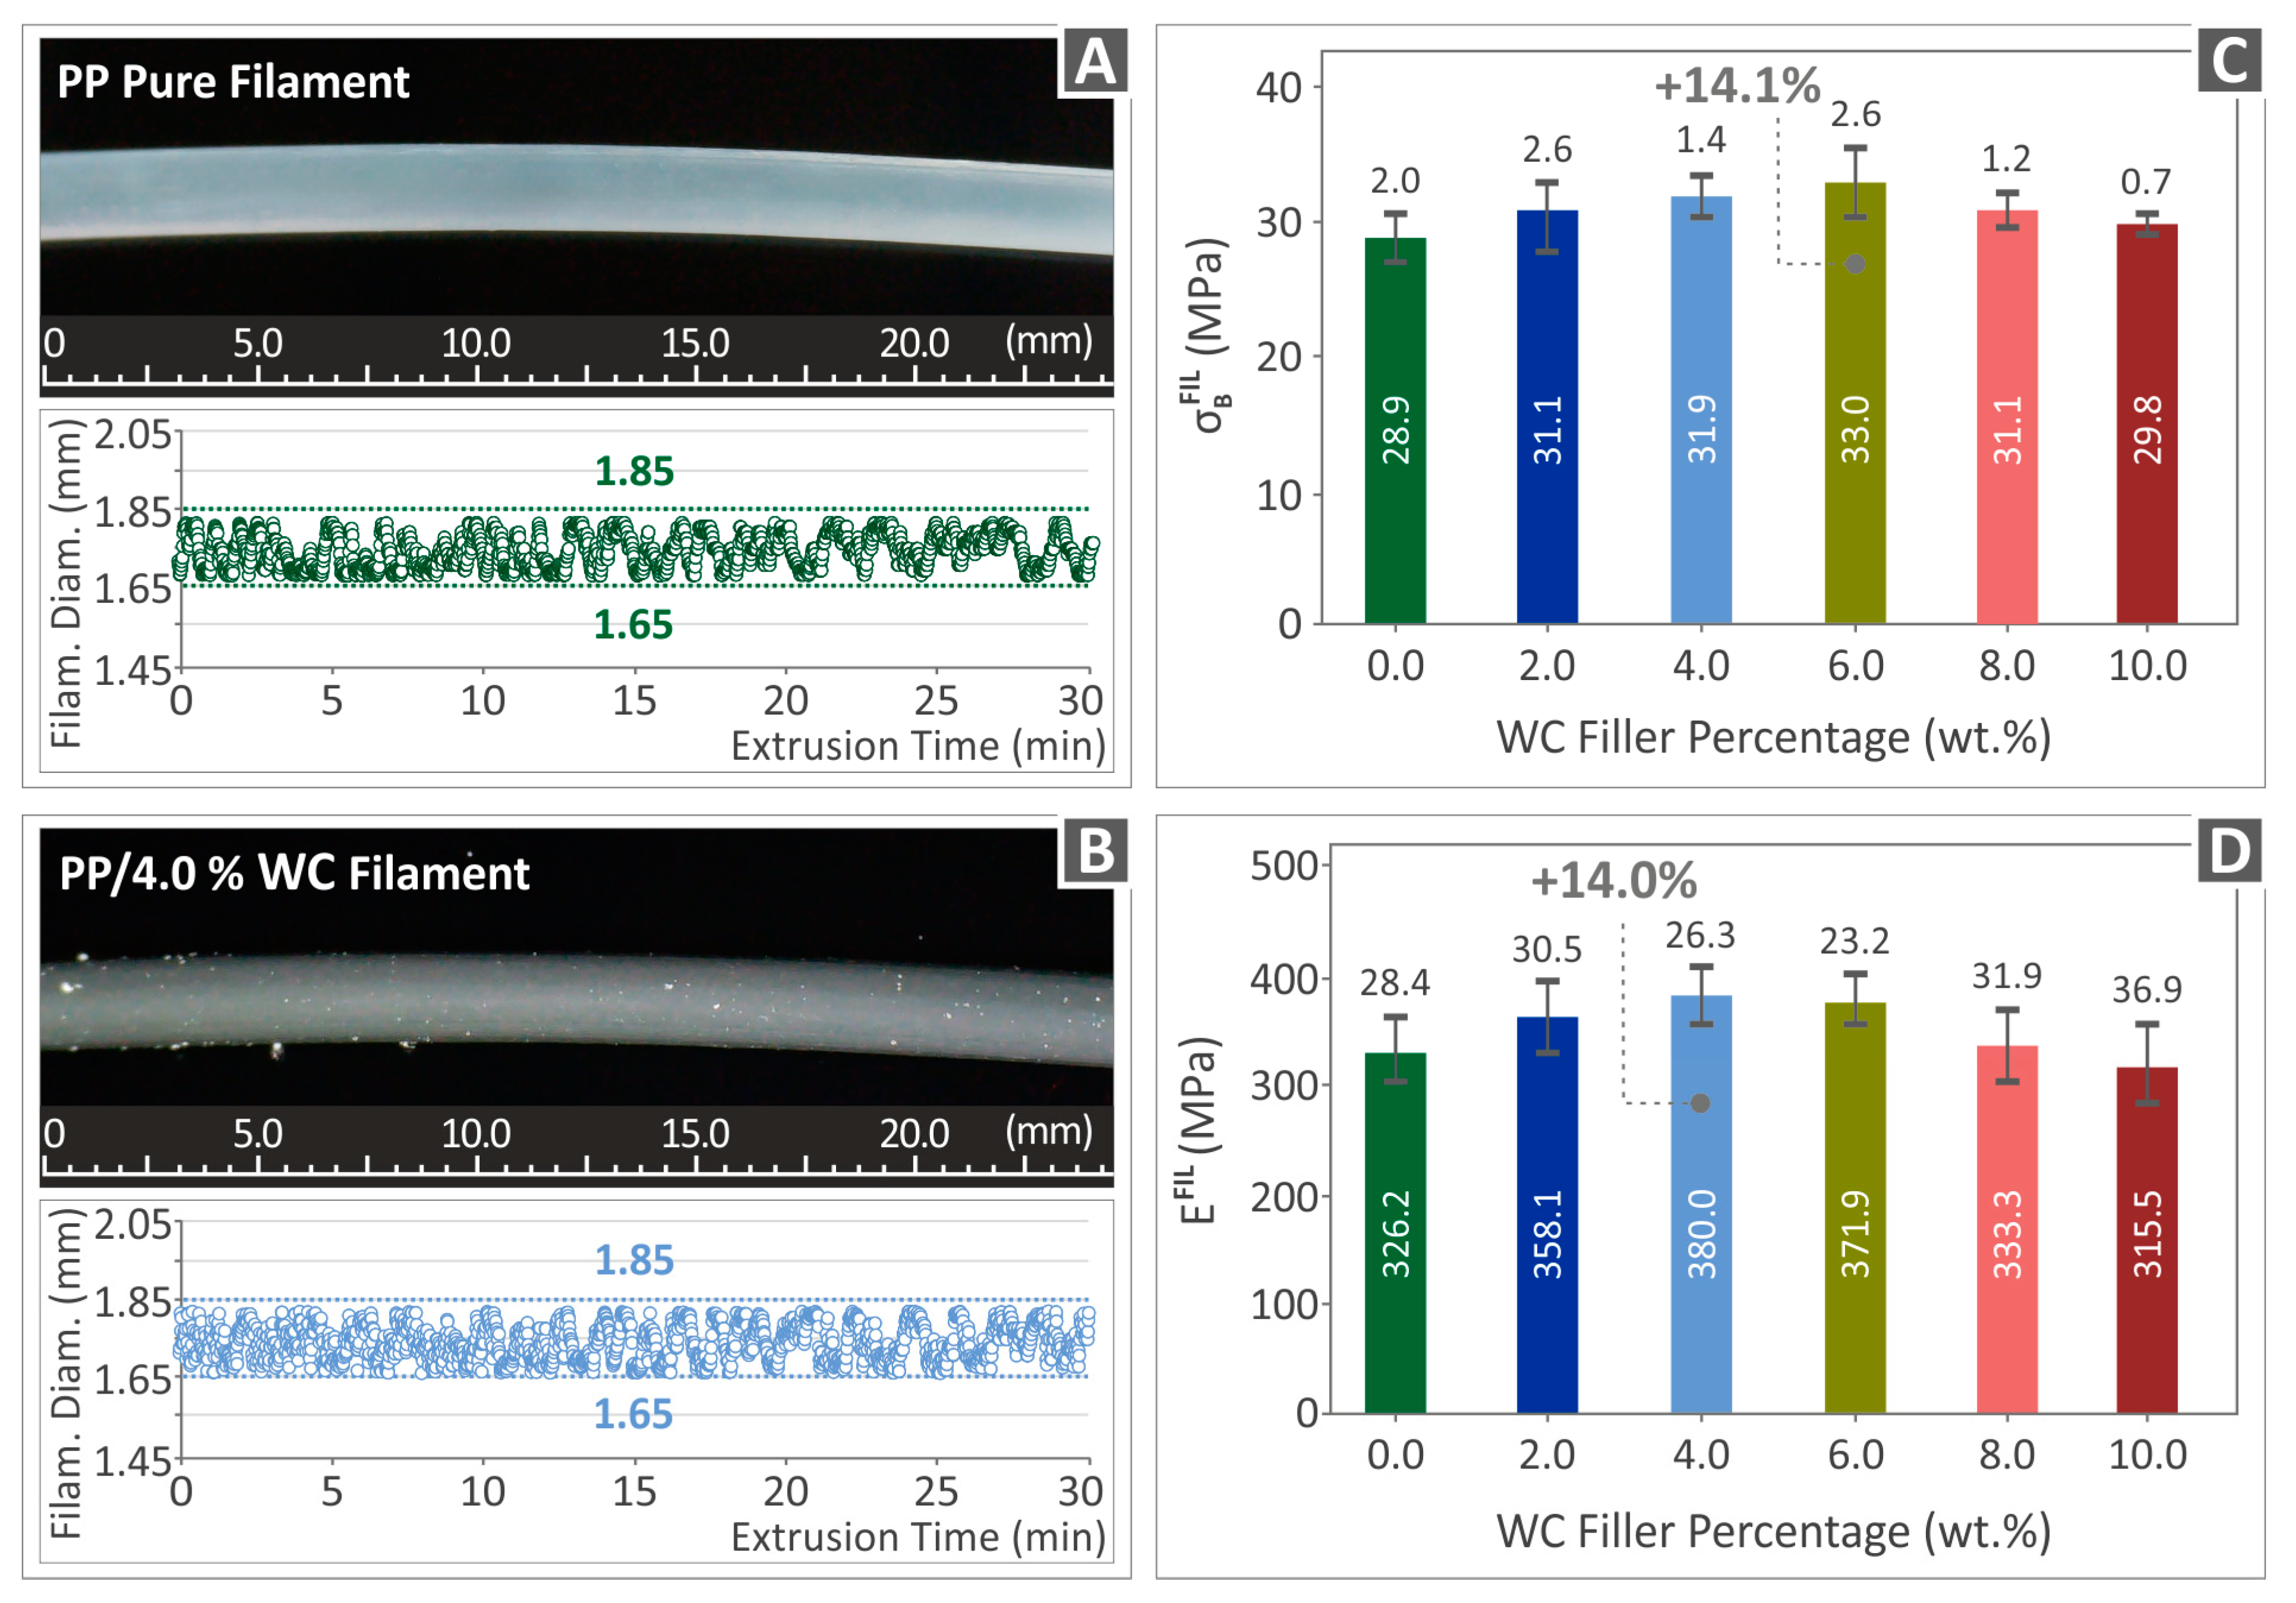
3.4. Filament Performance Analysis

Close-loop filament diameter monitoring was performed on a 3devo composer extruder (supplied by 3devo B.V., situated in Utrecht, The Netherlands). As a result, the filament diameter remained approximately constant and within a predetermined range, guaranteeing its homogeneity and compliance with the MEX 3D printing process.
Different filament segments are shown in Figure 6A,B, along with the in-process diameter measurements. An OZR-5 optical stereoscope (Kern & Sohn GmbH, Albstadt, Germany) was used to capture the images. The outcomes for the two distinct composites, pure PP and PP/WC (4.0 wt. %), are shown in these figures. The findings demonstrate that all the filaments produced have minor variations in their diameter, which are deemed appropriate for MEX 3D printing at 200 μm. This fluctuation was not exceeded by any of the real-time diameter volumes obtained through the extrusion method, which highlights the accuracy of the experimental setup and method. Optical stereoscopic views in Figure 6A,B show that the side surface of the filaments is roughly smooth with small flaws. These findings support the fact that the filaments generated were of good quality and integrity, making them appropriate for 3D printing using the MEX method.
Figure 6C,D show the evaluation of the tensile strength of the filaments. The PP/WC composite with 6.0 wt. % had the highest tensile strength of all the concentrations tested, measuring 33 MPa, 14.1% over the pure PP filament. Notably, compared with the pure PP filaments, all the composite filaments exhibited higher tensile strengths. Figure 6C also displays the outcomes for the elastic tensile modulus of the filaments. Again, it is clear that all the composite filaments showed higher values of the modulus of elasticity than pure PP. However, the PP/WC 10.0 wt. % composite was the only combination showing a small reduction in elasticity modulus. The PP/WC composite with a weight percentage of 4.0 was found to have the highest modulus of elasticity, 380 MPa, 14% greater than that of pure PP. This proves that the addition of WC to the composite improves the overall mechanical properties of the filaments by increasing their tensile strength and elastic modulus.

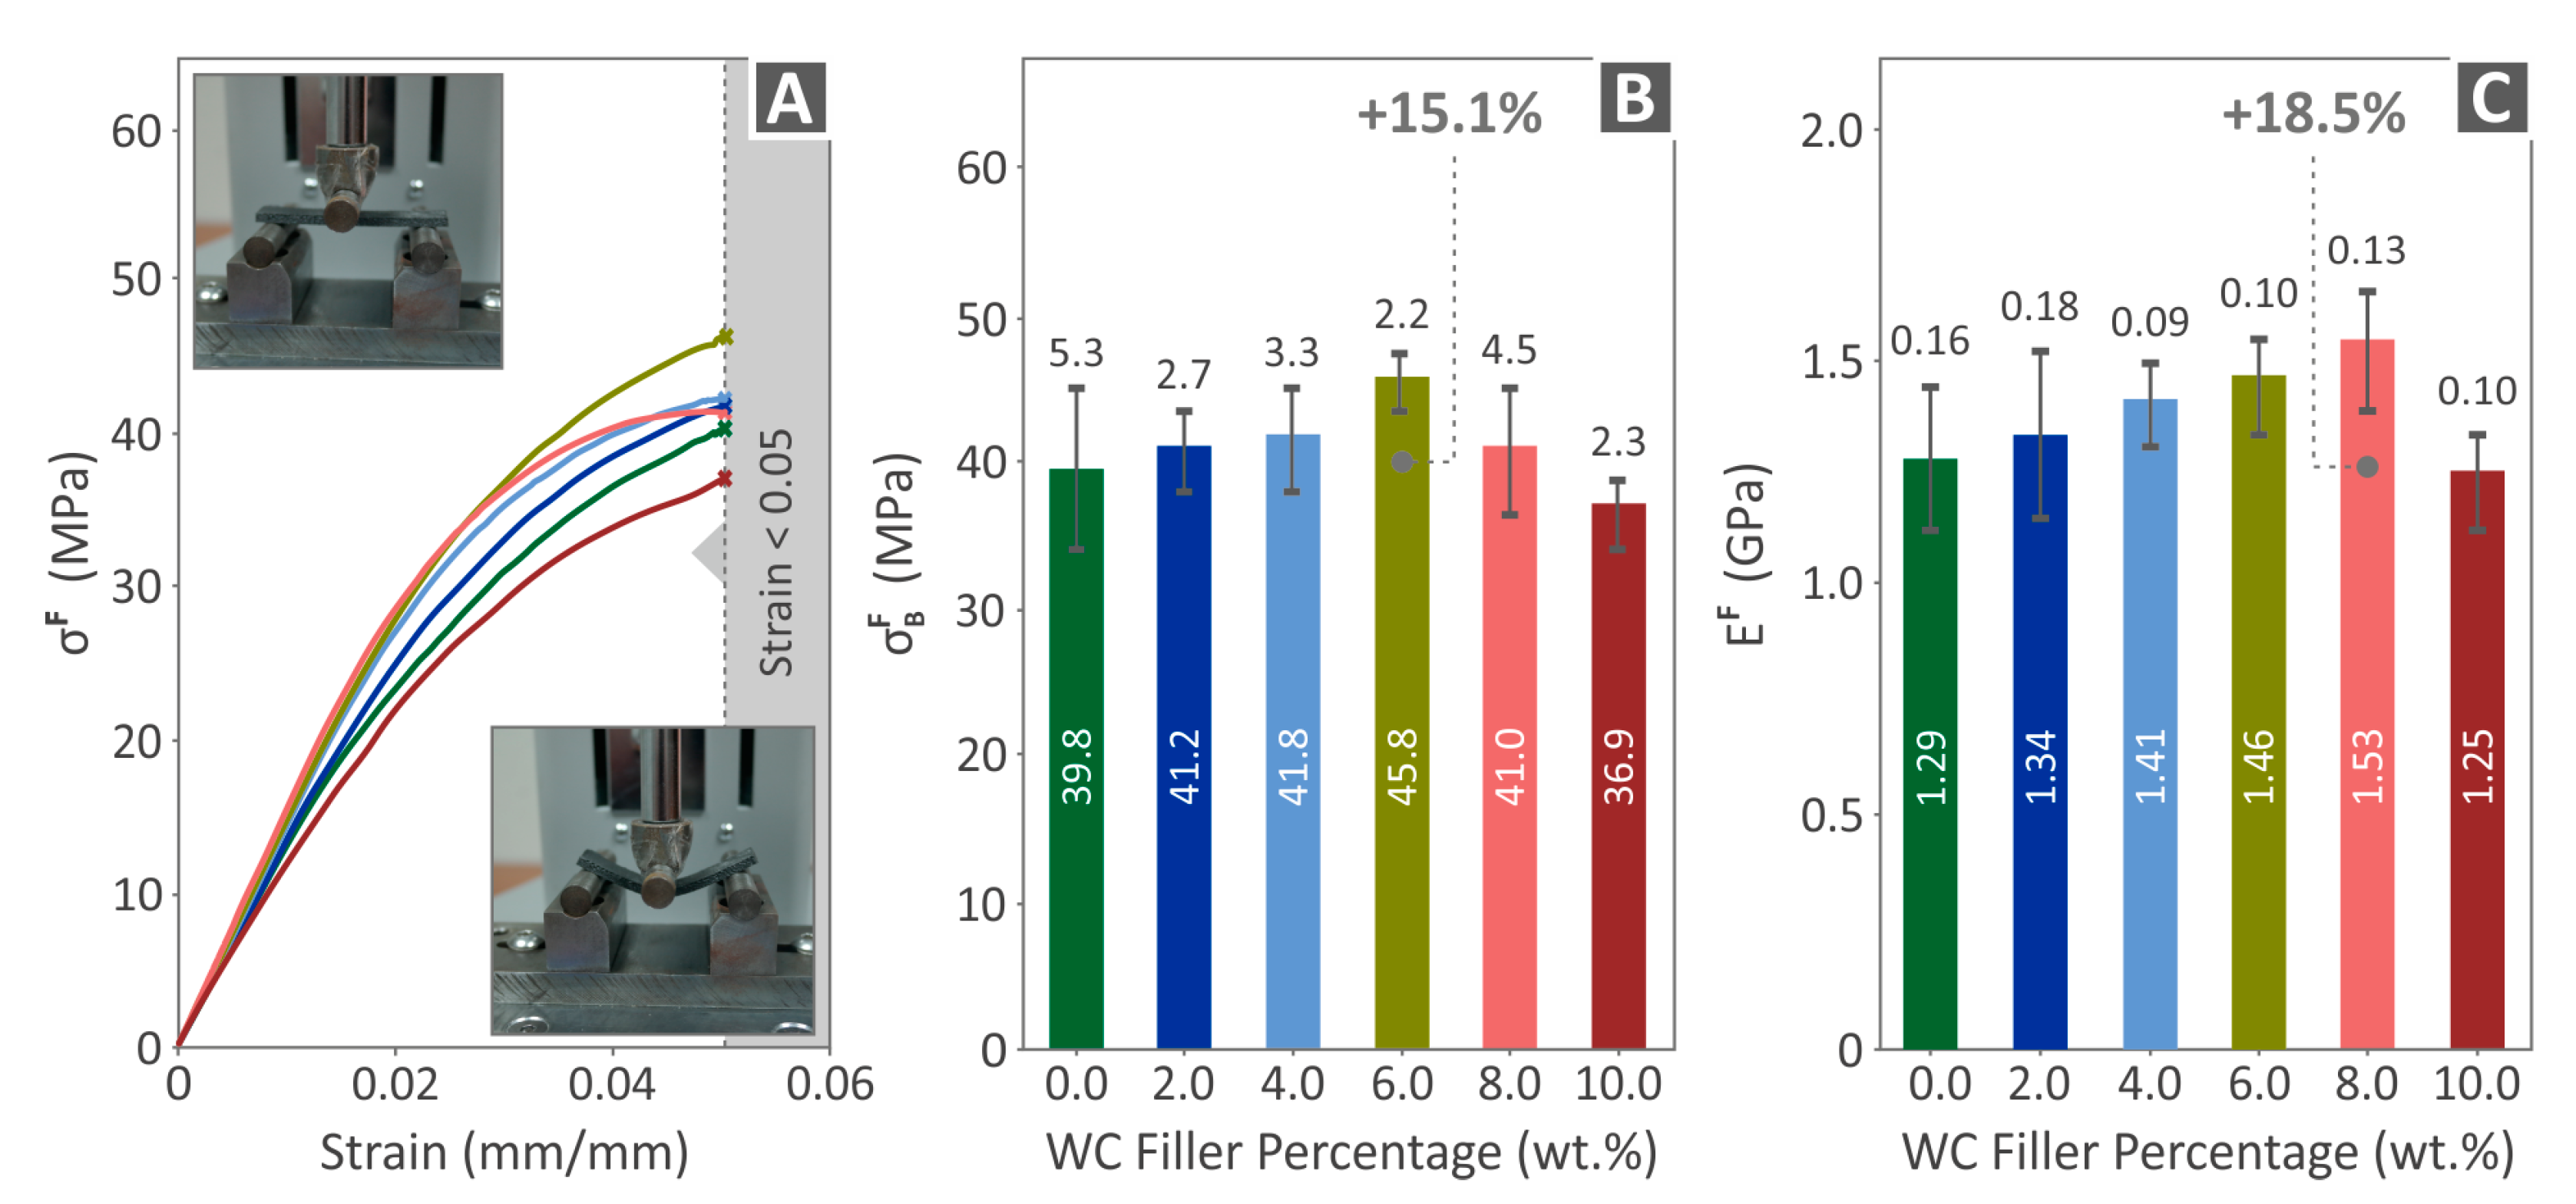
3.5. Mechanical Characterization

The tensile properties of the 3D-printed products were studied using an experimental procedure performed in accordance with the ASTM D638-02a standard. Comparing the strain (calculated in mm/mm) and tensile stress (calculated in MPa) measured in the specimens of each mixed material as well as raw PP, respective graphs were plotted and are shown in Figure 7A. Figure 7B shows the mean tensile strength of each tested nanocomposite. The tensile strength and filler content of the composite materials are correlated in this graph.
According to the experimental findings, each 3D-printed nanocompound had a higher tensile strength than the virgin PP material. The addition of 6.0 wt. % increased the tensile strength by 11.9%. The tensile modulus of elasticity for all filler ratios, including that of pure PP, is shown in Figure 7C. The findings of the experiment showed that, in comparison to the virgin PP polymer, all specimens with different filler concentrations exhibited higher tensile stiffness values. The sample with 8.0 wt. % WC had a 14.5% increase over pure PP, which was the most notable improvement.
The flexural properties of the specimens constructed of both virgin PP and PP/WC composites are presented in Figure 8, with the tests carried out according to ASTM D790-10 specifications. Figure 8A displays the stress–strain curves for each material evaluated for flexural strength up to an ultimate strain of 5%, following the instructions of the standard. The nanocomposite with 6.0 wt. % WC had the greatest flexural strength of 45.8 MPa, which was improved to pure PP by 15.1% (Figure 8B). The nanocomposite with the highest flexural modulus of elasticity, 18.5% more than that of the raw PP material, was also loaded with 8.0 wt. % of WC (Figure 8C). The specimen with 10.0 wt. % WC, however, showed a drop in both flexural strength and elastic modulus in all tests, which is a noticeable trend that can be seen. This implies that, beyond this range of loading, the results may lead to lower performance owing to the saturation of the filler in the matrix.
The toughness values (MJ/m3) of the fabricated specimens are shown in Figure 9. The energy consumption of the material in the test was determined by computing the area under the stress–strain curves. In addition to the samples containing 10.0 wt. % of WC particles, which exhibited the same value as pure PP in flexural toughness (as shown in Figure 9B), all composite materials showed higher tensile and flexural toughness values than the virgin PP polymeric material. In particular, considerable improvements in tensile and flexural toughness were observed. The PP/WC 4.0 wt. % nanocomposite showed a 19.3% increase in its tensile toughness compared to pure PP. The PP/WC 8.0 wt. % nanocomposite showed a 15.3% improvement in its flexural toughness compared to pure PP. These findings show that the addition of WC particles improves the toughness characteristics of the nanocomposites.
The findings of the impact trials are shown in Figure 10A, and the findings of the Vickers microhardness measurements are shown in Figure 10B. For all the materials investigated, the average Charpy impact strength and Vickers microhardness were analyzed for different filler concentrations. Figure 10A shows that the impact strength increases with filler percentage up to a point of 6.0 wt. %, beyond which no further gains are seen. Figure 10B, on the other hand, shows a consistent and linear increase in microhardness as the percentage of filler increases. The microhardness achieved a value of 20.9 HV at the greatest proportion of 10.0 wt. %, which is 24.8% more than that of raw PP. These results suggest that as the filler content increased, the hardness of the materials improved. Such performance increases the wear resistance of the parts built with this specific nanocomposite.

3.6. Morphological Evaluation

SEM was used to assess the surface morphology of the 3D-printed parts, allowing for a thorough analysis of the fractured and lateral surfaces of the specimens. The SEM images of the lateral surfaces of the 3D-printed specimens, which were PP/WC compounds with 0.0 wt. %, 4.0 wt. %, and 10.0 wt. %, are exhibited in Figure 11A,D,G. Flaws in the layer thickness and irregular layer morphologies in the side surface photos are observed, especially in the case of PP/10.0 WC wt. % (Figure 11G). In contrast, the layer structure appears to be continuous for all samples examined. Small clusters are observed on the surfaces of the samples. The fracture surfaces of the selected samples are illustrated in Figure 11B,E,H at magnifications of 30×, and in Figure 11C,F,I at a magnification of 300×, for a thorough examination of their morphological traits.
Microvoids were found when all the fracture surfaces of the samples were examined (Figure 11B,E,H), which are expected in the 3D printing structure [75]. A notable finding was the presence of larger voids in samples with 10.0 wt. % of WC particles. This finding suggests that a higher concentration of WC particles may result in the production of larger voids or flaws within the 3D-printed structure of the respective samples, which may have an impact on the material’s general mechanical characteristics and fracture behavior [76]. The pure PP sample exhibited a more ductile mechanism than the other samples under investigation in a higher magnification SEM image (300×) (Figure 11C), with lower deformation observed on the fracture surface.
The distribution of the additive (WC particles) within the PP matrix is shown in Figure 12, which allows us to identify any potential clustering or agglomeration of nanoparticles. This is crucial because agglomeration affects the mechanical performance of parts. Moreover, they could be the cause for the increased porosity presented above in the 10.0 wt. % nanocomposite [77]. Finally, the lack of agglomeration before the saturation of the filler verifies the sufficiency of the nanocomposite preparation method. The SEM image of the PP/WC compound with 6.0 wt. % WC is shown in Figure 12A. The absence of agglomerations of WC particles in this image suggests that either the dispersion was uniform or the amount present was rather low. However, the existence of WC particle agglomerations becomes clear when the investigation is expanded to the PP/WC compound with 10.0 wt. %, displayed in Figure 12B. Figure 12C magnifies the same region as Figure 12B to enable an in-depth view of the particle distribution.
A graph from EDS is also shown in Figure 12E, with a focus on the region shown in Figure 12B,C. The EDS examination of the PP/WC composite with 10.0 wt. % in Figure 12E shows the presence of both W and C elements, proving that the WC particles were successfully detected. The EDS mappings for W and C are shown in Figure 12F,G, respectively, showing that these elements are distributed uniformly across the sample.

4. Discussion

The TGA results demonstrated that the thermal behavior of the PP polymer was slightly affected by the addition of the WC nanoparticles. Furthermore, it was proven that the temperatures generated in the proposed method do not cause material degradation during extrusion and the MEX 3DP process, which may influence the 3D printing procedure or the subsequent mechanical properties of the parts fabricated using the produced composites. The nanocomposites prepared in the current study included a polymeric material (PP) and a ceramic filler in a nanoparticle form (WC). A filler is a material with high resistance to thermal loads. In the nanocomposites, the addition of the filler reduced the percentage of the matrix. The thermal stability of the prepared nanocomposites was investigated via TGA. Corresponding curves were formed for each nanocompound prepared and the unfilled PP thermoplastic sample. Subsequently, the curves were compared and evaluated. The curves follow a similar path, and the intense degradation of all the nanocompounds tested and the unfilled PP started at similar temperatures. This response indicates that no chemical reactions occurred between the matrix and filler, which could compromise the thermal response of the PP matrix. The process followed (mixing the materials within the extruder’s chamber with a thermomechanical process) involves no chemical processing of the materials, and it is a straightforward process. The challenges of the process are mainly related to the processability of the nanocomposites and the dispersion of the filler in the matrix. The effect of the addition of WC nanoparticles in the PP matrix on the thermal properties of the matrix was evaluated by investigating the thermal properties with TGA and DSC. Both methods showed that the changes in the thermal response of the PP matrix owing to the addition of WC nanoparticles were minimal.
Figure 13 provides a summary of the mechanical performance of both the pure PP material and the composite mixtures (PP/WC). The main finding was that the mechanical responses of the material improved as a result of the addition of WC particles to the PP matrix. Increased toughness, strength, and other desirable qualities are among these advantages. Several compounds were identified and evaluated in this study. Materials containing 6.0 wt. % and 8.0 wt. % of WC particles, however, showed the most enhanced mechanical performance throughout the various mechanical properties investigated.
Specifically, in terms of tensile, flexural, and impact strengths, the test specimens loaded with 6.0 wt. % of WC particles demonstrated the greatest improvement. On the other hand, the greatest improvement in tensile and flexural moduli of elasticity, as well as enhanced tensile toughness, was observed in the test specimens with an 8.0 wt. % loading of WC particles. The results demonstrated that the addition of 6.0 wt. % and 8.0 wt. % of WC particles improved the mechanical behavior of the PP matrix, albeit in different ways. The 6.0 wt. % loading led to notable gains in strength-related properties, whereas the 8.0 wt. % loading greatly improved stiffness-related features and tensile toughness. These results help in selecting the best WC particle loading for particular applications because different mechanical properties may be assigned more weight depending on how the composite material is used. From the average values, it can be inferred that the addition of WC nanoparticles led to noticeable strengthening properties. By inspecting the deviation, we found that some mechanical property values were within the error range of each other. The deviation was calculated from the five samples tested in each experiment following the standards. The deviation was not high in most mechanical tests, indicating a similar material composition in the specimens. Still, again following the standards, the mechanical properties were assessed using the average value of the five samples tested, and the outcome was the value of the respective mechanical properties. In addition, data with high deviations were neglected according to the instructions of the standards.
The microhardness showed a consistent increasing trend up to an additive loading of 10.0 wt. %, with an increase of 24.8% compared with the raw PP. Introducing a very hard ceramic such as WC in a soft polymeric matrix such as PP explains the reason why the hardness of the nanocompound is higher than that of the unfilled matrix material. This increase is attributed to the presence of WC nanoparticles in the matrix. Although no wear tests were conducted in this study, the hardness and microhardness were related to the wear resistance of the material [78,79,80,81]. In applications where high mechanical wear is expected, such nanocomposites could be considered to have strong potential to replace other pure polymeric filaments. Common polymeric filaments with limited resistance to these types of loads can be replaced with such nanocomposites, exploiting the advantages of the 3D printing process and expanding their potential applications. Such applications can potentially be considered in moving parts that interact with each other.
Based on the behavior of nanoparticles, increasing the concentration of fillers within the matrix leads to the formation of a network among the polymer chains, reducing their mobility and consequently resulting in enhanced mechanical characteristics [82,83,84]. Both the strength and stiffness of the materials increased owing to the reinforcing mechanism triggered by the addition of WC nanoparticles in the matrix. Beyond a certain threshold filler concentration, there is a point at which the matrix can no longer accommodate additional fillers, leading to a decline in its mechanical responsiveness [85,86]. The specific filler-to-matrix ratio at which this transition occurs depends on various factors and is not universally evident. Determining this precise saturation point necessitates an investigation tailored to each unique filler–matrix combination. It is worth noting that identifying the exact saturation point was not the focus of this study.
It should be noted that the extrusion and 3D printing settings were determined in the study based on the results from preliminary tests and following the corresponding literature on these materials. Both the extrusion and 3D printing processes were optimized for the unfilled PP polymer, and the same settings were used for the nanocomposites as well, to enable comparison of the specimens produced with this process. Optimizing the extrusion and 3D printing settings for each nanocompound would achieve better results regarding strengthening properties, but these results would not be comparable because they would have been acquired under different processing conditions. The processability of nanocomposites is an issue in this type of research. No processability issues were encountered up to the filler concentrations studied. It should be noted that no other additives were used in the nanocomposites to have a clear effect on the WC nanoparticles in the PP matrix. The reduction in the MFR in the nanocomposites compared with the unfilled PP polymer suggests that the 3D printing settings need to be optimized for each nanocomposite. The quality of the 3D printing process and the final printed shapes were evaluated by inspecting the lateral surfaces of the specimens using SEM. Perfect layer fusion was observed for the unfilled PP polymer. The layers had a uniform thickness, and no differences, voids, or defects were observed on the lateral surfaces of the samples. With the addition of WC particles, the layer thickness was not the same in all layers, and no uniform layer structure was observed. However, the fusion between the layers was without issues, and no defects were visible on the outer surface of the samples.
From the microstructure analysis of the fracture surfaces of the samples using SEM, it can be observed that the 4.0 wt. % nanocomposite, which showed improved tensile and flexural strength compared with the unfilled PP polymer, had a more solid 3D printing structure than the unfilled PP polymer. On the fracture surface of the 10.0 wt. % nanocomposite internal voids are visible in the 3D printing structure, attributed to the increased filler concentration in the matrix, which affected the processability in this case. This had a negative effect on the mechanical properties of the 10.0 wt. % nanocomposites, which were decreased compared with the nanocomposites with lower filler loading. Nevertheless, the mechanical properties of the 10.0 wt. % nanocomposite were improved compared with the unfilled PP matrix. This is due to the presence of the WC nanoparticles, which still contributed to the reinforcement of the PP matrix, despite the increased size of the internal voids compared with the unfilled PP, which negatively affected the mechanical performance of the specimens built with the 10.0 wt. % nanocomposite.
According to the available information, there are no publications on the mechanical characteristics of comparable compounds. This underlines the novelty and originality of this research, as it closes a sizable knowledge gap and presents novel viewpoints on the mechanical properties of the composites under investigation and the effect of ceramics as reinforcing agents in polymeric matrices in MEX 3DP. The reinforcement outcomes demonstrated in this study, such as the 11.9% enhancement in tensile strength, are similar to the effect achieved by introducing another ceramic (titanium nitride (TiN)) as an additive to the ABS thermoplastic, as documented in reference [11]. Notably, when the same ceramic additive was applied to another polymeric material (medical-grade polyamide 12), a significantly greater reinforcement effect was observed, leading to a remarkable increase of over 45% in the tensile strength of the original polymer [61]. These disparities underscore the distinct interactions between each polymer matrix and filler material, underscoring the rationale for conducting such investigations. Owing to their superior mechanical performance and relatively higher cost than common metal additives, ceramic fillers are expected to greatly enhance polymeric matrices, especially at low concentrations as additives. Therefore, the knowledge of the reinforcing effect of each ceramic in each polymeric material is useful information to be considered before the use of these composites in industrial applications.
Regarding the environmental aspects of this study, WC is considered a sustainable material that is recycled and reused [87,88,89]. Regarding the process followed for the preparation of nanocomposites, no environmental impact is expected. This is a typical filament extrusion and MEX 3D printing process. The only additional step was the initial mixing of raw materials. Since powders are potentially mixed in this step, this could have an environmental impact from the possible spread of the powders in the atmosphere. To overcome this issue, the powders were mixed in the study inside a closed box. Any powder cloud formed during the mixing of the raw materials was kept inside the box and did not spread in the room atmosphere.
It is crucial to emphasize the cost-effectiveness of the research methodology. Cost-effectiveness can be derived by considering several variables during production. The crucial cost-saving feature of this research is that, in addition to the costs involved in purchasing the PP matrix material, the inclusion of WC particles as a filler material constitutes the main additional expense. The project aims to upgrade the mechanical properties of the compound by adding WC particles to the PP matrix without incurring major additional expenditures in the primary matrix material. The total process still provides an affordable method for creating composite products with enhanced mechanical properties owing to the MEX 3D printing technique and the effective use of WC particles. This methodology can be applied directly for industrial use. Such processes are common in industrial environments for the production of filaments from raw materials in extruders. The only additional step is the mixing of the raw materials, which is a simple and common process in industrial environments. In such environments, twin-screw extruders are commonly used to further improve the mixing of the materials and dispersion of the filler in the matrix. The cost of the process is expected to increase because of the cost of the mixing process, which is expected to be negligible, as well as the additional cost of the WC filler. The cost of raw materials is expected to significantly decrease in industrial-scale quantities. Considering the low concentrations of WC additives in the nanocomposites, the additional cost is not expected to increase significantly. No additional costs or challenges are expected during the industrialization of the process.

5. Conclusions

The possibility of using tungsten carbide (WC) ceramic as a PP polymeric material strengthening agent in MEX 3DP was investigated in this study. This hypothesis has been proven previously. The thermomechanical extrusion method was used to create nanocomposites, which led to the production of filaments that function effectively with MEX 3DP and are compatible with it. When comparing the PP/WC composite with 6.0 wt. % loading to pure PP, the tensile and flexural strengths were both enhanced by 11.9% and 15.1%, respectively. The tensile and flexural moduli of elasticity were also improved by the addition of WC, increasing the respective metrics by 14.5% and 18.5% in the PP/WC 8.0 wt. % composite. The 10.0 wt. % nanocomposite showed significantly enhanced microhardness properties (24.8% increase), indicating a good wear resistance for the parts built with this specific nanocompound, making them suitable for applications with respective specifications.
Overall, the results pave the way for real-world applications and future improvements in composite materials by providing insights into the potential of WC-reinforced PP composite materials, notably at the 6.0 wt. % and 8.0 wt. % loading levels. In future work, the exact saturation percentage of WC nanoparticles in the PP matrix can be specified. In addition, the extrusion and 3D printing settings can be optimized for each nanocompound to maximize the reinforcing effect of the filler. In the current study, the same parameters were used for all the nanocompounds to obtain comparable results. Additionally, both matrix materials and additives are often used in biomedical applications. Therefore, the potential applications of such nanocomposites can also be expanded in this area. For this purpose, in future work, additional tests related to the biocompatibility, cytotoxicity, and antibacterial performance of the nanocomposites will be required.

Supplementary Materials

The following supporting information can be downloaded at: https://www.mdpi.com/article/10.3390/jcs7090393/s1, Figure S1: The workflow of the experimental procedure: (A) raw materials; (B) drying process; (C) filament extrusion; (D) filament drying; (E) filament quality control; (F) filament mechanical testing; (G) sample 3D printing; (H) sample inspection; (I) sample mechanical testing (three-point bending); (J) sample mechanical testing (impact test); (K) rheology testing; (L) morphological analysis with SEM; Figure S2: Schematic for the filament production process in the extruder.

Author Contributions

A.M.: validation, formal analysis; M.P.: writing—review and editing; N.M. (Nikolaos Michailidis): resources, supervision, project administration; N.M. (Nikolaos Mountakis): data curation, visualization; A.A.: data curation, visualization; V.P.: visualization, validation; M.S.: data curation, visualization; C.C.: writing—original draft preparation; I.N.: data curation, investigation; N.V.: conceptualization, methodology, resources, supervision, project administration. The manuscript was written with contributions from all authors. All authors have read and agreed to the published version of the manuscript.

Funding

This study received no external funding.

Institutional Review Board Statement

Not applicable.

Data Availability Statement

Data are contained within the article.

Acknowledgments

The authors would like to thank the Institute of Electronic Structure and Laser of the Foundation for Research and Technology, Hellas (IESL-FORTH), and Aleka Manousaki for taking the SEM images presented in this work and the Photonic Phononic and Meta-Materials Laboratory for sharing the Raman instrumentation.

Conflicts of Interest

The authors declare no conflict of interest.

References

  1. Yu, W.; Nie, Z.; Lin, Y. Research on the Slicing Method with Equal Thickness and Low Redundancy Based on STL Files. J. Chin. Inst. Eng. 2021, 44, 469–477. [Google Scholar] [CrossRef]
  2. Van Dang, L.; Makhanov, S. Enhanced Vector Flow of Significant Directions for Five-Axis Machining of STL Surfaces. Int. J. Prod. Res. 2021, 59, 3664–3695. [Google Scholar] [CrossRef]
  3. Lavecchia, F.; Percoco, G.; Pei, E.; Galantucci, L.M. Computer Numerical Controlled Grinding and Physical Vapor Deposition for Fused Deposition Modelled Workpieces. Adv. Mater. Sci. Eng. 2018, 2018, 9037490. [Google Scholar] [CrossRef]
  4. Tamburrino, F.; Barone, S.; Paoli, A.; Razionale, A.V. Post-Processing Treatments to Enhance Additively Manufactured Polymeric Parts: A Review. Virtual Phys. Prototyp. 2021, 16, 221–254. [Google Scholar] [CrossRef]
  5. Saengchairat, N.; Tran, T.; Chua, C.-K. A Review: Additive Manufacturing for Active Electronic Components. Virtual Phys. Prototyp. 2017, 12, 31–46. [Google Scholar] [CrossRef]
  6. Kim, G.D.; Oh, Y.T. A Benchmark Study on Rapid Prototyping Processes and Machines: Quantitative Comparisons of Mechanical Properties, Accuracy, Roughness, Speed, and Material Cost. Proc. Inst. Mech. Eng. B J. Eng. Manuf. 2008, 222, 201–215. [Google Scholar] [CrossRef]
  7. Kirby, B.; Kenkel, J.M.; Zhang, A.Y.; Amirlak, B.; Suszynski, T.M. Three-Dimensional (3D) Synthetic Printing for the Manufacture of Non-Biodegradable Models, Tools and Implants Used in Surgery: A Review of Current Methods. J. Med. Eng. Technol. 2021, 45, 14–21. [Google Scholar] [CrossRef] [PubMed]
  8. Tuazon, B.J.; Custodio, N.A.V.; Basuel, R.B.; Delos Reyes, L.A.; Dizon, J.R.C. 3D Printing Technology and Materials for Automotive Application: A Mini-Review. Key Eng. Mater. 2022, 913, 3–16. [Google Scholar] [CrossRef]
  9. Janeková, J.; Pelle, S.; Onofrejová, D.; Pekarčiková, M. The 3D Printing Implementation in Manufacturing of Automobile Components. Acta Tecnol. 2019, 5, 17–21. [Google Scholar] [CrossRef]
  10. Sarvankar, S.G.; Yewale, S.N. Additive Manufacturing in Automobile Industry. Int. J. Res. Aeronaut. Mech. Eng 2019, 7, 1–10. [Google Scholar]
  11. Vidakis, N.; Mangelis, P.; Petousis, M.; Mountakis, N.; Papadakis, V.; Moutsopoulou, A.; Tsikritzis, D. Mechanical Reinforcement of ABS with Optimized Nano Titanium Nitride Content for Material Extrusion 3D Printing. Nanomaterials 2023, 13, 669. [Google Scholar] [CrossRef] [PubMed]
  12. Joshi, S.C.; Sheikh, A.A. 3D Printing in Aerospace and Its Long-Term Sustainability. Virtual Phys. Prototyp. 2015, 10, 175–185. [Google Scholar] [CrossRef]
  13. Martinez, D.W.; Espino, M.T.; Cascolan, H.M.; Crisostomo, J.L.; Dizon, J.R.C. A Comprehensive Review on the Application of 3D Printing in the Aerospace Industry. Key Eng. Mater. 2022, 913, 27–34. [Google Scholar] [CrossRef]
  14. Yap, Y.L.; Yeong, W.Y. Additive Manufacture of Fashion and Jewellery Products: A Mini Review. Virtual Phys. Prototyp. 2014, 9, 195–201. [Google Scholar] [CrossRef]
  15. Muhammad, M.S.; Kerbache, L.; Elomri, A. Potential of Additive Manufacturing for Upstream Automotive Supply Chains. Supply Chain. Forum Int. J. 2022, 23, 1–19. [Google Scholar] [CrossRef]
  16. Khoo, Z.X.; Teoh, J.E.M.; Liu, Y.; Chua, C.K.; Yang, S.; An, J.; Leong, K.F.; Yeong, W.Y. 3D Printing of Smart Materials: A Review on Recent Progresses in 4D Printing. Virtual Phys. Prototyp. 2015, 10, 103–122. [Google Scholar] [CrossRef]
  17. Debnath, S.K.; Debnath, M.; Srivastava, R.; Omri, A. Intervention of 3D Printing in Health Care: Transformation for Sustainable Development. Expert Opin. Drug Deliv. 2021, 18, 1659–1672. [Google Scholar] [CrossRef] [PubMed]
  18. Petousis, M.; Vidakis, N.; Mountakis, N.; Grammatikos, S.; Papadakis, V.; David, C.N.; Moutsopoulou, A.; Das, S.C. Silicon Carbide Nanoparticles as a Mechanical Boosting Agent in Material Extrusion 3D-Printed Polycarbonate. Polymers 2022, 14, 3492. [Google Scholar] [CrossRef] [PubMed]
  19. Rouway, M.; Nachtane, M.; Tarfaoui, M.; Chakhchaoui, N.; Omari, L.E.H.; Fraija, F.; Cherkaoui, O. 3D Printing: Rapid Manufacturing of a New Small-Scale Tidal Turbine Blade. Int. J. Adv. Manuf. Technol. 2021, 115, 61–76. [Google Scholar] [CrossRef]
  20. Nachtane, M.; Tarfaoui, M.; Ledoux, Y.; Khammassi, S.; Leneveu, E.; Pelleter, J. Experimental Investigation on the Dynamic Behavior of 3D Printed CF-PEKK Composite under Cyclic Uniaxial Compression. Compos. Struct. 2020, 247, 112474. [Google Scholar] [CrossRef]
  21. Lepoivre, A.; Boyard, N.; Levy, A.; Sobotka, V. Heat Transfer and Adhesion Study for the FFF Additive Manufacturing Process. Procedia Manuf. 2020, 47, 948–955. [Google Scholar] [CrossRef]
  22. Khunt, C.P.; Makhesana, M.A.; Mawandiya, B.K.; Patel, K.M. Investigations on the Influence of Printing Parameters during Processing of Biocompatible Polymer in Fused Deposition Modelling (FDM). Adv. Mater. Process. Technol. 2022, 8, 320–336. [Google Scholar] [CrossRef]
  23. Zharylkassyn, B.; Perveen, A.; Talamona, D. Effect of Process Parameters and Materials on the Dimensional Accuracy of FDM Parts. Mater. Today Proc. 2021, 44, 1307–1311. [Google Scholar] [CrossRef]
  24. Rahim, T.N.A.T.; Abdullah, A.M.; Md Akil, H. Recent Developments in Fused Deposition Modeling-Based 3D Printing of Polymers and Their Composites. Polym. Rev. 2019, 59, 589–624. [Google Scholar] [CrossRef]
  25. Vinoth Babu, N.; Venkateshwaran, N.; Rajini, N.; Ismail, S.O.; Mohammad, F.; Al-Lohedan, H.A.; Suchart, S. Influence of Slicing Parameters on Surface Quality and Mechanical Properties of 3D-Printed CF/PLA Composites Fabricated by FDM Technique. Mater. Technol. 2022, 37, 1008–1025. [Google Scholar] [CrossRef]
  26. Petousis, M.; Vidakis, N.; Mountakis, N.; Karapidakis, E.; Moutsopoulou, A. Functionality Versus Sustainability for PLA in MEX 3D Printing: The Impact of Generic Process Control Factors on Flexural Response and Energy Efficiency. Polymers 2023, 15, 1232. [Google Scholar] [CrossRef] [PubMed]
  27. Vidakis, N.; David, C.; Petousis, M.; Sagris, D.; Mountakis, N.; Moutsopoulou, A. The Effect of Six Key Process Control Parameters on the Surface Roughness, Dimensional Accuracy, and Porosity in Material Extrusion 3D Printing of Polylactic Acid: Prediction Models and Optimization Supported by Robust Design Analysis. Adv. Ind. Manuf. Eng. 2022, 5, 100104. [Google Scholar] [CrossRef]
  28. Popescu, D.; Zapciu, A.; Amza, C.; Baciu, F.; Marinescu, R. FDM Process Parameters Influence over the Mechanical Properties of Polymer Specimens: A Review. Polym. Test. 2018, 69, 157–166. [Google Scholar] [CrossRef]
  29. Yodo, N.; Dey, A. Multi-Objective Optimization for FDM Process Parameters with Evolutionary Algorithms. In Fused Deposition Modeling Based 3D Printing; Dave, H.K., Davim, J.P., Eds.; Springer International Publishing: Cham, Switzerland, 2021; pp. 419–444. ISBN 978-3-030-68024-4. [Google Scholar]
  30. Dey, A.; Yodo, N.; Khoda, B. Optimizing Process Parameters under Uncertainty in Fused Deposition Modeling. In Proceedings of the 2019 IIE Annual Conference, Orlando, FL, USA, 18–21 May 2019. [Google Scholar]
  31. Dey, A.; Roan Eagle, I.N.; Yodo, N. A Review on Filament Materials for Fused Filament Fabrication. J. Manuf. Mater. Process. 2021, 5, 69. [Google Scholar] [CrossRef]
  32. Vidakis, N.; Maniadi, A.; Petousis, M.; Vamvakaki, M.; Kenanakis, G.; Koudoumas, E. Mechanical and Electrical Properties Investigation of 3D-Printed Acrylonitrile–Butadiene–Styrene Graphene and Carbon Nanocomposites. J. Mater. Eng. Perform. 2020, 29, 1909–1918. [Google Scholar] [CrossRef]
  33. Petousis, M.; Vidakis, N.; Mountakis, N.; Papadakis, V.; Kanellopoulou, S.; Gaganatsiou, A.; Stefanoudakis, N.; Kechagias, J. Multifunctional Material Extrusion 3D-Printed Antibacterial Polylactic Acid (PLA) with Binary Inclusions: The Effect of Cuprous Oxide and Cellulose Nanofibers. Fibers 2022, 10, 52. [Google Scholar] [CrossRef]
  34. Wickramasinghe, S.; Do, T.; Tran, P. FDM-Based 3D Printing of Polymer and Associated Composite: A Review on Mechanical Properties, Defects and Treatments. Polymers 2020, 12, 1529. [Google Scholar] [CrossRef] [PubMed]
  35. Huang, S.; Fu, Q.; Yan, L.; Kasal, B. Characterization of Interfacial Properties between Fibre and Polymer Matrix in Composite Materials—A Critical Review. J. Mater. Res. Technol. 2021, 13, 1441–1484. [Google Scholar] [CrossRef]
  36. Li, J. The Research on the Interfacial Compatibility of Polypropylene Composite Filled with Surface Treated Carbon Fiber. Appl. Surf. Sci. 2009, 255, 8682–8684. [Google Scholar] [CrossRef]
  37. Karsli, N.G.; Aytac, A. Effects of Maleated Polypropylene on the Morphology, Thermal and Mechanical Properties of Short Carbon Fiber Reinforced Polypropylene Composites. Mater. Des. 2011, 32, 4069–4073. [Google Scholar] [CrossRef]
  38. Miranda, L.; Pereira, N.; Faldini, S.; Masson, T.; Silveira, L. Effect of Ionizing Radiation on Polypropylene Composites Reinforced with Coconut Fibers. In Proceedings of the 2009 International Nuclear Atlantic Conference, Rio de Janeiro, Brazil, 27 September–2 October 2009. [Google Scholar]
  39. Fu, S.; Yu, B.; Tang, W.; Fan, M.; Chen, F.; Fu, Q. Mechanical Properties of Polypropylene Composites Reinforced by Hydrolyzed and Microfibrillated Kevlar Fibers. Compos. Sci. Technol. 2018, 163, 141–150. [Google Scholar] [CrossRef]
  40. Burmistrov, I.; Gorshkov, N.; Ilinykh, I.; Muratov, D.; Kolesnikov, E.; Yakovlev, E.; Mazov, I.; Issi, J.-P.; Kuznetsov, D. Mechanical and Electrical Properties of Ethylene-1-Octene and Polypropylene Composites Filled with Carbon Nanotubes. Compos. Sci. Technol. 2017, 147, 71–77. [Google Scholar] [CrossRef]
  41. Yang, B.-X.; Shi, J.-H.; Pramoda, K.P.; Goh, S.H. Enhancement of the Mechanical Properties of Polypropylene Using Polypropylene-Grafted Multiwalled Carbon Nanotubes. Compos. Sci. Technol. 2008, 68, 2490–2497. [Google Scholar] [CrossRef]
  42. O’Donnell, H.J.; Baird, D.G. In Situ Reinforcement of Polypropylene with Liquid-Crystalline Polymers: Effect of Maleic Anhydride-Grafted Polypropylene. Polymer 1995, 36, 3113–3126. [Google Scholar] [CrossRef]
  43. Aranberri-Askargorta, I.; Lampke, T.; Bismarck, A. Wetting Behavior of Flax Fibers as Reinforcement for Polypropylene. J. Colloid. Interface Sci. 2003, 263, 580–589. [Google Scholar] [CrossRef]
  44. Joseph, P.V.; Joseph, K.; Thomas, S. Effect of Processing Variables on the Mechanical Properties of Sisal-Fiber-Reinforced Polypropylene Composites. Compos. Sci. Technol. 1999, 59, 1625–1640. [Google Scholar] [CrossRef]
  45. Karmarkar, A.; Chauhan, S.S.; Modak, J.M.; Chanda, M. Mechanical Properties of Wood–Fiber Reinforced Polypropylene Composites: Effect of a Novel Compatibilizer with Isocyanate Functional Group. Compos. Part A Appl. Sci. Manuf. 2007, 38, 227–233. [Google Scholar] [CrossRef]
  46. Fu, S.-Y.; Lauke, B.; Mäder, E.; Yue, C.-Y.; Hu, X. Tensile Properties of Short-Glass-Fiber- and Short-Carbon-Fiber-Reinforced Polypropylene Composites. Compos. Part A Appl. Sci. Manuf. 2000, 31, 1117–1125. [Google Scholar] [CrossRef]
  47. Papageorgiou, D.G.; Kinloch, I.A.; Young, R.J. Hybrid Multifunctional Graphene/Glass-Fibre Polypropylene Composites. Compos. Sci. Technol. 2016, 137, 44–51. [Google Scholar] [CrossRef]
  48. Unterweger, C.; Brüggemann, O.; Fürst, C. Effects of Different Fibers on the Properties of Short-Fiber-Reinforced Polypropylene Composites. Compos. Sci. Technol. 2014, 103, 49–55. [Google Scholar] [CrossRef]
  49. Rezaei, F.; Yunus, R.; Ibrahim, N.A.; Mahdi, E.S. Development of Short-Carbon-Fiber-Reinforced Polypropylene Composite for Car Bonnet. Polym. Plast. Technol. Eng. 2008, 47, 351–357. [Google Scholar] [CrossRef]
  50. Gogotsi, G.A. Fracture Toughness of Ceramics and Ceramic Composites. Ceram. Int. 2003, 29, 777–784. [Google Scholar] [CrossRef]
  51. Petousis, M.; Vidakis, N.; Mountakis, N.; Moutsopoulou, A.; Papadakis, V.; Maravelakis, E. On the Substantial Mechanical Reinforcement of Polylactic Acid with Titanium Nitride Ceramic Nanofillers in Material Extrusion 3D Printing. Ceram. Int. 2023, 49, 16397–16411. [Google Scholar] [CrossRef]
  52. Antoniadis, A.; Vidakis, N.; Bilalis, N. Fatigue Fracture Investigation of Cemented Carbide Tools in Gear Hobbing, Part 2: The Effect of Cutting Parameters on the Level of Tool Stresses—A Quantitative Parametric Analysis. J. Manuf. Sci. Eng. 2002, 124, 792–798. [Google Scholar] [CrossRef]
  53. Ravikumar, K.; Kiran, K.; Sreebalaji, V.S. Characterization of Mechanical Properties of Aluminium/Tungsten Carbide Composites. Measurement 2017, 102, 142–149. [Google Scholar] [CrossRef]
  54. Montgomery, R.S. The Mechanism of Percussive Wear of Tungsten Carbide Composites. Wear 1968, 12, 309–329. [Google Scholar] [CrossRef]
  55. Reyes, M.; Neville, A. Degradation Mechanisms of Co-Based Alloy and WC Metal–Matrix Composites for Drilling Tools Offshore. Wear 2003, 255, 1143–1156. [Google Scholar] [CrossRef]
  56. Henckens, T. Chapter 7—Thirteen Scarce Resources Analyzed. In Governance of the World’s Mineral Resources; Henckens, T., Ed.; Elsevier: Amsterdam, The Netherlands, 2021; pp. 147–380. ISBN 978-0-12-823886-8. [Google Scholar]
  57. Chen, G.; Luo, T.; Shen, S.; Zheng, J.; Tang, X.; Tao, T.; Xue, W. Tungsten Particles Reinforced High-Entropy Alloy Matrix Composite Prepared by in-Situ Reaction. J. Alloys Compd. 2021, 862, 158037. [Google Scholar] [CrossRef]
  58. Kameswara Reddy, M.; Suresh Babu, V.; Sai Srinadh, K.V.; Bhargav, M. Mechanical Properties of Tungsten Carbide Nanoparticles Filled Epoxy Polymer Nano Composites. Mater. Today Proc. 2020, 26, 2711–2713. [Google Scholar] [CrossRef]
  59. Vidakis, N.; Petousis, M.; Mountakis, N.; Korlos, A.; Papadakis, V.; Moutsopoulou, A. Trilateral Multi-Functional Polyamide 12 Nanocomposites with Binary Inclusions for Medical Grade Material Extrusion 3D Printing: The Effect of Titanium Nitride in Mechanical Reinforcement and Copper/Cuprous Oxide as Antibacterial Agents. J. Funct. Biomater. 2022, 13, 115. [Google Scholar] [CrossRef]
  60. Vidakis, N.; Moutsopoulou, A.; Petousis, M.; Michailidis, N.; Charou, C.; Papadakis, V.; Mountakis, N.; Dimitriou, E.; Argyros, A. Rheology and Thermomechanical Evaluation of Additively Manufactured Acrylonitrile Butadiene Styrene (ABS) with Optimized Tungsten Carbide (WC) Nano-Ceramic Content. Ceram. Int. 2023, 8, 144. [Google Scholar] [CrossRef]
  61. Pal, T.; Pramanik, S.; Verma, K.D.; Naqvi, S.Z.; Manna, P.K.; Kar, K.K. Chapter 6—Fly Ash-Reinforced Polypropylene Composites. In Handbook of Fly Ash Kar; Elsevier: Oxford, UK, 2022; pp. 243–270. ISBN 978-0-12-817686-3. [Google Scholar] [CrossRef]
  62. Saxena, P.; Shukla, P.; Gaur, M.S. Thermal Analysis of Polymer Blends and Double Layer by DSC. Polym. Polym. Compos. 2020, 29, S11–S18. [Google Scholar] [CrossRef]
  63. Soboyejo, W.O. Mechanical Properties of Engineered Materials; Marcel Dekker: New York, NY, USA, 2003; ISBN 0824789008. 9780824789008. [Google Scholar]
  64. Resta, V.; Quarta, G.; Lomascolo, M.; Maruccio, L.; Calcagnile, L. Raman and Photoluminescence Spectroscopy of Polycarbonate Matrices Irradiated with Different Energy 28Si+ Ions. Vacuum 2015, 116, 82–89. [Google Scholar] [CrossRef]
  65. Bichara, L.C.; Alvarez, P.E.; Fiori Bimbi, M.V.; Vaca, H.; Gervasi, C.; Brandán, S.A. Structural and Spectroscopic Study of a Pectin Isolated from Citrus Peel by Using FTIR and FT-Raman Spectra and DFT Calculations. Infrared Phys. Technol. 2016, 76, 315–327. [Google Scholar] [CrossRef]
  66. Synytsya, A.; Čopíková, J.; Matějka, P.; Machovič, V. Fourier Transform Raman and Infrared Spectroscopy of Pectins. Carbohydr. Polym. 2003, 54, 97–106. [Google Scholar] [CrossRef]
  67. Stuart, B.H. Temperature Studies of Polycarbonate Using Fourier Transform Raman Spectroscopy. Polym. Bull. 1996, 36, 341–346. [Google Scholar] [CrossRef]
  68. Lin, Z.; Guo, X.; He, Z.; Liang, X.; Wang, M.; Jin, G. Thermal Degradation Kinetics Study of Molten Polylactide Based on Raman Spectroscopy. Polym. Eng. Sci. 2021, 61, 201–210. [Google Scholar] [CrossRef]
  69. Makarem, M.; Lee, C.M.; Kafle, K.; Huang, S.; Chae, I.; Yang, H.; Kubicki, J.D.; Kim, S.H. Probing Cellulose Structures with Vibrational Spectroscopy. Cellulose 2019, 26, 35–79. [Google Scholar] [CrossRef]
  70. Zimmerer, C.; Matulaitiene, I.; Niaura, G.; Reuter, U.; Janke, A.; Boldt, R.; Sablinskas, V.; Steiner, G. Nondestructive Characterization of the Polycarbonate—Octadecylamine Interface by Surface Enhanced Raman Spectroscopy. Polym. Test. 2019, 73, 152–158. [Google Scholar] [CrossRef]
  71. Zou, H.; Yi, C.; Wang, L.; Liu, H.; Xu, W. Thermal Degradation of Poly(Lactic Acid) Measured by Thermogravimetry Coupled to Fourier Transform Infrared Spectroscopy. J. Therm. Anal. Calorim. 2009, 97, 929–935. [Google Scholar] [CrossRef]
  72. Liu, X.; Zou, Y.; Li, W.; Cao, G.; Chen, W. Kinetics of Thermo-Oxidative and Thermal Degradation of Poly(d,l-Lactide) (PDLLA) at Processing Temperature. Polym. Degrad. Stab. 2006, 91, 3259–3265. [Google Scholar] [CrossRef]
  73. Montoro, O.R.; Taravillo, M.; San Andrés, M.; de la Roja, J.M.; Barrero, A.F.; Arteaga, P.; Baonza, V.G. Raman Spectroscopic Study of the Formation of Fossil Resin Analogues. J. Raman Spectrosc. 2014, 45, 1230–1235. [Google Scholar] [CrossRef]
  74. Petousis, M.; Michailidis, N.; Papadakis, V.M.; Korlos, A.; Mountakis, N.; Argyros, A.; Dimitriou, E.; Charou, C.; Moutsopoulou, A.; Vidakis, N. Optimizing the Rheological and Thermomechanical Response of Acrylonitrile Butadiene Styrene/Silicon Nitride Nanocomposites in Material Extrusion Additive Manufacturing. Nanomaterials 2023, 13, 1588. [Google Scholar] [CrossRef]
  75. Song, Y.; Li, Y.; Song, W.; Yee, K.; Lee, K.-Y.Y.; Tagarielli, V.L. Measurements of the Mechanical Response of Unidirectional 3D-Printed PLA. Mater. Des. 2017, 123, 154–164. [Google Scholar] [CrossRef]
  76. Wang, X.; Zhao, L.; Fuh, J.Y.; Lee, H.P. Effect of Porosity on Mechanical Properties of 3D Printed Polymers: Experiments and Micromechanical Modeling Based on X-Ray Computed Tomography Analysis. Polymers 2019, 11, 1154. [Google Scholar] [CrossRef]
  77. Güler, Ö.; Bağcı, N. A Short Review on Mechanical Properties of Graphene Reinforced Metal Matrix Composites. J. Mater. Res. Technol. 2020, 9, 6808–6833. [Google Scholar] [CrossRef]
  78. Konyashin, I.; Ries, B.; Hlawatschek, D.; Zhuk, Y.; Mazilkin, A.; Straumal, B.; Dorn, F.; Park, D. Wear-Resistance and Hardness: Are They Directly Related for Nanostructured Hard Materials? Int. J. Refract. Met. Hard Mater. 2015, 49, 203–211. [Google Scholar] [CrossRef]
  79. Bressan, J.D.; Daros, D.P.; Sokolowski, A.; Mesquita, R.A.; Barbosa, C.A. Influence of Hardness on the Wear Resistance of 17-4 PH Stainless Steel Evaluated by the Pin-on-Disc Testing. J. Mater. Process. Technol. 2008, 205, 353–359. [Google Scholar] [CrossRef]
  80. Burnett, P.J.; Rickerby, D.S. The Mechanical Properties of Wear-Resistant Coatings: I: Modelling of Hardness Behaviour. Thin Solid Film. 1987, 148, 41–50. [Google Scholar] [CrossRef]
  81. Mandikos, M.N.; McGivney, G.P.; Davis, E.; Bush, P.J.; Carter, J.M. A Comparison of the Wear Resistance and Hardness of Indirect Composite Resins. J. Prosthet. Dent. 2001, 85, 386–395. [Google Scholar] [CrossRef] [PubMed]
  82. Mittal, G.; Rhee, K.Y.; Mišković-Stanković, V.; Hui, D. Reinforcements in Multi-Scale Polymer Composites: Processing, Properties, and Applications. Compos. B Eng. 2018, 138, 122–139. [Google Scholar] [CrossRef]
  83. Bindu, P.; Thomas, S. Viscoelastic Behavior and Reinforcement Mechanism in Rubber Nanocomposites in the Vicinity of Spherical Nanoparticles. J. Phys. Chem. B 2013, 117, 12632–12648. [Google Scholar] [CrossRef] [PubMed]
  84. Liu, H.; Brinson, L.C. Reinforcing Efficiency of Nanoparticles: A Simple Comparison for Polymer Nanocomposites. Compos. Sci. Technol. 2008, 68, 1502–1512. [Google Scholar] [CrossRef]
  85. Mostafa, S.A.; Faried, A.S.; Farghali, A.A.; EL-Deeb, M.M.; Tawfik, T.A.; Majer, S.; Abd Elrahman, M. Influence of Nanoparticles from Waste Materials on Mechanical Properties, Durability and Microstructure of UHPC. Materials 2020, 13, 4530. [Google Scholar] [CrossRef]
  86. Tamayo-Vegas, S.; Muhsan, A.; Liu, C.; Tarfaoui, M.; Lafdi, K. The Effect of Agglomeration on the Electrical and Mechanical Properties of Polymer Matrix Nanocomposites Reinforced with Carbon Nanotubes. Polymers 2022, 14, 1842. [Google Scholar] [CrossRef] [PubMed]
  87. Wigger, H.; Steinfeldt, M.; Bianchin, A. Environmental Benefits of Coatings Based on Nano-Tungsten-Carbide Cobalt Ceramics. J. Clean. Prod. 2017, 148, 212–222. [Google Scholar] [CrossRef]
  88. Ma, X.; Qi, C.; Ye, L.; Yang, D.; Hong, J. Life Cycle Assessment of Tungsten Carbide Powder Production: A Case Study in China. J. Clean. Prod. 2017, 149, 936–944. [Google Scholar] [CrossRef]
  89. Shemi, A.; Magumise, A.; Ndlovu, S.; Sacks, N. Recycling of Tungsten Carbide Scrap Metal: A Review of Recycling Methods and Future Prospects. Min. Eng. 2018, 122, 195–205. [Google Scholar] [CrossRef]
Figure 1. (A) SEM image of 10,000× WC nanopowder; (B) EDS graph; (C) 50,000× SEM image; (D) 100,000× SEM image; (E) EDS map for the W element.
Jcs 07 00393 g001
Figure 2. The settings of 3D printing that were utilized to create the samples and the related ASTM standards utilized for each test. The different colors in the lines and arrows in the specimens highlight the different orientations in the 3D printing structure in the successive layers.
Jcs 07 00393 g002
Figure 3. (A) Raman spectra from PP pure, PP/WC 2.0 wt. %, 4.0 wt. %, 6.0 wt. %, 8.0 wt. %, and 10.0 wt. %; (B) Raman spectral differences from PP pure. PP/WC 2.0 wt. %, 4.0 wt. %, 6.0 wt. %, 8.0 wt. %, and 10.0 wt. %.
Jcs 07 00393 g003
Figure 4. Utilizing (A) TGA curves and (B) heat-flow curves at various temperatures; a study of the thermal performance of pure PP and PP/WC compounds is shown.
Jcs 07 00393 g004
Figure 5. The rheological research on pure PP polymer and PP/WC composites is shown in (A) viscosity and stress versus shear rate and (B) melt flow rate versus WC filler percent by weight in the nanocomposites.
Jcs 07 00393 g005
Figure 6. Two filament mixtures are presented: (A) pure PP and (B) PP/WC 4.0 wt. %. (C) Findings of the filaments’ tensile test and (D) tensile modulus of elasticity.
Jcs 07 00393 g006
Figure 7. (A) Tensile stress–strain graphs of randomly selected 3D-printed samples from each nanocompound material; (B) tensile strength outcomes; (C) tensile modulus of elasticity.
Jcs 07 00393 g007
Figure 8. The results of the flexural testing performed on the 3D-printed samples: (A) stress–strain curves assessed using a representative sample from each nanocompound’s five printed samples. The test ended at 5% strain in compliance with ASTM D790 specifications; (B) the outcomes for the flexural strength and its standard deviation; (C) the findings for the flexural modulus of elasticity and its standard deviation.
Jcs 07 00393 g008
Figure 9. (A) Tensile toughness; (B) flexural toughness for all generated samples.
Jcs 07 00393 g009
Figure 10. (A) Charpy impact strength; (B) Vickers microhardness for all specimens created.
Jcs 07 00393 g010
Figure 11. The SEM images for (A) a side view of a virgin PP specimen at a magnification of 150×, (B) a fractured surface of a virgin PP specimen at a magnification of 30×, (C) a fractured surface of a virgin PP specimen at a magnification of 300×, (D) a side view of a PP/WC 4.0 wt. % specimen at a magnification of 150×, (E) a fractured surface of a PP/WC 4.0 wt. % specimen at a magnification of 30×, (F) a fractured surface of a PP/WC 4.0 wt. % specimen at a magnification of 300×, (G) a side view of a PP/WC 10.0 wt. % sample at a magnification of 150×, (H) a fractured surface of a PP/WC 10.0 wt. % sample at a magnification of 30×, and (I) a fractured surface of a PP/WC 10.0 wt. % sample at a magnification of 300×.
Jcs 07 00393 g011
Figure 12. (A) PP/WC 6.0 wt. % at 1000× magnification; (B) PP/WC 10.0 wt. % at 1000× magnification; (C) PP/WC 10.0 wt. % at 5000× magnification; (D) EDS mapping in the region indicated in (D); (E) EDS analysis of PP/WC 10.0 wt. % obtained from an area containing a large quantity of WC particles; (F,G) EDS mapping of W and C elements dispersion in the nanocomposite, respectively.
Jcs 07 00393 g012
Figure 13. Spider graph showing the mechanical test results. The green zone represents the thermoplastic PP’s raw mechanical performance. The right side displays the mechanical properties shown in the spider graph in a list form. The nanocomposite that achieved the highest results in each mechanical property is indicated with a color scale. Each nanocomposite is presented with a different color according to the provided legend in the figure.
Jcs 07 00393 g013
Table 1. Significant Raman peaks and their related assignments from PP pure.
Wavenumber (cm−1)IntensityRaman Peak Assignment
398MediumO-C-O bending [64]
809Major
839Majorγ(C–OH)ring [65,66]
940SmallC-H bending [64,67]
973Medium
998SmallC-H in-plane bending [67]
1036SmallC-CH3 stretching [68]
1151MediumSkeletal deformation [69]
1168MediumSkeletal vibrations, C–O–C bonds [69]
1329MajorC-O-C stretch [64]
1360MediumC–C-H, C-O–H, and O-C-H [69]
1435MediumC-H3 deformation [68] C- H2 deformation [67,70]
1457MajorC- H3 symmetric bending [64,67,68];
2721SmallC=O stretching [71]
2841MajorC-H2 symmetric stretching [69]
2869MajorC-H2 symmetric stretching [69]; C-H symmetric stretching [72]
2885MajorCH2 symmetric stretching [69,72]
2907MajorCH vibration [69]
2926MajorCH2 asymmetric stretching [69]
2954MajorCH2 asymmetric stretching [69]
2964MajorAsymmetric vibration of νas(CH3) [73]
Disclaimer/Publisher’s Note: The statements, opinions and data contained in all publications are solely those of the individual author(s) and contributor(s) and not of MDPI and/or the editor(s). MDPI and/or the editor(s) disclaim responsibility for any injury to people or property resulting from any ideas, methods, instructions or products referred to in the content.

