Article

Optimization and Prediction of Process Parameters during Abrasive Water Jet Machining of Hybrid Rice Straw and Furcraea foetida Fiber Reinforced Polymer Composite

by
Abhishek Sadananda Madival
1,
Deepak Doreswamy
2,
Raviraj Shetty
1,*,
Nithesh Naik
1,* and
Prakash Rao Gurupur
3
1
Department of Mechanical and Industrial Engineering, Manipal Institute of Technology, Manipal Academy of Higher Education, Manipal 576104, India
2
Department of Mechatronics, Manipal Institute of Technology, Manipal Academy of Higher Education, Manipal 576104, India
3
Manipal School of Architecture and Planning, Manipal Academy of Higher Education, Manipal 576104, India
*
Authors to whom correspondence should be addressed.
J. Compos. Sci. 2023, 7(5), 189; https://doi.org/10.3390/jcs7050189
Submission received: 17 March 2023 / Revised: 10 April 2023 / Accepted: 19 April 2023 / Published: 8 May 2023
(This article belongs to the Special Issue Advanced Polymeric Composites and Hybrid Materials)

Abstract

:
In the last few decades, natural composite materials have been considered one of the highly sustainable ecological alternatives for reducing the consumption of synthetic materials. Today, research on natural fiber composites is the main thrust for their use in various industrial applications. Further, continuous research works are being carried out to utilize natural composites as an alternative to synthetic materials. However, the inhomogeneity of composites, delamination, fiber pullout, higher surface roughness (SR) and dimensional inaccuracy under traditional machining have led the attention towards non-traditional machining, such as abrasive water jet machining, to achieve high-quality components. Hence, in this study, an experimental analysis based on the design of experiments is conducted on the machinability of a hybrid rice straw/Furcraea foetida composite under abrasive water jet machining (AWJM). Further, the concentration of the rice straw and the AWJ process parameters are varied, and their effects on the quality of machining is evaluated. The experimental trials are designed based on the Taguchi L27 orthogonal array, followed by an analysis of variance (ANOVA). From extensive experimentations, the concentration of rice straw is observed to be the most contributing (93.5%) factor to the SR. The traverse speed (TS) shows the highest percentage contributions of 93.13%, 55.50 and 55.70% to the material removal rate (MRR) and the top (TKW) and bottom kerf widths (BKW), respectively. However, the interaction between the fiber concentration and traverse speed gives the maximum contribution (35.04%) to the kerf taper (KT). A second-order response surface model is generated to study the effects of the process parameters on the SR, MRR, TKW, BKW and KT in any experimental domain. Finally, the microstructural characteristics of the machined surfaces, such as micro-cracks, debonding, and fiber pullout, are discussed.

1. Introduction

Environmental pollution caused by the continuous consumption of non-biodegradable synthetic materials is one of the significant issues witnessed around the globe. The dependency on synthetic materials in different applications generates a massive amount of non-biodegradable waste yearly. It is challenging to develop a sustainable model to recycle these wastes entirely, and the majority of them end up in an open environment, affecting ecological lives. Green materials are highly recommended, and various industries are continuously attempting to replace synthetic materials with eco-friendly alternatives [1]. Natural composite materials are considered one of the viable solutions for reducing polymer consumption in various applications [2,3]. Natural fibers show a better strength and dimensional stability, and they are cheaper than synthetic fibers [4,5,6]. Even though natural composites can be fabricated to near-required shapes, it is necessary to perform secondary operations, such as cutting and drilling, to meet the requirements of any specific application. The machinability of natural composites is extremely challenging, as they are anisotropic in nature, and the traditional machining of these composites results in delamination/damage and the development of a poor surface finish and dimensional inaccuracies [7]. Therefore, it is necessary to employ advanced machining techniques and to evaluate the optimum parametric conditions for achieving quality machining. AWJM is one such widely used tool for machining polymer composite materials. The AWJM study by Masoud et.al., 2021 [8] showed that the SOD (83.48%) is the most significant parameter, followed by the water pressure (15.70%) and TS (0.81%), which affected the kerf taper during the AWJ machining of a sugar palm/unsaturated polyester composite. The angle of the kerf taper generated in the test samples varied from 1.42° to 5.91°. Kalirasu et.al., 2015 [9] studied the AWJM of a coconut sheath/polyester composite. The study showed that the poor adhesion between the fiber and the matrix resulted in delamination and poor cutting quality. Jignesh et.al., 2014 [10] observed that an increase in the SOD and TS increased the surface roughness and kerf taper during the AWJ machining of a banana/unsaturated polyester composite. The overlapping of abrasives and the loss of the kinetic energy of the jet were observed to be the reason for the higher surface roughness and kerf at the higher TS and SOD, respectively. Azmir et.al., 2008 [11] observed that the water jet pressure (12.54%) and TS (11.11%) are significant parameters in the AWJM of a glass/epoxy composite. In addition, an increase in SOD increased the jet diameter and reduced the kinetic energy. Moreover, a lower traverse speed produced a better surface finish. Kalirasu et.al., 2015 [12] observed that the abrasive particle (77.42%) and traverse speed (16.11%) are the most contributing parameters affecting the kerf taper during the AWJM of a banana/polyester composite. Kumar et.al., 2019 [13] studied the AWJM of a Kevlar/epoxy composite by designing and analyzing experimental trials using Taguchi and ANOVA methods. The study showed that the traverse speed (46.90%) and water pressure (44.49%) mainly affected the surface roughness and kerf characteristics in the composite. The SR and KT increased with an increase in TS. At the same time, they decreased with an increase in water pressure. Jani et.al., 2020 [14] identified the traverse speed as the predominant factor that influences the kerf characteristics and MRR during the AWJM of an epoxy composited reinforced by hemp, Kevlar and coconut shell powder. The study showed that the kerf characteristics could be minimized by reducing the traverse speed. Moreover, an increase in the filler concentration increased the SR. AWJM is also used to machine complicated heterogenous structures. Szatkiewicz et al., 2023 [15] machined 3D printed steel 316 L and polymer composites using AWJ. Perec et al., 2022a, 2022b [16,17] studied the AWJ machining of steel material using recycled abrasive particles. It was observed in the study that the depth of the cut was directly proportional to the internal diameter of the nozzle during the AWJ machining. Moreover, the study by Perec et al., 2021 [18] achieved the maximum depth of cut (87.3 mm) with a 19.3% concentration of abrasive particles during the AWJ machining of marble material. AWJM consists of several critical process parameters; however, the traverse speed, water pressure, abrasive flow rate, type and size of abrasive grains and standoff distance are the most important parameters that affect the quality of machining [19,20,21]. There are fewer studies that detail the effect of a hybrid natural fiber reinforcement on the machinability of polymer composites. In this study, the machinability of a hybrid RSp/FF composite is studied, and the effects of the RSp concentration, standoff distance and traverse speed on the surface roughness, MRR and kerf are evaluated. The experimental trials are designed using the Taguchi L27 array, and the data are analyzed using ANOVA. Moreover, a second-order response model is developed to predict the output parameters under any given parametric conditions.

2. Methodology

The fibers extracted from locally collected rice straw and Furcrea foetida leaves were utilized as fiber reinforcement to fabricate a polymer composite. The segregated rice straw was chopped and ground into rice straw particles (RSp). The Furcraea foetida (FF) fiber was extracted from the plant’s leaf by using the water retting process [22,23]. Further, the extracted FF fibers were segregated, and a unidirectional fiber mat was prepared. Epoxy (Lapox L12) and a hardener (K6) (By: Atul Pvt. Ltd., Gujrat, India) were used as the matrix material. The composite samples were prepared using the hand layup method by varying the RSp fiber concentration. Initially, the RSp and epoxy were mixed, and the hardener was added to the mixture by maintaining an epoxy–hardener ratio of 1:10. The mold was coated with a releasing agent, and a thin layer of the RSp mixture was applied. The FF mat was then placed on the previously applied RSp layer, and another layer of the RSp mixture was applied on top of the FF fiber mat. The RSp mixture was homogenously spread across the mold using a hand roller, and this step was repeated until the required thickness was achieved. The laminate was allowed to cure under room conditions for 12 h. After curing, the laminate was removed from the mold. Figure 1 shows optical microscopic images detailing the distribution of the RSp in the fabricated test samples. Table 1 details the compositions of the composites.
Taguchi’s design of experiments is used to evaluate the effect of the AWJM process parameters on the machining quality. The RSp, SOD and TS are considered the process parameters by considering three parametric levels. Table 2 shows the process parameters and respective levels. The experimental trials are designed using the Taguchi L27 orthogonal array [24].
In the Taguchi experimental analysis of the S/N ratio characteristics, the smaller the better is considered for the SR and kerf characteristics [25], whereas the larger the better is adopted for the MRR, and these are given in Equations (1) and (2), respectively [26,27], where n is the number of observations, and y is the observed data.
The smaller the better:
S N = 10 log 1 n y 2
The larger the better:
S N = log 1 n 1 y 2
The response surface methodology (RSM) is a popular tool for evaluating the output parameters under any given experimental condition [28,29,30]. Therefore, a second-order response surface model (Equation (3)) is developed to estimate the effects of the fiber, SOD and TS on the output parameters during the AWJM of the hybrid rice straw/Furcrea foetida composite.
y = β 0 + i = 1 k β i x i + i = 1 k β i i x i 2 + i j β i j x i x j + ε
The least square method is considered for calculating the β coefficients of the model. The empirical relationships between the parameters are established using a central composite design. The different parameters and levels used and the central composite design for the AWJM of the test samples are shown in Table 3 and Table 4, respectively.
The fabricated composites are machined using an abrasive water jet machine. Figure 2 shows the AWJM (Protomax, Omax Corporation, Kent, Washington, DC, USA) used for the study. The specifications of the AWJ machine used for the study are detailed in Table 5, and Figure 3 shows the machined test samples. The garnet abrasive (85 HPX) used for the study is procured from Barton International, New York, NY, USA. The hardness of the garnet particles varies from 7.5 to 8.5 Mohs, and they are sharp and angular with an irregular shape. The abrasive consists of 92–96% of Garnet Almandine, Pyrope and Grossular with 4–8% of Magnetite, Hornblende, Feldspar, Mica and other minerals. The details of the experimental trials and corresponding responses are shown in Table 6.
The SR of the machined surfaces of the test samples under different parametric conditions are evaluated using a Surtronic 3+ (Taylor and Hobson, Leicester, England, UK) surface roughness tester with a stroke length of 2 mm. The SR is measured at the top, center and bottom surface locations from both the left and right profiles of the machined surfaces, as shown in Figure 4. However, the MRR (mm3/min) is calculated using Equation (4), where, t is the thickness of the test sample (mm), Od is the nozzle orifice diameter (mm) [Od = (TKW -BKW)/2], and Ts (mm/min) is the traverse speed [31].
M R R = t × O d × T S
The TKW and BKW of the machined slots in the material are measured using a tool makers microscope (Mitutoyo TM-500, Mitutoyo American Corporation, Marlborough, MA, USA). The kerf taper produced by the AWJM is calculated using Equation (5), where θ is the KT angle (deg); t is the thickness of the test sample (mm); and TKW and BKW are the top and bottom kerf widths (mm), respectively [8].
θ =   tan 1 T K W B K W 2 × t
The surface morphology of the machined surfaces is evaluated using SEM (EVO MA18, Carl Zeiss Ltd., Cambridge, UK). The surfaces of the machined test samples are passed through the sputtering process to enhance the electrical conductivity of the test samples. The SEM images of the RSp/FF hybrid test samples are captured at different locations on the machined surface by varying the magnification levels.

3. Results and Discussions

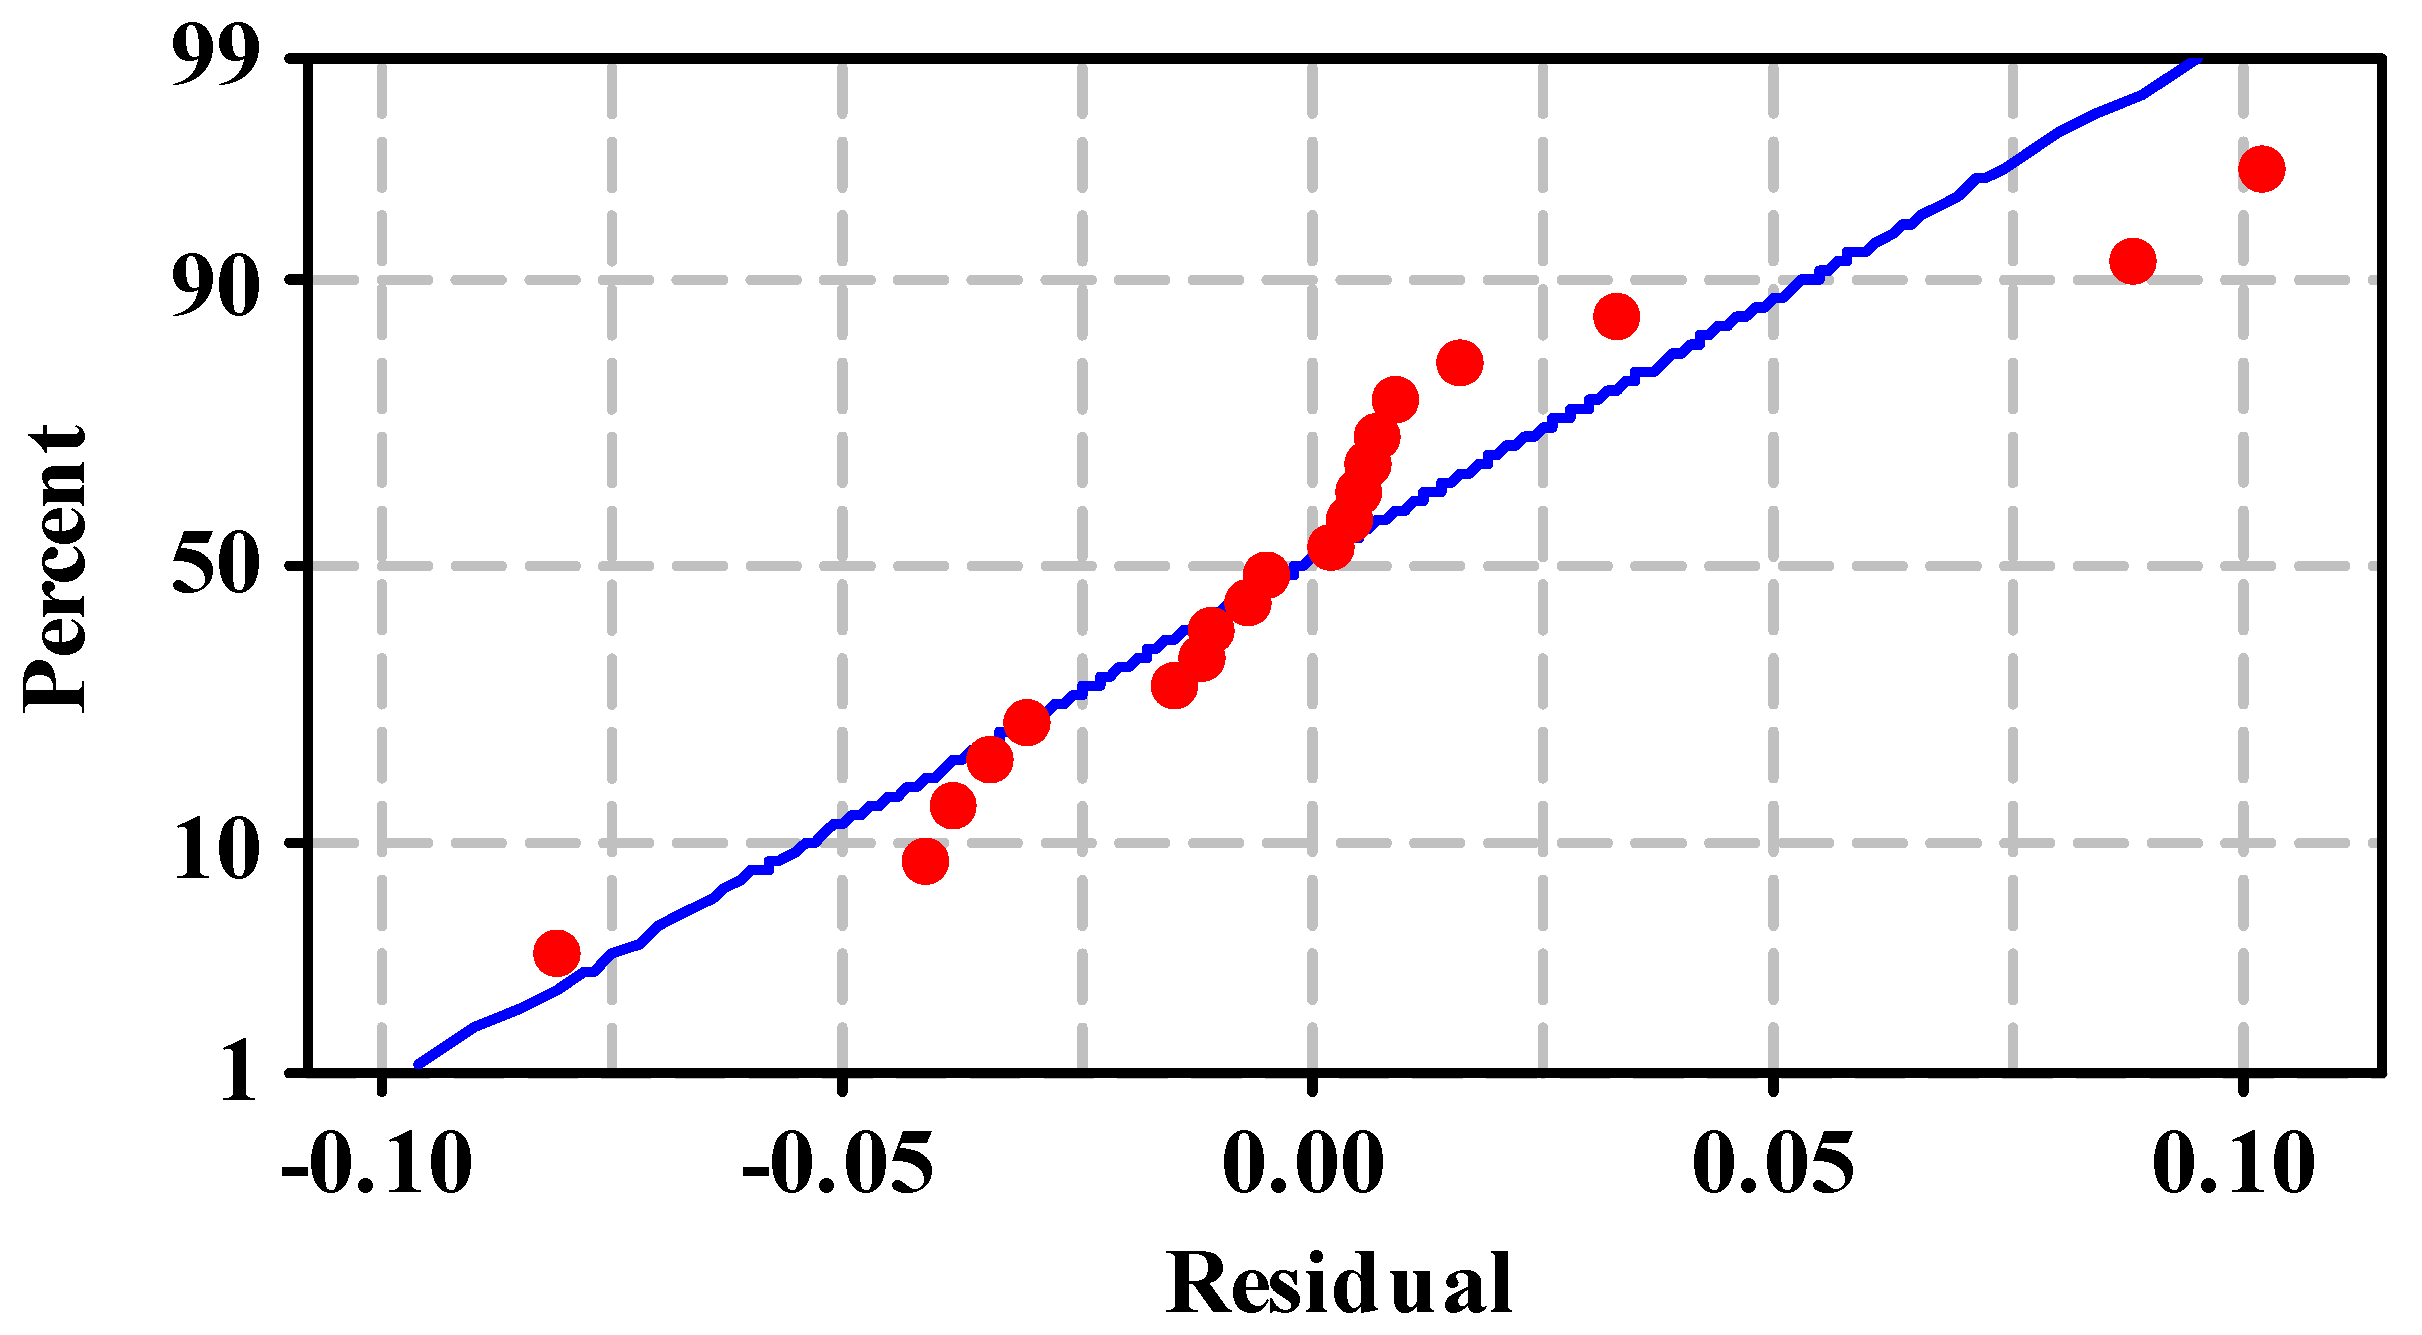
3.1. Surface Roughness

Table 7 shows the SR values of the machined surfaces. Figure 5 shows the main effect plot of the S/N ratio for the surface roughness of the test sample. In the main effect plot, it can be seen that a fiber Wt. of 5%, an SOD of 1 mm and a TS of 100 mm/min are the optimum conditions for obtaining a better surface finish during AWJ machining.
It was observed that the increase in the fiber content in the test sample increased the surface roughness of the machined surface. Since the RSp were randomly oriented in the test sample, these particles developed an irregular surface post-machining. Moreover, the cut FF fibers in the cross-sectional area appeared to be attached to the machined surface. In addition, the striations and cracks that developed on the machined surface due to the impact of the high-velocity abrasive particles further increased the overall SR of the machined surface. The SR marginally increased with the SOD and TS. Due to the air drag at a higher SOD, the water jet deflected and lost a part of its kinetic energy, resulting in a poor surface finish [32]. Moreover, at a higher TS, lesser abrasives take part in the cutting action, which resulted in a higher SR of the machined surface [33]. The contribution of each AWJM parameter and their interaction effects on the surface roughness are evaluated by conducting an ANOVA. The details from the ANOVA for the surface roughness are shown in Table 8. The analysis is conducted at a confidence level of 95%; i.e., α = 0.005. The R2 and R2 (adj) values in the ANOVA table are 96.7% and 89.2%, respectively. It is evident from the ANOVA table that the fiber concentration was the most contributing parameter (P = 93.35%) to the SR of the test sample, followed by TS (P = 2.14%), Fiber × SOD (P = 0.50%), SOD × TS (P = 0.46%), Fiber × TS (P = 0.14%) and SOD (P = 0.08%). Figure 6 shows the AWJ-machined surface of the R05F20 test sample.
The second-order response surface used to estimate the SR is formulated using the fiber (Wt.%), standoff distance and traverse speed parameters. The relationship between the SR and the process parameters is given in Equation (6), where A = fiber (Wt.%), B = SOD (mm), and C = TS (mm/min). The ANOVA for the response function of the SR is shown in Table 9. For the developed response model, R-Sq = 96.83%; R-Sq (pred) = 49.61%; and R-Sq (adj) = 93.30%. As seen in the table, Fcal (α = 0.05, 30.41) is greater than Ftab (α = 0.05, 9,9 = 3.18), and this indicates that the developed response function is statistically significant. Figure 7 shows the normal probability plot of residuals for the surface roughness. The RSM-predicted values for the 27 experimental trials are accurate, with an average error percentage of 3.49% compared to the experimental results. Figure 8 and Figure 9 show the contour and surface plots of the SR, respectively. In the figure, the intermediate values of the SR between the different ranges of the process parameters can be identified. It is evident from the figure that the increase in fiber (Wt.%) increased the SR of the test sample.
S u r f a c e   R o u g h n e s s   ( µ m ) = 5.28286 0.06479008 × A 0.814621 × B 6.72876 × 10 4 × C + 0.0125229 × A 2 + 0.111405 × B 2 4.02614 × 10 6 × C 2 + 0.0095 × A B + 8 × 10 5 × A C + 0.00140833 × B C

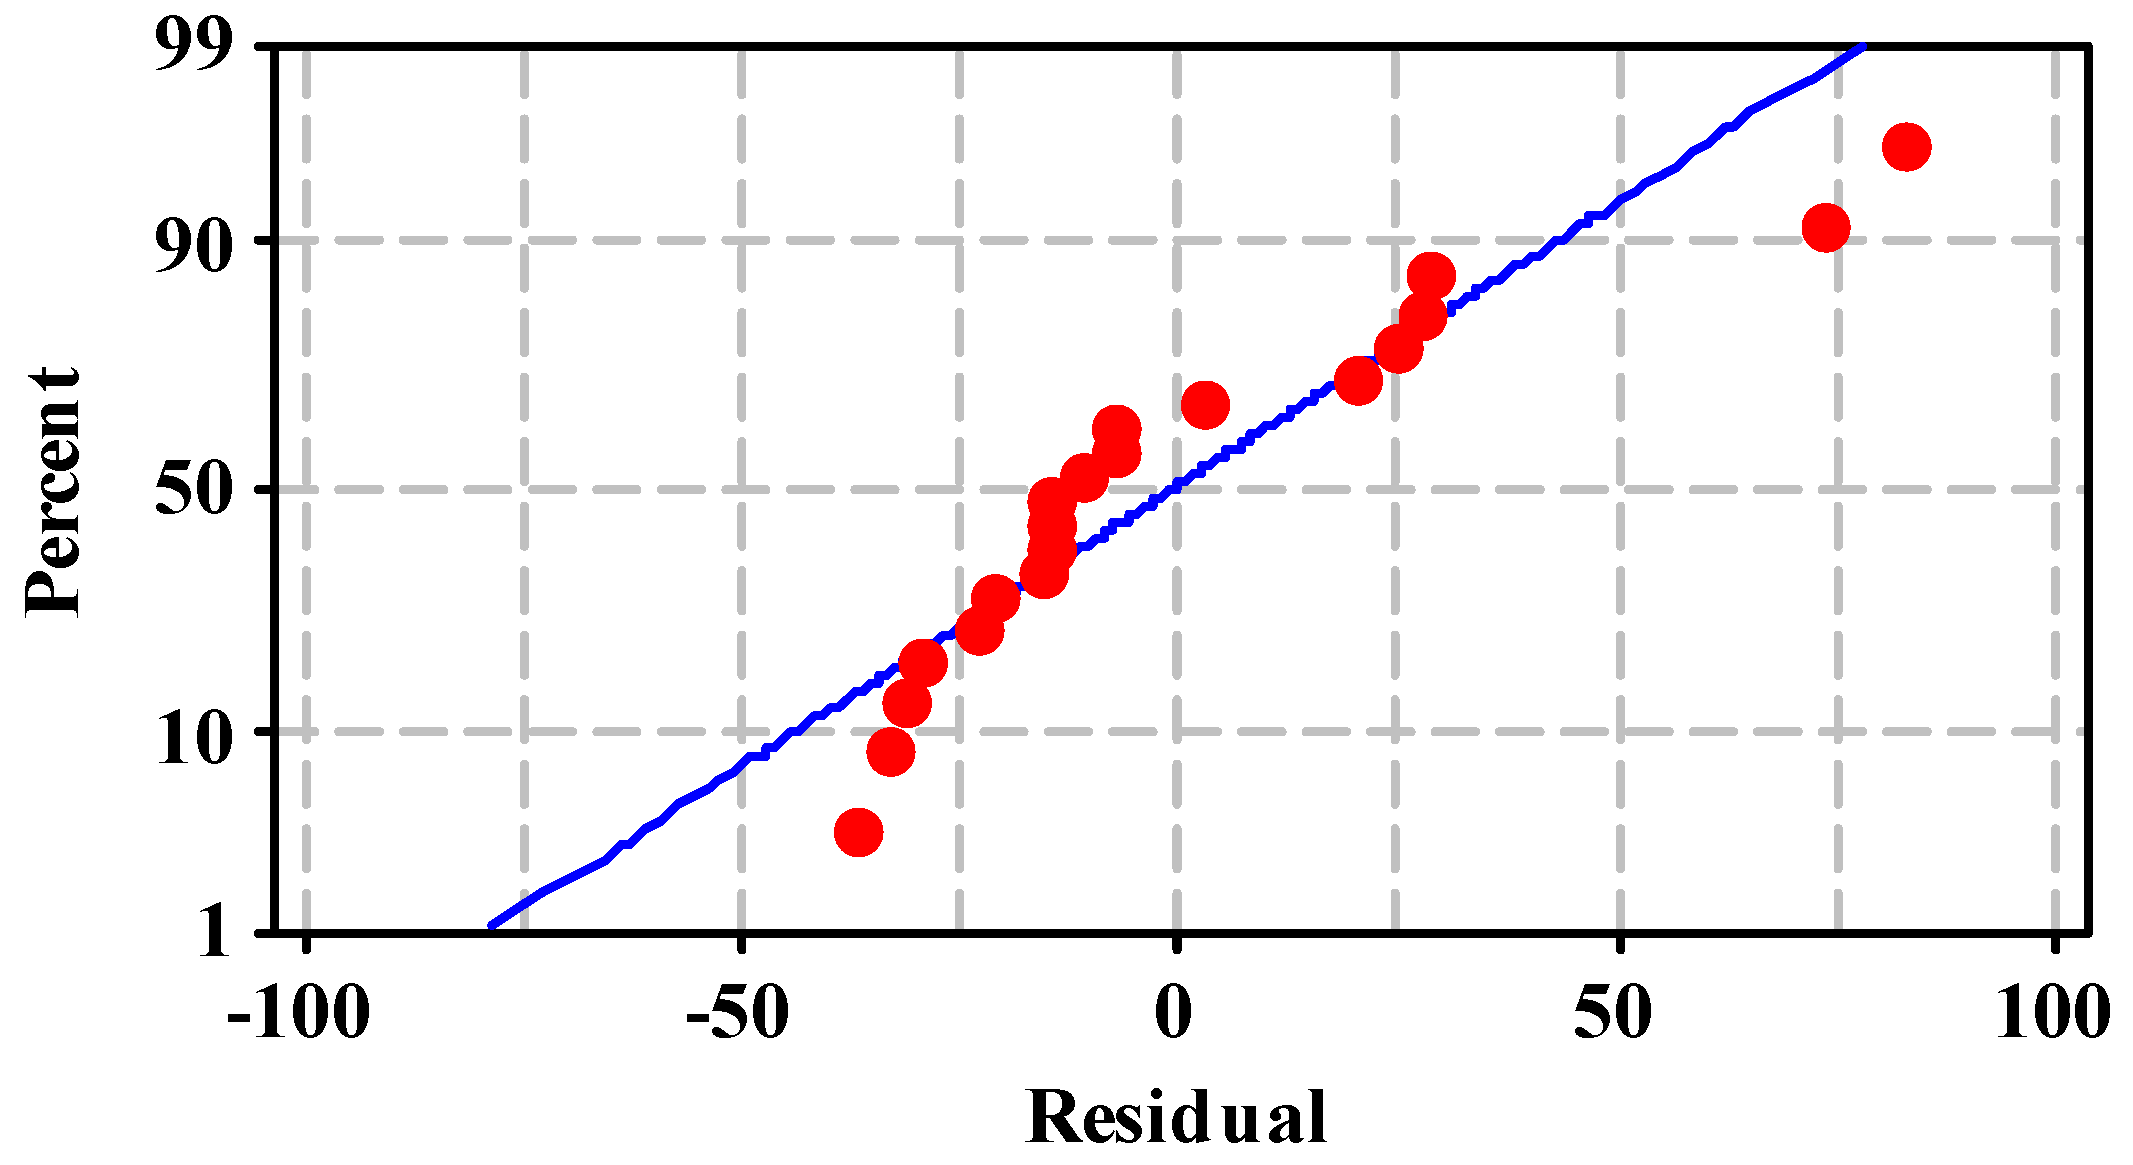
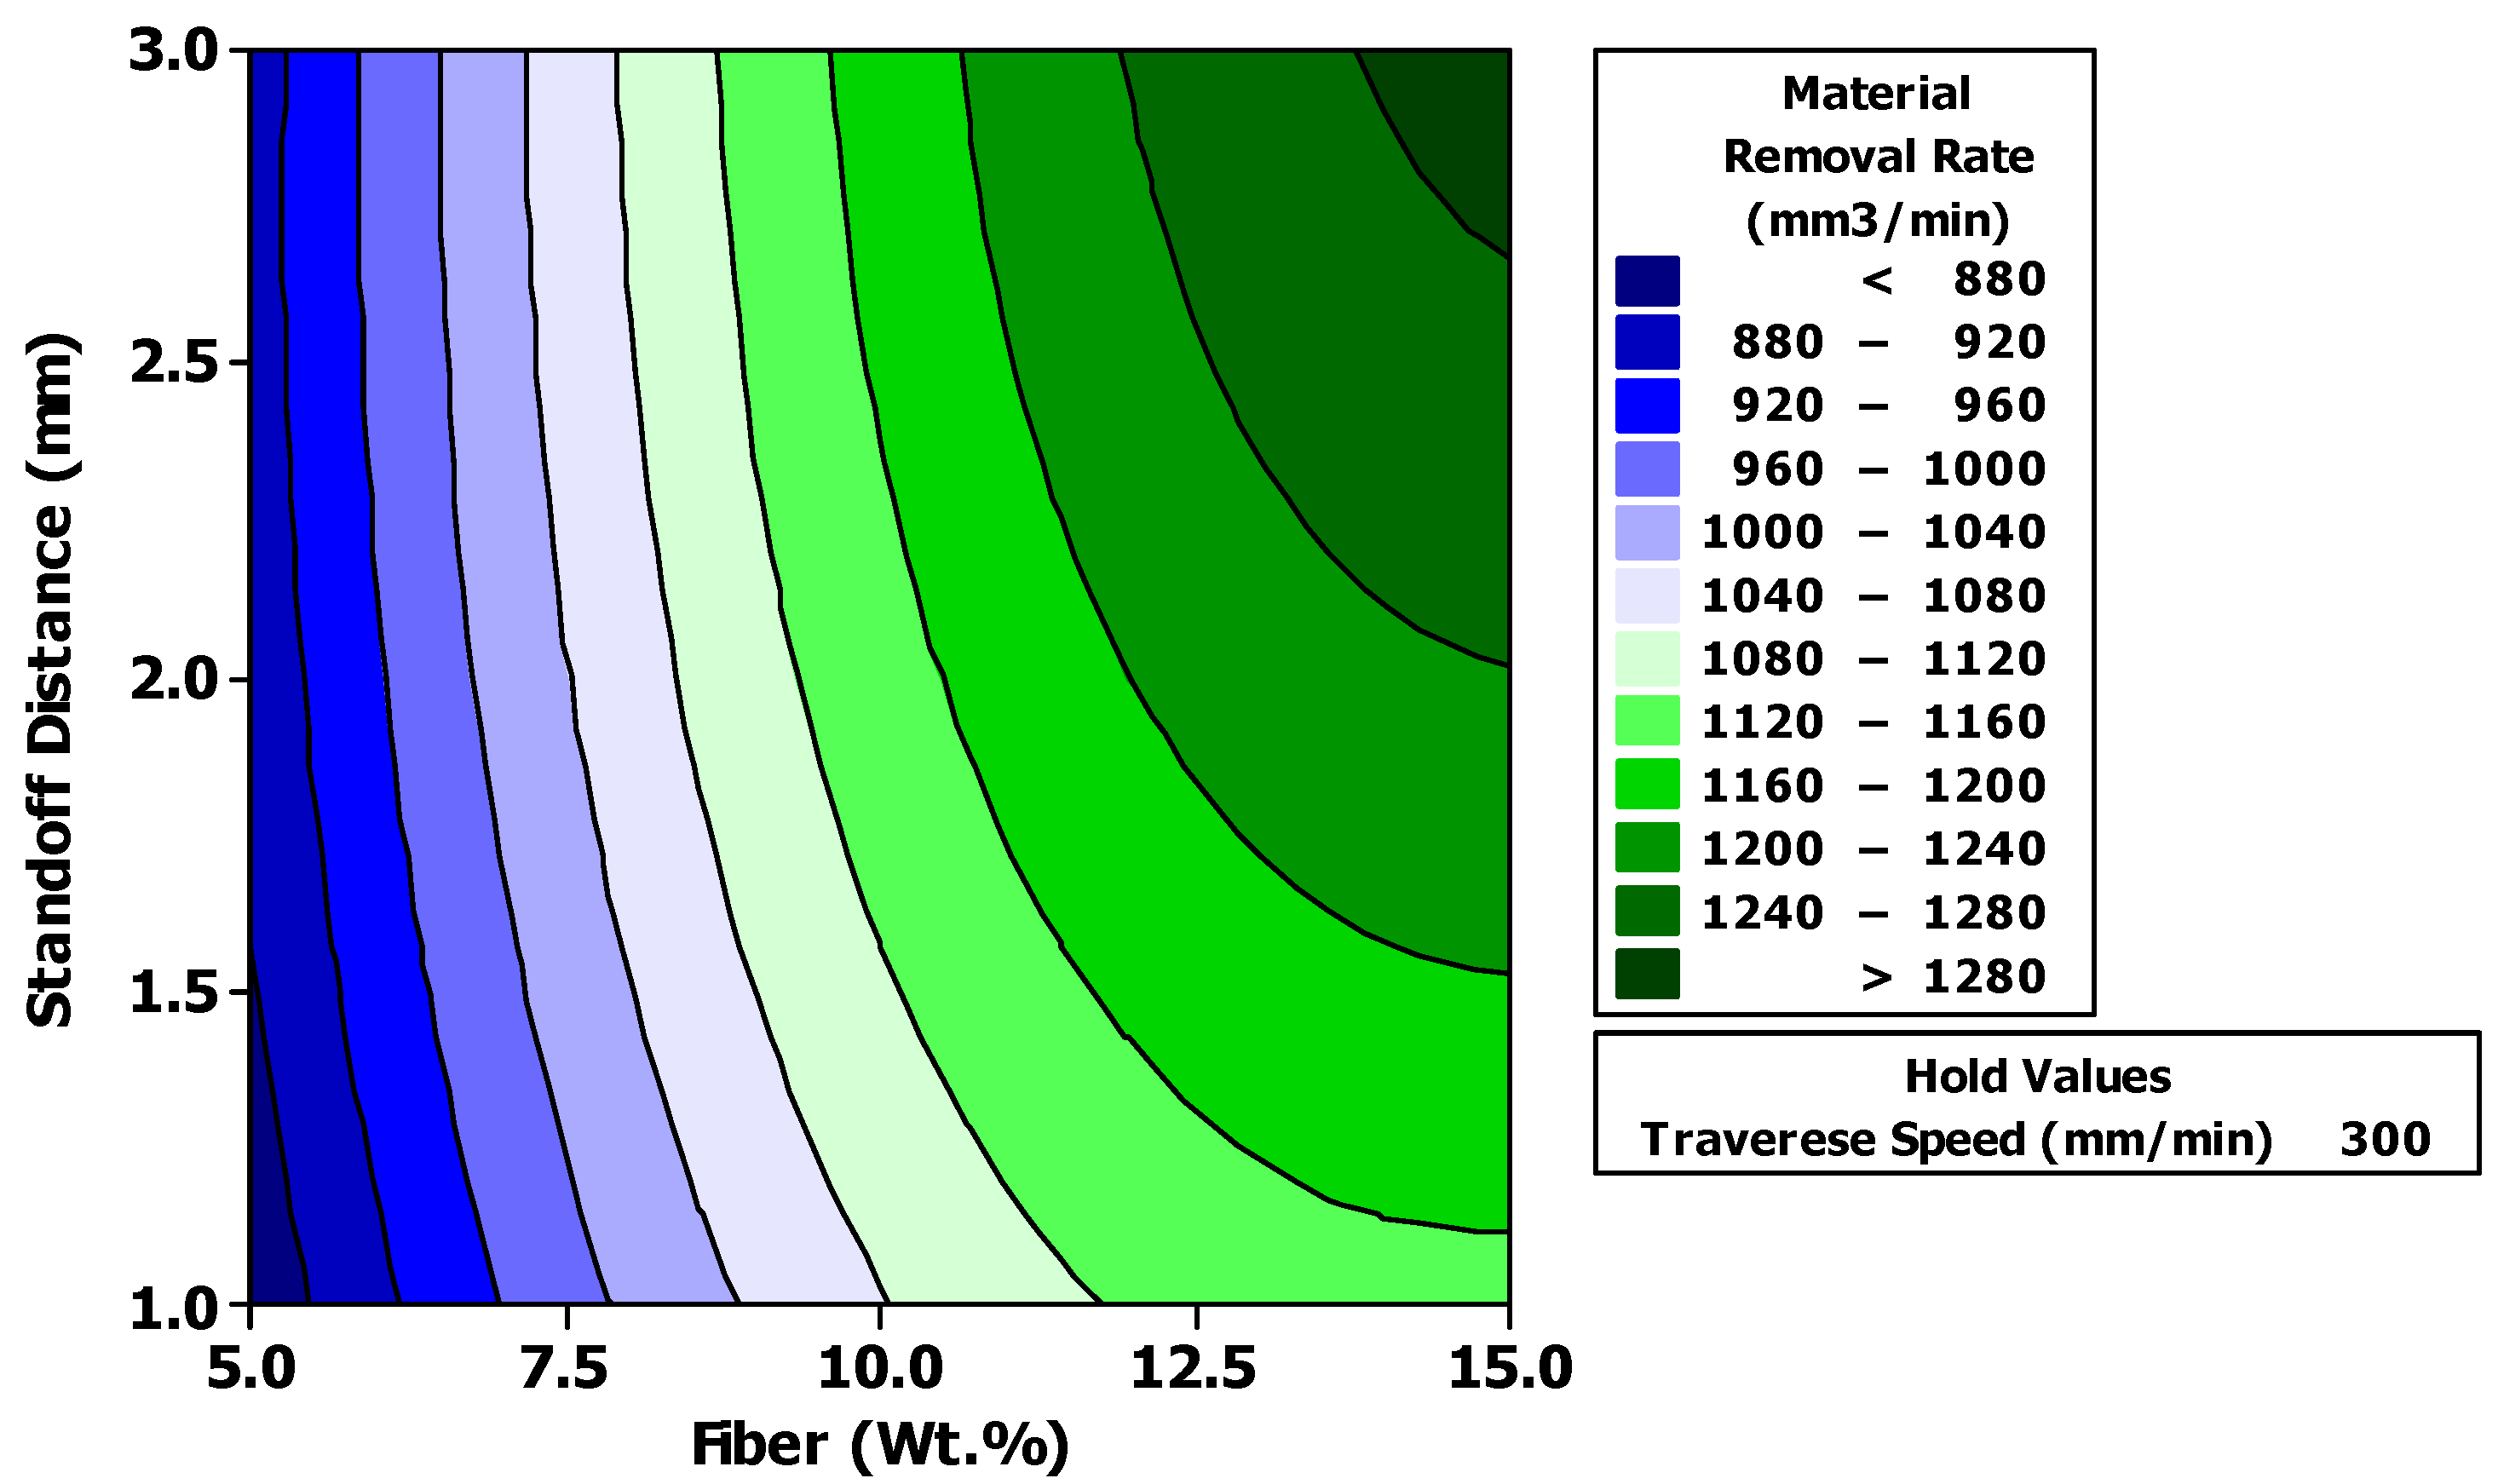
3.2. Material Removal Rate
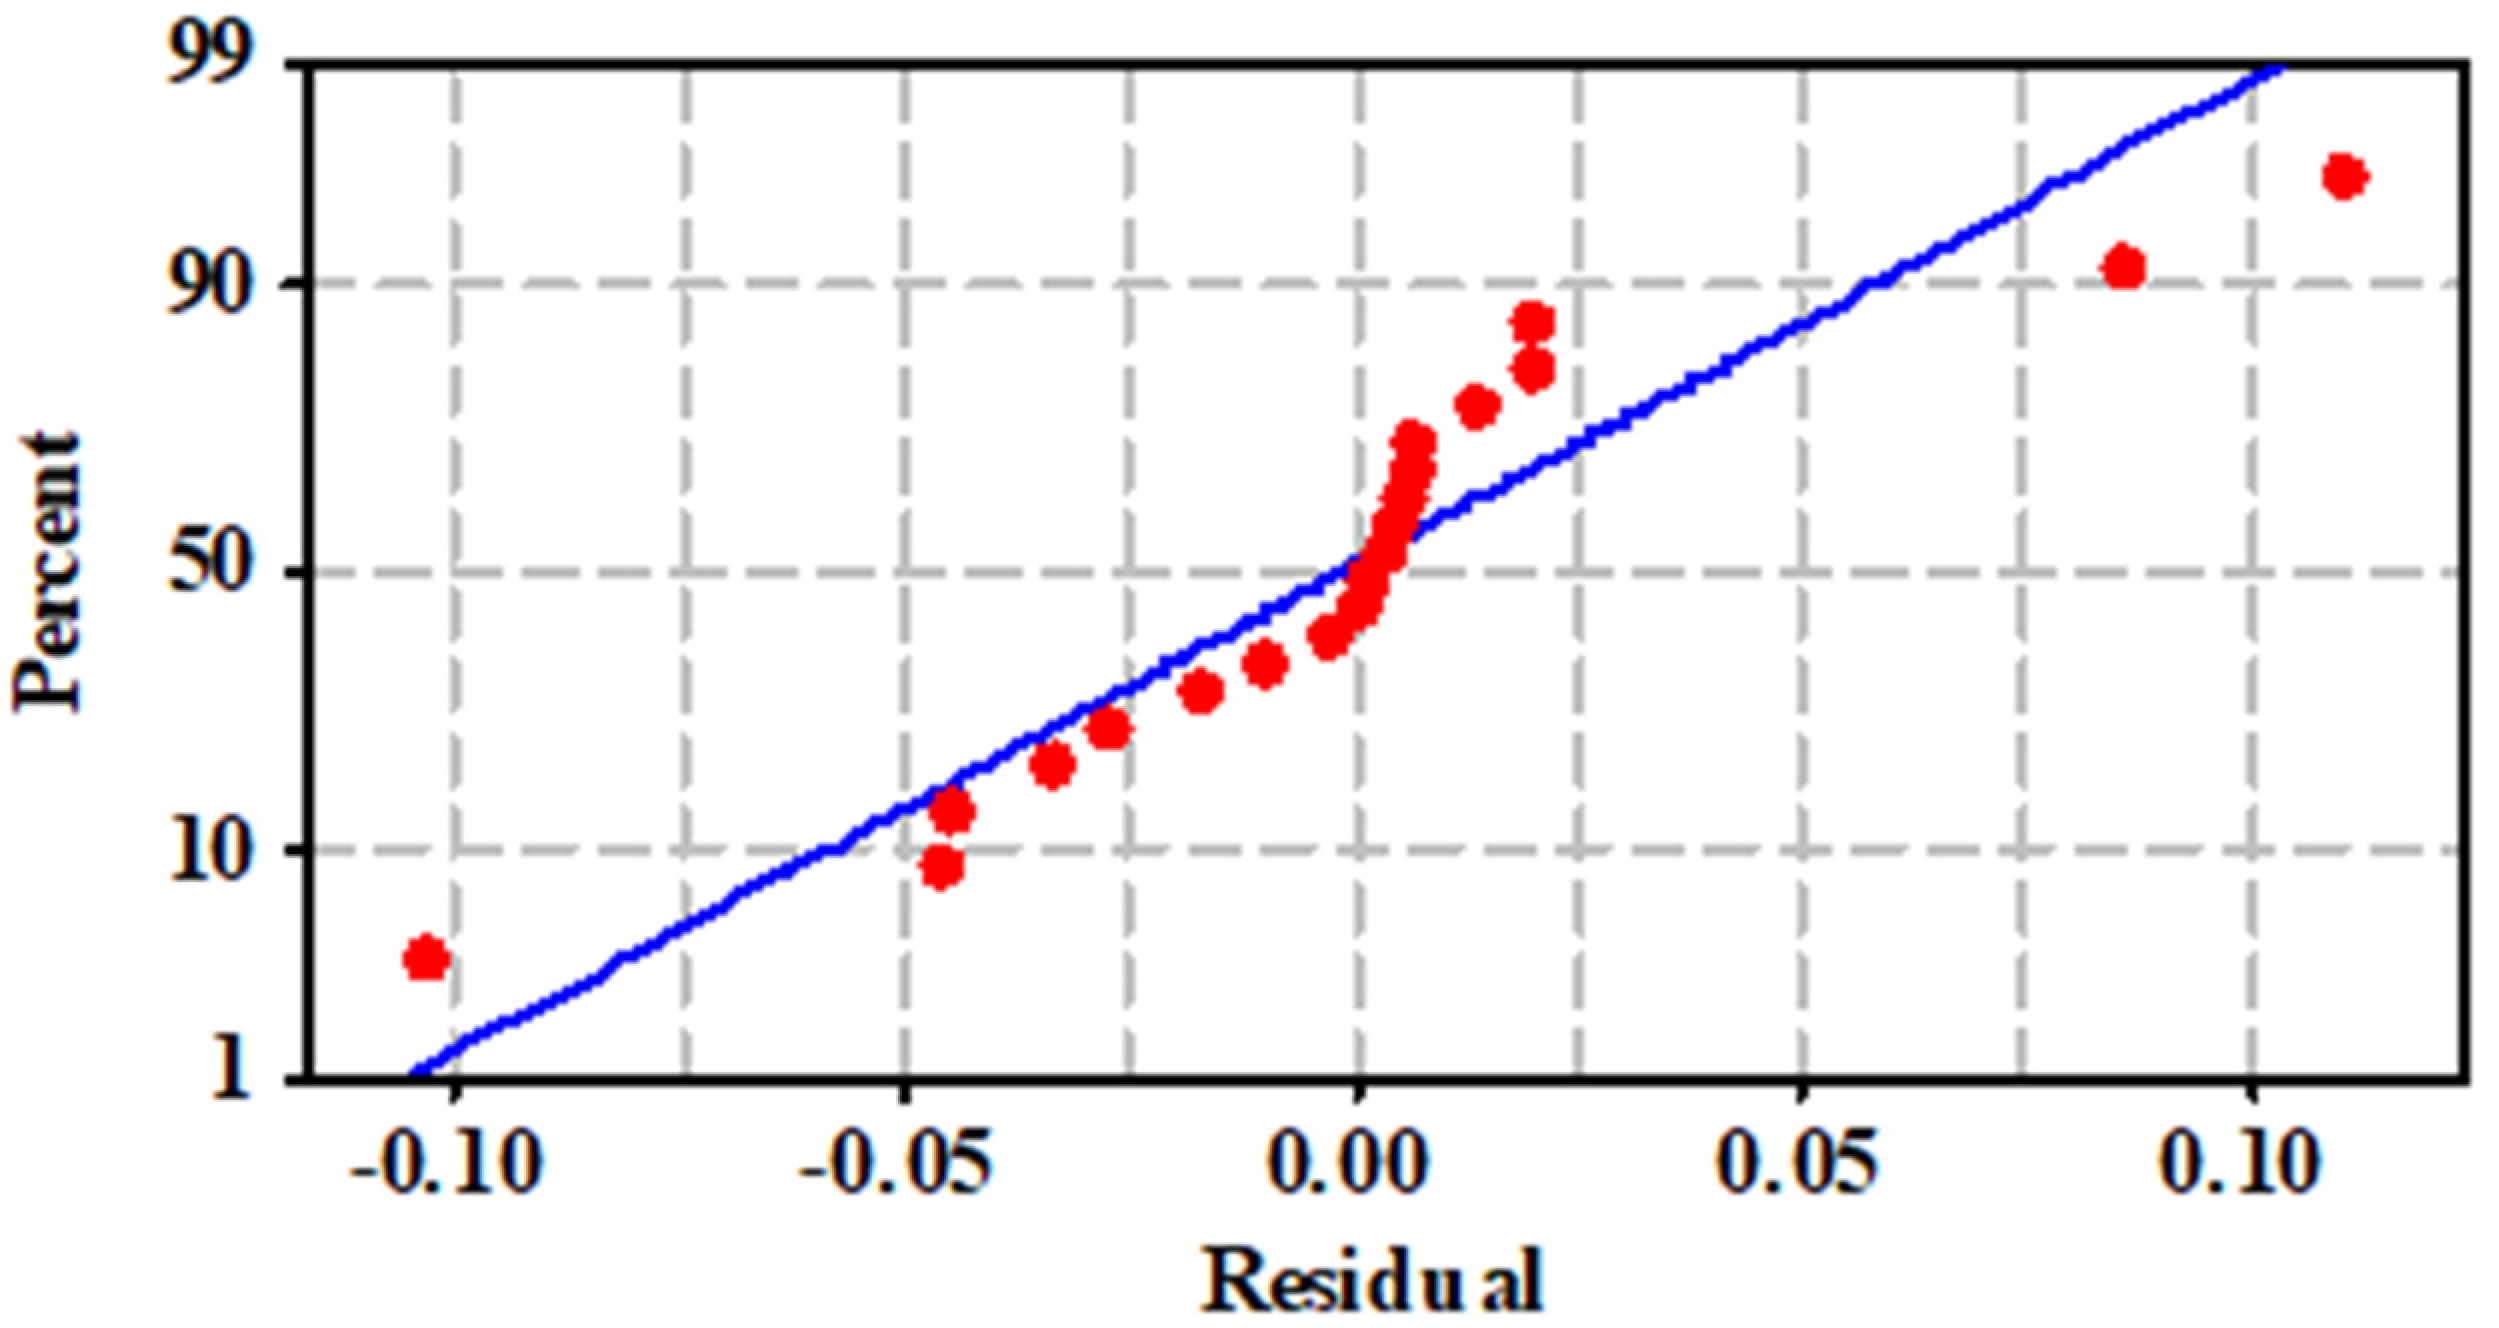
Figure 10 shows the main effect plot of the S/N ratio for the MRR of the test samples under different parametric conditions. In the main effect plot, it is observed that a fiber Wt. of 15%, an SOD of 3 mm and a TS of 300 mm/min are the optimum parametric conditions for achieving a higher MRR during AWJ machining. It is observed that the increase in the fiber wt.%, SOD and TS increases the MRR during the AWJ machining. At higher fiber concentrations, the test sample is covered with a higher amount of the soft RSp phase. This improves the machinability of the test sample, and a higher volume of material is removed. As the SOD increases, the air drag/resistance also increases and expands the diameter of the water jet, and the volume of the material removed from the test sample is higher than that removed from the test samples machined at a lower SOD. The time consumed for machining plays a significant role in achieving a higher MRR. At a higher TS, the time required for machining decreases drastically and results in a higher MRR [14]. The significance of each process parameter on the MRR is evaluated using an ANOVA at a confidence level of 95%; i.e., α = 0.05. The R2 and R2 (adj) values in the ANOVA table are 99.7% and 99%, respectively. From the ANOVA in Table 10, it can be seen that TS (P = 93.13%) is the most significant parameter, followed by Fiber (P = 5.34%), Fiber × SOD (P = 0.36%), SOD (P = 0.33%), Fiber × TS (P = 0.28%) and SOD × TS (P = 0.21%).
The second-order response surface used to estimate the material removal rate is developed by considering the fiber (Wt.%), standoff distance and traverse speed parameters. The effect of the process parameters on the MRR is expressed as a response function, as given in Equation (7), where, A = Fiber (Wt.%), B = SOD (mm), and C = TS (mm/min). The ANOVA for the developed response function of the MRR is as shown in Table 11. R2, R2(pred.) and R2(adj) are 98.22%, 93.40% and 97.52%, respectively. As seen in the table, Fcal (α = 0.05, 83.81) is greater than Ftab (α = 0.05, 9,9 = 3.18), and this shows that the developed response function is statistically significant.
M a t e r i a l   R e m o v a l   R a t e   m m 3 / min = 204.173 + 45.9240 × A 16.4778 × B + 3.232 × C 3.05744 × A 2 15.7559 × B 2 0.00273994 × C 2 + 4.92005 × A B + 0.133058 × A C   0.254932 × B C
Figure 11 shows the normal probability plot of residuals for the MRR. The RSM-predicted values of the output parameters comply with the experimental trial values, with an average error percentage of 14.21% compared to the experimental results. Figure 12 and Figure 13 show the contour and surface plots of the MRR. The contour plot is prepared by considering different levels of fiber wt.% and standoff distance, whereas the traverse speed is held constant (300 mm/min). In the figure, the intermediate output values of the MRR at different ranges of the process parameters can be identified. It is evident from the figure that the increase in the SOD and TS increased the MRR of the test sample.

3.3. Top Kerf Width

Figure 14 shows the main effect of the S/N ratios for the TKW generated in the test sample. In the main effect plot, it is evident that a fiber Wt. of 5%, an SOD of 1 mm and a TS of 100 mm/min are the optimum conditions for obtaining a lower TKW during the AWJ machining of the composites. The TKW of the R10F20 composite slightly increased (6.94%) compared to that of R05F20. However, the TKW of the R15F20 composite reduced (8.3%) compared to that of the R10F20 test sample. As the RSp content was increased, the interface in the test sample was filled with more softer RS particles, and the water jet penetrated with a lower resistance. The increase in the SOD and TS increased the TKW of the test sample. At a higher SOD, the top surface of the test sample was exposed to the downstream of the water jet. This downstream of the water jet produced a wider TKW during the AWJ machining [34]. As the TS increased, the abrasives impinging on the top surface rebounded and developed a wider TKW in the test sample [35]. The contribution of the process parameters on the TKW is analyzed using an ANOVA. The analysis is conducted at a confidence level of 95%; i.e., α = 0.005, and Table 12 shows the details of the ANOVA. The R2 and R2 (adj) percentages in the ANOVA table are 96.1% and 87.2%, respectively. As observed in the table, TS (P = 55.5%) was the most significant parameter affecting the TKW, followed by Fiber × SOD (P = 13.51%), Fiber (P = 11.40%), SOD (P = 6.65%), Fiber × TS (P = 5.70%) and SOD × TS (P = 3.32%).
The second-order response surface used to estimate the top kerf width is developed by considering the fiber (Wt.%), SOD and TS parameters. Equation (8) relates the effect of the process parameters on the TKW, where, A = Fiber (Wt.%), B = SOD (mm), and C = TS (mm/min). The ANOVA for the developed response function of the TKW is detailed in Table 13. The R2, R2 (pred) and R2 (adj) percentages for the ANOVA are 91.39%, 71.92% and 81.82%, respectively. As seen in the table, Fcal (α = 0.05, 10.60) is greater than Ftab (α = 0.05, 9,9 = 3.18), and this indicates that the response function is statistically significant. Figure 15 shows the normal probability plot of residuals for the TKW. The RSM-predicted response values comparably comply with the actual experimental trial values, with an average error percentage of 5.76%. Figure 16 and Figure 17 show the contour and surface plots of the top kerf width. The contour plot is prepared by considering different levels of fiber wt.% and standoff distance, whereas the traverse speed is held constant (100 mm/min). It is evident in the Figure that the AWJ parameters, i.e., an SOD of 2 mm and a fiber wt.% of 10, result in a lower top kerf width.
T o p   K e r f   W i d t h   m m = 0.0841306 + 0.0846414 × A + 0.0321405 × B + 0.00202641 × C 0.00471307 × A 2 0.0208268 × B 2 4.33268 × 10 6 × C 2 + 0.00370833 × A B + 1.20833 × 10 5 A C + 0.000127083 × B C

3.4. Bottom Kerf Width

Figure 18 shows the main effect plot for the S/N ratio of the BKW developed in the test sample. In the main effect plot, it can be seen that a fiber Wt. of 5%, an SOD of 1 mm and a TS of 100 mm/min were the optimum experimental conditions for obtaining a lower BKW during the AWJ machining of the hybrid rice straw/Furcraea foetida test samples. The BKW initially increased up to a fiber wt.% of 10, above which the BKW marginally decreased. It was observed that the increase in the TS and SOD increased the BKW. At a higher SOD, the widening of the jet due to air resistance produced a wider bottom kerf. Moreover, the overlapping of abrasives particles resulted in a wider bottom kerf width at a higher TS.
The contribution of each process parameter to the BKW is evaluated using an ANOVA. The analysis is conducted at a confidence level of 95%; i.e., α = 0.005. The ANOVA is shown in Table 14. The R2 and R2 (adj) values in the ANOVA table are 94.9% and 83.4%, respectively. The TS (P = 55.70%) is observed to be the most significant parameter that affects the BKW, followed by SOD (P = 11.39%), Fiber (P = 9.76%), Fiber × SOD (P = 9.43%), Fiber × TS (P = 5.15%) and SOD × TS (P = 3.48%).
The second-order response surface used to estimate the bottom kerf width during the AWJM of the test samples is developed by considering the fiber (Wt.%), standoff distance and traverse speed. Equation (9) shows the relationship between the process parameters and the bottom kerf width, where, A = Fiber (Wt.%), B = SOD (mm), and C = TS (mm/min). The ANOVA for the developed response function of the material removal rate is detailed in Table 15. The R2, R2 (pred) and R2(adj) values for the ANOVA are 89.25%, 59.84% and 77.31%, respectively. As seen in the ANOVA table, Fcal (α = 0.05, 8.27) is greater than Ftab (α = 0.05, 9,9 = 3.18), and this is indicates that the response function is statistically significant. Figure 19 shows the normal probability plot of residuals for the BKW. The RSM-predicted values for the experimental trials comply with the actual experimental trials, with an average error percentage of 5.68%.
B o t t o m   K e r f   W i d t h   m m = 0.148114 + 0.0739152 × A + 0.0286092 × B + 0.00269476 × C 0.00409542 × A 2 0.0180523 × B 2 6.15523 × 10 6 × C 2 + 0.003475 × A B + 1.05833 × 10 5 × A C + 0.000157083 × B C
Figure 20 and Figure 21 show the contour and surface plots of the bottom kerf width, respectively. The contour plot is prepared by considering different levels of fiber wt.% and standoff distance, whereas the TS is held constant (100 mm/min). As seen in the Figure, the lower bottom kerf width can be achieved at a fiber wt.% of 5 and 15. However, at 10 wt.% of fiber content, the bottom kerf width is observed to be slightly higher. The 3D surface plot shows that the increase in the SOD increases the bottom kerf width. Table 16 shows a comparison between the experimental and RSM-predicted response parameters for the 27 experimental trials.

3.5. Kerf Taper

Figure 22 shows the effect of the AWJM parameters on the kerf taper developed in the test samples. In the main effect plot, it is observed that a fiber Wt. of 5%, an SOD of 1 mm and a TS of 100 mm/min are the optimum levels of the process parameters for achieving a lower KT during AWJ machining. It is observed that the increase in the fiber wt.%, SOD and TS increases the KT in the test sample.
The increase in the fiber wt.% resulted in the development of softer fiber regions in the test sample. During machining, the abrasive particles easily penetrated the test sample and resulted in kerf widths that were slightly wider than those of the test samples with a lower fiber reinforcement. There were no major changes in the KT observed up to an SOD of 2 mm and a TS of 200 mm/min, above which the KT increased. At a higher SOD, the water jet diverged due to the increased air resistance and slightly increased the width of the impinging jet [36,37]. This variation in the BKW and TKW increased the KT. In the ANOVA in Table 17, it is evident that the interaction between the fiber and TS (35.04%) was the major contributor to the KT, followed by Fiber × SOD (29.83%), fiber (12.73%), SOD (10.27%), SOD × TS (8.5%) and TS (1%). The R2 and R2 (adj) values for the ANOVA are 97.4% and 91.5%, respectively.
Figure 23 shows the overall contribution of each process parameter to the SR, MRR, TKW, BKW and KT. The fiber Wt.% showed the maximum percentage contribution to the SR (93.35%). However, the TS showed the maximum percentage contributions of 93.13%, 55.50% and 55.70% to the MRR, TKW and BKW, respectively. The interaction between the fiber and TS showed a higher contribution (35.04%) to the KT. Overall, the contribution of the SOD to the machining quality was lower than that of the other process parameters.

3.6. Microstructural Analysis of AWJ-Machined Surfaces

Figure 24 shows the SEM images of the AWJ-machined surfaces of the test samples at different magnification levels. Figure 24 shows the presence of voids in the machined surfaces, which appear like globular pits. Figure 24a–c show the RSp and FF fibers attached to the machined surfaces. These irregularly arranged fibers on the machined surface appear to be one of the reasons for the higher surface roughness of the machined test samples. Due to the softer nature of the fibers, the abrasive particles are ineffective in cutting the fibers completely as a result, a section of fibers appears on the machined surfaces. In addition, abrasive particles generate striations on the machined surfaces due to the ploughing action of the abrasive particles. This combined effect further increases the SR of the machined surfaces. The high-velocity impact of the abrasives generates minor cracks on the impacted surfaces [38]. Moreover, the slight debonding of the fibers is observed in the cross-sectional regions of the machined surfaces; however, no fiber pullout or delamination is noticed. The RSp and FF fibers show good bonding with epoxy under AWJM. Figure 24d shows the garnet abrasive stuck on the machined surface of the test samples.

4. Conclusions

Natural composite materials are gaining a lot of interest among various industries for developing sustainable eco-friendly materials. As the traditional machining techniques are ineffective in achieving quality machining in polymer composites, it is necessary to identify and establish advanced machining techniques and the optimum conditions for achieving higher-quality machining. Therefore, in this study, AWJM is considered for machining a hybrid RSp/FF composite, and its effects on the machining quality are evaluated. The results from the study are detailed as follows:
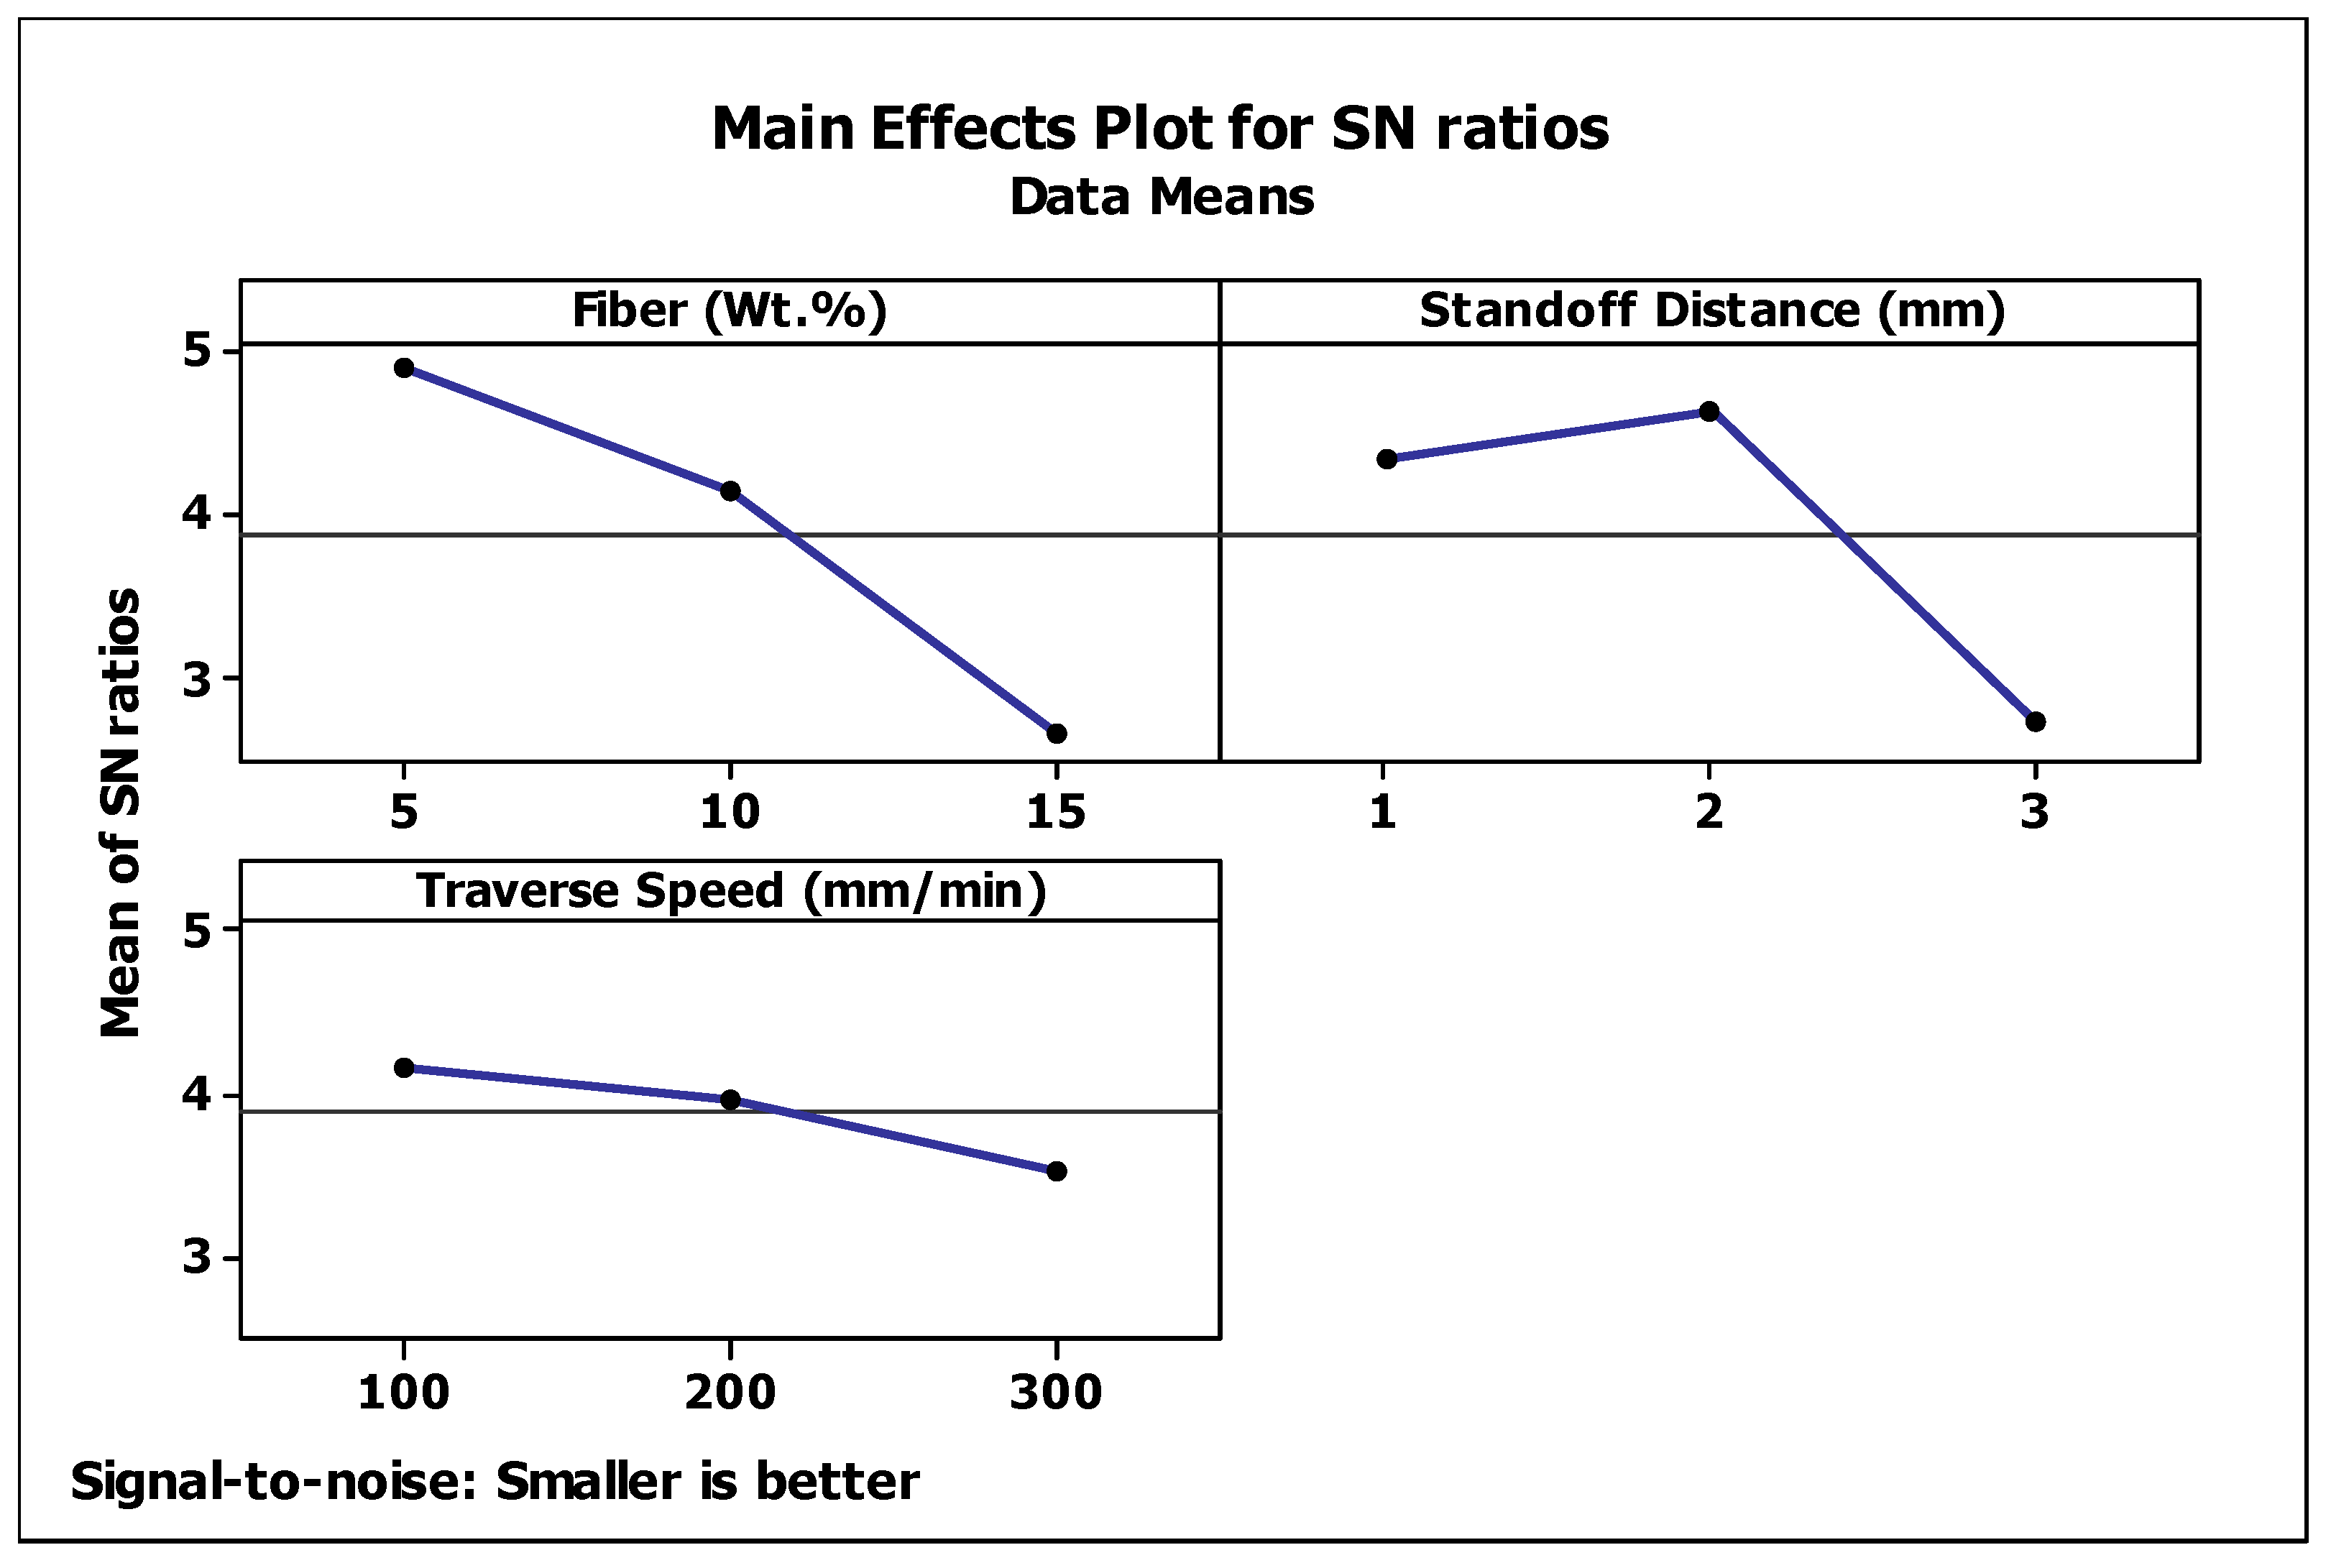
  • The rice straw concentration was observed to be the most contributing parameter (93.35%) to the surface roughness during the AWJ machining. It was seen that the increase in the rice straw concentration increased the surface roughness of the test sample. The inability of the abrasive jet to completely machine the softer fiber phase generated surface irregularities and increased the surface roughness.
  • The MRR was highly affected (93.13%) by the traverse speed and increased with the increase in the TS. The time involved in the machining process drastically decreased at a higher TS and improved the MRR during the AWJ machining.
  • The TKW and BKW were observed to be majorly influenced by the TS. The percentage contributions of the TS to the TKW and BKW were 55.5% and 55.7%, respectively. At a higher traverse speed, the abrasive particles rebounded on the cross-sectional surface of the test sample due to the faster movement of the nozzle and resulted in increased kerf widths in the test sample.
  • A second-order response function of the surface roughness, material removal rate, TKW and BKW was developed by considering the process parameters. The RSM-predicted values were closely comparable with the experimental results, with a minimal percentage of errors.
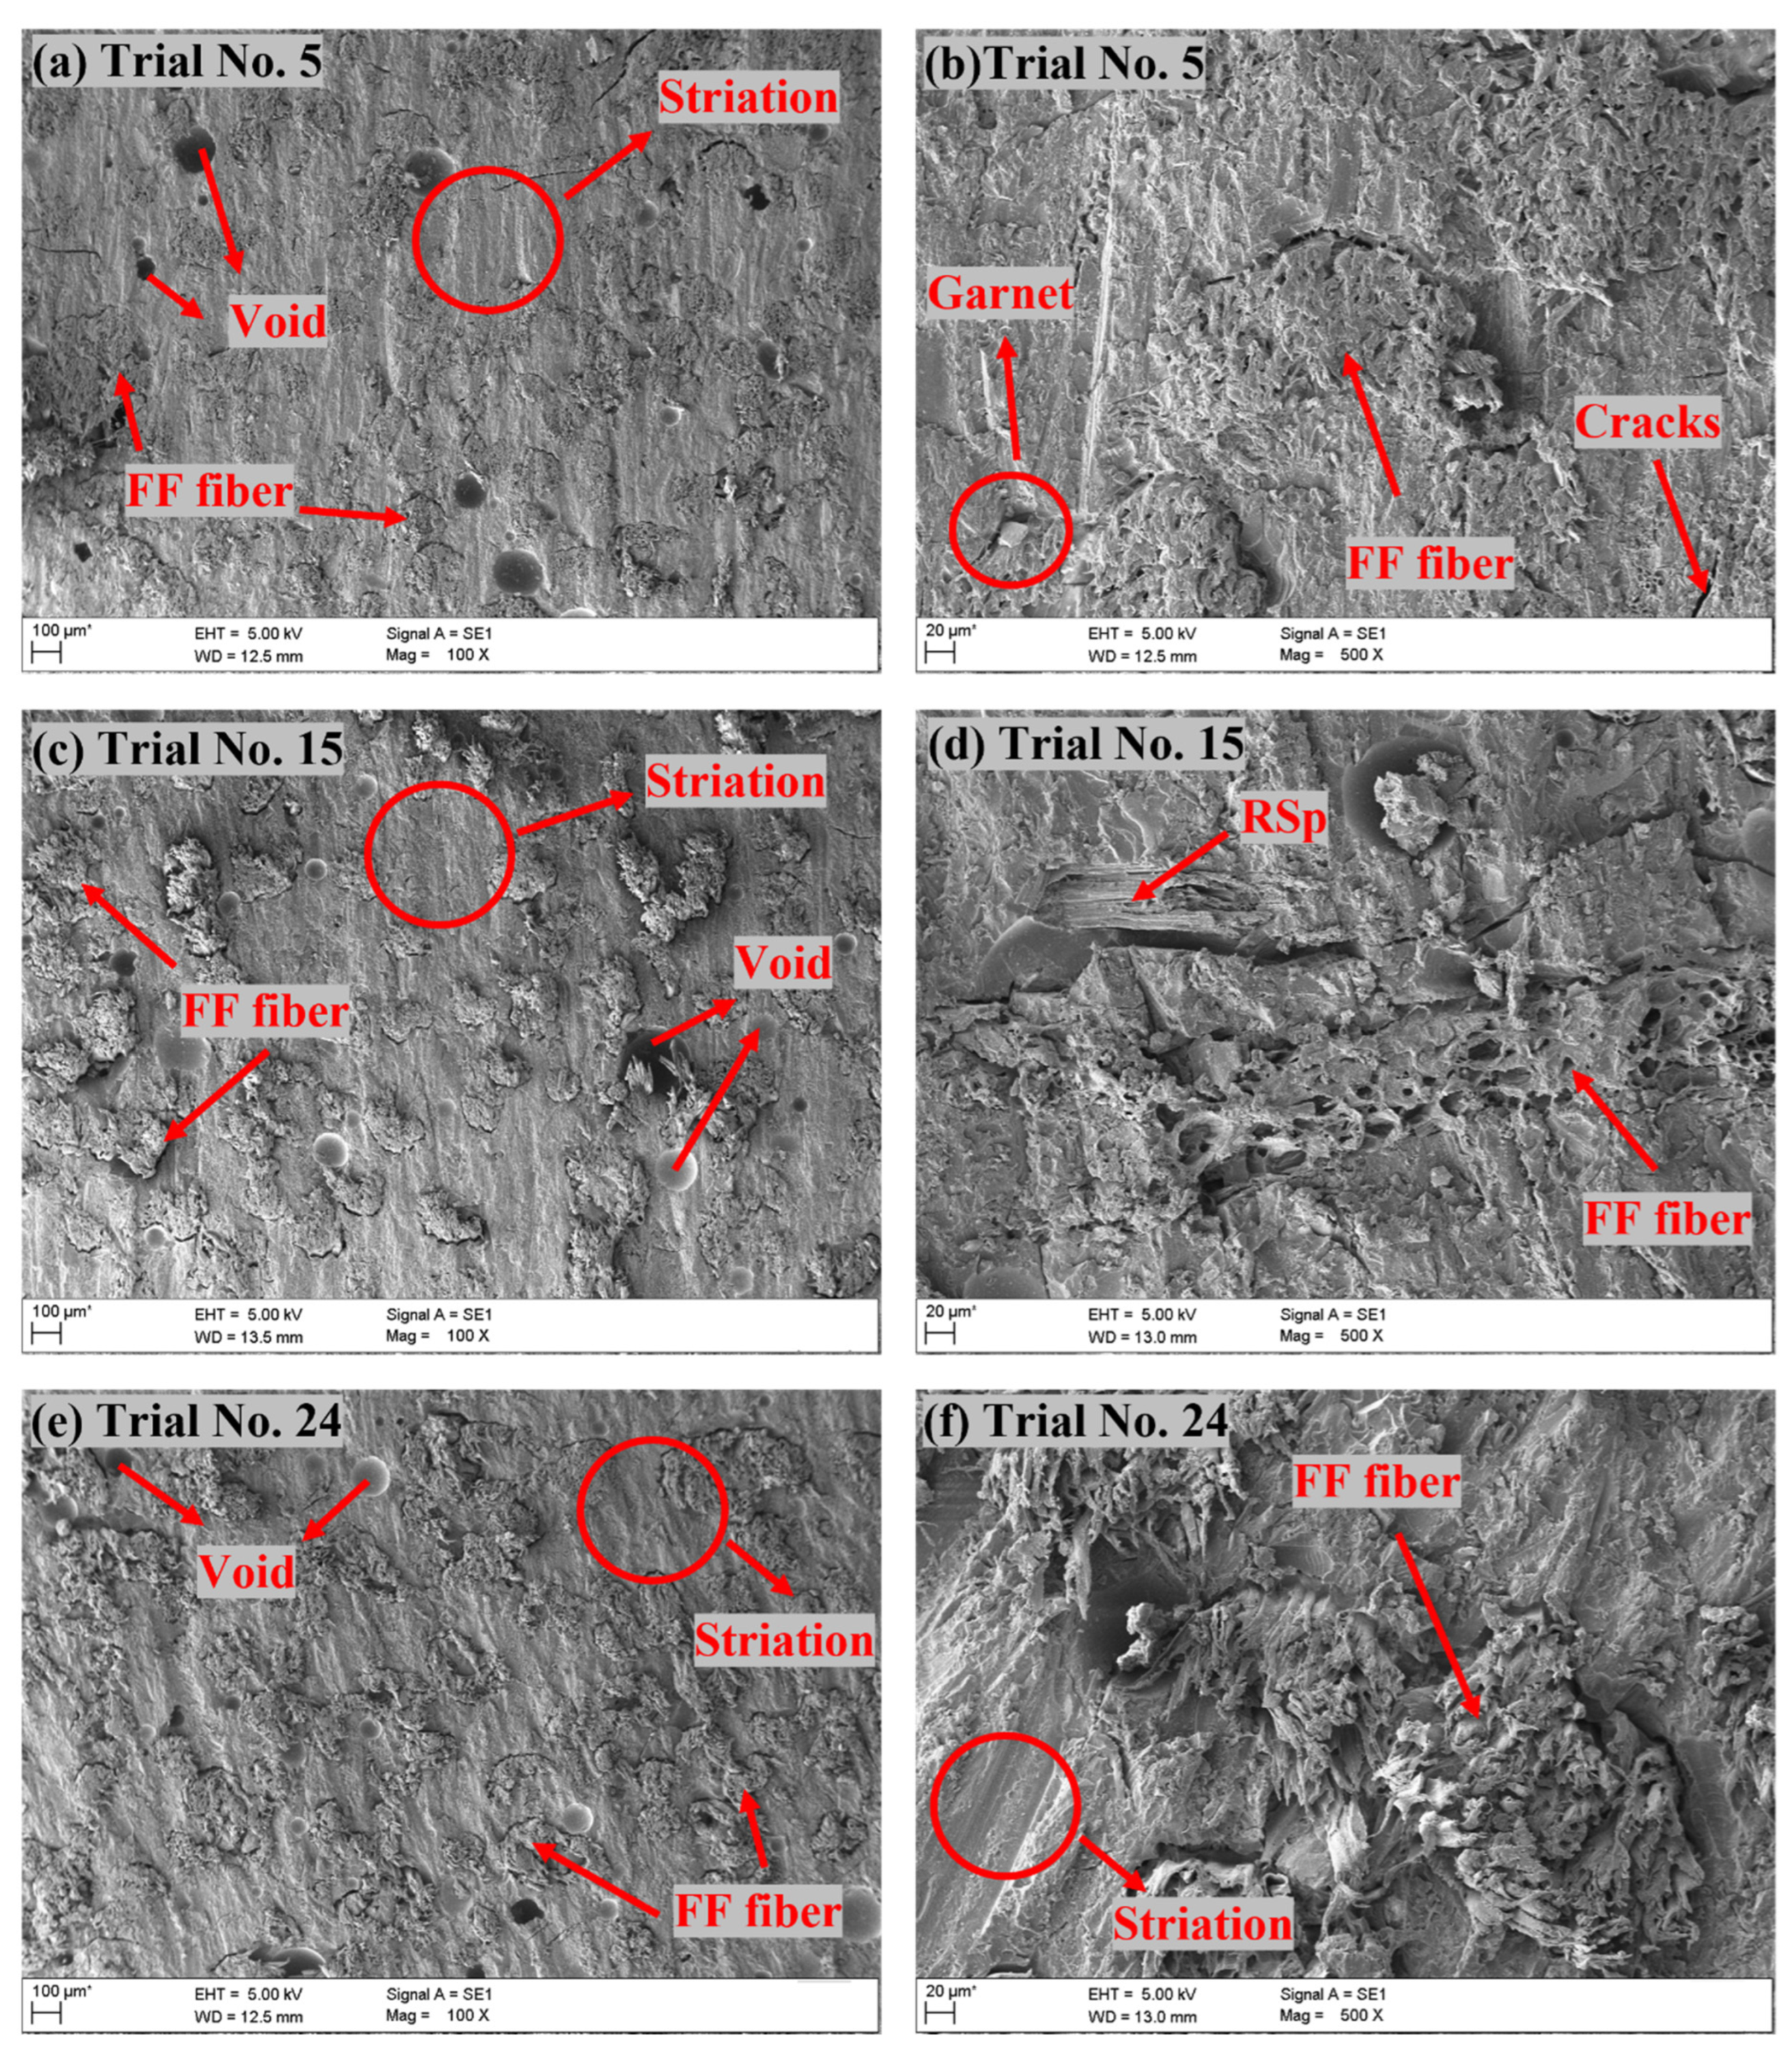
  • In the study, the optimum parameters that induced the best machining quality during the AWJ machining of the hybrid RS/FF composite were identified as follows: fiber: 5 Wt.%, SOD: 1 mm and TS: 100 mm/min. The SEM images of the machined surfaces showed irregularly arranged and partially cuts the fibers. The surfaces also showed that microcracks developed due to the high impact of the abrasive particles. Moreover, the slight debonding of the fibers from the matrix phase was seen; however, no fiber pullout was observed.

Author Contributions

Conceptualization, A.S.M., D.D., R.S. and N.N.; Data curation, A.S.M., D.D. and R.S.; Formal analysis, A.S.M., R.S., N.N. and P.R.G.; Investigation, A.S.M. and R.S.; Methodology, A.S.M., R.S. and N.N.; Resources, N.N. and P.R.G.; Supervision, D.D. and R.S.; Validation, D.D., R.S. and P.R.G.; Visualization, A.S.M. and R.S.; Writing—original draft, A.S.M.; Writing—review and editing, A.S.M., D.D., R.S., N.N. and P.R.G. All authors have read and agreed to the published version of the manuscript.

Funding

This research received no external funding.

Institutional Review Board Statement

Not applicable.

Informed Consent Statement

Not applicable.

Data Availability Statement

No data are available.

Conflicts of Interest

The authors declare no conflict of interest.

References

  1. Stevens, C.V. Industrial Applications of Natural Fibres: Structure, Properties and Technical Applications; John Wiley & Sons Ltd.: New York, NY, USA, 2010; ISBN 978-0-470-69508-1. [Google Scholar]
  2. Atiqah, A.; Jawaid, M.; Ishak, M.R.; Sapuan, S.M. Effect of alkali and silane treatments on mechanical and interfacial bonding strength of sugar palm fibers with thermoplastic polyurethane. J. Nat. Fib. 2018, 15, 251–261. [Google Scholar] [CrossRef]
  3. Khalid, M.Y.; Arif, Z.U.; Sheikh, M.F.; Nasir, M.A. Mechanical characterization of glass and jute fiber-based hybrid composites fabricated through compression molding technique. Int. J. Mater. Form. 2021, 14, 1085–1095. [Google Scholar] [CrossRef]
  4. Arpitha, G.R.; Yogesha, B. Science direct an overview on mechanical property evaluation of natural fiber reinforced polymers. Mater. Today Proc. 2017, 4, 2755–2760. [Google Scholar] [CrossRef]
  5. Das, O.; Babu, K.; Shanmugam, V.; Sykam, K.; Tebyetekerwa, M.; Neisiany, R.E.; Forsth, M.; Sas, G.; Gonzalez-Libreros, J.; Capezza, A.J.; et al. Natural and industrial wastes for sustainable and renewable polymer composites. Renew. Sustain. Energy Rev. 2022, 158, 112054. [Google Scholar] [CrossRef]
  6. Solomon, D.G. Application of Natural Fibers in Environmental Friendly Products. Int. J. Environ. Sci. Nat. Resour. 2020, 25, 147–153. [Google Scholar] [CrossRef]
  7. Shetty, R.; Hegde, A. Taguchi based fuzzy logic model for optimisation and prediction of surface roughness during AWJM of DRCUFP composites. Manuf. Rev. 2022, 9, 15. [Google Scholar] [CrossRef]
  8. Masoud, F.; Sapuan, S.M.; Ariffin, M.K.A.M.; Nukman, Y.; Bayraktar, E. Experimental analysis of kerf taper angle in cutting process of sugar palm fiber reinforced unsaturated polyester composites with laser beam and abrasive water jet cutting technologies. Polymers 2021, 13, 2543. [Google Scholar] [CrossRef]
  9. Kalirasu, S.; Rajini, N.; Jappes, J.T.W.; Uthayakumar, M.; Rajesh, S. Mechanical and machining performance of glass and coconut sheath fibre polyester composites using AWJM. J. Reinf. Plast. Compos. 2015, 34, 564–580. [Google Scholar] [CrossRef]
  10. Jignesh, K.P.; Shaikh, A.A. Parameters on Banana Fiber Reinforced. Int. J. Eng. Res. Tech. 2014, 3, 608–613. [Google Scholar]
  11. Azmir, M.A.; Ahsan, A.K. Investigation on glass/epoxy composite surfaces machined by abrasive water jet machining. J. Mater. Process. Technol. 2008, 198, 122–128. [Google Scholar] [CrossRef]
  12. Kalirasu, S.; Rajini, N.; Bharath, S.N.; Mahesh, K.D.; Gomathi, S.A. Studies of abrasive water jet machining (AWJM) parameters on banana/polyester composites using robust design concept. Appl. Mech. Mater. 2015, 787, 573–577. [Google Scholar] [CrossRef]
  13. Kumar, P.; Kant, R. Experimental study of abrasive water jet machining of Kevlar epoxy composite. J. Manuf. Eng. 2019, 14, 026–032. [Google Scholar] [CrossRef]
  14. Jani, S.P.; Senthil, K.A.; Adam, K.M.; Uthayakumar, M. Surface roughness and morphology studies on machining hybrid composite material using abrasive water jet cutting process. In Surface Engineering of Modern Materials; Springer: New York, NY, USA, 2020; pp. 125–148. [Google Scholar]
  15. Szatkiewicz, T.; Perec, A.; Radomska-Zalas, A.; Banaszek, K.; Balasz, B. Preliminary Studies into Cutting of a Novel Two Component 3D-Printed Stainless Steel–Polymer Composite Material by Abrasive Water Jet. Materials 2023, 16, 1170. [Google Scholar] [CrossRef] [PubMed]
  16. Perec, A.; Radomska-Zalas, A.; Fajdek-Bieda, A. Experimental research into marble cutting by abrasive water jet. Facta Univ. Ser. Mech. Eng. 2022, 20, 145–156. [Google Scholar] [CrossRef]
  17. Perec, A.; Radomska-Zalas, A.; Fajdek-Bieda, A.; Kawecka, E. Efficiency of Tool Steel Cutting by Water Jet with Recycled Abrasive Materials. Materials 2022, 15, 3978. [Google Scholar] [CrossRef] [PubMed]
  18. Perec, A. Multiple Response Optimization of Abrasive Water Jet Cutting Process using Response Surface Methodology (RSM). Procedia Comput. Sci. 2021, 192, 931–940. [Google Scholar] [CrossRef]
  19. Abdullah, A.B.; Sapuan, S.M. Hole-Making and Drilling Technology for Composites, 1st ed.; Woodhead: Duxford, UK, 2019; pp. 1–100. [Google Scholar]
  20. Ramesha, K.; Santhosh, N.; Kiran, K.; Manjunath, N.; Naresh, H. Effect of the Process Parameters on Machining of GFRP Composites for Different Conditions of Abrasive Water Suspension Jet Machining. Arab. J. Sci. Eng. 2019, 44, 7933–7943. [Google Scholar] [CrossRef]
  21. Momber, A.W.; Kovacevic, R. Principles of Abrasive Water Jet Machining, 1st ed.; Springer: London, UK, 1988; pp. 201–230. [Google Scholar]
  22. Abhishek, S.M.; Doreswamy, D.; Maddasani, S.; Shettar, M.; Shetty, R. Processing, Characterization of Furcraea foetida (FF) Fiber and Investigation of Physical/Mechanical Properties of FF/Epoxy Composite. Polymers 2020, 14, 14–1476. [Google Scholar]
  23. Musio, S.; Mussig, J.; Amaducci, S. Optimizing Hemp Fiber Production for High Performance Composite Applications. Front. Plant Sci. 2018, 9, 1702. [Google Scholar] [CrossRef]
  24. Shetty, R.; Kumar, S.; Mallagi, R.; Keni, L. L 1 6 Orthogonal Array-Based Three-Dimensional Finite Element Modeling for Cutting Force and Chip Formation Analysis During Dry Machining of Ti–6Al–4V. J. Adv. Manuf. Syst. 2021, 20, 123–134. [Google Scholar] [CrossRef]
  25. Hegde, A.L.; Shetty, R.; Chiniwar, D.S.; Naik, N.; Nayak, M. Optimization and Prediction of Mechanical Characteristics on Vacuum Sintered Ti-6Al-4V-SiCp Composites Using Taguchi’s Design of Experiments, Response Surface Methodology and Random Forest Regression. J. Compos. Sci. 2022, 6, 339. [Google Scholar] [CrossRef]
  26. Shetty, R.; Gurupur, P.R.; Hindi, J.; Hegde, A.; Naik, N.; Ali, M.S.S.; Patil, I.S.; Nayak, M. Processing, Mechanical Characterization, and Electric Discharge Machining of Stir cast and Spray Forming-Based Al-Si Alloy Reinforced with ZrO2 Particulate Composites. J. Compos. Sci. 2022, 6, 323. [Google Scholar] [CrossRef]
  27. Zaghloul, M.M.Y.; Mai, M.Y.Z. Developments in polyester composite materials-An in-depth review on natural fibers and nano fillers. Compos. Struct. 2021, 278, 114698. [Google Scholar] [CrossRef]
  28. Shetty, R.; Barboza, A.B.; Keni, L.G. Empirical study on stress distribution zone during machining of dracs using finite element analysis, Taguchi’s design of experiments and response surface. ARPN J. Eng. Appl. Sci. 2020, 14, 2576–2582. [Google Scholar]
  29. Shetty, R.; Kumar, C.R.; Ravindra, M.R. RSM based expert system development for cutting force prediction during machining of Ti–6Al–4V under minimum quantity lubrication. Int. J. Syst. Assu. Eng. Manag. 2021, 20, 1–8. [Google Scholar] [CrossRef]
  30. Shetty, R.; Pai, R.; Barboza, A.B.; Shetty, Y. Statistical and surface metallurgical study during electric discharge machining of Ti-6Al-4V. J. Eng. App. Sci. 2018, 13, 3594–3600. [Google Scholar]
  31. Jani, S.P.; Kumar, A.S.; Khan, M.A.; Kumar, M.U. Machinability of hybrid natural fiber composite with and without filler as reinforcement. Mater. Manuf. Process. 2016, 31, 1393–1399. [Google Scholar] [CrossRef]
  32. Dhakal, H.N.; Ismail, S.O.; Ojo, S.O.; Paggi, M.; Smith, J.R. Abrasive water jet drilling of advanced sustainable bio-fibre-reinforced polymer/hybrid composites: A comprehensive analysis of machining-induced damage responses. Int. J. Adv. Manuf. Technol. 2018, 99, 2833–2847. [Google Scholar] [CrossRef]
  33. Gupta, K.; Rajakumaran, M. Evaluation of machining performance of pineapple filler based reinforced polymer composites using abrasive water jet machining process. In Proceedings of the Conference of the South African Advanced Materials Initiative (CoSAAMI-2018), Vanderbijlpark, South Africa, 23–26 October 2018; pp. 23–26. [Google Scholar]
  34. Shanmugam, D.K.; Masood, S.H. An investigation on kerf characteristics in abrasive waterjet cutting of layered composites. J. Mater. Process. Technol. 2009, 209, 3887–3893. [Google Scholar] [CrossRef]
  35. Doreswamy, D.; Shivamurthy, B.; Anjaiah, D.; Sharma, N.Y. Kerf taper and delamination damage minimization of FRP hybrid composites under abrasive water-jet machining. Int. J. Manuf. Eng. 2015, 15, 1727–1744. [Google Scholar]
  36. Alberdi, A.; Suarez, A.; Artaza, T.; Escobar-Palafox, G.A.; Ridgway, K. Composite cutting with abrasive water jet. Procedia Eng. 2013, 63, 421–429. [Google Scholar] [CrossRef]
  37. Prabu, V.A.; Kumaran, S.T.; Uthayakumar, M. Performance Evaluation of Abrasive Water Jet Machining on Banana Fiber Reinforced Polyester Composite. J. Nat. Fibers 2017, 14, 450–457. [Google Scholar] [CrossRef]
  38. Ergene, B.; Bolat, C. A review on the recent investigation trends in abrasive waterjet cutting and turning of hybrid composites. Sigma J. Eng. Nat. Sci. 2019, 37, 989–1016. [Google Scholar]
Figure 1. Distribution of RSp in the test samples: (a) R05F20; (b) R10F20; (c) R15F20.
Jcs 07 00189 g001
Figure 2. Abrasive water jet machine.
Jcs 07 00189 g002
Figure 3. AWJ-machined hybrid RSp/FF test samples.
Jcs 07 00189 g003
Figure 4. Measurement of surface roughness in the machined slots.
Jcs 07 00189 g004
Figure 5. Main effect plot for S/N ratio of surface roughness.
Jcs 07 00189 g005
Figure 6. Optical image of machined surface of R05F20 test sample (Trial No. 1).
Jcs 07 00189 g006
Figure 7. Normal probability plot of residuals for surface roughness.
Jcs 07 00189 g007
Figure 8. Contour plot for SR.
Jcs 07 00189 g008
Figure 9. Surface plot for SR.
Jcs 07 00189 g009
Figure 10. Main effect plot for S/N ratio of MRR.
Jcs 07 00189 g010
Figure 11. Normal probability plot of residuals for MRR.
Jcs 07 00189 g011
Figure 12. Contour plot for MRR.
Jcs 07 00189 g012
Figure 13. Surface plot for MRR.
Jcs 07 00189 g013
Figure 14. Main effect plot for S/N ratio of top kerf width.
Jcs 07 00189 g014
Figure 15. Normal probability plot of residuals for TKW.
Jcs 07 00189 g015
Figure 16. Contour plot for TKW.
Jcs 07 00189 g016
Figure 17. Surface plot for TKW.
Jcs 07 00189 g017
Figure 18. Main effect plot for S/N ratio of bottom kerf width.
Jcs 07 00189 g018
Figure 19. Normal probability plot of residuals for BKW.
Jcs 07 00189 g019
Figure 20. Contour plot for BKW.
Jcs 07 00189 g020
Figure 21. Surface plot for BKW.
Jcs 07 00189 g021
Figure 22. Main effect plot for S/N ratio of kerf taper.
Jcs 07 00189 g022
Figure 23. Contribution of process parameters to the response parameters.
Jcs 07 00189 g023
Figure 24. Microscopic images of the machined surfaces of hybrid RSp/FF composites (a,b) R05F20; (c,d) R10F20 and (e,f) R15F20.
Jcs 07 00189 g024
Table 1. Details of fiber concentration in test samples.
Sl. No.Sample CodeRSp (Wt.%)FF (Wt.%)Epoxy (Wt.%)
1R05F2052075
2R10F20102070
3R10F20152065
Table 2. Process parameters and levels during AWJM.
CodeControl ParametersLevel 1Level 2Level 3
FiberRS Particle (Wt. %)51015
SODStandoff Distance (mm)123
TSTraverse Speed (mm/min)100200300
Table 3. Process parameters and levels for AWJM (RSM).
Control FactorsLevels
−10+1
Fiber (Wt.%)51015
Standoff distance (mm)123
Traverse speed (mm/min)100200300
Table 4. L20 Central Composite Design.
Trial No.BlocksFiber (Wt.%)SOD (mm)TS (mm/min)
11−1−1−1
21+1−1−1
31−1+1−1
41+1+1−1
51−1−1+1
61+1−1+1
71−1+1+1
81+1+1+1
91000
101000
111000
121000
132−100
142+100
1520−10
1620+10
17200−1
18200+1
192000
202000
Table 5. Specifications of AWJ machine.
Sl. No ParticularsCapacity
1Pump Capacity5 HP (3.73 kW)
2Mixing Tube57.15 mm long/±0.762 mm Dia.
3Linear Positional Accuracy±0.127 mm
4AbrasiveGarnet (#80 mesh)
5Water Jet Pressure206.8 MPa
6Abrasive Flow Rate113 g/min
7Dia. of Orifice 0.2 mm
8High-Pressure Water Flow Rate2.84 dm3/min
Table 6. Experimental details and response parameters.
Trial No.Fiber (Wt.%)SOD (mm)TS (mm/min)SR (µm)MRR (mm3/min)TKW (mm)BKW (mm)KT (deg)
1511004.79267.720.650.730.63
2512004.39587.040.720.790.54
3513004.27914.320.740.810.52
4521004.12245.020.590.670.55
5522004.64528.070.650.710.44
6523004.69873.000.730.780.37
7531004.05257.440.600.720.86
8532004.42568.030.690.770.58
9533004.81931.780.740.850.82
101011005.01284.480.610.670.47
111012005.51677.290.710.810.70
121013005.75932.940.670.811.03
131021005.15277.330.640.690.35
141022005.40805.920.850.940.59
151023005.671079.60.790.870.58
161031005.59319.960.690.770.55
171032005.61702.990.770.840.55
181033005.651216.30.840.991.10
191511006.45337.220.610.690.60
201512006.64722.180.620.710.68
211513006.811175.70.720.780.46
221521006.68329.840.550.691.06
231522006.89730.860.630.771.01
241523006.961364.50.750.850.74
251531006.61351.110.630.740.78
261532006.69822.000.720.820.78
271533006.821365.80.800.900.74
Table 7. Details of the measured surface roughness values at different surface locations of the machined slots.
Trial
No.
ProfileLocation of SR (µm)
Measurement
Average
SR (µm)
Trial
No.
ProfileLocation of SR (µm)
Measurement
Average
SR (µm)
Top CenterBottom Top CenterBottom
1Left5.344.904.584.7815Left5.646.025.305.60
Right4.743.895.26Right5.245.785.66
2Left3.64.954.784.3916Left6.367.054.865.65
Right3.383.925.71Right5.696.853.15
3Left4.164.323.304.2717Left5.723.157.846.45
Right4.655.623.59Right5.948.028.08
4Left4.884.824.104.1218Left6.245.045.816.64
Right4.123.643.18Right8.59.424.85
5Left4.895.964.224.6419Left8.464.445.046.81
Right3.345.204.26Right8.47.96.62
6Left4.364.515.794.6920Left7.017.825.306.68
Right4.865.163.48Right5.747.426.84
7Left3.043.544.224.0521Left3.47.324.325.45
Right3.513.027.02Right6.146.944.58
8Left3.784.105.024.4122Left8.247.027.626.96
Right3.885.204.51Right5.647.286.01
9Left5.125.865.084.8123Left6.77.896.406.61
Right4.893.954.01Right8.24.406.12
10Left4.307.385.585.0524Left6.366.355.246.61
Right4.104.704.25Right7.886.567.30
11Left3.126.327.585.5125Left6.696.627.956.89
Right4.955.625.50Right6.86.187.12
12Left5.446.584.185.7526Left7.786.896.966.69
Right8.804.325.19Right6.785.885.89
13Left4.024.485.065.1527Left8.76.055.266.82
Right4.325.987.04Right6.257.527.18
14Left5.055.554.305.40
Right6.945.085.50
Table 8. ANOVA for S/N ratios of surface roughness.
SourceDFSeq SSAdj SSAdj MSFPP (%)
Fiber257.6557.6528.82112.7093.35
SOD20.0510.0510.0250.100.900.08
TS21.3241.3240.6622.590.132.14
Fiber × SOD40.3100.3100.0770.300.860.50
Fiber ×TS 40.0870.0870.0220.090.980.14
SOD ×TS40.2850.2850.0710.280.880.46
Residual Error82.0452.0450.255
Total2661.76
Table 9. ANOVA for SR (µm).
SourceDFSeq SSAdj SSAdj MSFP
Regression913.085313.08531.4539230.410.000
Residual Error90.43030.43030.04781
Total19
Table 10. ANOVA for S/N ratios of MRR.
SourceDFSeq SSAdj SSAdj MSFPP (%)
Fiber233.7533.7516.8767.5605.34
SOD22.102.1031.0514.210.050.33
TS2588.01588.01294.011177.13093.13
Fiber × SOD42.332.330.582.330.140.36
Fiber × TS41.821.820.451.830.210.28
SOD × TS41.321.320.331.330.330.21
Residual Error81.991.990.25
Total26631.35
Table 11. ANOVA for MRR (mm3/min).
SourceDFSeq SSAdj SSAdj MSFP
Regression91,789,6081,789,608198,84583.810.00
Residual Error921,35421,3542373
Total19
Table 12. ANOVA for S/N ratios of top kerf width.
SourceDFSeq SSAdj SSAdj MSFPP (%)
Fiber22.822.821.4111.590.00411.4
SOD21.641.640.826.760.0196.65
TS213.7613.766.8856.42055.5
Fiber ×SOD43.343.340.836.870.01113.51
Fiber × TS41.411.410.352.900.0945.70
SOD × TS40.820.820.251.690.2453.32
Residual Error80.970.970.12 3.93
Total2624.79
Table 13. ANOVA for TKW (mm).
SourceDFSeq SSAdj SSAdj MSFP
Regression90.1544390.1544390.01716010.600.001
Residual Error90.145650.145650.001618
Total19
Table 14. ANOVA for S/N ratios of bottom kerf width.
SourceDF Seq SSAdj SSAdj MSFPP (%)
Fiber22.022.021.017.660.0149.76
SOD22.362.361.188.940.00911.39
TS211.5711.575.7843.72055.70
Fiber × SOD41.951.950.483.700.0549.43
Fiber × TS41.071.070.262.020.1845.15
SOD ×TS40.720.720.181.360.3283.48
Residual Error81.051.050.13 5.10
Total2620.77
Table 15. ANOVA for BKW (mm).
SourceDFSeq SSAdj SSAdj MSFP
Regression90.1535470.1535470.0170618.270.002
Residual Error90.0185630.0185630.002063
Total19
Table 16. Experimental and RSM-predicted values.
Tr. No.SR (µm)MRR (mm3/min)TKW (mm)BKW (mm)
Exp.RSM Exp.RSMExp.RSMExp.RSM
14.784.68267.72311.160.640.590.730.67
24.384.68587.04593.200.720.680.790.77
34.274.59914.32820.440.740.690.810.76
44.124.39245.02279.480.590.590.660.67
54.634.53528.06536.030.650.700.710.80
64.694.58873.00737.770.730.710.780.79
74.044.32257.43216.290.600.550.710.65
84.414.60568.03447.340.690.670.760.78
94.814.79931.78623.590.740.700.850.80
105.015.39284.48402.610.610.690.670.75
115.515.42677.29751.170.710.780.800.86
125.745.37932.941044.90.670.800.810.85
135.155.14277.32395.520.640.710.690.78
145.405.32805.92718.600.850.820.940.90
155.665.411079.6986.870.790.840.860.91
165.595.12319.95356.930.690.680.760.77
175.615.44702.99654.510.760.810.840.91
185.655.671216.3897.290.840.840.980.93
196.456.72337.21341.180.600.550.680.63
206.646.79722.17756.270.620.650.710.75
216.816.781175.71116.50.720.670.780.74
226.686.52329.84358.690.550.580.690.67
236.896.73730.85748.300.630.700.760.81
246.966.871364.41083.10.750.730.850.82
256.616.54351.10344.700.630.580.730.68
266.696.90821.99708.810.720.710.820.83
276.827.171365.71018.10.800.750.900.85
Exp. = experimental.
Table 17. ANOVA for S/N ratios of KT.
SourceDFSeq SSAdj SSAdj MSFPP (%)
Fiber223.41823.41811.709019.570.00112.73
SOD218.90418.9049.451815.800.00210.27
TS21.8431.8430.92161.540.2721
Fiber × SOD454.86654.86613.716522.93029.83
Fiber ×TS464.44964.44916.112326.93035.04
SOD × TS415.64515.6453.91126.540.128.5
Residual Error84.7864.7860.5983 2.6
Total26183.911
Disclaimer/Publisher’s Note: The statements, opinions and data contained in all publications are solely those of the individual author(s) and contributor(s) and not of MDPI and/or the editor(s). MDPI and/or the editor(s) disclaim responsibility for any injury to people or property resulting from any ideas, methods, instructions or products referred to in the content.

