
High-Pressure FDM 3D Printing in Nitrogen [Inert Gas] and Improved Mechanical Performance of Printed Components


Abstract
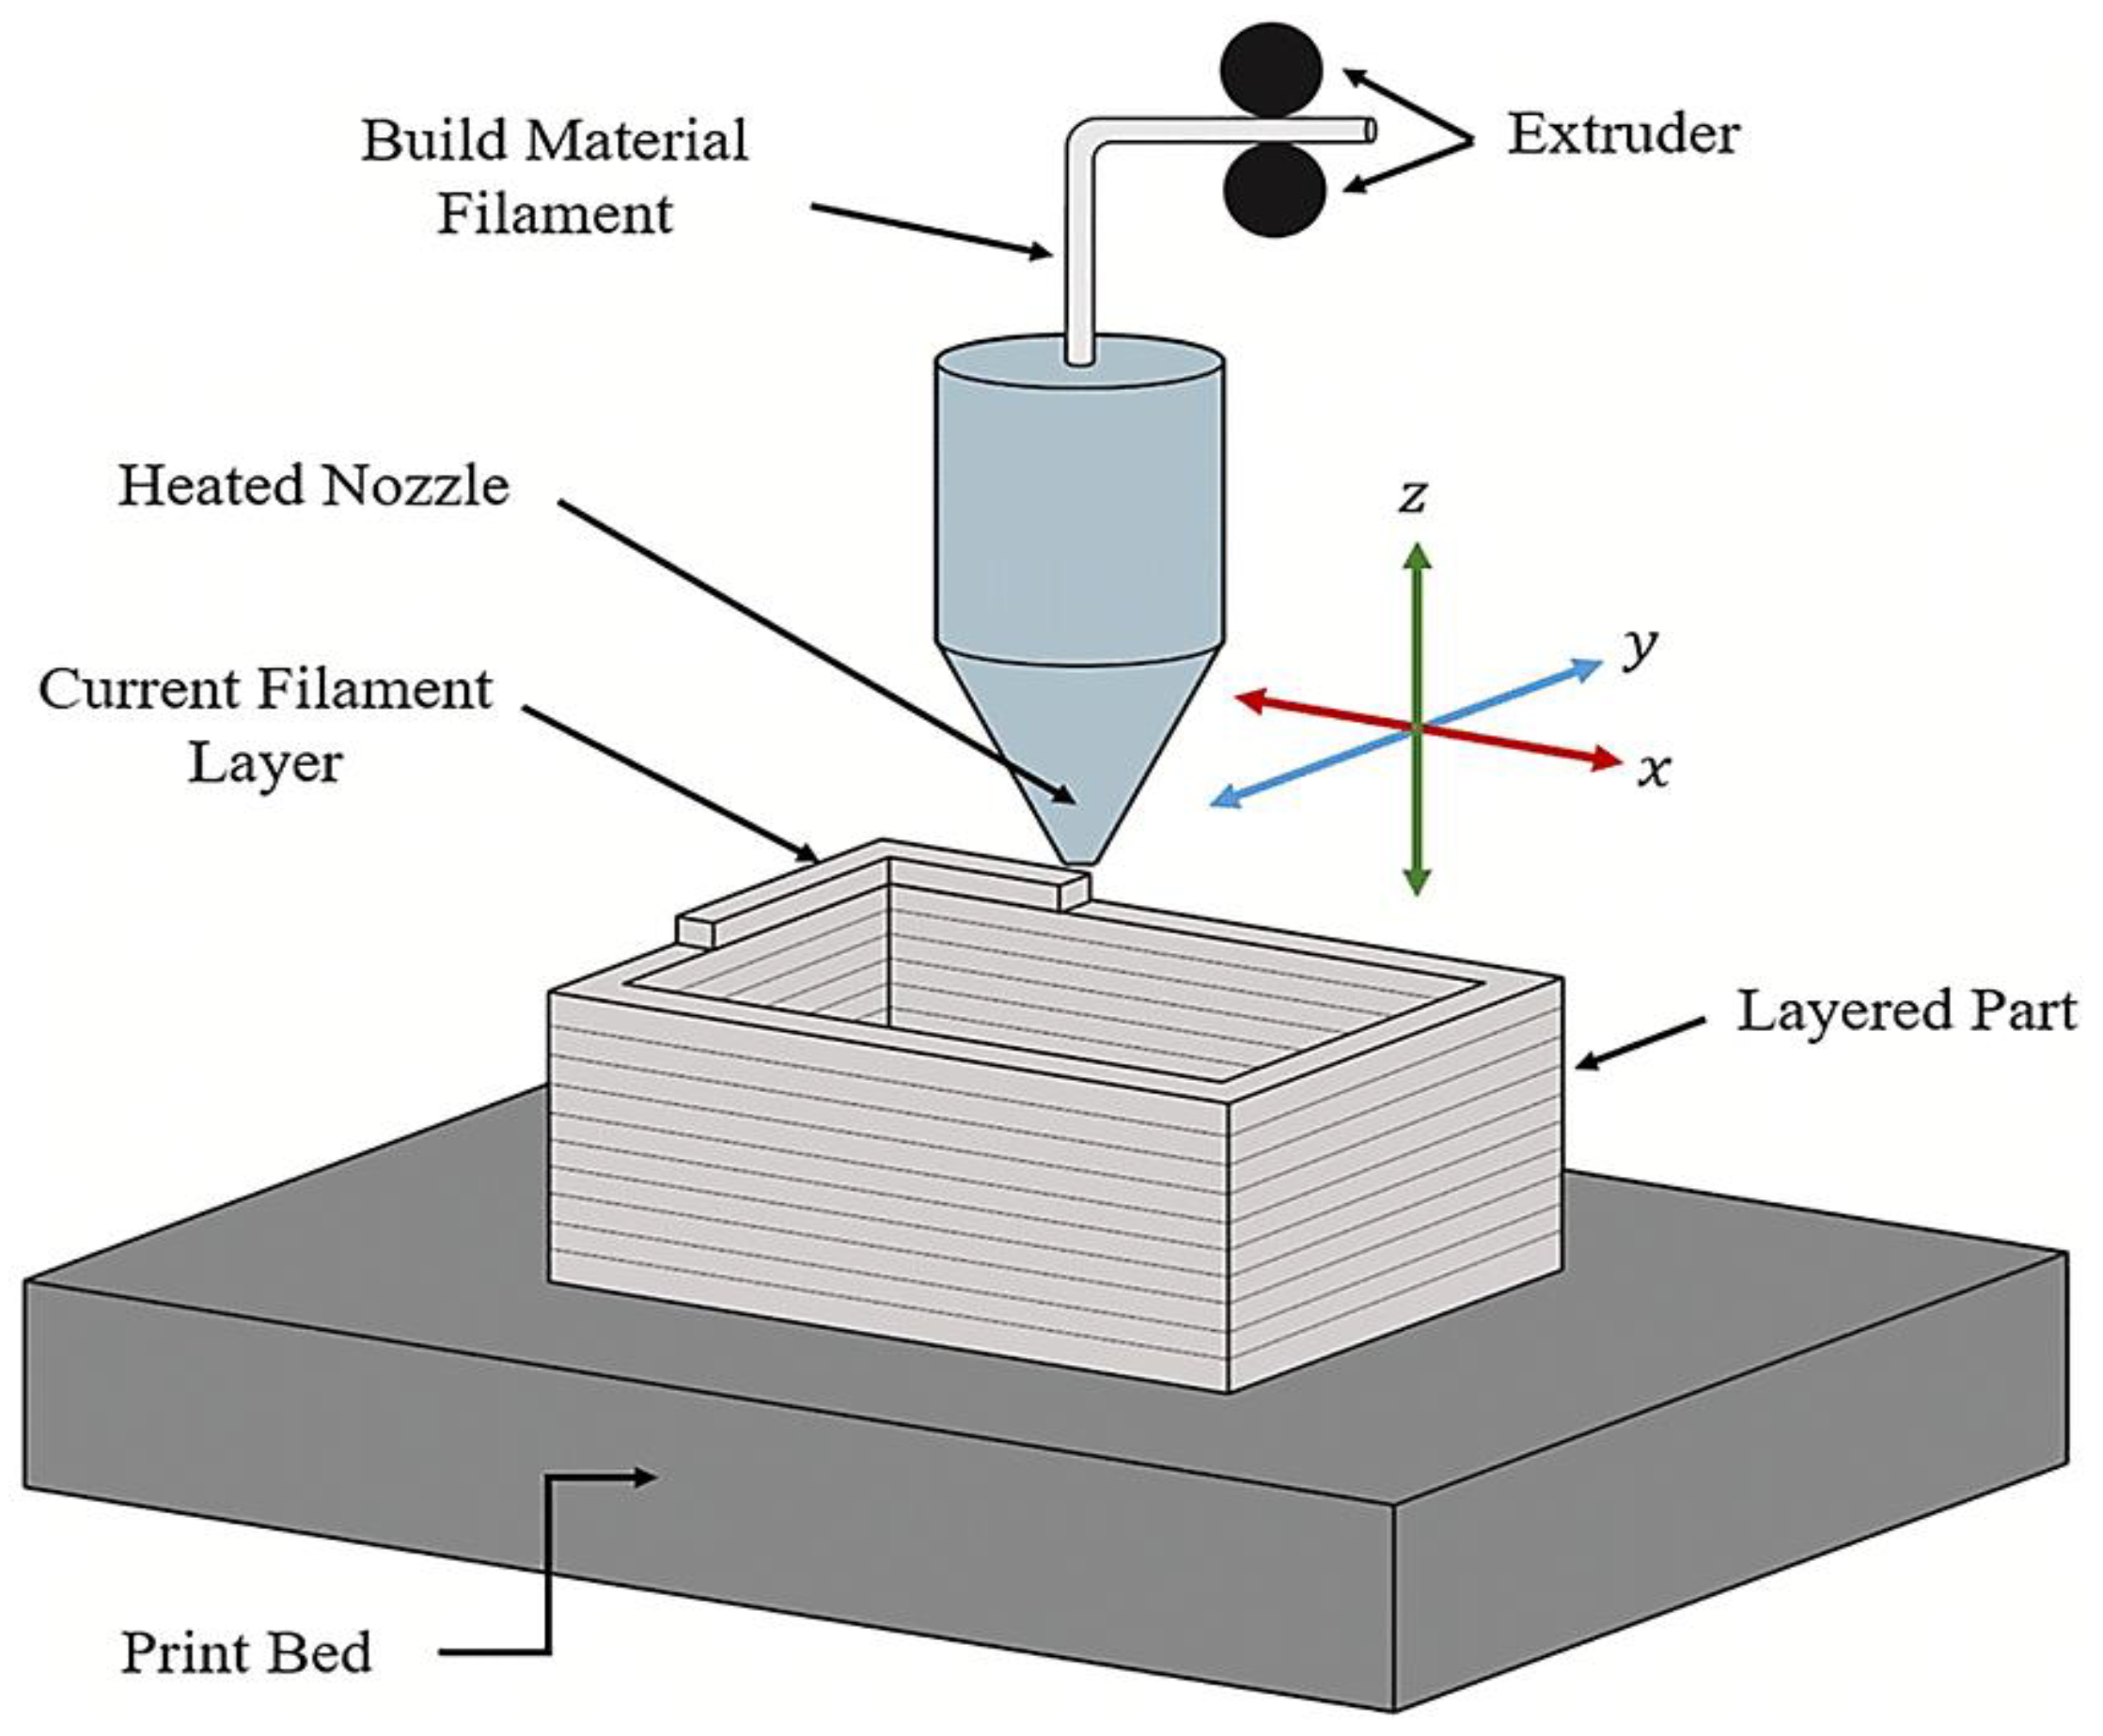
:1. Introduction
2. Materials and Methods
2.1. Material
2.2. Machines
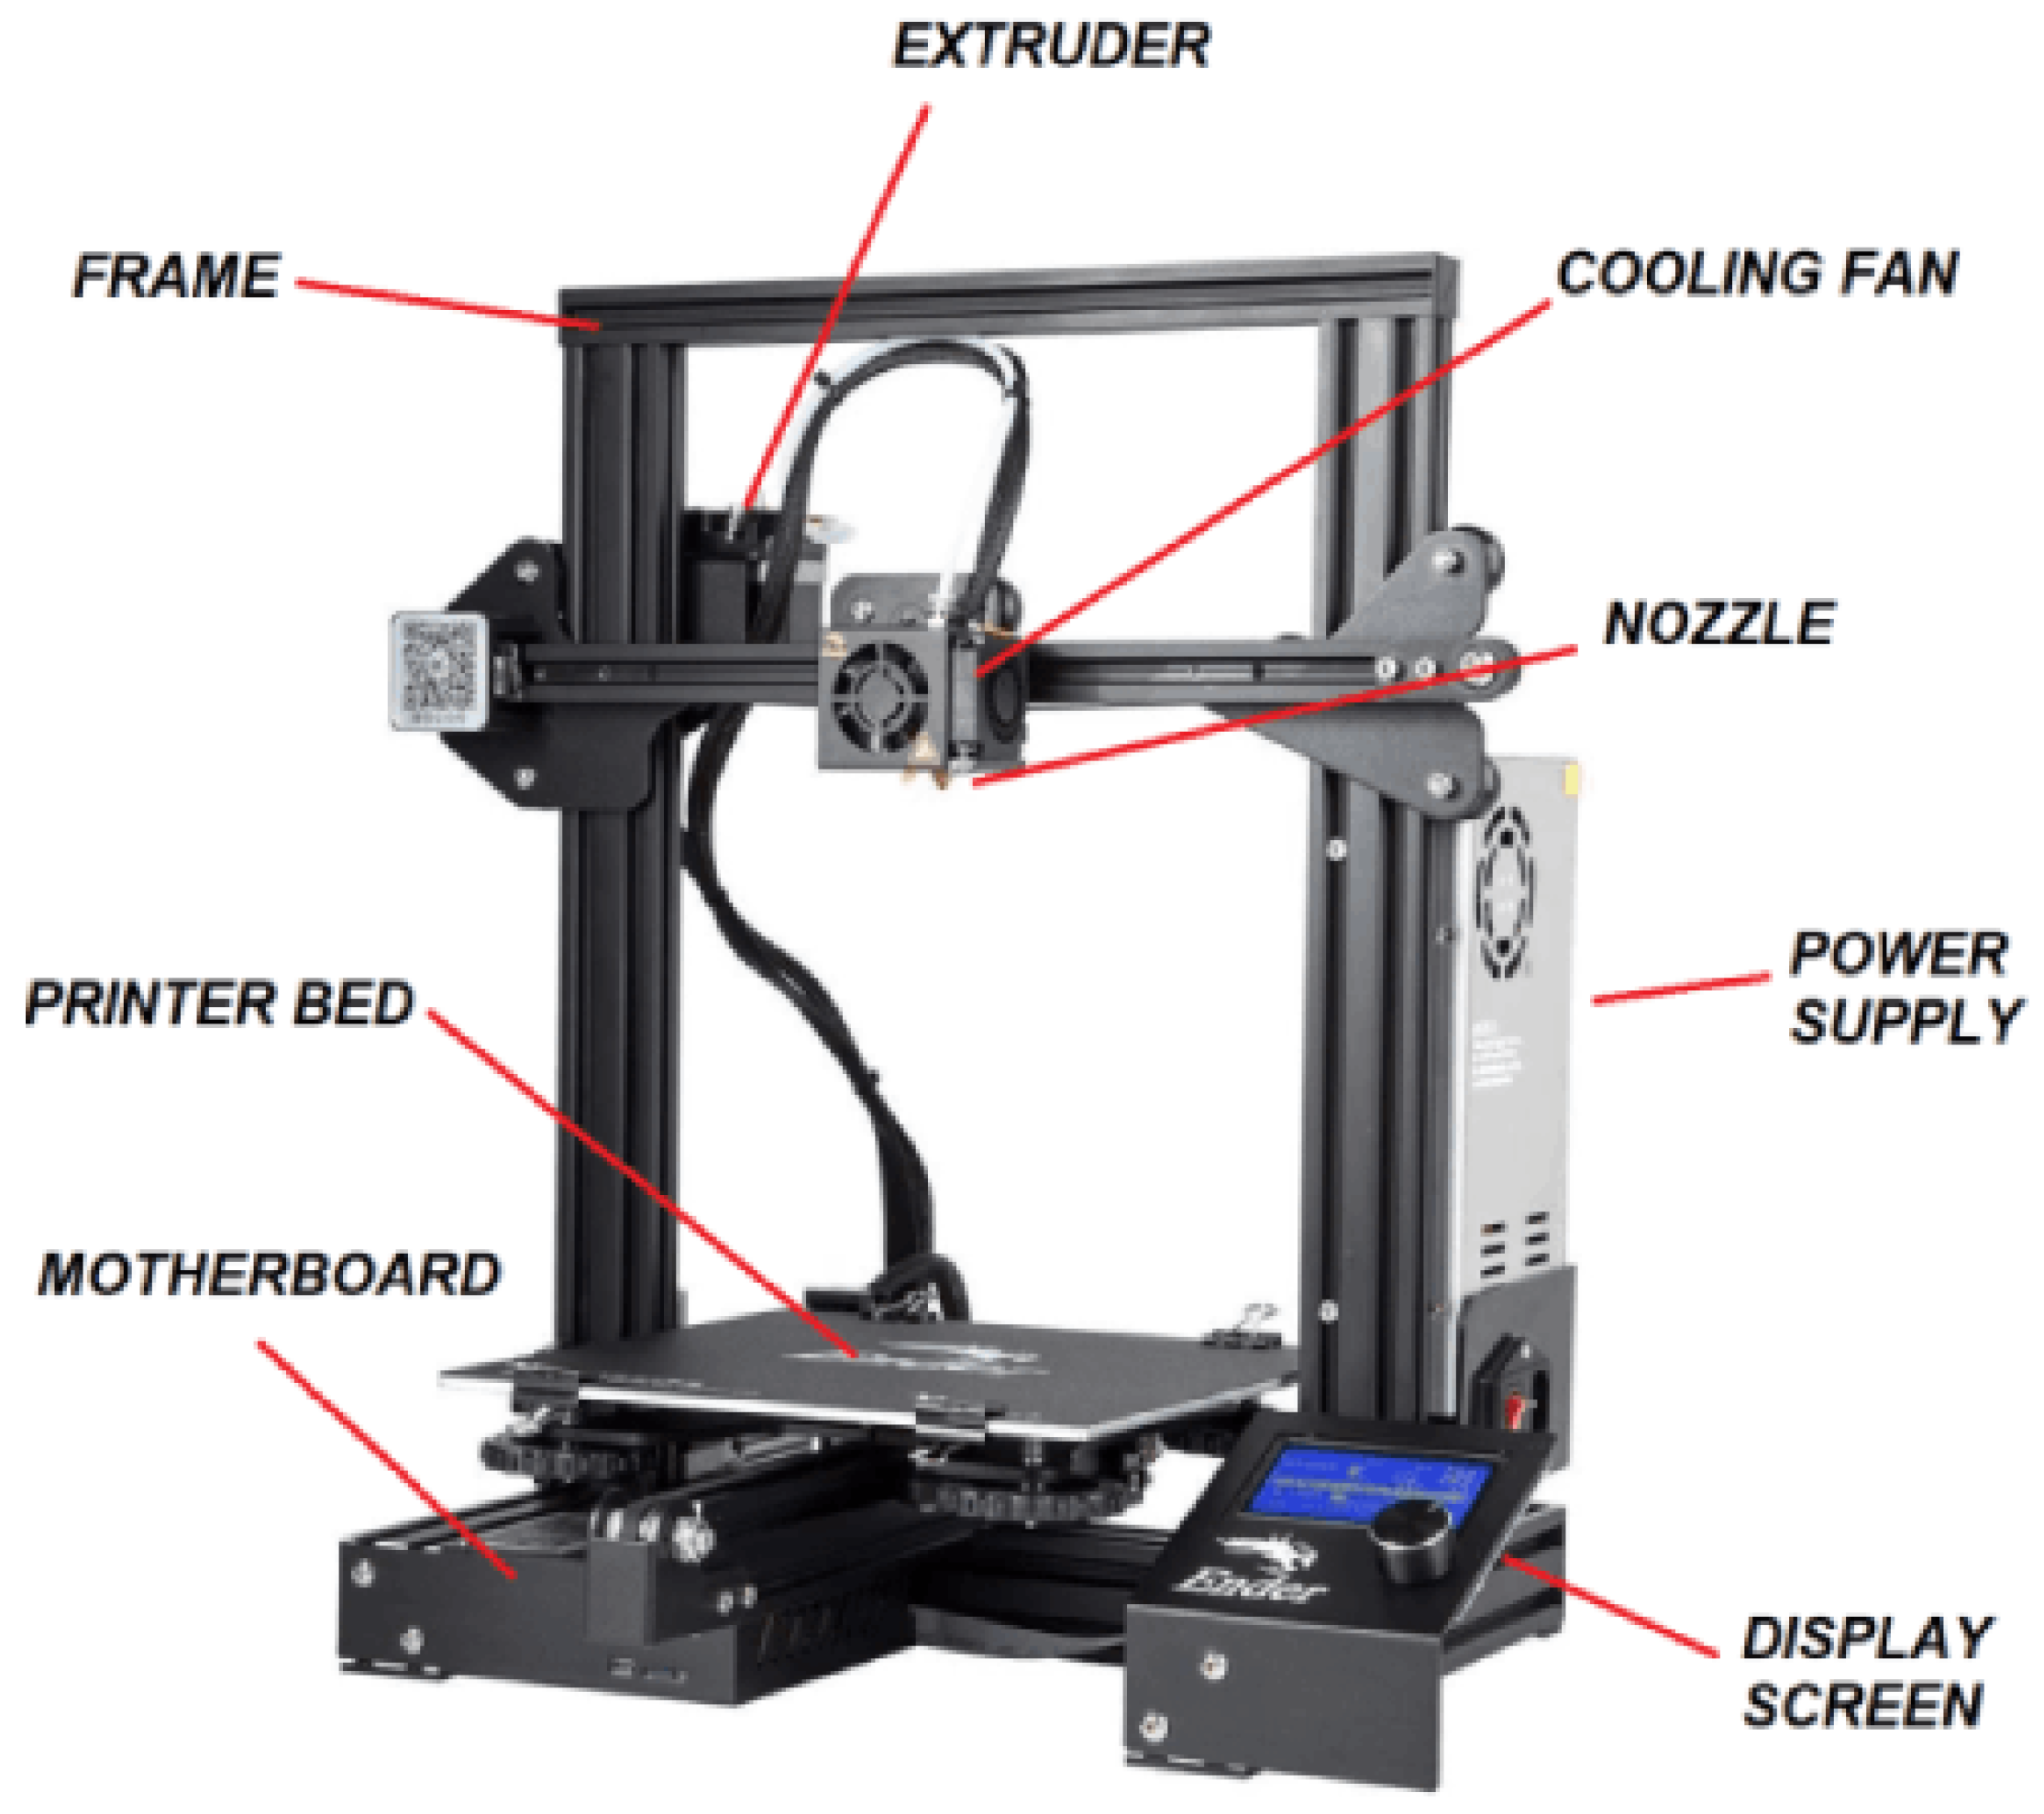
2.2.1. FDM 3D Printer
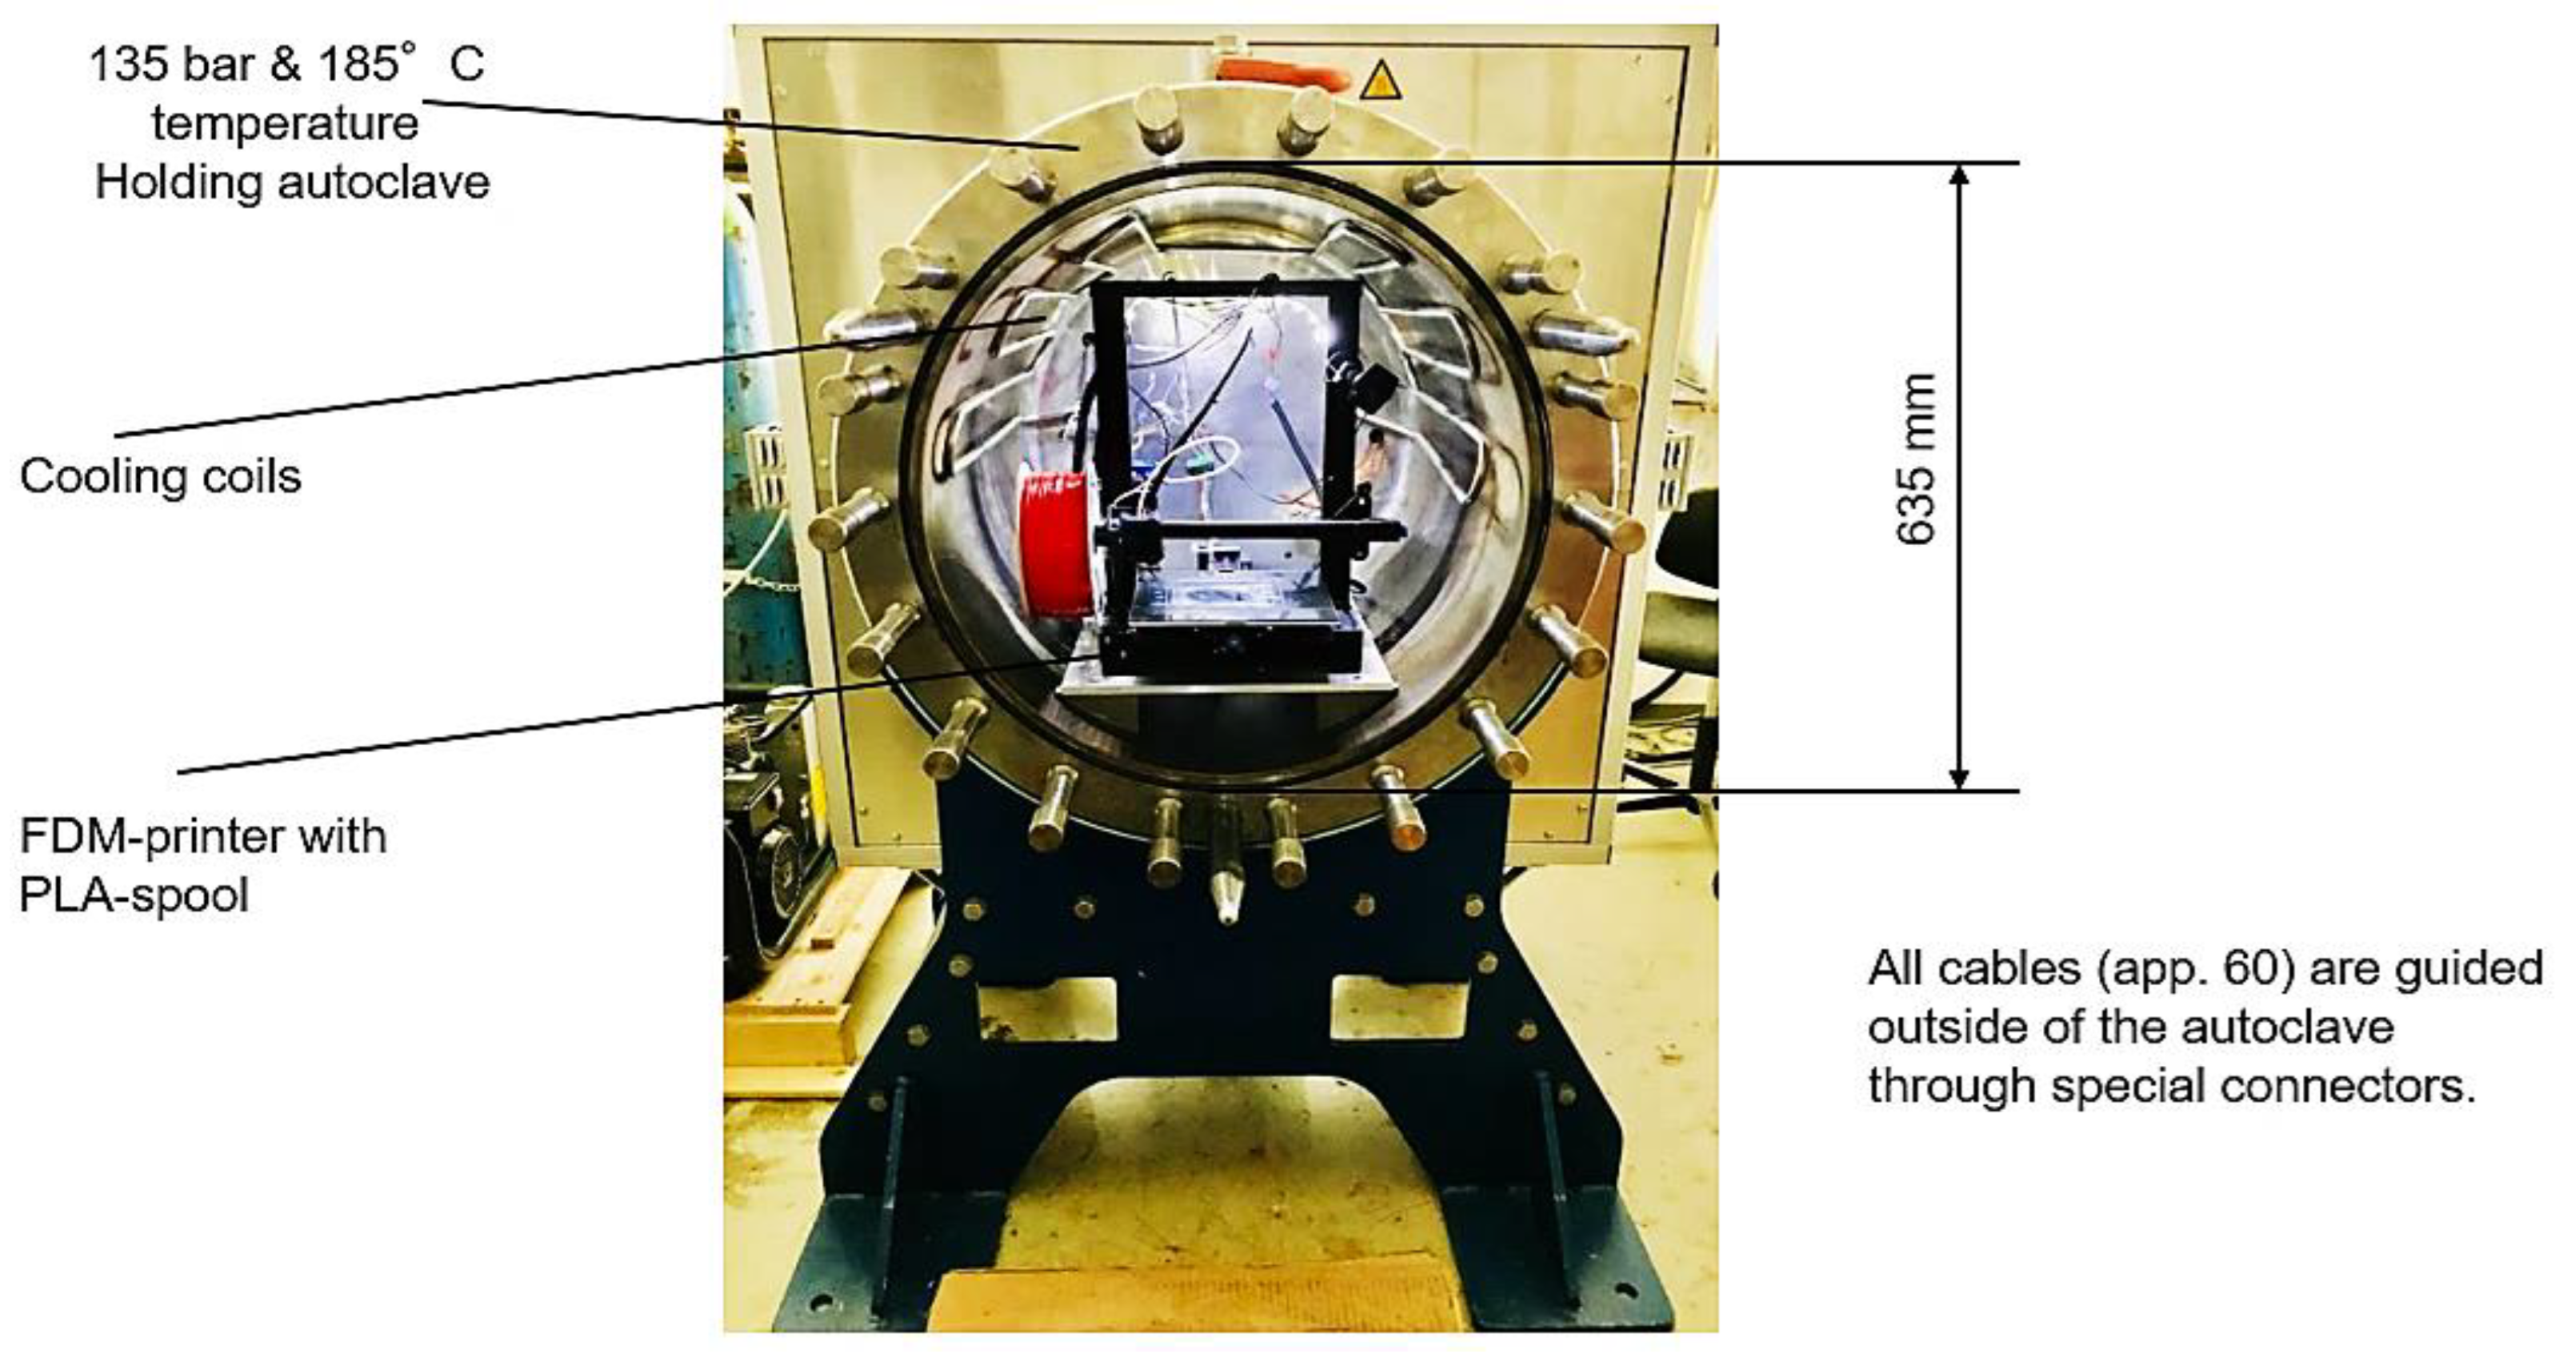
2.2.2. Autoclave
2.3. Fabrication of Specimens
2.3.1. 3D Printing
2.3.2. Injection Molding
2.4. Experimental Setup
2.5. Material Tests
2.5.1. Tensile Test
2.5.2. Flexural Test
2.5.3. Charpy Impact Test
2.5.4. Microscopy Test
3. Results
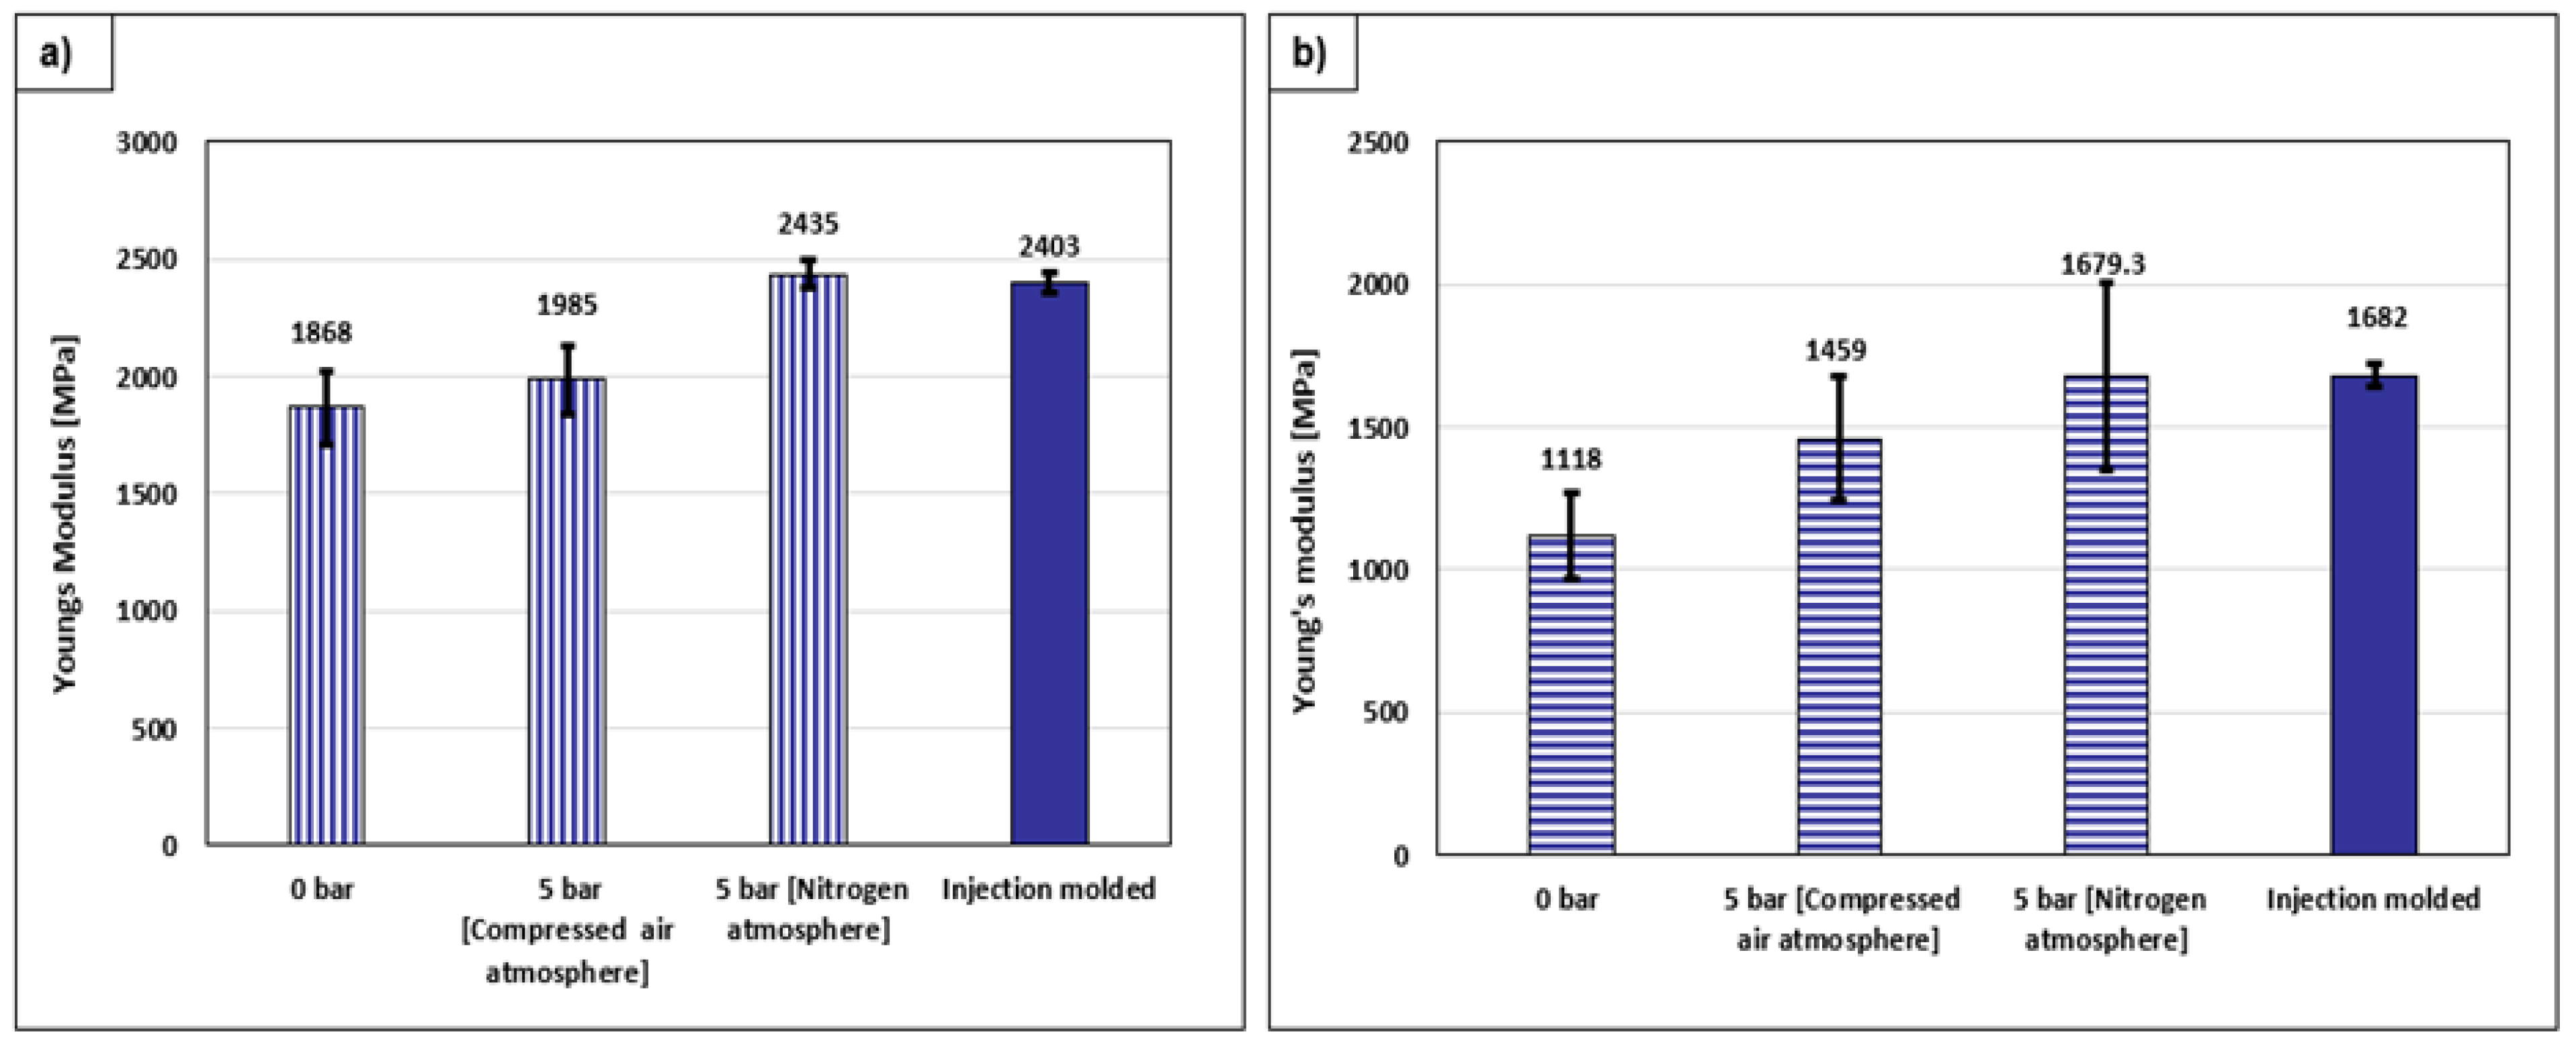
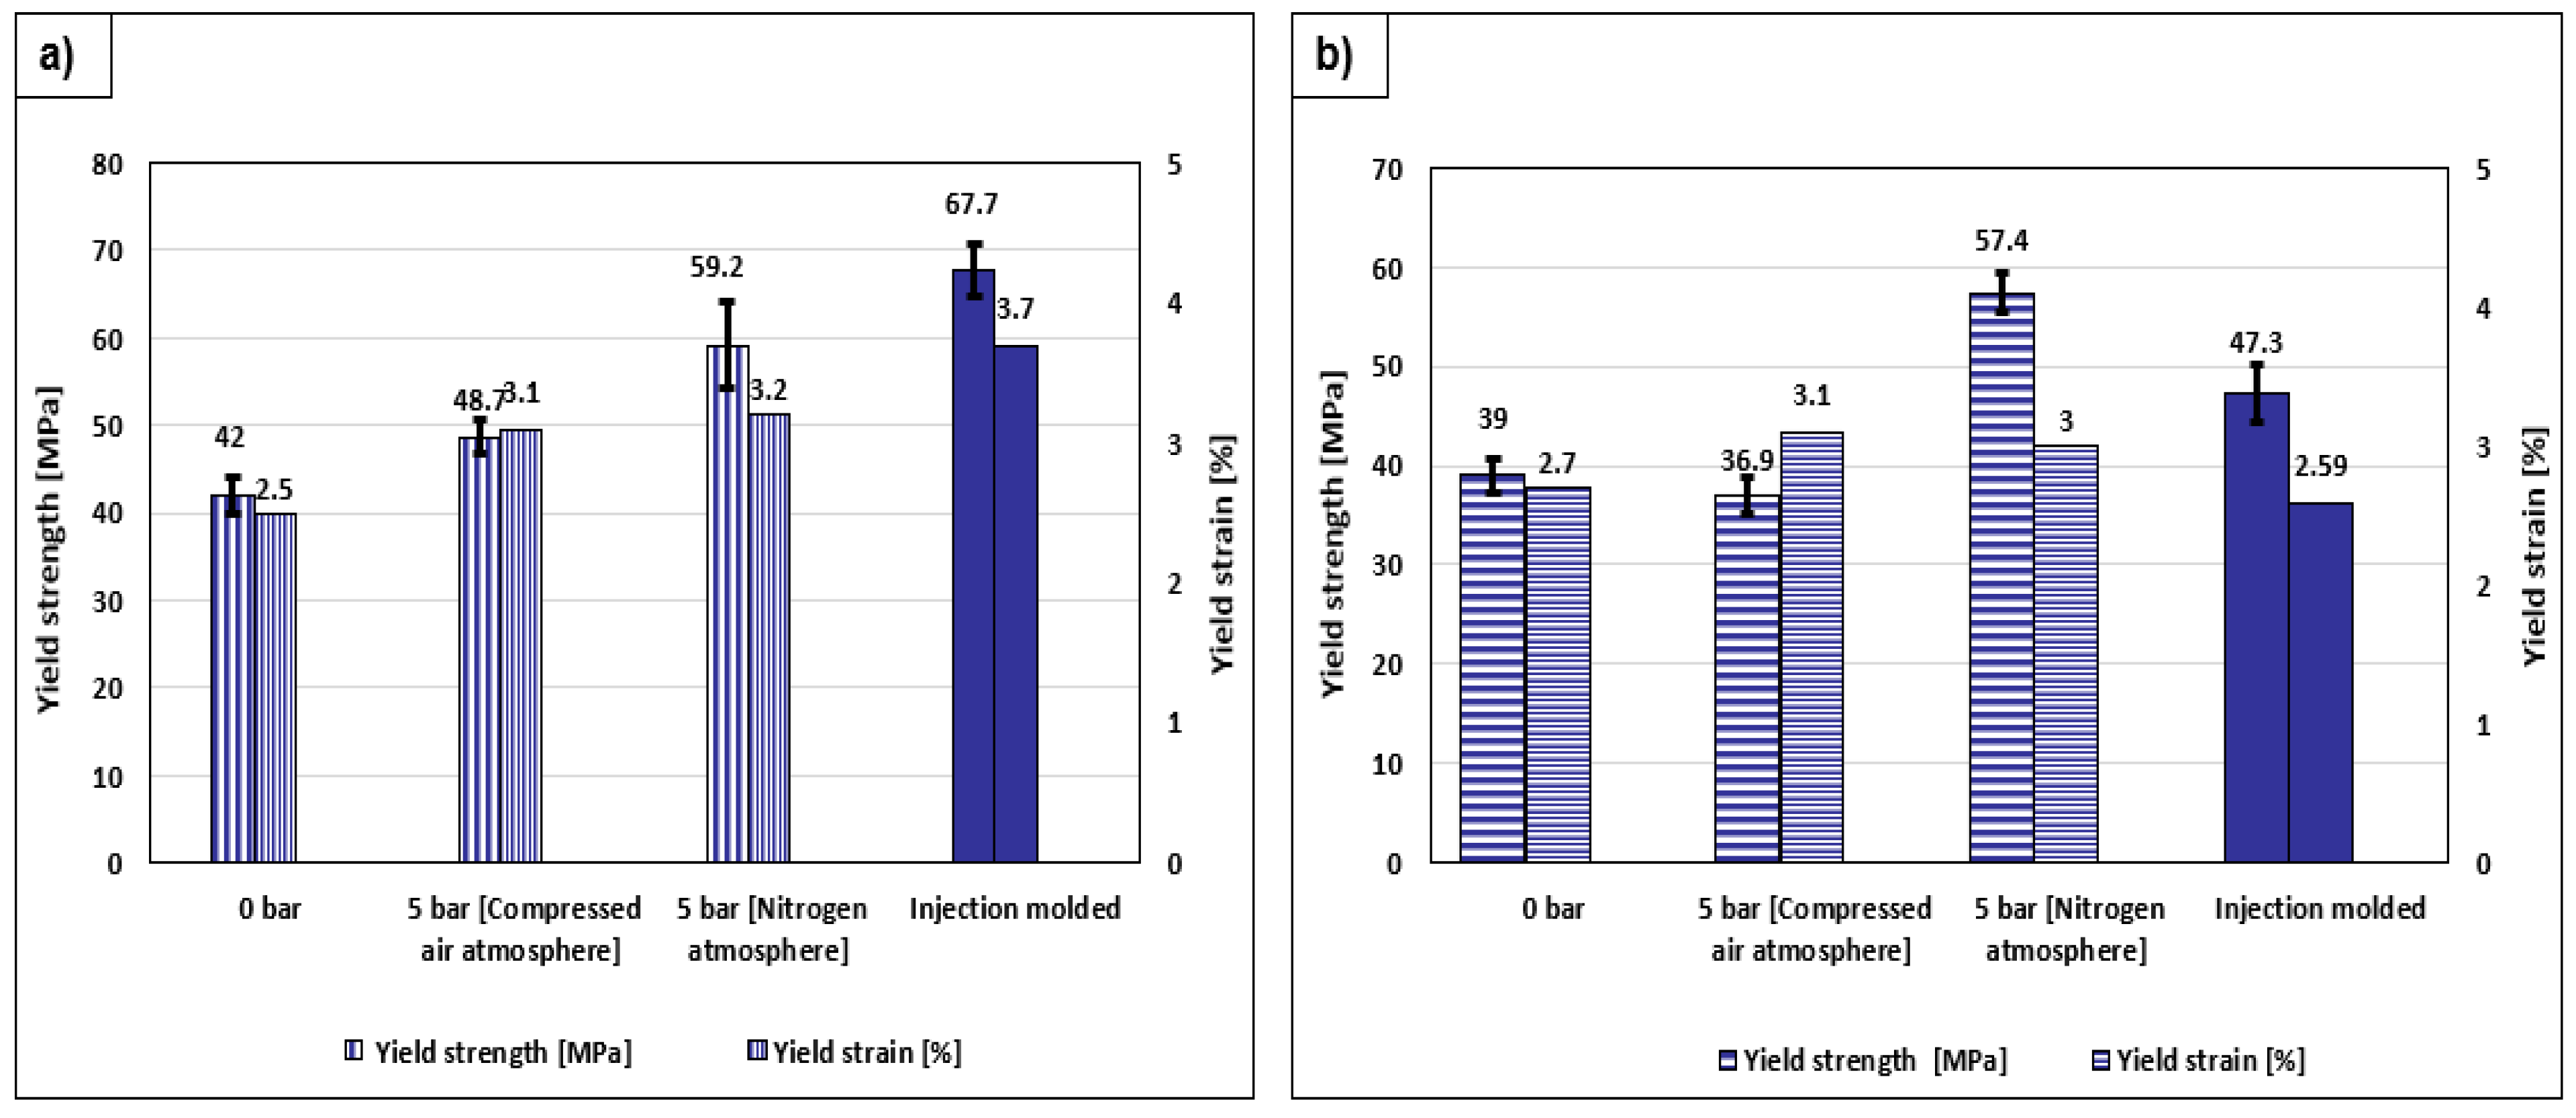
3.1. Tensile Test Results
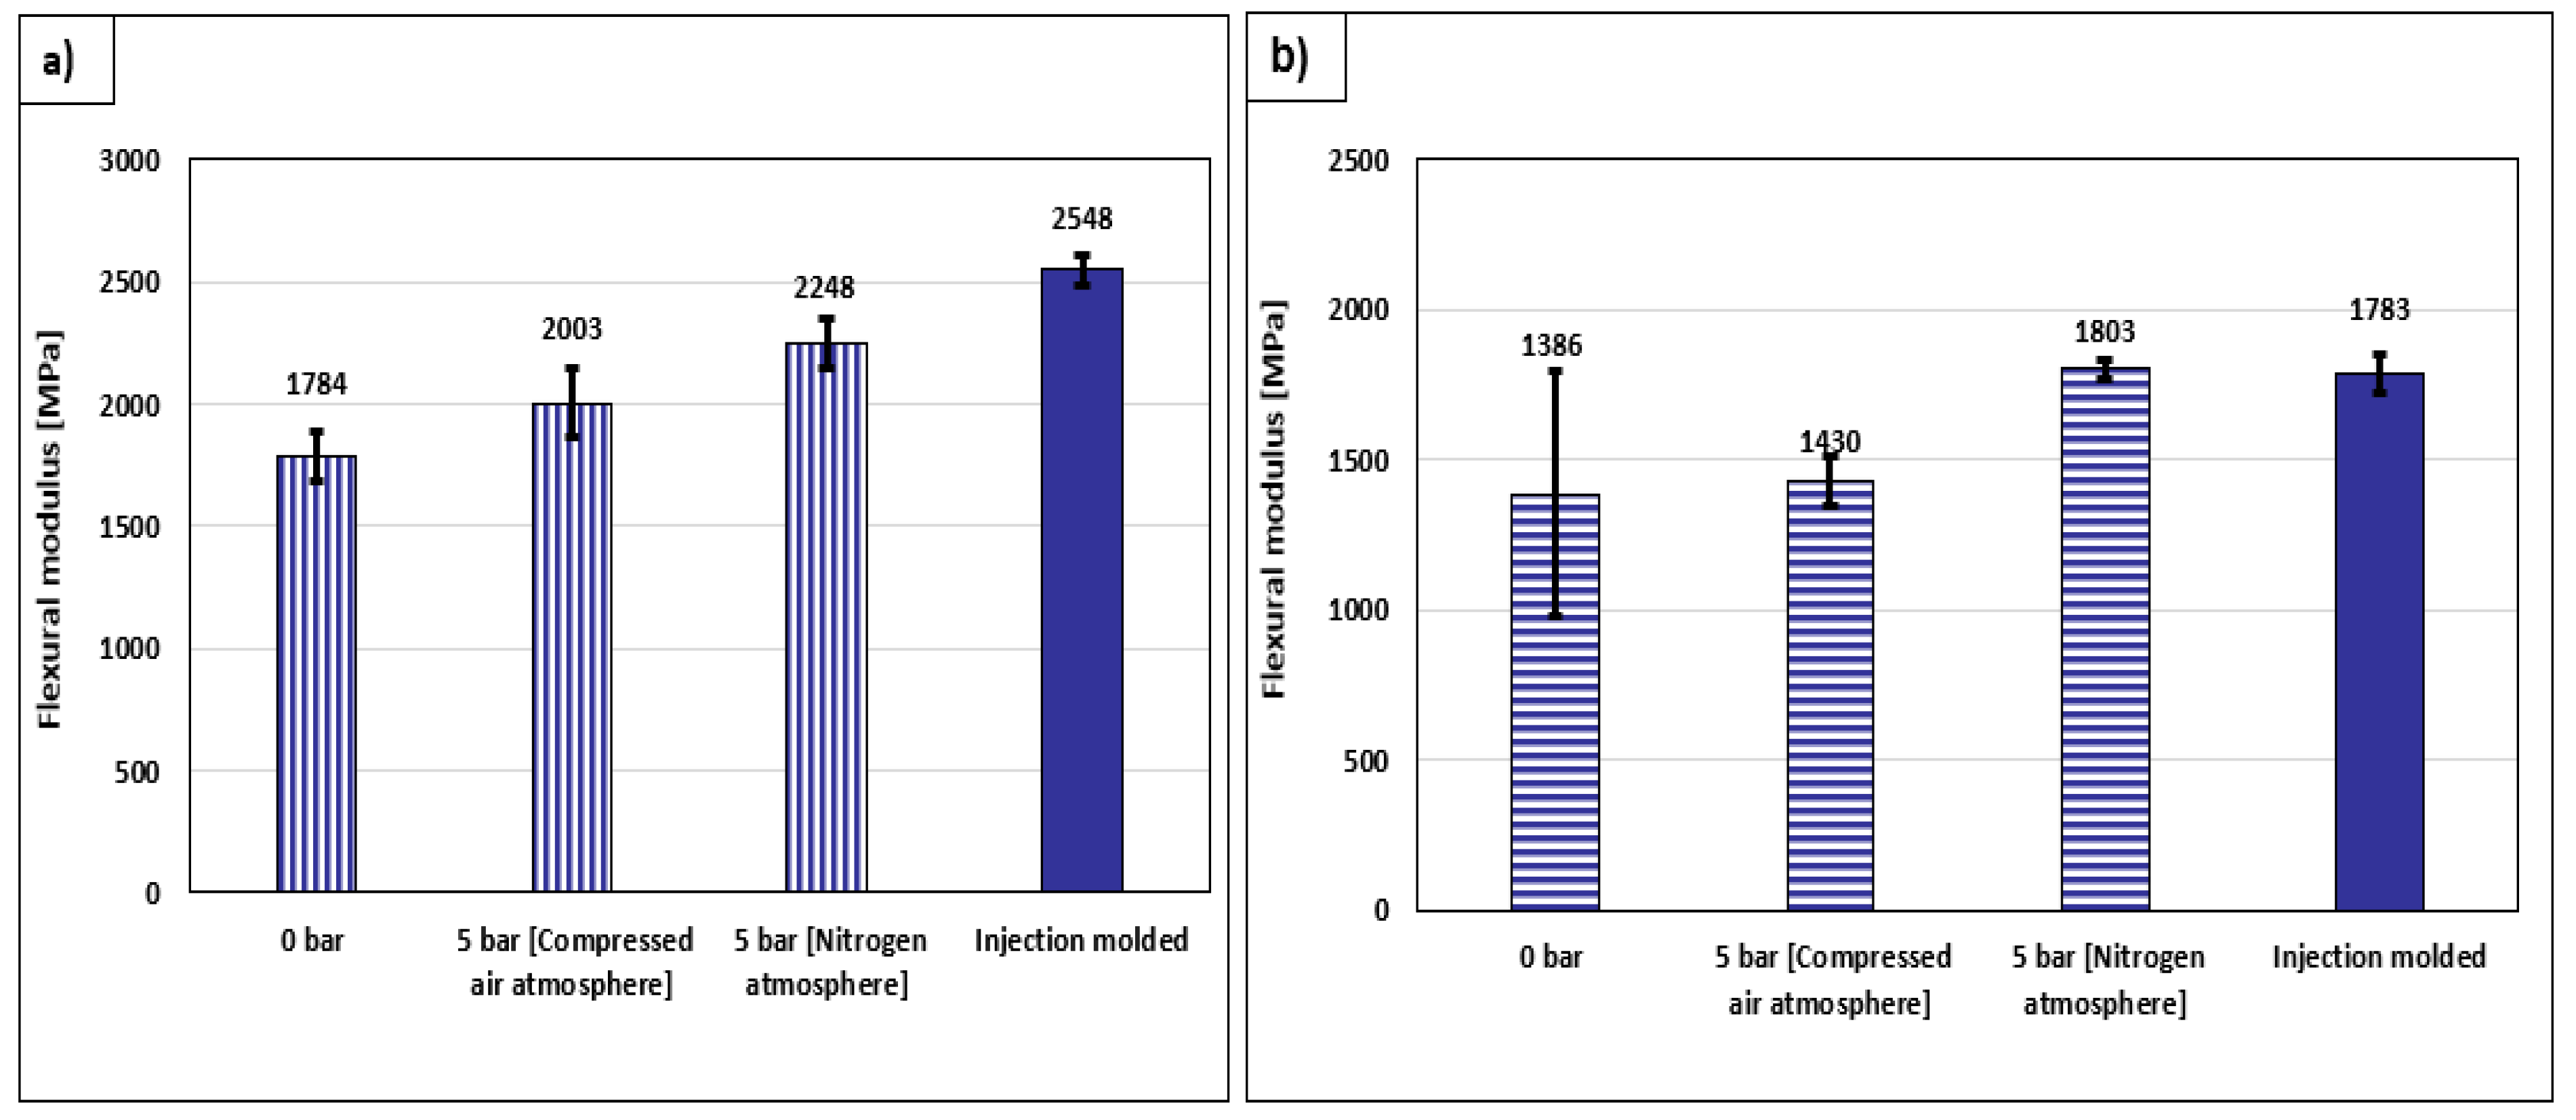
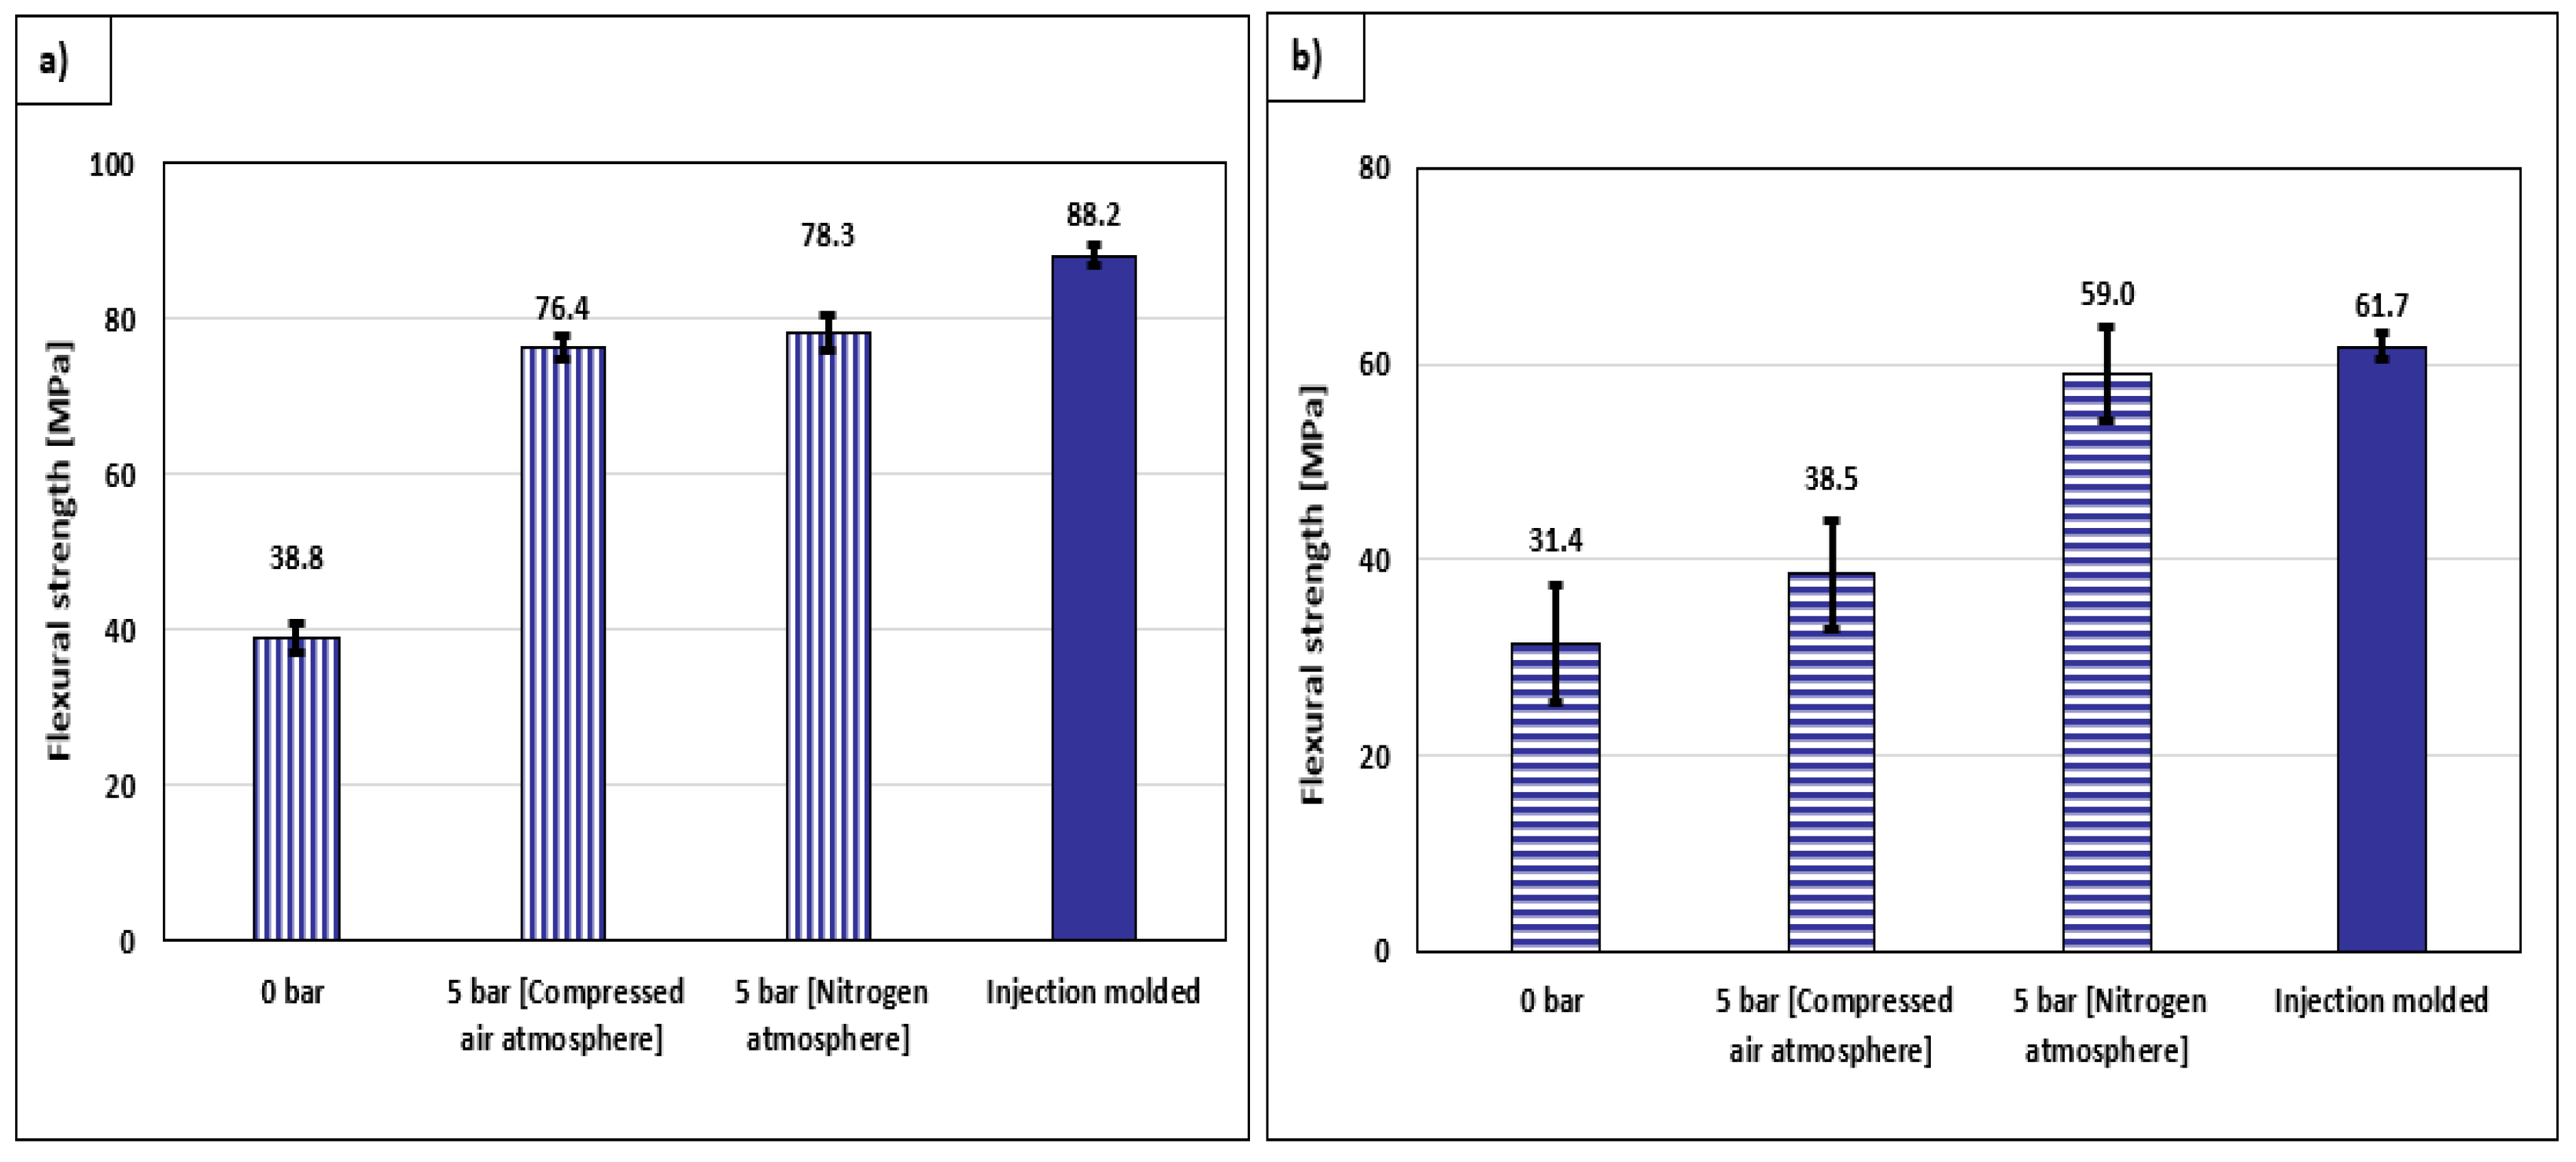
3.2. Flexural Tests
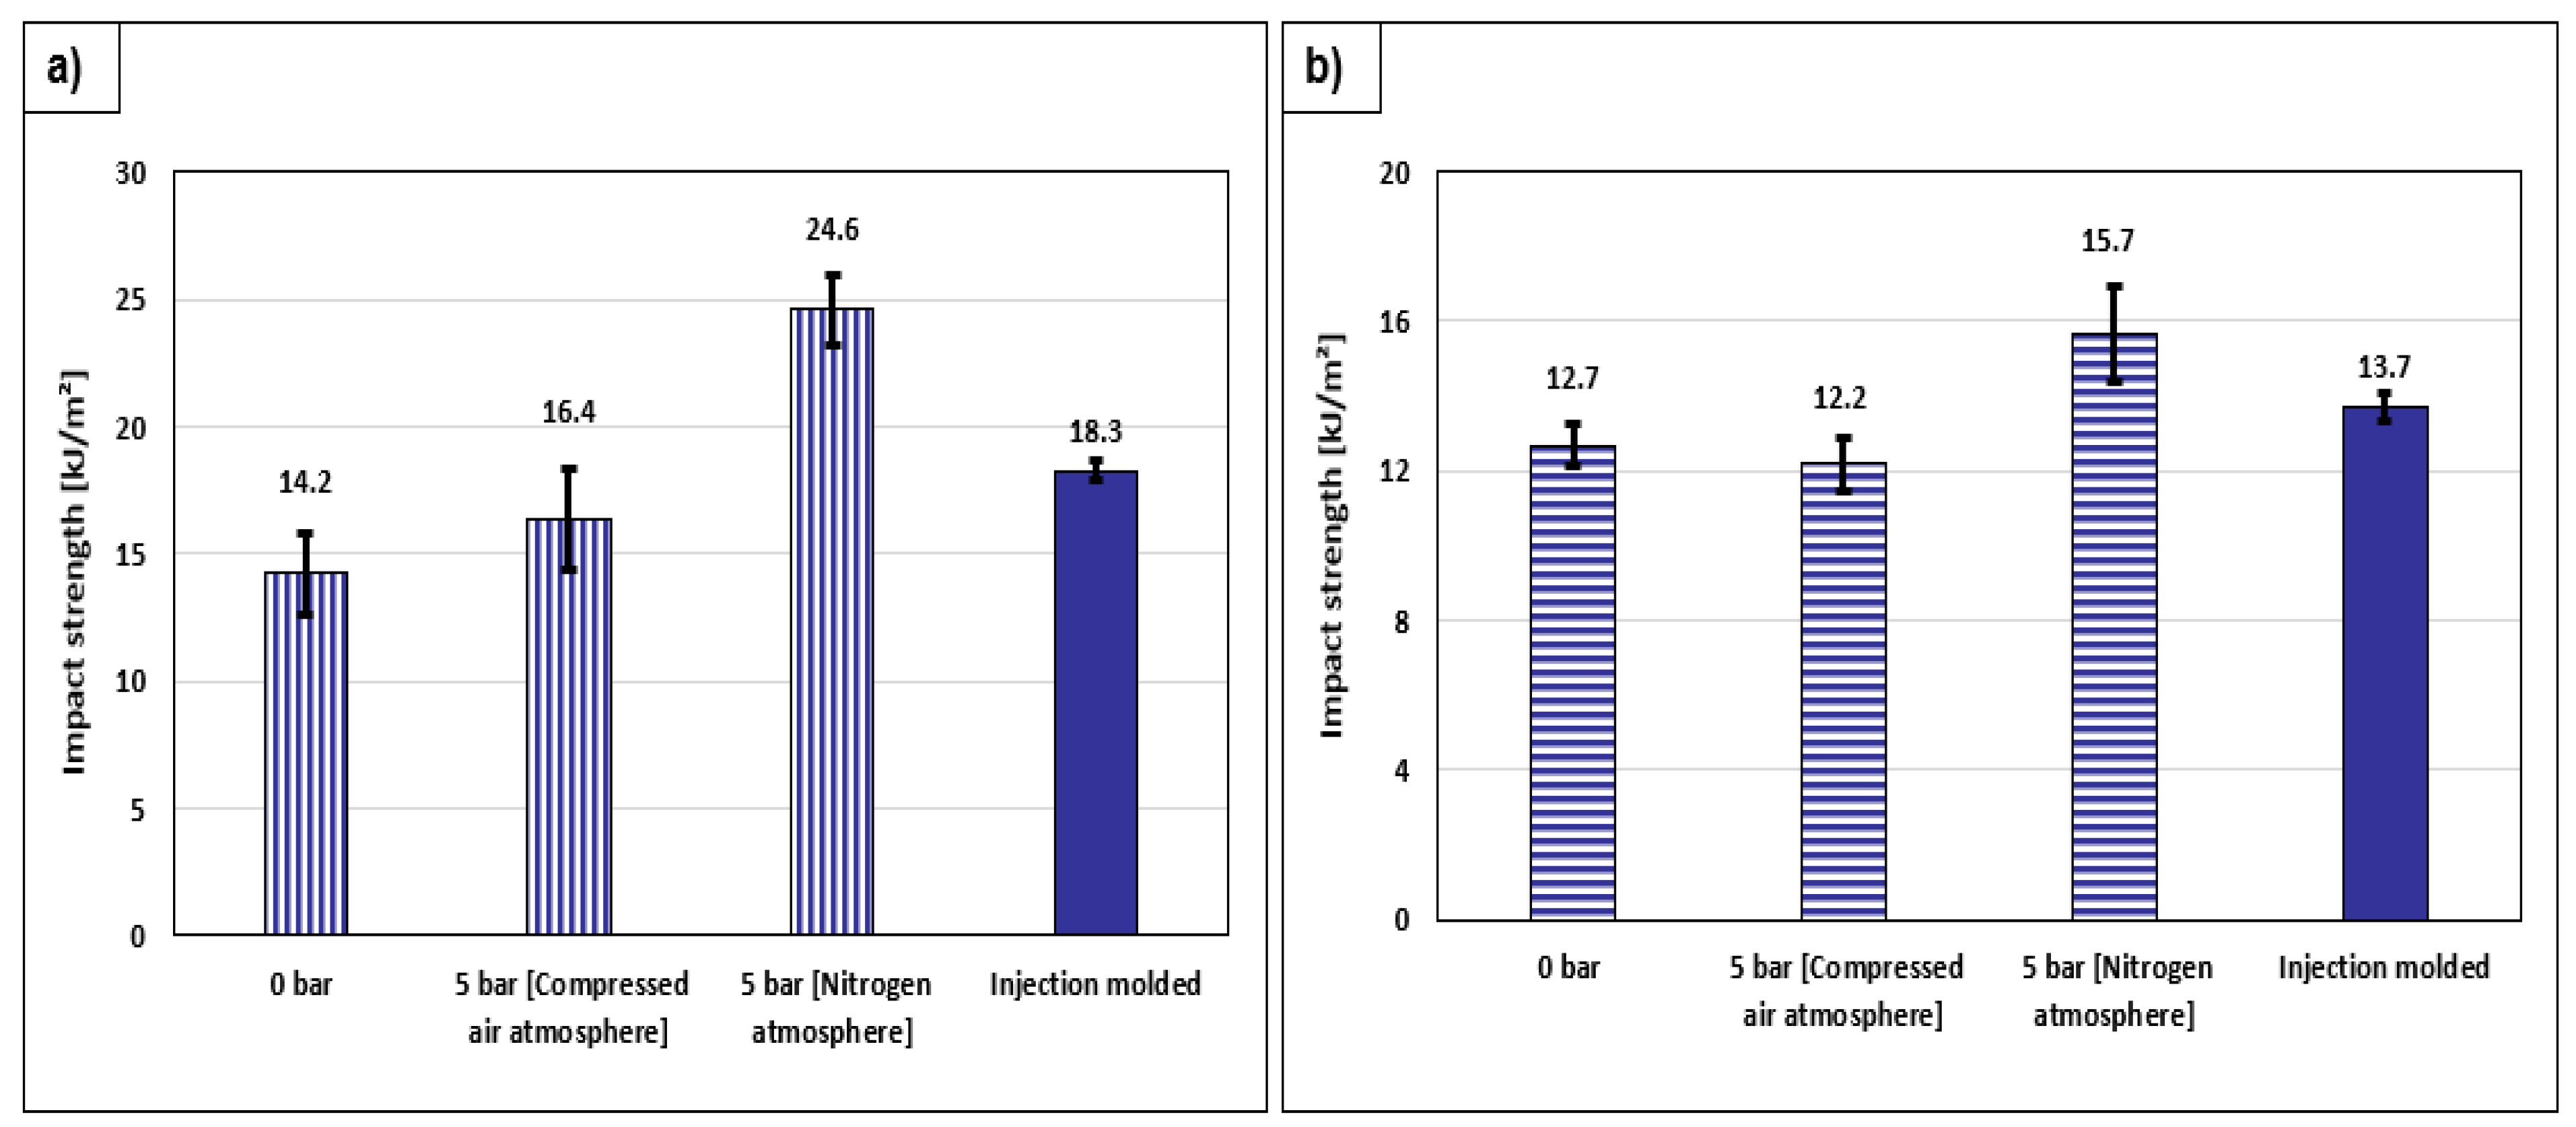
3.3. Charpy Impact Test
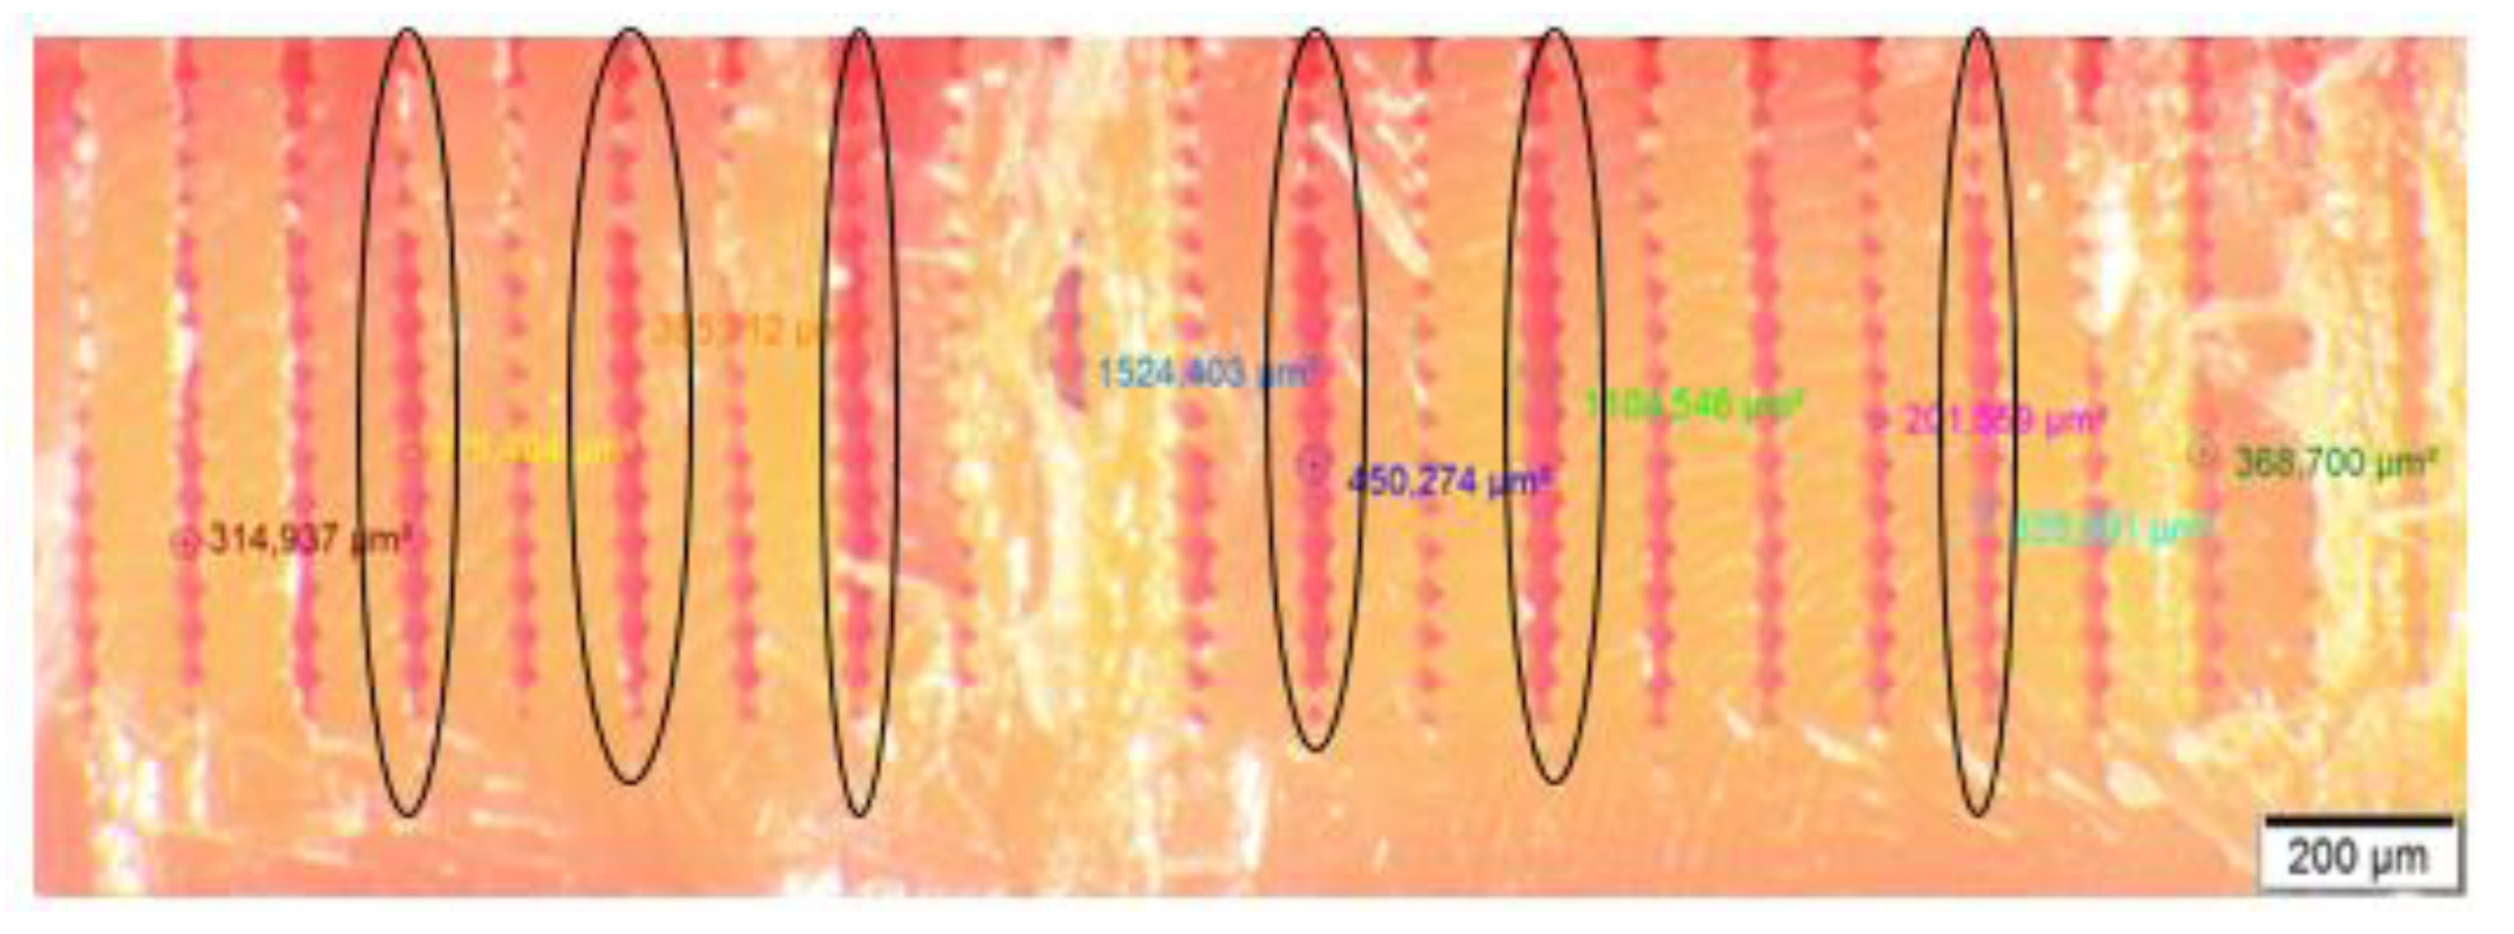
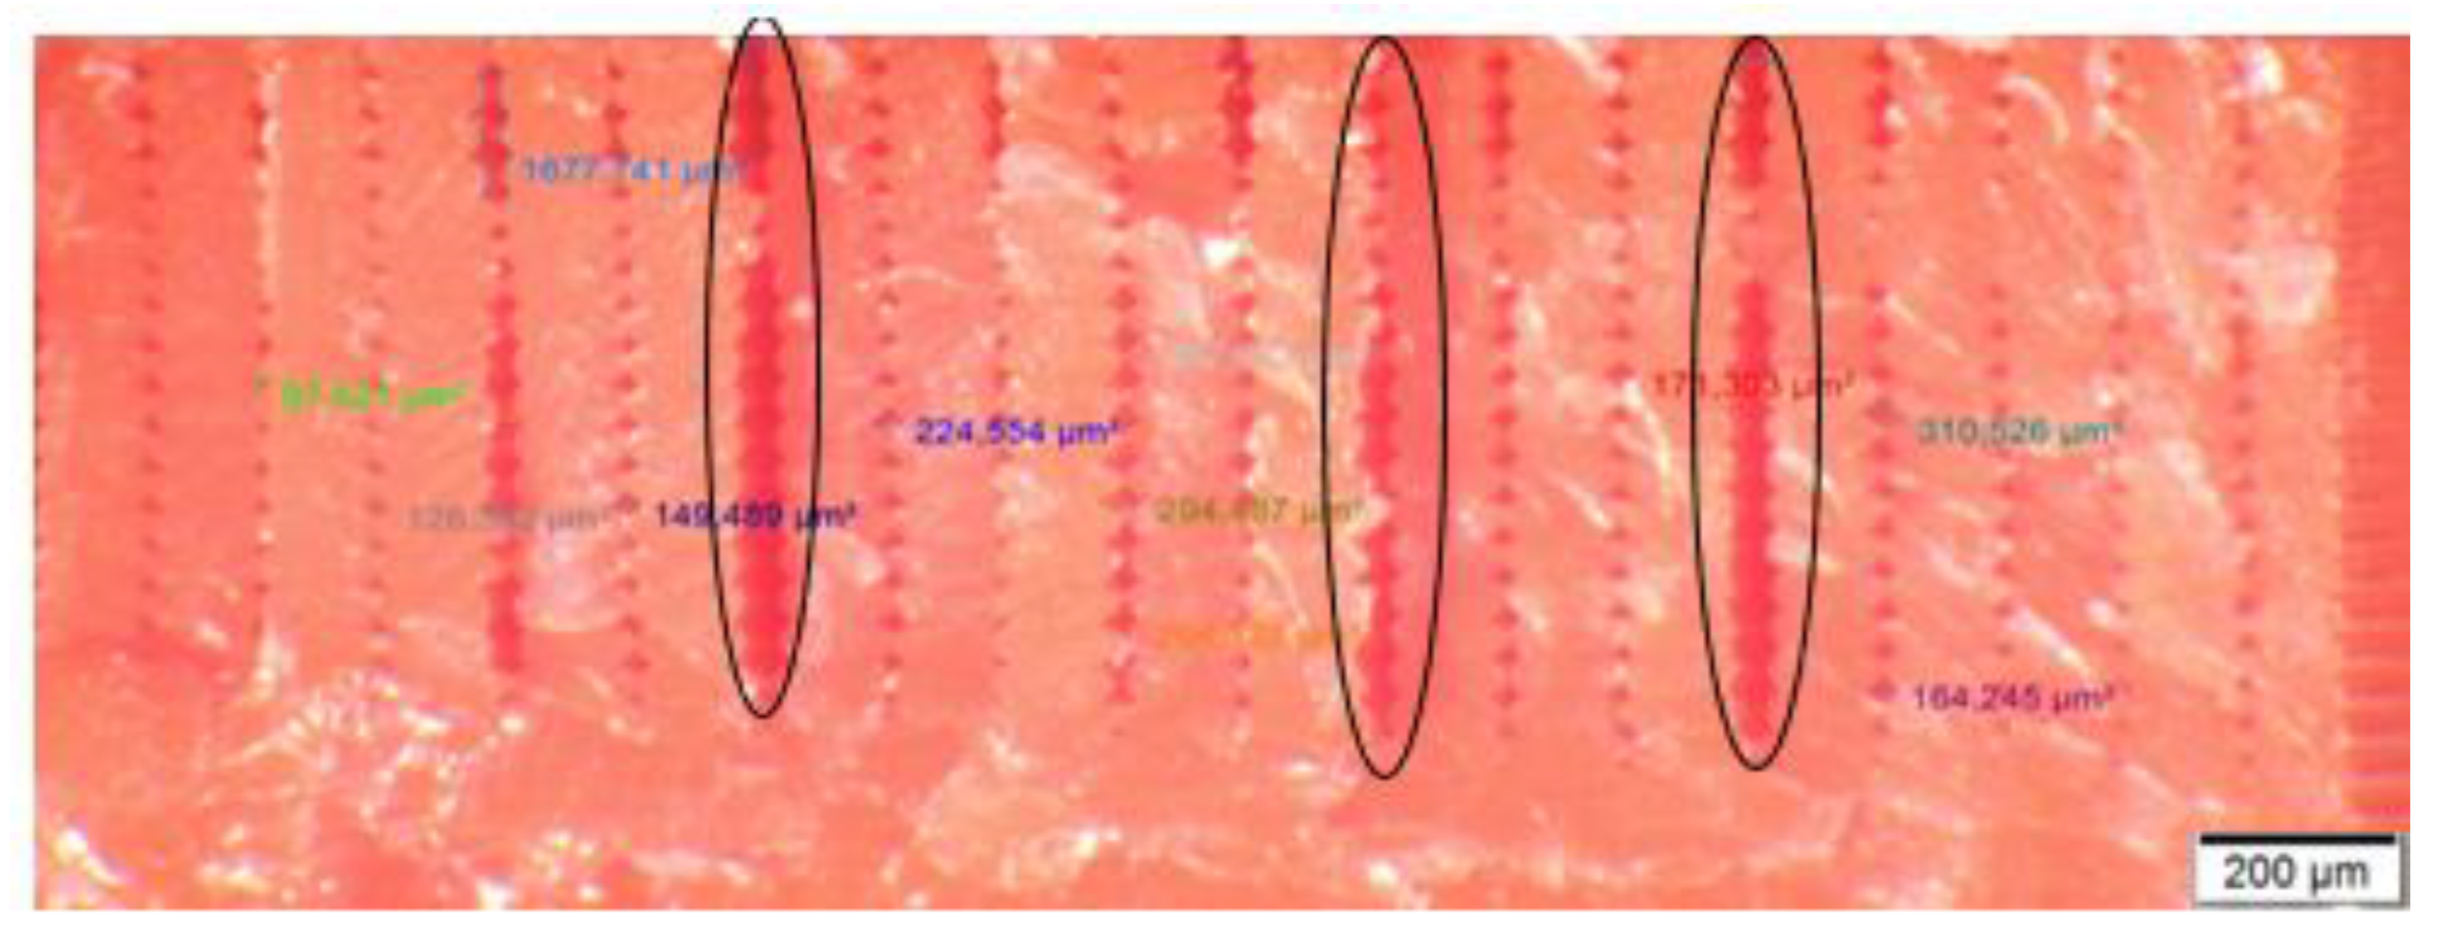
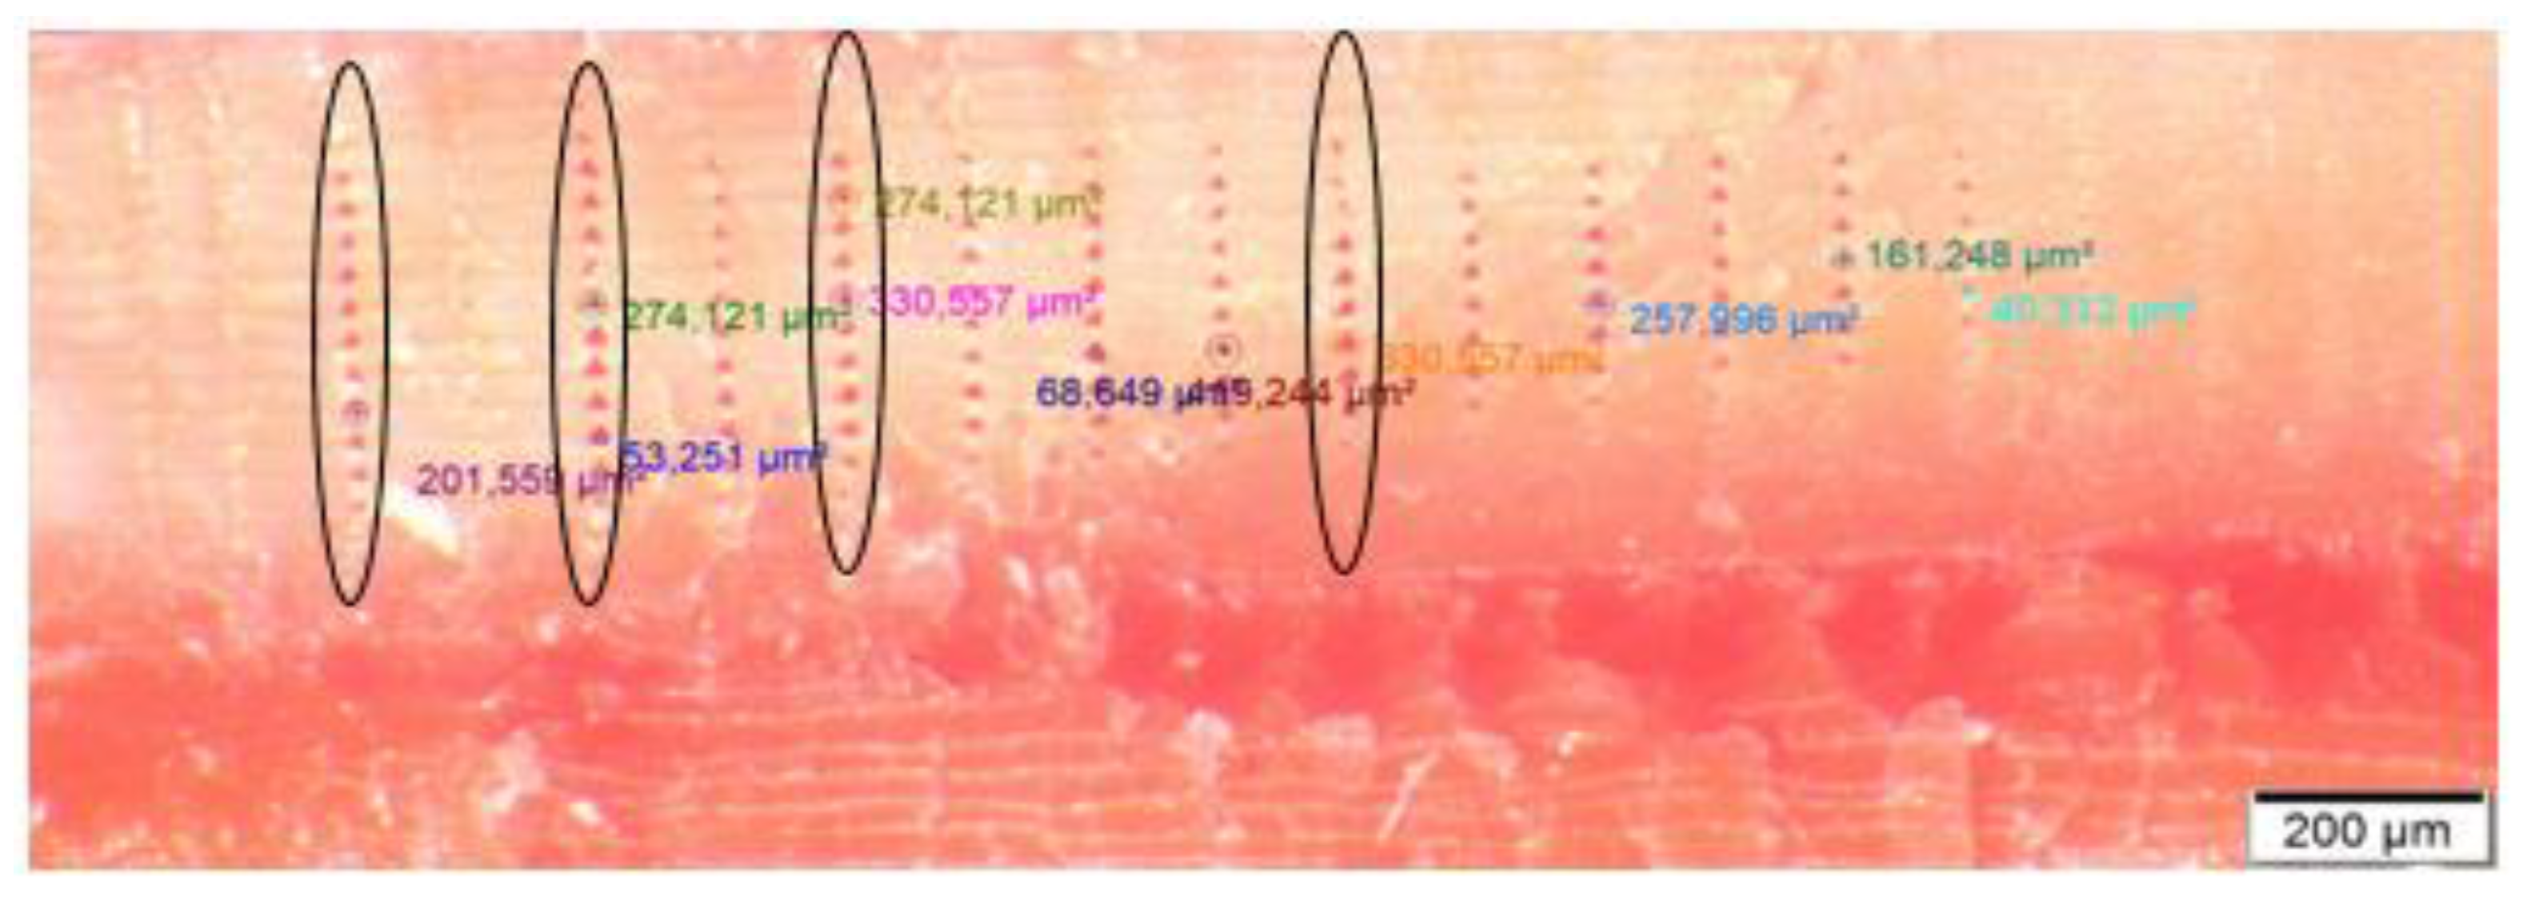
3.4. Microscopy Test Results
4. Conclusions
- Autoclave preheating and pressure improved the layer consolidation for 3D printing.
- The nitrogen gas atmosphere in the chamber inhibits layer oxidation, promoting improved layer adhesion.
- A decrease in void size brought on by autoclave pressure
Author Contributions
Funding
Acknowledgments
Conflicts of Interest
References
- Turner, B.N.; Strong, R.; Gold, S.A. A review of melt extrusion additive manufacturing processes: I. Process design and modeling. Rapid Prototyp. J. 2014, 20, 192–204. [Google Scholar] [CrossRef]
- Utela, B.; Storti, D.; Anderson, R.; Ganter, M. A review of process development steps for new material systems in three-dimensional printing (3DP). J. Manuf. Process. 2008, 10, 96–104. [Google Scholar] [CrossRef]
- Wang, X.; Jiang, M.; Zhou, Z.; Gou, J.; Hui, D. 3D printing of polymer matrix composites: A review and perspective. Compos. Part B Eng. 2017, 110, 442–458. [Google Scholar] [CrossRef]
- Kolarevic, B. Digital fabrication: Manufacturing architecture in the information age. In Proceedings of the Association for Computer Aided Design in Architecture, New York, NY, USA, 11–14 October 2001; pp. 268–277. [Google Scholar]
- Pucci, U.; Christophe, B.R.; Sisti, J.A.; Connolly, E.S., Jr. Three-dimensional printing: Technologies, applications, and limitations in neurosurgery. Biotechnol. Adv. 2017, 35, 521–529. [Google Scholar] [CrossRef] [PubMed]
- Shaik, Y.P.; Schuster, J.; Katherapalli, H.R.; Shaik, A. 3D Printing under High Ambient Pressures and Improvement of Mechanical Properties of Printed Parts. J. Compos. Sci. 2022, 6, 16. [Google Scholar] [CrossRef]
- Es-Said, O.; Foyos, J.; Noorani, R.; Mendelson, M.; Marloth, R.; Pregger, B. Effect of layer orientation on mechanical properties of rapid prototyped samples. Mater. Manuf. Process. 2000, 15, 107–122. [Google Scholar] [CrossRef]
- Lederle, F.; Meyer, F.; Brunotte, G.P.; Kaldun, C.; Hübner, E.G. Improved mechanical properties of 3D-printed parts by fused deposition modeling processed under the exclusion of oxygen. Prog. Addit. Manuf. 2016, 1, 3–7. [Google Scholar] [CrossRef] [Green Version]
- Yang, C.; Tian, X.; Li, D.; Cao, Y.; Zhao, F.; Shi, C. Influence of thermal processing conditions in 3D printing on the crystallinity and mechanical properties of PEEK material. J. Mater. Process. Technol. 2017, 248, 1–7. [Google Scholar] [CrossRef]
- Shaik, Y.P.; Schuster, J.; Shaik, A.; Mohammed, M.; Katherapalli, H.R. Effect of Autoclave Pressure and Temperature on Consolidation of Layers and Mechanical Properties of Additively Manufactured (FDM) Products with PLA. J. Manuf. Mater. Process. 2021, 5, 114. [Google Scholar] [CrossRef]
- Shaik, Y.P.; Schuster, J.; Chowdary, R. Impact of 3D printing patterns and post-consolidation pressure on mechanical properties of FDM printed samples. Am. Res. J. Mater. Sci. 2020, 1, 1–10. [Google Scholar]
- Robert, J.M.; Ashlie, M.; John, N.; John, S.; Jeff, Y. Cellulose nanomaterials review: Structure, properties, and nanocomposites. R. Soc. Chem. 2011, 40, 3941–3994. [Google Scholar]
- Xionghao, L.; Zhongjin, N.; Shuyang, B.; Baiyang, L. Preparation and mechanical properties of fiber-reinforced PLA for 3D printing materials. IOP conference series. Mater. Sci. Eng. 2018, 322, 022012. [Google Scholar]
- Kiendl, J.; Gao, C. Controlling toughness and strength of FDM 3D-printed PLA components through the raster layup. Composites Part B 2020, 180, 107562. [Google Scholar] [CrossRef]
- Agarwala, M.K.; Jamalabad, V.R.; Langrana, N.A.; Ahmad, S.; Whalen, P.J.; Danforth, S.C. Structural quality of parts processed by fused deposition. Rapid Prototype J. 1996, 2, 4–19. [Google Scholar] [CrossRef]
- Herz GmbH. 20 May 2022. Available online: https://shop.filamentonline.de/de/38-pla-175mm? (accessed on 8 February 2022).
- Upcraft, S.; Fletcher, R. The rapid prototyping technologies. Assem. Autom. 2003, 23, 318–330. [Google Scholar] [CrossRef]
- Creality Ender 3 V2. CREALITY. January 2022. Available online: https://www.creality3dofficial.eu/products/ender-3-v2-3d-printer? (accessed on 1 March 2022).
- Haage Anagramm Technologien GmbH. January 2022. Available online: https://www.haage.com/DE/produkte/hochdruckautoklaven (accessed on 1 March 2022).
- Jürgen, N.; Doreen, S.; Bernd, H.; Matthias, B.; Dieter, P.; Claus, V.; Dieter, L.; Simon, A. Investigations on the formation of composites by injection molding of PA6 and different grafted polypropylenes and their blends. J. Appl. Polym. Sci. 2006, 100, 2992–2999. [Google Scholar]
- Zhou, H. Computer Modeling for Injection Molding: Simulation, Optimization, and Control; A John Wiley & Sons. Inc. Publication: Hoboken, NJ, USA, 2013; ISBN 978-0-470-60299-7. [Google Scholar]
- Michigan Technology University, Internet Citation (2022) about Tensile Test. Michigan Tech. Available online: https://www.mtu.edu/materials/k12/experiments/tensile (accessed on 1 March 2023).
- Internet Citation (2022) about Flexural Test Resources. Available online: https://www.testresources.net/applications/test-types/flexural-test (accessed on 1 March 2023).
- Tóth, L. Historical background and development of the Charpy test. In From Charpy to Present Impact Testing; European Structural Integrity Society: Cassino, Italy, 2002; pp. 3–19. [Google Scholar]
- Miao, L.; Dwayne, D.A.; Dongsheng, Z. Displacement/strain measurements using an optical microscope and digital image correlation. Opt. Eng. 2006, 45, 033605. [Google Scholar]


| 3D Printing at 0 Bar | 3D Printing at 5 Bar | 3D Printing At 5 Bar Nitrogen Atmosphere | Injection-Molded Specimen | |
|---|---|---|---|---|
| PLA Viods area (µm2) | 255.51 µm2 | 145.11 µm2 | 101.34 µm2 | ~50–70 * µm2 |
| 3D Printing at 0 Bar | 3D Printing at 5 Bar | 3D Printing At 5 bar Nitrogen Atmosphere | Injection-Molded Specimen | |
|---|---|---|---|---|
| Longitudinal (Average Density) | 1.0932 gm/cm3 | 1.1587 gm/cm3 | 1.1912 gm/cm3 | 1.2492 gm/cm3 |
| Transverse (Average Density) | 1.0462 gm/cm3 | 1.1141 gm/cm3 | 1.1642 gm/cm3 | 1.2492 gm/cm3 |
Disclaimer/Publisher’s Note: The statements, opinions and data contained in all publications are solely those of the individual author(s) and contributor(s) and not of MDPI and/or the editor(s). MDPI and/or the editor(s) disclaim responsibility for any injury to people or property resulting from any ideas, methods, instructions or products referred to in the content. |
© 2023 by the authors. Licensee MDPI, Basel, Switzerland. This article is an open access article distributed under the terms and conditions of the Creative Commons Attribution (CC BY) license (https://creativecommons.org/licenses/by/4.0/).
Share and Cite
Shaik, Y.P.; Schuster, J.; Naidu, N.K. High-Pressure FDM 3D Printing in Nitrogen [Inert Gas] and Improved Mechanical Performance of Printed Components. J. Compos. Sci. 2023, 7, 153. https://doi.org/10.3390/jcs7040153
Shaik YP, Schuster J, Naidu NK. High-Pressure FDM 3D Printing in Nitrogen [Inert Gas] and Improved Mechanical Performance of Printed Components. Journal of Composites Science. 2023; 7(4):153. https://doi.org/10.3390/jcs7040153
Chicago/Turabian StyleShaik, Yousuf Pasha, Jens Schuster, and Naresh Kumar Naidu. 2023. "High-Pressure FDM 3D Printing in Nitrogen [Inert Gas] and Improved Mechanical Performance of Printed Components" Journal of Composites Science 7, no. 4: 153. https://doi.org/10.3390/jcs7040153