
Mesoscale Analysis of Rubber Particle Effect on Indirect Tensile and Flexural Tensile Strength of Crumb Rubber Mortar


Abstract
:1. Introduction
2. Experiment Program
2.1. Mix Proportions Design
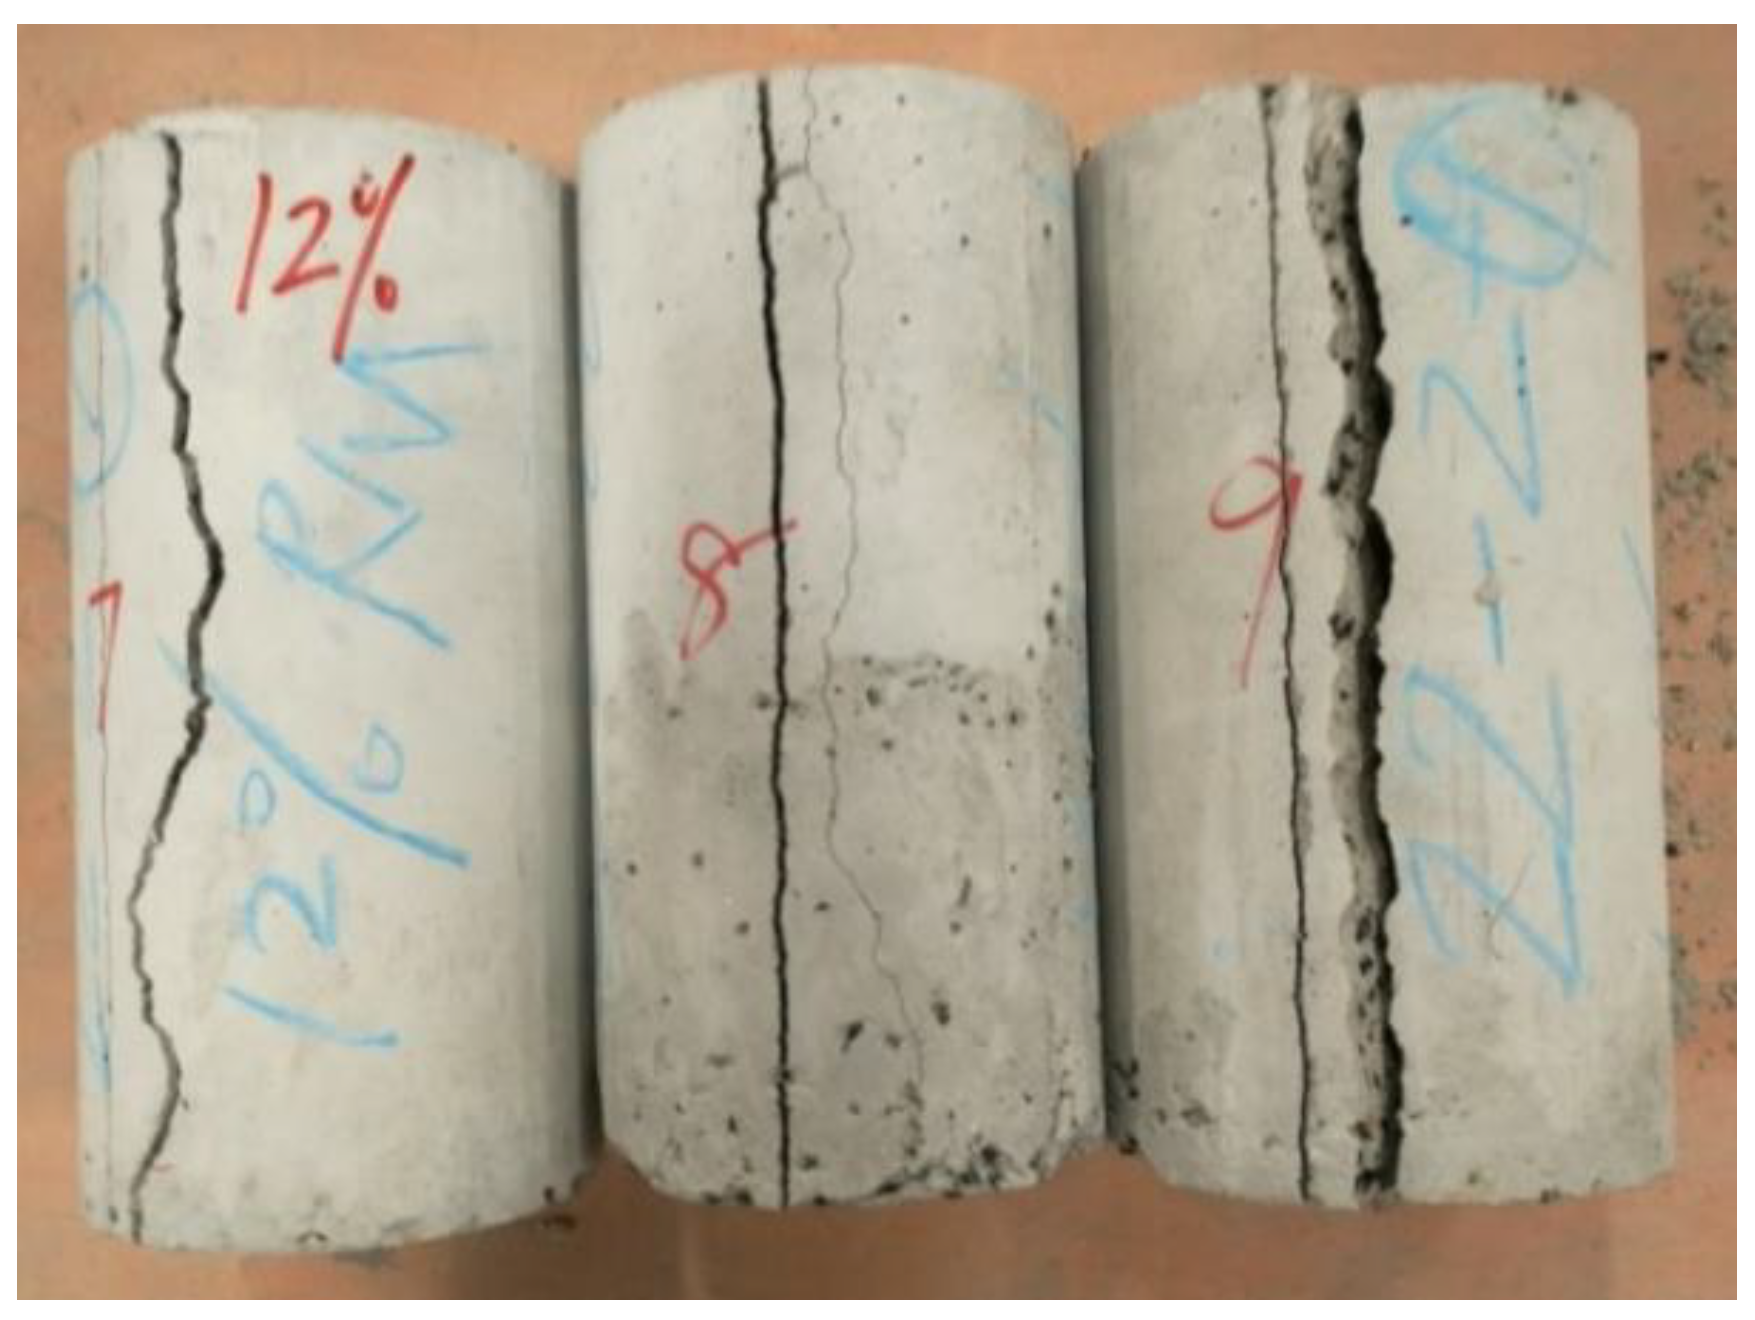
2.2. Specimen Preparation and Test Program
3. Mesoscale Simulation of Crumb Rubber Mortar
3.1. Mesoscale Model Formation of Rubber Mortar
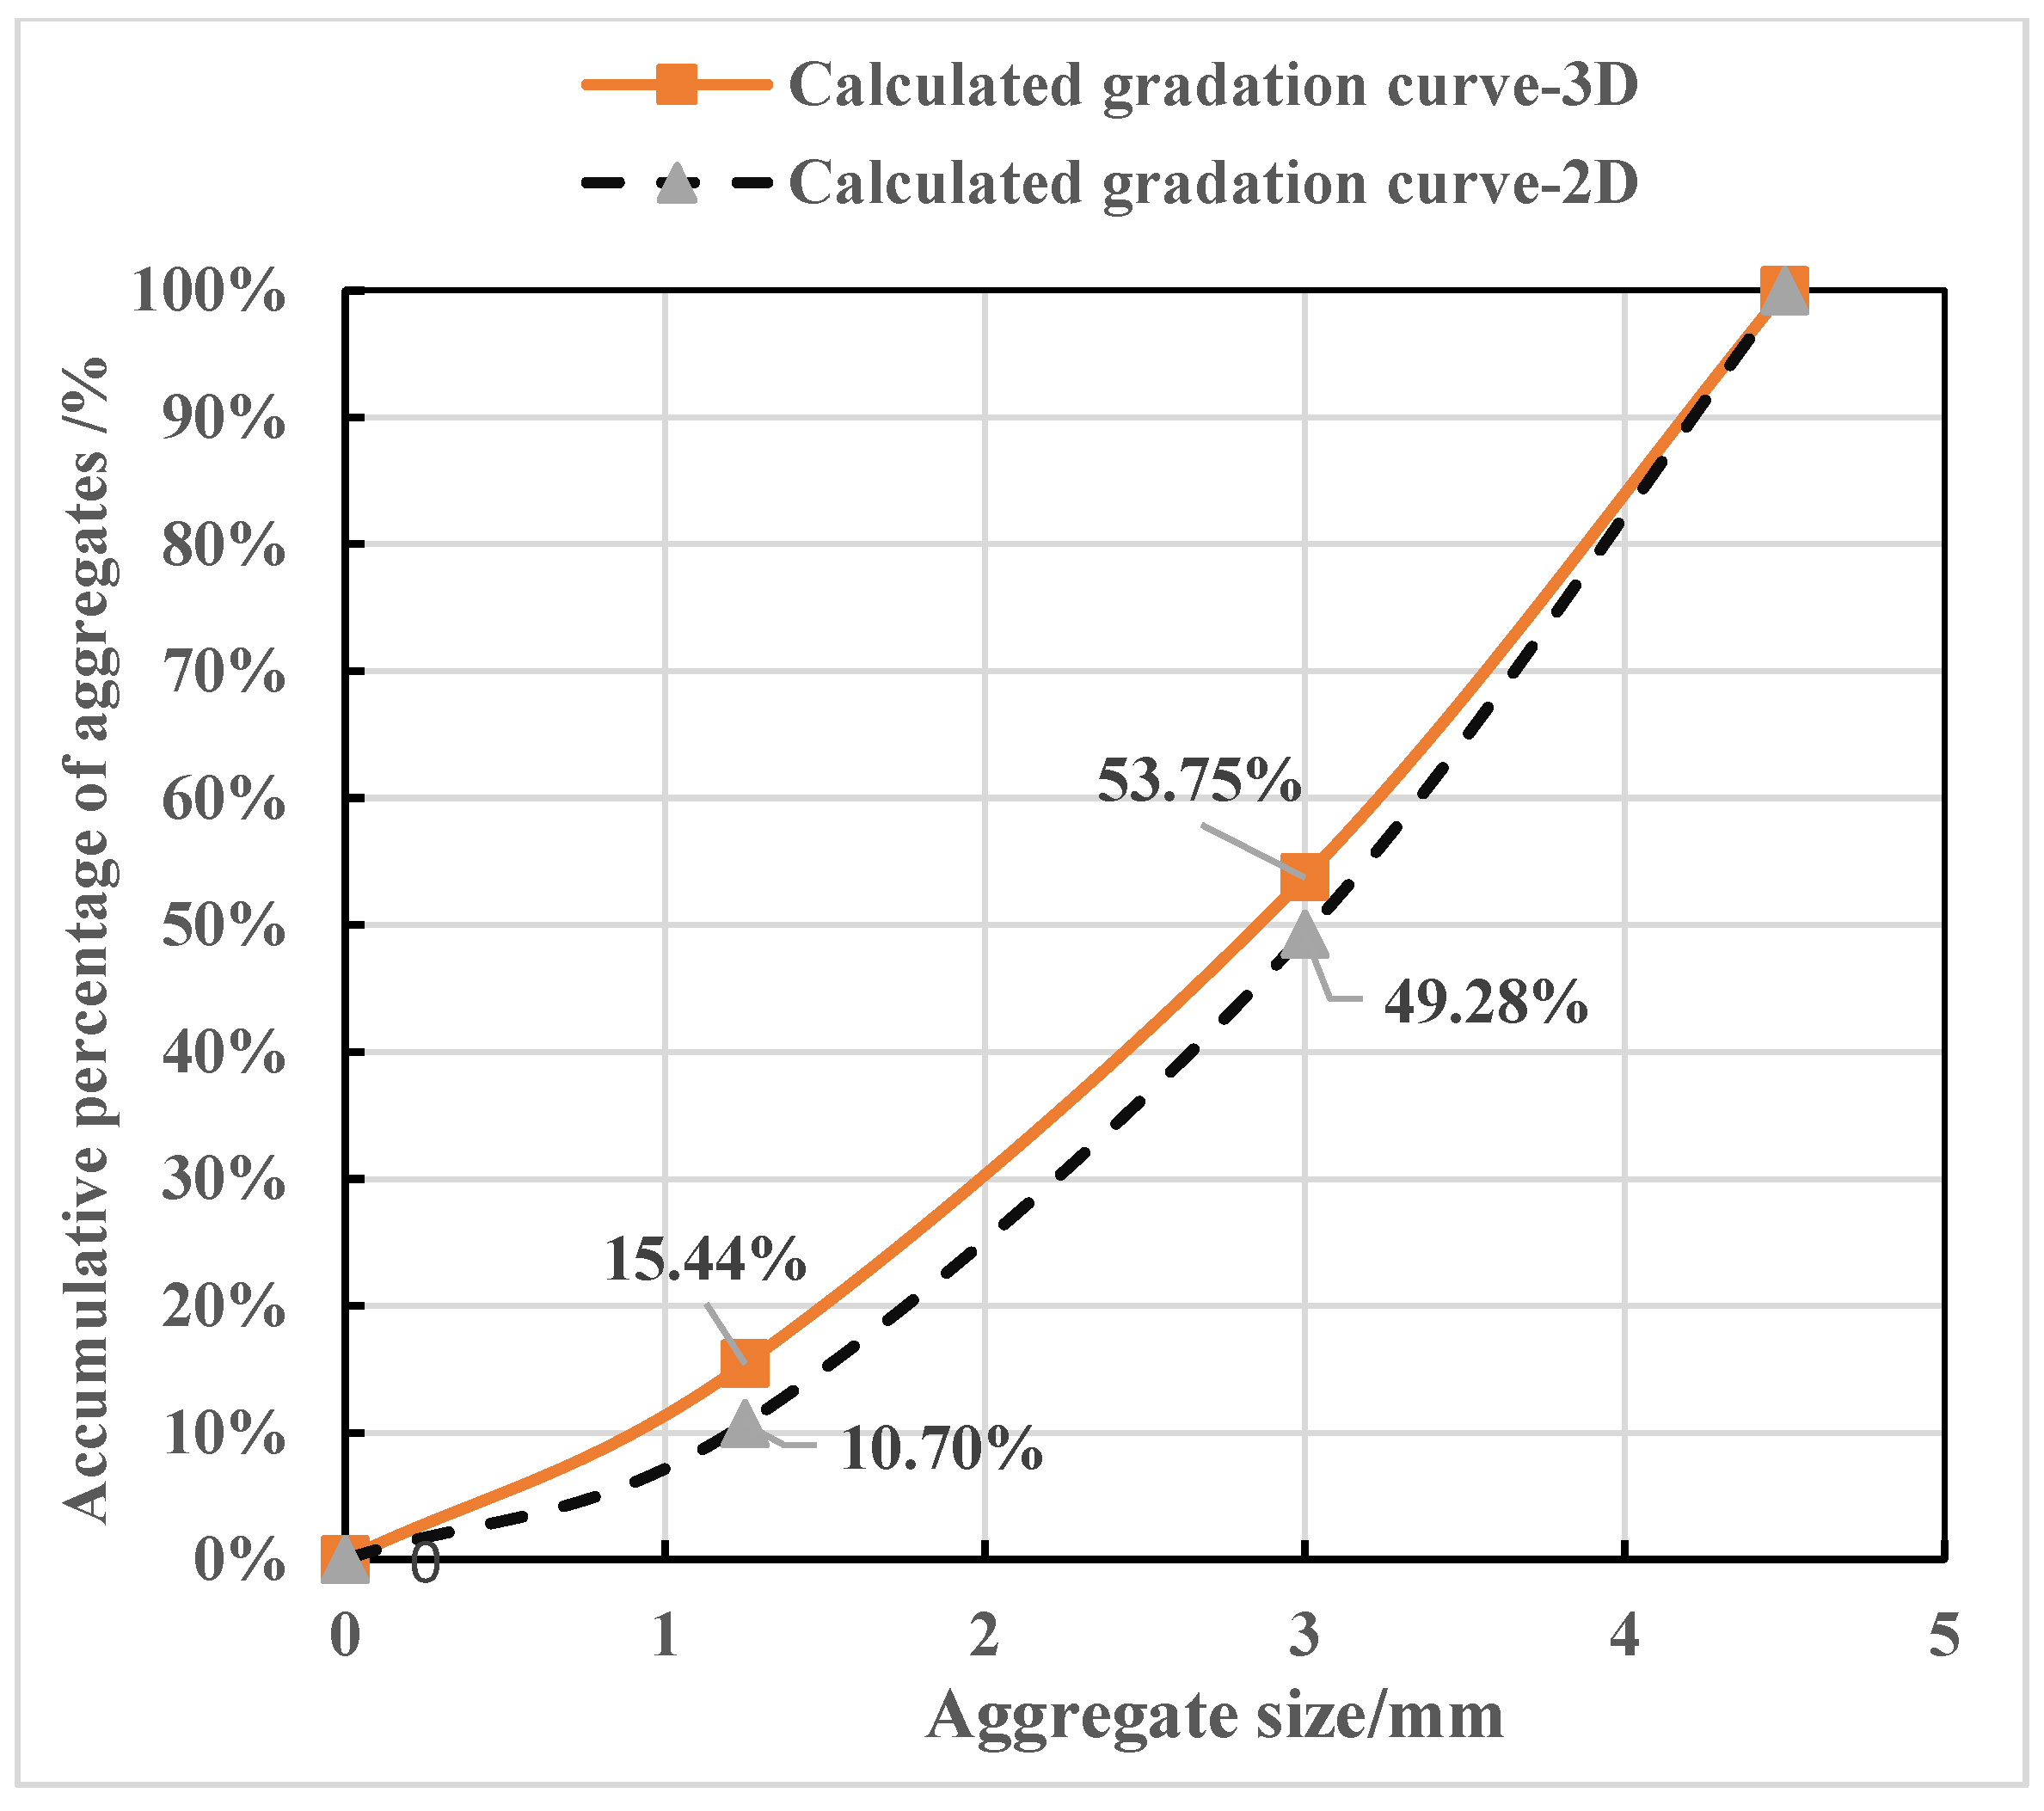
3.1.1. Conversion of the Distribution of Rubber Particles from Space to a Plane
3.1.2. Simulation of the Shape of Rubber Particles and Their Interface Layer
3.1.3. Mesoscale Models of CRM Specimens
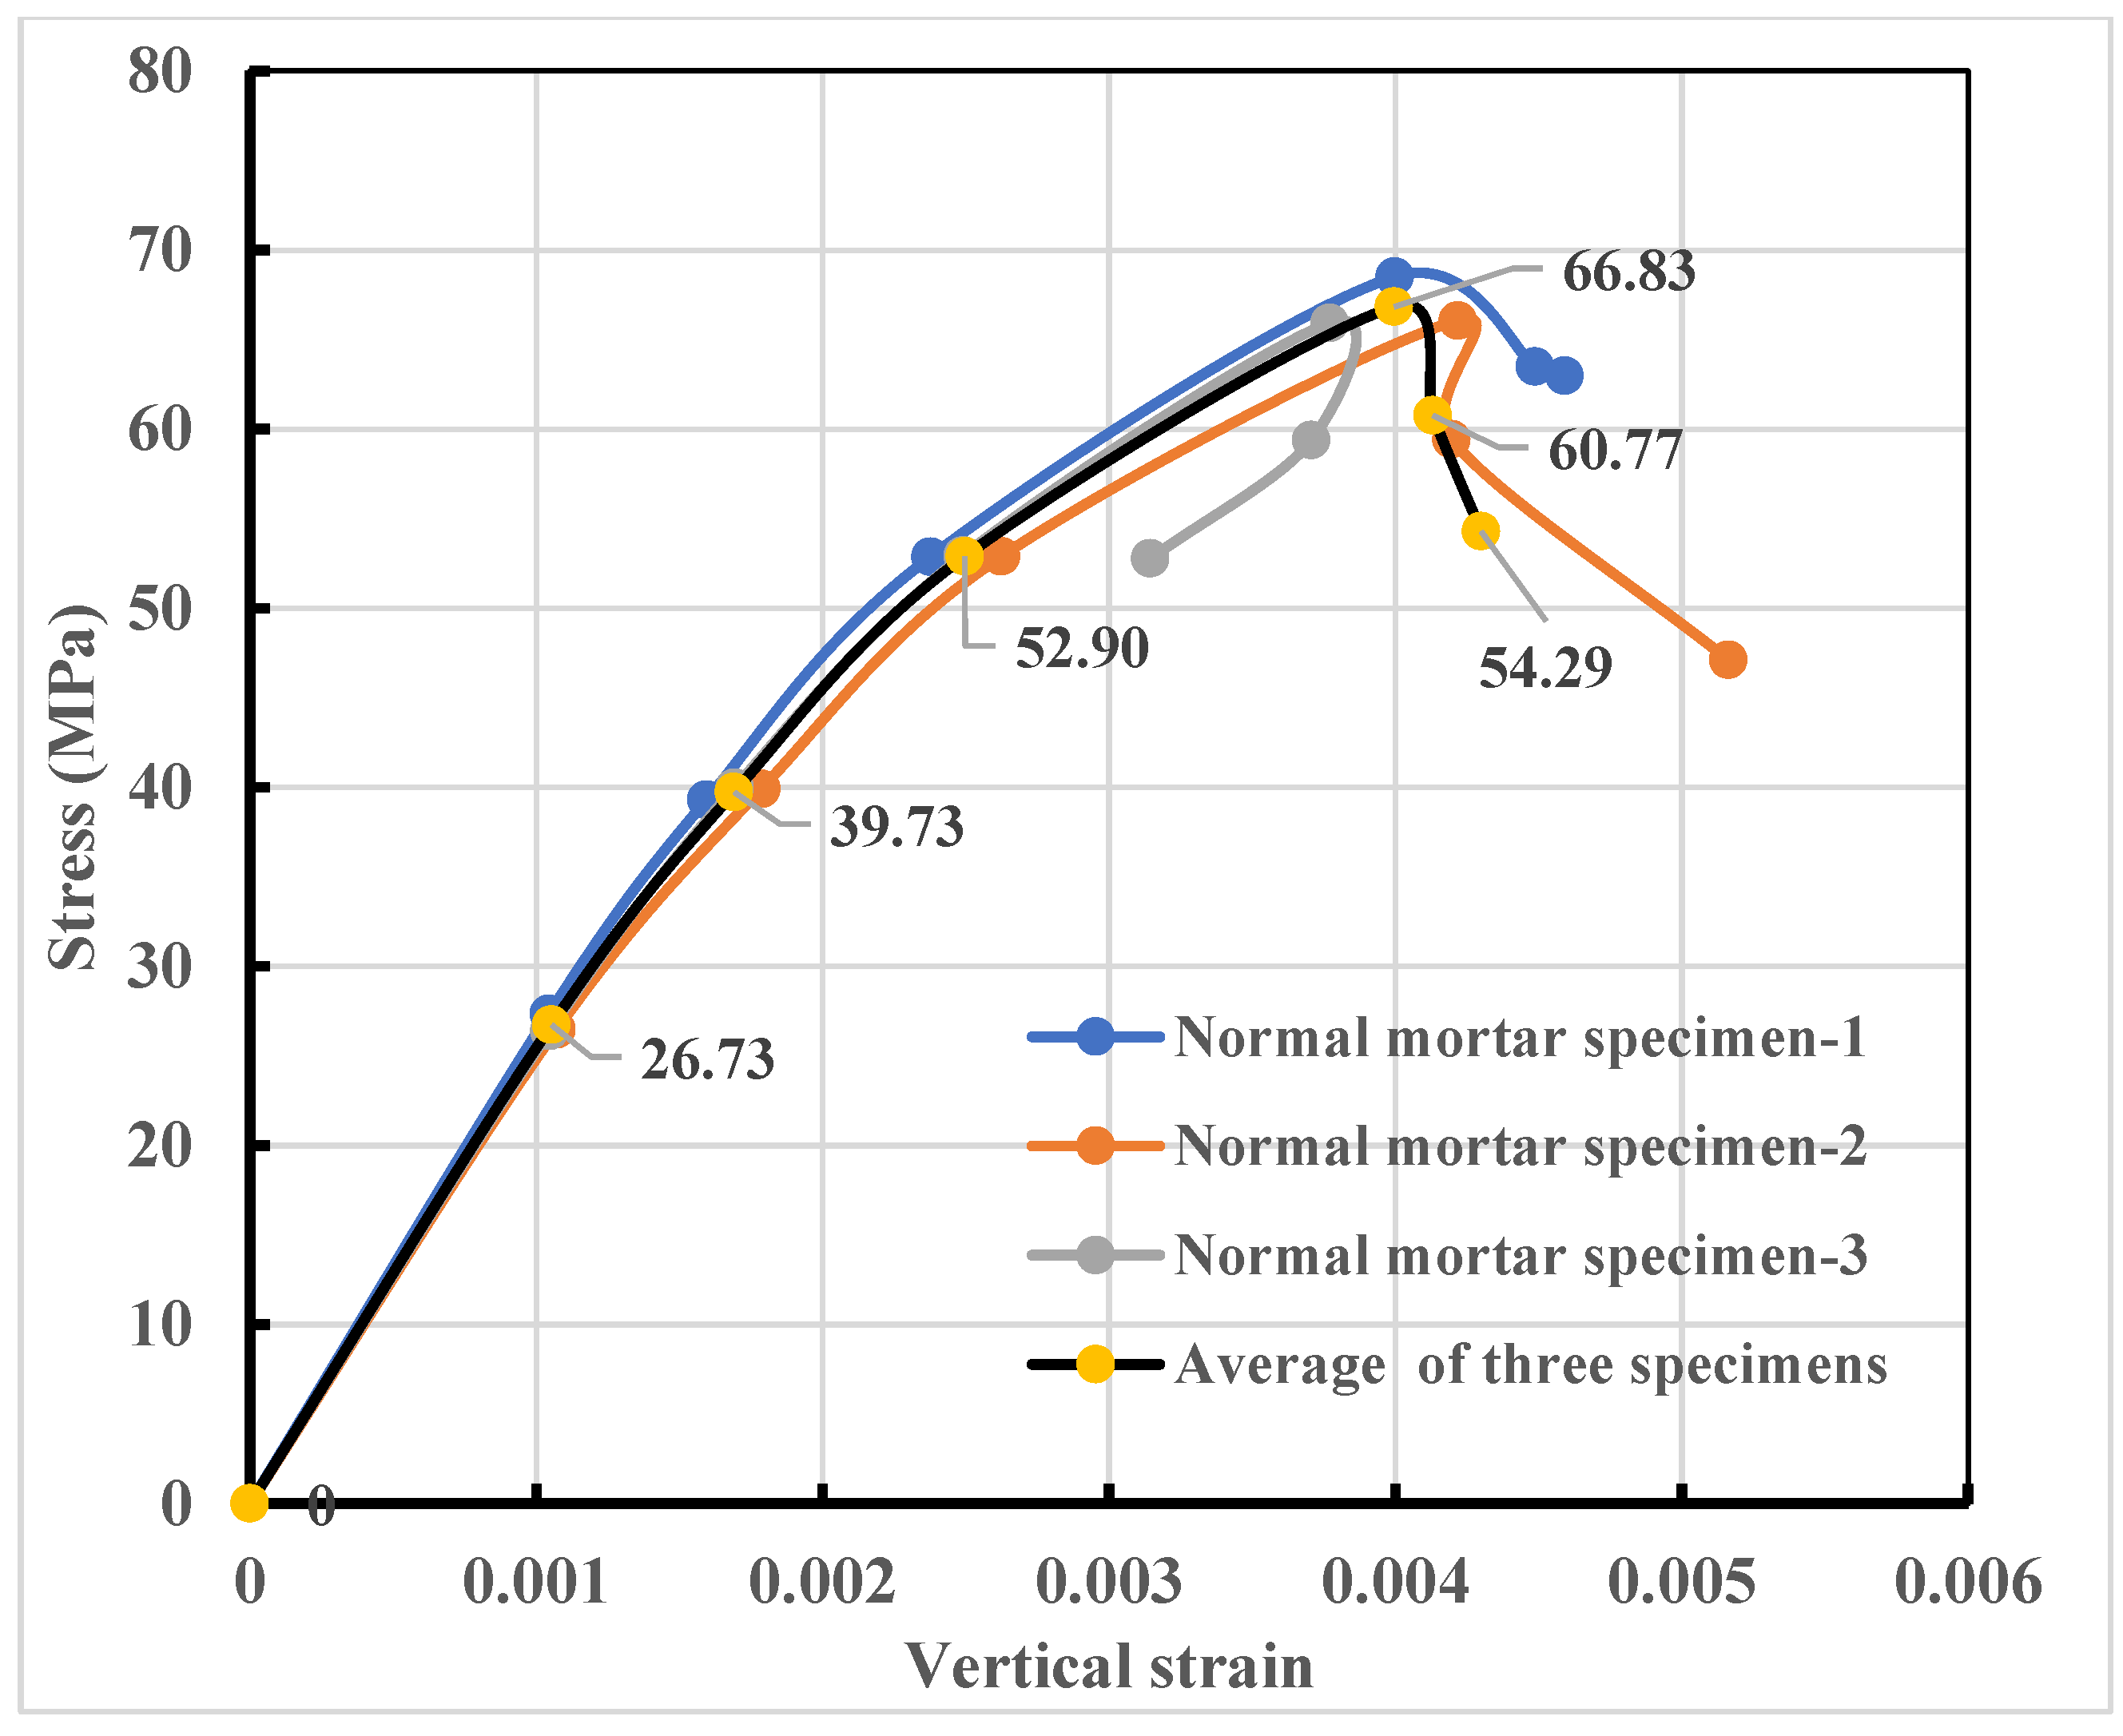
3.1.4. Mechanical Properties of Three-Phase Materials in Rubber Mortar
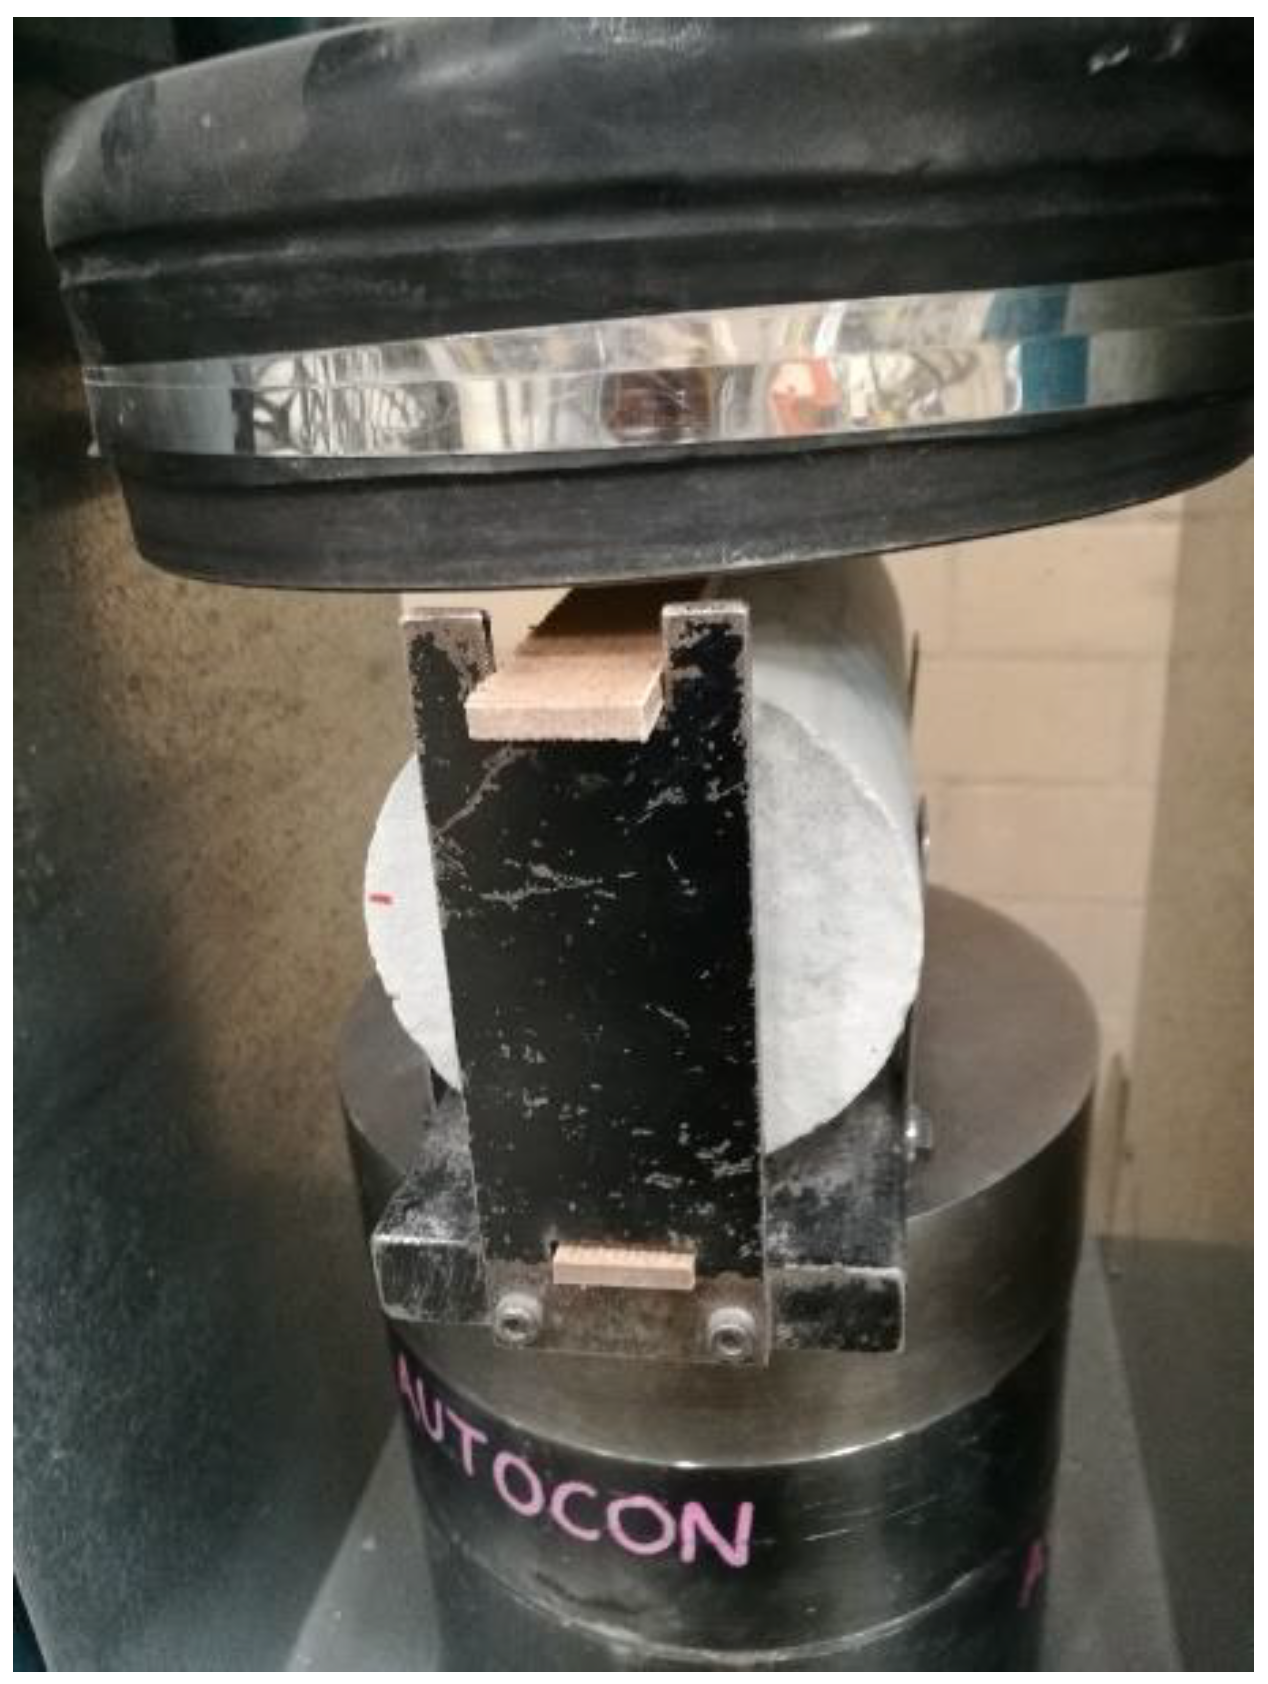
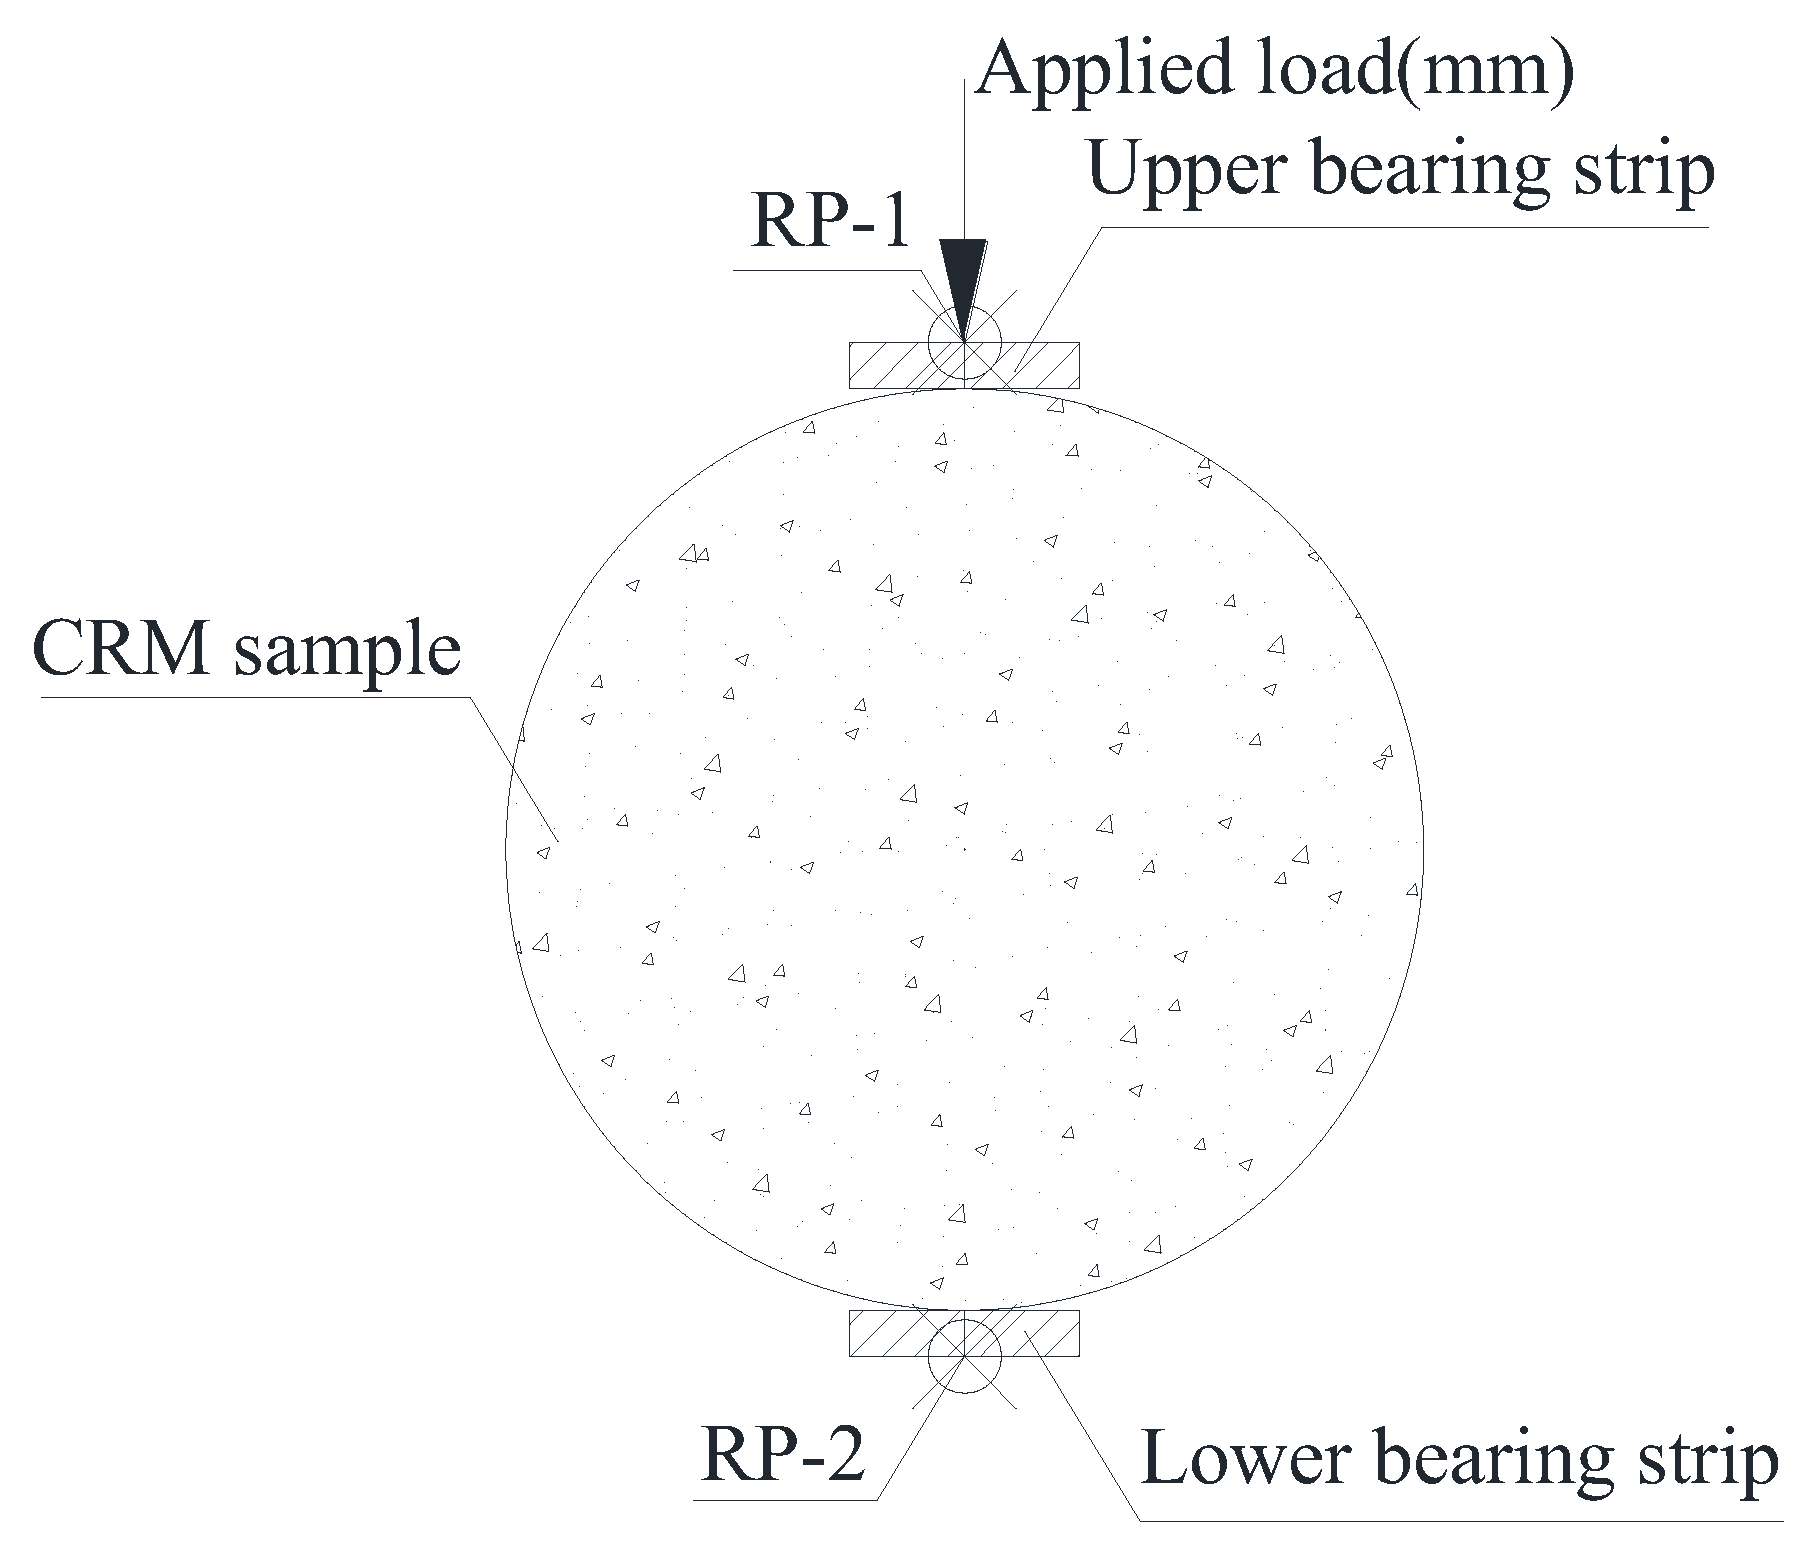
3.1.5. Simulation of Indirect Tensile Test
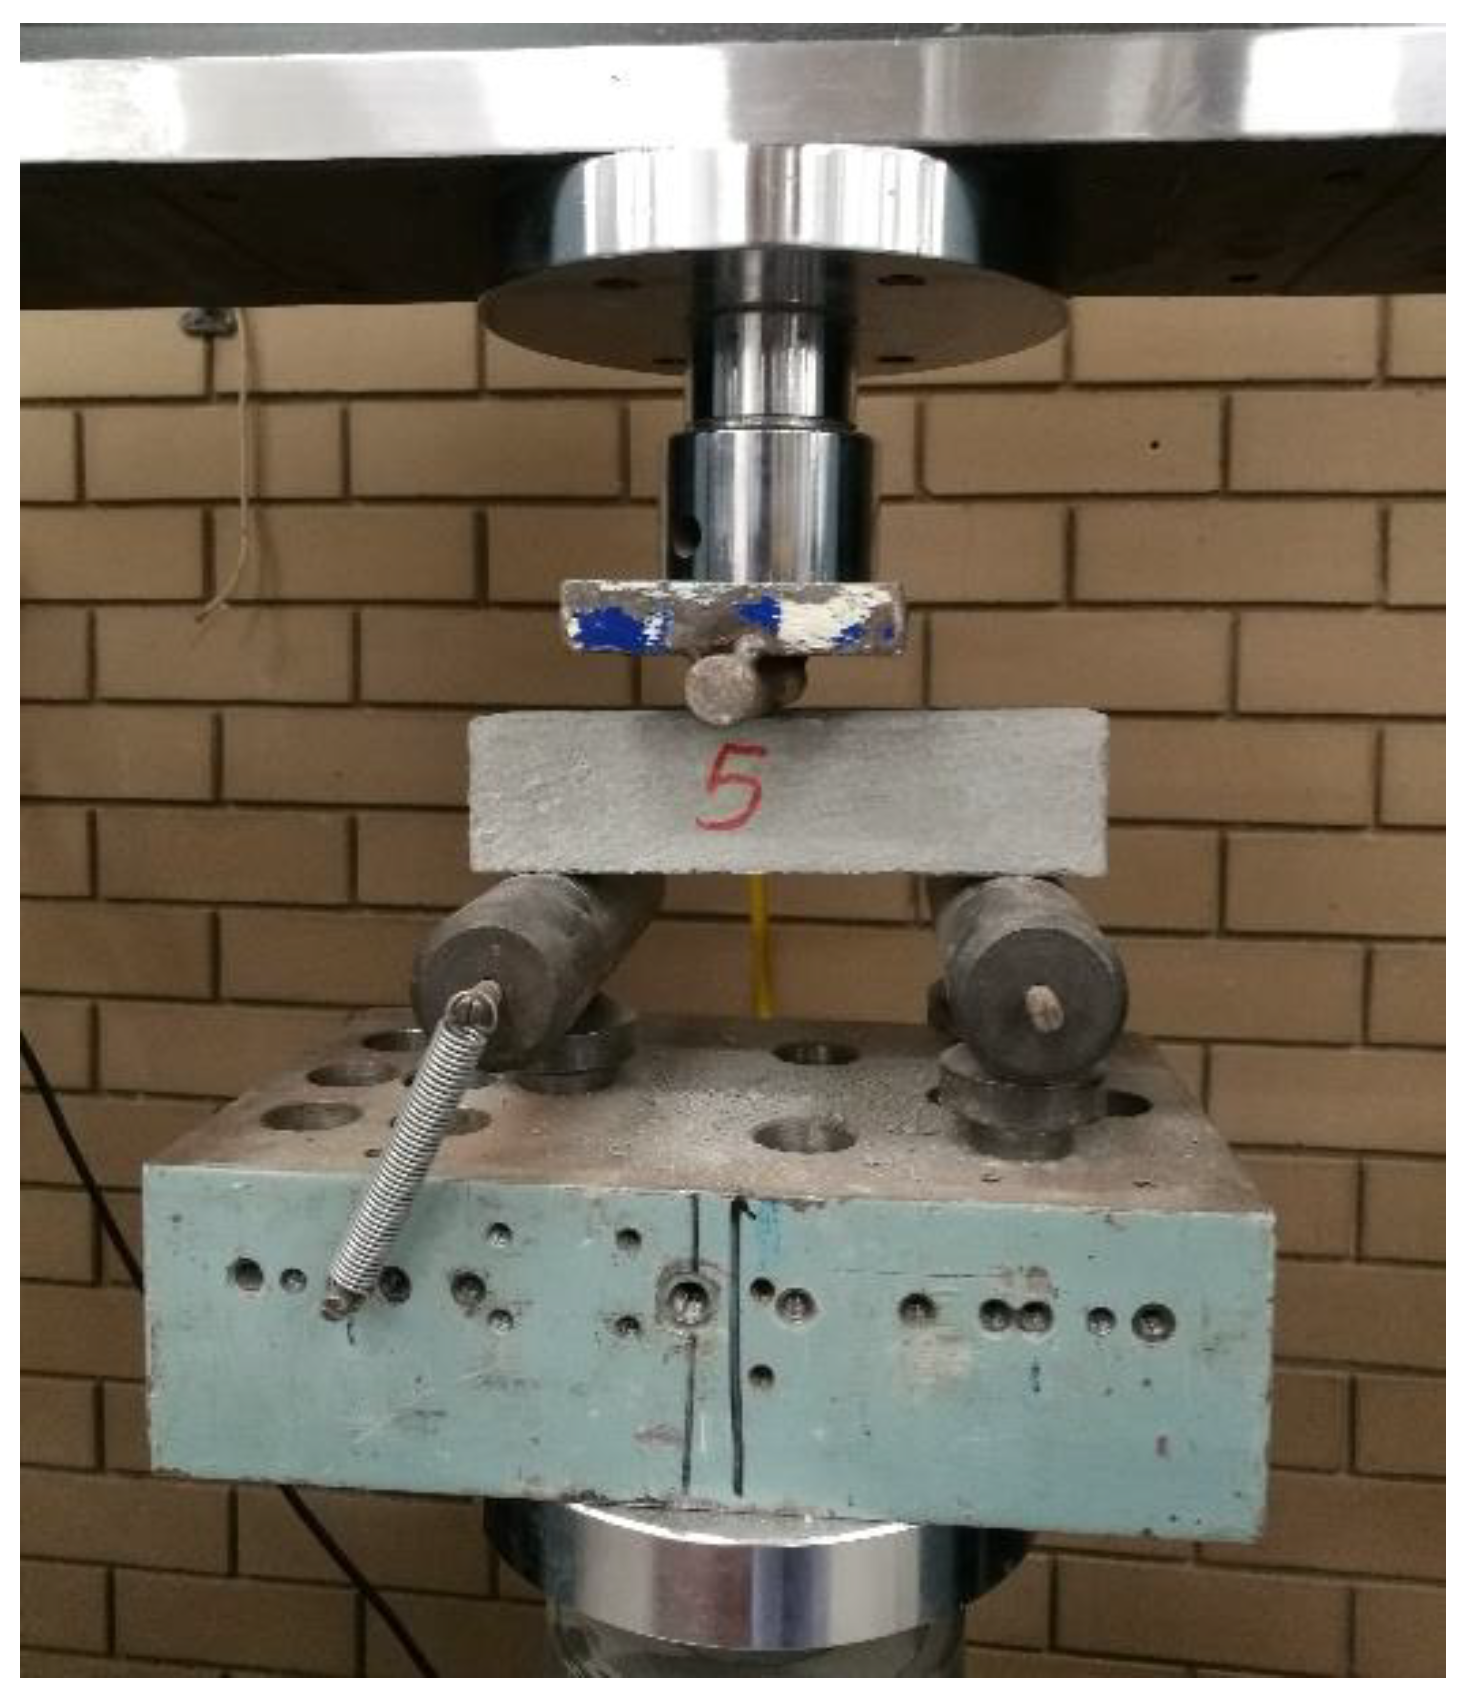
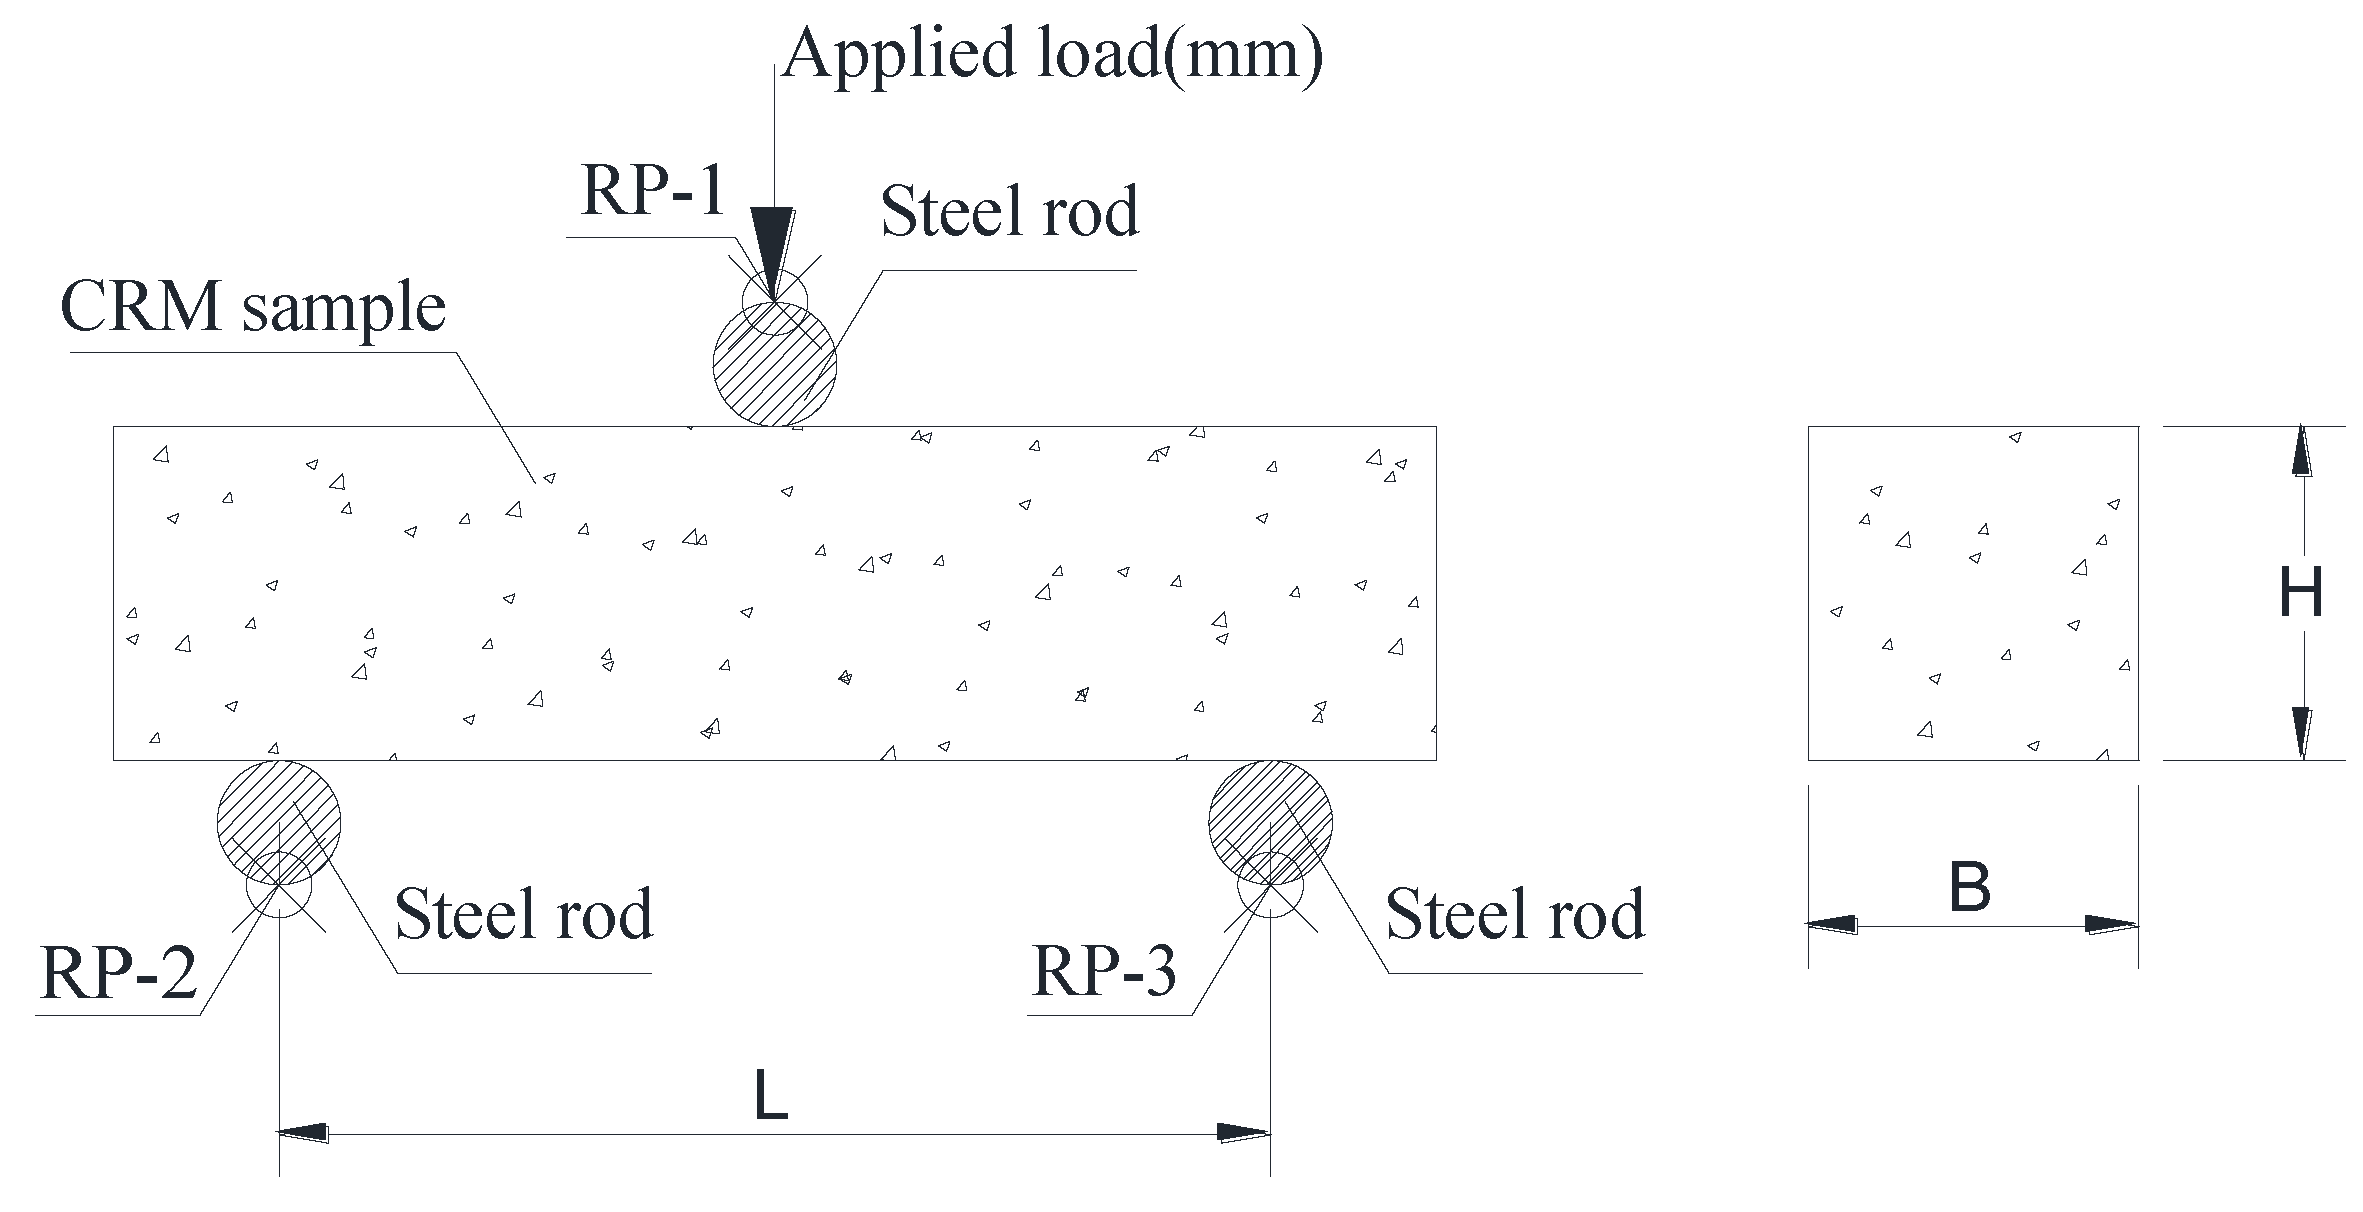
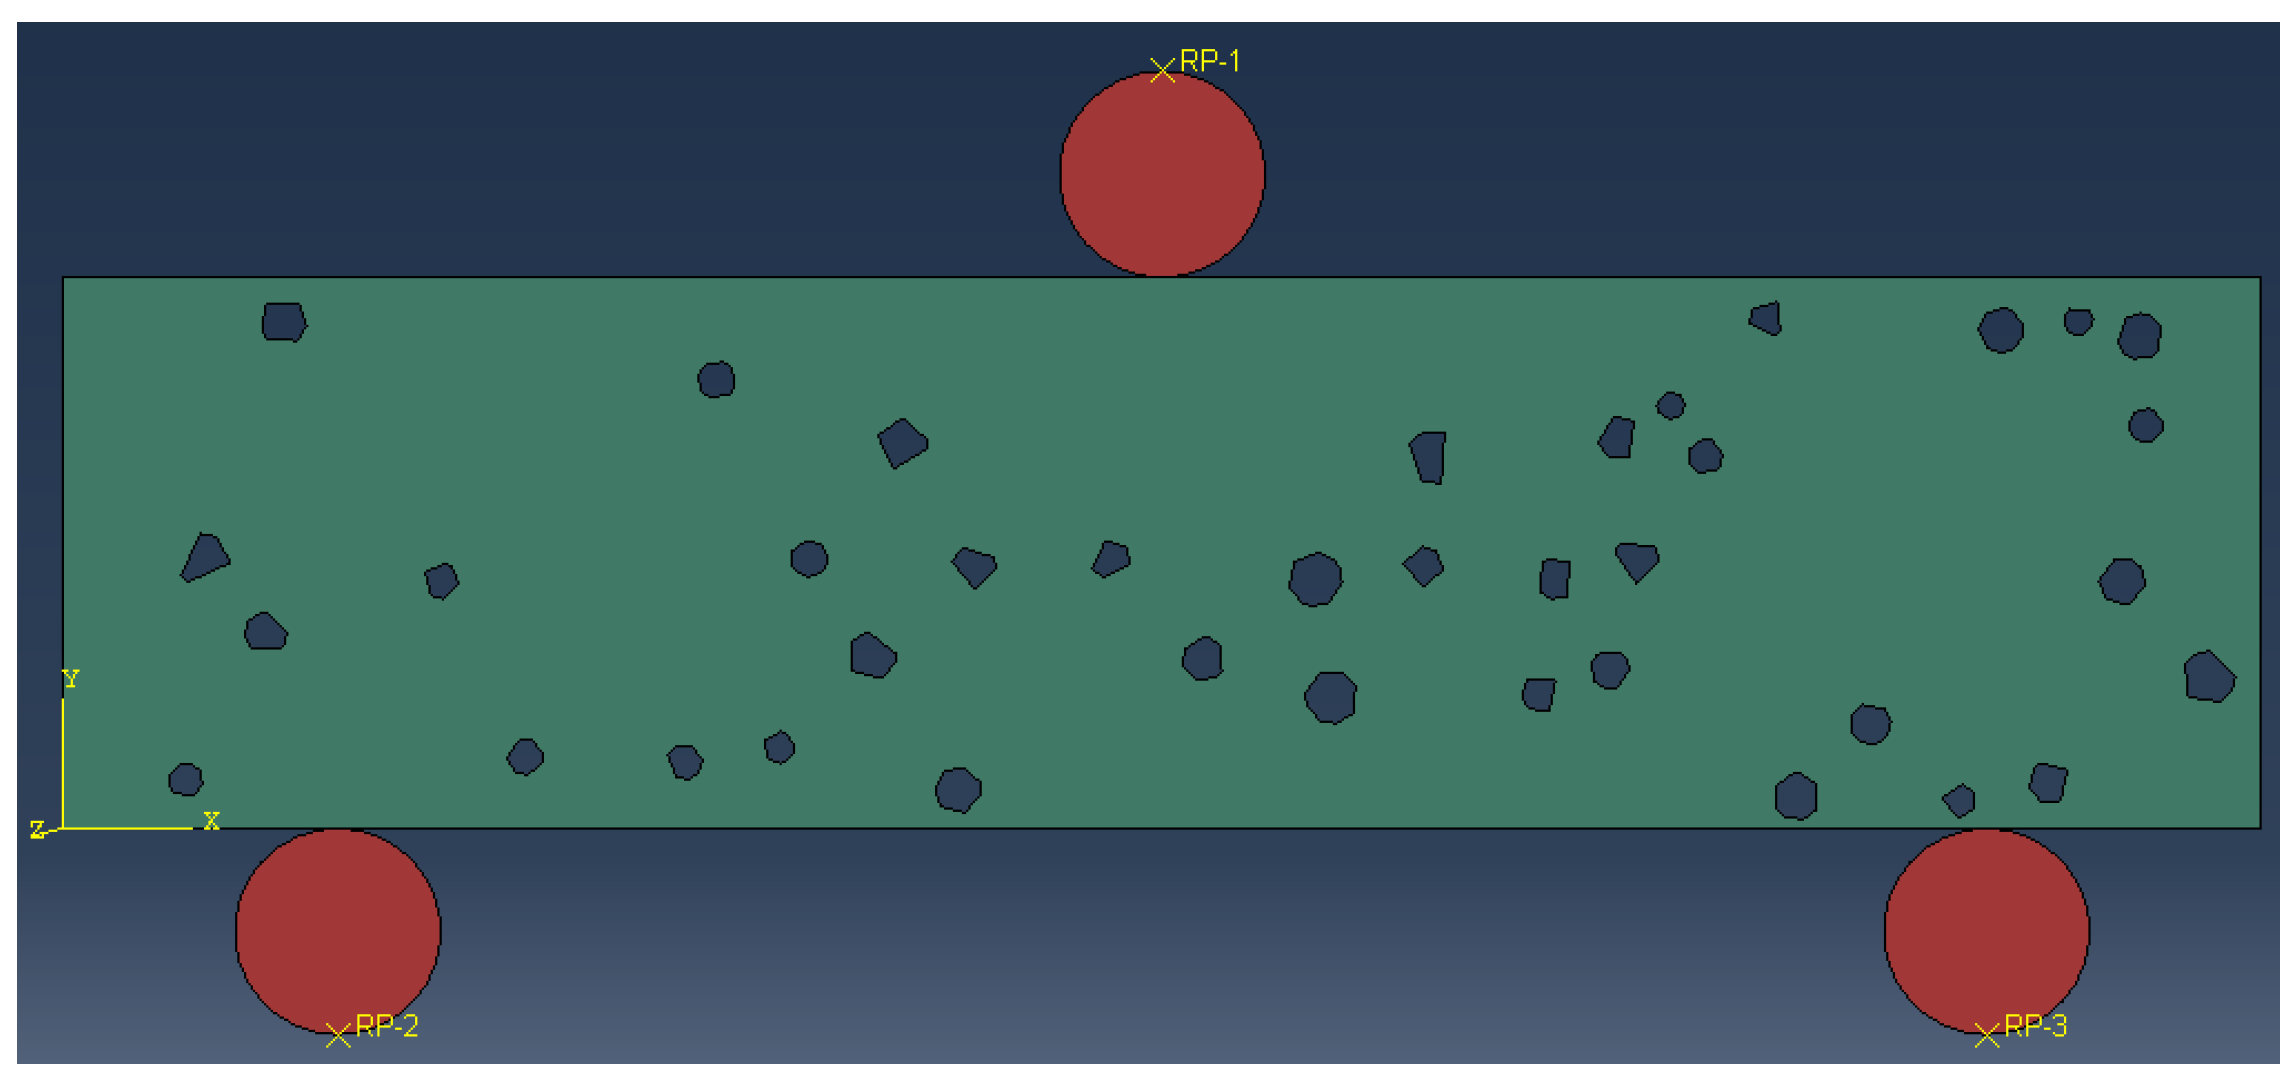
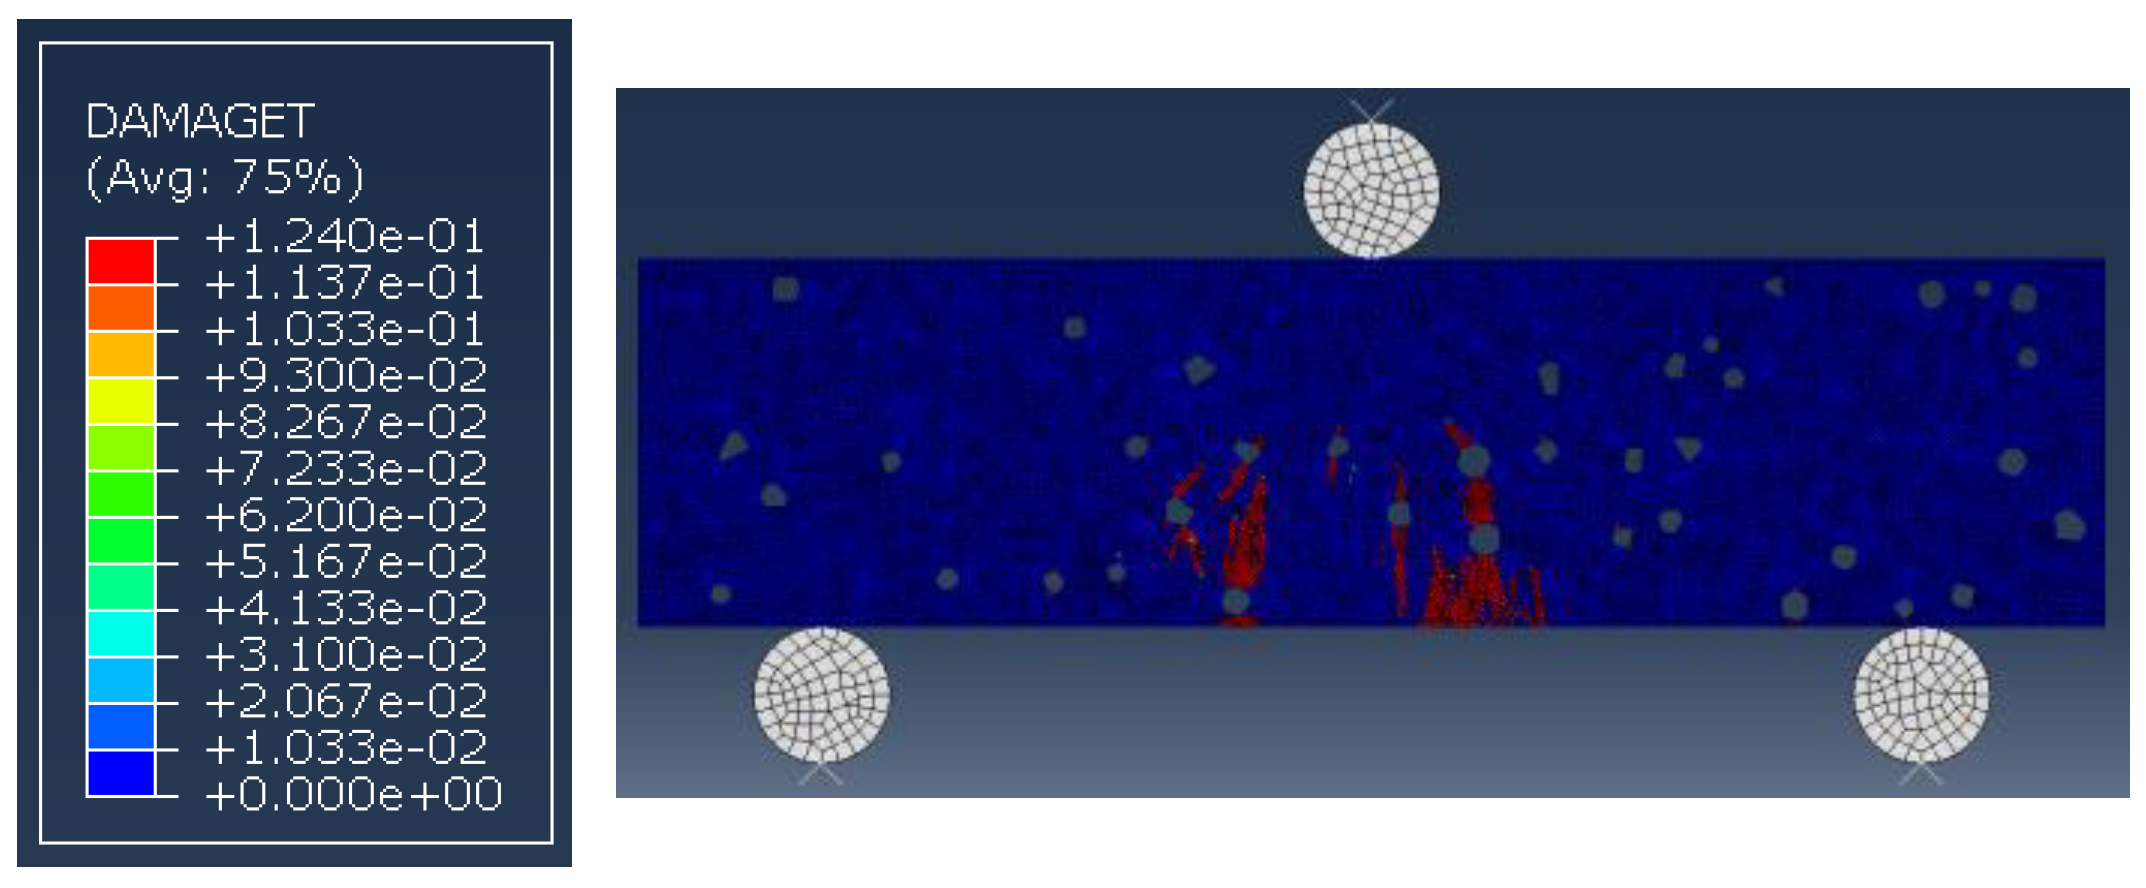
3.1.6. Simulation of Three-Point Flexural Test
3.2. Numerical Analysis of Influencing Factors of Indirect Tensile Strength
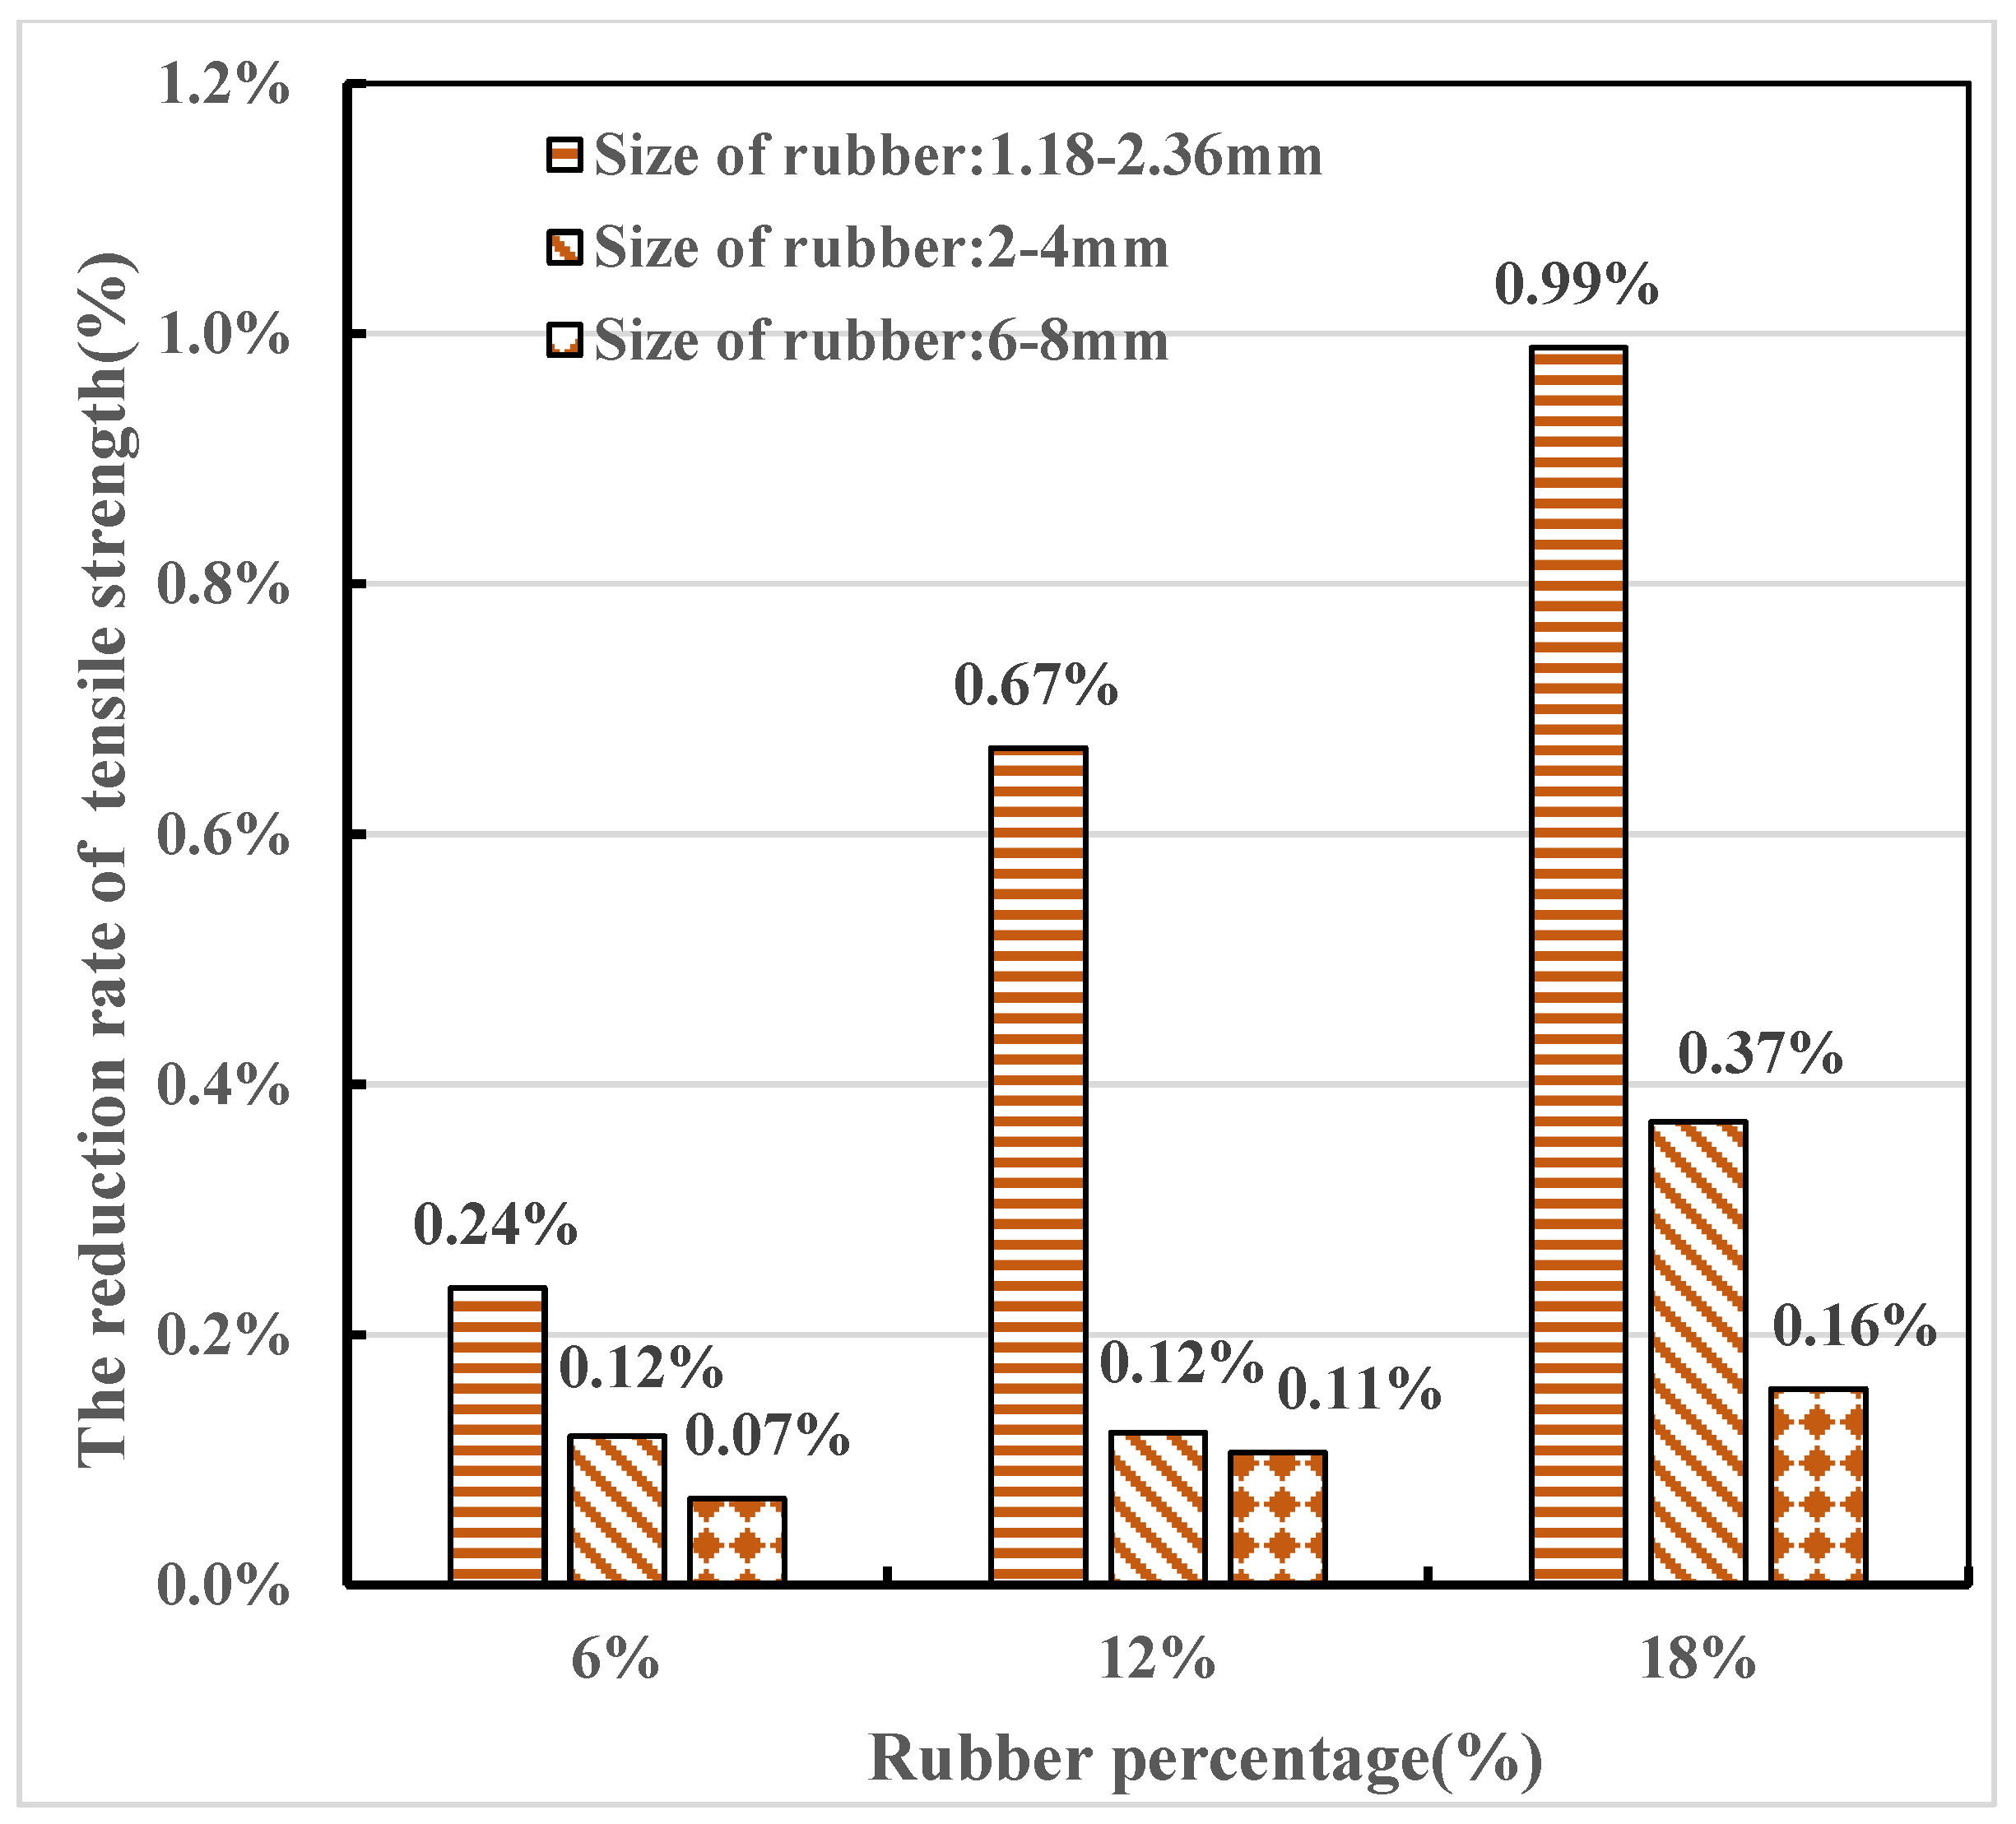
3.2.1. The Influence of the Presence of ITZ
3.2.2. The Influence of Rubber Aggregate Distributions
3.2.3. The Influence of Mortar Matrix Strength
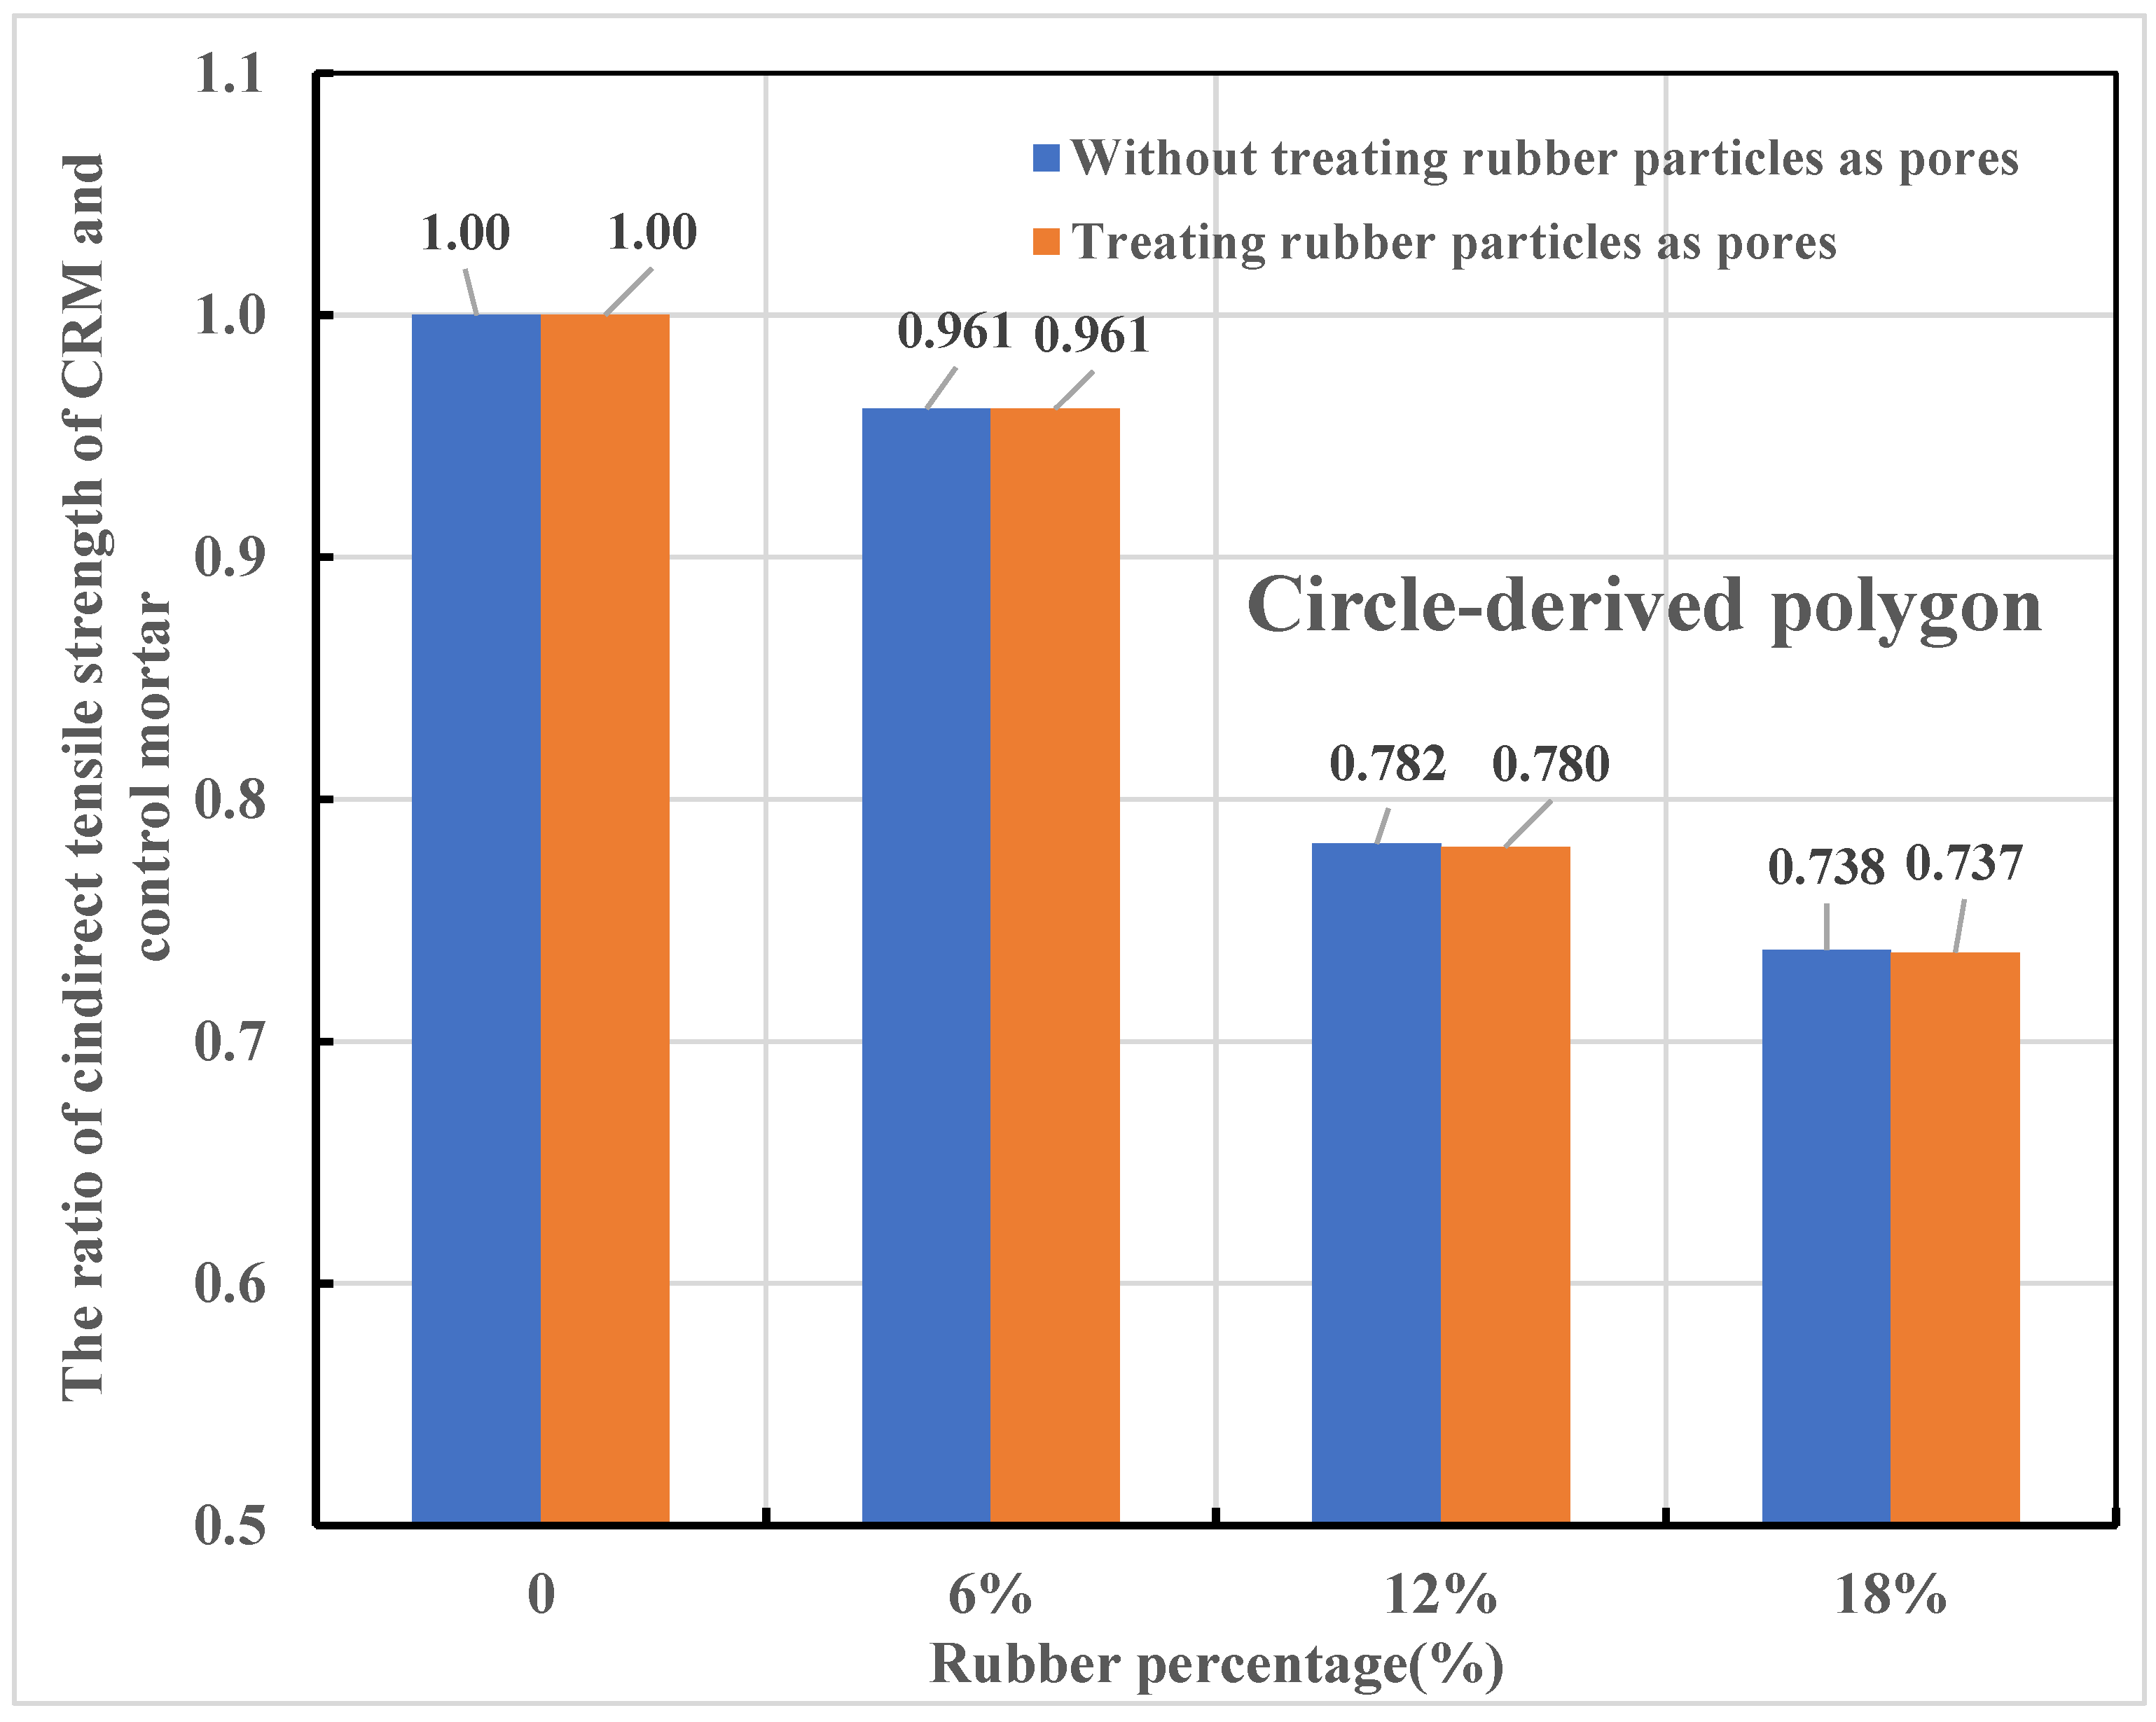
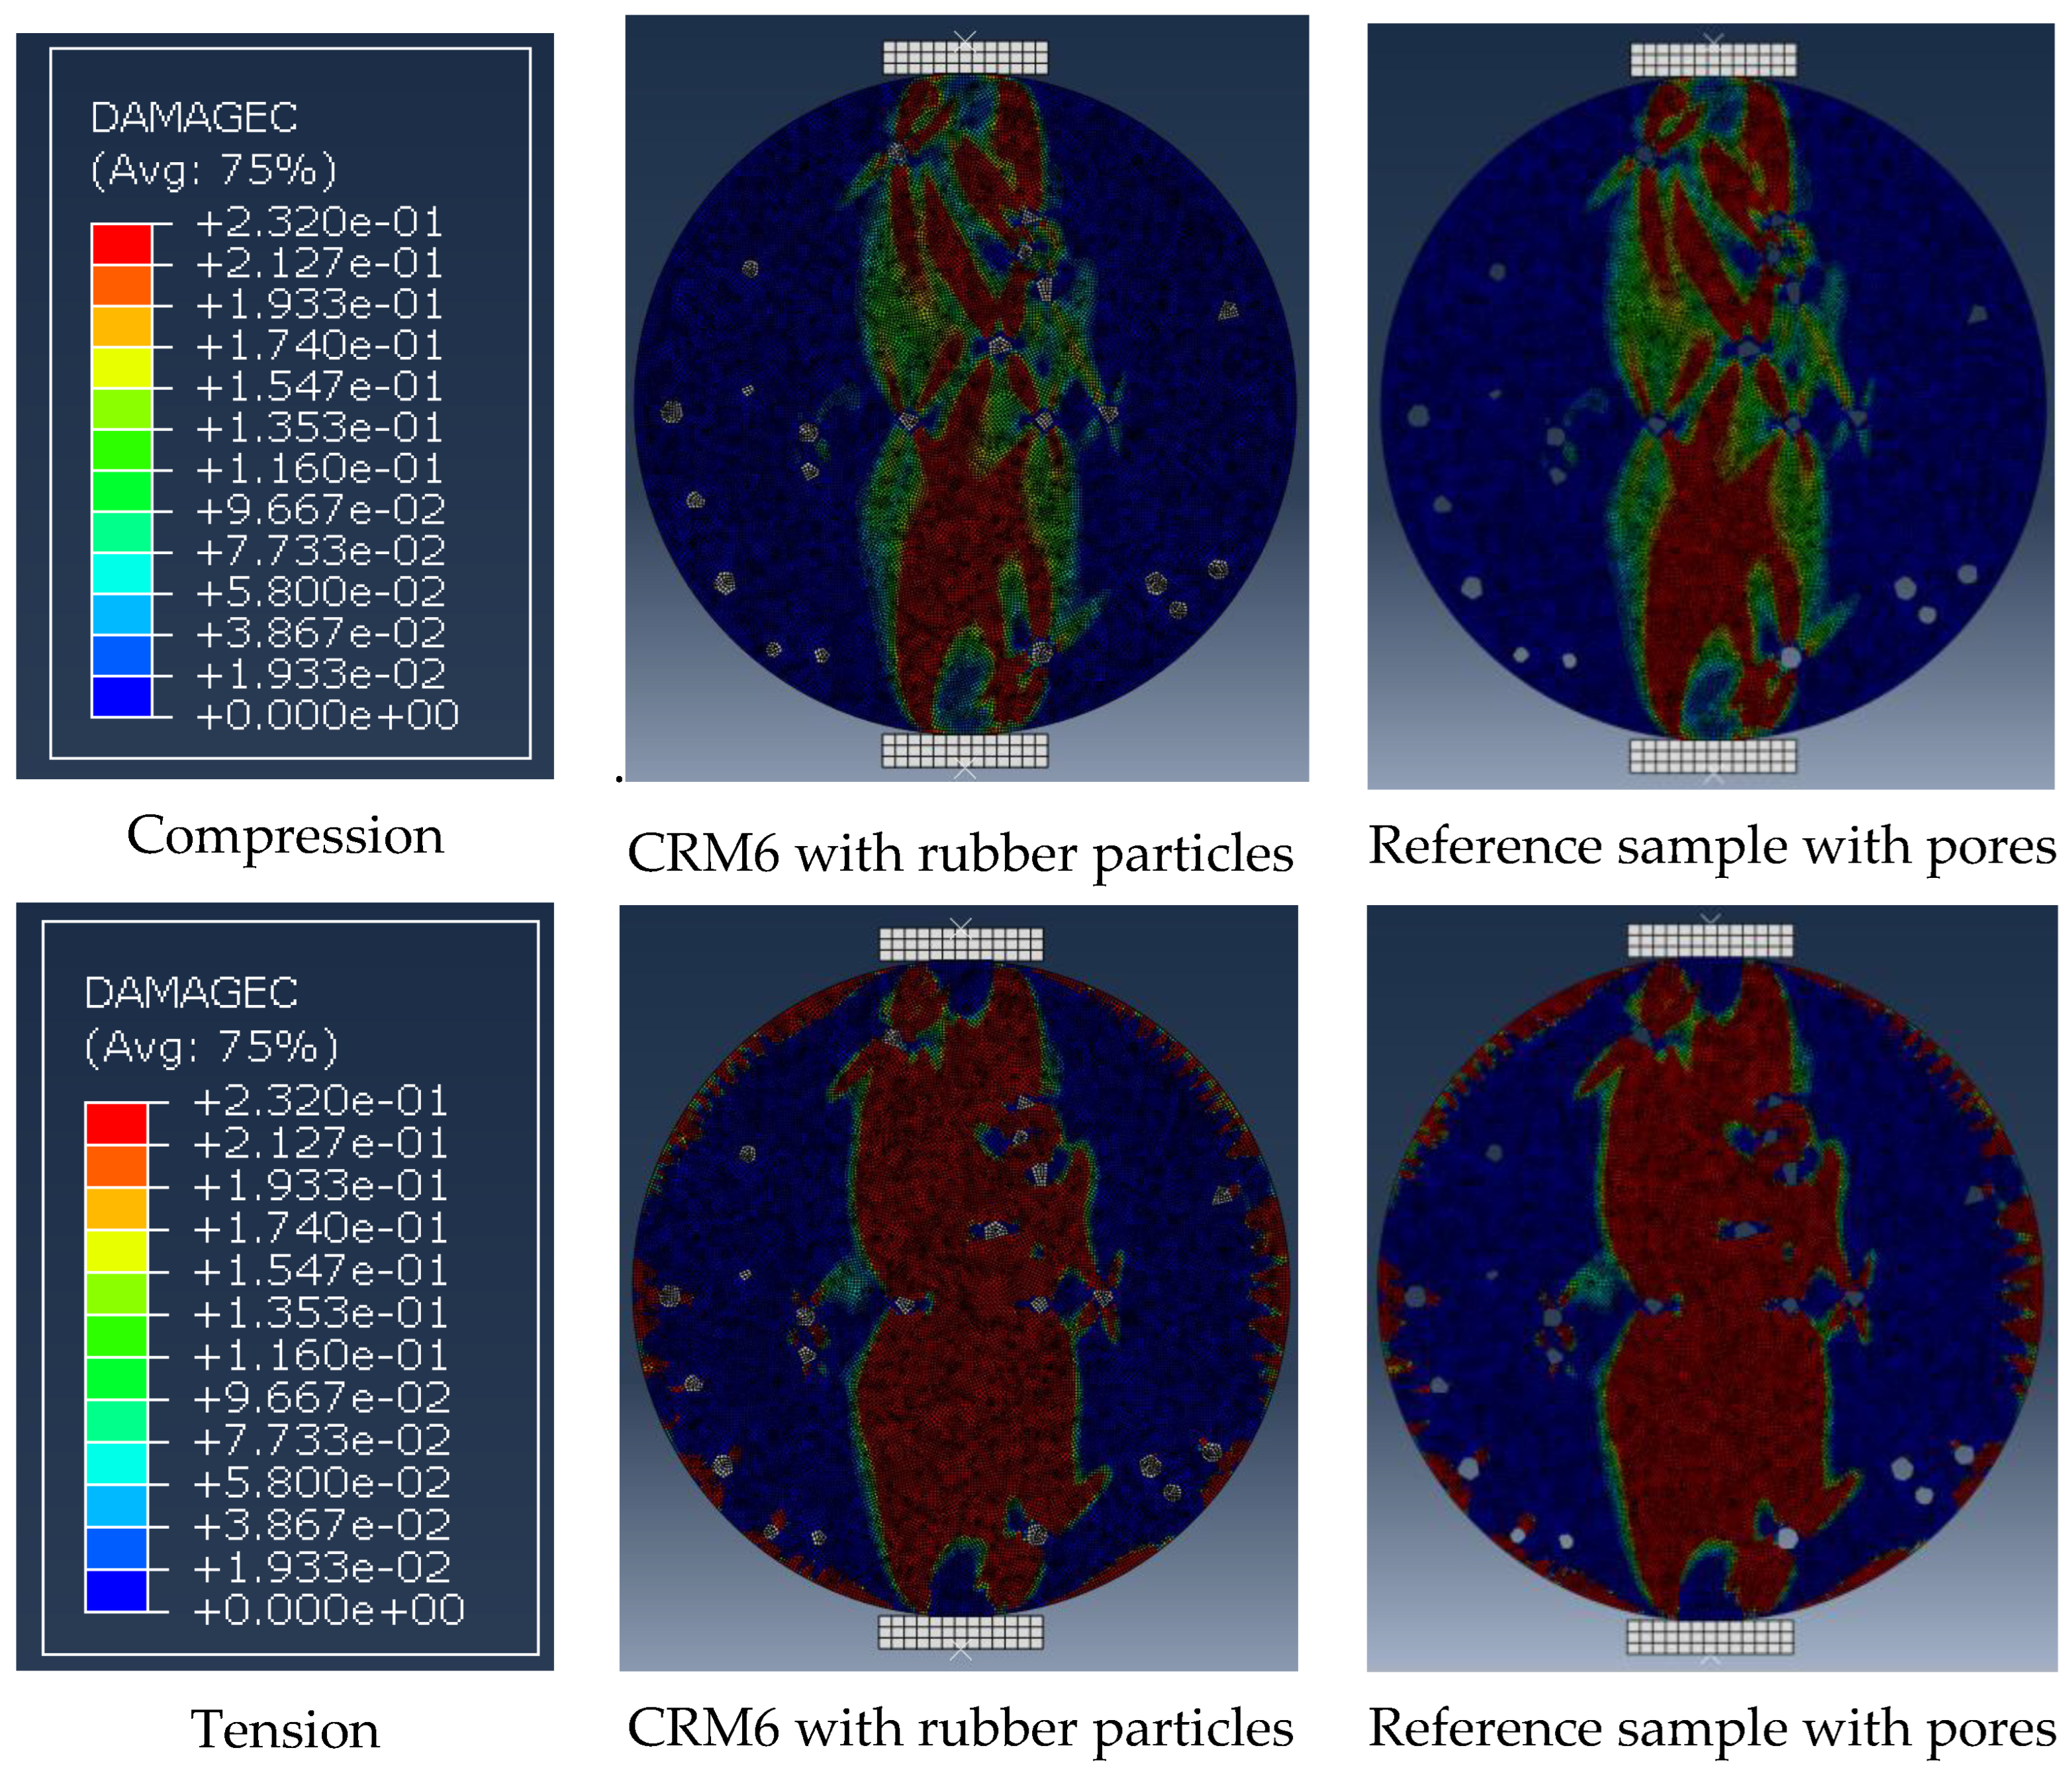
3.2.4. The Influence of Treating Rubber Particles as Pores
3.2.5. Numerical Analysis Summary
4. Mesoscale Model Applications and Validation
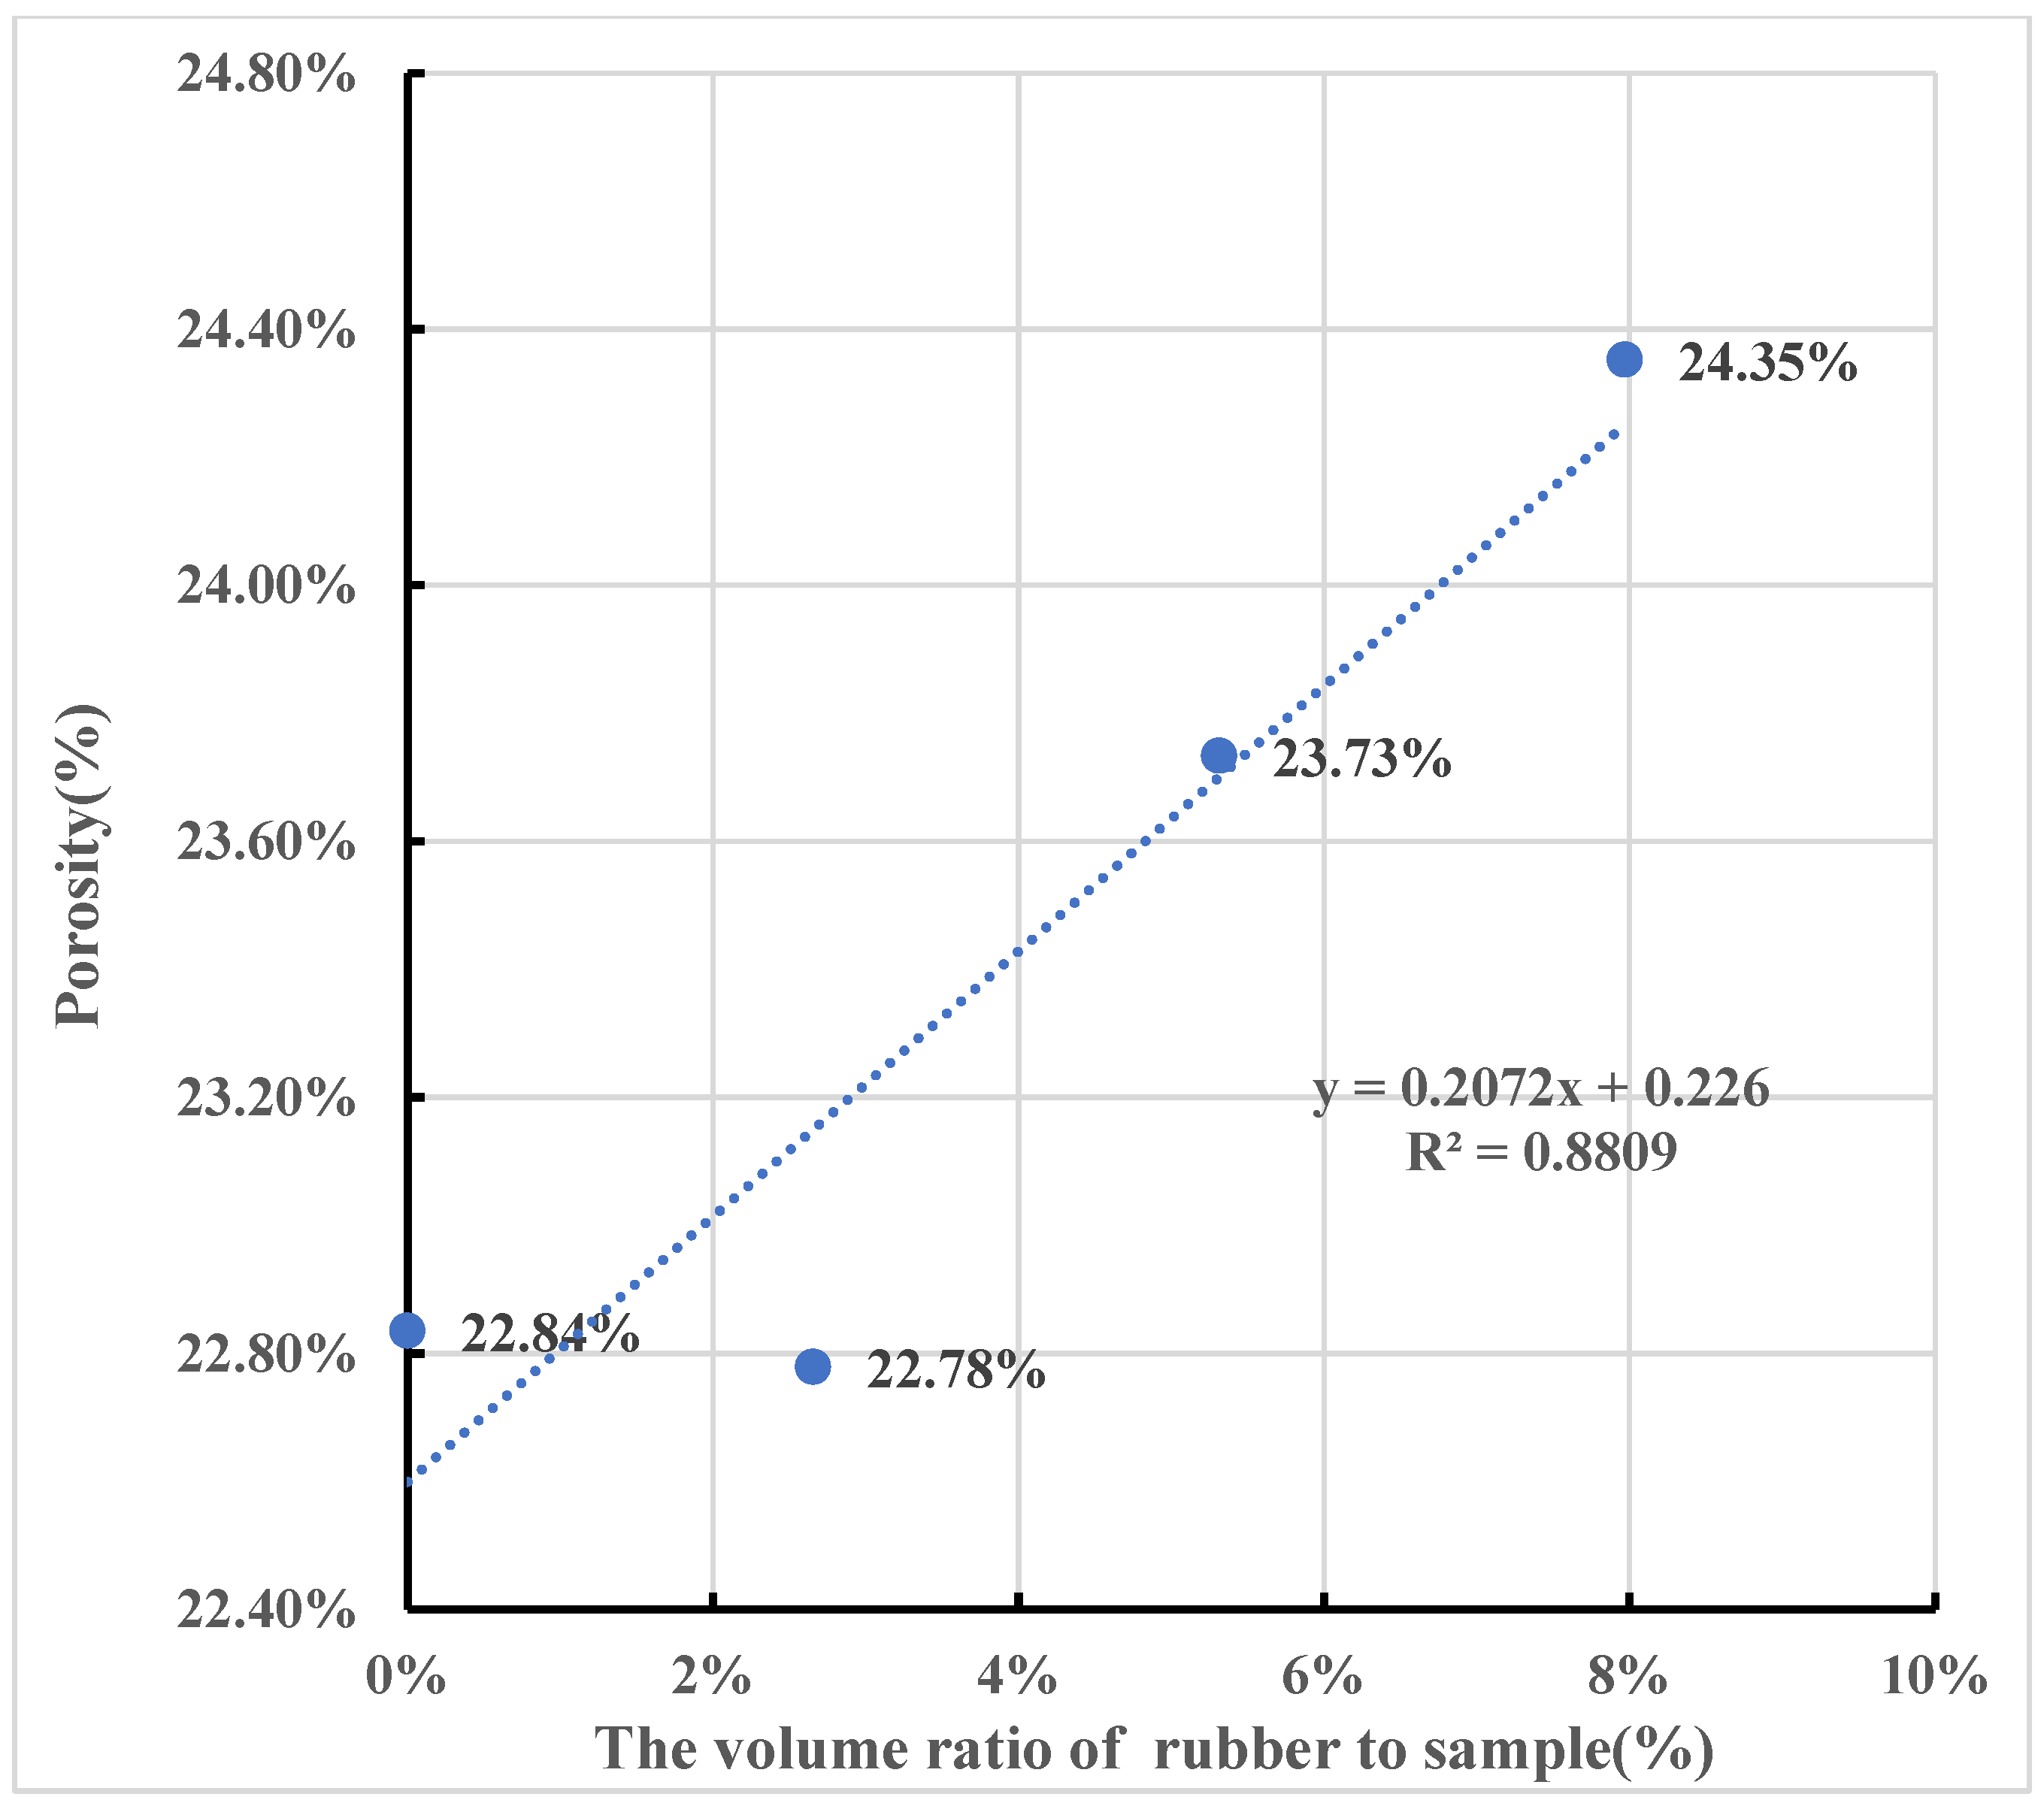
4.1. A Pore-Based Mesoscale Model for Predicting the Tensile Strength of CRM
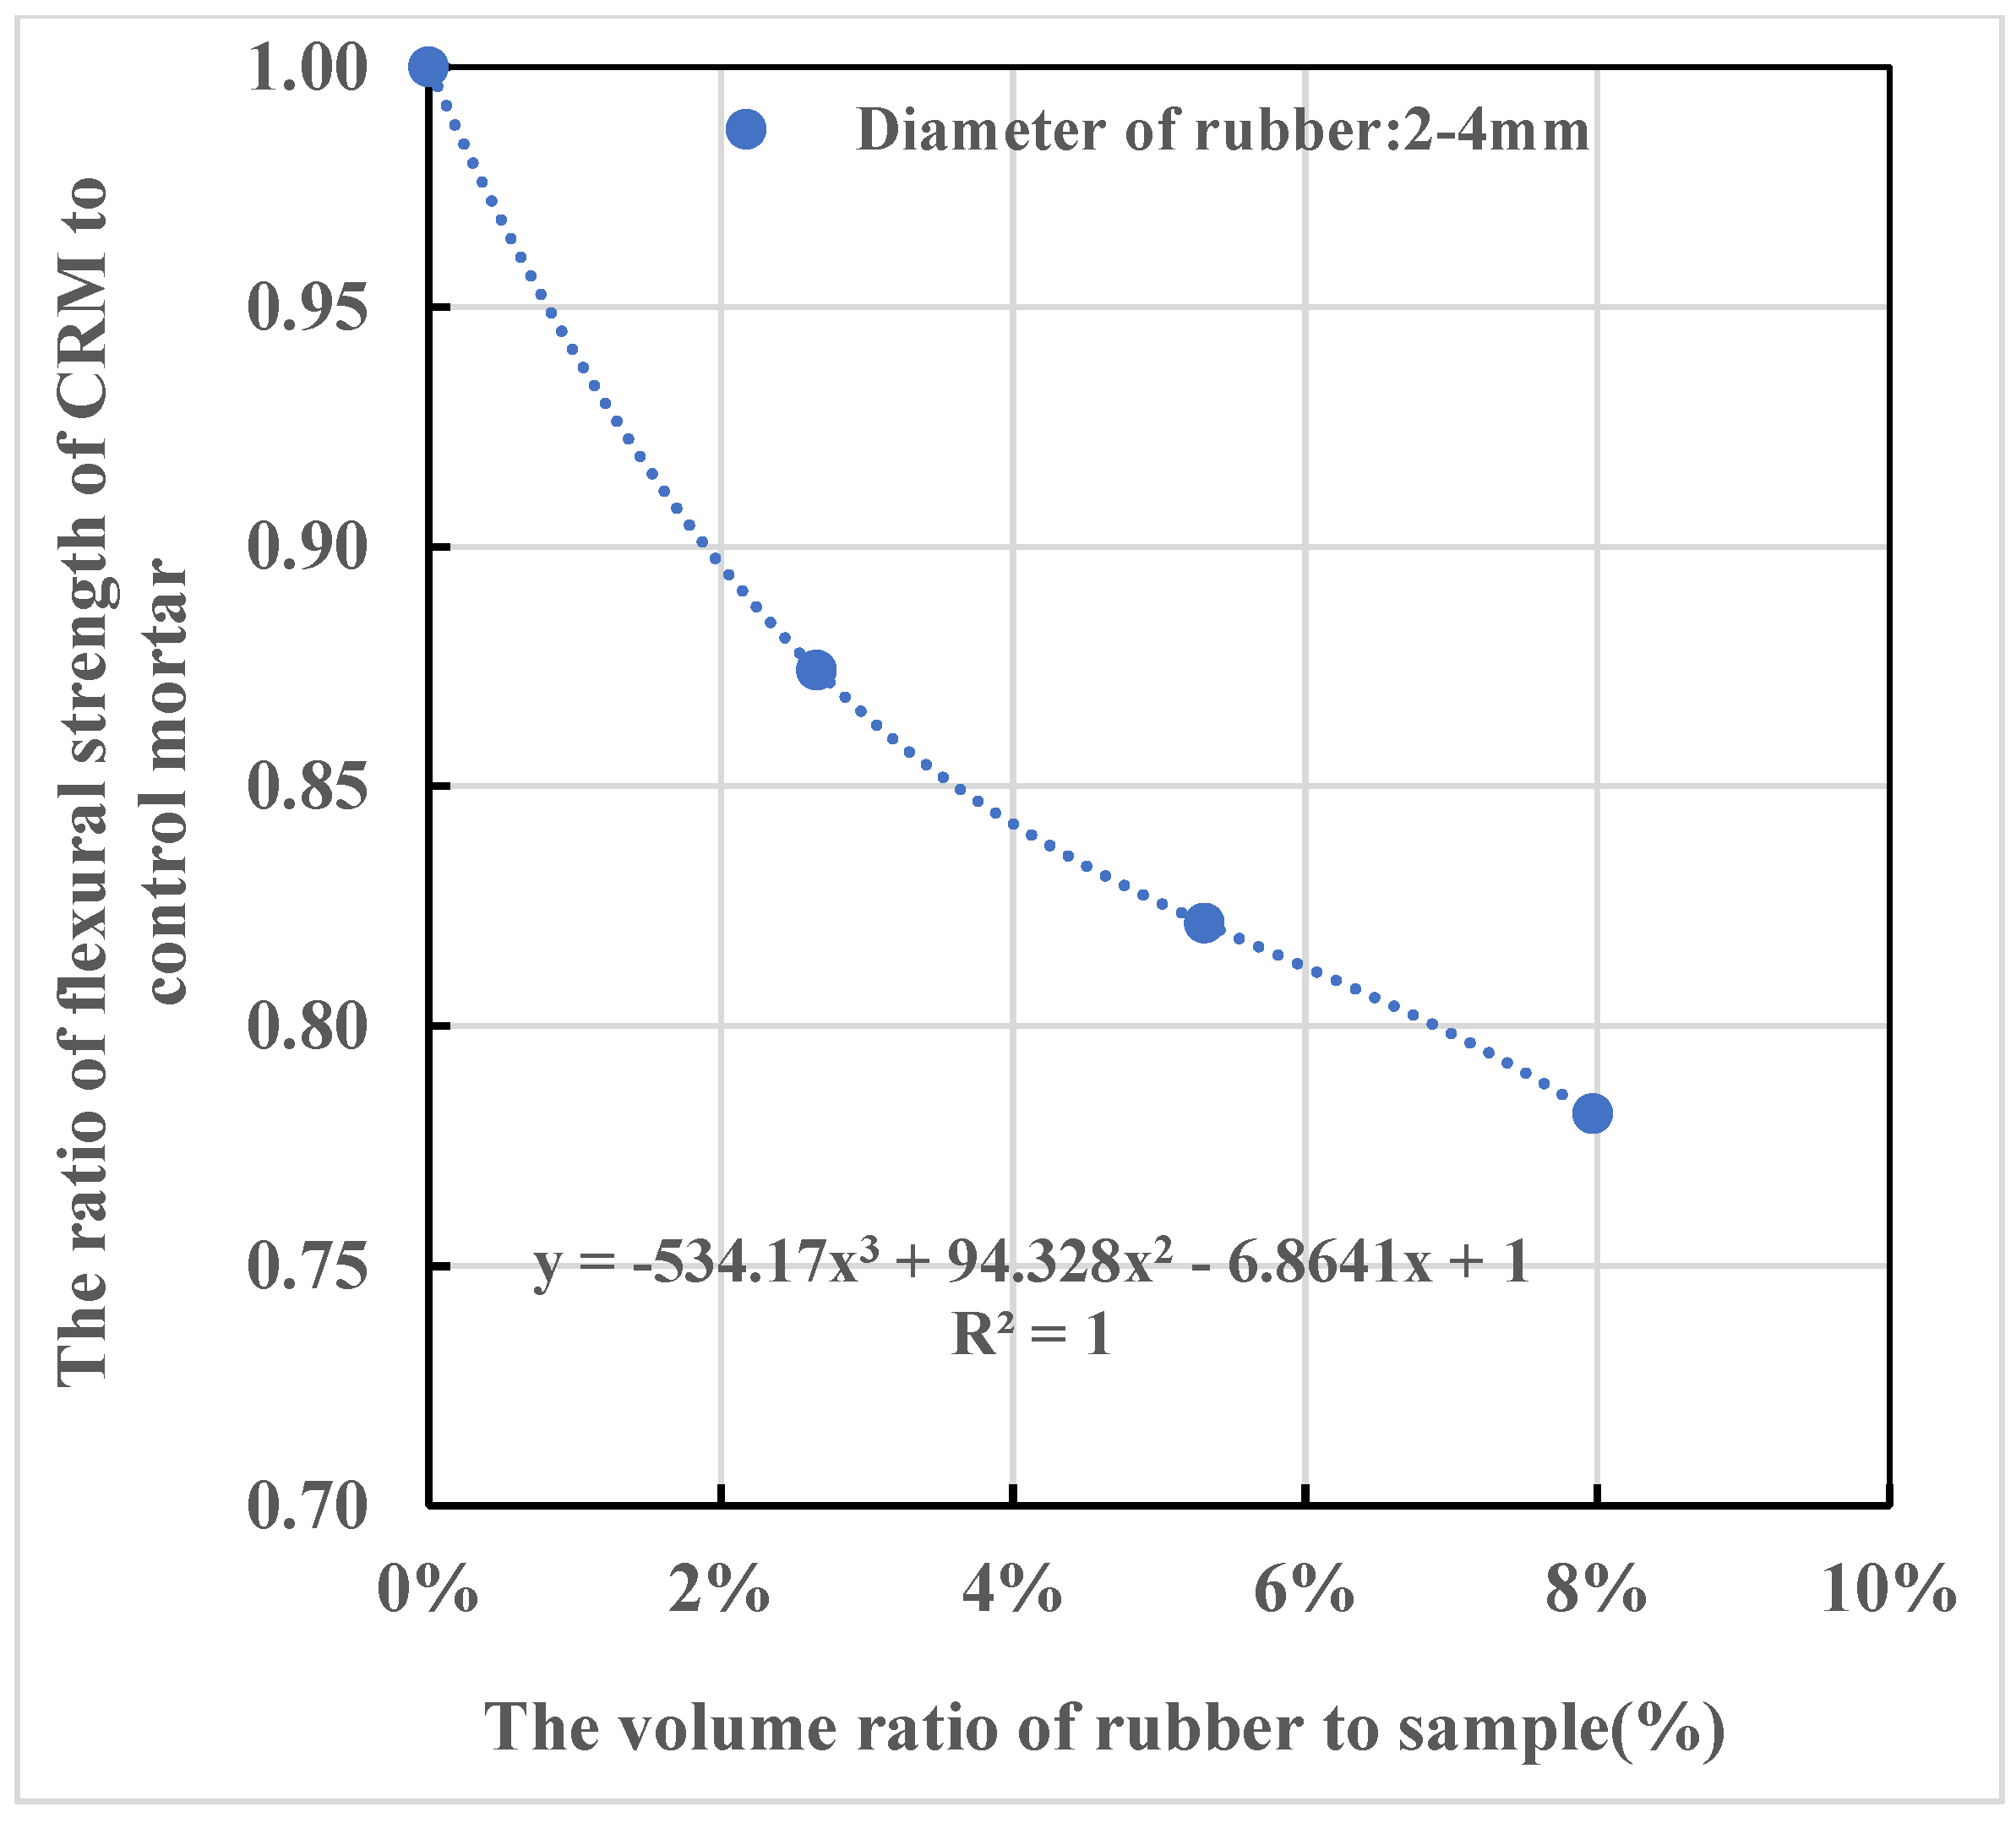
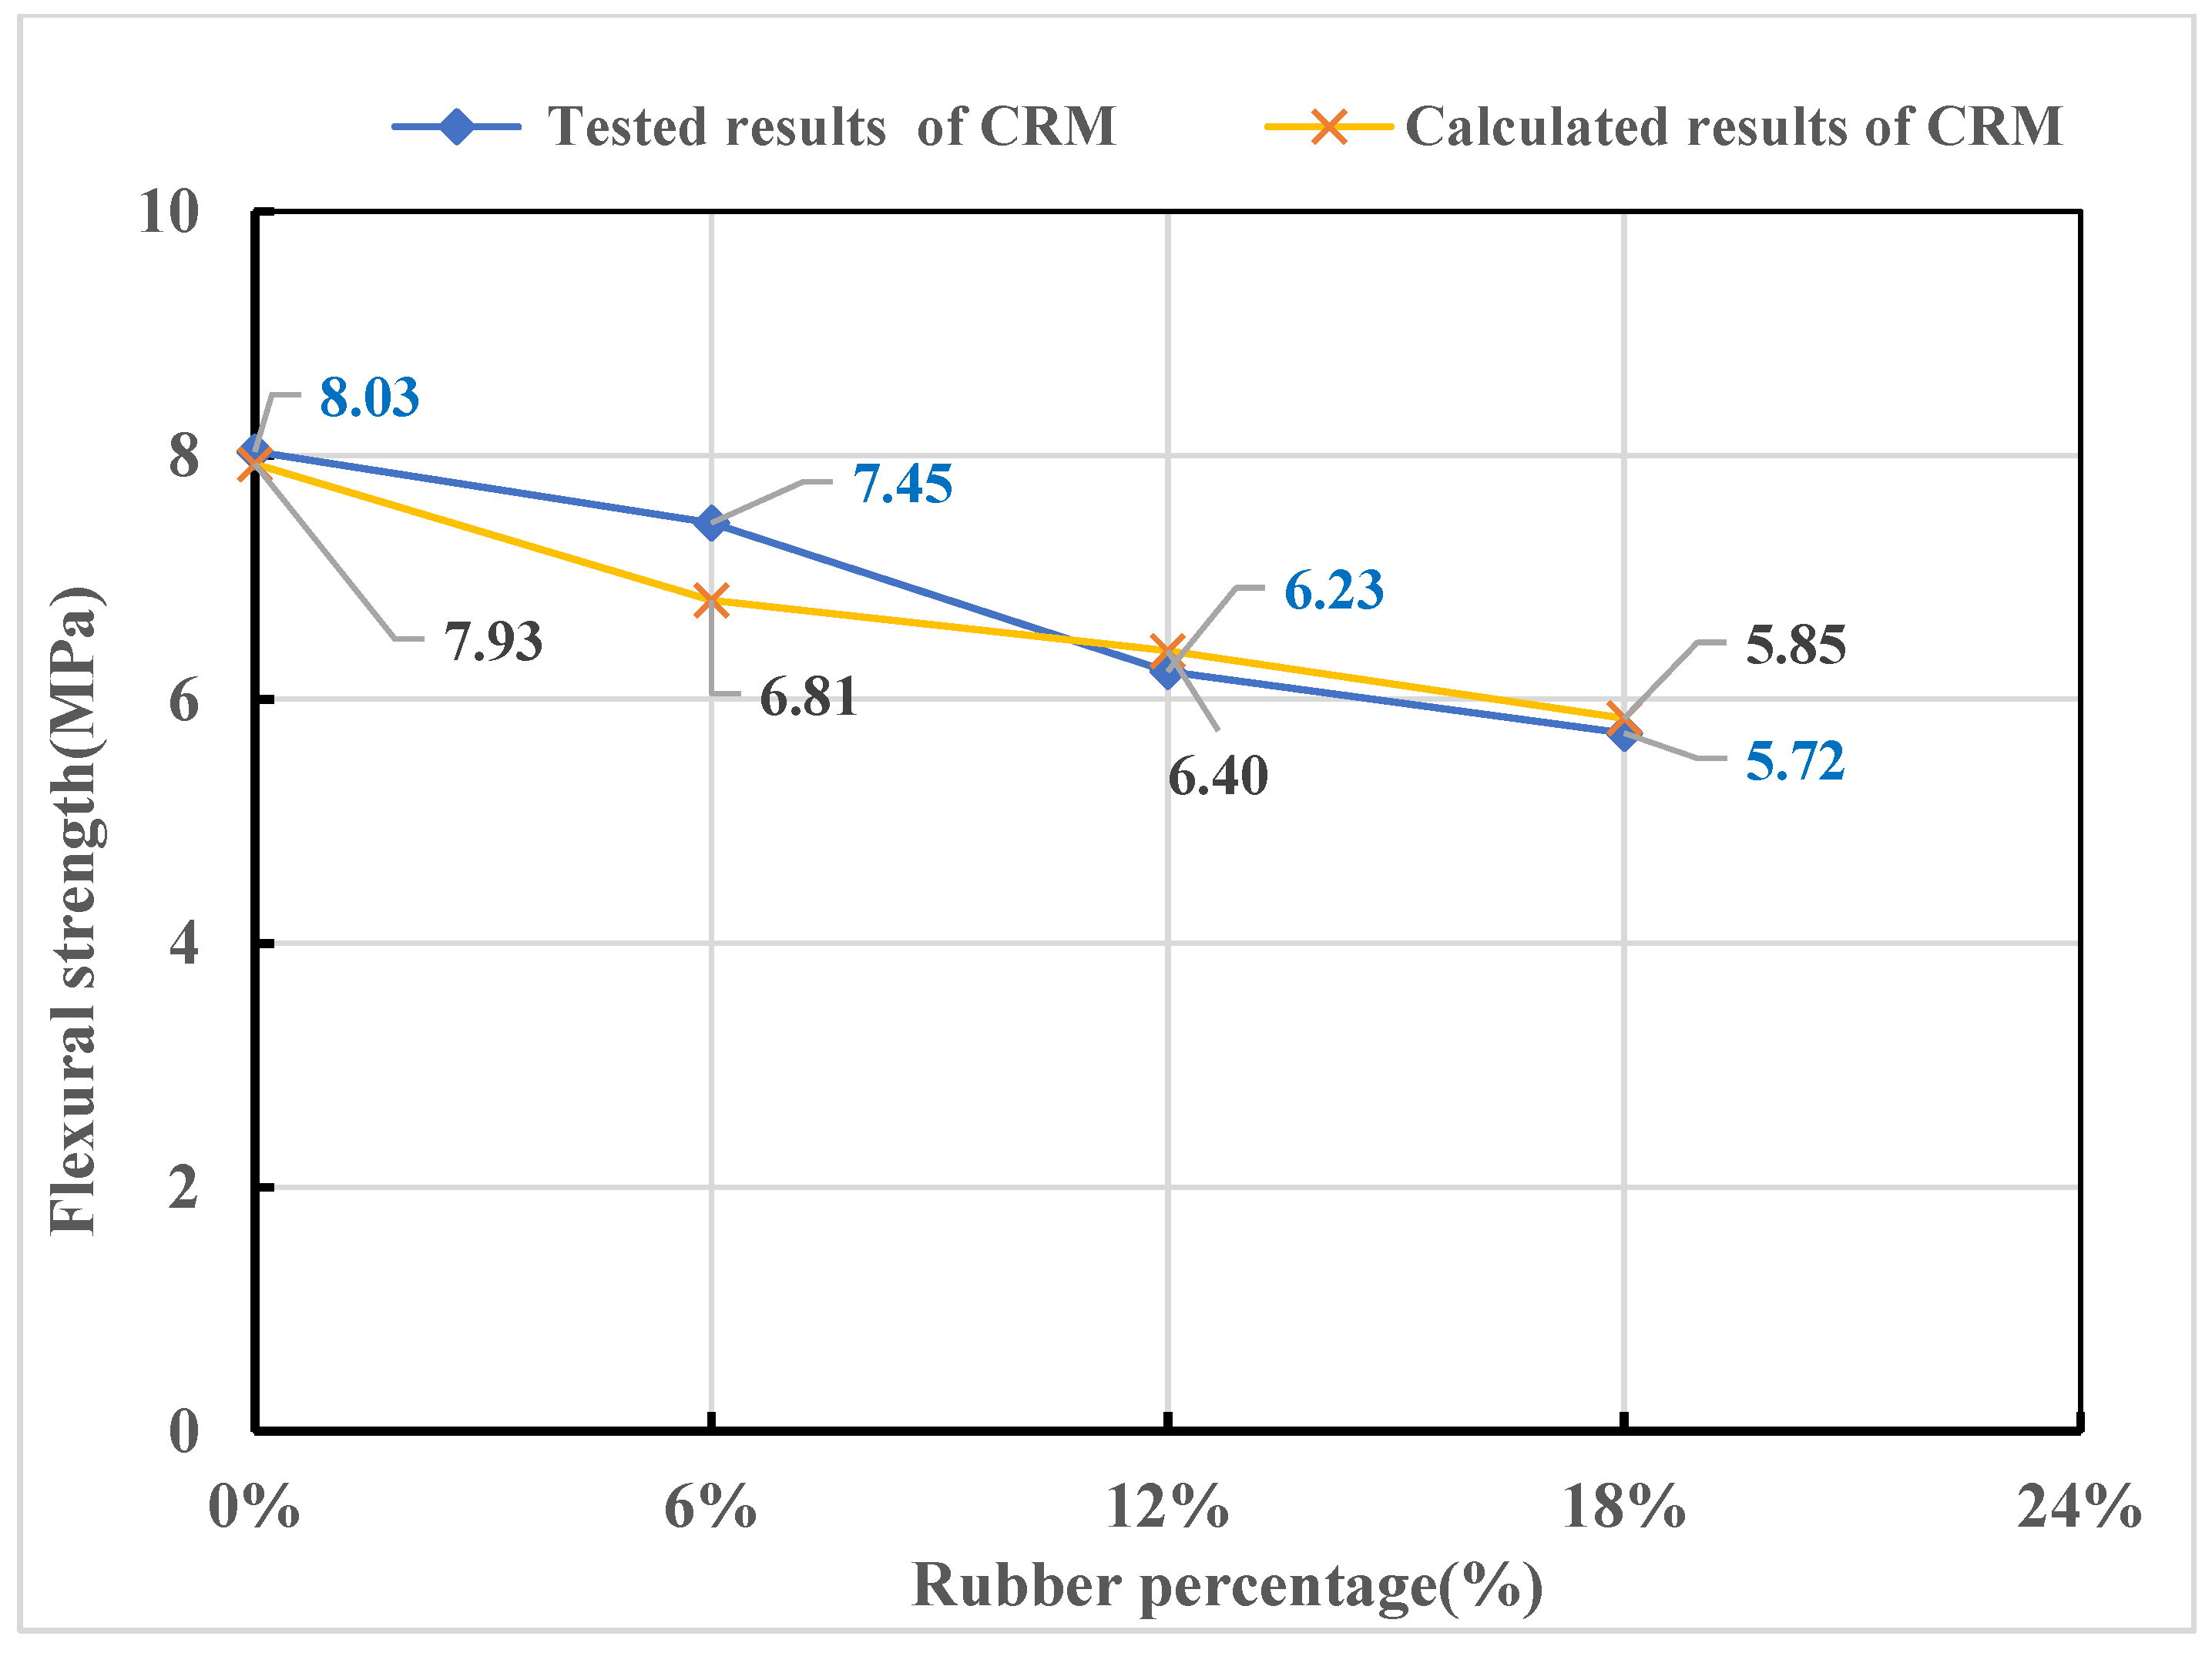
4.2. A Pore-Based Mesoscale Model for Predicting the Flexural Strength of CRM
5. Conclusions
Author Contributions
Funding
Institutional Review Board Statement
Informed Consent Statement
Data Availability Statement
Conflicts of Interest
References
- Zhu, H.; Thong-On, N.; Zhang, X. Adding crumb rubber into exterior wall materials. Waste Manag. Res. 2002, 20, 407–413. [Google Scholar] [CrossRef] [PubMed]
- Wongsa, A.; Sata, V.; Nematollahi, B.; Sanjayan, J.; Chindaprasirt, P. Mechanical and thermal properties of lightweight geopolymer mortar incorporating crumb rubber. J. Clean. Prod. 2018, 195, 1069–1080. [Google Scholar] [CrossRef]
- Di Mundo, R.; Seara-Paz, S.; González-Fonteboa, B.; Notarnicola, M. Masonry and render mortars with tyre rubber as aggregate: Fresh state rheology and hardened state performances. Constr. Build. Mater. 2020, 245, 118359. [Google Scholar] [CrossRef]
- de Souza Kazmierczak, C.; Schneider, S.D.; Aguilera, O.; Albert, C.C.; Mancio, M. Rendering mortars with crumb rubber: Mechanical strength, thermal and fire properties and durability behaviour. Constr. Build. Mater. 2020, 253, 119002. [Google Scholar] [CrossRef]
- Li, J.; Saberian, M.; Nguyen, B.T. Effect of crumb rubber on the mechanical properties of crushed recycled pavement materials. J. Environ. Manag. 2018, 218, 291–299. [Google Scholar] [CrossRef]
- Uygunoğlu, T.; Topçu, İ.B. The role of scrap rubber particles on the drying shrinkage and mechanical properties of self-consolidating mortars. Constr. Build. Mater. 2010, 24, 1141–1150. [Google Scholar] [CrossRef]
- Eltayeb, E.; Ma, X.; Zhuge, Y.; Youssf, O.; Mills, J. Influence of rubber particles on the properties of foam concrete. J. Build. Eng. 2020, 30, 101217. [Google Scholar] [CrossRef]
- Eltayeb, E.; Ma, X.; Zhuge, Y.; Xiao, J.; Youssf, O. Composite walls Composed of profiled steel skin and foam rubberized concrete subjected to eccentric compressions. J. Build. Eng. 2022, 46, 103715. [Google Scholar] [CrossRef]
- Eltayeb, E.; Ma, X.; Zhuge, Y.; Youssf, O.; Mill, J.; Xiao, J. Structural behaviour of composite panels made of profiled steel sheets and foam rubberised concrete under monotonic and cyclic shearing loads. Thin-Walled Struct. 2020, 151, 10672. [Google Scholar] [CrossRef]
- Eltayeb, E.; Ma, X.; Zhuge, Y.; Youssf, O.; Mill, J.; Xiao, J. Structural performance of composite panels made of profiled steel skins and foam rubberised concrete under axial compressive loads. Eng. Struct. 2020, 211, 110448. [Google Scholar] [CrossRef]
- Marques, A.C.; Akasaki, J.L.; Trigo, A.P.M.; Marques, M.L. Influence of the surface treatment of tire rubber residues added in mortars. Rev. IBRACON Estrut. Mater. 2008, 1, 113–120. [Google Scholar] [CrossRef] [Green Version]
- Correia, S.L.; Partala, T.; Loch, F.C.; Segadães, A.M. Factorial design used to model the compressive strength of mortars containing recycled rubber. Compos. Struct. 2010, 92, 2047–2051. [Google Scholar] [CrossRef]
- Song, W.-J.; Qiao, W.-G.; Yang, X.-X.; Lin, D.-G.; Li, Y.-Z. Mechanical properties and constitutive equations of crumb rubber mortars. Constr. Build. Mater. 2018, 172, 660–669. [Google Scholar] [CrossRef]
- Yu, Y.; Zhu, H. Influence of Rubber Size on Properties of Crumb Rubber Mortars. Materials 2016, 9, 527. [Google Scholar] [CrossRef] [PubMed] [Green Version]
- Turatsinze, A.; Granju, J.-L.; Bonnet, S. Positive synergy between steel-fibres and rubber aggregates: Effect on the resistance of cement-based mortars to shrinkage cracking. Cem. Concr. Res. 2006, 36, 1692–1697. [Google Scholar] [CrossRef]
- Turki, M.; Bretagne, E.; Rouis, M.J.; Quéneudec, M. Microstructure, physical and mechanical properties of mortar–rubber aggregates mixtures. Constr. Build. Mater. 2009, 23, 2715–2722. [Google Scholar] [CrossRef]
- Rodrigues, E.A.; Manzoli, O.L.; Bitencourt, L.A.G., Jr.; Bittencourt, T.N. 2D mesoscale model for concrete based on the use of interface element with a high aspect ratio. Int. J. Solids Struct. 2016, 94–95, 112–124. [Google Scholar] [CrossRef]
- Wang, X.; Zhang, M.; Jivkov, A.P. Computational technology for analysis of 3D meso-structure effects on damage and failure of concrete. Int. J. Solids Struct. 2016, 80, 310–333. [Google Scholar] [CrossRef]
- Forti, T.; Batistela, G.; Forti, N.; Vianna, N. 3D Mesoscale Finite Element Modelling of Concrete under Uniaxial Loadings. Materials 2020, 13, 4585. [Google Scholar] [CrossRef]
- Chen, H.; Xu, B.; Mo, Y.L.; Zhou, T. Behavior of meso-scale heterogeneous concrete under uniaxial tensile and compressive loadings. Constr. Build. Mater. 2018, 178, 418–431. [Google Scholar] [CrossRef]
- Sheng, P.; Zhang, J.; Ji, Z. An advanced 3D modeling method for concrete-like particle-reinforced composites with high volume fraction of randomly distributed particles. Compos. Sci. Technol. 2016, 134, 26–35. [Google Scholar] [CrossRef]
- Guo, R.; Ren, H.; Zhang, L.; Long, Z.; Jiang, X.; Wu, X.; Wang, H. Direct dynamic tensile study of concrete materials based on mesoscale model. Int. J. Impact Eng. 2020, 143, 103598. [Google Scholar] [CrossRef]
- Zhou, R.; Song, Z.; Lu, Y. 3D mesoscale finite element modelling of concrete. Comput. Struct. 2017, 192, 96–113. [Google Scholar] [CrossRef] [Green Version]
- Huang, Y.J.; Yang, Z.J.; Chen, X.W.; Liu, G.H. Monte Carlo simulations of meso-scale dynamic compressive behavior of concrete based on X-ray computed tomography images. Int. J. Impact Eng. 2016, 97, 102–115. [Google Scholar] [CrossRef]
- Duarte, A.P.C.; Silva, B.A.; Silvestre, N.; De Brito, J.; Júlio, E. Mechanical characterization of rubberized concrete using an image-processing/XFEM coupled procedure. Compos. Part B Eng. 2015, 78, 214–226. [Google Scholar] [CrossRef]
- Duarte, A.P.C.; Silvestre, N.; de Brito, J.; Júlio, E. Numerical study of the compressive mechanical behaviour of rubberized concrete using the eXtended Finite Element Method (XFEM). Compos. Struct. 2017, 179, 132–145. [Google Scholar] [CrossRef]
- Li, X.; Chen, X.; Jivkov, A.P.; Zhang, J. 3D mesoscale modeling and fracture property study of rubberized self-compacting concrete based on uniaxial tension test. Theor. Appl. Fract. Mech. 2019, 104, 102363. [Google Scholar] [CrossRef]
- Diao, H.; Wang, X.; Cui, Y.; Han, S.; Qi, C. Analysis of Rubberized Self-Compacting Concrete under Uniaxial Tension by 3D Mesoscale Models. Adv. Civ. Eng. 2020, 2020, 8854730. [Google Scholar] [CrossRef]
- AS 1012.8.1; AS1012.8.1:2014 Methods of Testing Concrete Method 8.1: Method for Making and Curing Concrete—Compression and Indirect Tensile Test Specimens. Standards Australia: Sydney, Australia, 2014.
- ASTM: C-348-20; Standard Test Method for Flexural Strength of Hydraulic-Cement Mortars. ASTM International: West Conshohocken, PA, USA, 1999. [CrossRef]
- AS 1012.10; Australian Standard 1012.10: Methods of Testing Concrete-Determination of Indirect Tensile Strength of Concrete Cylinders (‘Brazil’ or Splitting Test). Standards Australia: Sydney, Australia, 2000.
- Chen, H.; Li, D.; Ma, X.; Zhong, Z.; Abd-Elaal, E.-S. Mesoscale analysis of rubber particle effect on young’s modulus and creep behaviour of crumb rubber concrete. Int. J. Mech. Mater. Des. 2021, 17, 659–678. [Google Scholar] [CrossRef]
- Kim, S.-M.; Al-Rub, R.K.A. Meso-scale computational modeling of the plastic-damage response of cementitious composites. Cem. Concr. Res. 2011, 41, 339–358. [Google Scholar] [CrossRef]
- Scrivener, K.L.; Crumbie, A.K.; Laugesen, P. The Interfacial Transition Zone (ITZ) Between Cement Paste and Aggregate in Concrete. Interface Sci. 2004, 12, 411–421. [Google Scholar] [CrossRef]
- D Systèmes. Analysis User’s Guide: Volume III: Materials. In ABAQUS 6.14 Analysis User’s Guide 2014; Abaqus Analysis, Dassault Systems: Boston, MA, USA, 2014; Volume III, p. 294. [Google Scholar]
- Birtel, V.; Mark, P. Parameterised Finite Element Modelling of RC Beam Shear Failure. In Proceedings of the 2006 ABAQUS Users’ Conference, Boston, MA, USA, 23–25 May 2006; pp. 95–108. [Google Scholar]
- Wang, J.; Guo, Z.; Yuan, Q.; Zhang, P.; Fang, H. Effects of ages on the ITZ microstructure of crumb rubber concrete. Constr. Build. Mater. 2020, 254, 119329. [Google Scholar] [CrossRef]
- Huang, Y.; Yang, Z.; Ren, W.; Liu, G.; Zhang, C. 3D meso-scale fracture modelling and validation of concrete based on in-situ X-ray Computed Tomography images using damage plasticity model. Int. J. Solids Struct. 2015, 67–68, 340–352. [Google Scholar] [CrossRef]
- Xiao, J.; Li, W.; Corr, D.J.; Shah, S.P. Effects of interfacial transition zones on the stress–strain behavior of modeled recycled aggregate concrete. Cem. Concr. Res. 2013, 52, 82–99. [Google Scholar] [CrossRef]
- Onuaguluchi, O.; Panesar, D.K. Hardened properties of concrete mixtures containing pre-coated crumb rubber and silica fume. J. Clean. Prod. 2014, 82, 125–131. [Google Scholar] [CrossRef]
- ASTM C 642-06; Standard Test Method for Density, Absorption, and Voids in Hardened Concrete. ASTM International: West Conshohocken, PA, USA, 1997.


| Mix | Rubber Content (%) | Cement (kg/m3) | Sand (kg/m3) | Water (kg/m3) | Rubber (kg/m3) |
|---|---|---|---|---|---|
| Control | 0.00% | 678.0 | 1164.4 | 339.0 | 0.0 |
| CRM6 | 6.00% | 678.0 | 1094.5 | 339.0 | 30.3 |
| CRM12 | 12.00% | 678.0 | 1024.7 | 339.0 | 60.6 |
| CRM18 | 18.00% | 678.0 | 954.8 | 339.0 | 90.9 |
| Mix | Type of Aggregate | Size Range (mm) | 3D | 2D |
|---|---|---|---|---|
| Control mortar | sand | 0.5–2 | 6.84% | 3.13% |
| 2–4 | 16.96% | 11.29% | ||
| 4–5 | 20.47% | 14.85% |
| Mix | Type of Aggregate | Size Range (mm) | 3D VR [2,4] | 2D AR [2,4] |
|---|---|---|---|---|
| CRM6 | Crumb rubber granules | 2–4 | 2.66% | 1.77% |
| CRM12 | 5.31% | 3.54% | ||
| CRM18 | 7.97% | 5.31% |
| Composition | Young’s Modulus (MPa) | Poisson’s Ratio | Compressive Strength (MPa) | Tensile Strength (MPa) |
|---|---|---|---|---|
| Mortar | 25,374.26 | 0.2 | 66.83 | 3.98 |
| Rubber particles * | 3 | 0.49 | ||
| ITZ | 25,374.26 * 60% | 0.2 | 66.83 * 60% | 3.98 * 60% |
| Rubber Content (%) | Rubber Size (mm) | Tensile Strength of CRM without ITZ (MPa) | Tensile Strength of CRM with ITZ (MPa) | Reduction Rate |
|---|---|---|---|---|
| 6% | 1.18–2.36 mm | 3.865 | 3.856 | 0.24% |
| 12% | 3.534 | 3.511 | 0.67% | |
| 18% | 3.227 | 3.195 | 0.99% | |
| 6% | 2–4 mm | 3.928 | 3.923 | 0.12% |
| 12% | 3.867 | 3.862 | 0.12% | |
| 18% | 3.526 | 3.513 | 0.37% | |
| 6% | 6–8 mm | 3.859 | 3.856 | 0.07% |
| 12% | 3.714 | 3.710 | 0.11% | |
| 18% | 3.580 | 3.575 | 0.16% |
| Sample | Rubber Particle Size(mm) | ||||
|---|---|---|---|---|---|
| 0.86 | 1.77 | 3 | 5 | 7 | |
| CRM6-1 | 3.83 | 3.89 | 3.92 | 3.92 | 3.81 |
| CRM6-2 | 3.76 | 3.83 | 3.77 | 3.34 | 3.78 |
| CRM6-3 | 3.76 | 3.76 | 3.75 | 3.82 | 4.11 |
| CRM6-4 | 3.76 | 3.84 | 3.78 | 3.88 | 3.75 |
| CRM6-5 | 3.80 | 3.71 | 3.48 | 3.37 | 3.10 |
| CRM6-6 | 3.76 | 3.67 | 3.76 | 4.02 | 4.00 |
| Average(MPa) | 3.78 | 3.78 | 3.74 | 3.73 | 3.76 |
| Standard Deviation(MPa) | 0.03 | 0.08 | 0.13 | 0.27 | 0.32 |
| CRM18-1 | 3.29 | 3.34 | 3.36 | 3.71 | 3.75 |
| CRM18-2 | 3.31 | 3.21 | 3.27 | 3.02 | 2.61 |
| CRM18-3 | 3.28 | 3.22 | 3.18 | 3.08 | 2.52 |
| CRM18-4 | 3.35 | 3.17 | 3.37 | 3.18 | 3.29 |
| CRM18-5 | 3.31 | 3.27 | 3.21 | 2.92 | 2.74 |
| CRM18-6 | 3.34 | 3.15 | 3.43 | 3.60 | 3.89 |
| Average(MPa) | 3.32 | 3.23 | 3.30 | 3.25 | 3.13 |
| Standard Deviation(MPa) | 0.02 | 0.06 | 0.09 | 0.30 | 0.54 |
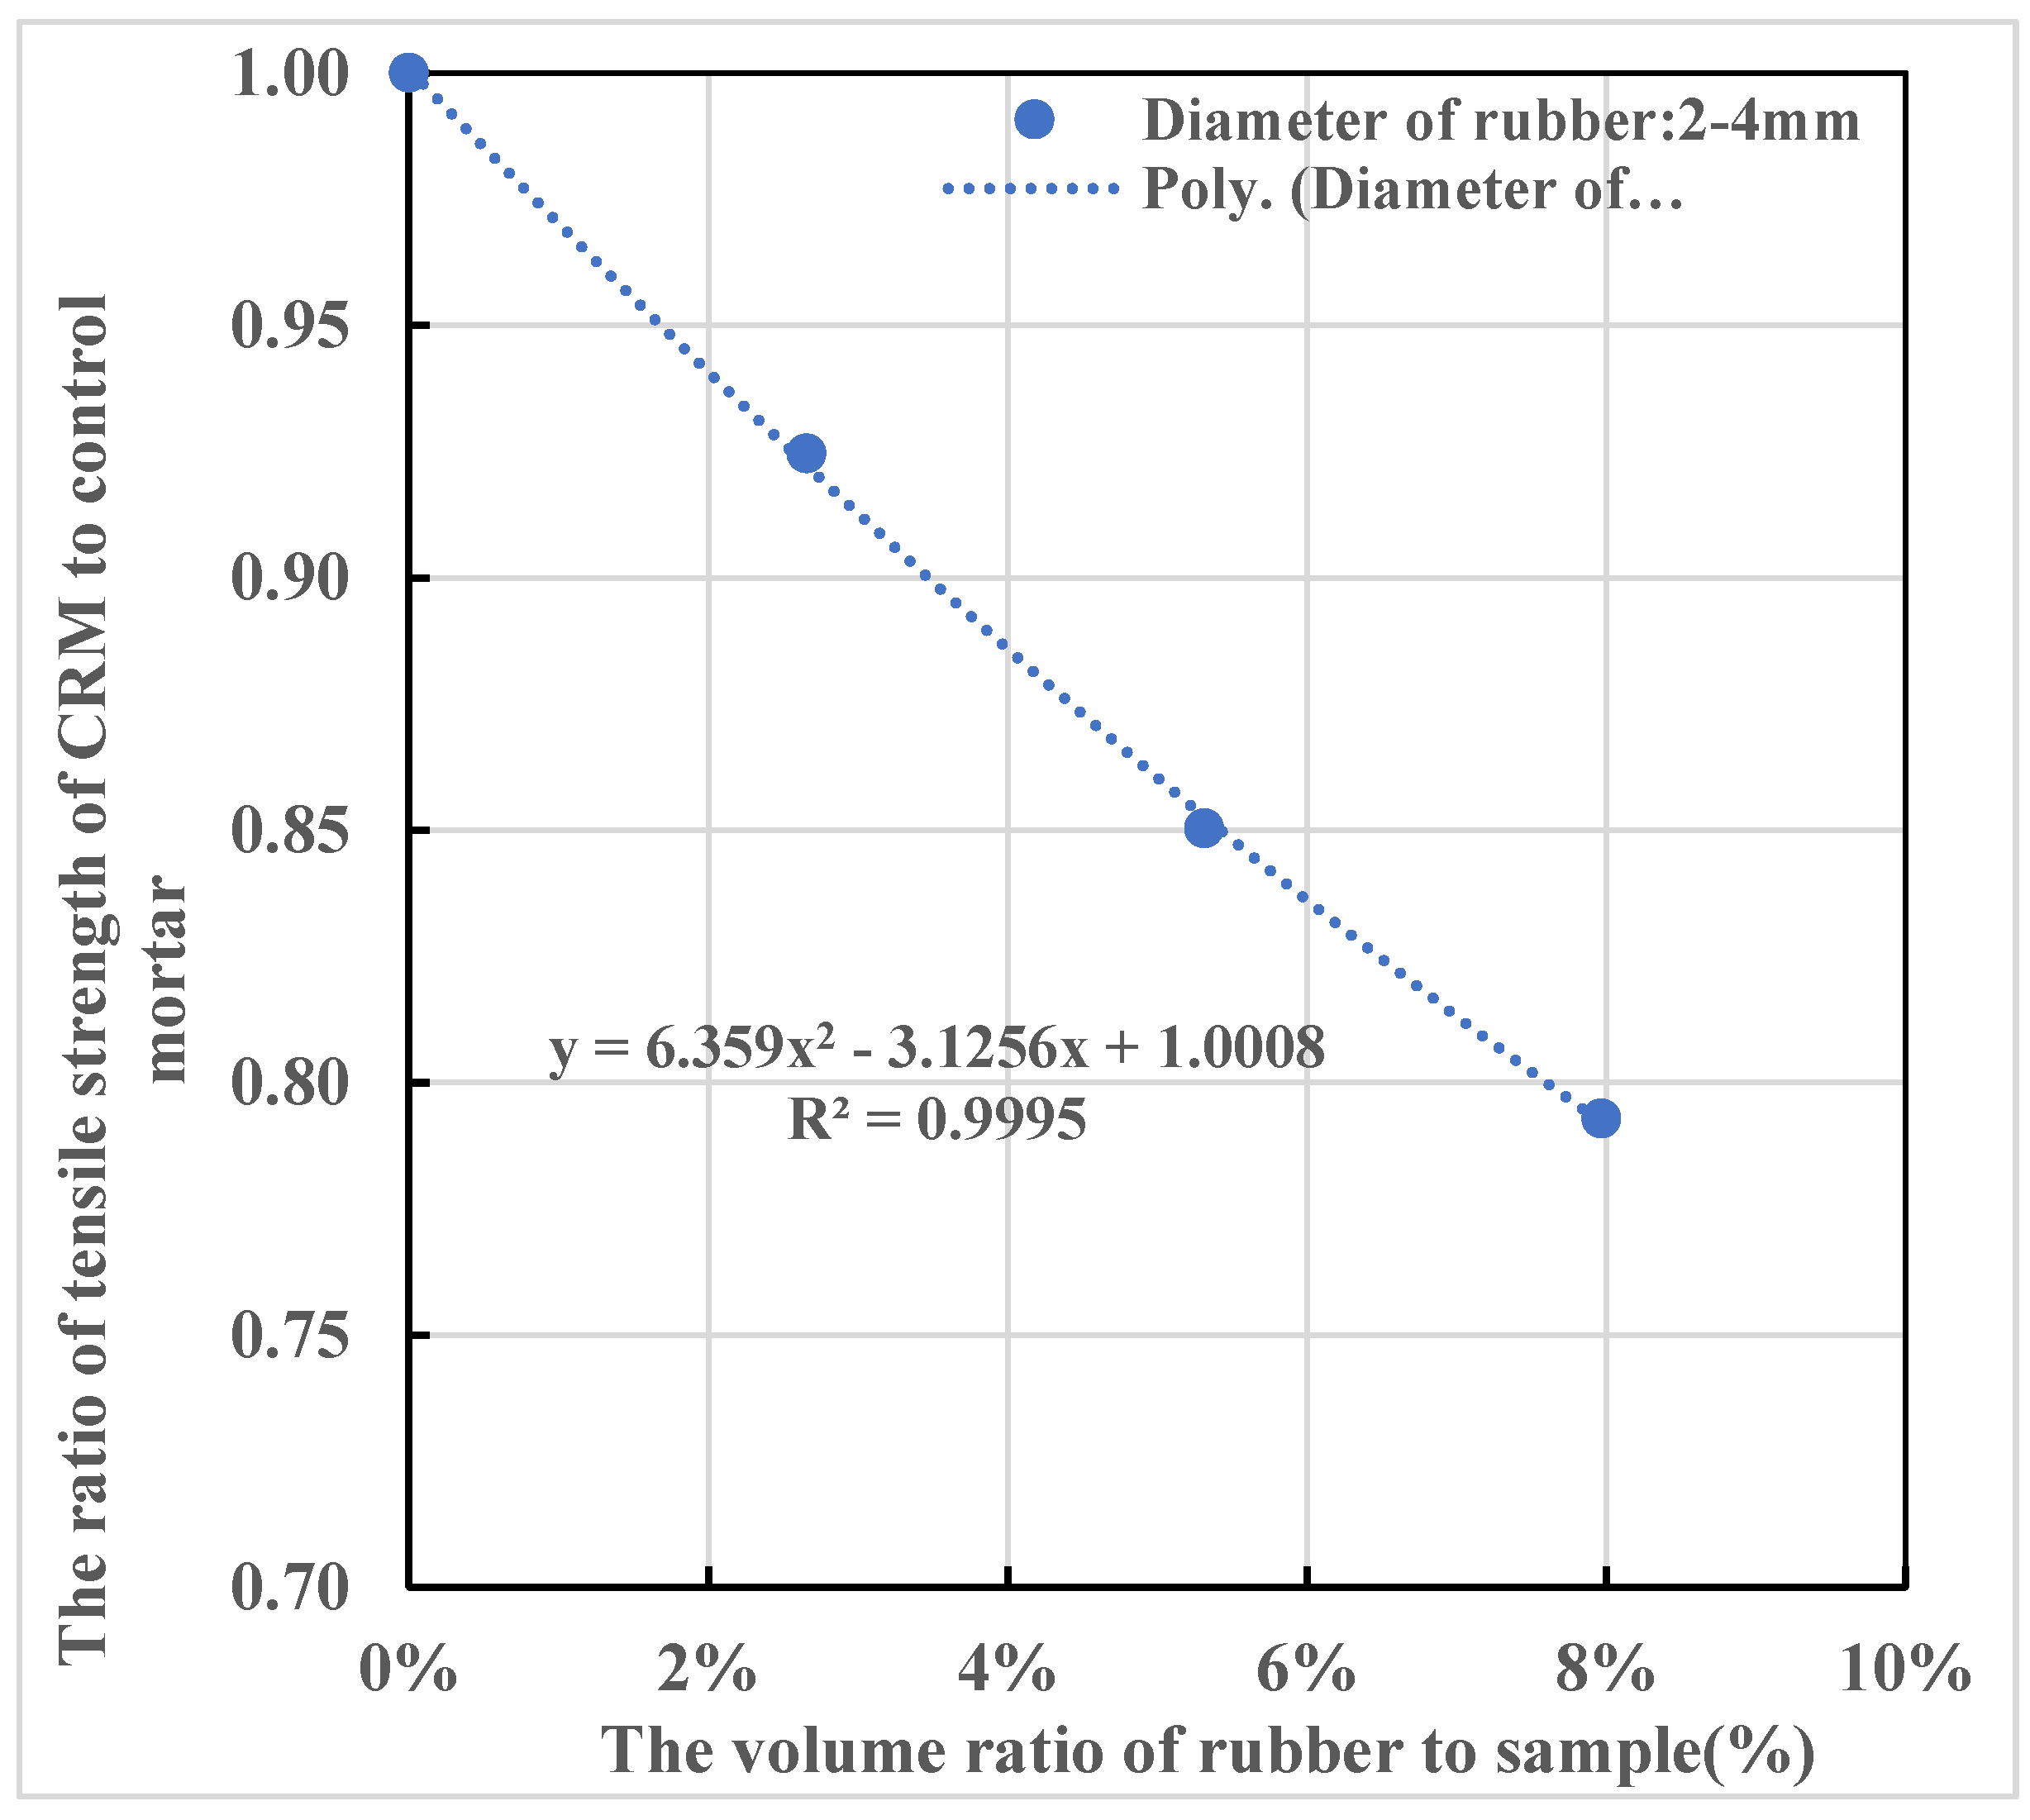
| Mix | Rubber Content (%) | Calculated Results (MPa) | Average (MPa) | Average Strength Ratio of CRM and Control Mix |
|---|---|---|---|---|
| Control | 0% | 4.08 | 4.08 | 1 |
| CRM6-1 | 6% | 3.92 | 3.77 | 0.92 |
| CRM6-2 | 3.57 | |||
| CRM6-3 | 3.81 | |||
| CRM6-4 | 3.84 | |||
| CRM6-5 | 3.81 | |||
| CRM6-6 | 3.69 | |||
| CRM12-1 | 12% | 3.19 | 3.47 | 0.85 |
| CRM12-2 | 3.48 | |||
| CRM12-3 | 3.50 | |||
| CRM12-4 | 3.65 | |||
| CRM12-5 | 3.62 | |||
| CRM12-6 | 3.38 | |||
| CRM18-1 | 18% | 3.01 | 3.23 | 0.79 |
| CRM18-2 | 3.24 | |||
| CRM18-3 | 3.35 | |||
| CRM18-4 | 3.46 | |||
| CRM18-5 | 3.33 | |||
| CRM18-6 | 3.02 |
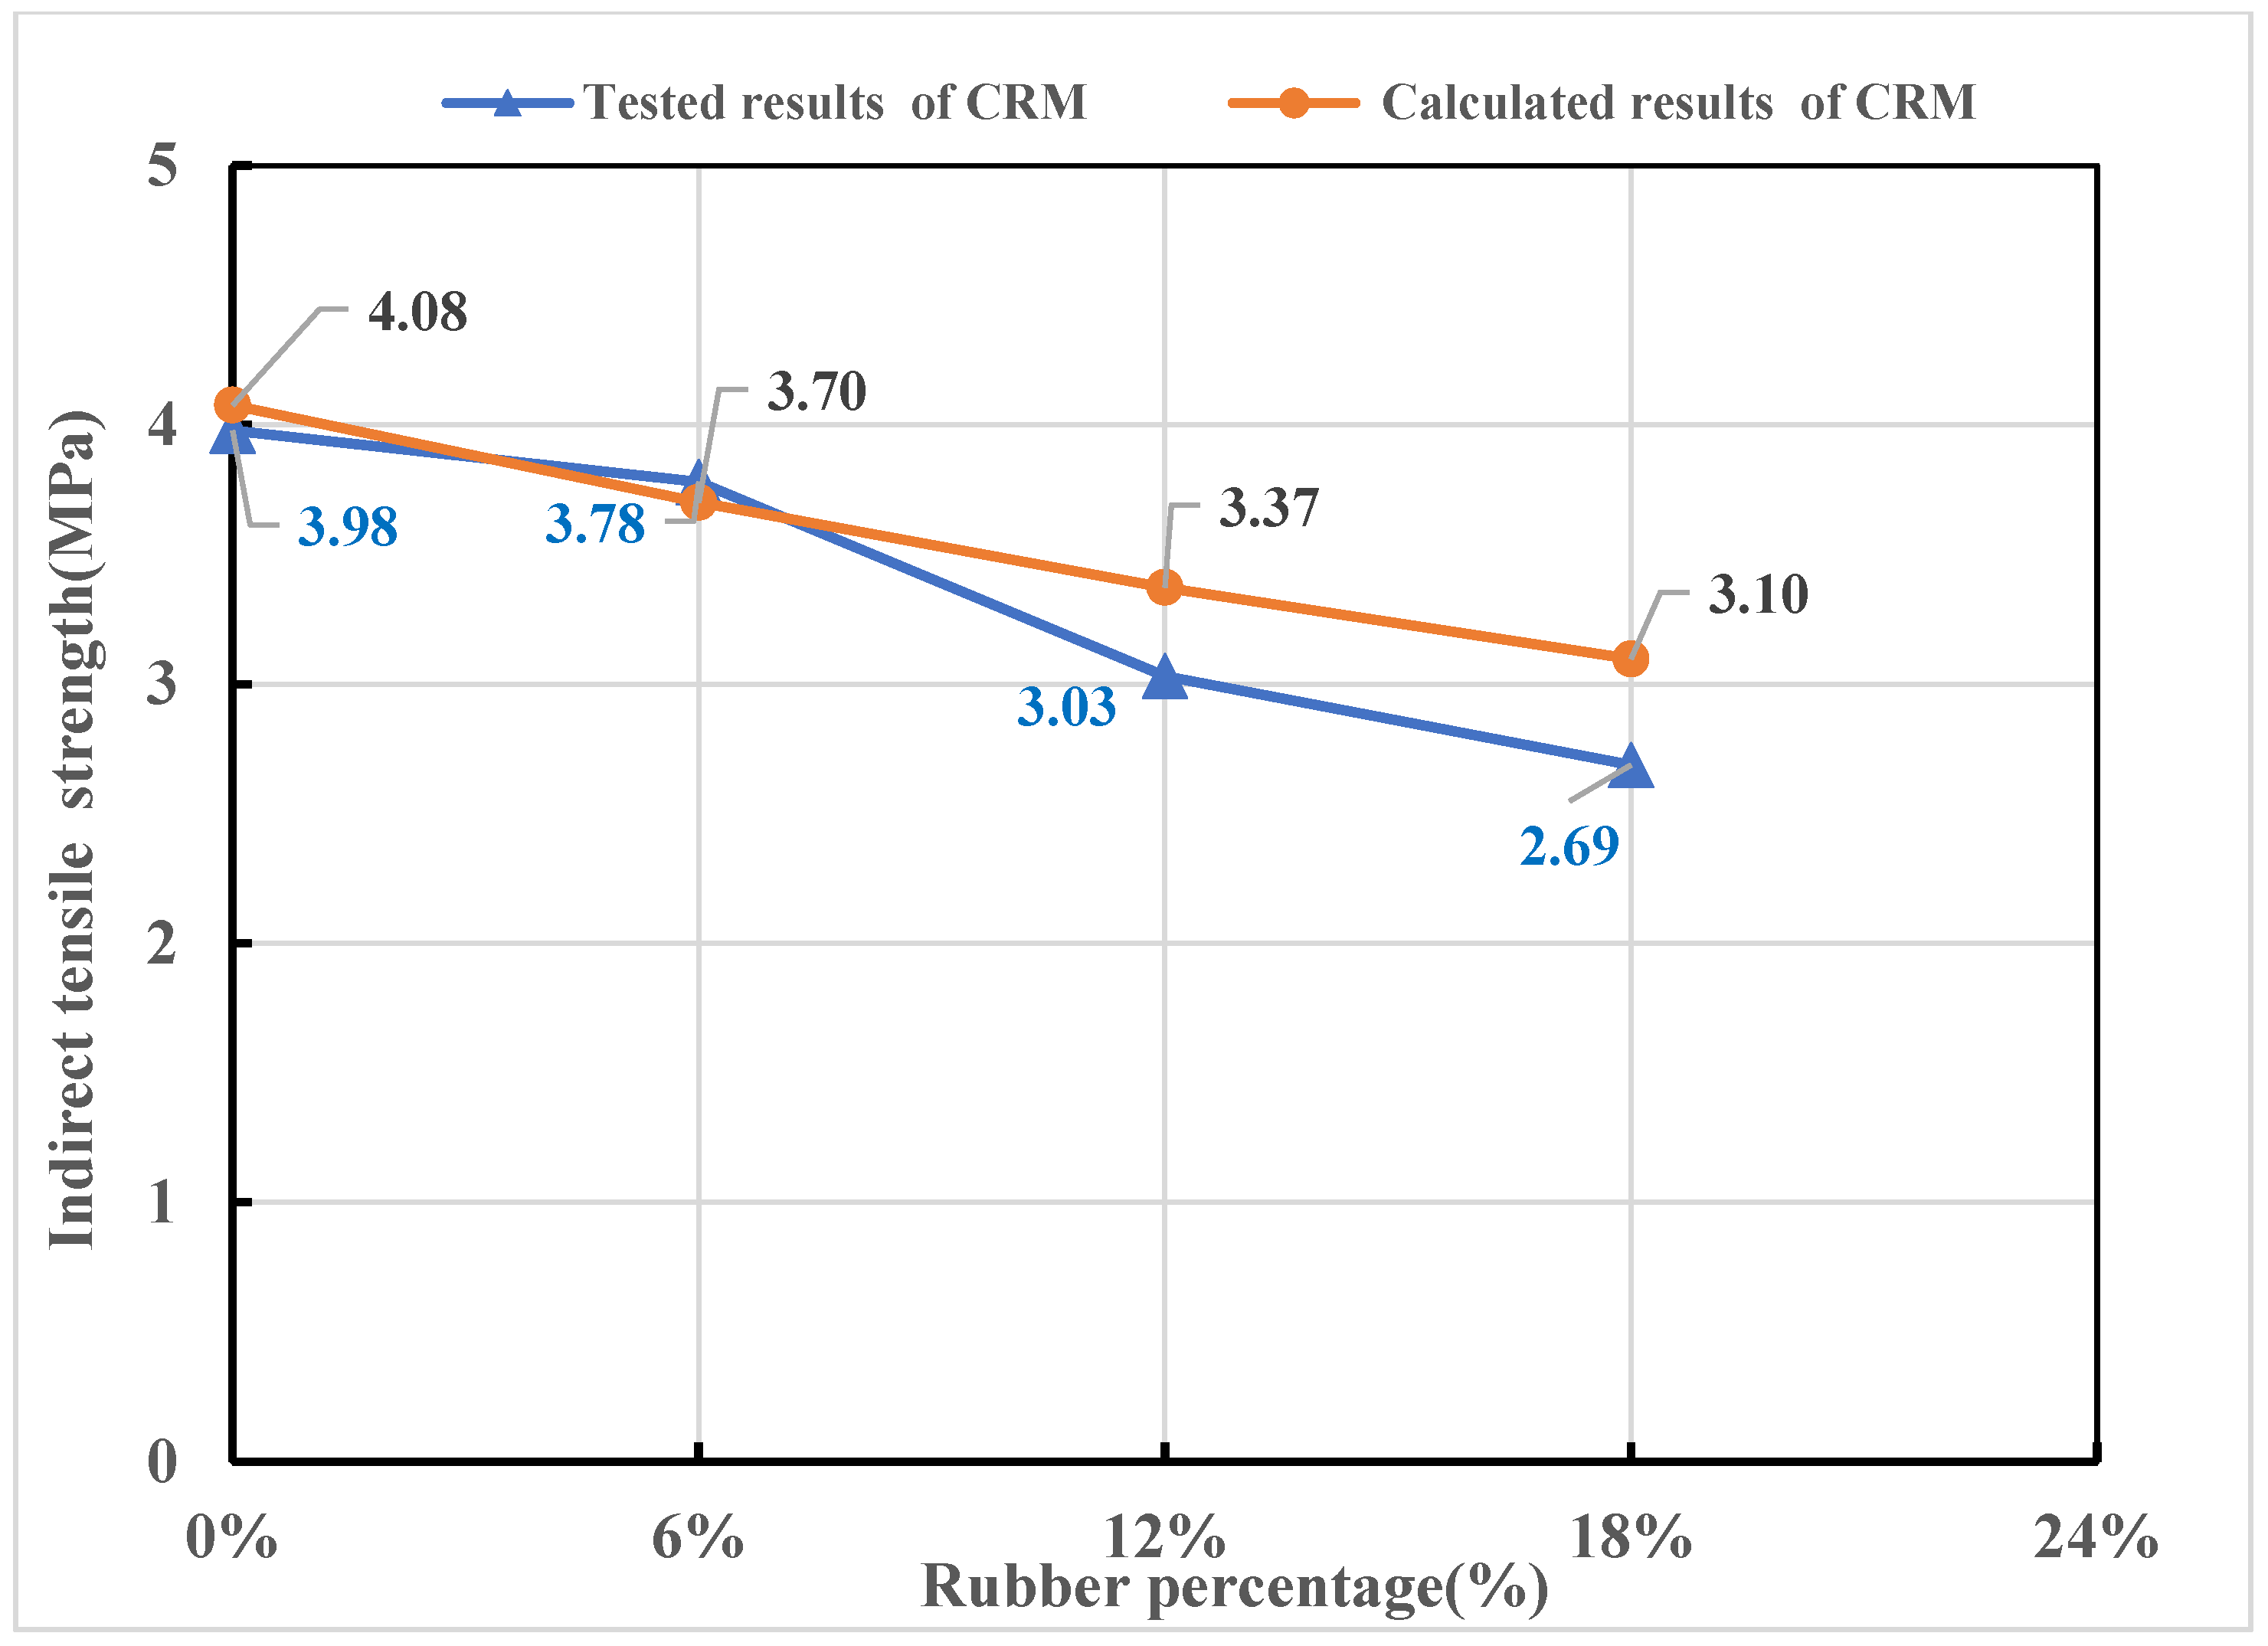
| Rubber Content | 0% | 6% | 12% | 18% |
|---|---|---|---|---|
| Indirect tensile strength (MPa) | 4.44 | 3.76 | 2.92 | 2.60 |
| 3.52 | 3.83 | 3.29 | 2.81 | |
| 3.98 | 3.75 | 2.87 | 2.65 | |
| Average (MPa) | 3.98 | 3.78 | 3.03 | 2.69 |
| Standard deviation (MPa) | 0.38 | 0.04 | 0.19 | 0.09 |
| Mix | Rubber Content (%) | The Volume Ratio of Rubber and the Sample | Porosity of CRM | Increase in Porosity of CRM | Sum of Increased Porosity and Rubber Percentage |
|---|---|---|---|---|---|
| Control | 0 | 0.00% | 22.60% | 0.00% | 0.00% |
| CRM6 | 6% | 2.66% | 23.15% | 0.55% | 3.21% |
| CRM12 | 12% | 5.31% | 23.70% | 1.10% | 6.41% |
| CRM18 | 18% | 7.97% | 24.25% | 1.65% | 9.62% |
| Rubber Content | 0% | 6% | 12% | 18% |
|---|---|---|---|---|
| Flexural strength (MPa) | 7.65 | 8.33 | 5.89 | 6.01 |
| 7.92 | 6.73 | 6.06 | 5.84 | |
| 8.52 | 7.27 | 6.73 | 5.32 | |
| Average (MPa) | 8.03 | 7.45 | 6.23 | 5.72 |
| Standard deviation (MPa) | 0.37 | 0.66 | 0.36 | 0.30 |
| Mix | Rubber Content (%) | Calculated Results (MPa) | Average (Mpa) | Average Strength Ratio of CRM and Control Mix |
|---|---|---|---|---|
| Control | 0% | 7.93 | 7.93 | 1 |
| CRM6-1 | 6% | 6.85 | 6.93 | 0.87 |
| CRM6-2 | 6.42 | |||
| CRM6-3 | 6.65 | |||
| CRM6-4 | 7.45 | |||
| CRM6-5 | 6.85 | |||
| CRM6-6 | 7.37 | |||
| CRM12-1 | 12% | 6.70 | 6.51 | 0.82 |
| CRM12-2 | 5.69 | |||
| CRM12-3 | 6.58 | |||
| CRM12-4 | 6.88 | |||
| CRM12-5 | 6.28 | |||
| CRM12-6 | 6.96 | |||
| CRM18-1 | 18% | 6.25 | 6.20 | 0.78 |
| CRM18-2 | 5.55 | |||
| CRM18-3 | 6.36 | |||
| CRM18-4 | 6.51 | |||
| CRM18-5 | 6.08 | |||
| CRM18-6 | 6.44 |
Disclaimer/Publisher’s Note: The statements, opinions and data contained in all publications are solely those of the individual author(s) and contributor(s) and not of MDPI and/or the editor(s). MDPI and/or the editor(s) disclaim responsibility for any injury to people or property resulting from any ideas, methods, instructions or products referred to in the content. |
© 2023 by the authors. Licensee MDPI, Basel, Switzerland. This article is an open access article distributed under the terms and conditions of the Creative Commons Attribution (CC BY) license (https://creativecommons.org/licenses/by/4.0/).
Share and Cite
Chen, H.; Li, D.; Ma, X.; Zhong, Z.; Abd-Elaal, E.-S. Mesoscale Analysis of Rubber Particle Effect on Indirect Tensile and Flexural Tensile Strength of Crumb Rubber Mortar. J. Compos. Sci. 2023, 7, 16. https://doi.org/10.3390/jcs7010016
Chen H, Li D, Ma X, Zhong Z, Abd-Elaal E-S. Mesoscale Analysis of Rubber Particle Effect on Indirect Tensile and Flexural Tensile Strength of Crumb Rubber Mortar. Journal of Composites Science. 2023; 7(1):16. https://doi.org/10.3390/jcs7010016
Chicago/Turabian StyleChen, Huailiang, Danda Li, Xing Ma, Zheng Zhong, and El-Sayed Abd-Elaal. 2023. "Mesoscale Analysis of Rubber Particle Effect on Indirect Tensile and Flexural Tensile Strength of Crumb Rubber Mortar" Journal of Composites Science 7, no. 1: 16. https://doi.org/10.3390/jcs7010016