
Fused Filament Fabrication 3D Printing: Quantification of Exposure to Airborne Particles

 , , ,
, , ,
Abstract
:1. Introduction
- The materials studied.
- The variety of process setups examined.
- The direct focal point in employee exposure, through the comparison with exposure thresholds.
2. Materials and Methods
2.1. Instrumentation
- Channel 1: 300–400 nm
- Channel 2: 400–500 nm
- Channel 3: 500–600 nm
- Channel 4: 600 nm–1 μm
- Channel 5: 1–2.5 μm
- Channel 6: 2.5–25 μm
2.2. Description of Studied Cases
2.3. Experiment Setup
2.3.1. Case 1—TPU 27.2%CF
2.3.2. Case 2—Multiple Printers
2.3.3. Case 3—CF Co-Deposition (Semi-Industrial)
2.3.4. Case 4—CF Co-Deposition (Custom)
2.4. Point of Reference for Result Interpretation
- 40,000 #/cm3 of ultrafine particles as an 8 h TWA–occupational exposure threshold;
- 80,000 #/cm3 of ultrafine particles as a 15 min threshold.
3. Results
3.1. Case 1—TPU 27.2%CF
3.2. Case 2—Multiple Printers
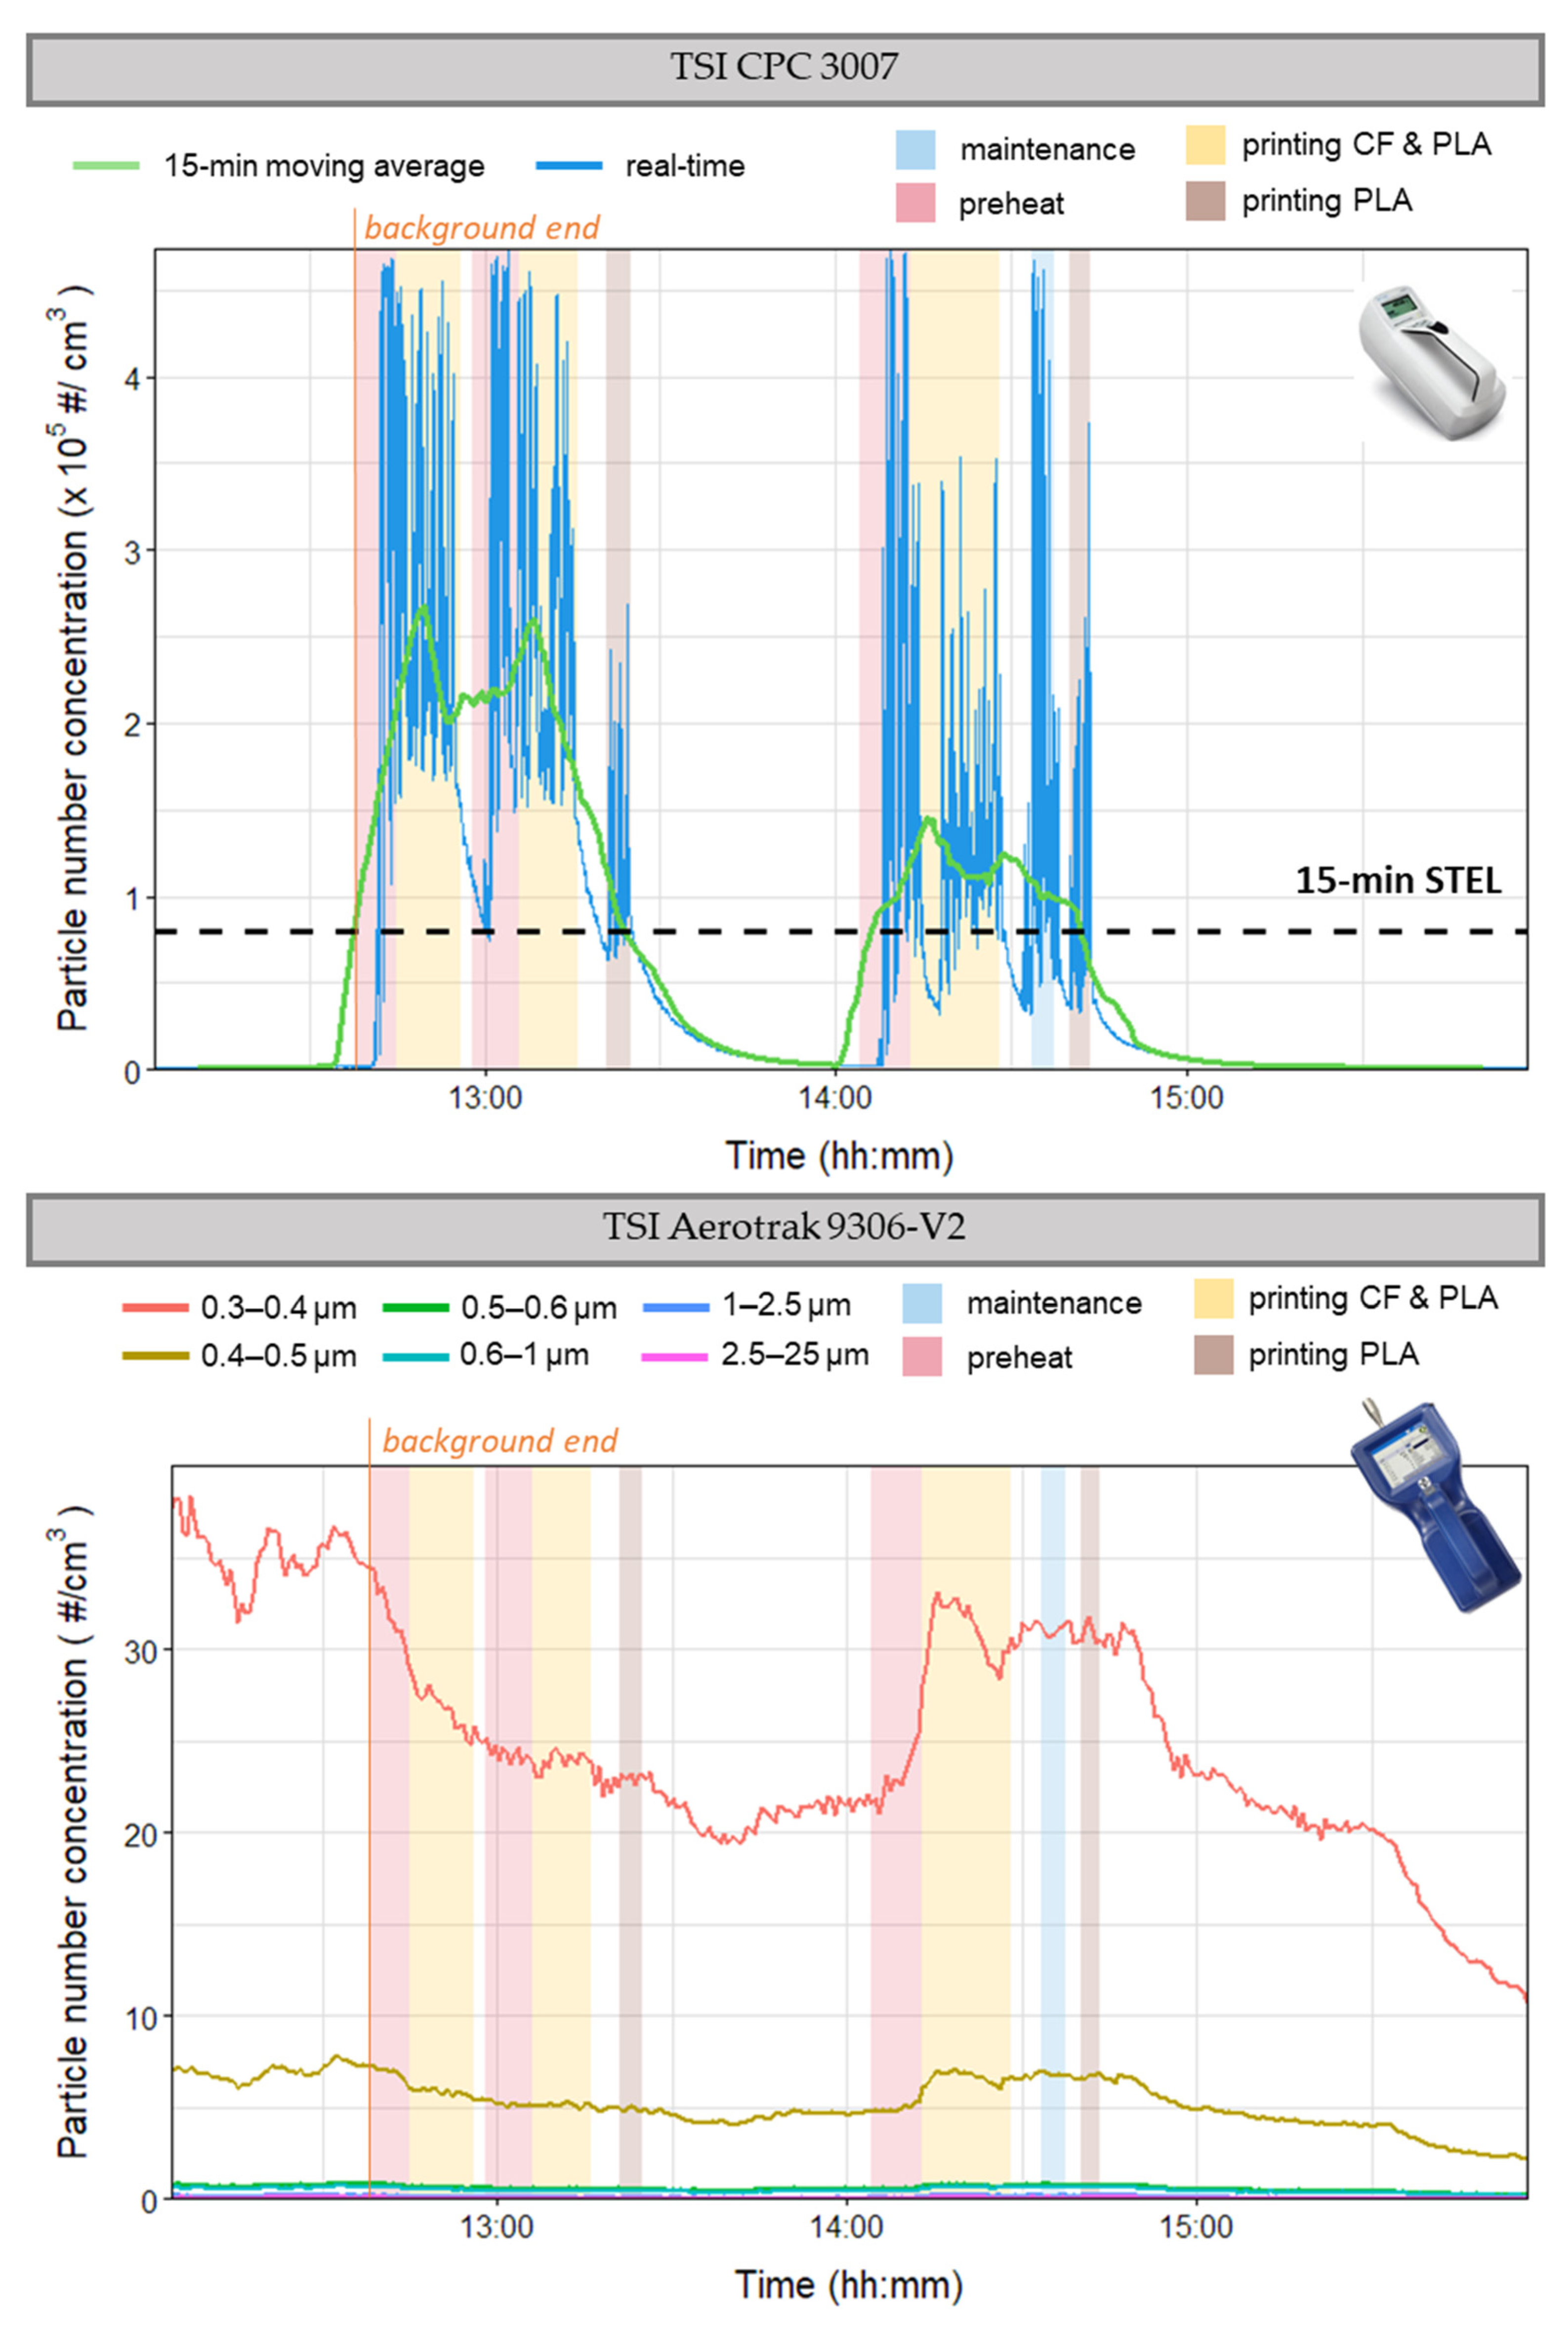
3.3. Case 3—CF Co-Deposition (Semi-Industrial)
3.3.1. Case 3a
3.3.2. Case 3b
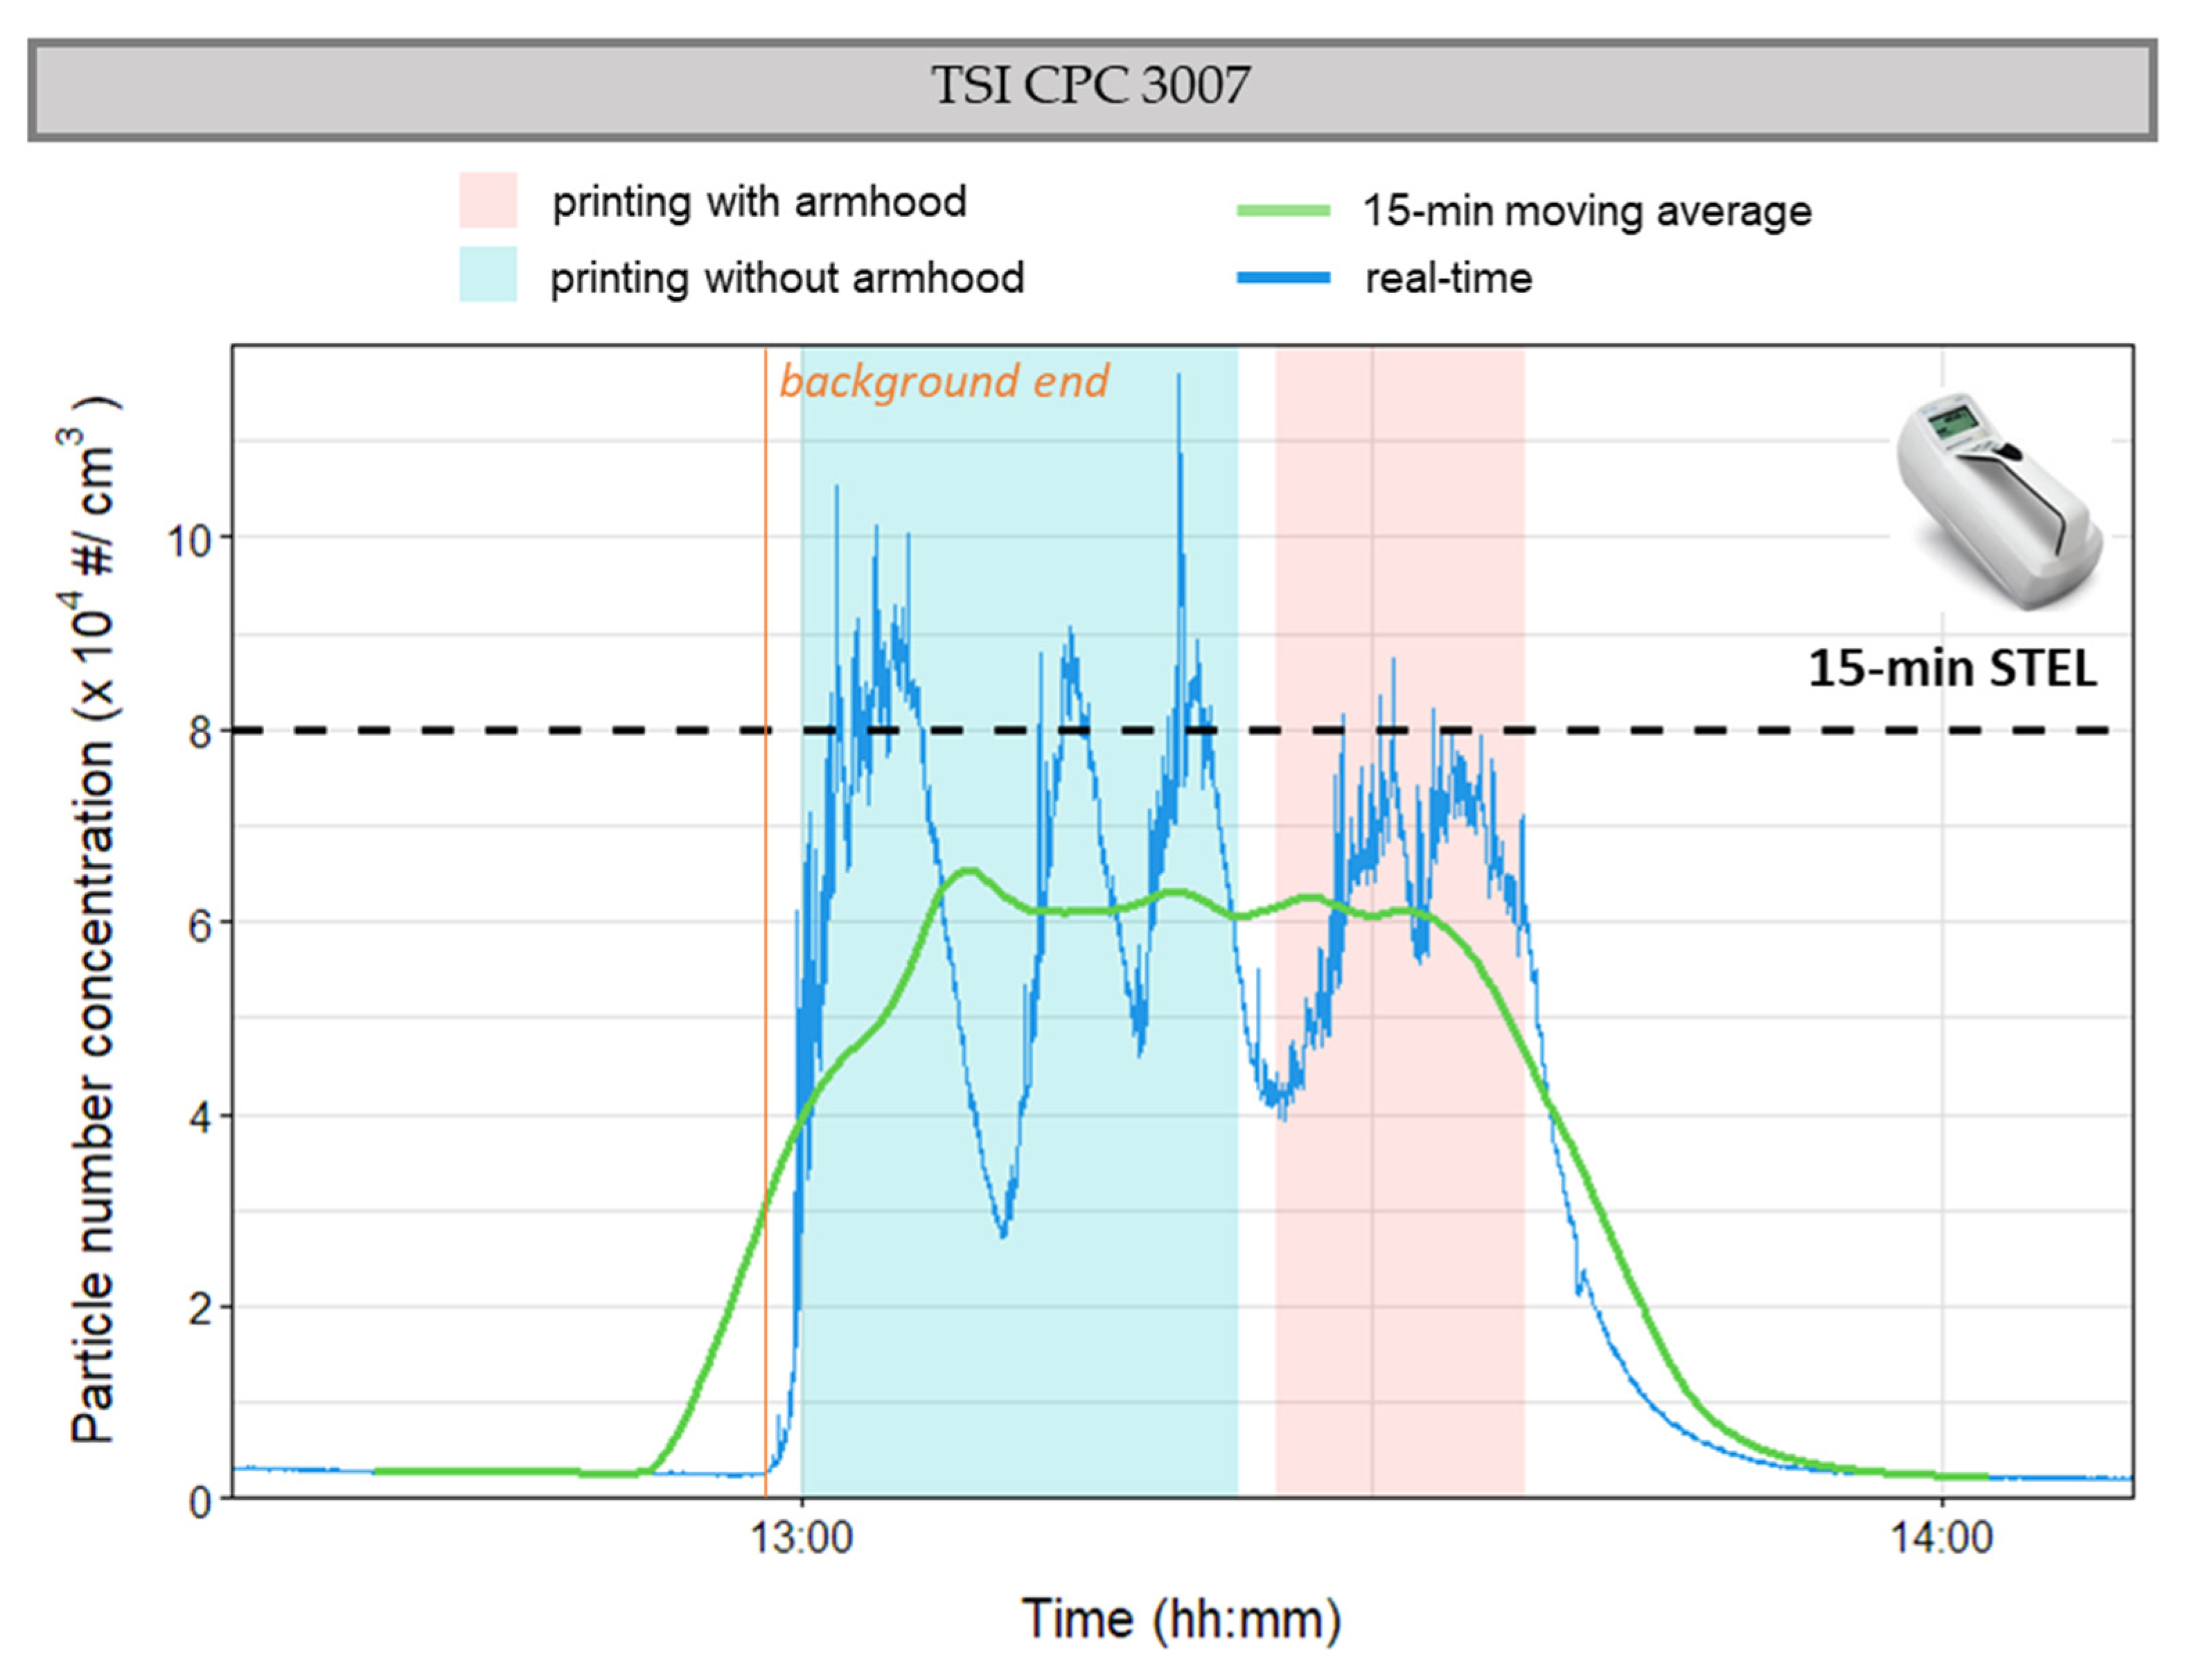
3.4. Case 4—CF Co-Deposition (Custom)
3.4.1. Case 4a
3.4.2. Case 4b
4. Discussion
4.1. UFP Emissions
4.2. Hierarchy of Controls to Mitigate UFP Occupational Exposure
- Positioning exhausts or air purification devices as close to emission sources as possible
- Setting up ventilation configuration to position employees upwind of the dilution zone
- Using auxiliary fans to circulate air evenly across the room
- Adding make-up air (fresh, uncontaminated tempered air from outside the workspace) to replace existing air that cannot be recirculated in places where it will be most effective
4.3. Research Barriers and Potential for Further Work
5. Conclusions
Supplementary Materials
Author Contributions
Funding
Institutional Review Board Statement
Informed Consent Statement
Data Availability Statement
Conflicts of Interest
Abbreviations
| ACH | Air Changes per Hour |
| ALARP | As Low As Reasonably Practicable |
| ANSI | American National Standards Institute |
| CF | Carbon Fibre |
| CFRP | Carbon-Fibre-Reinforced Polymers |
| CNT | Carbon Nano-Tube |
| CoPA | Copolyamide |
| CPC | Condensation Particle Counter |
| DNA | Deoxyribonucleic Acid |
| FFF | Fused Filament Fabrication |
| FFP | Filtered Facepiece Respirator |
| HEPA | High Efficiency Particulate Air Filter |
| ISO | International Organization for Standardization |
| NEAT | Nanoparticle Emission Assessment Technique |
| NIOSH | National Institute for Occupational Safety and Health |
| OECD | Organisation for Economic Co-operation and Development |
| OEL | Occupational Exposure Limit |
| PA | Polyamide |
| PETG | Polyethylene Terephthalate Glycol |
| PLA | Polylactic Acid |
| PPE | Personal Protective Equipment |
| ROS | Reactive Oxygen Species |
| SMPS | Scanning Mobility Particle Sizer |
| STEL | Short-Term Exposure Limit |
| STOP | Substitution, Technical, Organisational, Personal protective equipment |
| TPU | Thermoplastic polyurethane |
| TWA | Time-weighted Average |
| UFP | Ultrafine Particles |
| UL | Underwriters Laboratories |
| VOCs | Volatile Organic Compounds |
References
- Ngo, T.D.; Kashani, A.; Imbalzano, G.; Nguyen, K.T.Q.; Hui, D. Additive Manufacturing (3D Printing): A Review of Materials, Methods, Applications and Challenges. Compos. Part B Eng. 2018, 143, 172–196. [Google Scholar] [CrossRef]
- Wang, X.; Jiang, M.; Zhou, Z.; Gou, J.; Hui, D. 3D Printing of Polymer Matrix Composites: A Review and Prospective. Compos. Part B Eng. 2017, 110, 442–458. [Google Scholar] [CrossRef]
- Chen, Z.; Li, Z.; Li, J.; Liu, C.; Lao, C.; Fu, Y.; Liu, C.; Li, Y.; Wang, P.; He, Y. 3D Printing of Ceramics: A Review. J. Eur. Ceram. Soc. 2019, 39, 661–687. [Google Scholar] [CrossRef]
- Panwisawas, C.; Tang, Y.T.; Reed, R.C. Metal 3D Printing as a Disruptive Technology for Superalloys. Nat. Commun. 2020, 11, 2327. [Google Scholar] [CrossRef]
- Yan, Q.; Dong, H.; Su, J.; Han, J.; Song, B.; Wei, Q.; Shi, Y. A Review of 3D Printing Technology for Medical Applications. Engineering 2018, 4, 729–742. [Google Scholar] [CrossRef]
- Aimar, A.; Palermo, A.; Innocenti, B. The Role of 3D Printing in Medical Applications: A State of the Art. J. Healthc. Eng. 2019, 2019, e5340616. [Google Scholar] [CrossRef] [Green Version]
- Kasmi, S.; Cayuela, J.; Backer, B.D.; Labbé, E.; Alix, S. Modified Polylactic Acid with Improved Impact Resistance in the Presence of a Thermoplastic Elastomer and the Influence of Fused Filament Fabrication on Its Physical Properties. J. Compos. Sci. 2021, 5, 232. [Google Scholar] [CrossRef]
- Sanei, S.H.R.; Popescu, D. 3D-Printed Carbon Fiber Reinforced Polymer Composites: A Systematic Review. J. Compos. Sci. 2020, 4, 98. [Google Scholar] [CrossRef]
- Pickering, K.; Stoof, D. Sustainable Composite Fused Deposition Modelling Filament Using Post-Consumer Recycled Polypropylene. J. Compos. Sci. 2017, 1, 17. [Google Scholar] [CrossRef] [Green Version]
- Karayannis, P.; Petrakli, F.; Gkika, A.; Koumoulos, E.P. 3D-Printed Lab-on-a-Chip Diagnostic Systems-Developing a Safe-by-Design Manufacturing Approach. Micromachines 2019, 10, 825. [Google Scholar] [CrossRef] [Green Version]
- Elkaseer, A.; Schneider, S.; Scholz, S.G. Experiment-Based Process Modeling and Optimization for High-Quality and Resource-Efficient FFF 3D Printing. Appl. Sci. 2020, 10, 2899. [Google Scholar] [CrossRef] [Green Version]
- Gkartzou, E.; Koumoulos, E.P.; Charitidis, C.A. Production and 3D Printing Processing of Bio-Based Thermoplastic Filament. Manuf. Rev. 2017, 4, 1. [Google Scholar] [CrossRef]
- Wichmann, H.-E. Diesel Exhaust Particles. Inhal. Toxicol. 2007, 19 (Suppl. 1), 241–244. [Google Scholar] [CrossRef] [PubMed]
- Oberdörster, G.; Oberdörster, E.; Oberdörster, J. Nanotoxicology: An Emerging Discipline Evolving from Studies of Ultrafine Particles. Environ. Health Perspect. 2005, 113, 823–839. [Google Scholar] [CrossRef] [PubMed]
- Mansfield, E.; Kaiser, L.; Fujita, D.; van de Voorde, M. Metrology and Standardization for Nanotechnology: Protocols and Industrial Innovations; Wiley: Weinheim, Germany, 2017. [Google Scholar]
- Zhang, Q.; Wong, J.P.S.; Davis, A.Y.; Black, M.S.; Weber, R.J. Characterization of Particle Emissions from Consumer Fused Deposition Modeling 3D Printers. Aerosol Sci. Technol. 2017, 51, 1275–1286. [Google Scholar] [CrossRef] [Green Version]
- Ding, S.; Ng, B.F.; Shang, X.; Liu, H.; Lu, X.; Wan, M.P. The Characteristics and Formation Mechanisms of Emissions from Thermal Decomposition of 3D Printer Polymer Filaments. Sci. Total Environ. 2019, 692, 984–994. [Google Scholar] [CrossRef]
- Deng, Y.; Cao, S.-J.; Chen, A.; Guo, Y. The Impact of Manufacturing Parameters on Submicron Particle Emissions from a Desktop 3D Printer in the Perspective of Emission Reduction. Build. Environ. 2016, 104, 311–319. [Google Scholar] [CrossRef]
- Gümperlein, I.; Fischer, E.; Dietrich-Gümperlein, G.; Karrasch, S.; Nowak, D.; Jörres, R.A.; Schierl, R. Acute Health Effects of Desktop 3D Printing (Fused Deposition Modeling) Using Acrylonitrile Butadiene Styrene and Polylactic Acid Materials: An Experimental Exposure Study in Human Volunteers. Indoor Air 2018, 28, 611–623. [Google Scholar] [CrossRef]
- Chan, F.L.; House, R.; Kudla, I.; Lipszyc, J.C.; Rajaram, N.; Tarlo, S.M. Health Survey of Employees Regularly Using 3D Printers. Occup. Med. Oxf. Engl. 2018, 68, 211–214. [Google Scholar] [CrossRef] [Green Version]
- House, R.; Rajaram, N.; Tarlo, S.M. Case Report of Asthma Associated with 3D Printing. Occup. Med. Oxf. Engl. 2017, 67, 652–654. [Google Scholar] [CrossRef] [Green Version]
- Li, A.J.; Pal, V.K.; Kannan, K. A Review of Environmental Occurrence, Toxicity, Biotransformation and Biomonitoring of Volatile Organic Compounds. Environ. Chem. Ecotoxicol. 2021, 3, 91–116. [Google Scholar] [CrossRef]
- Wojtyła, S.; Klama, P.; Baran, T. Is 3D Printing Safe? Analysis of the Thermal Treatment of Thermoplastics: ABS, PLA, PET, and Nylon. J. Occup. Environ. Hyg. 2017, 14, D80–D85. [Google Scholar] [CrossRef] [PubMed]
- Mohammadian, Y.; Nasirzadeh, N. Toxicity Risks of Occupational Exposure in 3D Printing and Bioprinting Industries: A Systematic Review. Toxicol. Ind. Health 2021, 37, 573–584. [Google Scholar] [CrossRef] [PubMed]
- Organisation for Economic Co-operation and Development. ENV/JM/MONO(2010)47 Compilation and Comparison of Guidelines Related to Exposure to Nanomaterials in Laboratories. 2010. Available online: http://www.oecd.org/officialdocuments/displaydocument/?cote=env/jm/mono(2010)47&doclanguage=en (accessed on 25 February 2022).
- Dobrzyńska, E.; Kondej, D.; Kowalska, J.; Szewczyńska, M. State of the Art in Additive Manufacturing and Its Possible Chemical and Particle Hazards—Review. Indoor Air 2021, 31, 1733–1758. [Google Scholar] [CrossRef]
- Stefaniak, A.B.; Bowers, L.N.; Knepp, A.K.; Virji, M.A.; Birch, E.M.; Ham, J.E.; Wells, J.R.; Qi, C.; Schwegler-Berry, D.; Friend, S.; et al. Three-Dimensional Printing with Nano-Enabled Filaments Releases Polymer Particles Containing Carbon Nanotubes into Air. Indoor Air 2018, 28, 840–851. [Google Scholar] [CrossRef]
- Alberts, E.; Ballentine, M.; Barnes, E.; Kennedy, A. Impact of Metal Additives on Particle Emission Profiles from a Fused Filament Fabrication 3D Printer. Atmos. Environ. 2021, 244, 117956. [Google Scholar] [CrossRef]
- Mendes, L.; Kangas, A.; Kukko, K.; Mølgaard, B.; Säämänen, A.; Kanerva, T.; Flores Ituarte, I.; Huhtiniemi, M.; Stockmann-Juvala, H.; Partanen, J.; et al. Characterization of Emissions from a Desktop 3D Printer. J. Ind. Ecol. 2017, 21 (Suppl. S1), S94–S106. [Google Scholar] [CrossRef]
- Organisation for Economic Co-operation and Development. ENV/JM/MONO (2015)19 Harmonized Tiered Approach to Measure and Assess the Potential Exposure to Airborne Emissions of Engineered Nano-Objects and Their Agglomerates and Aggregates at Workplaces; OECD: Paris, France, 2015. [Google Scholar]
- Eastlake, A.C.; Beaucham, C.; Martinez, K.F.; Dahm, M.M.; Sparks, C.; Hodson, L.L.; Geraci, C.L. Refinement of the Nanoparticle Emission Assessment Technique into the Nanomaterial Exposure Assessment Technique (NEAT 2.0). J. Occup. Environ. Hyg. 2016, 13, 708–717. [Google Scholar] [CrossRef] [Green Version]
- UL Chemical Safety, Underwriters Laboratories Inc. ANSI/CAN/UL 2904 Standard Method for Testing and Assessing Particle and Chemical Emissions from 3D Printers; UL Chemical Safety, Underwriters Laboratories Inc.: Marietta, GA, USA, 2019. [Google Scholar]
- Stefaniak, A.B.; Johnson, A.R.; du Preez, S.; Hammond, D.R.; Wells, J.R.; Ham, J.E.; LeBouf, R.F.; Menchaca, K.W.; Martin, S.B.; Duling, M.G.; et al. Evaluation of Emissions and Exposures at Workplaces Using Desktop 3-Dimensional Printers. J. Chem. Health Saf. 2019, 26, 19–30. [Google Scholar] [CrossRef]
- Zontek, T.L.; Ogle, B.R.; Jankovic, J.T.; Hollenbeck, S.M. An Exposure Assessment of Desktop 3D Printing. J. Chem. Health Saf. 2017, 24, 15–25. [Google Scholar] [CrossRef] [Green Version]
- EN 1540:2022; Workplace Exposure—Terminology. CEN-CENELEC Management Centre: Brussels, Belgium, 2022.
- Youn, J.-S.; Seo, J.-W.; Han, S.; Jeon, K.-J. Characteristics of Nanoparticle Formation and Hazardous Air Pollutants Emitted by 3D Printer Operations: From Emission to Inhalation. RSC Adv. 2019, 9, 19606–19612. [Google Scholar] [CrossRef] [Green Version]
- Stephens, B.; Azimi, P.; El Orch, Z.; Ramos, T. Ultrafine Particle Emissions from Desktop 3D Printers. Atmos. Environ. 2013, 79, 334–339. [Google Scholar] [CrossRef]
- Sloan, C.D.; Philipp, T.J.; Bradshaw, R.K.; Chronister, S.; Barber, W.B.; Johnston, J.D. Applications of GPS-Tracked Personal and Fixed-Location PM2.5 Continuous Exposure Monitoring. J. Air Waste Manag. Assoc. 2016, 66, 53–65. [Google Scholar] [CrossRef] [PubMed] [Green Version]
- Repair3D—Recycling and Repurposing of Plastic Waste For Advanced 3D Printing Applications. Available online: https://www.repair3d.net/ (accessed on 1 April 2022).
- Viitanen, A.-K.; Kallonen, K.; Kukko, K.; Kanerva, T.; Saukko, E.; Hussein, T.; Hämeri, K.; Säämänen, A. Technical Control of Nanoparticle Emissions from Desktop 3D Printing. Indoor Air 2021, 31, 1061–1071. [Google Scholar] [CrossRef]
- Deutsche Gesetzliche Unfallversicherung. IFA—Technical Information: Ultrafine Aerosols and Nanoparticles at the Workplace. Available online: https://www.dguv.de/ifa/fachinfos/nanopartikel-am-arbeitsplatz/beurteilung-von-schutzmassnahmen/index-2.jsp (accessed on 25 February 2022).
- van Broekhuizen, P.; van Veelen, W.; Streekstra, W.-H.; Schulte, P.; Reijnders, L. Exposure Limits for Nanoparticles: Report of an International Workshop on Nano Reference Values. Ann. Occup. Hyg. 2012, 56, 515–524. [Google Scholar] [CrossRef] [PubMed] [Green Version]
- Baybutt, P. The ALARP Principle in Process Safety. Process Saf. Prog. 2014, 33, 36–40. [Google Scholar] [CrossRef]
- Heitbrink, W.A.; Lo, L.-M.; Dunn, K.H. Exposure Controls for Nanomaterials at Three Manufacturing Sites. J. Occup. Environ. Hyg. 2015, 12, 16–28. [Google Scholar] [CrossRef] [Green Version]
- Zhang, Q.; Gangupomu, R.H.; Ramirez, D.; Zhu, Y. Measurement of Ultrafine Particles and Other Air Pollutants Emitted by Cooking Activities. Int. J. Environ. Res. Public Health 2010, 7, 1744–1759. [Google Scholar] [CrossRef]
- Azimi, P.; Zhao, D.; Pouzet, C.; Crain, N.E.; Stephens, B. Emissions of Ultrafine Particles and Volatile Organic Compounds from Commercially Available Desktop Three-Dimensional Printers with Multiple Filaments. Environ. Sci. Technol. 2016, 50, 1260–1268. [Google Scholar] [CrossRef]
- Tang, C.-L.; Seeger, S. Systematic Ranking of Filaments Regarding Their Particulate Emissions during Fused Filament Fabrication 3D Printing by Means of a Proposed Standard Test Method. Indoor Air 2022, 32, e13010. [Google Scholar] [CrossRef]
- Blok, L.G.; Longana, M.L.; Yu, H.; Woods, B.K.S. An Investigation into 3D Printing of Fibre Reinforced Thermoplastic Composites. Addit. Manuf. 2018, 22, 176–186. [Google Scholar] [CrossRef]
- Pervaiz, S.; Qureshi, T.A.; Kashwani, G.; Kannan, S. 3D Printing of Fiber-Reinforced Plastic Composites Using Fused Deposition Modeling: A Status Review. Materials 2021, 14, 4520. [Google Scholar] [CrossRef] [PubMed]
- American Conference of Governmental Industrial Hygienists; Committee on Industrial Ventilation. Industrial Ventilation: A Manual of Recommended Practice; American Conference of Governmental Industrial Hygienists: Cincinnati, OH, USA, 1998. [Google Scholar]
- Zhou, Y.; Kong, X.; Chen, A.; Cao, S. Investigation of Ultrafine Particle Emissions of Desktop 3D Printers in the Clean Room. Procedia Eng. 2015, 121, 506–512. [Google Scholar] [CrossRef] [Green Version]
- Yi, J.; LeBouf, R.F.; Duling, M.G.; Nurkiewicz, T.; Chen, B.T.; Schwegler-Berry, D.; Virji, M.A.; Stefaniak, A.B. Emission of Particulate Matter from a Desktop Three-Dimensional (3D) Printer. J. Toxicol. Environ. Health A 2016, 79, 453–465. [Google Scholar] [CrossRef]
- Seeger, S.; Brödner, D.; Wilke, O.; Jacobi, T.; Rasch, F.; Rothhardt, M. Emissions of Fine and Ultrafine Particles and Volatile Organic Compounds from Different Filament Materials Operated on a Low-Cost 3D Printer. Gefahrst. Reinhalt. Luft 2018, 78, 79–87. [Google Scholar]
- Viitanen, A.-K.; Uuksulainen, S.; Koivisto, A.J.; Hämeri, K.; Kauppinen, T. Workplace Measurements of Ultrafine Particles—A Literature Review. Ann. Work Expo. Health 2017, 61, 749–758. [Google Scholar] [CrossRef]
- Gu, J.; Uhde, E.; Wensing, M.; Xia, F.; Salthammer, T. Emission Control of Desktop 3D Printing: The Effects of a Filter Cover and an Air Purifier. Environ. Sci. Technol. Lett. 2019, 6, 499–503. [Google Scholar] [CrossRef]
- ISO 45001:2018; Occupational Health and Safety Management Systems—Requirements with Guidance for Use. ISO: Geneva, Switzerland, 2018.
- Min, K.; Li, Y.; Wang, D.; Chen, B.; Ma, M.; Hu, L.; Liu, Q.; Jiang, G. 3D Printing-Induced Fine Particle and Volatile Organic Compound Emission: An Emerging Health Risk. Environ. Sci. Technol. Lett. 2021, 8, 616–625. [Google Scholar] [CrossRef]
- Leso, V.; Ercolano, M.L.; Mazzotta, I.; Romano, M.; Cannavacciuolo, F.; Iavicoli, I. Three-Dimensional (3D) Printing: Implications for Risk Assessment and Management in Occupational Settings. Ann. Work Expo. Health 2021, 65, 617–634. [Google Scholar] [CrossRef]
- Kyung-ho Park, S.K. Characteristics of Ultrafine Particle Emission Change Depending on the Placement of Ventilation Systems in 3D Printer Working Environment; AIVC: Rotterdam, The Netherlands, 2019. [Google Scholar]
- Great Britain Health and Safety Executive. General Ventilation in the Workplace: Guidance for Employers; HSG202; Health Safety Executive: Sudbury, UK, 2000.
- Prevention through Design: Insights from Computational Fluid Dynamics Modeling to Predict Exposure to Ultrafine Particles from 3D Printing. J. Toxicol. Environ. Health Part A 2021, 84, 458–474. [CrossRef]
- Chýlek, R.; Kudela, L.; Pospíšil, J.; Šnajdárek, L. Parameters Influencing the Emission of Ultrafine Particles during 3D Printing. Int. J. Environ. Res. Public Health 2021, 18, 11670. [Google Scholar] [CrossRef] [PubMed]
- Jeon, H.; Park, J.; Kim, S.; Park, K.; Yoon, C. Effect of Nozzle Temperature on the Emission Rate of Ultrafine Particles during 3D Printing. Indoor Air 2020, 30, 306–314. [Google Scholar] [CrossRef] [PubMed]
- Karayannis, P.; Saliakas, S.; Kokkinopoulos, I.; Damilos, S.; Koumoulos, E.P.; Gkartzou, E.; Gomez, J.; Charitidis, C. Facilitating Safe FFF 3D Printing: A Prototype Material Case Study. Sustainability 2022, 14, 3046. [Google Scholar] [CrossRef]
- Kim, B.; Shin, J.H.; Kim, H.P.; Jo, M.S.; Kim, H.S.; Lee, J.S.; Lee, H.K.; Kwon, H.C.; Han, S.G.; Kang, N.; et al. Assessment and Mitigation of Exposure of 3-D Printer Emissions. Front. Toxicol. 2022, 3, 817454. [Google Scholar] [CrossRef]
- Lee, J.H.; Lee, S.-B.; Bae, G.N.; Jeon, K.S.; Yoon, J.U.; Ji, J.H.; Sung, J.H.; Lee, B.G.; Lee, J.H.; Yang, J.S.; et al. Exposure Assessment of Carbon Nanotube Manufacturing Workplaces. Inhal. Toxicol. 2010, 22, 369–381. [Google Scholar] [CrossRef]


| Case 1 | Case 2 | Case 3 | Case 4 | ||||
|---|---|---|---|---|---|---|---|
| 3a | 3b | 4a | 4b | ||||
| Process | FFF 3D printing | FFF 3D printing | Continuous Fibre Reinforcement (CFR) | Continuous Fibre Reinforcement (CFR) | |||
| 3D printer | Raise3D Pro2 Plus- enclosure cap removed | Raise3D Pro2 Raise3D Pro2 Plus | Markforged Industrial X7 | Modified Prusa i3 MK3S | |||
| Raise 3D Technologies Inc., Irvine, CA, USA. | Markforged, Watertown, MA, USA | Prusa Research a.s., Prague, Czech Republic | |||||
| Workroom Ventilation/Air Filtration | Negative pressure mechanical ventilation, air purifier with HEPA filter | Negative pressure mechanical ventilation, air purifier with HEPA filter | General ventilation through an open window | Air purifier with HEPA filter | No ventilation | Mechanical ventilation (10 ACH), local exhaust | |
| Workroom | Volume | 45 m3 | 45 m3 | 15 m3 | 20 m3 | 40 m3 | |
| Temperature | ~30 °C | ~30 °C | ~20 °C | ~20 °C | ~20 °C | ||
| Humidity | 40% | 40% | 40% | 40% | 40% | ||
| Filaments Used (colour) | Non-commercial TPU with Carbon fibres 27.2% w/w (black) | MasterFill PLA Pro (natural) PolyFlex™ TPU95 (orange) PolyMide™ CoPA (black) Spectrum PETG (yellow) | Markforged 800cc Onyx FR (black) + Markforged Carbon Fiber | Easyprint PLA (natural) + Markforged Carbon Fiber | |||
| Process | Measurement Duration | Full or near full 8 h workday | ≈2 h | ||||
| Time Per Print | 45 min | 10–30 min | 4–6 h | 10–20 min | |||
| Object | Square mono-shell tower (1 × 1 × 5 cm) | Square mono-shell tower (1 × 1 × 2 cm) | Fan (radius ≈ 10 cm) | Rectangular (1 × 4 × 0.2 cm) | |||
| Nozzle Temperature | 210–230 °C (increasing) | PLA-215 °C TPU-230 °C CoPA-250 °C PETG-250 °C | Onyx-275 °C CF-230 °C | 200 °C | |||
| Bed Temperature | Not heated | Not heated | Not heated | 50 °C | |||
| Operator Involvement | Filament loading-unloading Print starting Removal of failed prints, purged material Regular monitoring | Print Starting Remote monitoring | Filament loading-unloading Print starting Removal of failed prints, purged material Regular monitoring | ||||
| Incidental Emissions | Negligible transfer of particles from 3D printing at adjacent room | Negligible transfer of particles from 3D printing at adjacent room | No incidental emission expected | No incidental emission expected | |||
| Enclosure Specifications | No enclosure | Built-in non-airtight enclosure with dedicated air fan equipped with HEPA filter | Built-in non-airtight enclosure without air filtration/removal. | No enclosure | |||
| Concentration Peaks (#/cm3) | Max. Peak (#/cm3) | Peak Time (hh:mm) | Max. 15 min Mean (#/cm3) | Corresponding Emission Events | 15 min Threshold Exceeded (80,000 #/cm3) |
|---|---|---|---|---|---|
| 233,000 | 11:09 | 123,700 | Filament Load | Yes | |
| Background Mean (#/cm3) | 6400 | ||||
| Full Workday Concentration Mean (#/cm3) | 12,500 | ||||
| Eight hour threshold exceeded (40,000 #/cm3) | No | ||||
| Concentration Peaks (#/cm3) | Max. Peak (#/cm3) | Peak Time (hh:mm) | Max. 15 min Mean (#/cm3) | Corresponding Emission Events | 15 min Threshold Exceeded (80,000 #/cm3) |
|---|---|---|---|---|---|
| 110,000 | 13:34 | 77,800 | Filament Loading/Unloading (PLA to TPU) Print Start (CoPA) | No | |
| Background Mean (#/cm3) | 1700 | ||||
| Full Workday Concentration Mean (#/cm3) | 16,900 | ||||
| Eight hour threshold exceeded (40,000 #/cm3) | No | ||||
| Case | Case 3a No Controls | Case 3b Air Purifier Active |
|---|---|---|
| Background Mean (#/cm3) | 4100 | 3400 |
| Max. 15 min mean (#/cm3) | 15,400 | 33,800 |
| Corresponding emission events | Printing | Printing |
| 15 min threshold exceeded (80,000 #/cm3) | No | No |
| Full Workday Concentration Mean (#/cm3) | 6800 | 11,800 |
| Eight hour threshold exceeded (40,000 #/cm3) | No | No |
Publisher’s Note: MDPI stays neutral with regard to jurisdictional claims in published maps and institutional affiliations. |
© 2022 by the authors. Licensee MDPI, Basel, Switzerland. This article is an open access article distributed under the terms and conditions of the Creative Commons Attribution (CC BY) license (https://creativecommons.org/licenses/by/4.0/).
Share and Cite
Saliakas, S.; Karayannis, P.; Kokkinopoulos, I.; Damilos, S.; Gkartzou, E.; Zouboulis, P.; Karatza, A.; Koumoulos, E.P. Fused Filament Fabrication 3D Printing: Quantification of Exposure to Airborne Particles. J. Compos. Sci. 2022, 6, 119. https://doi.org/10.3390/jcs6050119
Saliakas S, Karayannis P, Kokkinopoulos I, Damilos S, Gkartzou E, Zouboulis P, Karatza A, Koumoulos EP. Fused Filament Fabrication 3D Printing: Quantification of Exposure to Airborne Particles. Journal of Composites Science. 2022; 6(5):119. https://doi.org/10.3390/jcs6050119
Chicago/Turabian StyleSaliakas, Stratos, Panagiotis Karayannis, Ioannis Kokkinopoulos, Spyridon Damilos, Eleni Gkartzou, Panagiotis Zouboulis, Anna Karatza, and Elias P. Koumoulos. 2022. "Fused Filament Fabrication 3D Printing: Quantification of Exposure to Airborne Particles" Journal of Composites Science 6, no. 5: 119. https://doi.org/10.3390/jcs6050119