Article

Mixed-Mode I/II Testing of Composite Materials—A Refined Data Reduction Scheme for the Wedge-Loaded Asymmetric Double Cantilever Beam Test

1
Fraunhofer EMI, Ernst-Zermelo-Str.4, 79104 Freiburg, Germany
2
Chair of Ceramic Materials Engineering, University of Bayreuth, Prof.-Rüdiger-Bormann-Str. 1, 95447 Bayreuth, Germany
*
Author to whom correspondence should be addressed.
J. Compos. Sci. 2022, 6(10), 319; https://doi.org/10.3390/jcs6100319
Submission received: 9 September 2022 / Revised: 10 October 2022 / Accepted: 14 October 2022 / Published: 18 October 2022
(This article belongs to the Special Issue Characterization and Modelling of Composites, Volume III)

Abstract

:
The wedge-loaded asymmetric double cantilever beam (WADCB) test is an experimental method to determine the mixed-mode I/II fracture toughness of composite materials by inserting a wedge into the specimen along a potential delamination path. Whilst the current closed-form solution for the ADCB test assumes identical forces acting in both specimen arms, this manuscript proposes a refined closed-form solution allowing for different forces acting on both specimen arms, which is thought to be more general and more rigorous. WADCB tests were carried out on composites made from Torayca T700SC/2592 unidirectional prepreg. Both the current and the refined closed-form solution were used to analyze the data, and some differences were found in the predictions, indicating that the forces in the two specimen arms are indeed not identical.

1. Introduction

Fiber-reinforced polymer matrix composite materials have been introduced into load-bearing structures by the aerospace industry due to their high weight specific strength and weight specific stiffness, which offer the potential for significant weight reductions compared to metallic solutions [1]. In services, these composite structures may be subjected to out-of-plane impact loading, for example by a tool drop, hailstones, or bird impact, which may result in separation of adjacent plies—the so-called delamination [2,3,4,5]. Delamination damage is considered critical for composite materials as the associated loss in stiffness can cause catastrophic failure of the structure, particularly when loaded in compression [6]. The resistance of the composite interface to crack propagation, also known as fracture toughness, is a material property. Three different modes of fracture have been defined. Mode I is characterized by out-of-plane tensile crack opening; mode II is characterized by in-plane shear loading; and mode III describes out-of-plane shear loading. In real applications, pure mode loading is extremely rare and mixed mode I/II loading is typical the aforementioned impact scenarios. Several experimental methods have been proposed in order to characterize the mixed-mode I/II fracture toughness.
The Mixed-Mode bending test, originally proposed by Reeder and Crews [7] and further refined by Reeder [8], has been standardized in ASTM D6671 [9]. The method combines the double cantilever beam (DCB) test, used for pure mode I loading, and the end notched flexure (ENF) test, used for mode II loading by introducing the load under bending via a lever arm. The unique feature of this configuration is that it can generate a wide range of mixed-mode ratios by changing the lever arm position of the test apparatus. However, the test fixture is relatively heavy, thus making it difficult to use for the measurement of mixed-mode data under high rates of loading. An alternative test method is the Arcan test [10,11], which however also required a large test fixture, thus making it less promising for application in high-rate loading conditions. Russel and Street [12] proposed the mixed-mode flexure (MMF) specimen, which has some similarities to the MMB test. The main difference is that the MMF test requires different ratios of arm thicknesses in order to produce different mixed-mode ratios, whilst only one specimen configuration is required for the MMB test. Horikawa et al. [13] used this test for high-rate analyses with the Hopkinson bar. For the lower loading rates, the debonding of fiber/matrix interface was the dominant fracture mode, whereas for the higher loading rates, the cohesive fracture of the matrix resin was dominant regardless of mode ratio. It was observed from the results that, with an increase in loading rates, the fracture toughness decreased. Several research groups have worked on the Modified End Notched Flexure (MENF) test [14], or the related Single–Leg Bending (SLB) test [15,16,17,18] and Over Leg Bending (OLB) test [19]. However, these methods suffer from the same drawback as the MMF test. Wosu et al. [20] employed such a specimen in a split Hopkinson Pressure Bar and reported a decrease in fracture toughness with increasing loading rate. Tracy et al. [21] introduced the modified version of single-leg bending by adding a truck on the upper side to overcome the problems of single-leg bending and four-point bending configurations using a hybrid composite comprising IM7 and AS4 fibers in a 3501-6 epoxy matrix specimen. This configuration offers several advantages such as eliminating the double crack growth problem in four-point bending test; variation in the mode ratio as a function of crack length typical of SLB; no need for a complex apparatus, the use of a non-linear numerical analysis, small test coupons, and a straightforward test fixture. However, this configuration has a limitation of allowing only one delamination to propagate from a central notch via through-thickness clamping constraints [22]. Johnson [23] proposed the Cracked Lap Shear (CLS) Test. Here, one specimen arm is uniaxially loaded, resulting in mixed mode I/II conditions at the crack tip. Despite the simplicity of the test being performed as a tensile test in a universal test machine, the CLS specimen has few significant drawbacks. Firstly, there is no applicable closed form solution to calculate mixed-mode I/II ratios using stress analysis. Therefore, numerical analysis is required. Secondly, a geometrically non-linear numerical analysis may be required to evaluate the contributions to the fracture toughness associated with mode I (GI)and mode II (GII) because of large rotations that can be generated from the load eccentricity at the delamination front. Furthermore, to create various mixed-mode-I/II ratios, different ply setups will be needed. Hooper and Hwu [24] proposed a sub-laminate approach based on the theory by Armanios and Rehfield [25] to evaluate the interlaminar stresses in the CLS specimen. Whilst this analysis was capable of predicting the shear stresses, the method failed to predict the mode I component of the stress. Szekrényes proposed two new different configurations named Prestressed End Notched Flexure (PENF) test [26] and Pre-stressed End Loaded Split (PELS) [27] test. Both configurations included a roller attached inside the specimen to maintain the mode-I crack opening, and the load is applied in a three-point bending test manner. These two configurations offer several advantages such as straightforward specimen geometry and simple experimental equipment (three-point bending setup and steel rollers). Both PENF and PELS specimens can produce any mode ratio at crack propagation onset. Traditional data-reduction techniques (compliance calibration method and classical beam theory) can be applied for data evaluation. Despite these advantages, these configurations have some drawbacks, such as suitable only for transparent composites; the mode ratio cannot be calculated without performing the experiments. The mode ratio will depend on the definition of the crack initiation and the accuracy of the measurement of the load and crack length. Lander et al. [28] proposed the asymmetric cut ply specimen, which features central surface notches by laying-up cut plies from the upper laminate surface to the through-thickness mid-plane, where a release film is placed as crack starter. The specimen is then loaded in four point bending. Bradley and Cohen [29] proposed the asymmetric double cantilever beam (ADCB) test specimen made of unidirectional graphite/epoxy split laminates. Linear beam theory was used to measure the mode I and mode II component of fracture toughness. This configuration offers several advantages such as the ability to generate various mixed-mode ratios, test specimen being a simple coupon geometry, and data reduction being able to be performed with closed-form solutions [30,31,32,33]. However, this specimen needed bonded hinges and the loading system is complicated as it is difficult to keep the two loadings parallel.
Xiao et al. [34] tested bi-materials with a modified ADCB, where the load was using a razor blade, which is pushed into the specimen along the crack interface. They proposed a closed-form solution for the total mode I/II fracture toughness:
G c = 3 · Δ 2 · E 1 · E 2 · h 1 3 · h 2 3 8 · a 4 · ( E 1 · h 1 3 + E 2 · h 2 3 )   ,
where Gc is the total fracture toughness; ∆ is the thickness of the razor blade (mm); E1 and E2 are the moduli of elasticity (N/mm2) of arm 1 and arm 2, respectively; h1 and h2 are the thicknesses (mm) of arm 1 and arm 2, respectively; a is the crack length (mm); and L is the uncracked portion of the specimen (mm).
In May’s review on high-rate fracture mechanics tests for mode I delamination [35], it was concluded that wedge-loaded DCB configurations offer some potential for high-rate mode I testing. In [36], a methodology was successfully derived for high-rate mode I testing using DCB specimens in a Hopkinson bar. It is therefore assumed that such a methodology can also be derived for mixed-mode I/II loading conditions by driving a wedge into an ADCB specimen. However, before moving to high-rate loading conditions, the static test needs to be revisited. Equation (1), as used by Xiao [34], can be derived from first principles, assuming that the forces acting on both specimen arms are identical. However, there are some doubts that this strong assumption is true. Therefore, this manuscript proposes a more generalized closed-form solution for calculating the total fracture toughness Gc from ADCB test data, which allows for variable forces in the opposing arms.

2. Methods

2.1. Material

The material used for this research was Torayca T700SC/2592 unidirectional carbon fiber reinforced prepreg. The thickness of each prepreg sheet is 0.1 mm.

2.2. Specimen Dimensions and Manufacturing
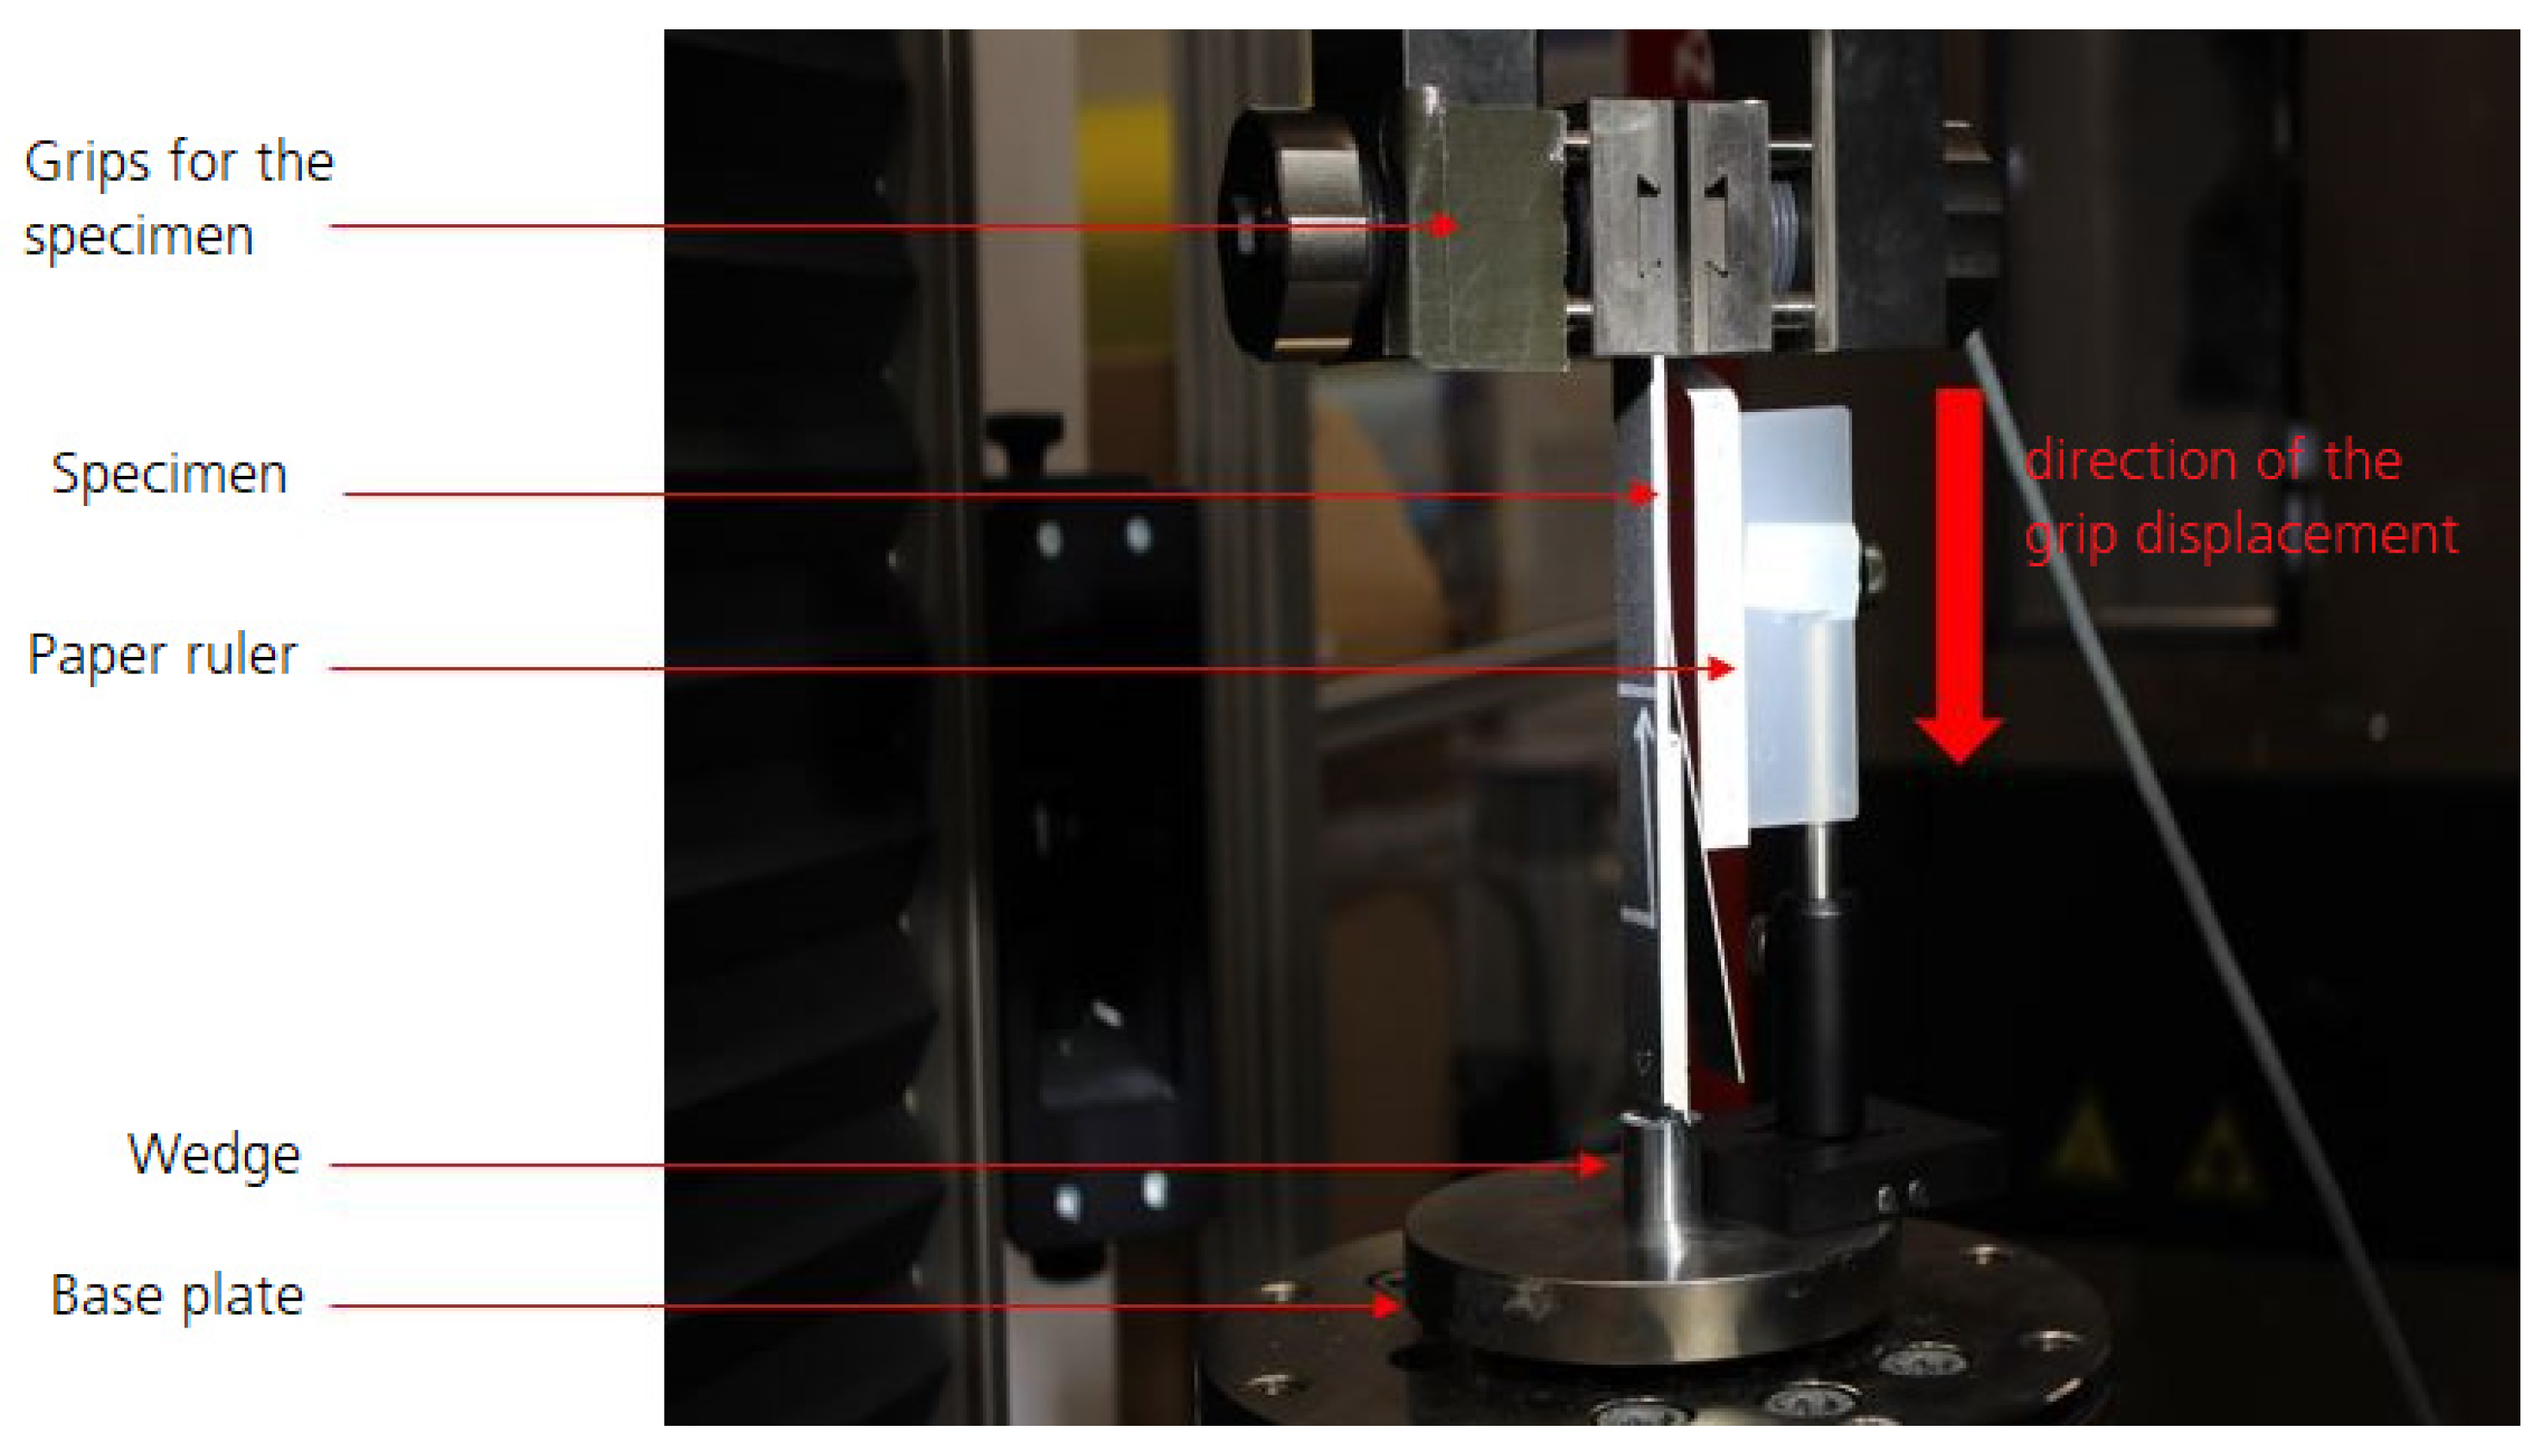
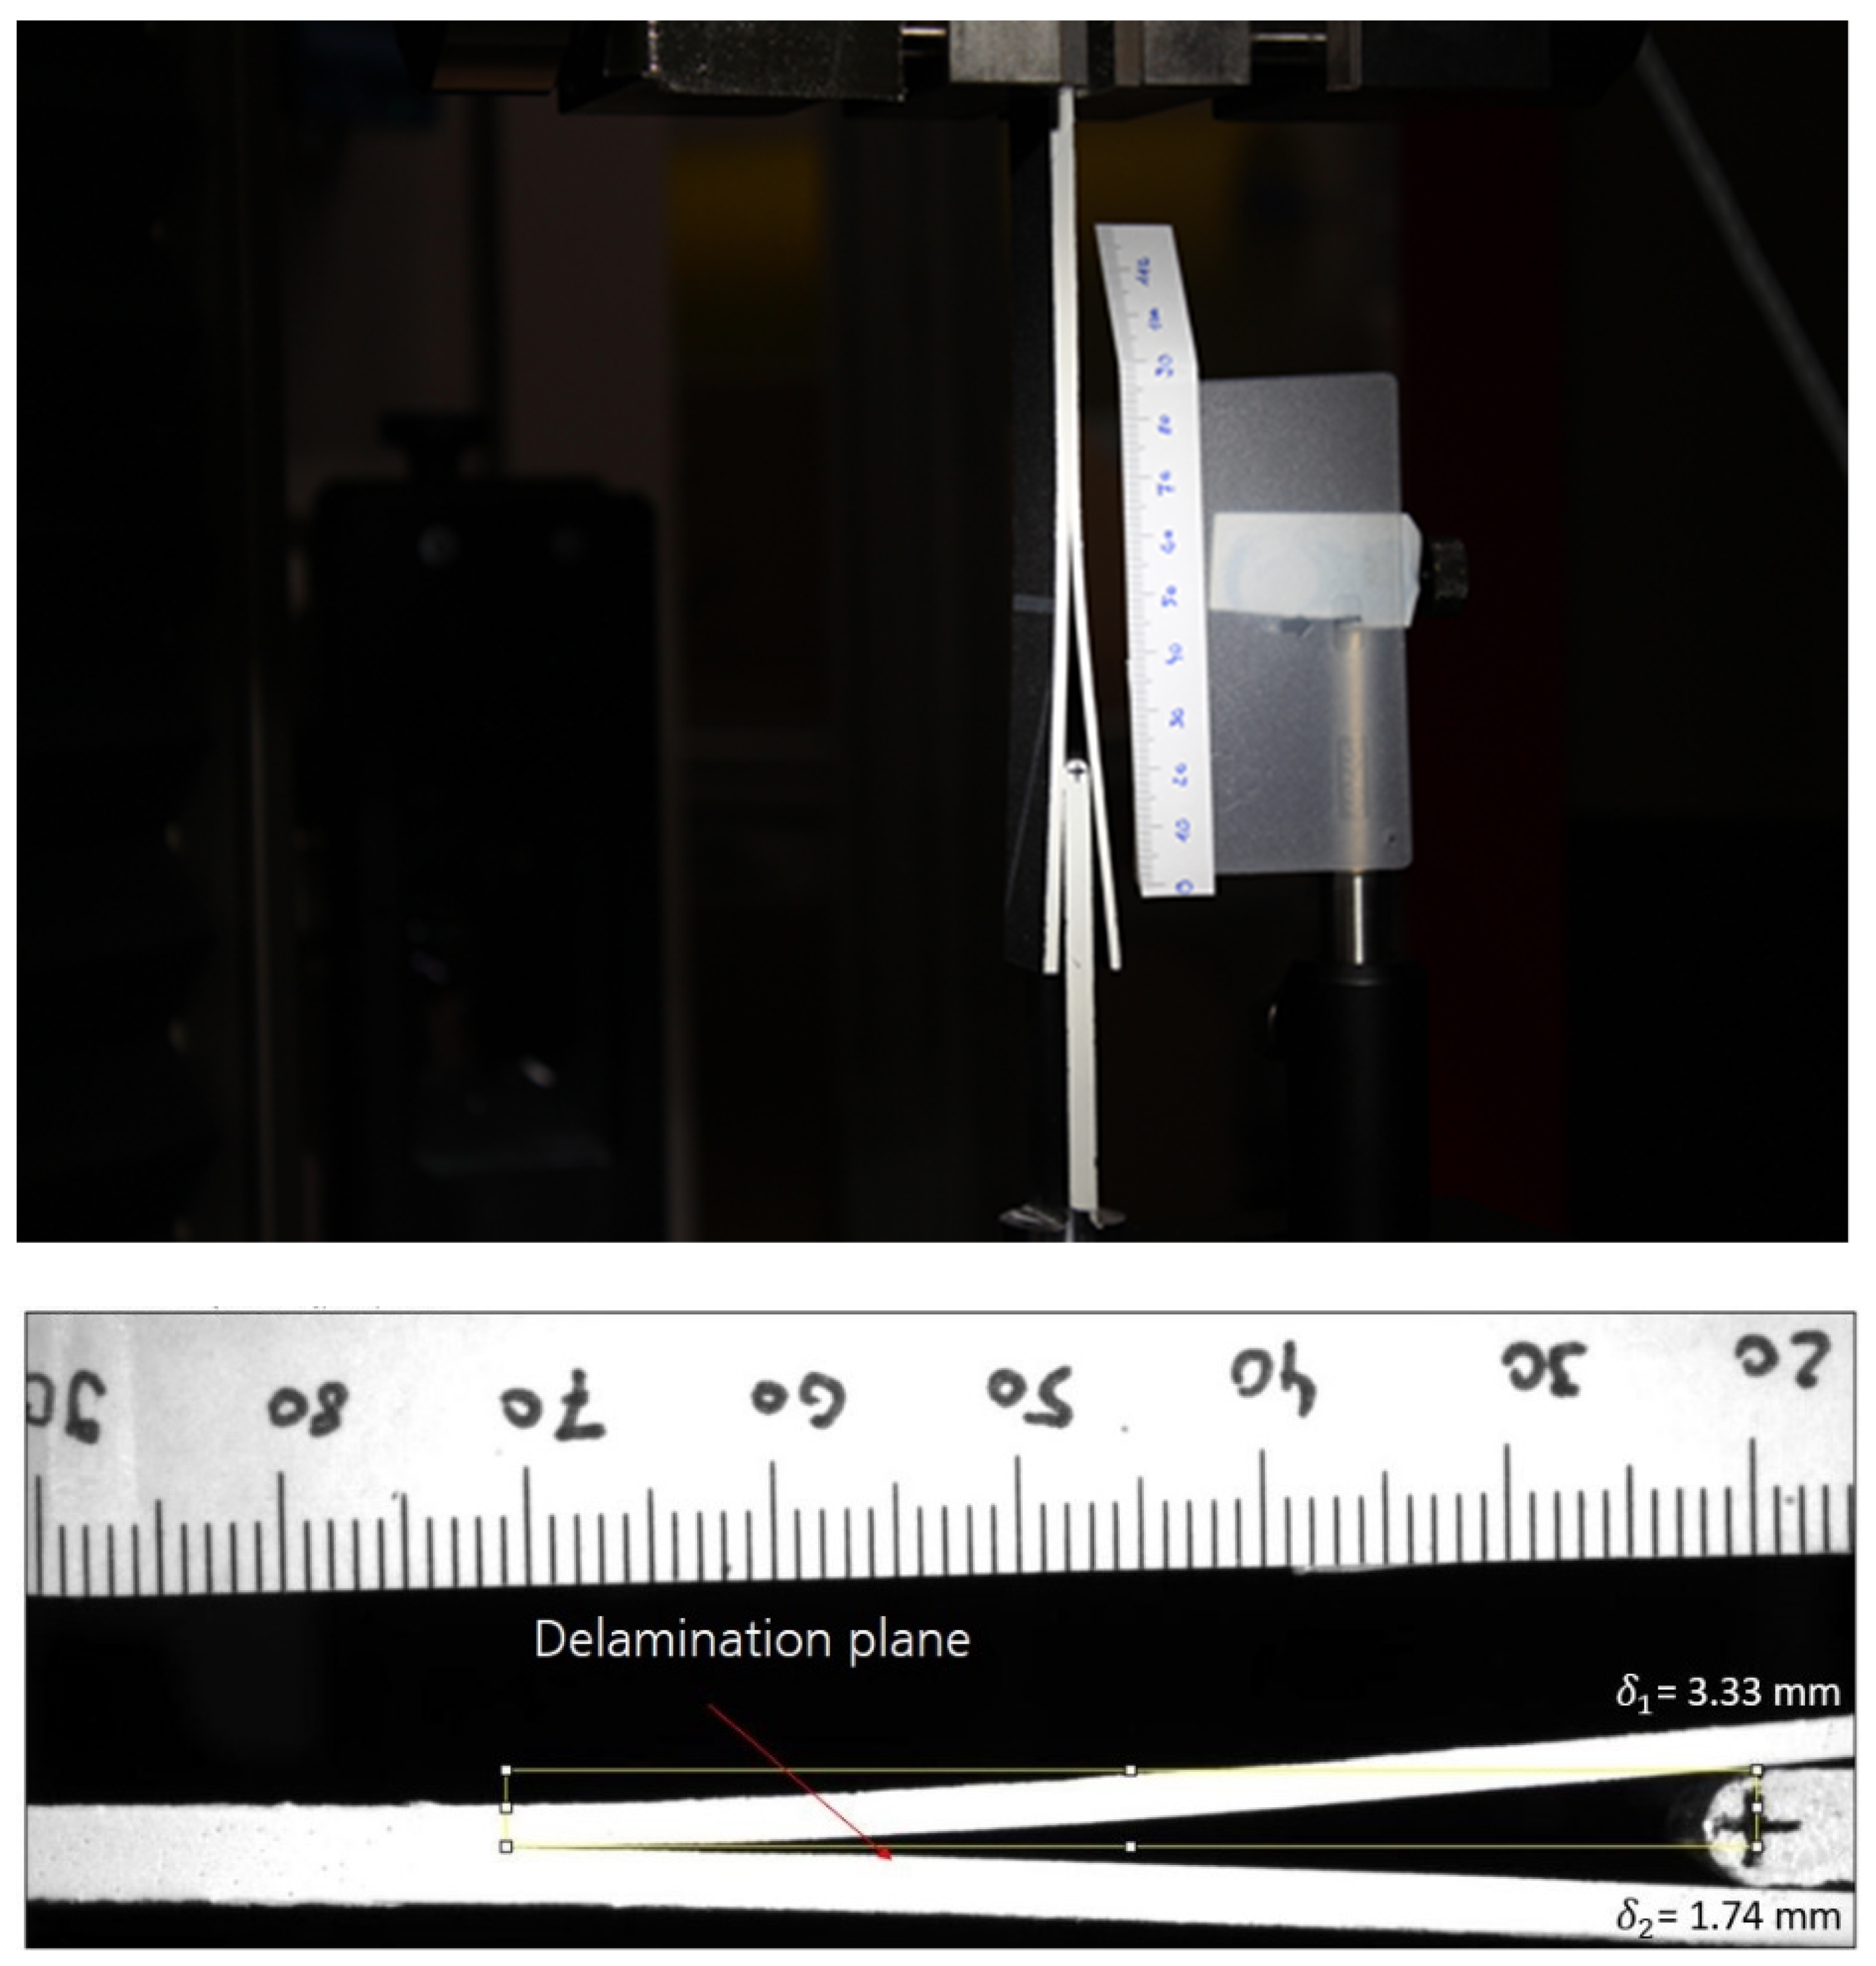
The ADCB specimens with length 170 mm, width 22 mm, and thickness 4 mm were extracted from composite plates of stacking sequence [0]40. The plates were manufactured in an out-of-autoclave process as described in the following: First, the single prepreg sheets were taken from the freezer and allowed to adjust to room temperature in order to enhance adhesion. After that, the prepreg sheets were stacked on top of each other on a steel base plate. A roller was used to remove any air bubbles trapped between the plies to prevent undesired voids inside the specimen. During the stacking process, a Teflon film, thickness 0.0127 mm, was inserted in order to create the required pre-crack. Three different plates were manufactured, for which the Teflon film was inserted at different ply interfaces in order to create specimens with different mixed-mode ratios. For panel A, the Teflon film was inserted after 8 plies; for panel B, the Teflon film was inserted after 13 plies, and for panel C, the Teflon film was inserted after 17 plies. This results in thickness ratios between the two composite arms of 0.25, 0.48, and 0.74, respectively. The thickness ratio is defined as the thickness of the thinner arm divided by the thickness of the thicker arm. A thickness ratio of 1 corresponds, therefore, to a symmetric specimen. After completion of the stacking process, the panels were vacuum-bagged and cured inside an oven for 6 h. The pressure inside the oven was 1 bar (atmospheric pressure), and the curing temperature was 140 °C. After curing, the specimens were extracted from the plates using a high-speed milling machine. The edges of the specimens were painted with white spray paint to allow for better tracking of crack propagation.

2.3. Test Setup

All of the experiments were carried out on a quasi-static Zwick Z250 electro-mechanical test machine, equipped with a load cell of capacity 10 kN with an accuracy class of 0.5. A paper ruler was placed close to the specimens in the test machine in order to have a reference for image analysis. The image analysis further required the setup of a camera system to track and monitor crack propagation in the specimens. For this purpose, a camera type Basler acA2040-90um-NIR USB3 Vision Camera ace 1′’ with CMOSIS CMV4000 NIR-E monochrome 2048 × 2048 Pixel, 90 fps NIR-Enhanced Pixel size 5.5 × 5.5 μm2 and C-mount was used with a Zeiss Milvus 2,0/100 mm macro lens. Figure 1 and Figure 2 show the test setup for the WADCB test in full and in detail, respectively. The wedge, thickness 5.08 mm with rounded front, is the same as in [36], where wedge-loaded symmetric double cantilever beam specimens were successfully tested within a Hopkinson bar. All tests were performed using displacement control with a cross-head displacement of 5 mm/min. It was found that a “floating” wedge, able to glide on a base plate (see Figure 1), was more suited than a fully fixed wedge. The gliding of the wedge on the base plate avoids the introduction of bending loads in the uncracked section of the specimen, which is a major advantage for the calculation of the energy release rate and for the execution of the tests.

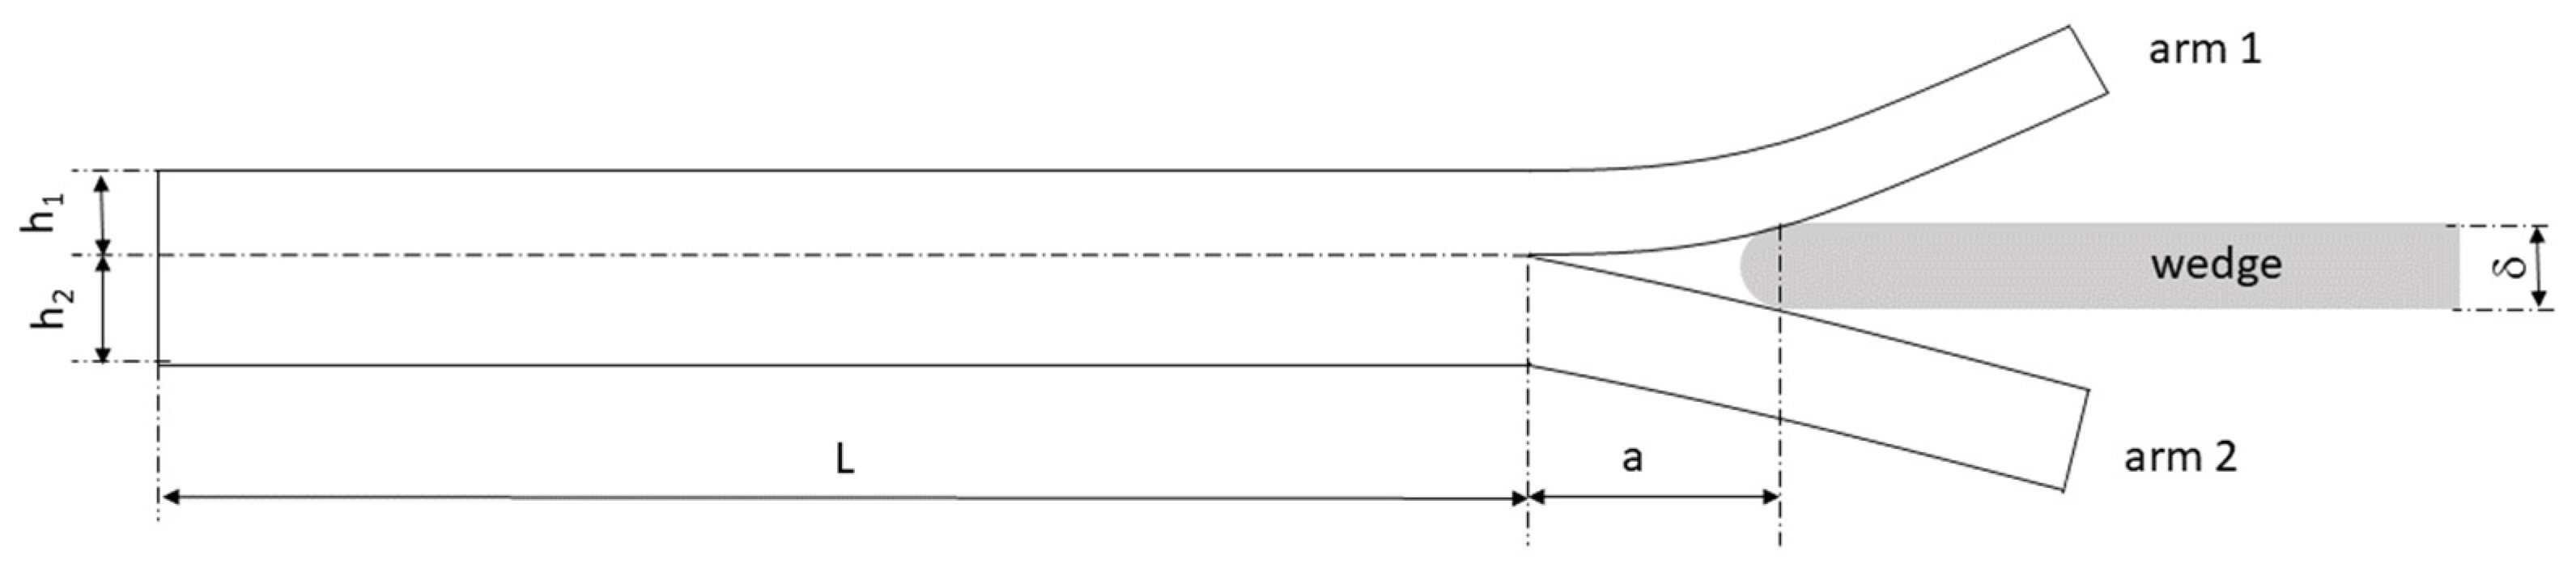
2.4. Novel Closed Form Solution for GC
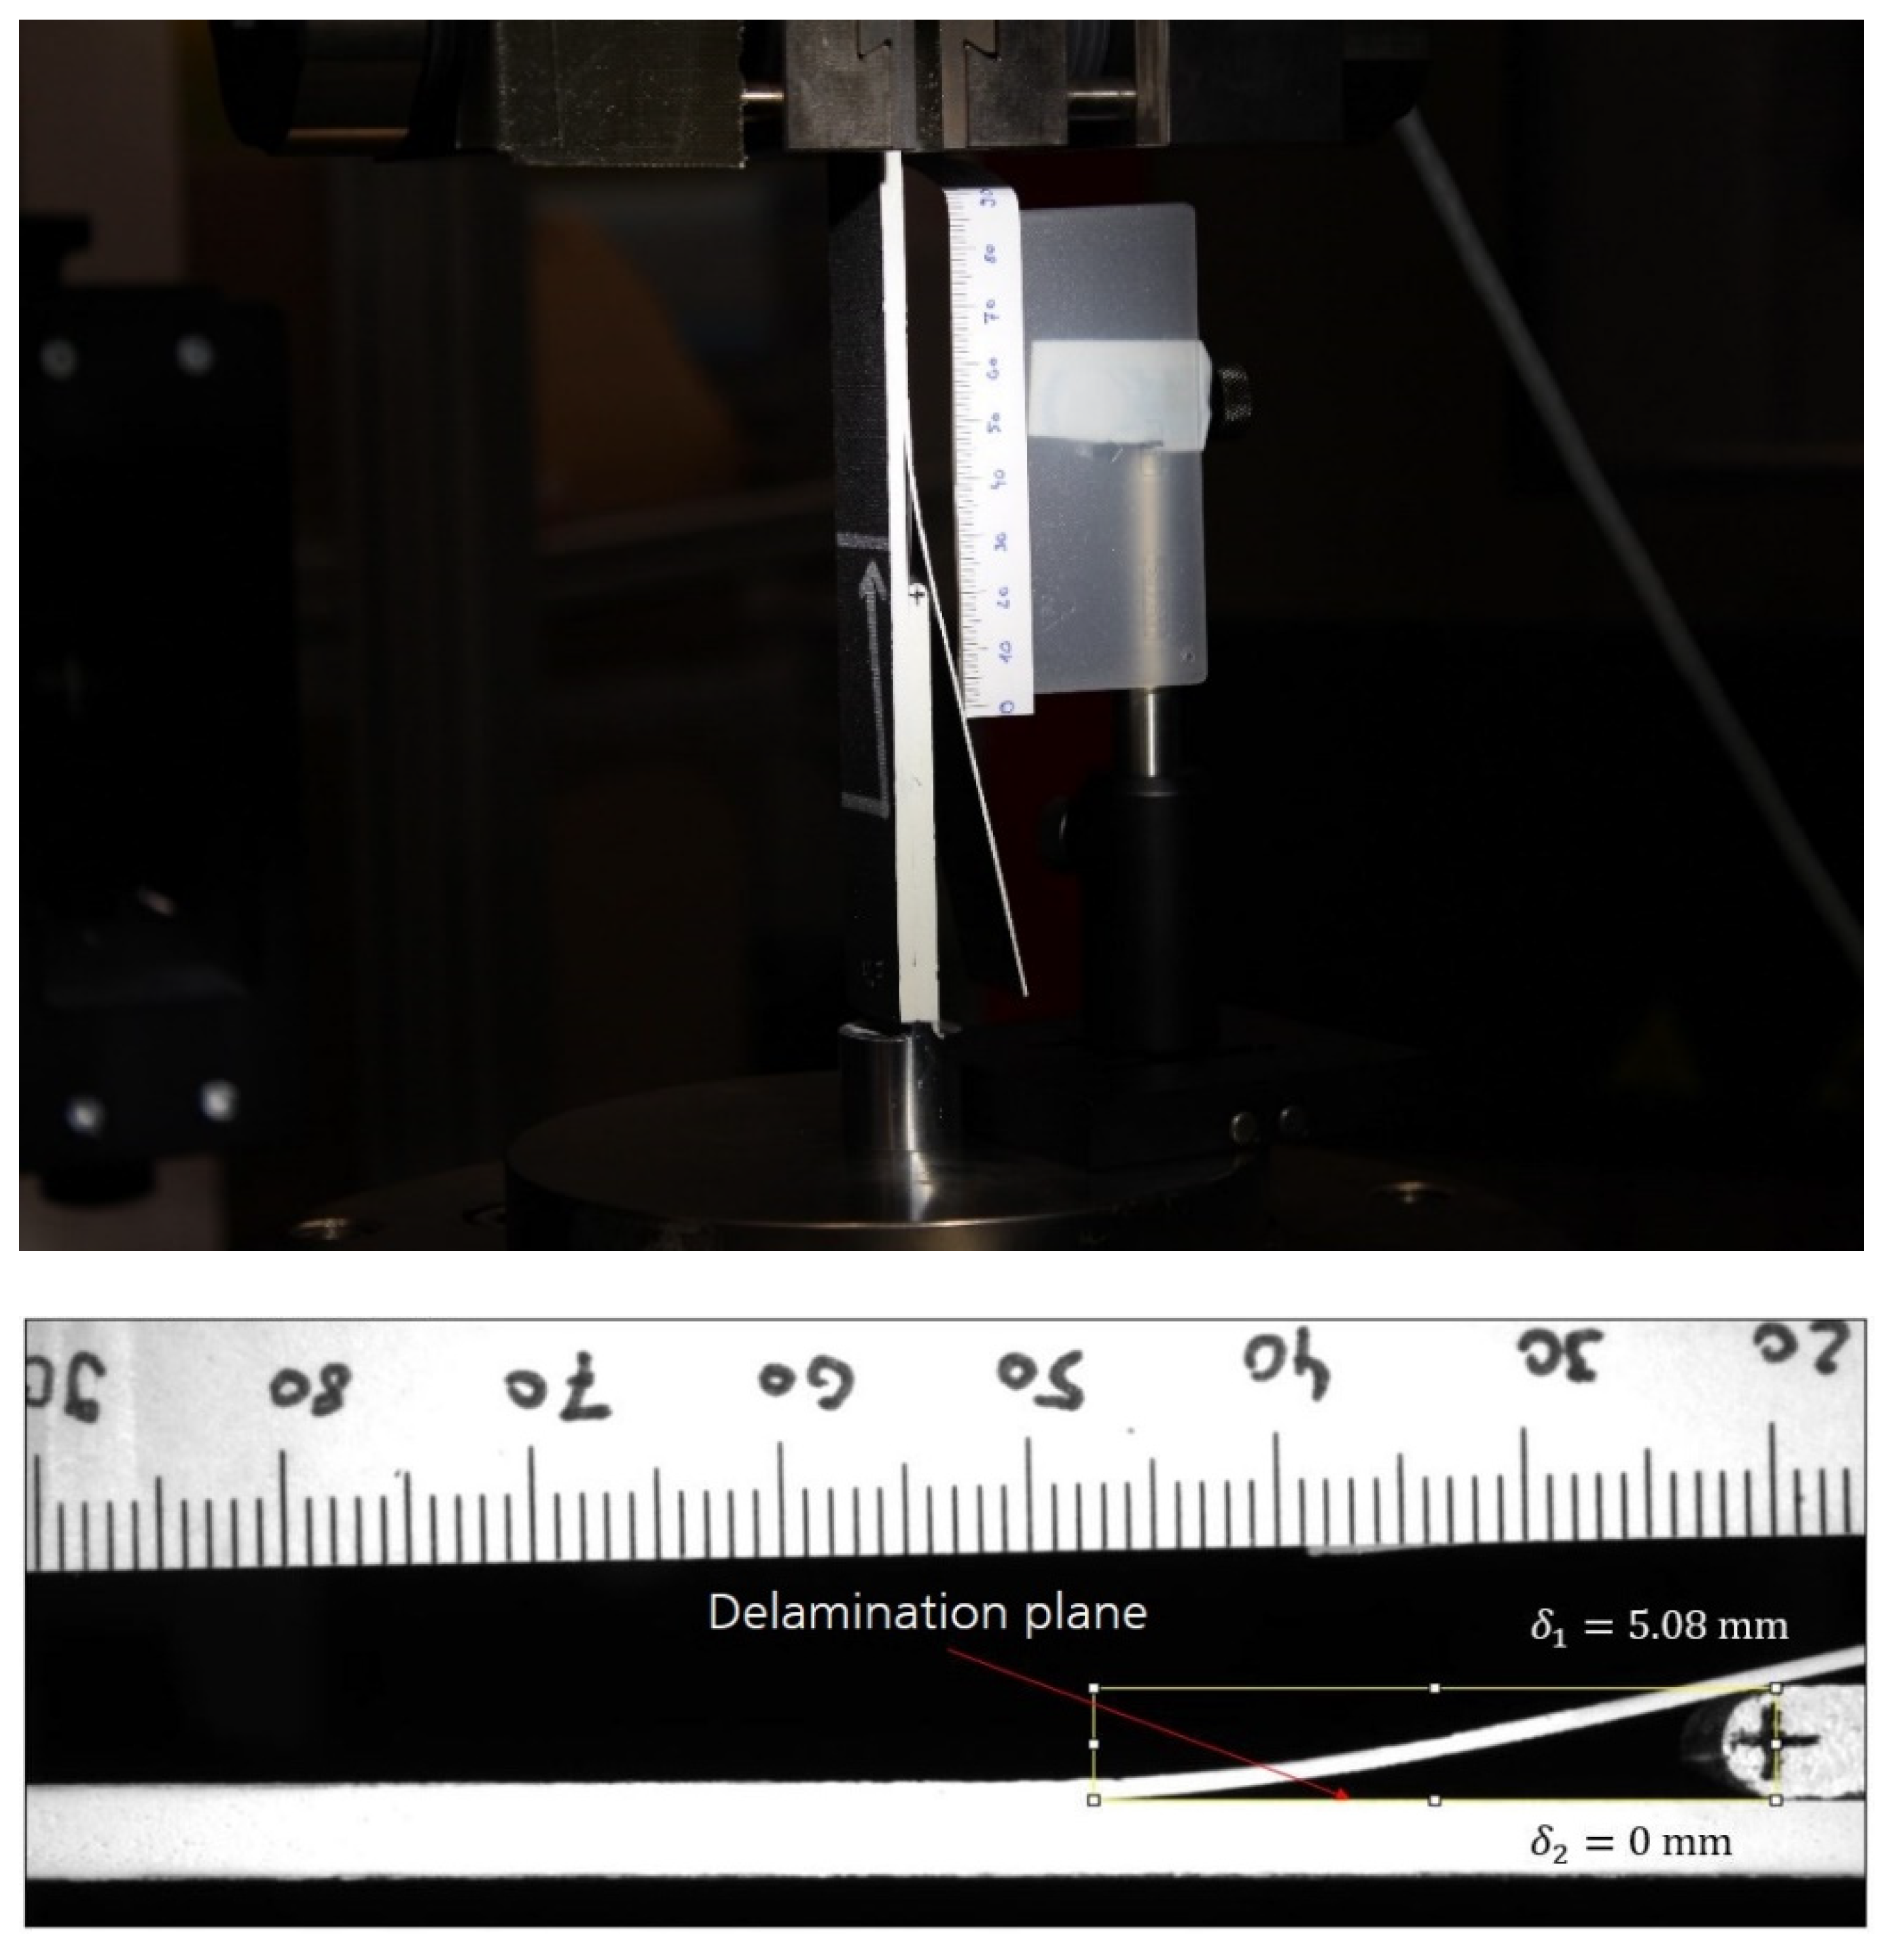
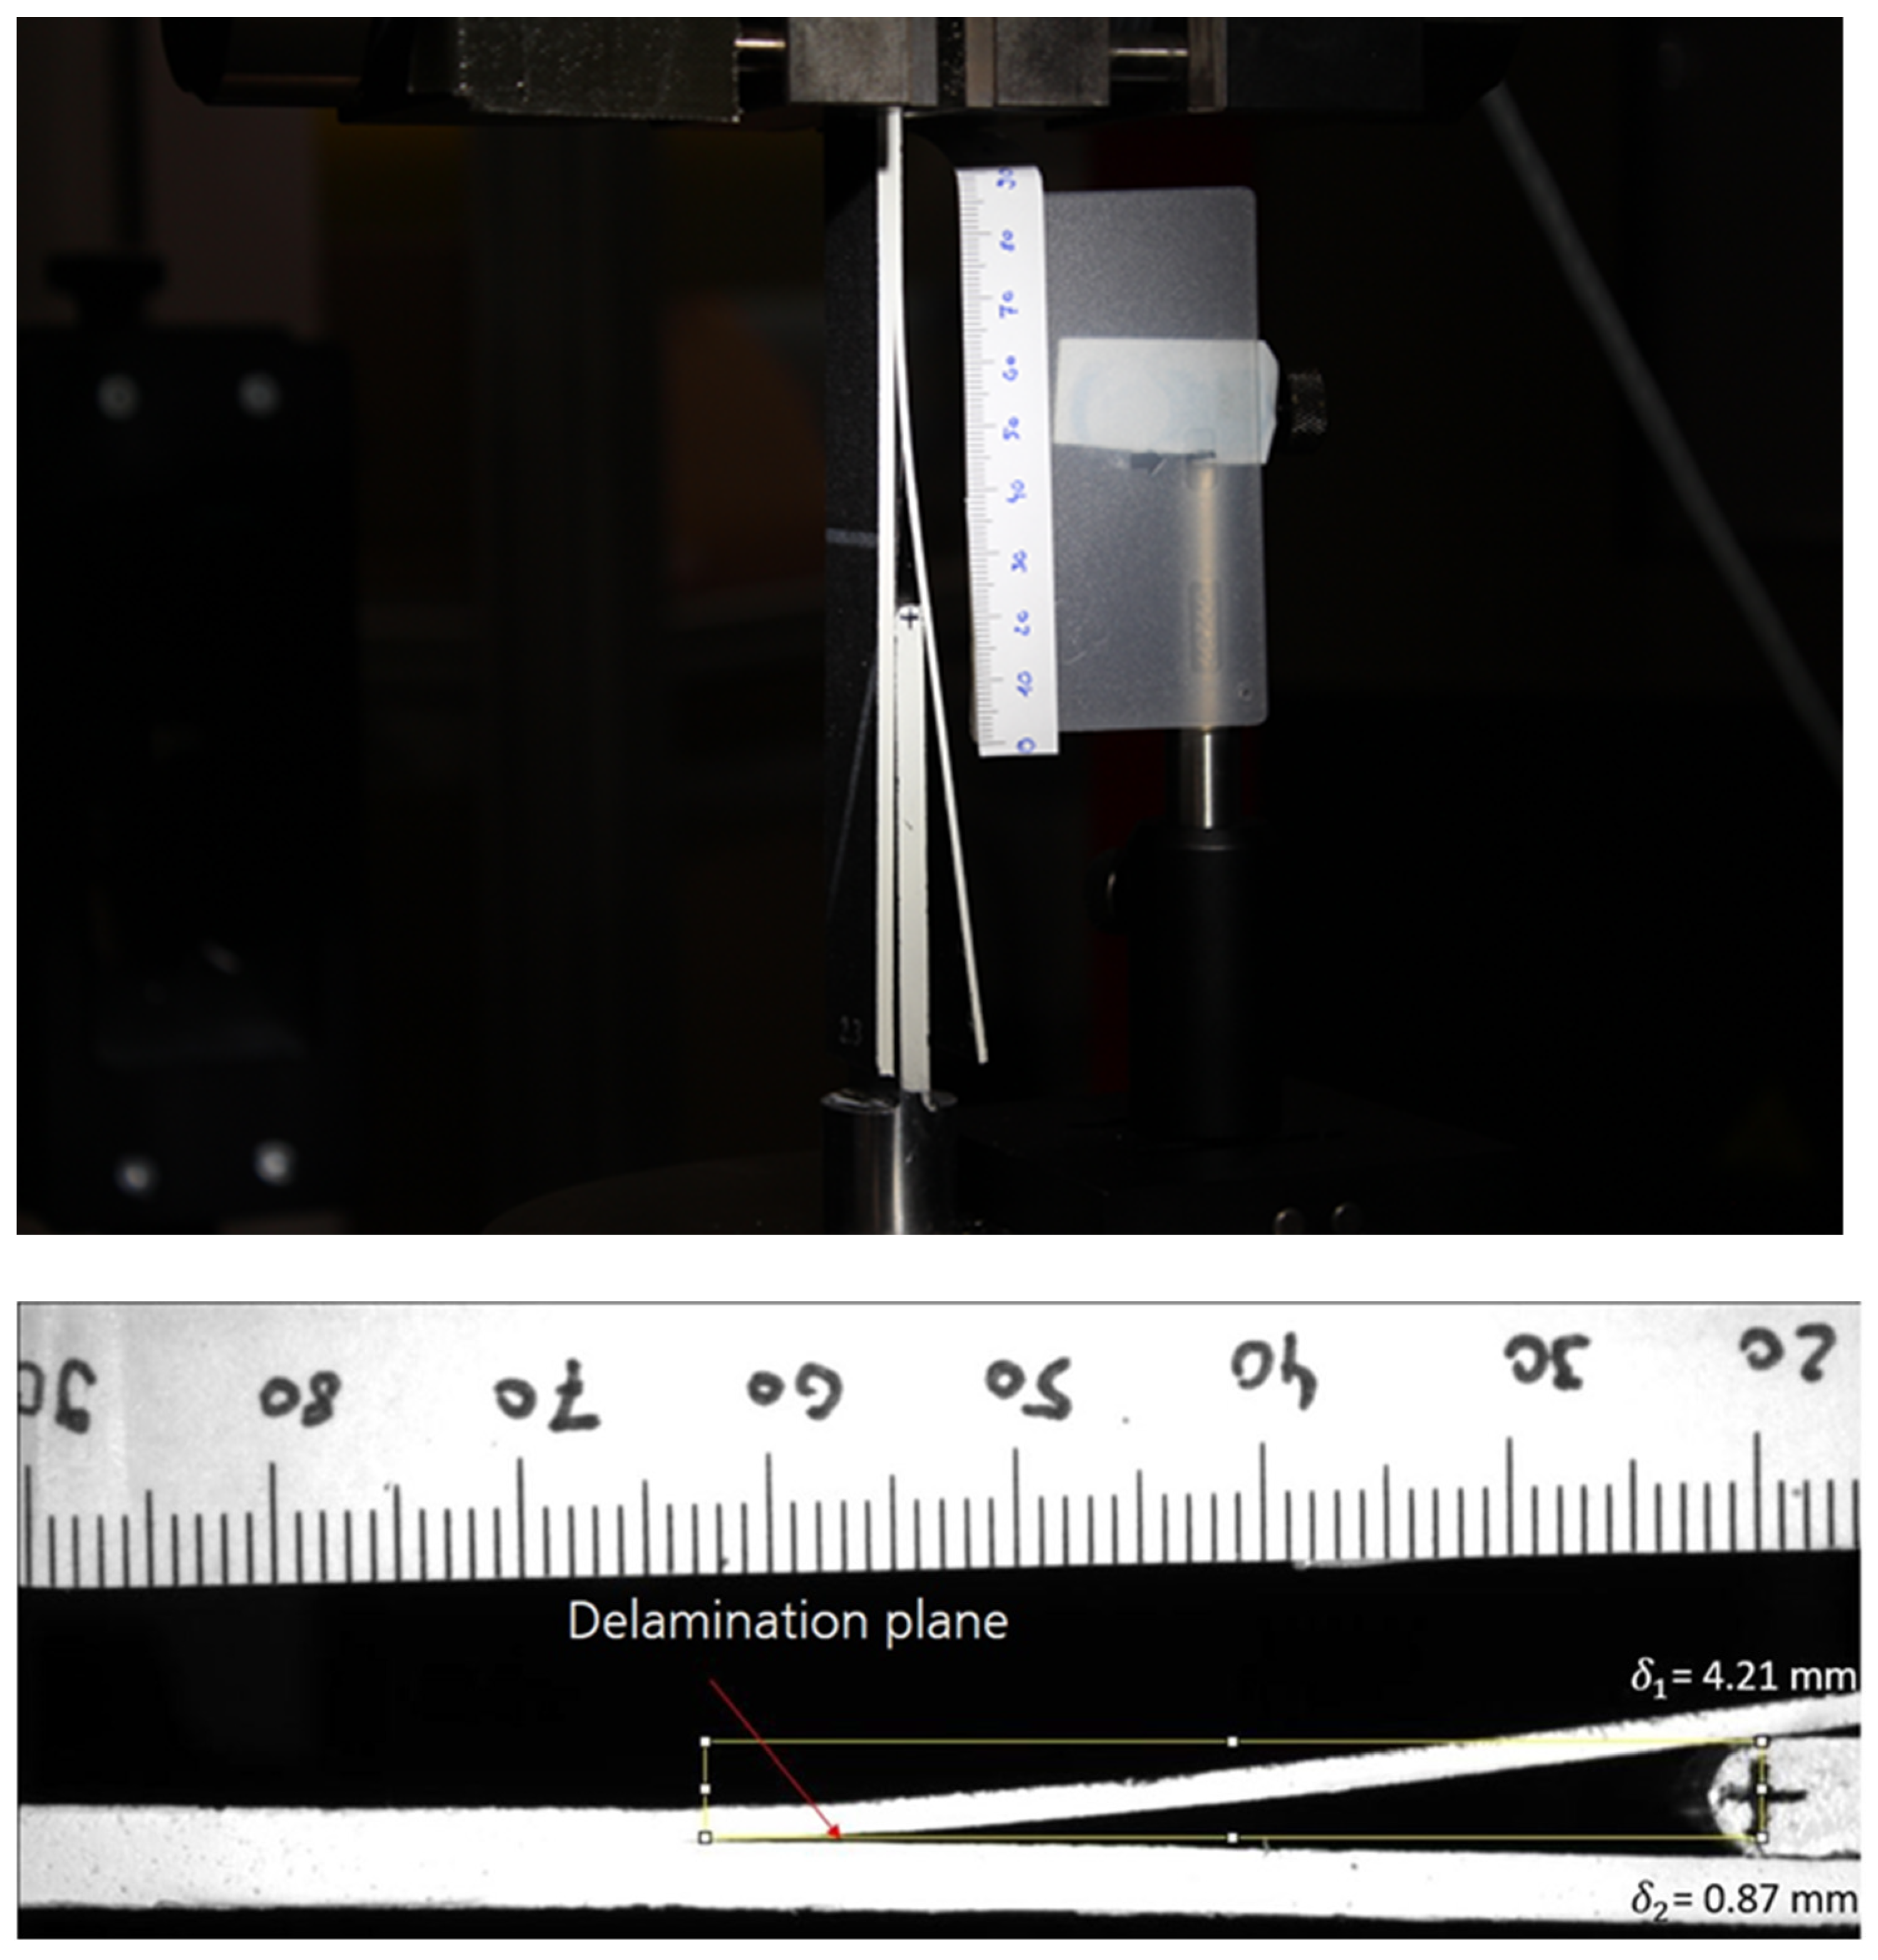
Figure 2 shows a schematic of the WDCB configuration. Here, Δ is the thickness of the wedge, a is the effective delamination length, L is the length of the uncracked portion of the specimen, h1 and h2 are the thicknesses of arm 1 and arm 2, respectively.
In contrast to the classical solution by Xiao et al. [34], where the underlying assumption is that both arms are loaded with the same force, we follow a more generalized approach, assuming that the forces in the two arms may differ from another. In the following, the generalized approach is derived:
The total strain energy Us stored in the two arms can be expressed as
U s = 1 2 · ( P 1 · δ 1 + P 2 · δ 2 )
where P1 and P2 are the forces acting on each arm, and δ1 and δ2 are the displacements of the two arms. In Equation (2), the contribution of the strain energy generated by longitudinal loads (as the friction forces between the wedge and the arms of the specimen) are neglected. In fact, this contribution is an order of magnitude smaller than the bending-induced strain energy. Using beam theory, the following relationships between the displacements and the forces exist:
δ 1 = 4 · P 1 · a 3 E 1 · b · h 1 3
δ 2 = 4 · P 2 · a 3 E 2 · b · h 2 3
where E1 and E2 are the flexural modulus; h1 and h2 are the thicknesses of the two arms; and b is the width of the specimen.
The forces in Equation (2) can be eliminated by replacing them with Equations (3) and (4), solved for P1 and P2:
U s = b 8 · a 3 · ( δ 1 2 · E 1 · h 1 3 + δ 2 2 · E 2 · h 2 3 )
The derivate of Us with respect to the crack length a is
d U s d a = 3 ·   b 8 · a 4 · ( δ 1 2 · E 1 · h 1 3 + δ 2 2 · E 2 · h 2 3 )
From the pioneering work of Williams [37], it is known that
G = 1 b · ( d U s d a )
Combining Equations (6) and (7) leads to the total fracture toughness under mixed-mode I/II loading conditions
G = 3   8 · a 4 · ( δ 1 2 · E 1 · h 1 3 + δ 2 2 · E 2 · h 2 3 )

2.5. Data Analysis

Equation (8) allows for calculating the total fracture toughness without the need for measuring forces, which may be beneficial for tests under high rates of loading [35,38]. The only parameters to be determined are the crack length and the deflections δ1 and δ2 of the two arms. It is known that the total deflection δ1 + δ2 equals the thickness of the wedge. All remaining parameters are either material constants or geometric parameters. As the crack length contributes to the total fracture toughness with the power of 4, it is important to minimize the error on determining the crack length. It was therefore decided to determine the effective delamination length, defined as the distance from the crack tip to the contact point between the specimen and wedge, using the open source image processing package Fiji App, which allows for measuring distances in images. Furthermore, the effect of error on the measurement of the crack length was evaluated. Other accurate techniques, for example, based on the extrapolation of the arm edge profile to find the crack tip, have been proposed in the literature [36].

3. Results

A total of three different thickness ratios (ratio of the thickness of the two cantilever arms) were tested under quasi-static loading conditions. For each thickness ratio, five specimens were tested. For each specimen, the fracture toughness was calculated using two different methods: the Xiao method (Equation (1) and the proposed method (Equation (8)). The flexural modulus required for the calculations was determined to be 107.5 GPa using four-point bending tests.

3.1. Thickness Ratio 0.25

Figure 3 shows an example of the WADCB test for the thickness ratio 0.25. It can be observed that the thick arm does not deform, whilst the thin arm undergoes significant bending deformation. During the test, it was observed that the effective delamination length, measured from the crack tip to the contact point with the wedge, initially decreased until crack propagation started. Once crack propagation started, the effective delamination length remained constant.
Table 1 summarizes the calculated total fracture toughness for a thickness ratio of 0.25 for the two analysis methods. Whilst there are some minor differences for the individual specimens, on average, both methods predict the same total fracture toughness and the same coefficient of variation.

3.2. Thickness Ratio 0.48

Figure 4 shows an example of the WADCB test for the thickness ratio 0.48. It can be observed that the thicker arm experiences approximately 17% of the total deformation, whilst the thinner arm experiences about 83% of the total deformation. During the test, it was observed that the effective delamination length, measured from the crack tip to the contact point with the wedge, initially decreased until crack propagation started. Once crack propagation started, the effective delamination length remained constant.
Table 2 summarizes the calculated total fracture toughness for a thickness ratio of 0.48 using both the Xiao method (Equation (1)) and the proposed method (Equation (8)). On average, the proposed solution predicts slightly higher total fracture toughness than the reference method by Xiao.

3.3. Thickness Ratio 0.74

Figure 5 shows an example of the WADCB test for the thickness ratio 0.74. It can be observed that the thicker arm experiences approximately 34% of the total deformation, whilst the thinner arm experiences about 66% of the total deformation. During the test, it was observed that the effective delamination length, measured from the crack tip to the contact point with the wedge, initially decreased until crack propagation started. Once crack propagation started, the effective delamination length remained constant. Table 3 summarizes the calculated total fracture toughness for a thickness ratio of 0.74 using both the Xiao method (Equation (1)) and the proposed method (Equation (8)). Whilst there are some minor differences for the individual specimens, on average, both methods predict the same total fracture toughness and the same coefficient of variation.

4. Discussion and Conclusions

4.1. Wedge-Loaded Asymmetric Double Cantilever Beam Specimen

Asymmetric Double Cantilever Beams specimens were successfully tested under quasi-static loading conditions. It was found to be beneficial to introduce loads into both arms by using a free floating wedge. Three configuration with different thickness ratios of the ADCB arms were tested (0.25, 0.48, and 0.74). For all configurations, it was found that the effective delamination length was constant after crack propagation started. This is in agreement with experiments reported by Isakov et al. [36] on a wedge-loaded double cantilever beam (WDCB) test. It is noted that the WDCB test is a special case of the ADCB test for a thickness ratio of 1.0. For thickness ration 0.25, the total fracture toughness was reported to be approximately 0.8 kJ/m2; for thickness ratio 0.48, the total fracture toughness was reported to be approximately 0.5 kJ/m2; and for thickness ratio 0.74, the total fracture toughness was reported to be approximately 0.6 kJ/m2. Nakatani et al. [39] and Yashiro et al. [40] determined the mode II fracture toughness of Torayca T700SC/2592 using the end notched flexure test. They reported values of GIIc = 1.3 kJ/m2 [39] and GIIc = 1.061 kJ/m2 [40]. Yashiro et al. [40] also studied the mode II fracture toughness of Torayca T700SC/2592 using doubly end-notched tension test and reported mode II fracture toughness values ranging from GIIc = 1.006 kJ/m2 to GIIc = 1.265 kJ/m2, depending on the length of the initial crack. Yamamoto et al. [41] determined the mode I fracture toughness of Torayca T700SC/2592 using a DCB test. They reported a value of GIc = 0.3 kJ/m2. Considering these data, the mixed-mode data measured using the WDCB test are considered to be on the lower end of the expected values. However, it must be noted that there are some differences to the data reported in the literature. The specimens used by Nakatani et al. [39] and Yamamoto et al. [41] were cured within an autoclave. The baseline plates used in this research were produced in an out-of-autoclave process, which typically results in lower mechanical properties than plates produced in an autoclave-process, in particular for through-thickness properties, such as the interlaminar fracture toughness. A second factor contributing to lower-than-expected values of mixed mode I /II fracture toughness is that the shelf life of the prepreg used for this work had expired. However, the purpose of this work was not to determine the fracture toughness of Torayca T700SC/2592 but to revisit the data-reduction methods for the WADCB test.

4.2. Comparison of Xiao Method to the Novel Method

The classical data reduction method for the WADCB test proposed by Xiao et al. [34] assumes that the forces acting on both arms of the ADCB are the same. Within this work, we generalized the data-reduction method by assuming that the forces within the two specimen arms are not identical. Looking at Table 1, Table 2 and Table 3, it can be seen that the forces in both arms are in fact not identical, thus justifying the need for the novel proposed analysis method. This difference is likely to be due to the non-perfect sliding of the floating wedge on the supporting plate. Friction between the wedge and the supporting plate thus prevent the wedge from being placed at the exact position, ensuring force equality in both arms of the specimen. It is, however, noted that, for the cases considered within this work, the differences between using Xiao’s formulation and the novel formulation are in the range of less than 5%. One interesting aspect of the WADCB test is that, for both formulations, the forces do not need to be recorded during testing, which makes this test an interesting candidate for high rate characterization, where force signals are compromised by inertia effects [35,38].

4.3. Sensitivity to Error

The only parameters that need to be recorded during the test are the effective crack length a and the displacements of the two cantilever arms δ1 and δ2. In the following, the sensitivity of the novel formulation in Equation (8) to these two measured quantities is discussed. Table 4 illustrates the influence of errors in measuring the crack length. First, the data reported in Table 1, Table 2 and Table 3 are considered as a reference, implying no error on the measurement of the effective crack length. Then, the crack length is virtually varied by −1.0 mm, −0.5 mm, + 0.5 mm, and +1.0 mm. The resulting error on fracture toughness is the change in fracture toughness with reference to the data reported in Table 1, Table 2 and Table 3. It can be seen that for a thickness ratio 0.74, even small inaccuracies in measuring the effective crack length may already have a strong influence on the calculated total fracture toughness. This is due to the fact that the effective crack length a contributes to Equations (1) and (8) with the power of 4. Therefore, small errors in determining the effective crack length may result in large errors. For the other thickness ratios, the error is smaller but unneglectable. It is therefore of high importance to determine the effective crack length as accurately as possible.
Table 5 summarizes the effect of measurement errors on the displacement δ. As there is less room for interpretation in measuring the displacement compared to the crack length, the accuracy of the displacement measurement is directly related to the resolution of the camera system. For the setup used for this work, 1 pixel corresponds to 0.07471 mm: the thickness of the wedge is therefore discretized by 68 pixels. Table 5 illustrates the influence of miscounting pixels for the example of specimen WADCB_2.3. Again, the reported data is considered to be correct. It can be seen that, for human type errors on the displacement measurement (−2 pixels up to +2 pixels), the resulting error on the predicted fracture toughness is less than 5 %. Furthermore, Table 5 shows the differences in the loading of the two arms, thus justifying the development of a novel data reduction scheme for the WADCB test.

4.4. Drawbacks of the WADCB Test and Future Perspectives

There are two main aspects of the WDCB test, which need to be improved in the future. Firstly, for all wedge-loaded configurations, there is always some uncertainty about the influence of friction (between the wedge and the specimen arms) on the predicted fracture toughness. One approach, which could be followed in order to improve on this aspect was proposed by Renart et al. [42], who suggested to include a loading (pushing the wedge into the specimen) and unloading (pulling the wedge from the specimen) stage for WDCB specimen in order to include aspects of friction. Such a methodology could also be implemented for the WADCB specimen. It should however be noted that this method only allows for determining the contribution of friction under quasi-static loading conditions. High-rate tests are carried out under open loop control, which eliminates the possibility of an unloading cycle. Secondly, the closed form solution proposed in Equation (8) only allows for calculating the total mixed-mode fracture toughness. A separation of the contributing components GI and GII is not possible. However, Manam [43] reported that for sufficiently small differences between the loads in the arms, in a first approximation, the components GI and GII can be estimated using Ducept’s approach for mode partitioning [30]. One limitation of the ADCB test in general is, however, that the achievable mixed mode ratio (GII/Gc) is limited to the range from 0 to 0.3 for the configuration assessed here [30]. Therefore, in order to investigate the complete domain of the mode mixity, the WADCB test should be completed by tests allowing for higher mode mixity ratios close or equal to mode II.
In future work, the WADCB test will be assessed for its suitability to produce high-rate mixed mode I/II fracture toughness values using a Split Hopkinson Pressure bar. In the process, some challenges in the load introduction will need to be overcome. If a floating wedge concept is followed, which was preferred under quasi-static loading conditions, a solution is required to allow for axial movement. Additionally, the friction imposed by the movement will differ from the friction under quasi-static conditions. If a fixed-wedge solution is followed, the asymmetric opening will cause undesired acentric loading on the Hopkinson bar.

Author Contributions

Conceptualization, M.M.; Methodology, B.U.M., P.H., M.I. and M.M.; formal analysis, B.U.M.; investigation, B.U.M. and P.H.; resources, M.I. and M.M.; writing—original draft preparation, M.M.; writing—review and editing, M.M., B.U.M., P.H. and M.I.; supervision, P.H. and M.M. All authors have read and agreed to the published version of the manuscript.

Funding

This research did not receive any funding.

Data Availability Statement

Not applicable.

Conflicts of Interest

The authors declare no conflict of interest.

References

  1. May, M.; Arnold-Keifer, S.; Haase, T. Damage resistance of composite structures with unsymmetrical stacking sequence subjected to high velocity bird impact. Compos. Part C Open Access 2020, 1, 100002. [Google Scholar] [CrossRef]
  2. Heimbs, S.; Heller, S.; Middendorf, P.; Hähnel, F.; Weiße, J. Low velocity impact on CFRP plates with compressive preload: Test and modelling. Int. J. Impact Eng. 2009, 36, 1182–1193. [Google Scholar] [CrossRef] [Green Version]
  3. Rhymer, J.; Kim, H.; Roach, D. The damage resistance of quasi-isotropic carbon/epoxy composite tape laminates impacted by high velocity ice. Compos. Part A Appl. Sci. Manuf. 2012, 43, 1134–1144. [Google Scholar] [CrossRef]
  4. González, E.; Maimí, P.; Camanho, P.; Turon, A.; Mayugo, J. Simulation of drop-weight impact and compression after impact tests on composite laminates. Compos. Struct. 2012, 94, 3364–3378. [Google Scholar] [CrossRef]
  5. Isakov, M.; Lange, S.; Kilchert, S.; May, M. In-situ damage evaluation of pure ice under high-rate compresive loading. Materials 2019, 12, 1236. [Google Scholar] [CrossRef] [Green Version]
  6. May, M.; Hallett, S. An assessment of through-thickness shear tests for initiation of fatigue failure. Compos. Part A Appl. Sci. Manuf. 2010, 41, 1570–1578. [Google Scholar] [CrossRef]
  7. Reeder, J.; Crews, J. Mixed-mode bending method for delamination testin. AIAA J. 1990, 28, 1270–1276. [Google Scholar] [CrossRef] [Green Version]
  8. Armanios, E.; Bucinell, R.; Wilson, D.; Reeder, J. Refinements to the Mixed-Mode Bending Test for Delamination Toughness. J. Compos. Technol. Res. 2003, 25, 11949. [Google Scholar] [CrossRef] [Green Version]
  9. ASTM. ASTM-D6671/D6671-M22: Mixed Mode I-Mode II Interlaminar Fracture Toughness of Unidirectional Fiber Reinforced Polymer Matrix Composites; ASTM: West Conshohocken, PA, USA, 2022. [Google Scholar]
  10. Arcan, M.; Hashin, Z.; Voloshin, A. A method to produce uniform plane-stress states with applications to fiber-reinforced materials. Exp. Mech. 1978, 18, 141–146. [Google Scholar] [CrossRef]
  11. Heydari, M.; Choupani, N. A new comparative method to evaluate the fracture properties of laminated composites. Int. J. Eng. -Trans. C Asp. 2014, 27, 991–1004. [Google Scholar]
  12. Russel, A.; Street, N. Moisture and temperature effects on the mixed-mode delamination fraczure of unidirectional graphite/epoxy. In ASTM STP 876 Delamination and Debonding of Materials; American Socienty for Testing and Materials: Philadelphia, PA, USA, 1985; pp. 349–370. [Google Scholar]
  13. Horikawa, N.; Kusaka, T.; Masuda, M. Rate dependence of interlaminar fracture toughness in carbon-fiber/epoxy composite laminates under mixed-mode loading. J. De Phys. IV 2000, 10, 317–326. [Google Scholar]
  14. Yoon, S.H.; Hong, C.S. Modified end notched flexure specimen for mixed mode interlaminar fracture in laminated composites. Int. J. Fract. 1990, 43, R3–R9. [Google Scholar] [CrossRef]
  15. Davidson, B.; Sundararaman, V. A single leg bendig test for interfacial fracture toughness determination. Int. J. Fract. 1996, 78, 193–210. [Google Scholar] [CrossRef]
  16. Szekrényes, A.; Uj, J. Comparison of some improved solutions for mixed-mode composite delamination coupons. Compos. Struct. 2006, 72, 321–329. [Google Scholar] [CrossRef]
  17. Polaha, J.J.; Davidson, B.D.; Hudson, R.C.; Pieracci, A. Effects of Mode Ratio, Ply Orientation and Precracking on the Delamination Toughness of a Laminated Composite. J. Reinf. Plast. Compos. 1996, 15, 141–173. [Google Scholar] [CrossRef]
  18. Govender, R.; Langdon, G.; Nurick, G.; Cloete, T. Impact delamination testing of fibre reinforced polymers using Hopkinson Pressure Bars. Eng. Fract. Mech. 2013, 101, 80–90. [Google Scholar] [CrossRef]
  19. Szekrényes, A.; Uj, J. Over-leg Bending Test for Mixed-mode I/II Interlaminar Fracture in Composite Laminates. Int. J. Damage Mech. 2007, 16, 5–33. [Google Scholar] [CrossRef] [Green Version]
  20. Wosu, S.; Hui, D.; Dutta, P. Dynamic mixed-mode I/II delamination fracture energy release rate of unidirctional graphite/epoxy composites. Eng. Fract. Mech. 2005, 72, 1531–1558. [Google Scholar] [CrossRef]
  21. Tracy, G.D.; Feraboli, P.; Kedward, K.T. A new mixed mode test for carbon/epoxy composite systems. Compos. Part A Appl. Sci. Manuf. 2003, 34, 1125–1131. [Google Scholar] [CrossRef]
  22. Charalambous, G.; Allegri, G.; Lander, J.; Hallett, S. A cut-ply specimen for the mixed-mode fracture toughness and fatigue characterizatin of FRPs. Compos. Part A Appl. Sci. Manuf. 2015, 74, 77–87. [Google Scholar] [CrossRef] [Green Version]
  23. Johnson, W. Stress analysis to the mixed-mode bending test for delamination toughness. J. Test. Eval. 1987, 15, 303–324. [Google Scholar]
  24. Hooper, S.; Hwu, C. A mixed mode fracture analysis of the cracked lap shea specimen using a sublaminate approach. In Proceedings of the 30th Structures, Structural Dynamics and Materials Conference, Mobile, AL, USA, 3–5 April 1989. [Google Scholar]
  25. Armanios, E.; Rehfield, L. Interlaminar analysis of laminated composites using a sublaminate approach. In Proceedings of the 27th AIAA/ASME/ASCE/AHS Structures, Structural Dynamics and Materials Conference, San Antonio, TX, USA, 19–21 May 1986. [Google Scholar] [CrossRef]
  26. Szekrenyes, A. Prestressed fracture specuimen for delamination testing of composites. Int. J. Fract. 2006, 139, 213–237. [Google Scholar] [CrossRef]
  27. Szekrényes, A. Prestressed composite specimen for mixed-mode I/II cracking in laminated materials. J. Reinf. Plast. Compos. 2010, 29, 3309–3321. [Google Scholar] [CrossRef]
  28. Lander, J.; Kawashita, L.; Allegri, G.; Hallett, S.; Wisnom, M. A cut ply specimen for the determination of mixed-mode interlaminar fracture toughness. In Proceedings of the 14th European Conference on Composite Materials, Budapest, Hungary, 7–10 June 2010. [Google Scholar]
  29. Bradley, W.; Cohen, R. Matrix Deformation and Fracture in Graphite-Reinforced Epoxies. In ASTM STP 876 Delamination and Debonding of Materials; American Society for Testing and Materials: Philadelphia, PA, USA, 1987; pp. 389–410. [Google Scholar]
  30. Ducept, F.; Gamby, D.; Davies, P. A mixed-mode failure criterion derived from tests on symmetric and asymmetric specimens. Compos. Sci. Technol. 1999, 59, 609–619. [Google Scholar] [CrossRef]
  31. Mollón, V.; Bonhomme, J.; Viña, J.; Argüelles, A. Theoretical and experimental analysis of carbon epoxy asymmetric dcb specimens to characterize mixed mode fracture toughness. Polym. Test. 2010, 29, 766–770. [Google Scholar] [CrossRef]
  32. Shokrieh, M.M.; Zeinedini, A. A Novel Method for Calculation of Strain Energy Release Rate of Asymmetric Double Cantilever Laminated Composite Beams. Appl. Compos. Mater. 2013, 21, 399–415. [Google Scholar] [CrossRef]
  33. Rubiera, S.; Argüelles, A.; Viña, J.; Rocandio, C.; Bonhomme, J. Fracture behavior under mixed mode I/II static and dynamic loading of ADCB specimens. J. Reinf. Plast. Compos. 2016, 35, 1513–1523. [Google Scholar] [CrossRef]
  34. Xiao, F.; Hui, C.Y.; Kramer, E.J. Analysis of a mixed mode fracture specimen: The asymmetric double cantilever beam. J. Mater. Sci. 1993, 28, 5620–5629. [Google Scholar] [CrossRef]
  35. May, M. Measuring the rate-dependent mode I fracture toughness of composites—A review. Compos. Part A Appl. Sci. Manuf. 2016, 81, 1–12. [Google Scholar] [CrossRef]
  36. Isakov, M.; May, M.; Hahn, P.; Paul, H.; Nishi, M. Fracture toughness measurement withour force data—Application to high rate DCB on CFRP. Compos. Part A Appl. Sci. Manuf. 2019, 119, 176–187. [Google Scholar] [CrossRef]
  37. Williams, J.G. On the calculation of energy release rates for cracked laminates. Int. J. Fract. 1988, 36, 101–119. [Google Scholar] [CrossRef]
  38. May, M.; Channammagari, H.; Hahn, P. High-rate mode II fracture toughness testing of polymer matrix composites—A review. Compos. Part A Appl. Sci. Manuf. 2020, 137, 106019. [Google Scholar] [CrossRef]
  39. Nakatani, H.; Imamura, T.; Osaka, K. Suppression of interlaminar crack in UD-CFRP containing fibre discontinuity using polyamide mesh. In Proceedings of the 20th International Conference on Composite Materials, Copenhagen, Denmark, 19–24 July 2015. [Google Scholar]
  40. Yashiro, S.; Agata, T.; Yoshimura, A. A new approach for evaluating crack growth resistance curve of mode II delamination by doubly end-notched tension tests. Adv. Compos. Mater. 2017, 27, 119–133. [Google Scholar] [CrossRef]
  41. Yamamoto, N.; Inada, T.; Suzuki, T. Prediction of mode-I delamination growth for the multi-directional laminates of CFRP. In Proceedings of the ECCm 15—15th European Conference on Composite Materials, Venice, Italy, 24–28 June 2012. [Google Scholar]
  42. Renart, J.; Costa, J.; Santacruz, G.; Lazcano, S.; González, E. Measuring fracture energy of interfaces under mode I loading with the wedge driven test. Eng. Fract. Mech. 2020, 239, 107210. [Google Scholar] [CrossRef]
  43. Manam, B. Measuring the Mixed-Mode-I/II Fracture Toughness in Composite Materials Using Wedge Loaded Asymmetric DCB Specimen (Report A 01/21); Fraunhofer EMI: Freiburg, Germany, 2021. [Google Scholar]
Figure 1. WDCB test setup with “floating” wedge.
Jcs 06 00319 g001
Figure 2. Schematic of the WADCB test.
Jcs 06 00319 g002
Figure 3. WADCB test for thickness ratio 0.25. Top: global view; Bottom: close-up view of the delamination area.
Jcs 06 00319 g003
Figure 4. WADCB test for thickness ratio 0.48. Top: global view; Bottom: close-up view of the delamination area.
Jcs 06 00319 g004
Figure 5. WADCB test for thickness ratio 0.74. Top: global view; Bottom: close-up view of the delamination area.
Jcs 06 00319 g005
Table 1. Calculated total fracture toughness for thickness ratio 0.25.
Xiao (Equation (1))Proposed Solution (Equation (8))
Specimen No.Gc (kJ/m2)Gc (kJ/m2)
WADCB_4.20.610.62
WADCB_4.30.730.75
WADCB_4.50.870.89
WADCB_4.70.720.70
WADCB_4.80.900.91
Mean0.770.77
Standard deviation0.120.12
Coefficient of variation15%15%
Table 2. Calculated total fracture toughness for thickness ratio 0.48.
Xiao (Equation (1))Proposed Solution (Equation (8))
Specimen No.Gc (kJ/m2)Gc (kJ/m2)
WADCB_2.20.460.48
WADCB_2.30.620.65
WADCB_2.40.600.63
WADCB_2.50.570.58
WADCB_2.70.230.27
Mean0.490.52
Standard deviation0.160.16
Coefficient of variation33%30%
Table 3. Calculated total fracture toughness for thickness ratio 0.74.
Xiao (Equation (1))Proposed Solution (Equation (8))
Specimen No.Gc (kJ/m2)Gc (kJ/m2)
WADCB_1.10.620.63
WADCB_1.40.390.39
WADCB_1.50.680.68
WADCB_1.60.640.64
WADCB_1.70.660.67
Mean0.600.60
Standard deviation0.120.12
Coefficient of variation20%20%
Table 4. Sensitivity of total fracture toughness to the accuracy of crack length measurement.
Specimen No.Thickness RatioAssumed Error on Crack Length Resulting Error on Fracture Toughness
WADCB_4.20.25−1.0 mm+22%
WADCB_4.2−0.5 mm+14%
WADCB_4.2+0.5 mm0%
WADCB_4.2+1.0 mm−6%
WADCB_2.50.48−1.0 mm+10%
WADCB_2.5−0.5 mm+5%
WADCB_2.5+0.5 mm−4%
WADCB_2.5+1.0 mm−8%
WADCB_3.80.74−1.0 mm+86%
WADCB_3.8−0.5 mm+79%
WADCB_3.8+0.5 mm+66%
WADCB_3.8+1.0 mm+60%
Table 5. Sensitivity of total fracture toughness to the accuracy of displacement measurement.
Assumed
Pixel
Error
δ1δ2P1P2ΔP = P2 − P1Gc
(kJ/m2)
Resulting Error on Fracture Toughness
PxmmmmNNNkJ/m2
−53.841.2450.64147.8797.220.75090+16.8%
−43.911.1751.56139.5287.950.72341+12.6%
−33.991.0952.62129.9877.360.69884+8.7%
−24.061.0253.54121.6368.090.67720+5.4%
−14.130.9554.47113.2858.820.65850+2.5%
04.210.8755.52103.7448.220.642730%
14.280.8056.4495.4038.950.62989−2.0%
24.360.7257.5085.8628.360.61998−3.5%
34.430.6558.4277.5119.090.61301−4.6%
44.510.5759.4867.978.490.60897−5.3%
54.580.560.4059.62−0.780.60786−5.4%
Publisher’s Note: MDPI stays neutral with regard to jurisdictional claims in published maps and institutional affiliations.

