Article

Characterization of the Dimensional Precision, Physical Bonding, and Tensile Performance of 3D-Printed PLA Parts with Different Printing Temperature

School of Engineering and Physical Sciences, Heriot-Watt University Malaysia, Jalan Venna P5/2, Precinct 5, Putrajaya 62200, Malaysia
*
Authors to whom correspondence should be addressed.
J. Manuf. Mater. Process. 2024, 8(2), 56; https://doi.org/10.3390/jmmp8020056
Submission received: 13 February 2024 / Revised: 1 March 2024 / Accepted: 1 March 2024 / Published: 5 March 2024
(This article belongs to the Special Issue Design, Processes and Materials for Additive Manufacturing)

Abstract

:
In this study, tensile test specimens were fabricated using a material extrusion 3D-printer at various printing temperatures to evaluate the development of physical bonds within the same layer as well as in between previous layers. The tensile test specimens were fabricated using PLA material, with printing temperatures ranging from 180 °C to 260 °C. Experimental investigations were conducted to investigate the dimensional accuracy and physical appearance of the parts across printing temperatures. Uniaxial tensile tests were conducted at a strain rate of 1 mm/min and repeated five times for each variable in accordance with the ASTM D638-14 standard. Results showed that increasing the printing temperatures yielded parts with better tensile properties. An approximate difference of 40% in tensile strength was observed between specimens fabricated under the two most extreme conditions (180 °C and 260 °C). The changes in tensile properties were attributed to bonding mechanisms related to interlayer bonding strength and a reduction in voids within the internal geometry. Analysis of the fracture surface using scanning electron microscopy (SEM) revealed fewer and smaller voids within the internal geometry for parts printed at higher temperature. The percentage area of voids reduced significantly when the printing temperature was increased from 180 °C to 220 °C. The tensile properties continuously improved with the printing temperature, with parts printed at 220 °C exhibiting the highest dimensional accuracy. The findings offer insight into the impact of the printing temperature on both the external physical bonds between printed roads, affecting the physical appearance and dimensional accuracy, and the internal bonds, affecting the tensile properties of the fabricated parts.

1. Introduction

Over the past 25 years, additive manufacturing (AM) has seen a mass increase in adaptation for manufacturing processes in the industry. The technology was commonly used to produce proof-of-concept prototypes in its pioneering stages but has matured as an alternative method to produce complex-shaped products. Therefore, AM technologies have since grown to become a manufacturing technology that is able to compensate for the shortcomings of traditional manufacturing methods such as subtractive, formative, and molding technologies [1]. Intensive research in these technologies has aided in the development of materials, software, equipment, and processing capabilities such as speed, resolution, and dimensional accuracy related to additive manufacturing. Through these advancements, increasing interest has been drawn to adopt AM technologies in the manufacturing industry [2]. The direct fabrication of fully functional parts is the current trend that dictates the advancement of additive manufacturing technologies. In recent years, AM technologies have been rapidly developed for the automotive industry due to their ability to shorten the time needed for product design and development as well as the production of highly customized parts for optimized performance [3,4].
The AM process begins with the generation of a 3D model, which is then sliced into 2D cross-sections containing information on each layer. The 2D-data are then transferred to the AM machine and built in a layer-by-layer manner [5]. Therefore, these complex 3D-models can be fabricated directly without the requirement of specific fixtures or tools [6]. AM technologies can be subdivided into several categories: material extrusion, VAT photopolymerization, powder bed fusion, binder jetting, material jetting, sheet lamination, and direct energy deposition [7]. Fused deposition modeling (FDM), which falls under the category of material extrusion, was originally developed by Scott Crump in the late 1980s and patented by Stratasys Inc. [8]. The equivalent technology, which utilizes the same principle, is known as fused filament fabrication (FFF). Since the expiration of the patent in 2009, the possibilities for low-cost FDM printers have gained more attention and paved the way for accessible 3D-printing. Due to its simplicity and low cost, numerous brands and variations of printers based on this technology have been developed in the past decade. FFF is an AM technology that is commonly used to fabricate polymer and composite materials as it is low-cost, simple to use, and has the ability to print large parts compared to other AM technologies [9,10]. The mechanical properties, accuracy, roughness, speed, and material cost of parts manufactured by various AM techniques (stereolithography, FFF, material jetting, powder bed fusion, 3D printing (3DP), and sheet lamination) have been compared in a previous study. FFF is able to produce parts with a high impart strength but exhibited disadvantages in term of accuracy, roughness, speed, and compressive strength [11]. Among the two most popular AM techniques for polymers (FFF, VAT photopolymerization), FFF is more user friendly and requires less production time than VAT photopolymerization. However, the print quality of an FFF printed part is not as good as the print quality of VAT photopolymerization [12]. Most commercial polymers are petrochemical-based and made from non-renewable sources. Popular materials commonly used with FDM are acrylonitrile butadiene styrene (ABS), polyethylene-terephthalate-glycol (PETG), and polyether-ether-ketone (PEEK) due to their enhanced mechanical properties, reliability, and durability [13]. Polylactic acid (PLA) is a type of biodegradable plastic made from renewable sources such as sugar cane and corn [14,15]. Its low printing temperature, ease of use, and biodegradability makes this one of the most popular materials used with FFF. Furthermore, PLA is also increasingly utilized in the biomedical field to produce patient specific implants and prostheses due to its material properties such as biocompatibility, sterilizability, low weight, and cost [16,17,18,19,20]. Finally, PLA is able to degrade into the surrounding environment without harm at the end of its life cycle [21].
The process of model fabrication in FFF begins by feeding a filament made from thermoplastic polymers through an extruder head. The liquefier in the extruder head heats the filament material into its molten or semi-molten state and systematically deposits it in the form of roads onto the build platform. As soon the molten material is deposited, it cools down and solidifies, forming a layer based on the computer-generated file. The process repeats, and a new layer is built upon the previous layer until the 3D-model is formed [22]. The strength and quality of FFF fabricated parts are often compared with their traditionally manufactured injection molded counterparts as they are made of the same material. However, it should be noted that FFF fabricated parts are weaker compared to injection molded parts, even if they are printed at 100% infill [23]. One major drawback of FFF fabricated parts is their poor mechanical properties due to weak physical bonding between the deposited roads [24]. The development of bonds is highly dependent on the temperature development during printing as the core principle is derived from extrusion and relies on the heating and cooling of thermoplastic material. Additionally, the strength of the parts is also compromised by the weak interlaminar bonding and the presence of voids due to the nature of the layer-by-layer deposition process [25]. Void formation within the parts can be associated with the incomplete neck growth between deposited roads where they solidify before polymer coalescence with adjacent and preceding layers is complete [26,27]. Previous studies have concluded that inter-filament bonding improves when the printing temperature is higher due to the reheating effect on the previously deposited roads by increasing the time window available for bond development. However, a reduced dimensional accuracy was observed when an excessively high printing temperature was used [8,9,10].
FFF 3D-printing has established itself as a favored additive manufacturing technology used to process thermoplastic materials due to its ease of use and low cost over the years. As a result, numerous researchers worldwide have contributed to the advancement of FFF processes in terms of performance and explored the influence of process parameters on the quality and properties of the fabricated parts [28]. The quality of the FFF fabricated parts depends on the combination of a variety of process parameters such as printing temperature, build plate temperature, print speed, layer thickness, build orientation, and infill pattern [29,30,31,32,33]. Most of the research that has been carried out investigated the effect of optimizing a variety of process parameters to produce parts with better mechanical performance [34,35,36,37]. Furthermore, the implementation of fiber reinforcements [38], particles, compatibilizers, nanomaterials, and other techniques into the final product has also been explored to improve the mechanical properties of the fabricated parts [39,40,41,42]. Domingo-Espin et al. [43] confirmed that the mechanical properties of parts fabricated by FFF were affected by part orientation and build direction, and suggested that tensile loading should not be applied perpendicular to the layer planes to avoid fragile fracture due to the weak bonding between layers. Kaveh et al. [44] investigated the possibility of optimizing process parameters such as feed and flow rate, filament width, and printing temperature to improve the internal cavity and precision of FFF fabricated parts. It was concluded that the interlayer mechanical properties are affected by the formation of bonds between the deposited roads, which depends on the diffusion bonding of the polymer across the interface. The above-mentioned studies also focused on the effect of different process parameters and the resulting mechanical properties (tensile, flexural, and impact) of the FFF fabricated parts.
Specific to printing temperature, researchers have found that increasing the printing temperature has a positive effect on the mechanical properties, but that an excessive increase results in more brittle parts [45]. Vanaei et al. [46] studied the effect of extrusion and platform temperature as well as the cooling factors that affected the bonding between the materials and concluded that the effect of the extruder temperature was more significant compared to other process parameters. Benwood et al. [47] and Alafaghani et al. [48] investigated the mechanical properties of parts fabricated using PLA material and observed that the maximum strength for the material was around 200 °C to 220 °C. They concluded that the extrusion temperature–strength relationship is not linear. This is likely due to the rheological property of the material where it loses viscosity, resulting in the formation of constant voids within the material [49]. Based on the literature, the printing temperature is an important printing parameter as it is the main heat source provided to the material and dictates the successful extrusion of material, while at the same time, it induces changes in the material properties.
The physical bonding between adjacent and preceding roads within the internal cavity greatly affects the resulting mechanical properties of the FFF fabricated parts and are commonly attributed to bond development during the printing process. During the printing process, a stream of semi-molten filament material is extruded next to another existing filament; viscous flow of the polymer causes a neck formation as they are in a molten state. Molecular diffusion at the interface and randomization can be explained using the reptation theory. De-Gennes [50] developed a reptation model to explain the concept of the diffusion bonding of polymeric materials. In later research conducted by Kim et al. [51], the motion of chains across the interface was presented in five stages, which included surface arrangement, surface approach, wetting, diffusion, and randomization. Sun et al. [52] further extended the concept and reorganized bond formation into surface contact, neck growth and molecular diffusion, and randomization across the interface. The time required for diffusion and randomization can be approximated by the reptation time of the polymer chain [53]. Coogan et al. [54] presented a method utilizing a diffusion-controlled healing model to predict the bond formation strength of FFF fabricated parts. The researchers also concluded that air gaps/porosity had the most influential effect on the mechanical properties and attributed the mechanical anisotropy of the FFF fabricated parts to porosity ratio present inside the parts [55,56,57,58]. In a study conducted by Abbott et al. [59], it was reported that the infill angle and air gap had the largest influence on the mechanical properties. The coalescence of adjacent roads at different printing temperatures and different printing strategies (unidirectional and bidirectional) was numerically modeled in a recent work [60] that reported that increasing the printing temperature increased the coalescence between roads.
Based on the literature review, it can be seen that many similar studies have been conducted to investigate the effect of various process parameters on the resulting mechanical properties as well as statistical approaches to yield the best mechanical properties [61,62]. However, the underlying relationship between PLA printing temperature and the resulting physical bonding within the internal cavity as well as its subsequent impact on the tensile properties of PLA have not been investigated in detail. Furthermore, to the best of our knowledge, the correlation between printing temperature, voids, and tensile strength has not been previously systematically reported and quantified. Thus, this study aimed to assess the quality of the bonds by quantifying the average size and percentage area of voids present between the deposited roads that result in measurable changes in tensile strength over a range of printing temperatures. It is believed that the formation of voids is a result of incomplete physical bonding between adjacent and preceding roads that can be related to neck formation and molecular diffusion across the interfaces. Furthermore, the physical appearance and dimensional accuracy of the fabricated parts were also investigated with reference to different printing temperatures. The outcome of this paper provides a better understanding on how optimizing the printing temperature affects the quality of the bonds formed within the internal cavity and its implication in the tensile properties of FFF fabricated parts.

2. Materials and Methods

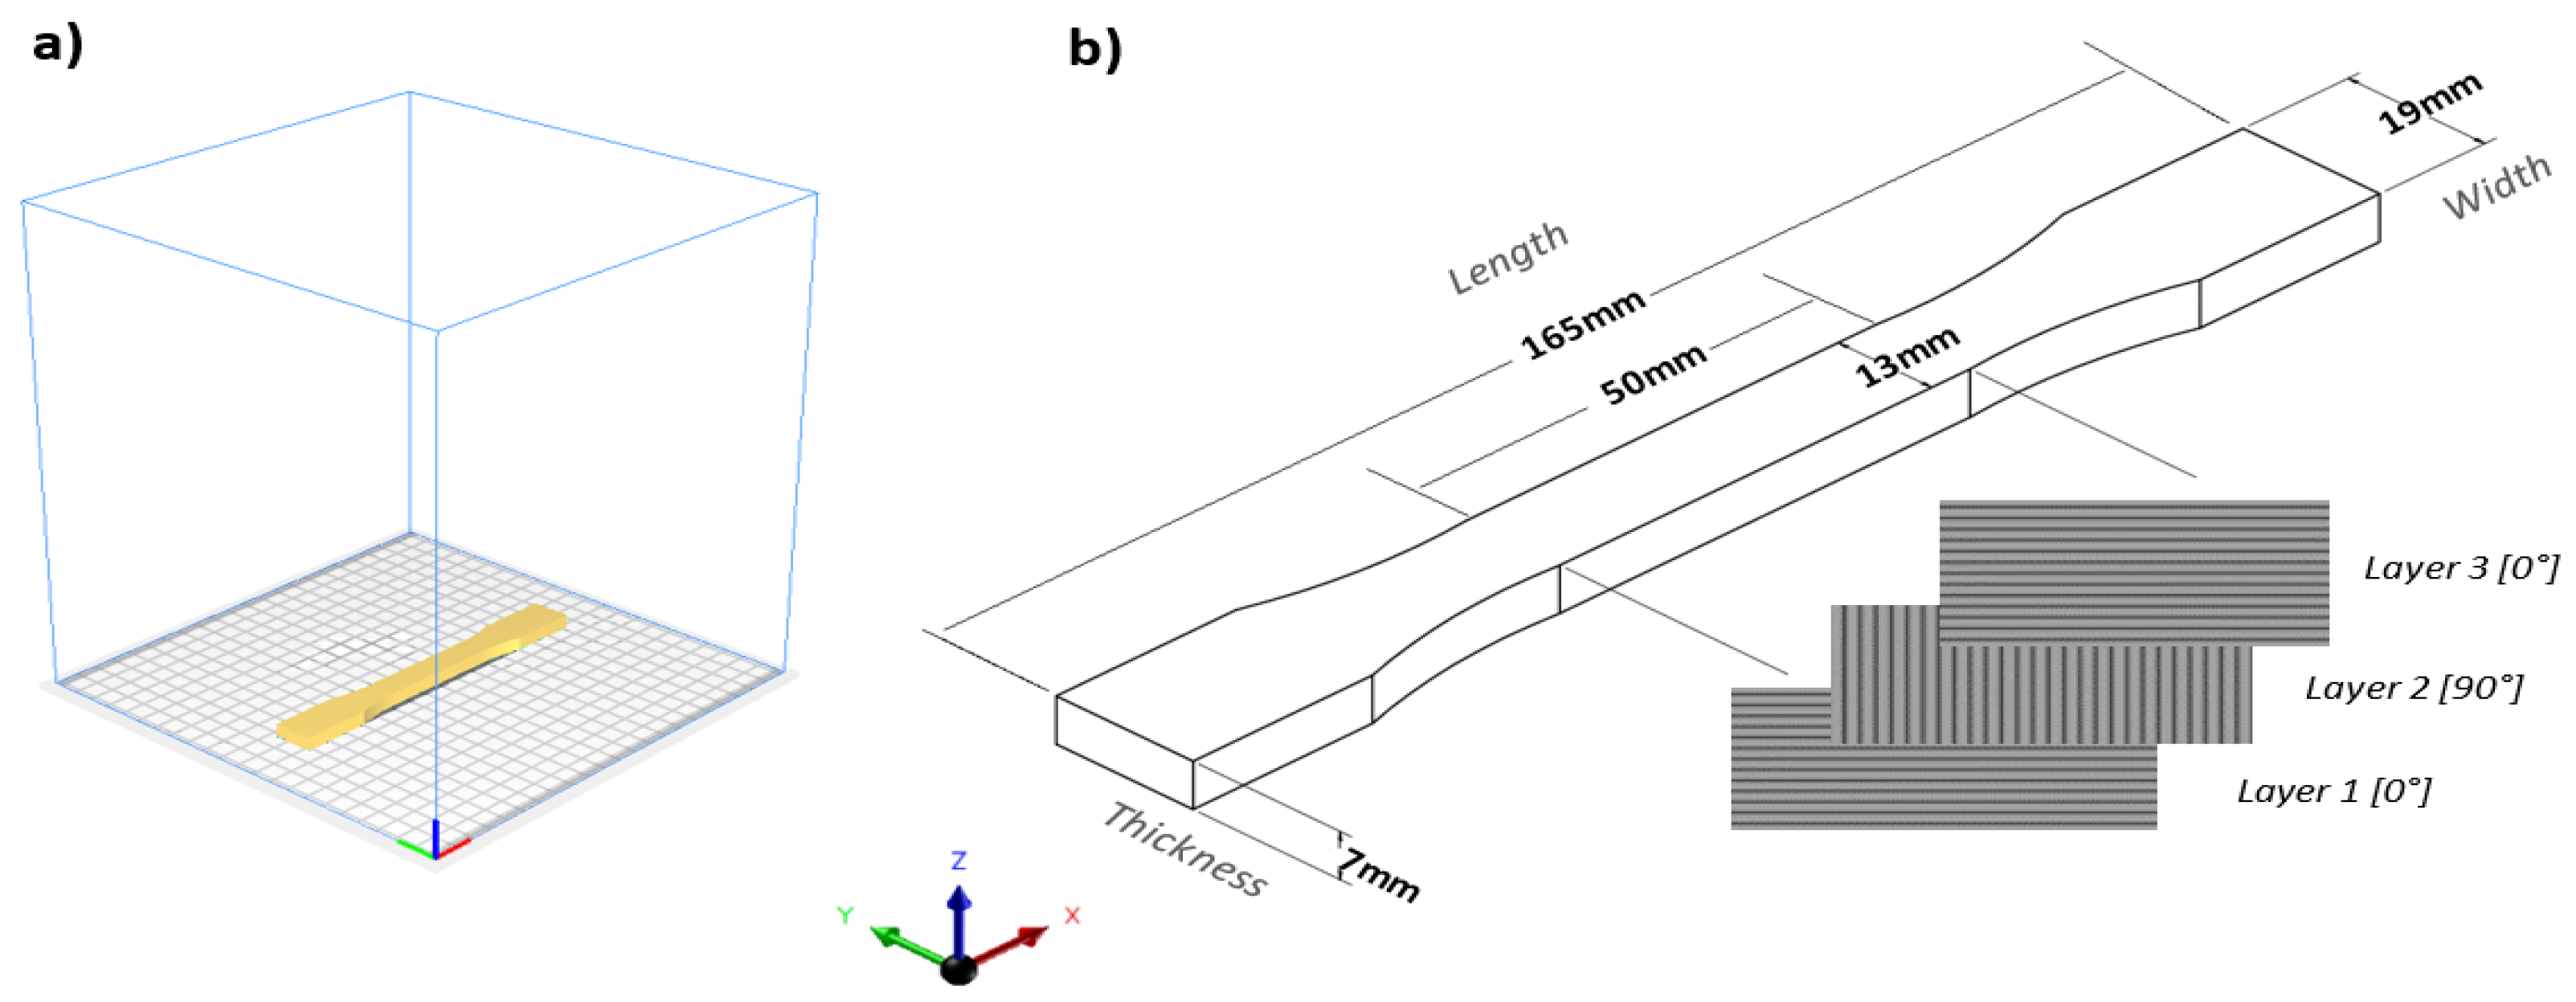
2.1. Materials and Sample Preparation

Tensile test specimens were fabricated using an FFF 3D-printer (Creality Ender 3v2, Shenzhen, China) with a print precision of ±0.1 mm, X-Y axis precision of 0.012 mm and Z-axis precision of 0.004 mm [63] using a 0.4 mm nozzle. The study was conducted by varying the printing temperatures from 180 °C to 260 °C at intervals of 10 °C. All of the samples were printed using yellow-colored PLA material (Polymaker Polylite, Shanghai, China) with a diameter of 1.75 mm at 100% infill density. The printing temperature was chosen based on the recommended values in the technical data sheet provided by the manufacturer, which was between 180 °C and 240 °C. The range of printing temperature was further expanded up to 260 °C to investigate the behavior of the material above the recommended settings, but kept slightly below the degradation temperature of PLA, which is around 280 °C [64]. Attempts to print the PLA specimens below 180 °C were unsuccessful and resulted in clogging of the nozzle, but printing above the recommended peak temperature of 240 °C did not result in any difficulties. According to the PLA material data sheet, the material has an elastic modulus of 2.6 GPa, and an ultimate tensile strength (UTS) of 46.6 MPa for use under standard processing conditions. The material was stored in a humidity-controlled container (AIPO AS-31, Zhuhai, China) prior to the fabrication process. To mitigate external factors affecting the investigation, other process parameters were fixed, as shown in Table 1. The samples were printed flat on the build platform as shown in Figure 1a. A raster orientation of [0°/90°] was selected for this study to allow brittle fracture to occur. The orientation was selected to produce fracture surfaces with clear boundaries between preceding layers at the fracture surface based on previous studies [65]. The micrographs of the fracture surfaces were then used to quantify the percentage porosity within the internal cavity. The arrangement of the raster is presented in Figure 1b, and the methods used to assess the FFF fabricated specimens in this investigation were: (i) dimensional accuracy and physical appearance, (ii) tensile properties and behavior, and (iii) physical bonding and the formation of voids.

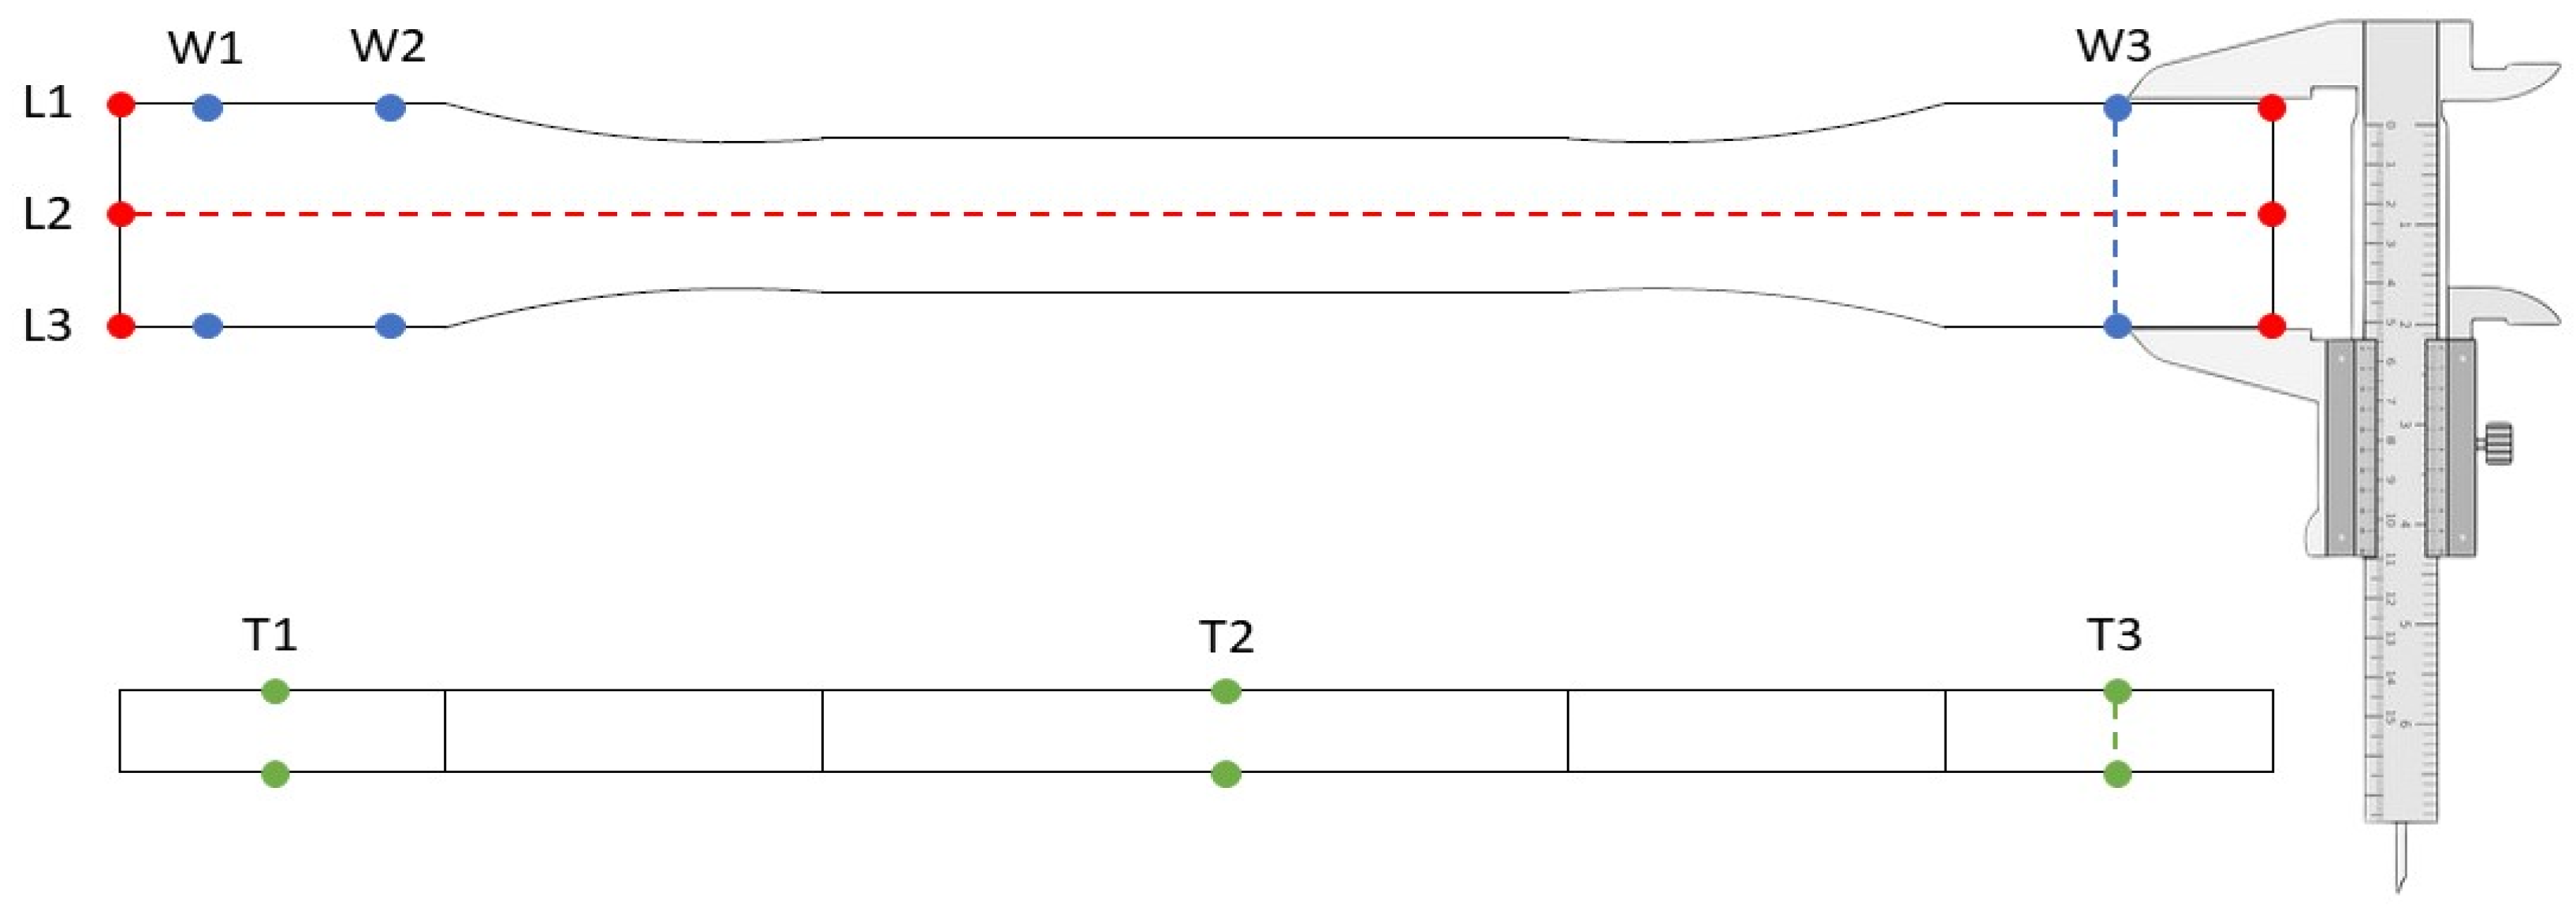
2.2. Measurement of Dimensional Accuracy

A total of six specimens were fabricated for each printing temperature according to ASTM D638-14 Type I and measured 165 mm long, 19 mm wide, and 7 mm thick. The gauge cross-sectional area of the specimens was 13 mm × 7 mm (width × thickness) with a 50 mm gauge length thickness, as presented in Figure 1b. The length, width, and thickness of the specimens were measured at three different locations, as presented in Figure 2, using digital calipers (Mitutoyo, Japan) with an accuracy of ±0.01 mm, and the average values were compared with the designed specifications to determine the dimensional accuracy. The physical appearances of three specimens were selected from each printing temperature and observed using a digital microscope (CoolingTech, ShenZhen, China).
The dimensional accuracy of the parts fabricated at different printing temperatures was examined by comparing the measured length, width, and thickness with the designed specifications. The absolute and dimensional error were calculated as:
A b s o l u t e   E r r o r   ( m m )   = ( M e a s u r e d   V a l u e D e s i g n e d   V a l u e )
D i m e n s i o n a l   E r r o r   ( % )   = ( M e a s u r e d   V a l u e ) ( D e s i g n e d   V a l u e ) ( M e a s u r e d   V a l u e ) × 100

2.3. Tensile Testing

Tensile testing was conducted using a universal testing machine (Galdabini Quasar 25, Cardano al Campo, Italy) at a strain rate of 1 mm/min until failure occurred in the form of fracture. The extension of the specimens was measured and recorded using an axial extensometer (Reliant EAG, Colorado Springs, CO, USA). A minimum of five specimens from each printing temperature was tested according to the ASTM test procedures and only the results from specimens that fractured within the gauge length were included for analysis. The corresponding results were plotted into a stress–strain curve based on the average values from five tests.

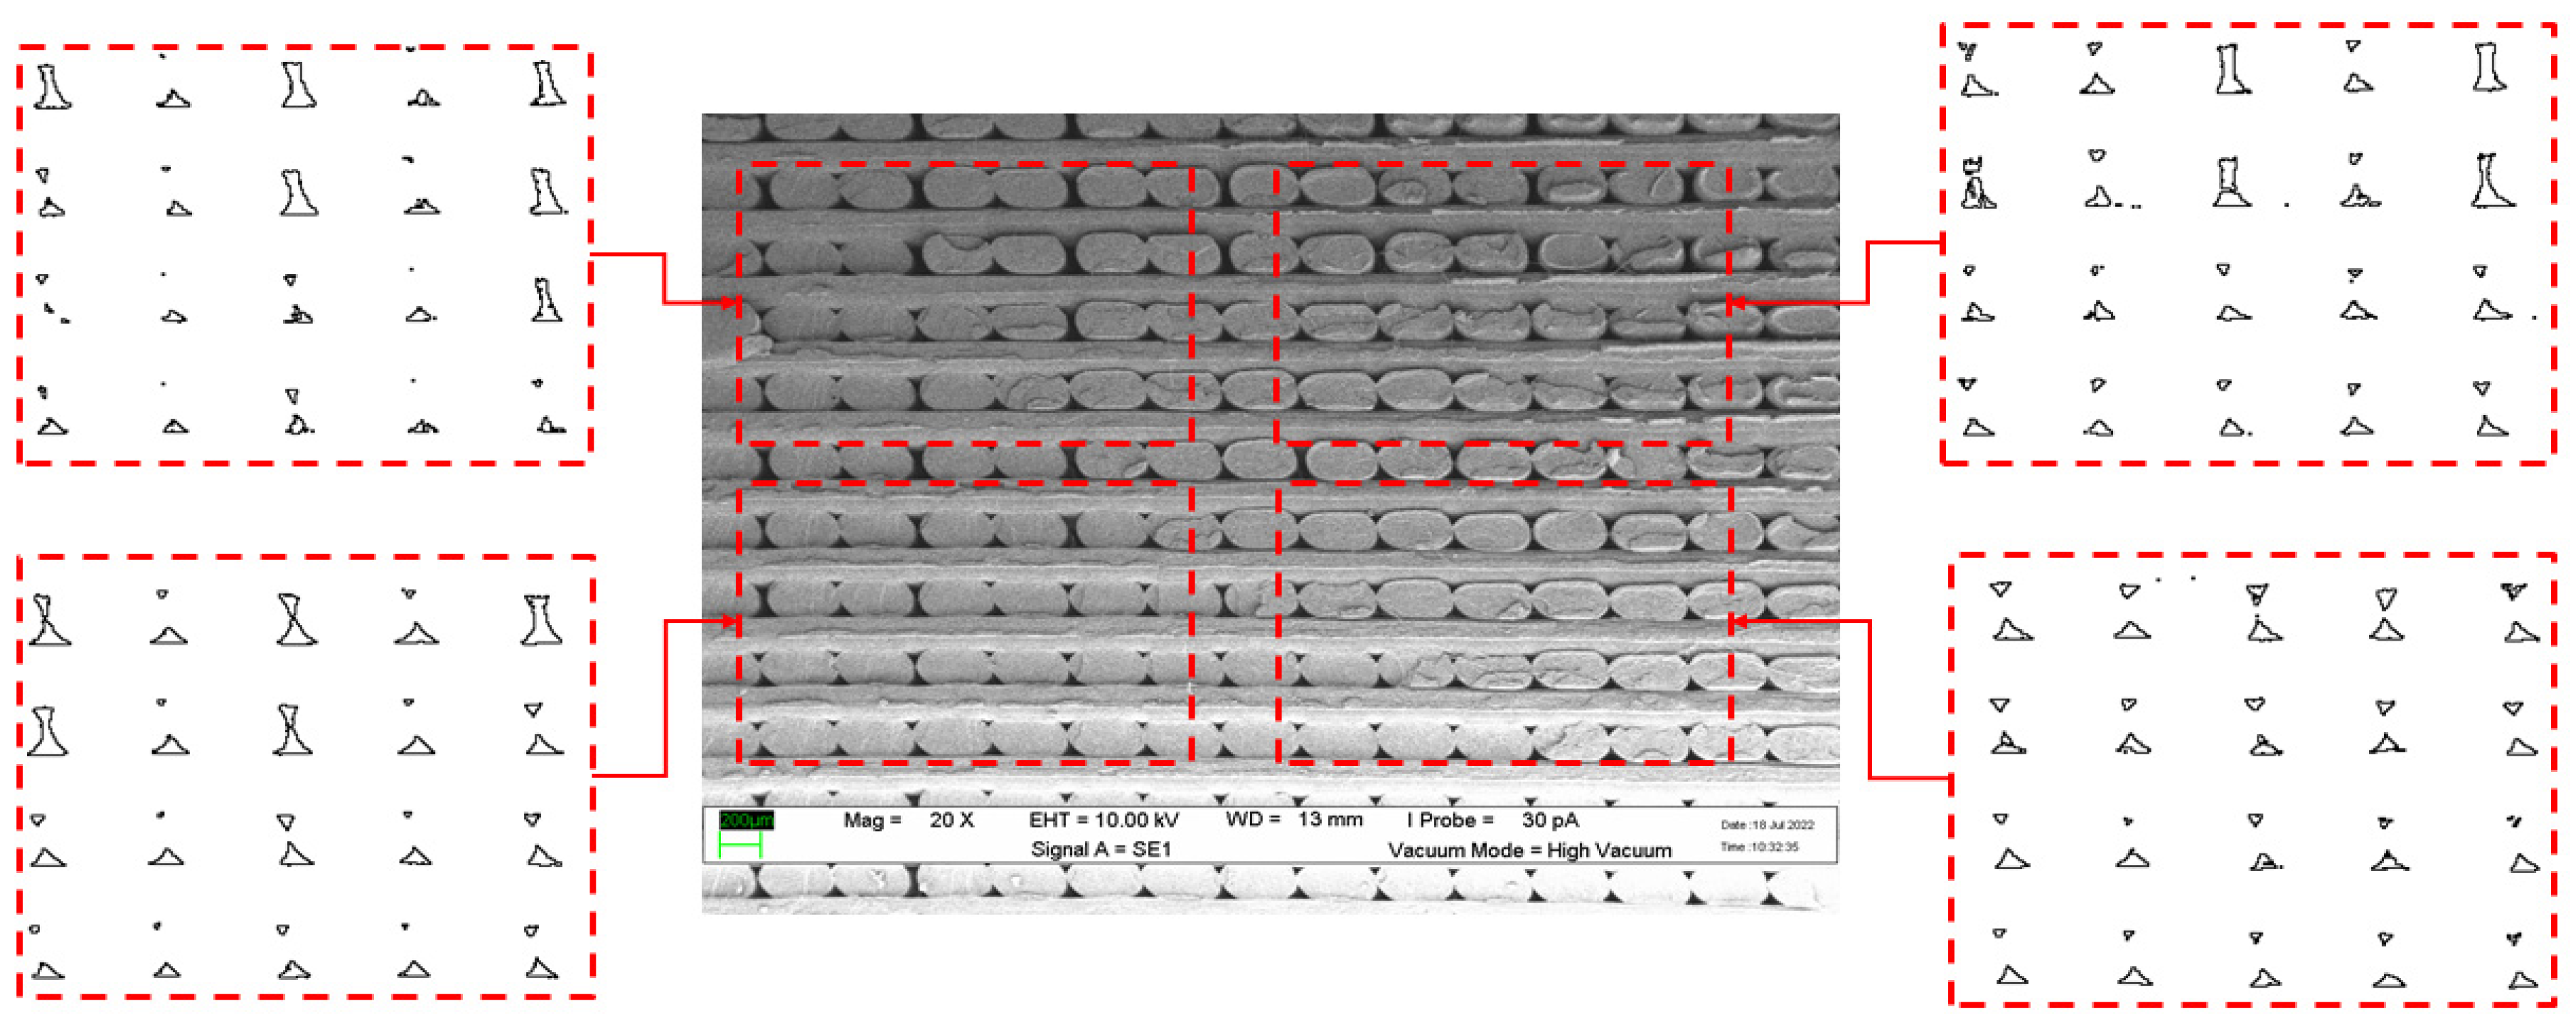
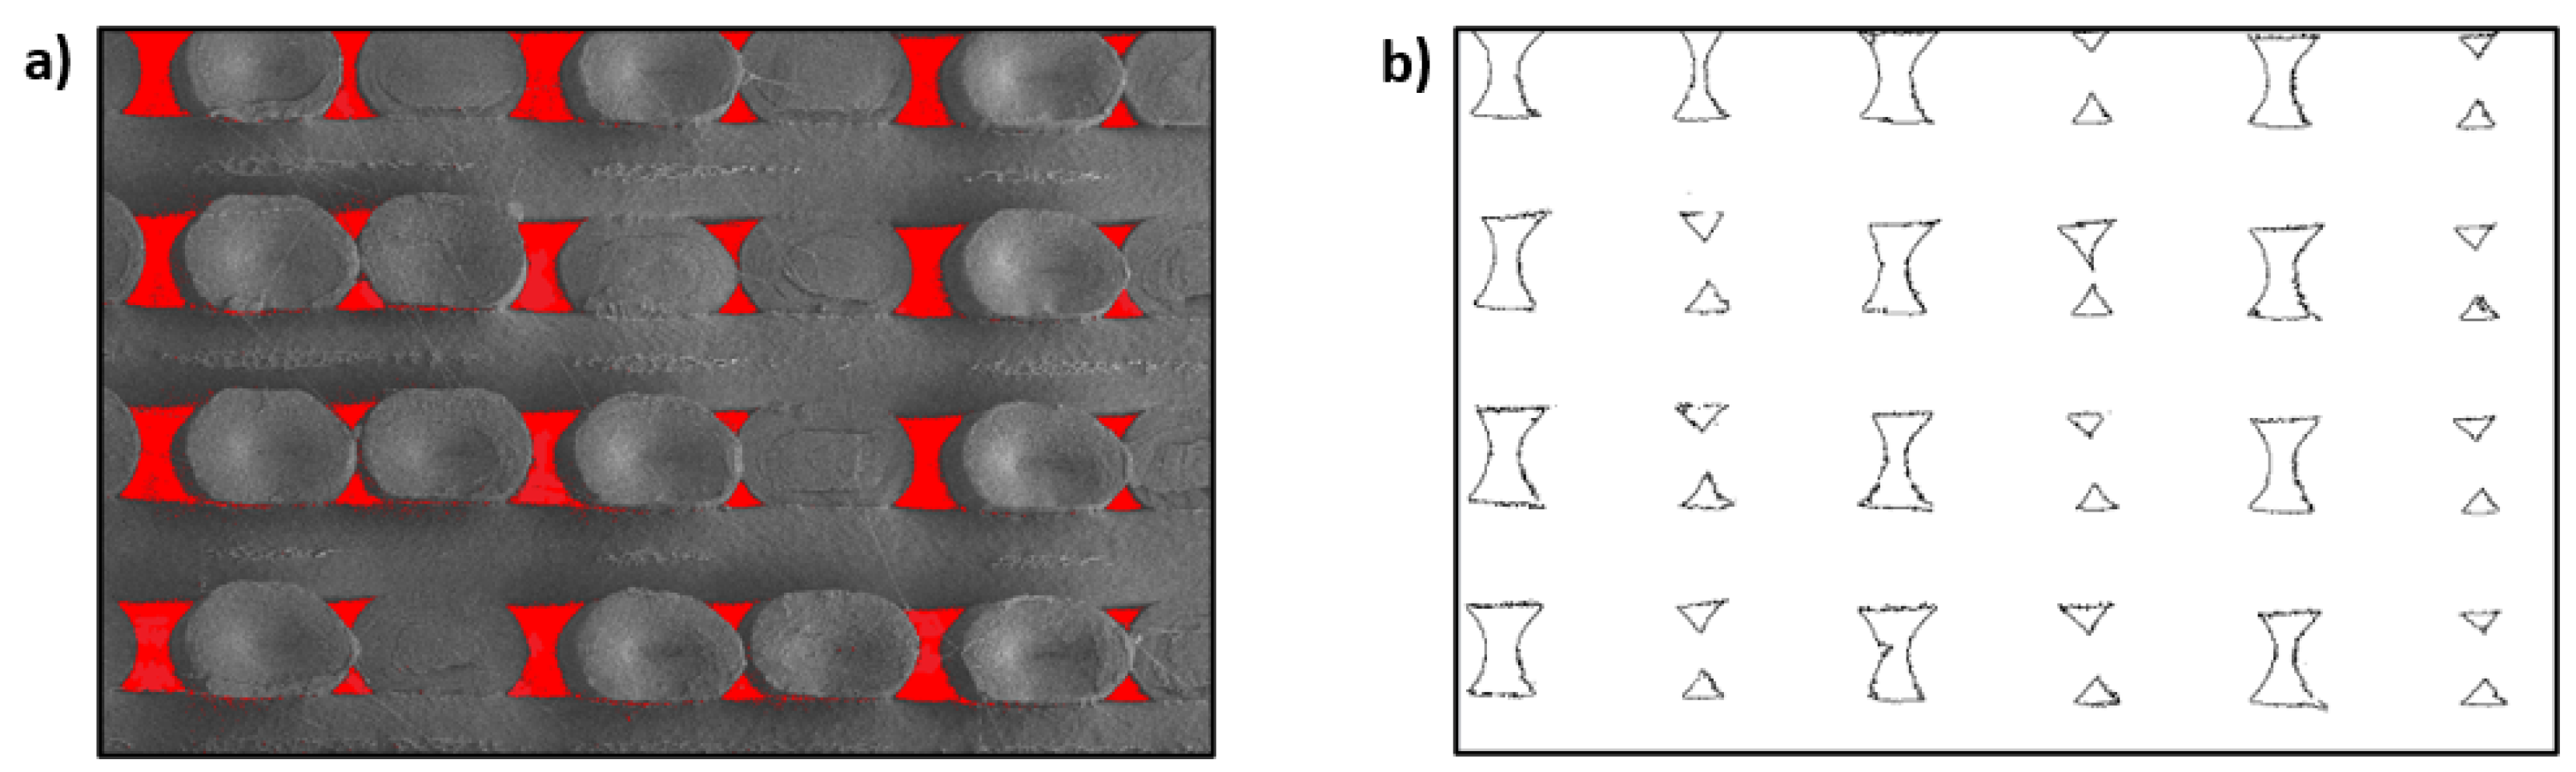
2.4. Fracture Surface Observation and Analysis

Quantitative analysis and imaging are methods used to analyze the formation of voids in FFF fabricated parts [26]. The cross-section of the fracture surface from the specimens was observed under scanning electron microscope (LEO 1455VP, Germany) at 20× and 50× magnification to determine the physical bonding between filaments at selected printing temperatures (extreme temperature and budget constraints). The SEM micrographs were imported to an image processing software, ImageJ (v1.54g), and analyzed to see whether changes in the printing temperature affected the physical bonding between the printed roads, which is influenced by neck formation and molecular diffusion. A method utilized by Abbott et al. [59] to quantify the contact length between extruded roads of the specimens was initially considered, but the results were not beneficial as it was difficult to distinguish the boundaries between the adjacent roads at printing temperatures above 220 °C. Consequently, a method of quantifying the average size of the voids and the percentage area of void spaces was used in this study. It should be noted that the measurements are highly dependent on the region where the measurements are conducted. Therefore, the analysis was conducted at four different regions of the cross-sectional fracture surface to obtain an average, as shown in Figure 3.
Using the image processing software (ImageJ), the average size and percentage area of void spaces from the micrographs were identified by adjusting the threshold level, which were converted to a binarized form. Figure 4 shows an example of the conversion of the SEM micrographs into the binary form to calculate the average size and percentage area of the voids using the particle analysis tool available in the software [67]. The average size and percentage area of voids from the binarized images were then complied and related to the recorded tensile strength at different printing temperatures.

3. Results

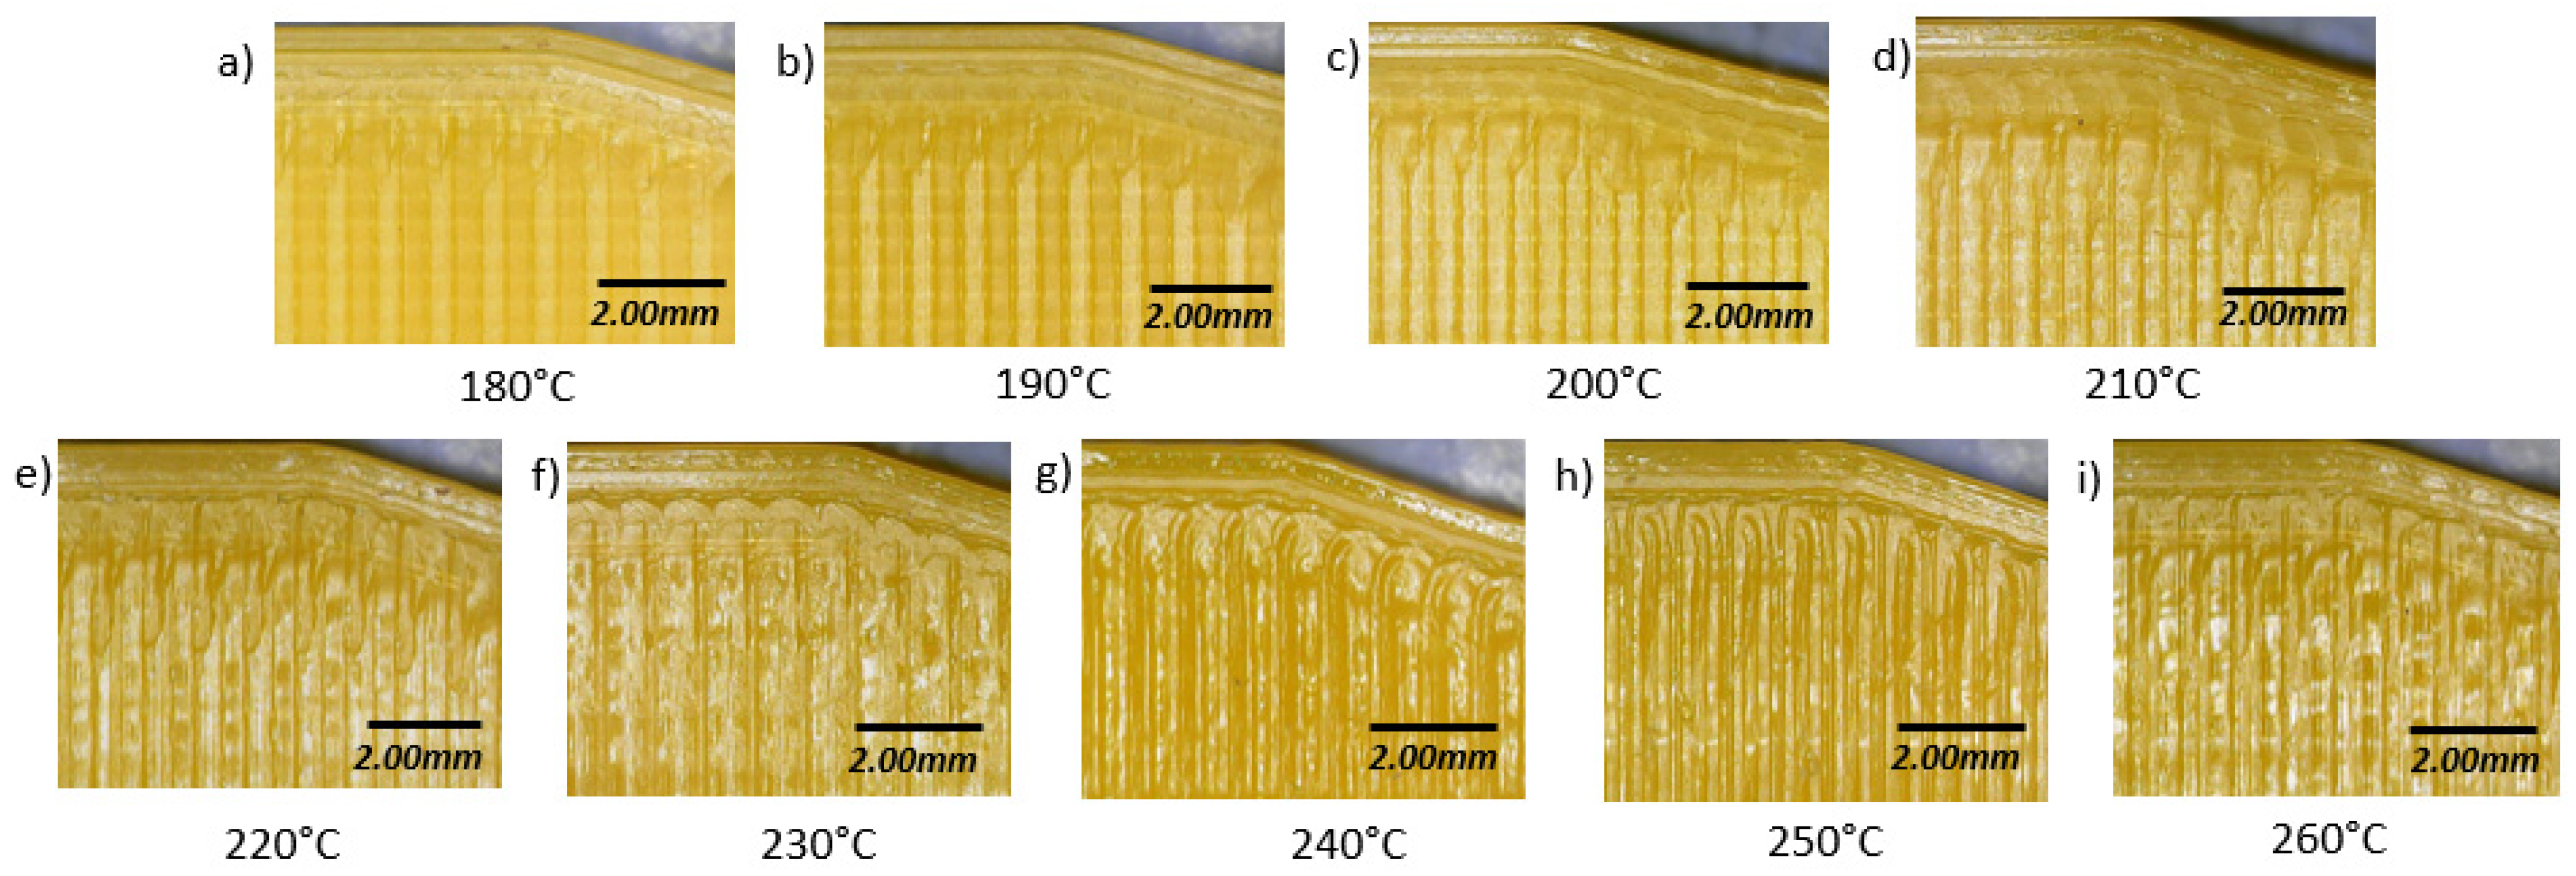
3.1. Physical Appearance of Specimens

Figure 5 illustrates the fractured tensile specimens fabricated at different temperatures. It can be observed that the surface finish of the specimens differed at different printing temperatures, as shown in Figure 5a–i. The deposited molten filament is known as a ‘road’ and takes the shape of the nozzle. At low printing temperatures, there is a clear division of boundaries between the deposited roads. The physical appearance of the surface also becomes shinier as the printing temperature is increased, as illustrated in Figure 5e–i. This is likely due to the higher percentage of crystallinity as a longer time is available for the molecular chains to rearrange into its crystallized form. PLA is a semi-crystalline polymer where the polymer chains are arranged in either a random amorphous phase or a highly organized crystalline phase [68]. PLA is known to have a slow crystallization time, which means that the polymer needs to be cooled slowly to allow sufficient time for recrystallization to occur. At lower printing temperatures, the cooling process is rapid, therefore, the majority of the polymer chains remain in an amorphous arrangement, leading to a low percentage of crystallinity [69].

3.2. Dimensional Accuracy

From the results obtained, it can be observed that all of the measured values of width, length, and thickness showed the same trend, whereby the values increased with increasing printing temperature until reaching an optimum printing temperature. From the results, the optimum printing temperature for the PLA material used in this study was 220 °C*, where the specimens had the least dimensional error.
Table 2 summarizes the measured values and dimensional error of the specimens fabricated at different printing temperatures. Specimens fabricated below 220 °C measured smaller, while those above 220 °C measured larger than the designed specifications. The deposition of material at different printing temperatures is highly dependent on the rheological properties of the polymer. This leads to a difference between the intended deposition volume and actual deposition volume, which affects the dimensional accuracy [70]. The processing temperature has a significant effect on the viscosity of PLA, which affects the formation of bonds between the deposited roads.
Based on the results in Table 2, specimens printed at low temperatures measured smaller than their designed specifications. This can be related to the low fluidity and high viscosity behavior at low temperatures, which leads to the non-uniform and incomplete deposition of PLA material. In contrast, the viscosity of PLA decreases as the working temperature increases, which results in a higher flow capacity. A higher flow capacity results in road spreading and also enhances the die-swell effect, resulting in greater extrudate expansion after the material leaves the nozzle [71,72]. Therefore, specimens printed at higher temperatures measured larger than their designed specifications.

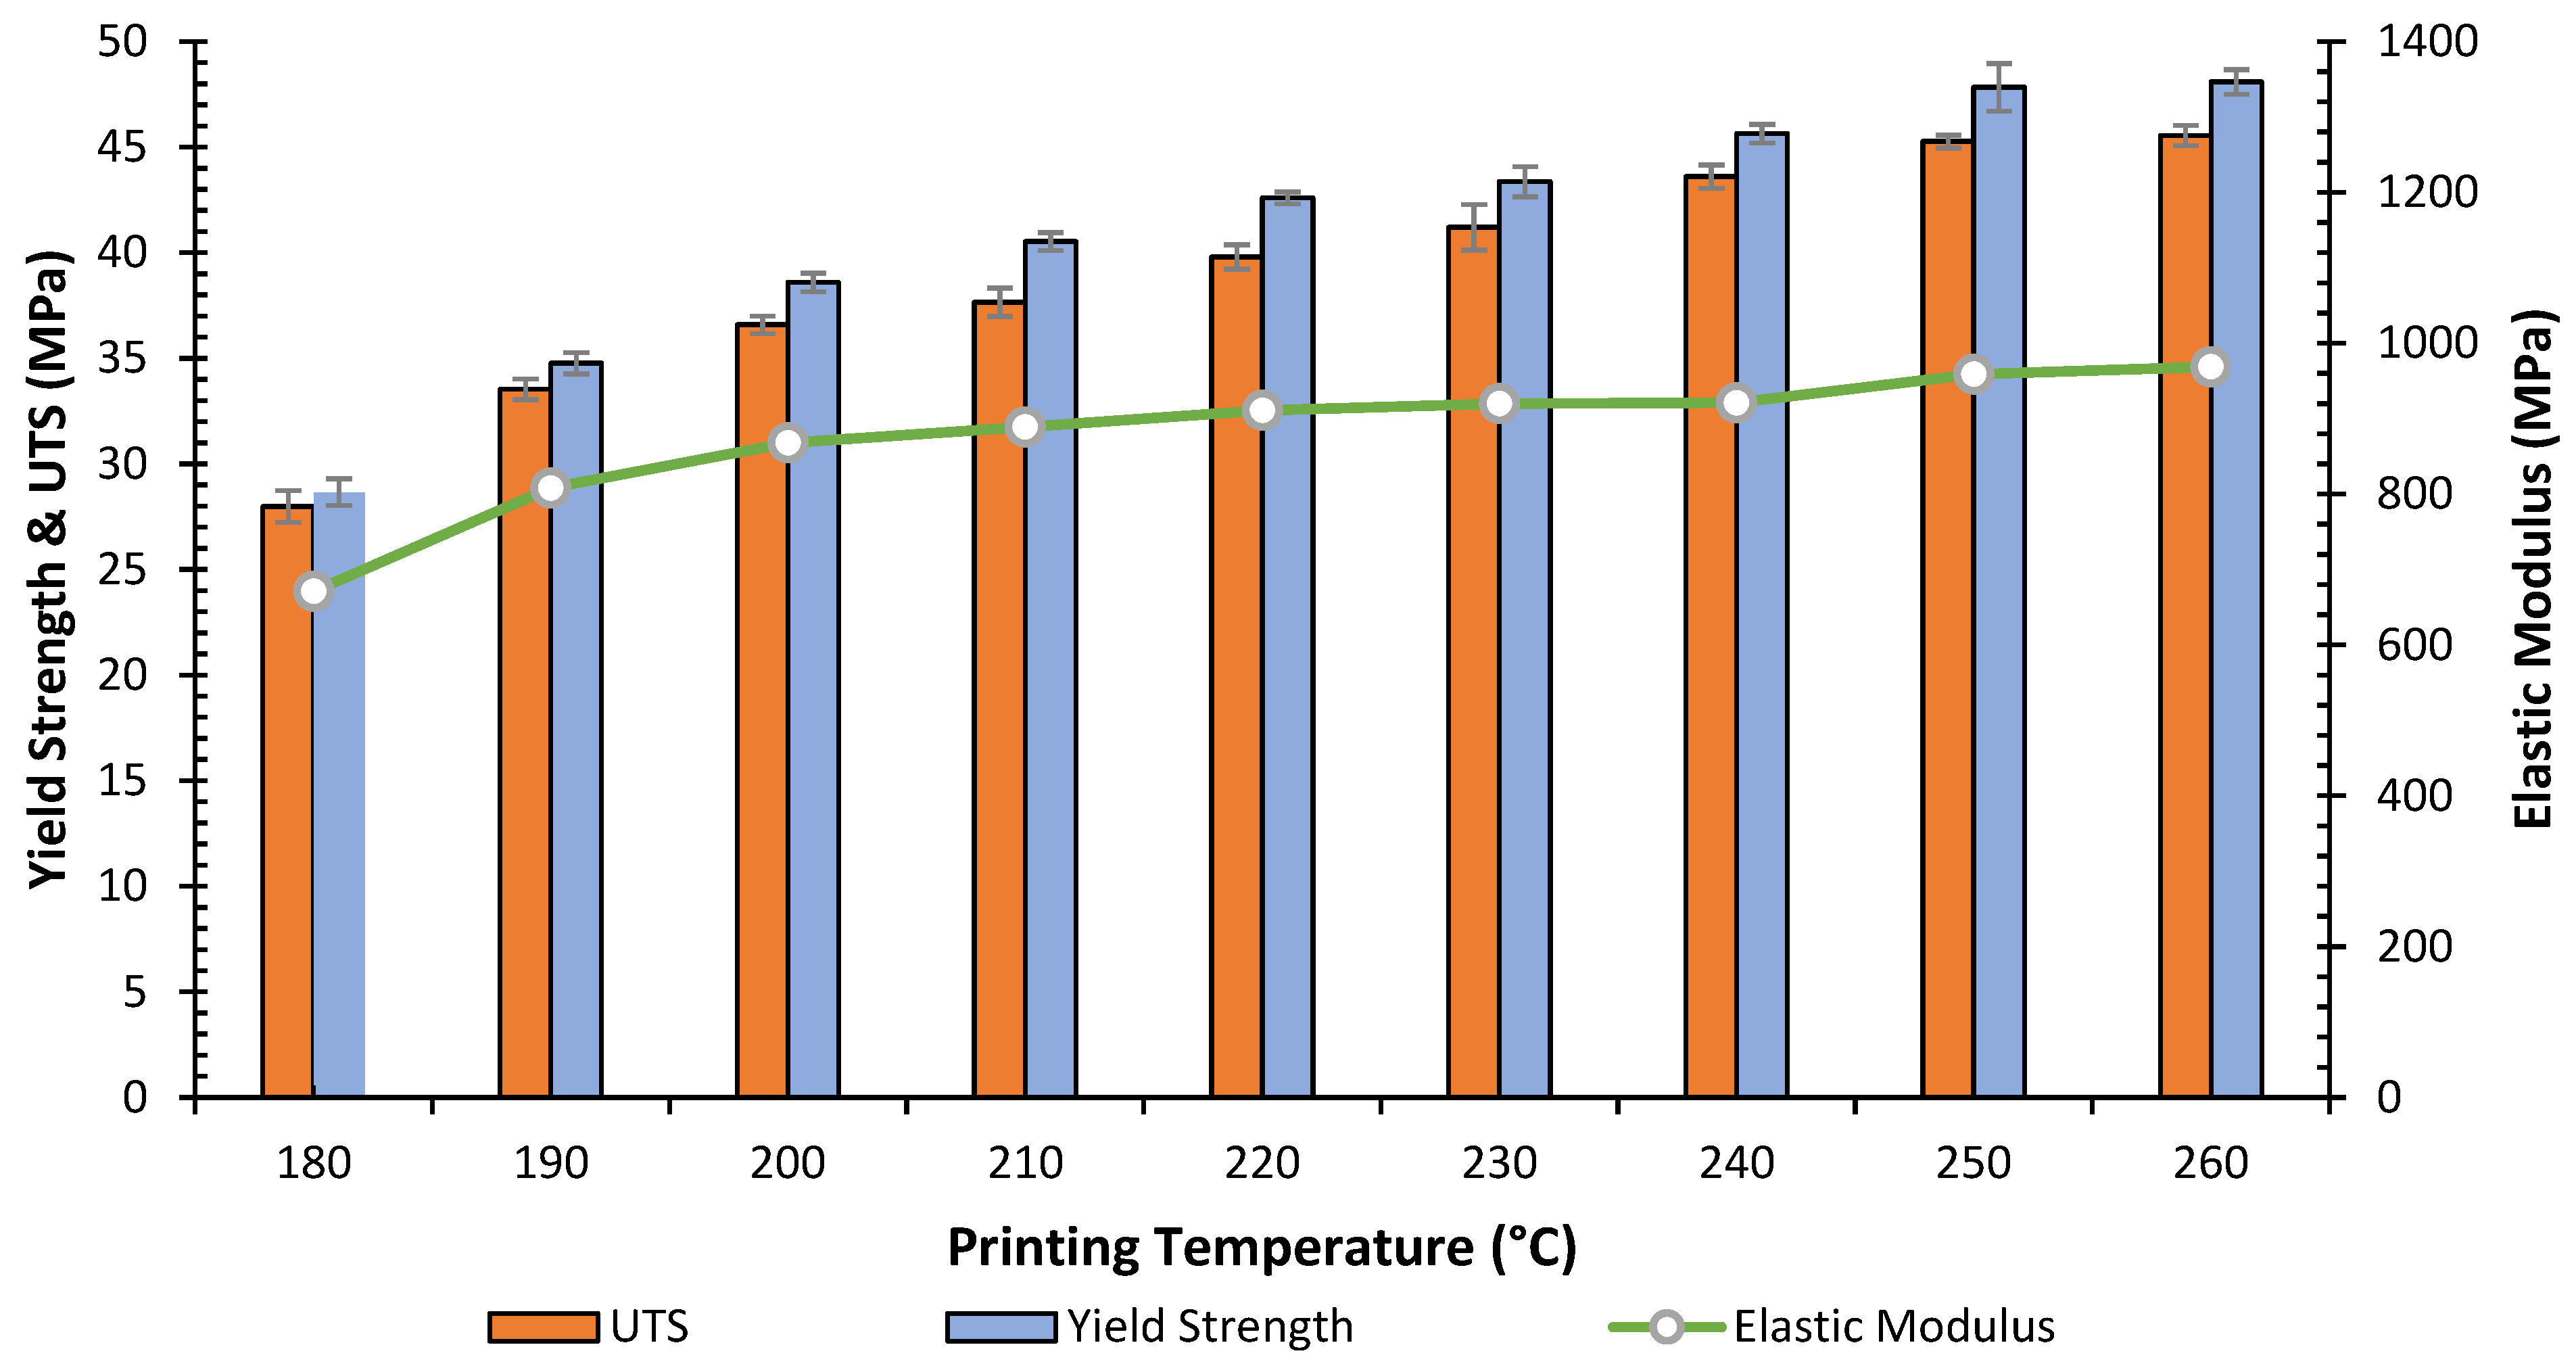
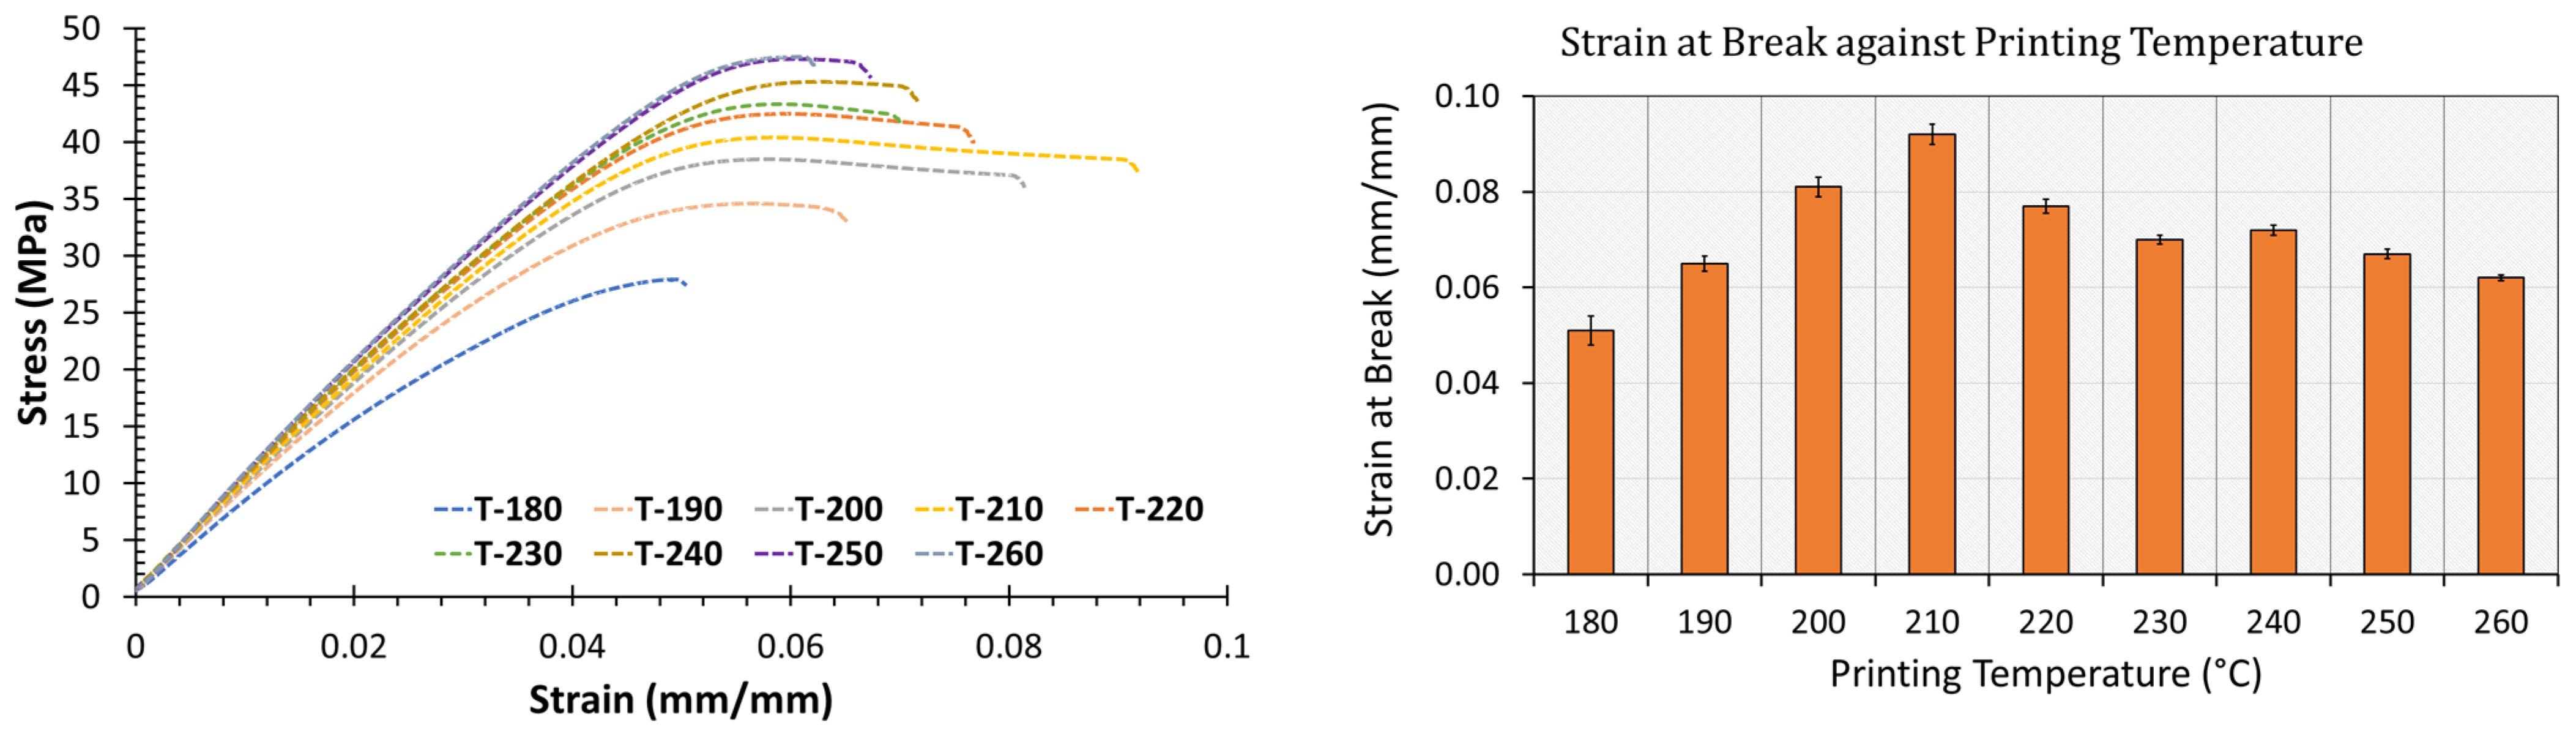
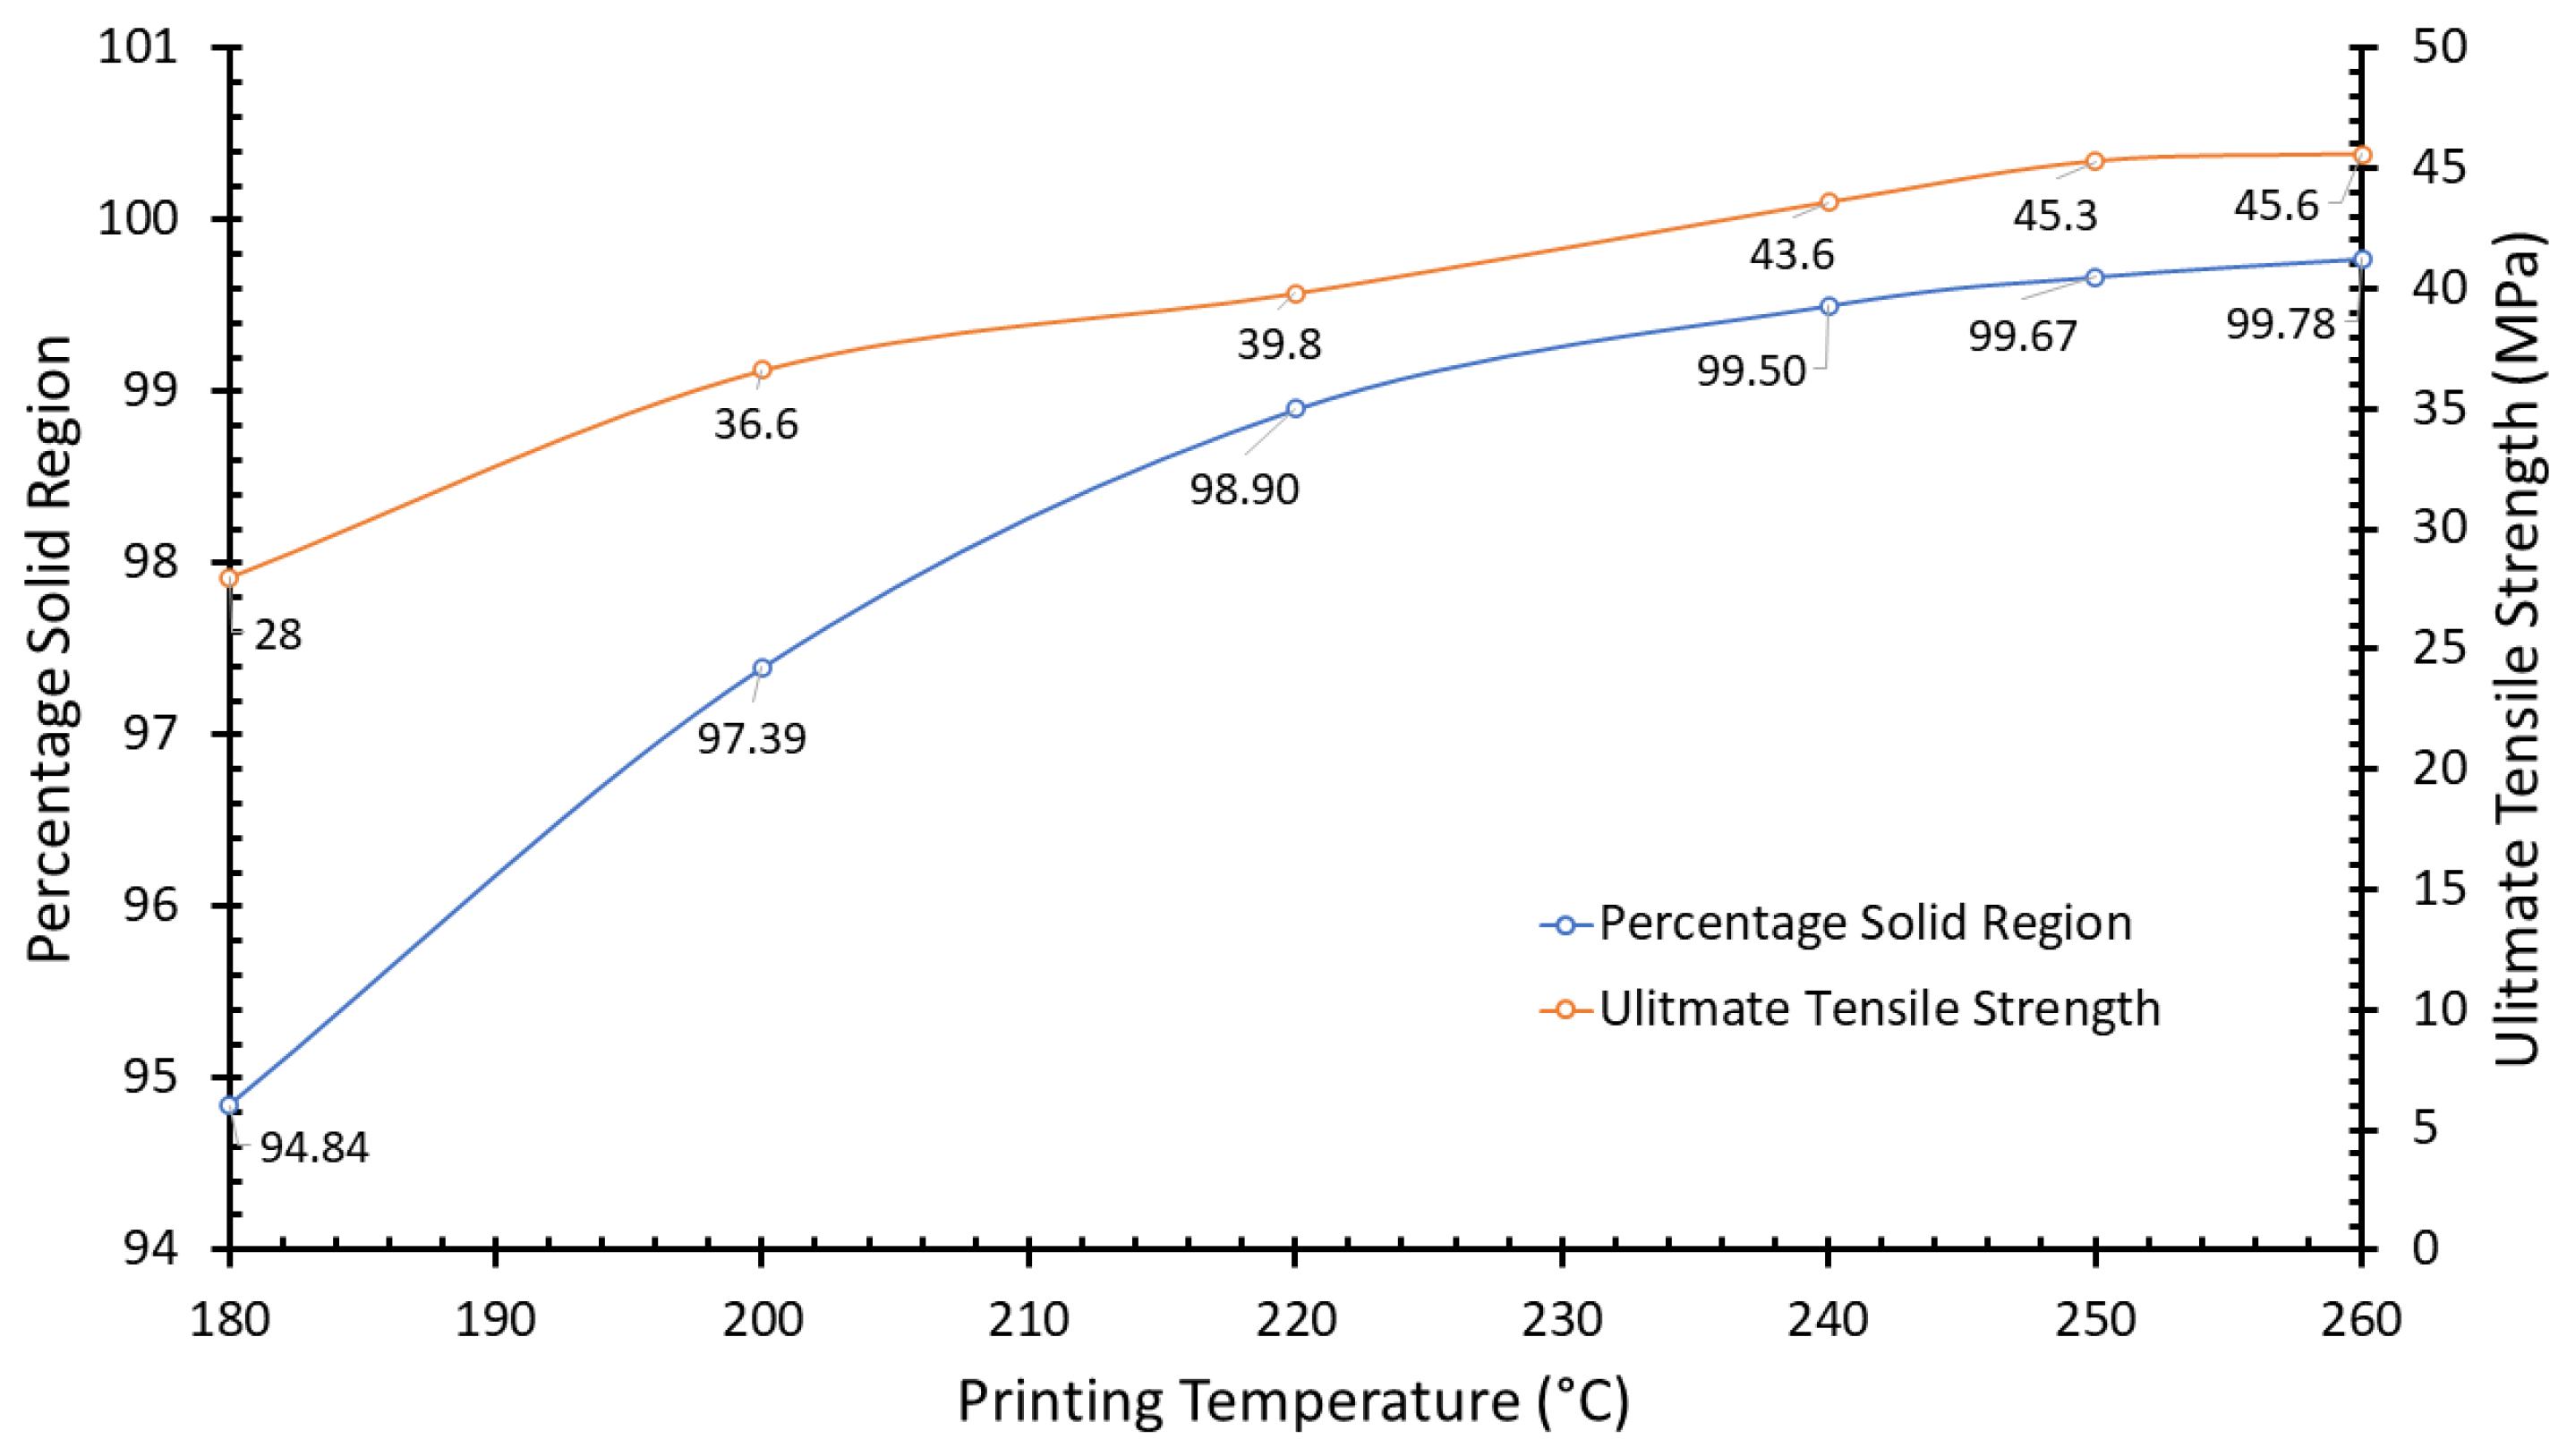
3.3. Tensile Properties
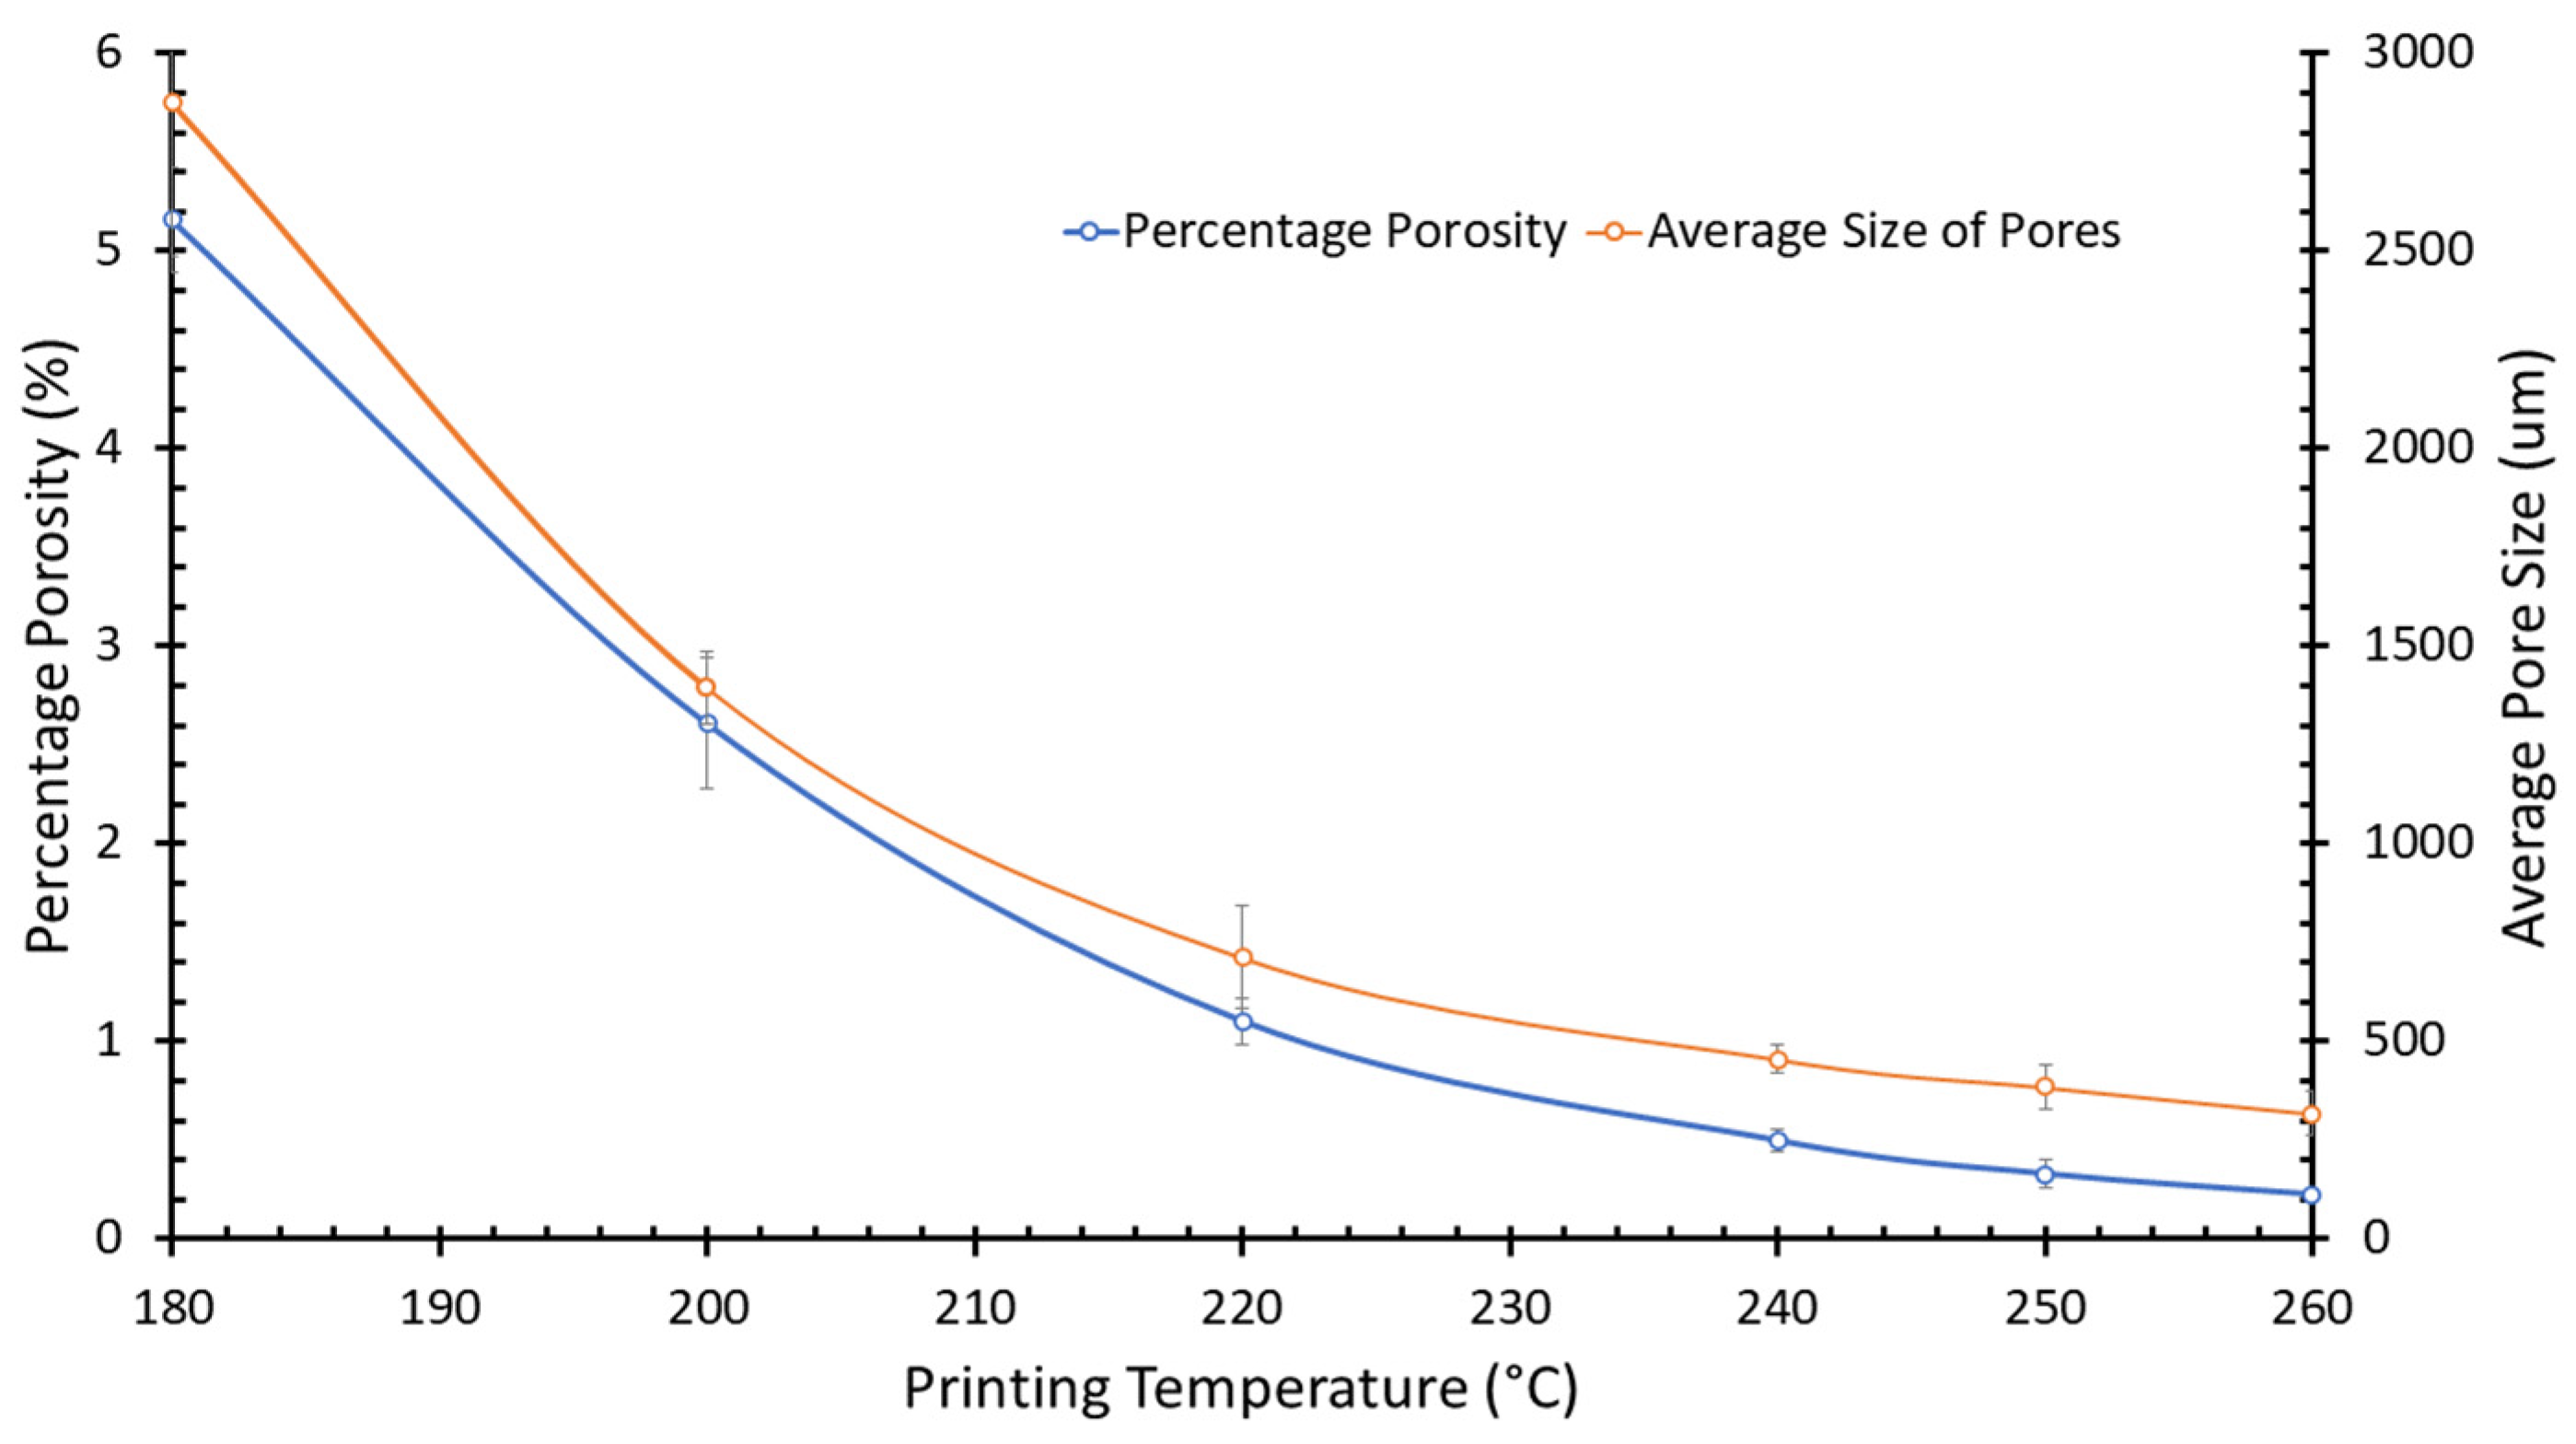
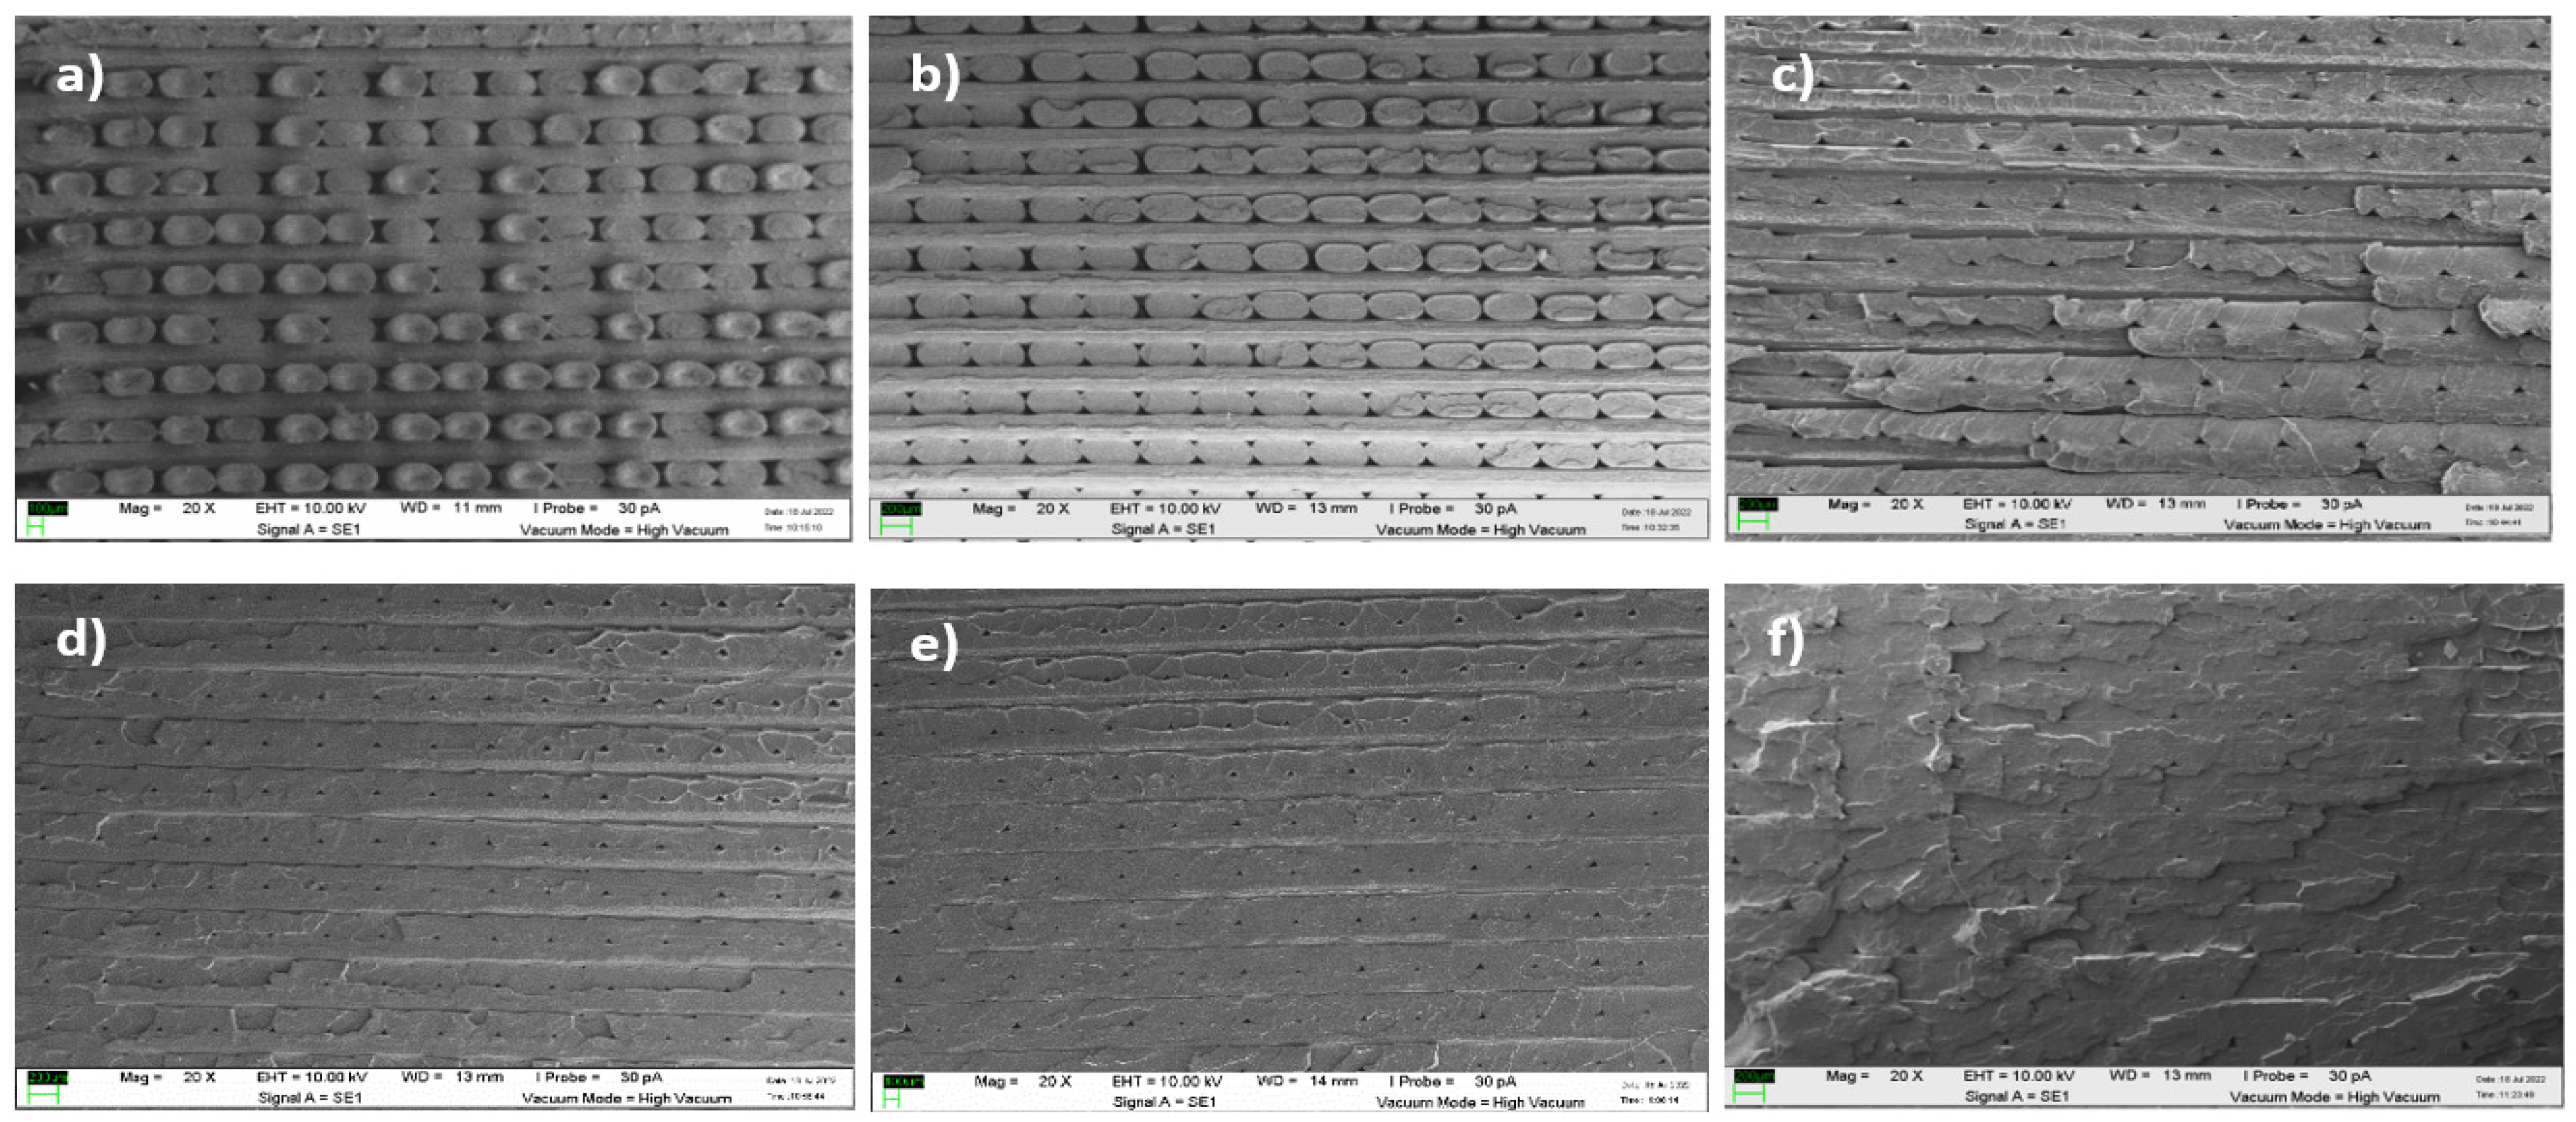
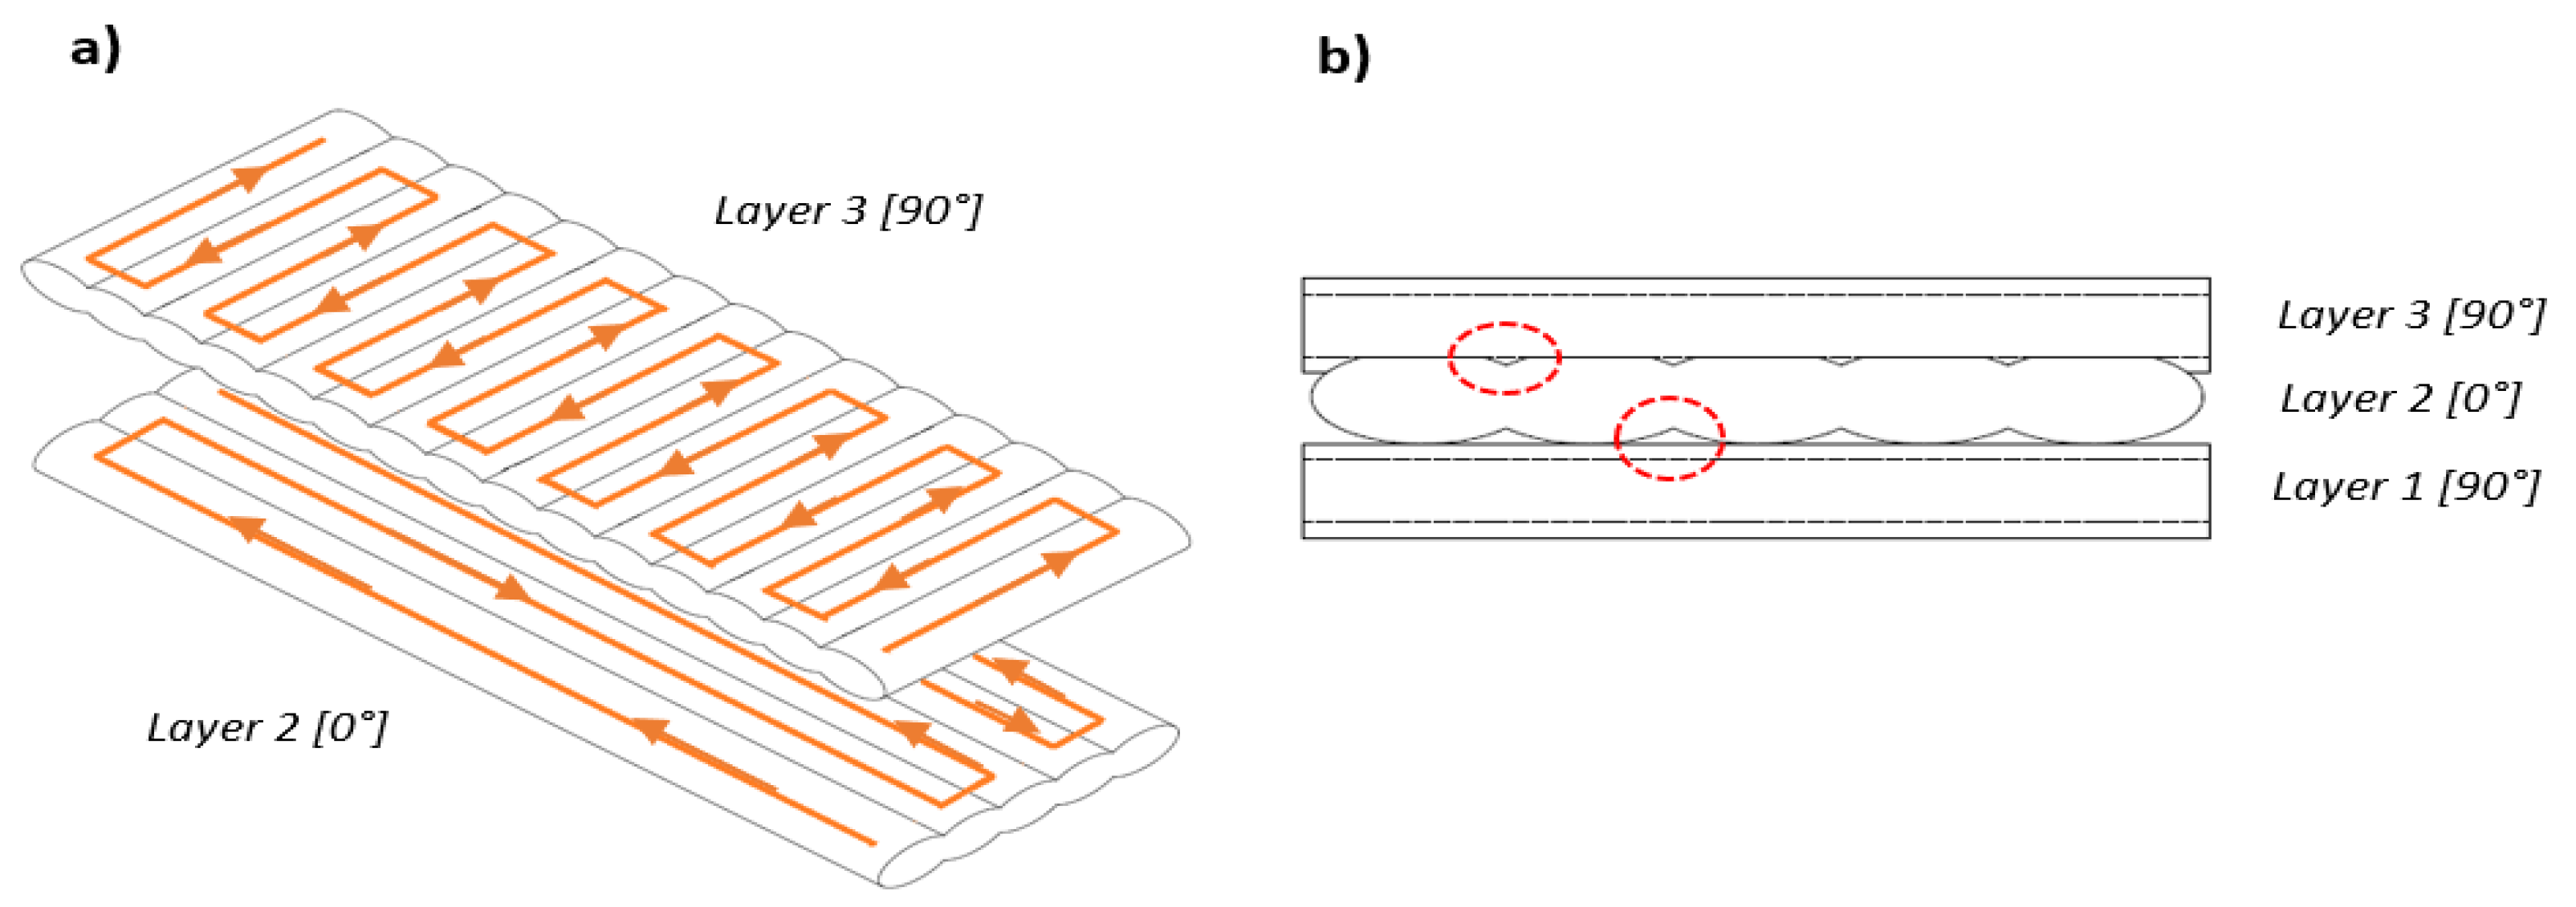
Based on the results shown in Figure 6, it can be observed that the tensile strength and elastic modulus increased with printing temperature. The stress–strain curve from Figure 7 shows that specimens printed at different printing temperatures exhibited different ultimate tensile strengths, implying a difference in maximum holding capacity. A drastic 23% increase in tensile strength was observed for specimens printed at 180 °C to 200 °C. This can be attributed to the quality of bonds formed within the specimens, which will be discussed in Section 3.5. Increasing the printing temperature after 200 °C to 260 °C contributed to a further 17% improvement in tensile strength.
Overall, a 38% difference in tensile strength was recorded for specimens printed at the two most extreme conditions. The strain at break, as shown in Figure 7, showed an increasing trend up to 210 °C, then a gradual decrease was observed after. The fracture mechanism can be described as brittle as the plastic deformation was low, which can be identified as the region between the yield point and rupture point on the stress–strain curve. The results show that PLA exhibits an elastic–plastic response as there is no evidence of strain hardening beyond the yield strength [68].

3.4. Void Formation

Quantitative analysis was conducted using the SEM micrographs at 50x magnification. Figure 8 shows the relationship between the percentage and average size of voids with the printing temperature. The trend of the results illustrates a significant decrease in the percentage area of voids when the printing temperature increased from 180 °C to 220 °C, while a further increase in printing temperature had a lesser effect on reducing the percentage area of voids. In contrast, the average void size showed a steady decrease from 180 °C up to 260 °C. The improvement in physical bonding can be attributed to the improved neck formation and molecular diffusion, where greater overlap between deposited roads was observed. Therefore, increasing the printing temperature leads to a reduced percentage of voids. Figure 9 shows the relationship between the ultimate tensile strength and percentage of solid region within the internal geometry with printing temperature. Based on the results, it is clear that a higher tensile strength is a result of parts with a higher density within their internal geometry.
Based on the SEM micrographs in Figure 10, a lack of bond overlap is clear at low printing temperatures. A significant reduction in the size and percentage area of voids was observed as the printing temperature increased, which improved the physical bonding between the roads. The influential factors affecting the fracture dynamics and plastic deformation of the specimens are the physical bonding between roads and the voids that form within the internal geometry. A larger and higher percentage of voids could be observed for specimens printed at lower temperatures based on the SEM micrographs of the failure cross-section, as shown in Figure 10a,b. The strength degradation can be attributed to the greater residual porosity within the internal geometry contributing to weaker tensile strength and quicker failure. A reasonable assumption is that the voids undergo high-stress concentration upon loading and act as failure points where crack initiation begins [73]. The propagation of failure in brittle polymers can be associated with crazing and molecular void formation [74]. In terms of the failure mechanism, the presence of voids creates an initiation point for failure that triggers layer delamination upon loading. This effect is more profound when the infill is printed at certain orientations such as those printed at a raster angle of [45°] [65,75]. Therefore, controlling the process parameters is an effective way to reduce these effects as well as the porosity related defects that result in failure.

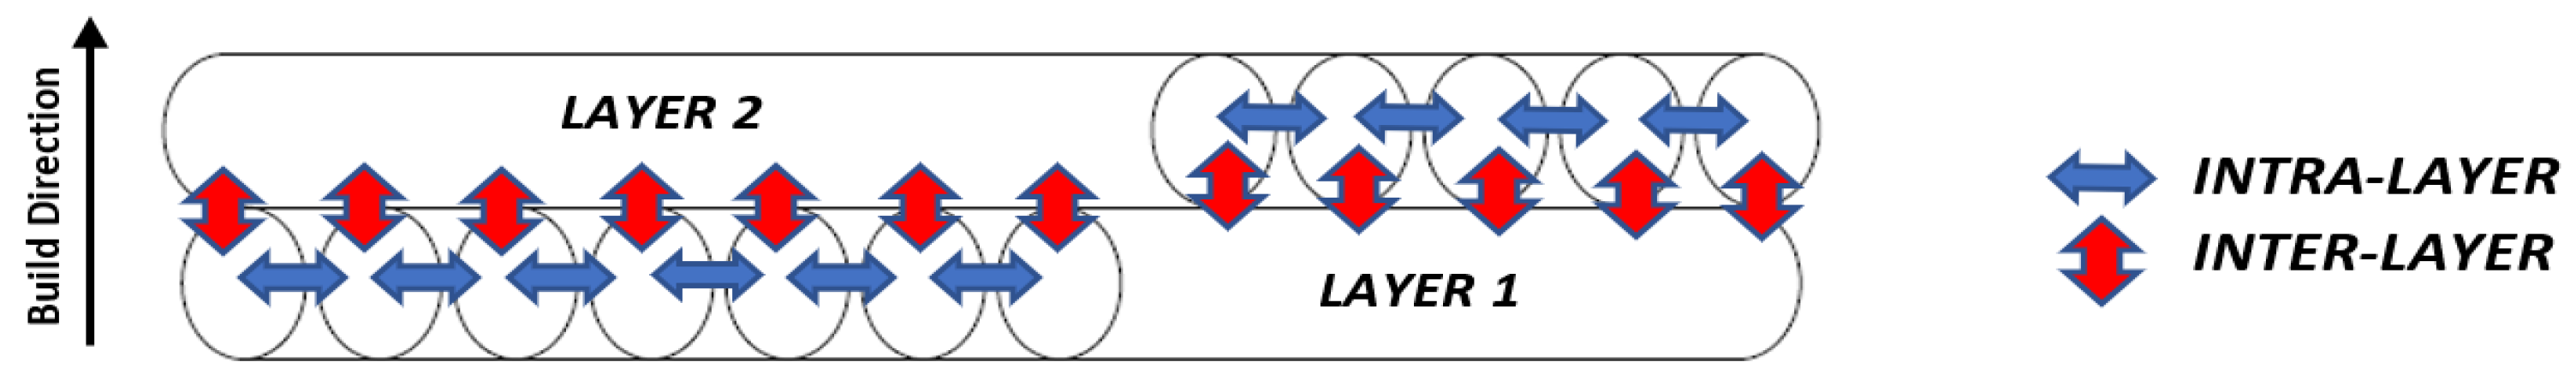
3.5. Bond Development Based on Fracture Analysis

During printing, the deposited roads solidify and form cross-bonding with adjacent and preceding roads that were previously deposited through polymer sintering. This phenomenon can be related to the concept of diffusion bonding, which includes surface contact, neck growth, molecular diffusion, and randomization across the interface [52]. The mechanical properties of FFF fabricated parts are dictated by the quality of bonds between adjacent and underlying roads. The bonds formed between adjacent roads within the same layer are known as ‘intralayer bonds’, while bonds formed with preceding roads from previous layers are known as ‘interlayer bonds’, which is illustrated in Figure 11. A greater overlap between roads is categorized as better physical bonding as less voids are formed within the internal geometry. From the micrographs of the cross-sectional fracture surfaces, it can be confirmed that the printing temperature affects the formation of bonds between roads. The bonds developed are highly dependent on the local temperature at which bonding occurs, which is known as the coalescence temperature. The formation of bonds through polymer diffusion is highly dependent on heating and cooling factors. Therefore, it is important to optimize process parameters such as printing temperature and speed to enhance the strength of bonds.
The schematic diagram shown in Figure 12a,b was reconstructed to illustrate the necking and molecular diffusion between roads within the same layer (intralayer bonds). At higher coalescence temperatures, the time window where the roads are above the polymer glass transition temperature is longer and allows more time for neck growth and molecular diffusion across the interface [53]. The strength of the bonds is higher as the roads fuse more closely together, which also results in the reduction in the size and percentage area of voids. Therefore, a longer time window is preferable as it results in the formation of stronger bonds. Figure 12c,d illustrates the development of interlayer bonds with previous layers as the printing temperature increases. As the printing temperature increases, a stronger and more compact structure is formed as a result of greater overlap with roads from the previous layers. This reduces the tendency for delamination between the layers to occur upon loading, which increases the tensile strength. Besides forming stronger bonds between roads, the deposition of molten filament is also expected to have a reheating effect on adjacent and preceding roads, which promotes polymer diffusion and entanglement. Heat from the freshly deposited road is transferred through heat conduction to the previously deposited roads [77]. This reheats the previously deposited roads above their glass transition temperature, allowing for neck formation and polymer diffusion to reoccur [78]. Therefore, a higher printing temperature results in a greater reheating effect as more heat can be transferred [79]. Based on the results obtained, it can be concluded that a higher printing temperature provides a longer time window for bond development, which results in better neck formation and an increased tensile strength similar to the research by Abbott et al. [59].
The presence of voids within the part can be associated with inadequate neck formation and molecular diffusion and is more profound at lower printing temperatures. The voids act as a point for crack initiation where upon loading results in failure [80]. The formation of voids can be attributed to the rheological behavior of PLA, where viscosity is high at lower working temperatures [81]. The viscosity material decreases with increasing temperature and flows more easily, allowing better fusion between the roads, thus decreasing the size of the voids. Similar results were reported in a recent numerical simulation, where the kinetics of coalescence increased at higher temperature [60].
Based on the SEM micrographs in Figure 12, it can be observed that the majority of the voids formed on the bottom side of the roads. This was identified as all of the samples were placed and viewed using the same orientation during SEM imaging. This phenomenon can be attributed to the printing path taken during the fabrication process which is illustrated in Figure 13a. For the layers printed with an infill orientation of 90 degrees, the deposited roads take a shorter printing path compared to layers of 0 degrees. Due to the shorter path, the adjacent roads are of higher temperature when new roads are deposited, thus increasing the time window available for diffusion bonding. At a high printing temperature, the low viscosity molten PLA quickly fills the gaps from previous layers due to gravitational force.
The shorter path taken for roads printed at 90 degrees results in a greater overlap with roads from the preceding layer, forming smaller voids. This is illustrated between layers 2 and 3 in Figure 13b. Furthermore, the higher coalescence temperature also results in a greater reheating effect, which provides a secondary chance for molecular diffusion and randomization across the interface. In contrast, the previous roads would have already cooled down when new roads are deposited for roads printed at 0 degrees. This significantly reduces the time window available for neck growth and molecular diffusion, which causes the roads to fuse less closely together. The formation of voids on the bottom side of the layers is a result of the lack of bonding with preceding layers and is illustrated between layers 1 and 2 in Figure 13b.

4. Conclusions

This study provides knowledge on how varying the printing temperatures affects FFF fabricated parts both externally and internally. The relationship between printing temperature with dimensional accuracy and tensile properties was established. From the results, it can be concluded that the notable increase in tensile strength is due to better developed physical bonds within the internal geometry. A steady decrease in the average size of voids was observed when the printing temperature was increased. The percentage area of voids reduced by approximately 86% as the printing temperature was increased from 180 °C to 220 °C. On the other hand, T = 220 °C was the optimum printing temperature that yielded the best dimensional accuracy. It was observed that specimens printed below T = 220 °C were smaller than the designed specification while those above T = 220 °C were larger. Based on the results, it is clear that the development of bonds between adjacent and preceding roads is highly dependent on the rheological behavior of PLA, which is a function of temperature. A longer time window for neck growth and polymer diffusion between deposited roads formed stronger bonds. Next, it should also be noted that the tool path taken during printing has a profound effect on the formation of voids. The shorter printing path for layers printed at 90 degrees showed more overlap with roads from adjacent and preceding layers as the coalescence temperature was higher. From this study, it is evident that varying the printing temperature has a profound effect on the quality of bonds formed between the deposited roads. This affects the tensile properties due to the internal geometry of the printed parts and externally in the form of dimensional accuracy and surface finish. The findings from this paper provide a method to alter the mechanical properties by optimizing the printing temperature.

Author Contributions

Conceptualization, R.P. and M.K.L.; Methodology, R.P., M.K.L. and T.C.Y.; Design, R.P.; Testing, R.P. and K.I.I.; Investigation, R.P. and K.I.I.; Writing—original draft preparation, R.P. and M.K.L.; Writing—review and editing, M.K.L. and T.C.Y.; Supervision, M.K.L. and T.C.Y.; Project administration, M.K.L.; Funding acquisition, M.K.L. and T.C.Y. All authors have read and agreed to the published version of the manuscript.

Funding

This work was supported by the Ministry of Higher Education Malaysia under the Fundamental Research Grant Scheme (FRGS/1/2019/TK05/HWUM/02/2).

Data Availability Statement

Data are contained within the article.

Acknowledgments

The authors thank the laboratory staff at the School of Engineering and Physical Sciences at Heriot-Watt University Malaysia for their technical assistance. R.P. would like to thank the Malaysian Ministry of Higher Education (MOHE) and Heriot-Watt University Malaysia for the financial support. M.K.L. would like to thank the funder of this project.

Conflicts of Interest

The authors declare no conflicts of interest.

References

  1. Pereira, T.; Kennedy, J.V.; Potgieter, J. A Comparison of Traditional Manufacturing vs Additive Manufacturing, the Best Method for the Job. Procedia Manuf. 2019, 30, 11–18. [Google Scholar] [CrossRef]
  2. Srivastava, M.; Rathee, S. Additive Manufacturing: Recent Trends, Applications and Future Outlooks. Prog. Addit. Manuf. 2022, 7, 261–287. [Google Scholar] [CrossRef]
  3. Vasco, J.C. Chapter 16—Additive Manufacturing for the Automotive Industry. In Handbooks in Advanced Manufacturing; Pou, J., Riveiro, A., Davim, J.P.B.T.-A.M., Eds.; Elsevier: Amsterdam, The Netherlands, 2021; pp. 505–530. ISBN 978-0-12-818411-0. [Google Scholar]
  4. Mohseni, Y.; Mohseni, M.; Suresh, S.; Riotto, M.; Jaggessar, A.; Little, J.P.; Wille, M.-L.; Yarlagadda, P.K. Investigating Impacts of FDM Printing Parameters and Geometrical Features on Void Formation in 3D Printed Automotive Components. Mater. Today Proc. 2023. [Google Scholar] [CrossRef]
  5. Gardan, J. Additive Manufacturing Technologies: State of the Art and Trends. Int. J. Prod. Res. 2016, 54, 3118–3132. [Google Scholar] [CrossRef]
  6. Hsueh, M.H.; Lai, C.J.; Wang, S.H.; Zeng, Y.S.; Hsieh, C.H.; Pan, C.Y.; Huang, W.C. Effect of Printing Parameters on the Thermal and Mechanical Properties of 3d-Printed Pla and Petg, Using Fused Deposition Modeling. Polymers 2021, 13, 1758. [Google Scholar] [CrossRef]
  7. Gibson, I.; Rosen, D.; Stucker, B.; Khorasani, M. Additive Manufacturing Technologies; Springer International Publishing: Cham, Switzerland, 2021; Volume 17, ISBN 978-3-030-56126-0. [Google Scholar]
  8. Crump, S. Apparatus and Method for Creating Three-Dimensional Objects. U.S. Patent 5,121,329, 30 October 1984. Available online: https://patents.google.com/patent/US5121329A/en (accessed on 8 September 2023).
  9. Nagaraju, D.S.; Krupakaran, R.L.; Sripadh, C.; Nitin, G.; Joy Joseph Emmanuel, G. Mechanical Properties of 3D Printed Specimen Using FDM (Fused Deposition Modelling) and SLA (Stereolithography) Technologies. Mater. Today Proc. 2023. [Google Scholar] [CrossRef]
  10. Syrlybayev, D.; Zharylkassyn, B.; Seisekulova, A.; Akhmetov, M.; Perveen, A.; Talamona, D. Optimisation of Strength Properties of FDM Printed Parts—A Critical Review. Polymers 2021, 13, 1587. [Google Scholar] [CrossRef] [PubMed]
  11. Kim, G.D.; Oh, Y.T. A Benchmark Study on Rapid Prototyping Processes and Machines: Quantitative Comparisons of Mechanical Properties, Accuracy, Roughness, Speed, and Material Cost. Proc. Inst. Mech. Eng. Part B J. Eng. Manuf. 2008, 222, 201–215. [Google Scholar] [CrossRef]
  12. Muenks, D.; Kyosev, Y. Productivity Comparison Between Vat Polymerization and Fused Filament Fabrication Methods for Additive Manufacturing of Polymers. 3D Print. Addit. Manuf. 2021, 10, 40–49. [Google Scholar] [CrossRef]
  13. Calignano, F.; Manfredi, D.; Ambrosio, E.P.; Biamino, S.; Lombardi, M.; Atzeni, E.; Salmi, A.; Minetola, P.; Iuliano, L.; Fino, P. Overview on Additive Manufacturing Technologies. Proc. IEEE 2017, 105, 593–612. [Google Scholar] [CrossRef]
  14. Avinc, O.; Khoddami, A. Overview of Poly(Lactic Acid) (PLA) Fibre. Fibre Chem. 2009, 41, 391–401. [Google Scholar] [CrossRef]
  15. Taib, N.-A.A.B.; Rahman, M.R.; Huda, D.; Kuok, K.K.; Hamdan, S.; Bakri, M.K.; Julaihi, M.R.M.; Khan, A. A Review on Poly Lactic Acid (PLA) as a Biodegradable Polymer. Polym. Bull. 2022, 80, 1179–1213. [Google Scholar] [CrossRef]
  16. Shiva, S.; Asuwin Prabu, R.G.; Bajaj, G.; John, A.E.; Chandran, S.; Kumar, V.V.; Ramakrishna, S. A Review on the Recent Applications of Synthetic Biopolymers in 3D Printing for Biomedical Applications. J. Mater. Sci. Mater. Med. 2023, 34, 62. [Google Scholar] [CrossRef]
  17. Barchiki, F.; Fracaro, L.; Dominguez, A.C.; Senegaglia, A.C.; Vaz, I.M.; Soares, P.; Moura, S.A.; Brofman, P.R. Biocompatibility of ABS and PLA Polymers with Dental Pulp Stem Cells Enhance Their Potential Biomedical Applications. Polymers 2023, 15, 4629. [Google Scholar] [CrossRef]
  18. Bozkurt, Y.; Karayel, E. 3D Printing Technology; Methods, Biomedical Applications, Future Opportunities and Trends. J. Mater. Res. Technol. 2021, 14, 1430–1450. [Google Scholar] [CrossRef]
  19. Stachurová, T.; Rybková, Z.; Škrlová, K.; Malachová, K.; Havlíček, M.; Plachá, D. Biocompatibility and Biocidal Effects of Modified Polylactide Composites. Front. Microbiol. 2022, 13, 1031783. [Google Scholar] [CrossRef] [PubMed]
  20. Paz-González, J.A.; Velasco-Santos, C.; Villarreal-Gómez, L.J.; Alcudia-Zacarias, E.; Olivas-Sarabia, A.; Cota-Leal, M.A.; Flores-López, L.Z.; Gochi-Ponce, Y. Structural Composite Based on 3D Printing Polylactic Acid/Carbon Fiber Laminates (PLA/CFRC) as an Alternative Material for Femoral Stem Prosthesis. J. Mech. Behav. Biomed. Mater. 2023, 138, 105632. [Google Scholar] [CrossRef]
  21. Jamshidian, M.; Tehrany, E.A.; Imran, M.; Jacquot, M.; Desobry, S. Poly-Lactic Acid: Production, Applications, Nanocomposites, and Release Studies. Compr. Rev. Food Sci. Food Saf. 2010, 9, 552–571. [Google Scholar] [CrossRef]
  22. Gupta, K.; Jain, N.K.; Laubscher, R. Chapter 4—Advances in Gear Manufacturing; Gupta, K., Jain, N.K., Laubscher, R., Eds.; Academic Press: Cambridge, MA, USA, 2017; pp. 67–125. ISBN 978-0-12-804460-5. [Google Scholar]
  23. Podsiadły, B.; Skalski, A.; Rozpiórski, W.; Słoma, M. Are We Able to Print Components as Strong as Injection Molded?—Comparing the Properties of 3D Printed and Injection Molded Components Made from ABS Thermoplastic. Appl. Sci. 2021, 11, 6946. [Google Scholar] [CrossRef]
  24. Gao, X.; Qi, S.; Kuang, X.; Su, Y.; Li, J.; Wang, D. Fused Filament Fabrication of Polymer Materials: A Review of Interlayer Bond. Addit. Manuf. 2021, 37, 101658. [Google Scholar] [CrossRef]
  25. Wolszczak, P.; Lygas, K.; Paszko, M.; Wach, R.A. Heat Distribution in Material during Fused Deposition Modelling. Rapid Prototyp. J. 2018, 24, 615–622. [Google Scholar] [CrossRef]
  26. Tao, Y.; Kong, F.; Li, Z.; Zhang, J.; Zhao, X.; Yin, Q.; Xing, D.; Li, P. A Review on Voids of 3D Printed Parts by Fused Filament Fabrication. J. Mater. Res. Technol. 2021, 15, 4860–4879. [Google Scholar] [CrossRef]
  27. Wang, X.; Zhao, L.; Fuh, J.Y.; Lee, H.P. Effect of Porosity on Mechanical Properties of 3D Printed Polymers: Experiments and Micromechanical Modeling Based on X-Ray Computed Tomography Analysis. Polymers 2019, 11, 1154. [Google Scholar] [CrossRef]
  28. Vyavahare, S.; Teraiya, S.; Panghal, D.; Kumar, S. Fused Deposition Modelling: A Review. Rapid Prototyp. J. 2020, 26, 176–201. [Google Scholar] [CrossRef]
  29. Aloyaydi, B.; Sivasankaran, S.; Mustafa, A. Investigation of Infill-Patterns on Mechanical Response of 3D Printed Poly-Lactic-Acid. Polym. Test. 2020, 87, 106557. [Google Scholar] [CrossRef]
  30. Abe, Y.; Kurose, T.; Santos, M.V.A.; Kanaya, Y.; Ishigami, A.; Tanaka, S.; Ito, H. Effect of Layer Directions on Internal Structures and Tensile Properties of 17-4PH Stainless Steel Parts Fabricated by Fused Deposition of Metals. Materials 2021, 14, 243. [Google Scholar] [CrossRef]
  31. Kristiawan, R.B.; Imaduddin, F.; Ariawan, D.; Ubaidillah; Arifin, Z. A Review on the Fused Deposition Modeling (FDM) 3D Printing: Filament Processing, Materials, and Printing Parameters. Open Eng. 2021, 11, 639–649. [Google Scholar] [CrossRef]
  32. Naveed, N. Investigate the Effects of Process Parameters on Material Properties and Microstructural Changes of 3D-Printed Specimens Using Fused Deposition Modelling (FDM). Mater. Technol. 2021, 36, 317–330. [Google Scholar] [CrossRef]
  33. Giri, J.; Chiwande, A.; Gupta, Y.; Mahatme, C.; Giri, P. Effect of Process Parameters on Mechanical Properties of 3d Printed Samples Using FDM Process. Mater. Today Proc. 2021, 47, 5856–5861. [Google Scholar] [CrossRef]
  34. Bellini, A.; Güçeri, S. Mechanical Characterization of Parts Fabricated Using Fused Deposition Modeling. Rapid Prototyp. J. 2003, 9, 252–264. [Google Scholar] [CrossRef]
  35. Onwubolu, G.C.; Rayegani, F. Characterization and Optimization of Mechanical Properties of ABS Parts Manufactured by the Fused Deposition Modelling Process. Int. J. Manuf. Eng. 2014, 2014, 598531. [Google Scholar] [CrossRef]
  36. Li, H.; Wang, T.; Sun, J.; Yu, Z. The Effect of Process Parameters in Fused Deposition Modelling on Bonding Degree and Mechanical Properties. Rapid Prototyp. J. 2018, 24, 80–92. [Google Scholar] [CrossRef]
  37. Valvez, S.; Silva, A.P.; Reis, P.N.B. Optimization of Printing Parameters to Maximize the Mechanical Properties of 3D-Printed PETG-Based Parts. Polymers 2022, 14, 2564. [Google Scholar] [CrossRef] [PubMed]
  38. Exley, O.; Perera, Y.S.; Abeykoon, C. Investigation of the Effect of the Degree of Hollowness and Internal Cavity Structure on the Mechanical Properties of 3D-Printed Parts. Int. J. Light. Mater. Manuf. 2024, 7, 45–61. [Google Scholar] [CrossRef]
  39. Haque, A.N.; Naebe, M. Tensile Properties of Natural Fibre-Reinforced FDM Filaments: A Short Review. Sustainability 2023, 15, 16580. [Google Scholar] [CrossRef]
  40. Ismail, K.I.; Ramarad, S.; Yap, T.C.; Ahmed, R. Design and Fabrication of an In Situ Short-Fiber Doser for Fused Filament Fabrication 3D Printer: A Novel Method to Manufacture Fiber–Polymer Composite. Inventions 2023, 14, 10. [Google Scholar] [CrossRef]
  41. Prüß, H.; Vietor, T. Design for Fiber-Reinforced Additive Manufacturing. J. Mech. Des. Trans. ASME 2015, 137, 111409. [Google Scholar] [CrossRef]
  42. Baumann, F.; Scholz, J.; Fleischer, J. Investigation of a New Approach for Additively Manufactured Continuous Fiber-Reinforced Polymers. Procedia CIRP 2017, 66, 323–328. [Google Scholar] [CrossRef]
  43. Domingo-Espin, M.; Puigoriol-Forcada, J.M.; Garcia-Granada, A.-A.; Llumà, J.; Borros, S.; Reyes, G. Mechanical Property Characterization and Simulation of Fused Deposition Modeling Polycarbonate Parts. Mater. Des. 2015, 83, 670–677. [Google Scholar] [CrossRef]
  44. Kaveh, M.; Badrossamay, M.; Foroozmehr, E.; Hemasian Etefagh, A. Optimization of the Printing Parameters Affecting Dimensional Accuracy and Internal Cavity for HIPS Material Used in Fused Deposition Modeling Processes. J. Mater. Process. Technol. 2015, 226, 280–286. [Google Scholar] [CrossRef]
  45. Jatti, V.S.; Jatti, S.V.; Patel, A.; Jatti, V.S. A Study On Effect Of Fused Deposition Modeling Process Parameters On Mechanical Properties. Int. J. Sci. Technol. Res. 2019, 8, 689–693. [Google Scholar]
  46. Vanaei, H.; Shirinbayan, M.; Deligant, M.; Raissi, K.; Fitoussi, J.; KHELLADI, S.; Tcharkhtchi, A. Influence of Process Parameters on Thermal and Mechanical Properties of Polylactic Acid Fabricated by Fused Filament Fabrication. Polym. Eng. Sci. 2020, 60, 1822–1831. [Google Scholar] [CrossRef]
  47. Benwood, C.; Anstey, A.; Andrzejewski, J.; Misra, M.; Mohanty, A.K. Improving the Impact Strength and Heat Resistance of 3D Printed Models: Structure, Property, and Processing Correlationships during Fused Deposition Modeling (FDM) of Poly(Lactic Acid). ACS Omega 2018, 3, 4400–4411. [Google Scholar] [CrossRef]
  48. Alafaghani, A.; Qattawi, A.; Alrawi, B.; Guzman, A. Experimental Optimization of Fused Deposition Modelling Processing Parameters: A Design-for-Manufacturing Approach. Procedia Manuf. 2017, 10, 791–803. [Google Scholar] [CrossRef]
  49. Valerga, A.P.; Batista, M.; Salguero, J.; Girot, F. Influence of PLA Filament Conditions on Characteristics of FDM Parts. Materials 2018, 11, 8. [Google Scholar] [CrossRef]
  50. De Gennes, P.G. Reptation of a Polymer Chain in the Presence of Fixed Obstacles. J. Chem. Phys. 1971, 55, 572–579. [Google Scholar] [CrossRef]
  51. Kim, Y.H.; Wool, R.P. A Theory of Healing at a Polymer-Polymer Interface. Macromolecules 1983, 16, 1115–1120. [Google Scholar] [CrossRef]
  52. Sun, Q.; Rizvi, G.M.; Bellehumeur, C.T.; Gu, P. Effect of Processing Conditions on the Bonding Quality of FDM Polymer Filaments. Rapid Prototyp. J. 2008, 14, 72–80. [Google Scholar] [CrossRef]
  53. Gurrala, P.K.; Regalla, S.P. Part Strength Evolution with Bonding between Filaments in Fused Deposition Modelling: This Paper Studies How Coalescence of Filaments Contributes to the Strength of Final FDM Part. Virtual Phys. Prototyp. 2014, 9, 141–149. [Google Scholar] [CrossRef]
  54. Coogan, T.J.; Kazmer, D.O. Healing Simulation for Bond Strength Prediction of FDM. Rapid Prototyp. J. 2017, 23, 551–561. [Google Scholar] [CrossRef]
  55. Sun, X.; Mazur, M.; Cheng, C.-T. A Review of Void Reduction Strategies in Material Extrusion-Based Additive Manufacturing. Addit. Manuf. 2023, 67, 103463. [Google Scholar] [CrossRef]
  56. Ismail, K.I.; Pang, R.; Ahmed, R.; Yap, T.C. Tensile Properties of In Situ 3D Printed Glass Fiber-Reinforced PLA. Polymers 2023, 15, 3436. [Google Scholar] [CrossRef]
  57. Chin Ang, K.; Fai Leong, K.; Kai Chua, C.; Chandrasekaran, M. Investigation of the Mechanical Properties and Porosity Relationships in Fused Deposition Modelling-fabricated Porous Structures. Rapid Prototyp. J. 2006, 12, 100–105. [Google Scholar] [CrossRef]
  58. Koch, C.; Van Hulle, L.; Rudolph, N. Investigation of Mechanical Anisotropy of the Fused Filament Fabrication Process via Customized Tool Path Generation. Addit. Manuf. 2017, 16, 138–145. [Google Scholar] [CrossRef]
  59. Abbott, A.C.; Tandon, G.P.; Bradford, R.L.; Koerner, H.; Baur, J.W. Process-Structure-Property Effects on ABS Bond Strength in Fused Filament Fabrication. Addit. Manuf. 2018, 19, 29–38. [Google Scholar] [CrossRef]
  60. Bakrani Balani, S.; Mokhtarian, H.; Coatanéa, E.; Chabert, F.; Nassiet, V.; Cantarel, A. Integrated Modeling of Heat Transfer, Shear Rate, and Viscosity for Simulation-Based Characterization of Polymer Coalescence during Material Extrusion. J. Manuf. Process. 2023, 90, 443–459. [Google Scholar] [CrossRef]
  61. Rasheed, A.; Hussain, M.; Ullah, S.; Ahmad, Z.; Kakakhail, H.; Riaz, A.A.; Khan, I.; Ahmad, S.; Akram, W.; Eldin, S.M.; et al. Experimental Investigation and Taguchi Optimization of FDM Process Parameters for the Enhancement of Tensile Properties of Bi-Layered Printed PLA-ABS. Mater. Res. Express 2023, 10, 95307. [Google Scholar] [CrossRef]
  62. Ambade, V.; Rajurkar, S.; Awari, G.; Yelamasetti, B.; Shelare, S. Influence of FDM Process Parameters on Tensile Strength of Parts Printed by PLA Material. Int. J. Interact. Des. Manuf. 2023. [Google Scholar] [CrossRef]
  63. Creality Ender 3 V2 3D Printer, 2KG PLA Filament. Available online: https://www.crealityofficial.co.uk/products/ender-3-v2-3d-printer?gad_source=1&gclid=Cj0KCQiA5-uuBhDzARIsAAa21T8lGp_9kyJt9f-z1hiBbM_0-FzNeyXoNSX_-_j8H9dNhYF-FCJyoKYaAgb_EALw_wcB (accessed on 26 February 2024).
  64. Carrasco, F.; Santana Pérez, O.; Maspoch, M.L. Kinetics of the Thermal Degradation of Poly(Lactic Acid) and Polyamide Bioblends. Polymers 2021, 13, 3996. [Google Scholar] [CrossRef] [PubMed]
  65. Pang, R.; Lai, M.K.; Ismail, K.I.; Yap, T.C. The Effect of Printing Temperature on Bonding Quality and Tensile Properties of Fused Deposition Modelling 3d-Printed Parts. IOP Conf. Ser. Mater. Sci. Eng. 2022, 1257, 12031. [Google Scholar] [CrossRef]
  66. Materials, P.; Materials, E.I.; Matrix, P.; Materials, C.; Specimens, P. Standard Test Method for Tensile Properties of Plastics 1. Open J. Compos. Mater. 2006, 3, 1–15. [Google Scholar] [CrossRef]
  67. Majid, S.N.A.; Alkahari, M.R.; Ramli, F.R.; Maidin, S.; Fai, T.C.; Sudin, M.N. Influence of Integrated Pressing during Fused Filament Fabrication on Tensile Strength and Porosity. J. Mech. Eng. 2017, SI 3, 185–197. [Google Scholar]
  68. Farah, S.; Anderson, D.G.; Langer, R. Physical and Mechanical Properties of PLA, and Their Functions in Widespread Applications—A Comprehensive Review. Adv. Drug Deliv. Rev. 2016, 107, 367–392. [Google Scholar] [CrossRef] [PubMed]
  69. Harris, A.M.; Lee, E.C. Improving Mechanical Performance of Injection Molded PLA by Controlling Crystallinity. J. Appl. Polym. Sci. 2008, 107, 2246–2255. [Google Scholar] [CrossRef]
  70. Ding, Q.; Li, X.; Zhang, D.; Zhao, G.; Sun, Z. Anisotropy of Poly(Lactic Acid)/Carbon Fiber Composites Prepared by Fused Deposition Modeling. J. Appl. Polym. Sci. 2020, 137, 48786. [Google Scholar] [CrossRef]
  71. Behdani, B.; Senter, M.; Mason, L.; Leu, M.; Park, J. Numerical Study on the Temperature-Dependent Viscosity Effect on the Strand Shape in Extrusion-Based Additive Manufacturing. J. Manuf. Mater. Process. 2020, 4, 46. [Google Scholar] [CrossRef]
  72. Turner, B.N.; Strong, R.; Gold, S.A. A Review of Melt Extrusion Additive Manufacturing Processes: I. Process Design and Modeling. Rapid Prototyp. J. 2014, 20, 192–204. [Google Scholar] [CrossRef]
  73. Garg, A.; Bhattacharya, A. An Insight to the Failure of FDM Parts under Tensile Loading: Finite Element Analysis and Experimental Study. Int. J. Mech. Sci. 2017, 120, 225–236. [Google Scholar] [CrossRef]
  74. Nomani, J.; Wilson, D.; Paulino, M.; Mohammed, M.I. Effect of Layer Thickness and Cross-Section Geometry on the Tensile and Compression Properties of 3D Printed ABS. Mater. Today Commun. 2020, 22, 100626. [Google Scholar] [CrossRef]
  75. Dudescu, C.; Racz, L. Effects of Raster Orientation, Infill Rate and Infill Pattern on the Mechanical Properties of 3D Printed Materials. Acta Univ. Cibiniensis Tech. Ser. 2017, 69, 23–30. [Google Scholar] [CrossRef]
  76. Vanaei, H.R.; Shirinbayan, M.; Costa, S.F.; Duarte, F.M.; Covas, J.A.; Deligant, M.; Khelladi, S.; Tcharkhtchi, A. Experimental Study of PLA Thermal Behavior during Fused Filament Fabrication. J. Appl. Polym. Sci. 2021, 138, 49747. [Google Scholar] [CrossRef]
  77. Vanaei, H.R.; Khelladi, S.; Deligant, M.; Shirinbayan, M.; Tcharkhtchi, A. Numerical Prediction for Temperature Profile of Parts Manufactured Using Fused Filament Fabrication. J. Manuf. Process. 2022, 76, 548–558. [Google Scholar] [CrossRef]
  78. Dabiri, S.; Schmid, S.; Tryggvason, G. Fully Resolved Numerical Simulations of Fused Deposition Modeling. In Proceedings of the ASME 2014 International Manufacturing Science and Engineering Conference Collocated with the JSME 2014 International Conference on Materials and Processing and the 42nd North American Manufacturing Research Conference, Detroit, MI, USA, 9–13 June 2014; Volume 2. [Google Scholar] [CrossRef]
  79. Vanaei, H.R.; Shirinbayan, M.; Deligant, M.; Khelladi, S.; Tcharkhtchi, A. In-Process Monitoring of Temperature Evolution during Fused Filament Fabrication: A Journey from Numerical to Experimental Approaches. Thermo 2021, 1, 332–360. [Google Scholar] [CrossRef]
  80. Ismail, K.I.; Yap, T.C.; Ahmed, R. 3D-Printed Fiber-Reinforced Polymer Composites by Fused Deposition Modelling (FDM): Fiber Length and Fiber Implementation Techniques. Polymers 2022, 14, 4659. [Google Scholar] [CrossRef]
  81. Fang, Q.; Hanna, M.A. Rheological Properties of Amorphous and Semicrystalline Polylactic Acid Polymers. Ind. Crop. Prod. 1999, 10, 47–53. [Google Scholar] [CrossRef]
Figure 1. (a) Print orientation and (b) dimensions of the specimen according to the ASTM D638-14 Type 1 Standard [66].
Jmmp 08 00056 g001
Figure 2. Different locations of measurement for the width (blue marking), length (red marking), and thickness (green marking); dotted lines indicate measured ends.
Jmmp 08 00056 g002
Figure 3. Example of selected regions used to conduct analysis to determine the formation of voids.
Jmmp 08 00056 g003
Figure 4. (a) Adjustment of threshold to determine the average size and percentage of void. (b) Binarized form of micrograph.
Jmmp 08 00056 g004
Figure 5. Physical appearance of specimens printed at different printing temperatures: (a) T = 180 °C, (b) T = 190 °C, (c) T = 200 °C, (d) T = 210 °C, (e) T = 220 °C, (f) T = 230 °C, (g) T = 240 °C, (h) T = 250 °C, and (i) T = 260 °C.
Jmmp 08 00056 g005
Figure 6. Ultimate tensile strength (UTS), yield strength, and elastic modulus at different printing temperatures.
Jmmp 08 00056 g006
Figure 7. Stress–strain curve at different printing temperatures; values at the end of each curve represent the strain at break.
Jmmp 08 00056 g007
Figure 8. Percentage area of voids and average void size plotted against printing temperature.
Jmmp 08 00056 g008
Figure 9. Ultimate tensile strength and percentage of solid region against printing temperature.
Jmmp 08 00056 g009
Figure 10. SEM images at 20× magnification detailing the fracture surface of the tensile testing specimens printed at: (a) T = 180 °C, (b) T = 200 °C, (c) T = 220 °C, (d) T = 240 °C, (e) T = 250 °C, and (f) T = 260 °C.
Jmmp 08 00056 g010
Figure 11. Interlayer and intralayer bonds formed between deposited roads. Reconstructed based on Gurrala et al. [76].
Jmmp 08 00056 g011
Figure 12. Schematic of the reconstructed bond development and SEM images at 50× magnification detailing the fracture surface of tensile testing specimens printed at: (a) T = 180 °C, (b) T = 200 °C, (c) T = 240 °C, and (d) T = 260 °C.
Jmmp 08 00056 g012
Figure 13. (a) Printing path (orange) during the fabrication of specimens. (b) Overlap of deposited roads with the previous layer (circled in red).
Jmmp 08 00056 g013
Table 1. Process parameters and settings used in the investigation.
Process ParameterSetting
Nozzle printing temperature180 °C to 260 °C (at intervals of 10 °C)
Print speed50 mm/s
Layer height0.2 mm
Build orientationFlat
Infill density100%
Infill patternLines
Platform temperature50 °C
Raster angle0°/90°
Table 2. Average measured width, length, and thickness of the specimens at different printing temperatures. Optimum printing temperature is labelled with (*).
Width (mm)Length (mm)Thickness (mm)
Temperature (°C)19.00165.007.00
Measured Value (mm)ErrorMeasured Value (mm)ErrorMeasured Value (mm)Error
mm%mm%mm%
18018.78 ± 0.2−0.22−1.16164.55 ± 0.4−0.45−0.276.91 ± 0.24−0.09−1.29
19018.76 ± 0.25−0.24−1.26164.59 ± 0.19−0.41−0.256.86 ± 0.05−0.14−2.00
20018.88 ± 0.11−0.12−0.63164.74 ± 0.01−0.26−0.166.95 ± 0.04−0.05−0.71
21018.95 ± 0.16−0.05−0.26164.83 ± 0.21−0.17−0.106.98 ± 0.10−0.02−0.29
220 *19.01 ± 0.08+0.01+0.05165.01 ± 0.17+0.01+0.017.01 ± 0.08+0.01+0.14
23019.00 ± 0.05+0.00+0.00165.04 ± 0.35+0.04+0.027.04 ± 0.08+0.04+0.57
24019.21 ± 0.17+0.21+1.11165.14 ± 0.27+0.14+0.087.08 ± 0.20+0.08+1.14
25019.50 ± 0.21+0.50+2.63165.13 ± 0.17+0.13+0.077.25 ± 0.07+0.25+3.57
26019.62 ± 0.06+0.62+3.26165.44 ± 0.25+0.44+0.277.27 ± 0.06+0.27+3.86
Disclaimer/Publisher’s Note: The statements, opinions and data contained in all publications are solely those of the individual author(s) and contributor(s) and not of MDPI and/or the editor(s). MDPI and/or the editor(s) disclaim responsibility for any injury to people or property resulting from any ideas, methods, instructions or products referred to in the content.

