1. Introduction
The material extrusion of plastics (MEX-TRB/P) has matured into a lucrative alternative to conventional manufacturing methods due to low machine hour rates, low and wide-ranged printer prices, and low infrastructural requirements. The additive manufacturing process is highly influenced by process parameters—such as infill density, number of shells, and layer thickness—which are selected in pre-processing, i.e., before manufacturing. Part properties such as tensile strength and dimensional accuracy depend strongly on process parameters and do not depend solely on material properties. Thus, the quality of the finished part is often unknown. This leads to a limited applicability of the material extrusion (MEX) process for stressed parts and results in high filling densities to ensure the required strength as well as low print speeds to ensure dimensional accuracy. Prediction models are a promising approach to overcome the current uncertainty in part quality. With them, the resulting part quality can be determined according to the selected process parameters. Such models have been developed in several publications. However, they are only tested in the research state and a methodology to implement such models in the business environment is missing.
For this reason, this publication presents a methodology that enables predictive quality assurance. This paper uses existing prediction models as a basis and connects them to create a solution space. Based on that and a calculated safety factor, parameter combinations are found that match the quality requirements of the considered use-case. The novelty of the paper lies in the newly developed methodology itself, the consideration of a safety factor for the specific application, and the testing of the methodology using practical application examples.
In the following, the current state of quality prediction in MEX is presented. This includes an introduction of the MEX process and error metrics, the state of the art and its shortcomings, and a short introduction of the used prediction models. Subsequently, the used methods and approach are presented. In
Section 4, the enabled solution space is analyzed and the presented methodology is tested as well as applied to two exemplary use cases. This is followed by a critical appraisal of the results and a conclusion.
2. Current State of Quality Prediction in Material Extrusion
This section serves to present the basic knowledge necessary to understand the developed determination method and the results of this work. This section provides a current overview of material extrusion and related prediction models. Particular emphasis is placed on part-quality prediction in material extrusion, specifically the successes achieved and the basic structure of such prediction models. In addition, the evaluation of prediction accuracy is discussed.
2.1. Introducing Material Extrusion
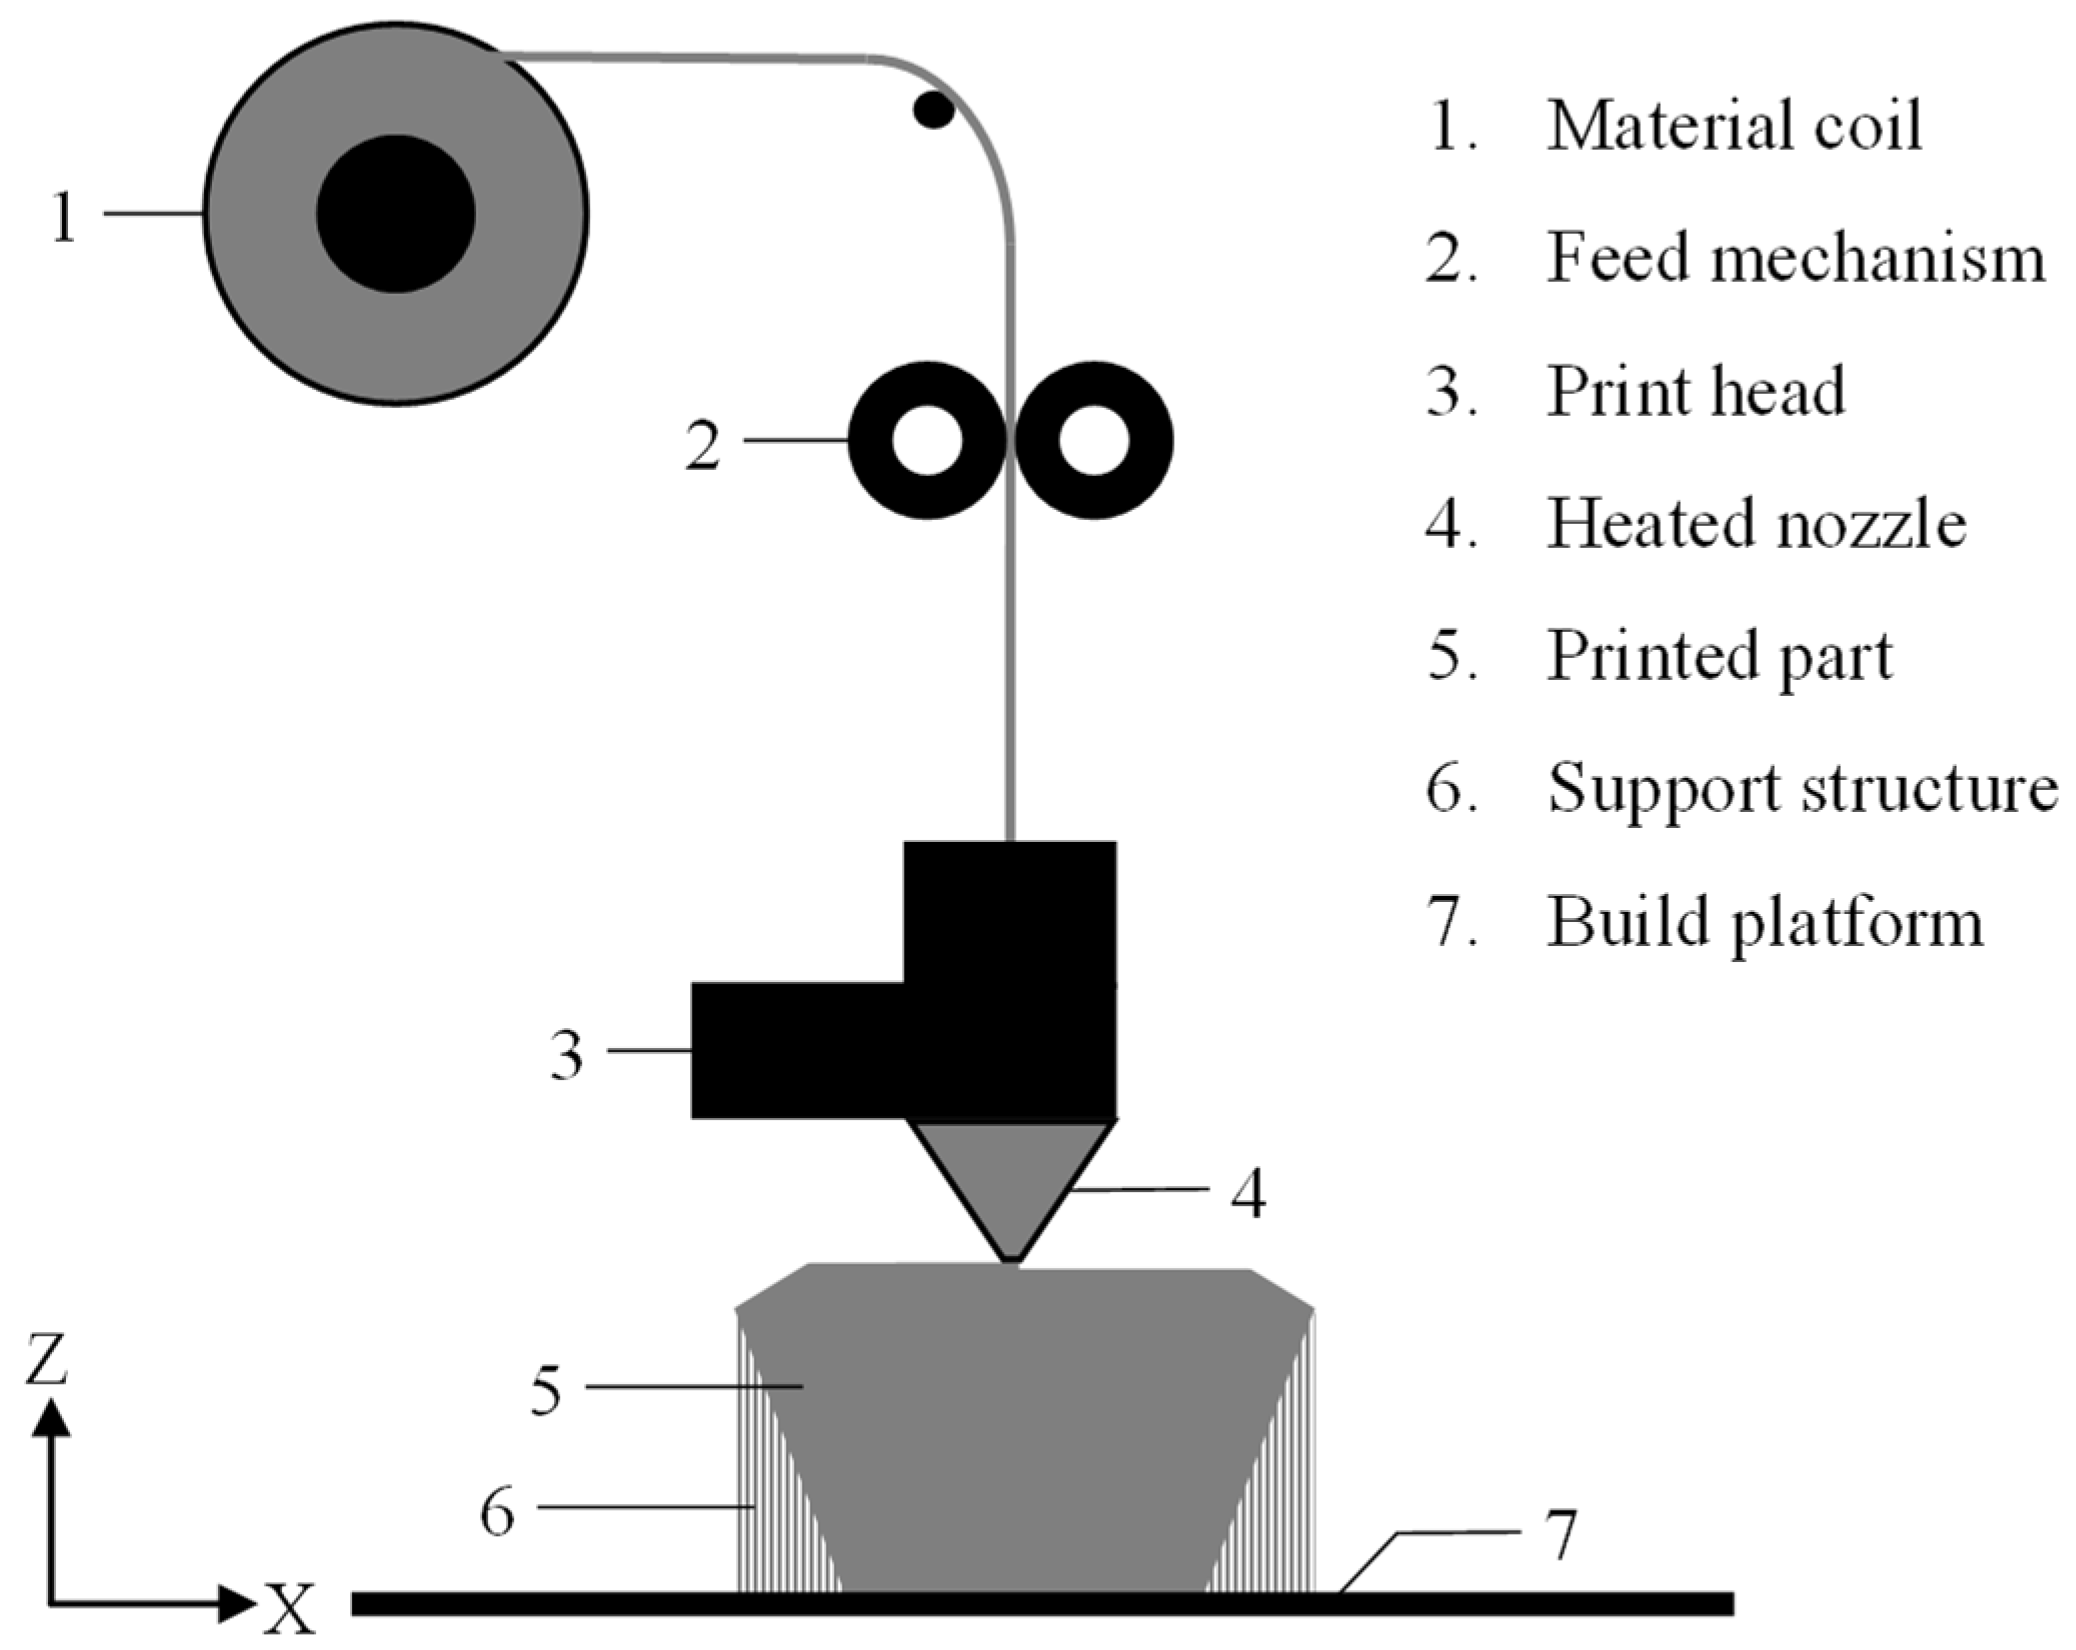
MEX can be defined as an additive manufacturing process that extrudes thermoplastic materials in a vector-oriented way using a thermal (physical) binding mechanism. The printer consists of a build platform and a print head with a heated nozzle [
1]. A sketch of a MEX printer is shown in
Figure 1. The extrusion head provides the appropriate material deposition in the X–Y plane according to the contour of the current layer. The used material, a prefabricated thin plastic wire called the filament, is continuously fed to the extrusion head. The material is partially melted and extruded through a nozzle which determines the strand diameter. After application, the paste-like material hardens as a result of heat conduction into the previously applied layer of the part and forms another solid layer. After a layer is printed, the Z-distance between the nozzle and print platform is increased, and the material is applied to the top of the partially finished part. This process is repeated until the part is completed [
2]. The build process may require support structures [
1]. The structures can be printed either in the same or in a different support material, e.g., a water-soluble material. The printer itself can consist of one up to several print heads, while most printers process with one or two heads. In addition, there are multi-material applications that allow the filament to be changed during printing, most often with an associated loss of material.
2.1.1. Process Flow
The MEX process can be divided into three stages—pre-, in- and post-processing—based on the norm VDI 3405. In the pre-processing, all operations that precede the actual manufacturing of a part are carried out. This includes data processing, preparing auxiliary structures, determining process parameters and the slicing process. The latter is an essential prefabrication stage. It involves slicing the volume model into several successive layers. Mostly, this process is performed automatically by the software once the necessary process parameters have been selected [
1]. After pre-processing, a machine code, usually a G-code, is obtained. This contains the path, process parameter values, and other information. Based on this, in-processing starts; this focuses on the manufacturing operations performed by the MEX printer, yet also includes part loading and unloading. Post-processing starts after removing the part of the printer. Removing support structures is a main part, yet other steps to obtain the technologically feasible part characteristics are included [
1]. Exemplary steps are vapor smoothing to improve the quality of surfaces [
3] or the insertion of threaded inserts [
4].
2.1.2. Process Parameters
The manufacturing process is defined by process parameters selected in pre-processing (prior manufacturing). The important process parameters influencing the investigated quality characteristics—in detail, tensile strength, dimensional accuracy and surface roughness—are introduced in the following.
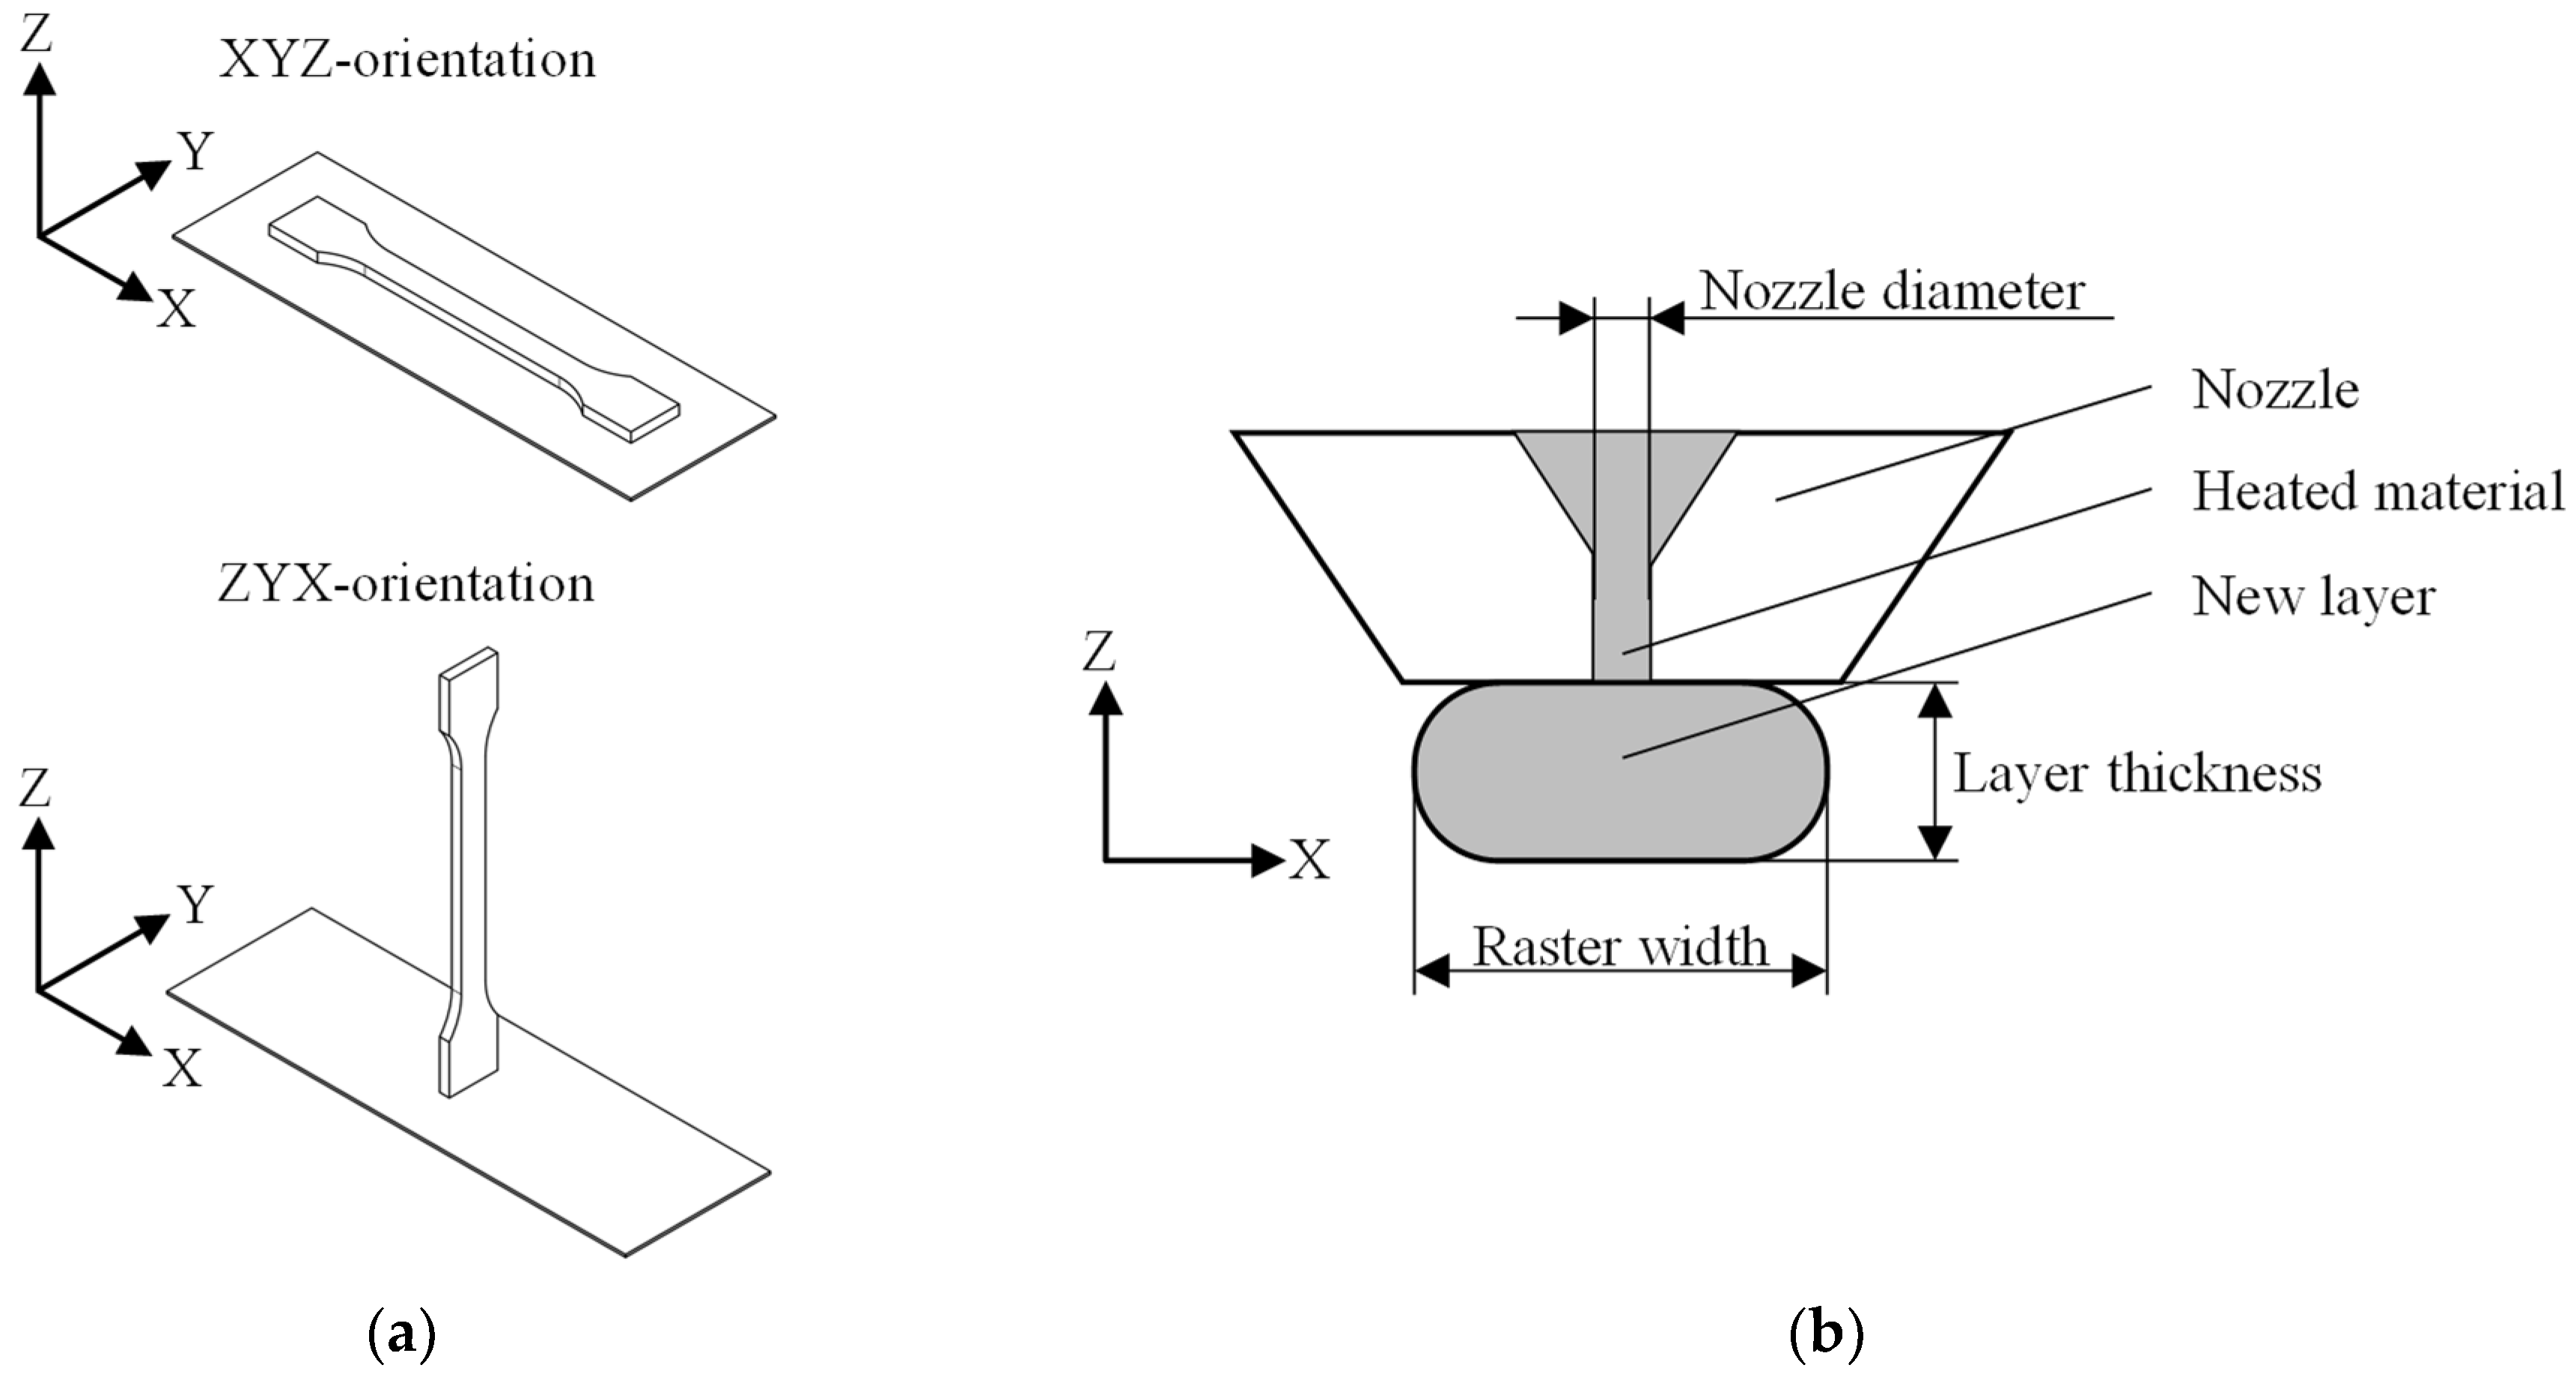
The build orientation, also called the part orientation, defines how the part is oriented on the build platform [
5]. This work follows the ISO 52,921 standard defining the orientation based on the length of the part dimensions (see (a) in
Figure 2) [
6]. A part consists of shells that can be defined as walls that are exposed to the outside of a part. They are influenced by the number of outer perimeters, top and bottom layers. The density of a part is highly influenced by the infill, which is described by the infill pattern—the shape of the infill—and infill density—the percentage filling level of the internal structure (see (c) in
Figure 2). The height of the deposited layers along the Z-direction is set by the parameter layer thickness (see (b) in
Figure 2). The parameter nozzle temperature, also referred to as extrusion temperature, determines the temperature used at the nozzle to heat up the material [
5]. The parameter print speed mode determines the movement of the print head according to the location.
2.2. Error Metrics to Evaluate Prediction Accuracy
In this paper, the performance of prediction models is evaluated using error metrics. The prediction accuracy is stated by the mean squared error
MSE (see Equation (1)), mean absolute error
MAE (see Equation (2)), mean absolute percentage error
MAPE (see Equation (3)) and root mean square error
RMSE (see Equation (4)) [
7]. This paper focuses in particular on improving the
MAPE, as it is assumed that its percentage output makes it easier for a user to work with. The metrics are calculated using the predicted value
, the measured value
and the number of samples
. These error metrics can be used for training and validation—reporting prediction accuracy on data used for training the model—as well as evaluation—reporting the prediction accuracy on test data that were not used to train the model. The latter is used to verify the quality of a prediction model. However, it should be noted that there is no reference value that indicates a satisfactory prediction accuracy. For this reason, the accuracy of the current state-of-the-art will be discussed later in this paper.
2.3. State of the Art
Machine learning is used in several areas of MEX, e.g., in the field of image-based print error detection. The following subsections will focus on published work that investigated the prediction of quality characteristics of tensile strength, linear dimensional accuracy and surface roughness for parts manufactured with MEX.
2.3.1. Tensile Strength
Deshwal et al. [
8] used a neural network (NN) to optimize the tensile strength of polylactic acid (PLA) samples. They found that the NN approach had a better performance than other tested approaches. This was also stated by a publication of Tura et al. [
9]. Several research publications target the prediction of tensile strength, by varying different parameters and investigating different materials. Grozav et al. [
10] varied nozzle temperature and print speed and investigated two materials: PLA and glycol-modified polyethylene terephthalate (PETG). Bayraktar et al. [
11] predicted the tensile strength by varying the nozzle temperature, layer thickness and raster orientation with a data volume of 108 samples. They achieved a MAPE of 3.34% for nine selected samples within their trained parameter steps. Yadav et al. predicted the tensile strength of multi-material parts by stacking layers of acrylonitrile butadiene styrene (ABS) and PETG material. The developed model achieved a prediction accuracy between 2.5 and 2.6% for three chosen and trained parameter sets [
12]. Tura et al. [
9] reached a MAPE of 2.21% on validation data for PLA samples by varying infill density, extrusion temperature and print speed. A test of the prediction accuracy on test data was not performed. The authors of this work achieved a MAPE of 2.54% on random test data using a NN approach based on 243 PETG samples [
13].
2.3.2. Dimensional Accuracy
Besides prediction approaches, the dimensional accuracy in MEX is investigated using an experimental research design [
14,
15,
16].
The prediction of part dimensions according to the deposition angle and layer thickness was presented by Boschetto and Bottini [
17]. However, that work did not state the achieved prediction accuracy with common metrics. Vyavahare et al. [
18] predicted the dimensional accuracy of an outer pyramidal region and an inner conical region of a pyramidal part using a regression model. The achieved absolute percentage error ranged from 2.3% to 15.0%. Yang and Zhang [
19] predicted the dimensional accuracy based on the process parameters of layer thickness, filling speed, extrusion speed, fallback speed and raster width offset using a NN. An H-shaped sample was used for measuring the distances. Nevertheless, the prediction accuracy was not stated using common metrics. Mohamed et al. [
20] predicted the dimensional accuracy of the length and diameter of cylinders using a NN approach. The model achieved a percentage deviation lower than 9.0% by testing three samples. Sharma et al. [
21] predicted the dimensional accuracy of shafts, holes and rectangular slots using a decision tree regression algorithm. The model was trained with a dataset of 33 samples for the ABS material and 26 samples for the PLA material, by varying the process parameters of wall thickness, infill density, build platform temperature, print speed, layer thickness and nozzle temperature. However, the publication did not provide the accuracy of the algorithm using common metrics or by stating the differences between predicted and measured values. The authors of that work predicted the linear dimensional accuracy using a NN approach with 32 samples. A
MAPE of 0.71% or lower was achieved for the linear dimensional accuracy in the X- and Y-directions. The model achieved a
MAPE of 2.21% in the Z-direction [
22].
2.3.3. Surface Roughness
Several mathematical approaches were used to predict the surface roughness of MEX parts [
23,
24,
25]. Vyavahare et al. [
18] used a regression approach to predict the surface roughness based on layer thickness, wall print speed, build orientation, wall thickness and extrusion temperature. The approach achieved an absolute percentage error of 4.8–16.3%.
In recent research activities, classification approaches were more often used to determine optimized process parameters. Such approaches use a limit value to separate the predictions into sufficient and insufficient. Barrios and Romero [
26] used a random forest and random tree approach to classify parts manufactured with PETG material. The best approach resulted in 86.7% correctly classified parts, by investigating the parameters of layer thickness, extrusion temperature, print speed, print acceleration and flow rate. Sohnius et al. [
27] achieved a classification accuracy of over 85% for deviation classifications and over 95% for gap classifications. They varied the maximum feed rate, layer thickness, infill density and nozzle temperature. A practical application of such approaches was published by Molero et al. by ensuring the part quality in frame glasses manufacturing [
28]. Cerro et al. [
29] classified the surface roughness of MEX parts using five variable-input parameters—layer thickness, print speed, number of perimeters, wall angle and nozzle temperature. The best algorithm identified used bagging and multilayer perceptron, achieving a classification accuracy of 96%. However, a classification approach does not facilitate prediction of the achievable surface roughness according to the process parameters. The accuracy of classification approaches gives little information about the accuracy of the prediction approaches, as parameter sets with a surface roughness that clearly deviate from the set limit value can be predicted inaccurately and would still be classified correctly. Additionally, the found research does not provide information on how a change in limit value would affect the classification accuracy. This leads to a limited application of classification approaches.
In contrast, several publications target a value prediction of the surface roughness using NNs. Boschetto et al. [
30] aimed to predict the surface roughness of cylinders and used multiple materials. The work achieved a
MAPE of 4.57% yet gave no information about the used data and solely predicted known data—i.e., it only validated the prediction accuracy. Vahabli and Rahmati [
31,
32] used a NN optimized with an imperialist competitive algorithm. The developed model achieved a
MAPE of 7.11% using part orientation and two layer thicknesses as input parameters. Saad et al. [
33] use a NN to determine the optimal parameter sets to reach a minimal surface roughness for a cuboid part. The best-found NN reached a
MAPE of 11.40%. The authors of that work used a NN approach based on an random grid search and a genetic algorithm [
22]. The NN was trained using 27 samples and achieved a
MAPE of 4.05% for horizontal surfaces and 7.21% for 45-degree build ups. However, for other surface orientations, the approach leads to a
MAPE higher than 10%. This emphasizes that the achievable prediction accuracy depends on the surface orientation. However, it has been observed that a better prediction result is obtained by reducing the scatter of the data. The scatter can be influenced by the printer itself, yet also by other influences, e.g., external influences.
2.3.4. Shortcomings in the Current Literature
The presented literature verifies the feasibility of quality prediction in MEX through several test studies. Nevertheless, an applicable methodology using prediction models for quality assurance is lacking. Thus, users and researchers aiming for an implementation of such prediction models are currently lacking an adequate procedure. Applications were solely published in the field of classification approaches focusing on surface roughness. As a result, users of the MEX process are not currently benefiting from the improvements that predictive quality assurance could provide. This underlines the open research gap this paper aims to close by providing an applicable methodology to use prediction models for quality assurance in pre-processing.
2.4. Short Introduction of the Used Prediction Models
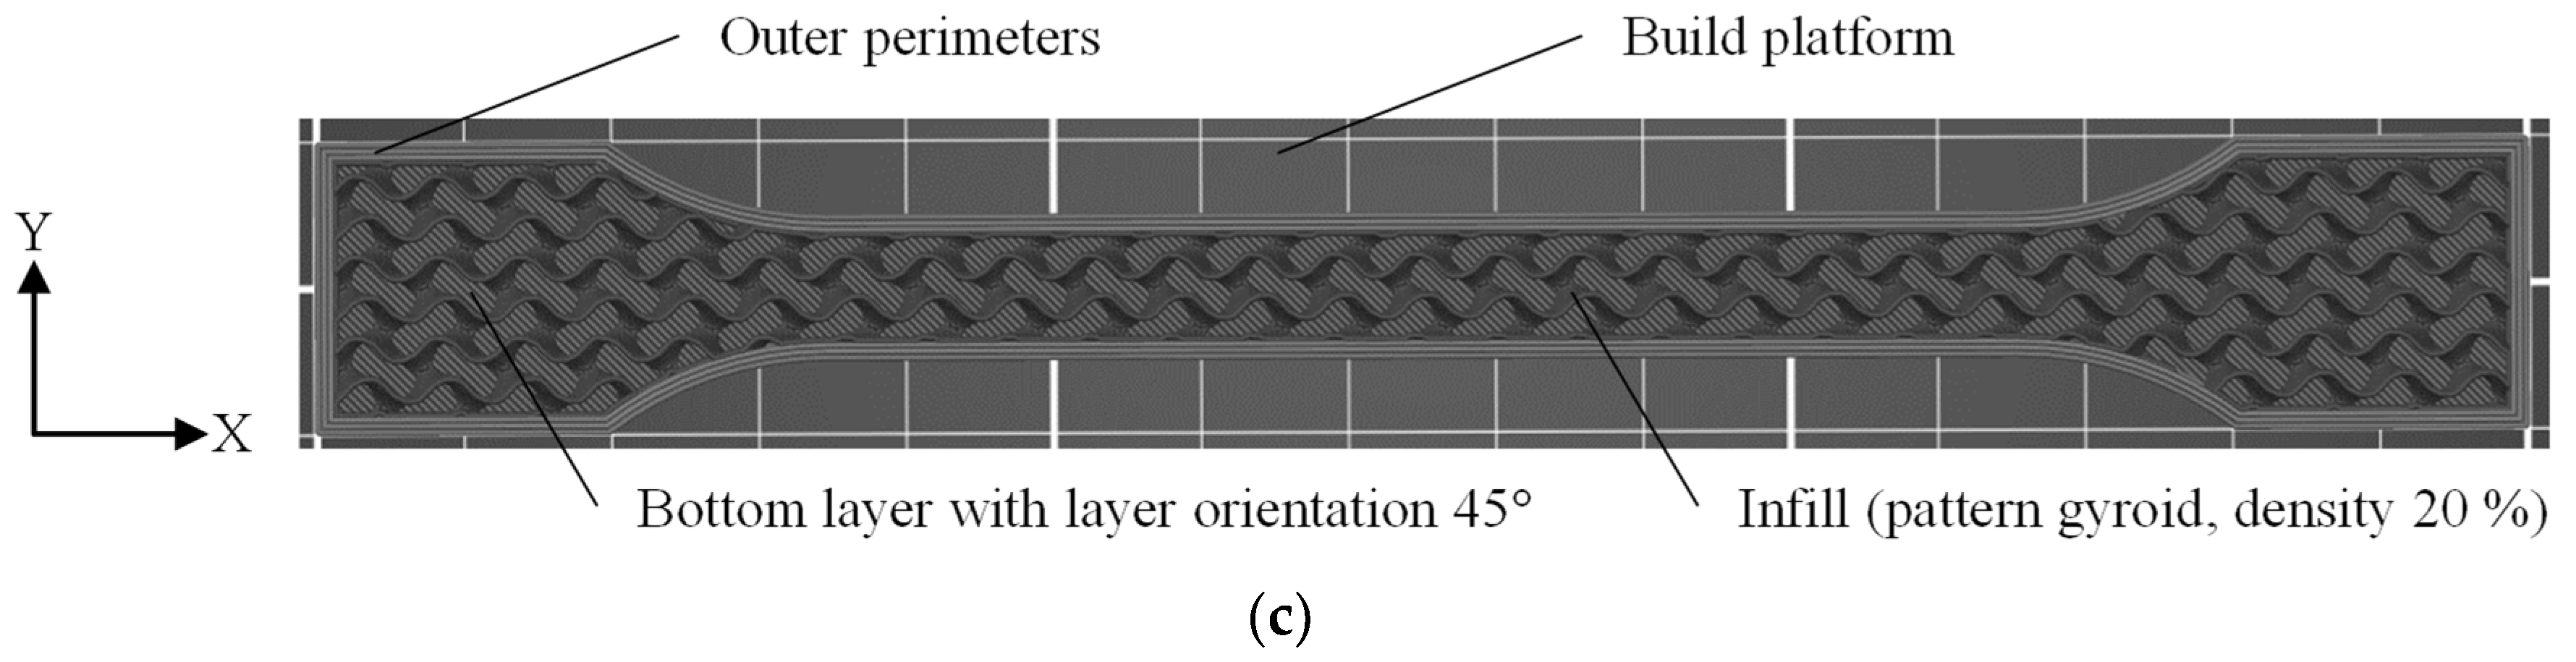
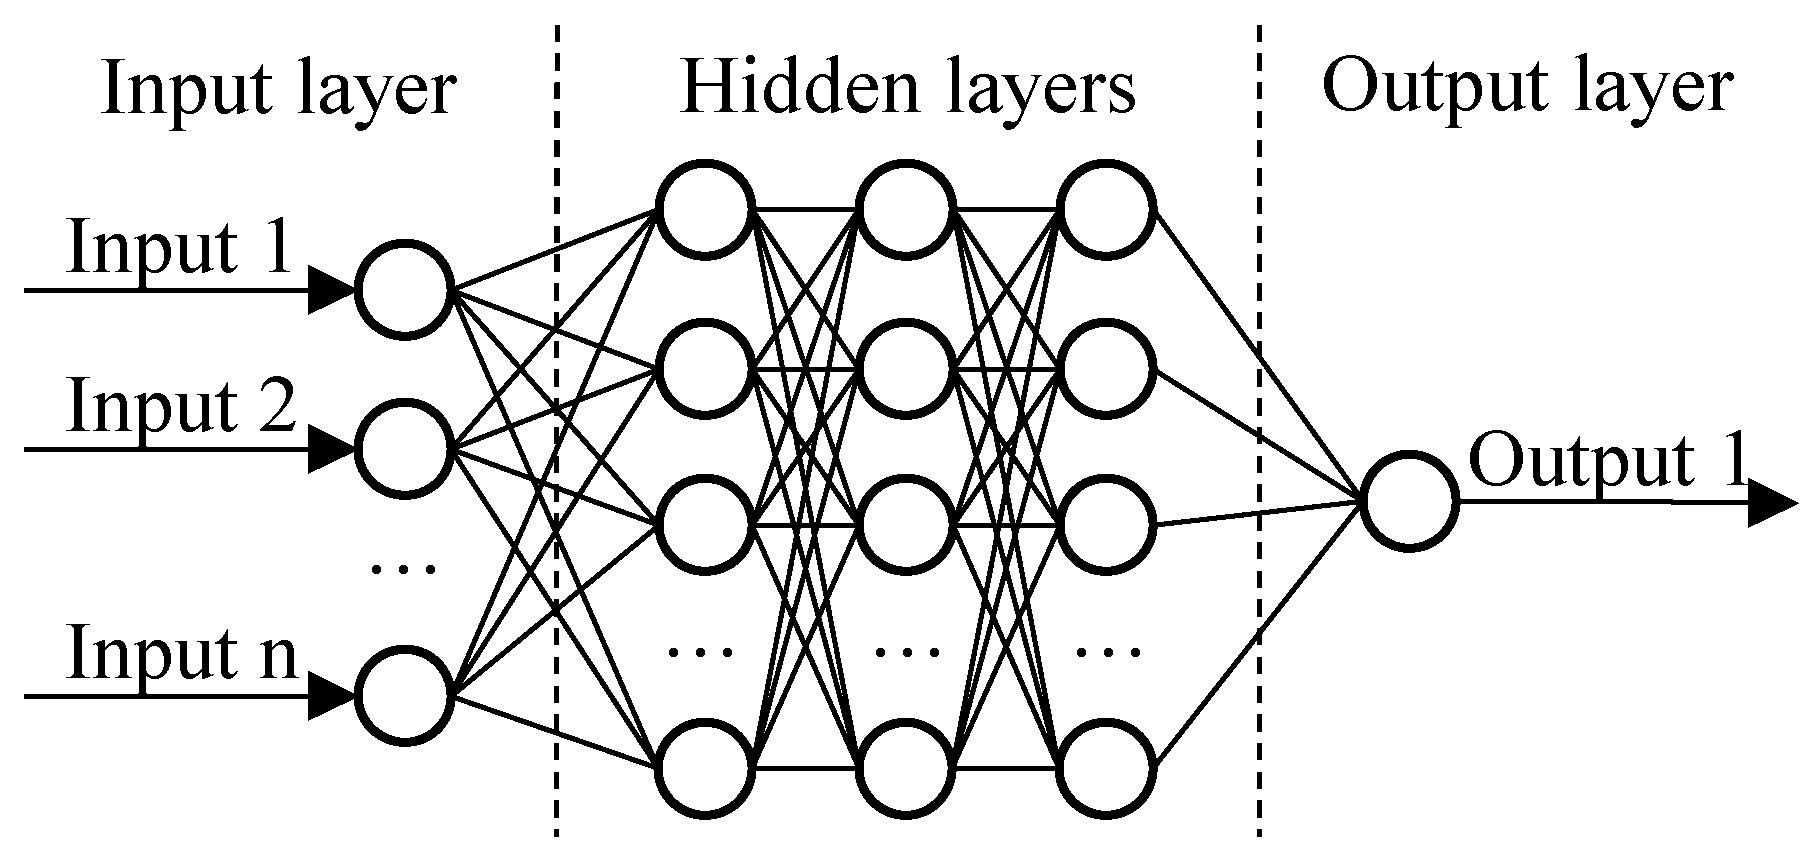
In this work, neural networks are used for the prediction of the resulting part quality. Artificial NNs are inspired by the function of biological NNs, such as those found in the human brain [
34]. A NN consists of nodes (neurons) and edges (synapses) connecting the nodes. The neurons are arranged in layers and can be divided into three types. Input units receive the input data and pass it to the NN. Hidden units are located between the input and output units and represent the inner layers of a NN. Output units receive the output data as a result of the calculations of the hidden units. The term “deep” is often used in the literature, describing a network with multiple hidden layers [
35]. However, a more precise definition is lacking. NNs can have different structures, while most models in the literature focused on feedforward networks when targeting a prediction of quality characteristics. In this case, all neurons in one layer are fully connected to all neurons in the following layer [
36]. A schematic illustration is shown in
Figure 3.
The learning process itself is strongly influenced by predefined parameters (hyperparameters), e.g., the loss function, number of epochs and batch size. Optimizing these is called hyperparameter tuning, which is an essential part of machine learning [
37]. The hyperparameters considered in this work are shown in
Table 1.
The most commonly used hyperparameter tuning approach is the random grid search, where hyperparameters are combined randomly and the best-found combination is used. Bergstra and Bengio described random grid search as a natural baseline against which to measure progress in the development of hyperparameter tuning algorithms [
38]. However, this approach is based on random selection and does not use optimization approaches to iteratively find the optimum. Genetic approaches are an alternative; they are inspired by the reproduction of natural creatures. They use an iterative procedure to approach an optimum and are based on selection, crossover and mutation. The term evolutionary algorithm is partly used synonymously in the literature, yet it refers to a somewhat broader class of heuristics [
39]. In this work, both approaches were used for hyperparameter tuning to find well-performing prediction models.
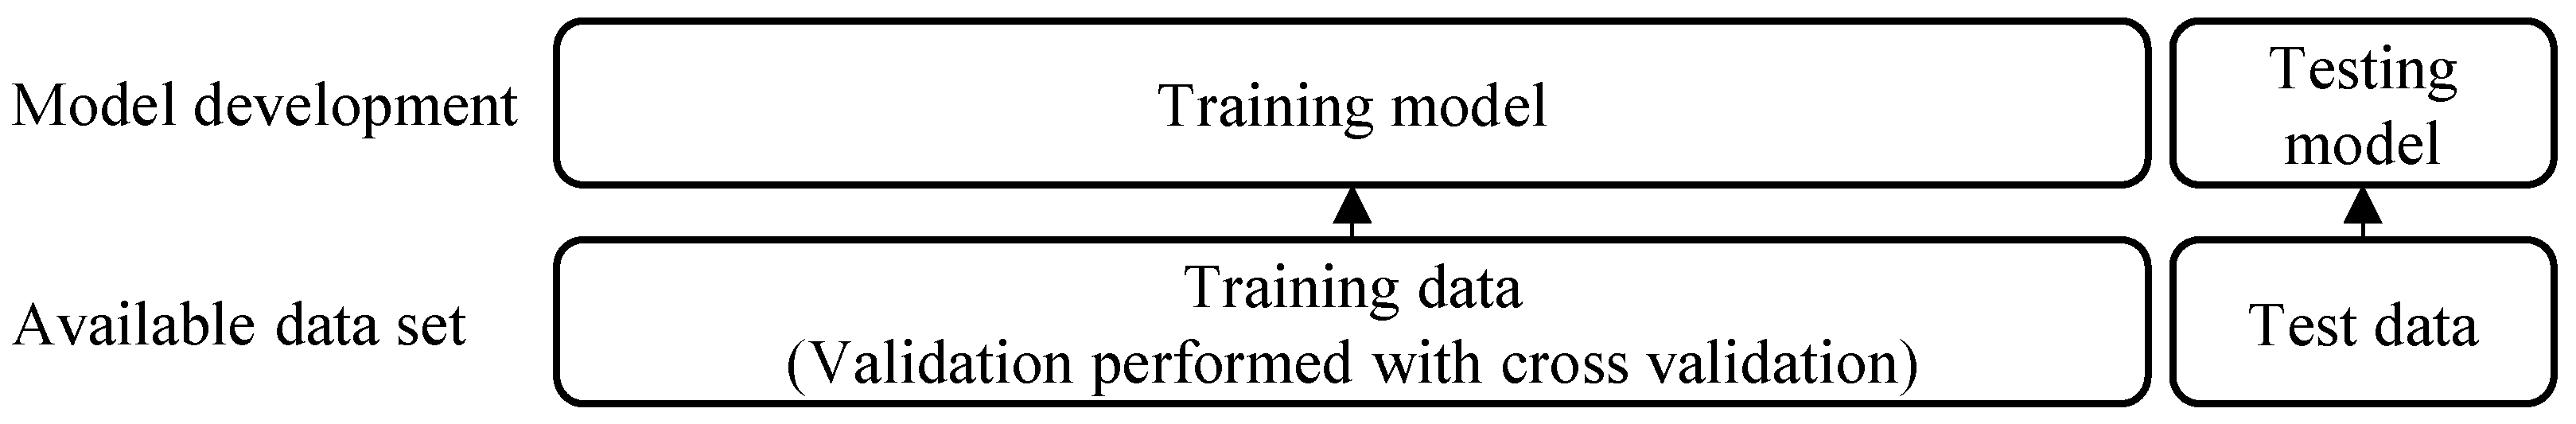
The training approach is based on training and validation data. A static splitting of training and validation data includes the risk of performing well only on the static validation set. Therefore, cross-validation is used to evaluate the performance of a NN model more effectively than the traditional static data split [
40]. Therefore, in this paper, the data were split into training data—used for training and validation—and test data (see
Figure 4).
3. Methods and Approach
3.1. Used Samples and Equipment
This publication measures the linear accuracy, surface roughness and tensile strength of MEX parts using three samples manufactured with a PETG filament. The samples were manufactured using a Prusa i3 MK3s+ with the corresponding Slicer PrusaSlicer version 2.6.1.
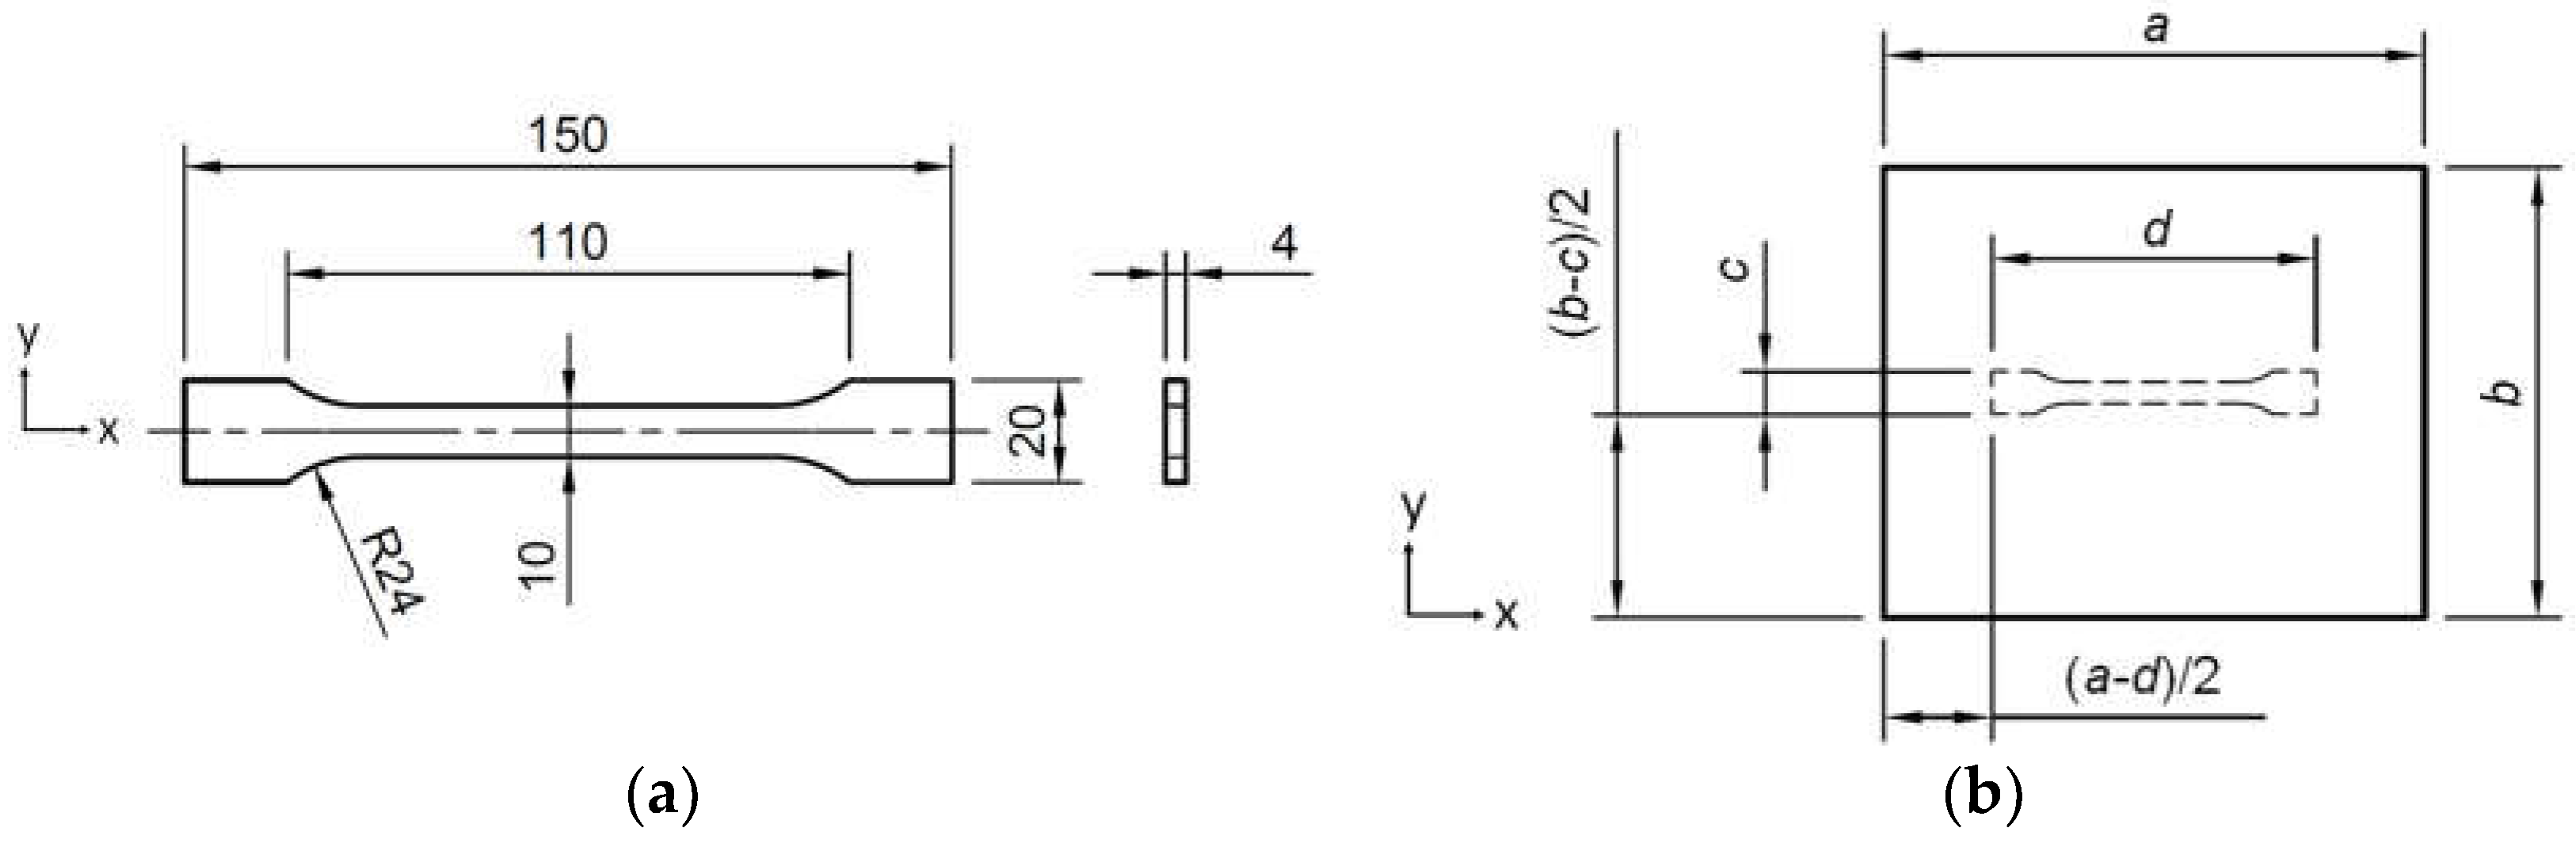
The tensile strength is tested using a type A1 sample according to DIN EN ISO 527-1 [
41] and 3167 [
42] (see (a) in
Figure 5). The sample was placed in a central position with an XYZ-orientation (see (b) in
Figure 5). The samples were tested using an Inspekt 200 from Hegewald & Peschke Meß- und Prüftechnik GmbH with a load cell of 10 kN, a test speed of 3 mm/min, a break-off criterion of 75% and a safety criterion of 8 kN. The accuracy of the traversing measurement was 0.015 μm.
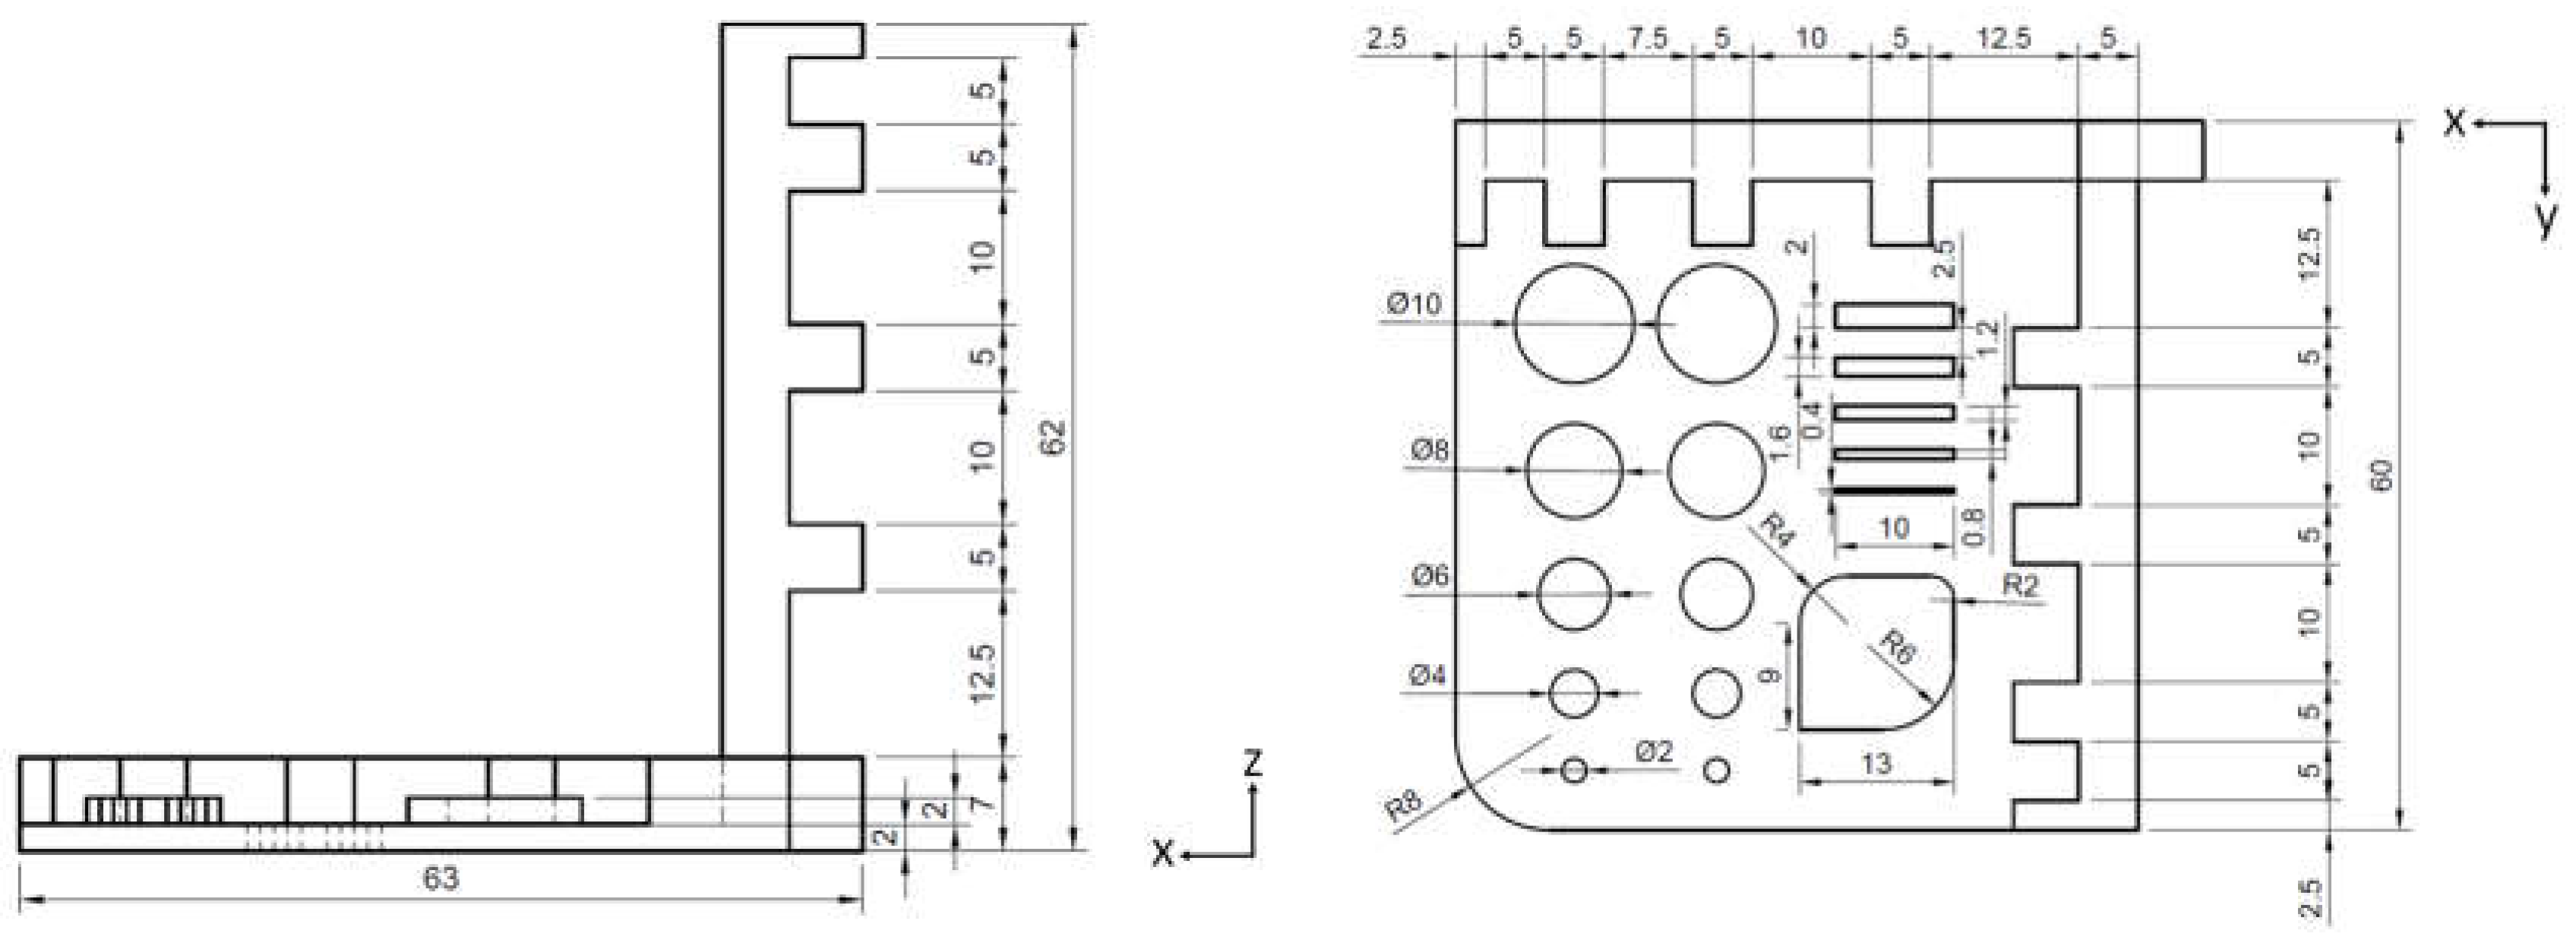
The linear dimensional accuracy is measured using a developed sample geometry (see
Figure 6). The sample geometry has already been used for quality prediction and for printer comparisons [
22,
43]. The dimensions were measured with an optical microscope VHX-5000 from Keyence, with an accuracy of 0.001 mm. The deviations from the actual dimension to the targeted dimension were measured by the length of the intervals. The accuracy in X- and Y-directions was measured using a chain measurement of the nine intervals. The accuracy in the Z-direction was measured with seven intervals since the sample was gently cut in the first interval, as the optical focus of the microscope was too small.
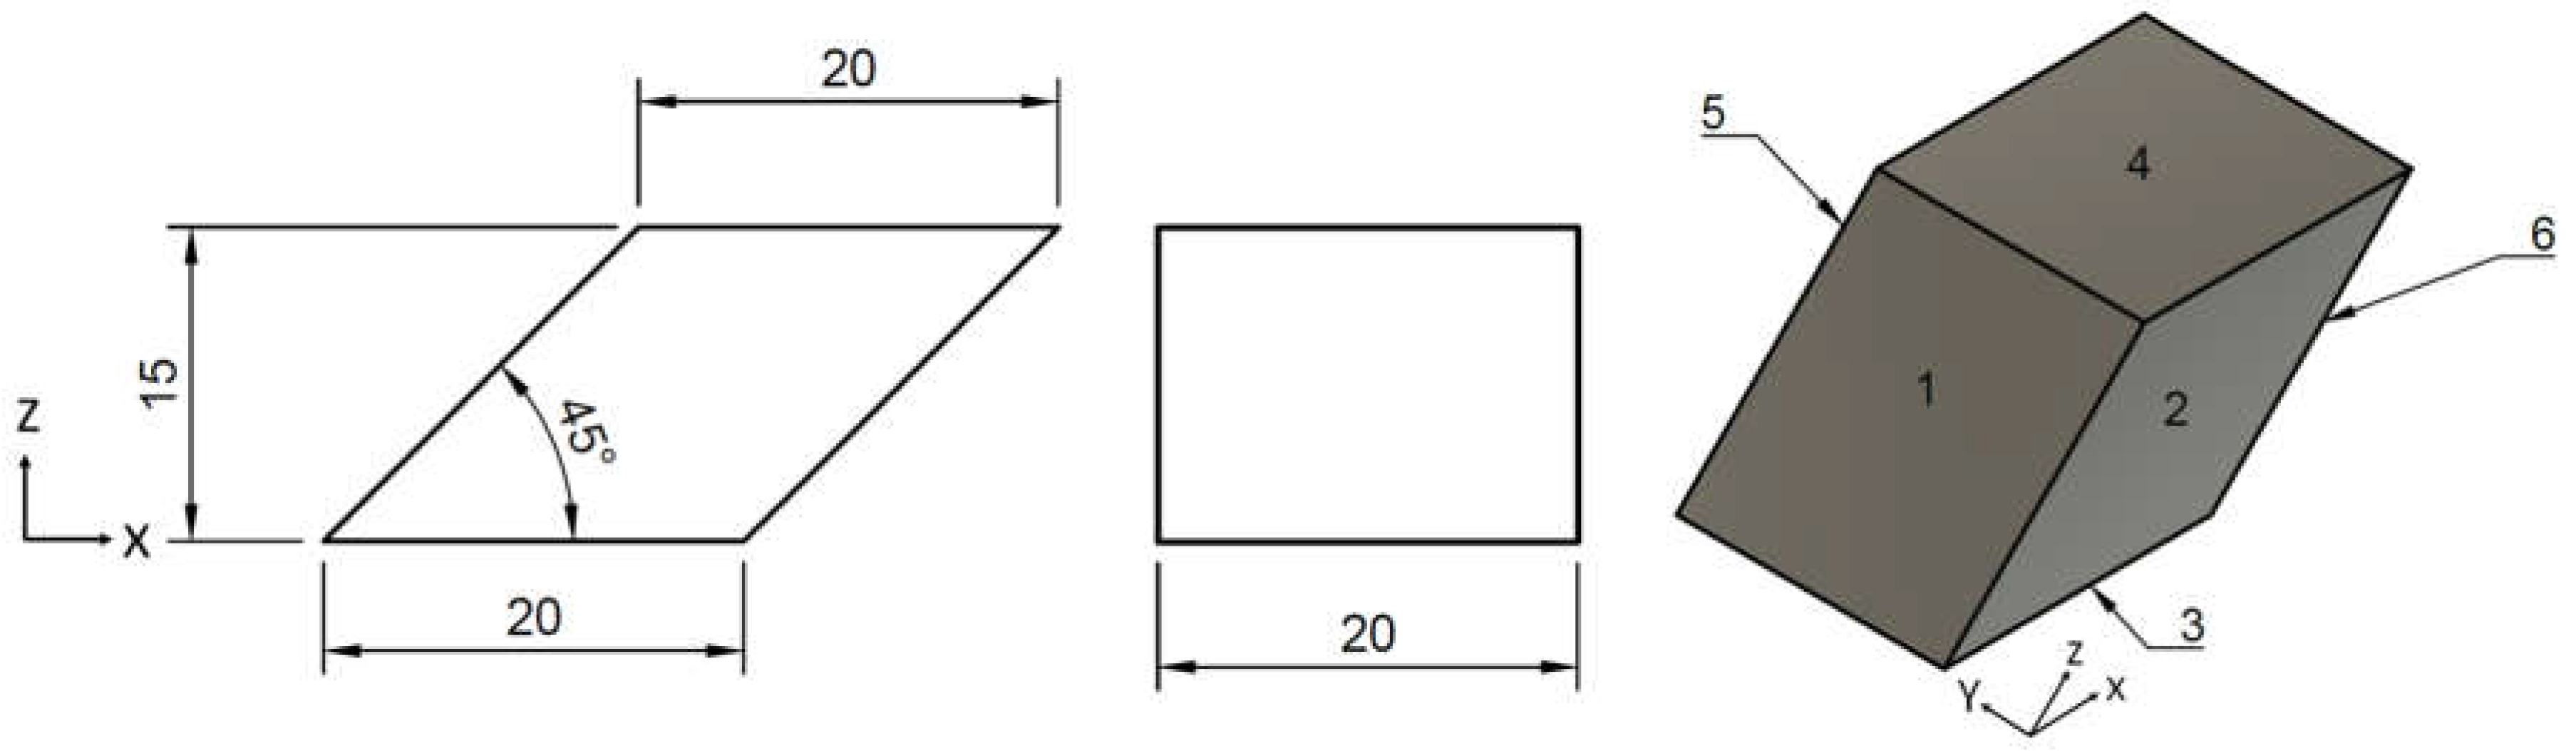
The surface roughness was measured orthogonally to the deposited strand. It was evaluated using
, based on standard DIN EN ISO 21920 [
44]. A parallelepiped was used as a test sample, allowing the measurement of five different surface orientations—in detail, the bottom surface (surface 3), the top surface (surface 4), two vertical wall surfaces in the X-direction (surfaces 2 and 5), a 45-degree overhang (surface 6) and a 45-degree build-up (surface 1). The sample and the names of the surfaces are shown in
Figure 7. The samples were manufactured in the XYZ-orientation with a centered positioning on the build platform.
A tactile measuring device (Villingen-Schwenningen, JENOPTIK Industrial Metrology Germany GmbH, Hommel-Etamic T8000Rc) was used for surface measuring. The stated machine accuracy was ±0.003 mm for . A diamond tip with a probe tip radius of 0.005 mm was used.
3.2. Used Prediction Models and Their Accuracies
This publication targets a methodology to implement existing prediction models into the manufacturing environment to enable a predictive quality assurance. Thus, this work uses existing prediction models that are based on the same material and printer [
13,
22]. Therefore, in this section, the prediction models and their training data are shortly introduced. A detailed discussion of the models can be taken from the corresponding cited publications.
The prediction models are based on NNs using the infill density, layer thickness, nozzle temperature, number of shells and print speed as input. In the case of surface roughness, the orientation of the shape is given as additional input; in the case of dimensional accuracy, the targeted distance and the orientation—X-, Y- or Z-orientation—is used. For each quality characteristic, a model was trained individually. The training data were based on a full factorial design using three values—minimum, middle and maximum—in the case of tensile strength prediction and two values—minimum and maximum—in the case of linear dimensional accuracy. However, in the case of surface roughness, a Taguchi method was used to further reduce the training data volume to 27 samples. The values of the process parameters can be found in
Table 2 and
Table 3. The prediction models were evaluated using 24 samples as a test dataset. These consisted of randomly selected process parameters within the minimum and maximum values. The achieved prediction accuracies—in detail,
MAPE,
MAE and
RMSE—are provided in
Table 4.
In addition to quality characteristics, print time and material consumption were considered. These are accurately calculated within the slicer program. However, an interface that determines print time and material consumption for several parameter sets is missing. This results in a high manual data-collection effort. Thus, this work predicts material consumption and print time values using the NN prediction approach of the existing models. These predictions are based on the tensile strength samples and therefore serve as an estimation for the parameter-selection phase. The prediction models achieved a MAPE of 2.42% for print time and 0.97% for material consumption on the introduced random dataset. The prediction accuracies were evaluated as sufficient based on the low MAPE. By using this procedure, the 12,285 parameter combinations can be determined by collecting 267 values from the slicer (243 for training and 24 for test data) for print time and material consumption.
3.3. Developed Determination Methodology
The presented methodology selects suitable process parameter sets based on specific use case requirements. It considers part-quality characteristics, print time and material consumption by using corresponding prediction models. The consideration of part quality requirements enables us to assure that the needed quality is met by the manufactured part. With the material consumption, the part weight and material costs can be optimized, while the consideration of print time enables the optimization of process time. With this, the three dimensions of the iron triangle—time, costs and quality—are considered, enabling a high degree of optimization.
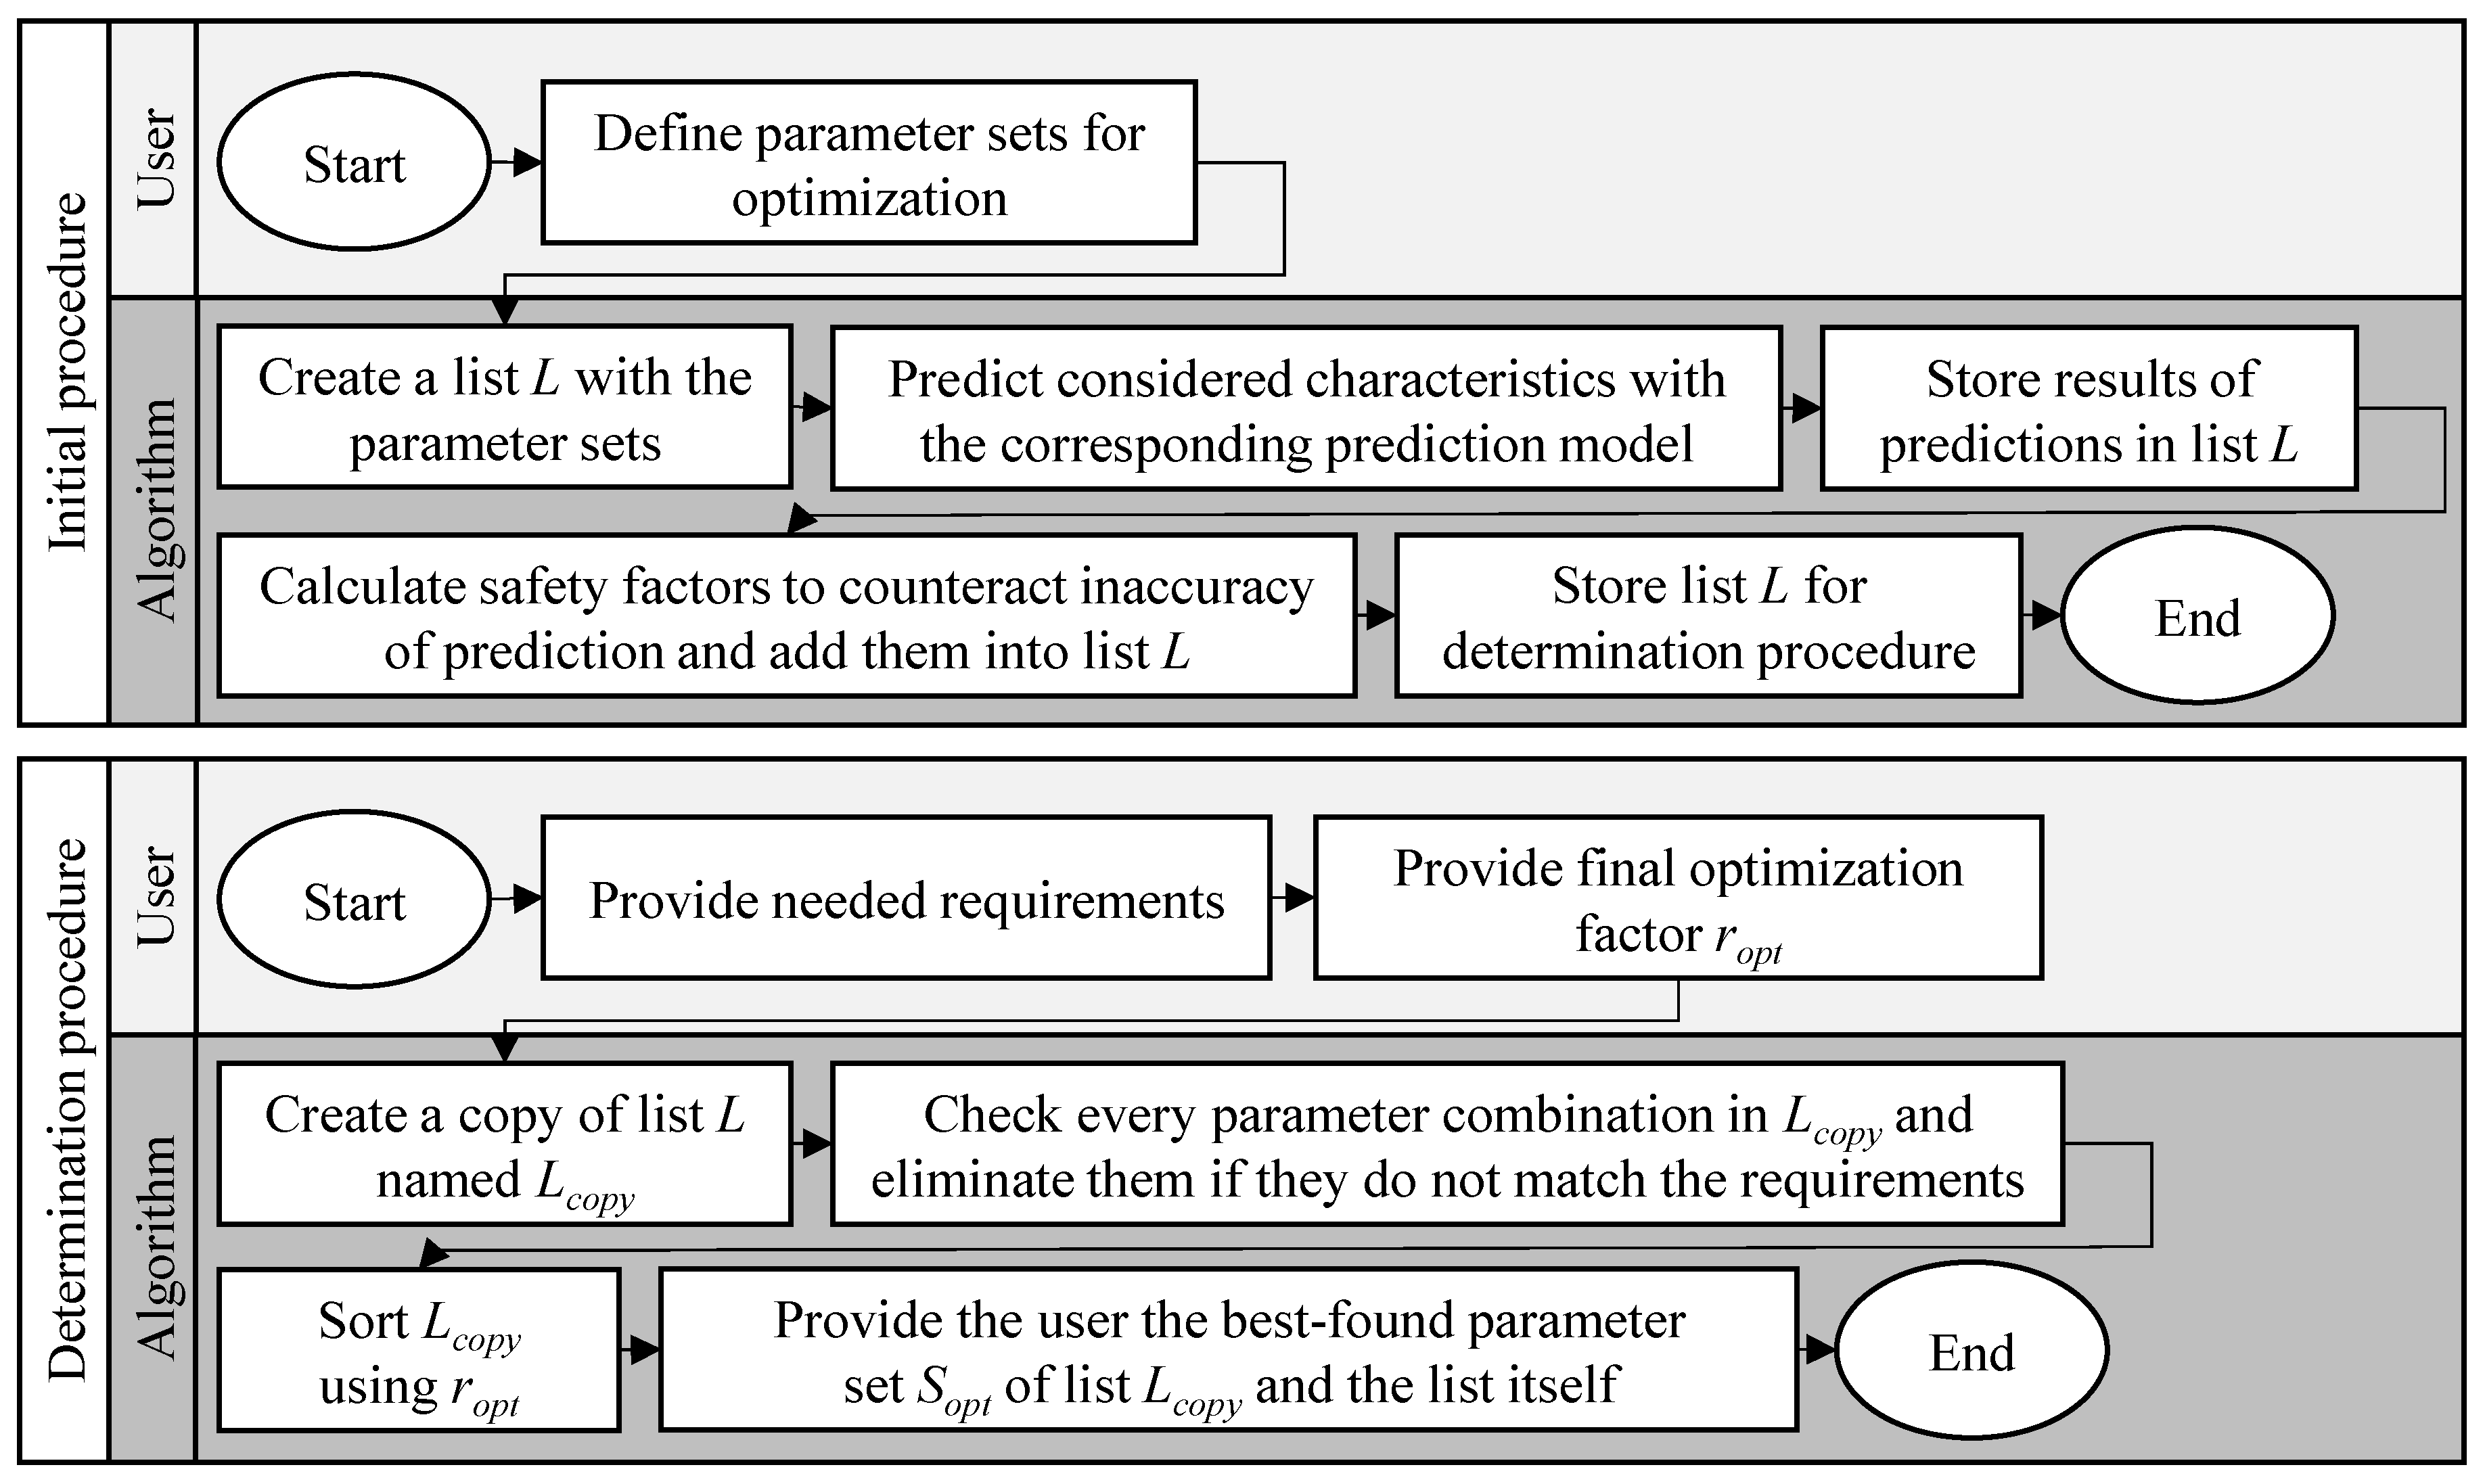
The determination is based on a lookup approach. The procedure can be split into an initial and a determination procedure (see
Figure 8). The initial procedure needs to be performed once to enable the following determination. It starts with the definition of parameters and their limits. Subsequently, for each parameter, value steps need to be defined. These determine the possible parameter combinations for the later optimization. The procedure results in a point-like solution space. The determination is based on list
, consisting of one column with all parameter combinations and a second column with an ID for each parameter combination. Subsequently, for each process parameter combination, the resulting part quality, time and material consumption are determined. This was enabled through the prediction models. The results are stored in
for the corresponding parameter set. The prediction models have a degree of inaccuracy. Thus, safety factors are required. This prevents us from selecting parameter sets that result in parts that do not fulfill the needed requirements. The safety factors are determined based on the prediction accuracy of the corresponding prediction model. In this work, the 0.95 percentile of the measured absolute percentage errors was used as a safety factor. For each characteristic, the safety factor
, which is a percentage value, was used to calculate the required limiting value using the target value
of the model. The limiting value is linked to the optimization direction. Therefore, an upper limit
and a lower limit
are calculated using Equations (5) and (6). These are then stored to the corresponding parameter set in list
. Finally, the list is stored and the initial procedure ends.
The determination of parameter sets can start after the initial procedure. First, the user provides the requirements of the use case. A quality requirement
can be defined either using a limiting value or by describing a solution space (see Equation (7)). Additionally, an optimization factor
is needed. Based on this, a preferable parameter set is identified that matches the requirement and optimizes
.
Targeting a determination of process parameters, the algorithm copies the list under a new name, . With this list, the optimization is performed. First, each parameter set is eliminated if it does not achieve the requirements of the use case. Subsequently, the remaining entries of are sorted with to identify the best-found parameter set . This is then provided to the user. In addition, is provided, as these parameter combinations also achieve the given requirements. In the case that the requirements cannot be matched with any parameter set, an empty list is provided. This procedure can be repeated if the requirements change or another use case is targeted.
3.4. Used Value Steps Defining the Solution Space
In the following, the defined value steps for the tests of the methodology and the subsequent application examples are presented. The print speed was chosen with the minimum, middle and maximum value, while the layer thickness was increased by 0.1 mm from 0.1 mm to 0.3 mm. The infill density was increased stepwise by 5% from the minimum to the maximum value. The data representation is summarized in
Table 5. The nozzle temperature and number of shells were stepwise increased by 1. This results in 12,285 parameter combinations which are used to find the best matching process parameter set for the quality requirements of the considered use case. However, the dimensional accuracy prediction needs a further input defining the targeted distance. This work considered dimensions from 2500 to 12,500 μm for X- and Y-directions and 2500 to 10,000 μm for the Z-direction. These are the limits of the training sample. For each direction, a step size of 500 μm was used, resulting in 58 selectable dimensions for optimization.
4. Results and Discussion
In the following, the results are presented. In an initial step, the enabled solution space is analyzed according to the quality characteristics. Subsequently, the methodology is tested with four different exemplary use case requirements. The developed methodology is then applied to two exemplary use cases. Finally, the results are critically evaluated, and the limitations of the methodology are discussed.
4.1. Enabled Solution Space
With the described procedure, a solution space is enabled which is influenced by the considered process parameters, their value representation and the manufacturing process itself. Thus, in the following, the results of the parameter sets are analyzed to gain knowledge about the regularities and limitations of the used procedure. In the following, scatter plots are used. Each prediction of a parameter set is represented by one dot. The determination methodology selects one of those dots as the best-found parameter set considering the given use-case requirements.
4.1.1. Tensile Strength
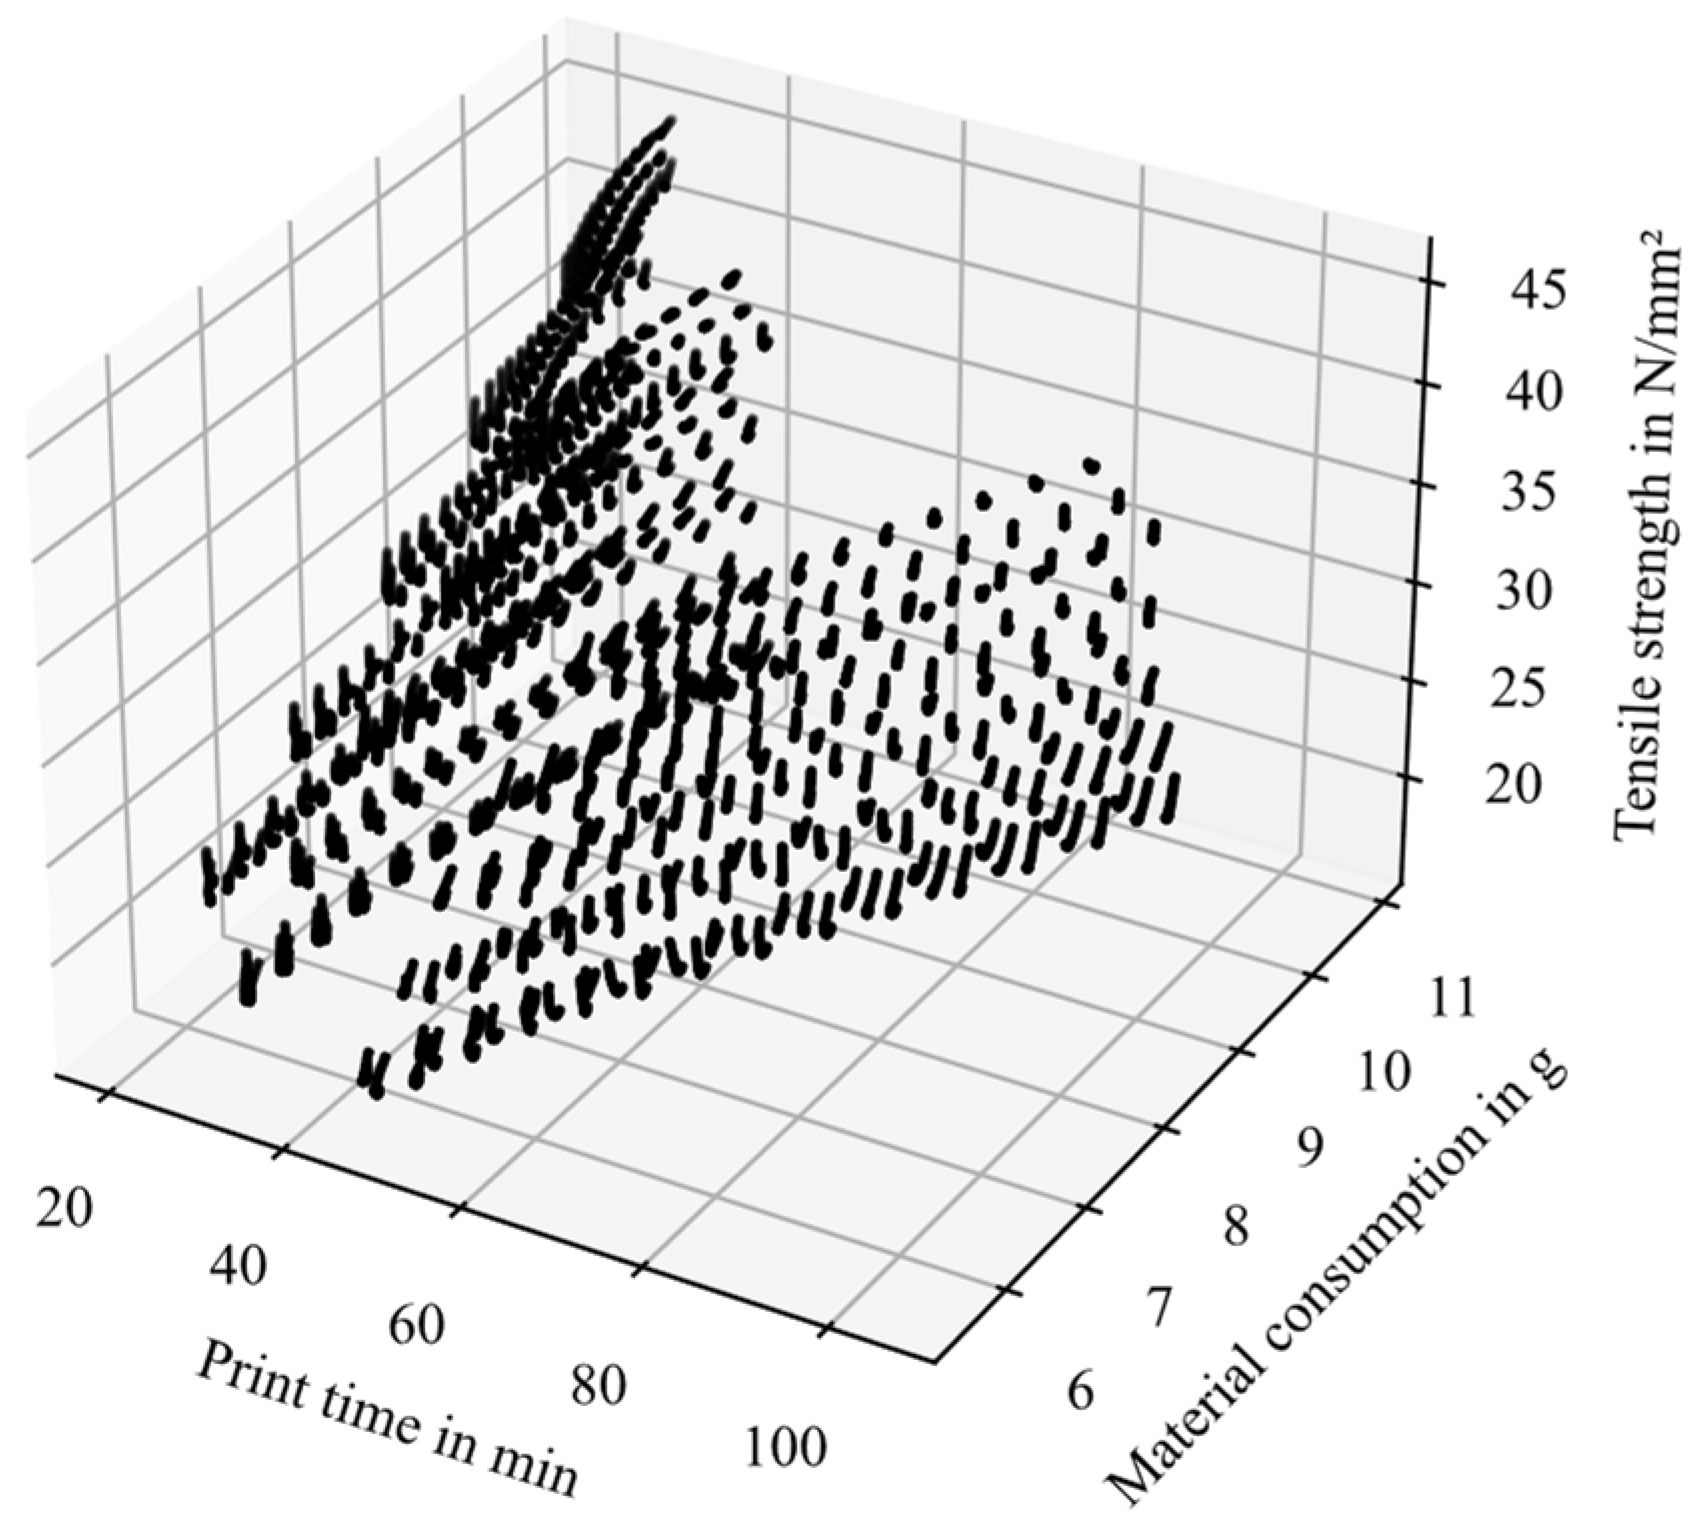
The solution space of the tensile strength is shown in
Figure 9. The minimum tensile strength was 16.44 N/mm
2 and the maximum was 45.00 N/mm
2. The results show that with a low print time and a high material consumption, the highest tensile strength was achieved (see increasing values in
Figure 9). The reduction in print time is caused by the process parameter layer thickness, as higher values reduce print time and increase tensile strength.
4.1.2. Linear Dimensional Accuracy
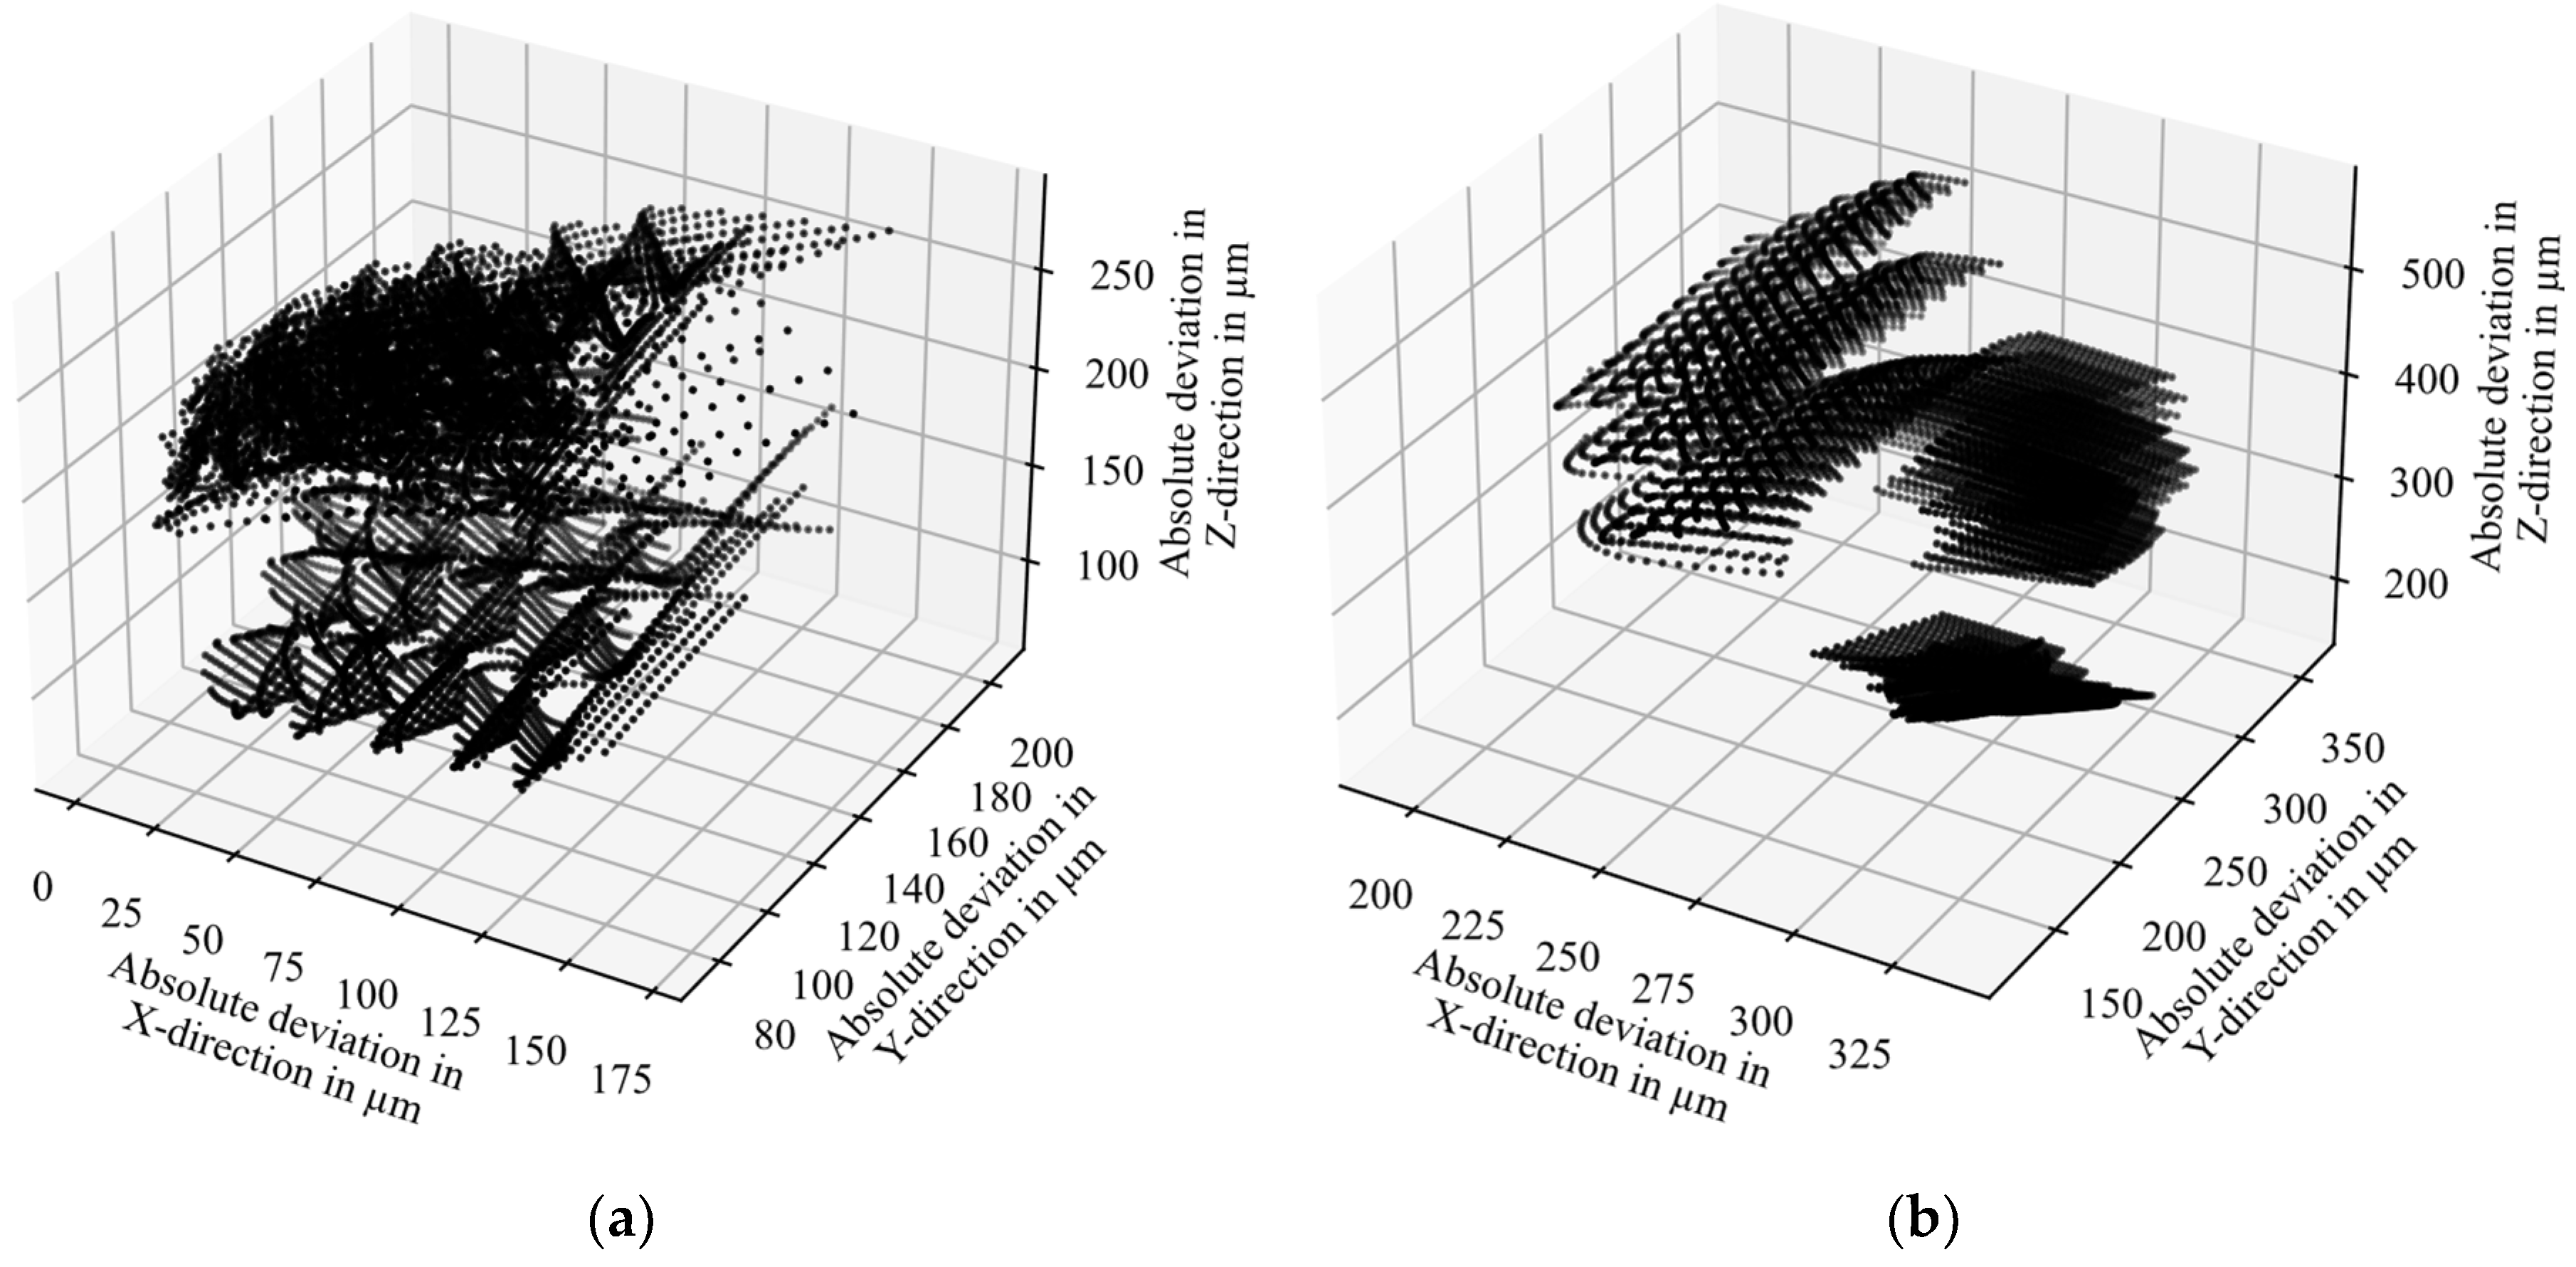
The solution space of the dimensional accuracy differs according to the build orientation and the length of the target dimension. The first can be seen by comparing the value range of the axes of (a) in
Figure 10. The second can be seen by comparing the value range of (a) and (b) in
Figure 10. The shapes of the dots of (a) and (b) in
Figure 10 differ. Thus, the distribution of the predicted absolute deviations differs according to the targeted dimension. This effect is consistent with the observed length- and orientation-dependent parameter influences in the corresponding publication that investigated the prediction model in more detail [
22].
4.1.3. Surface Roughness
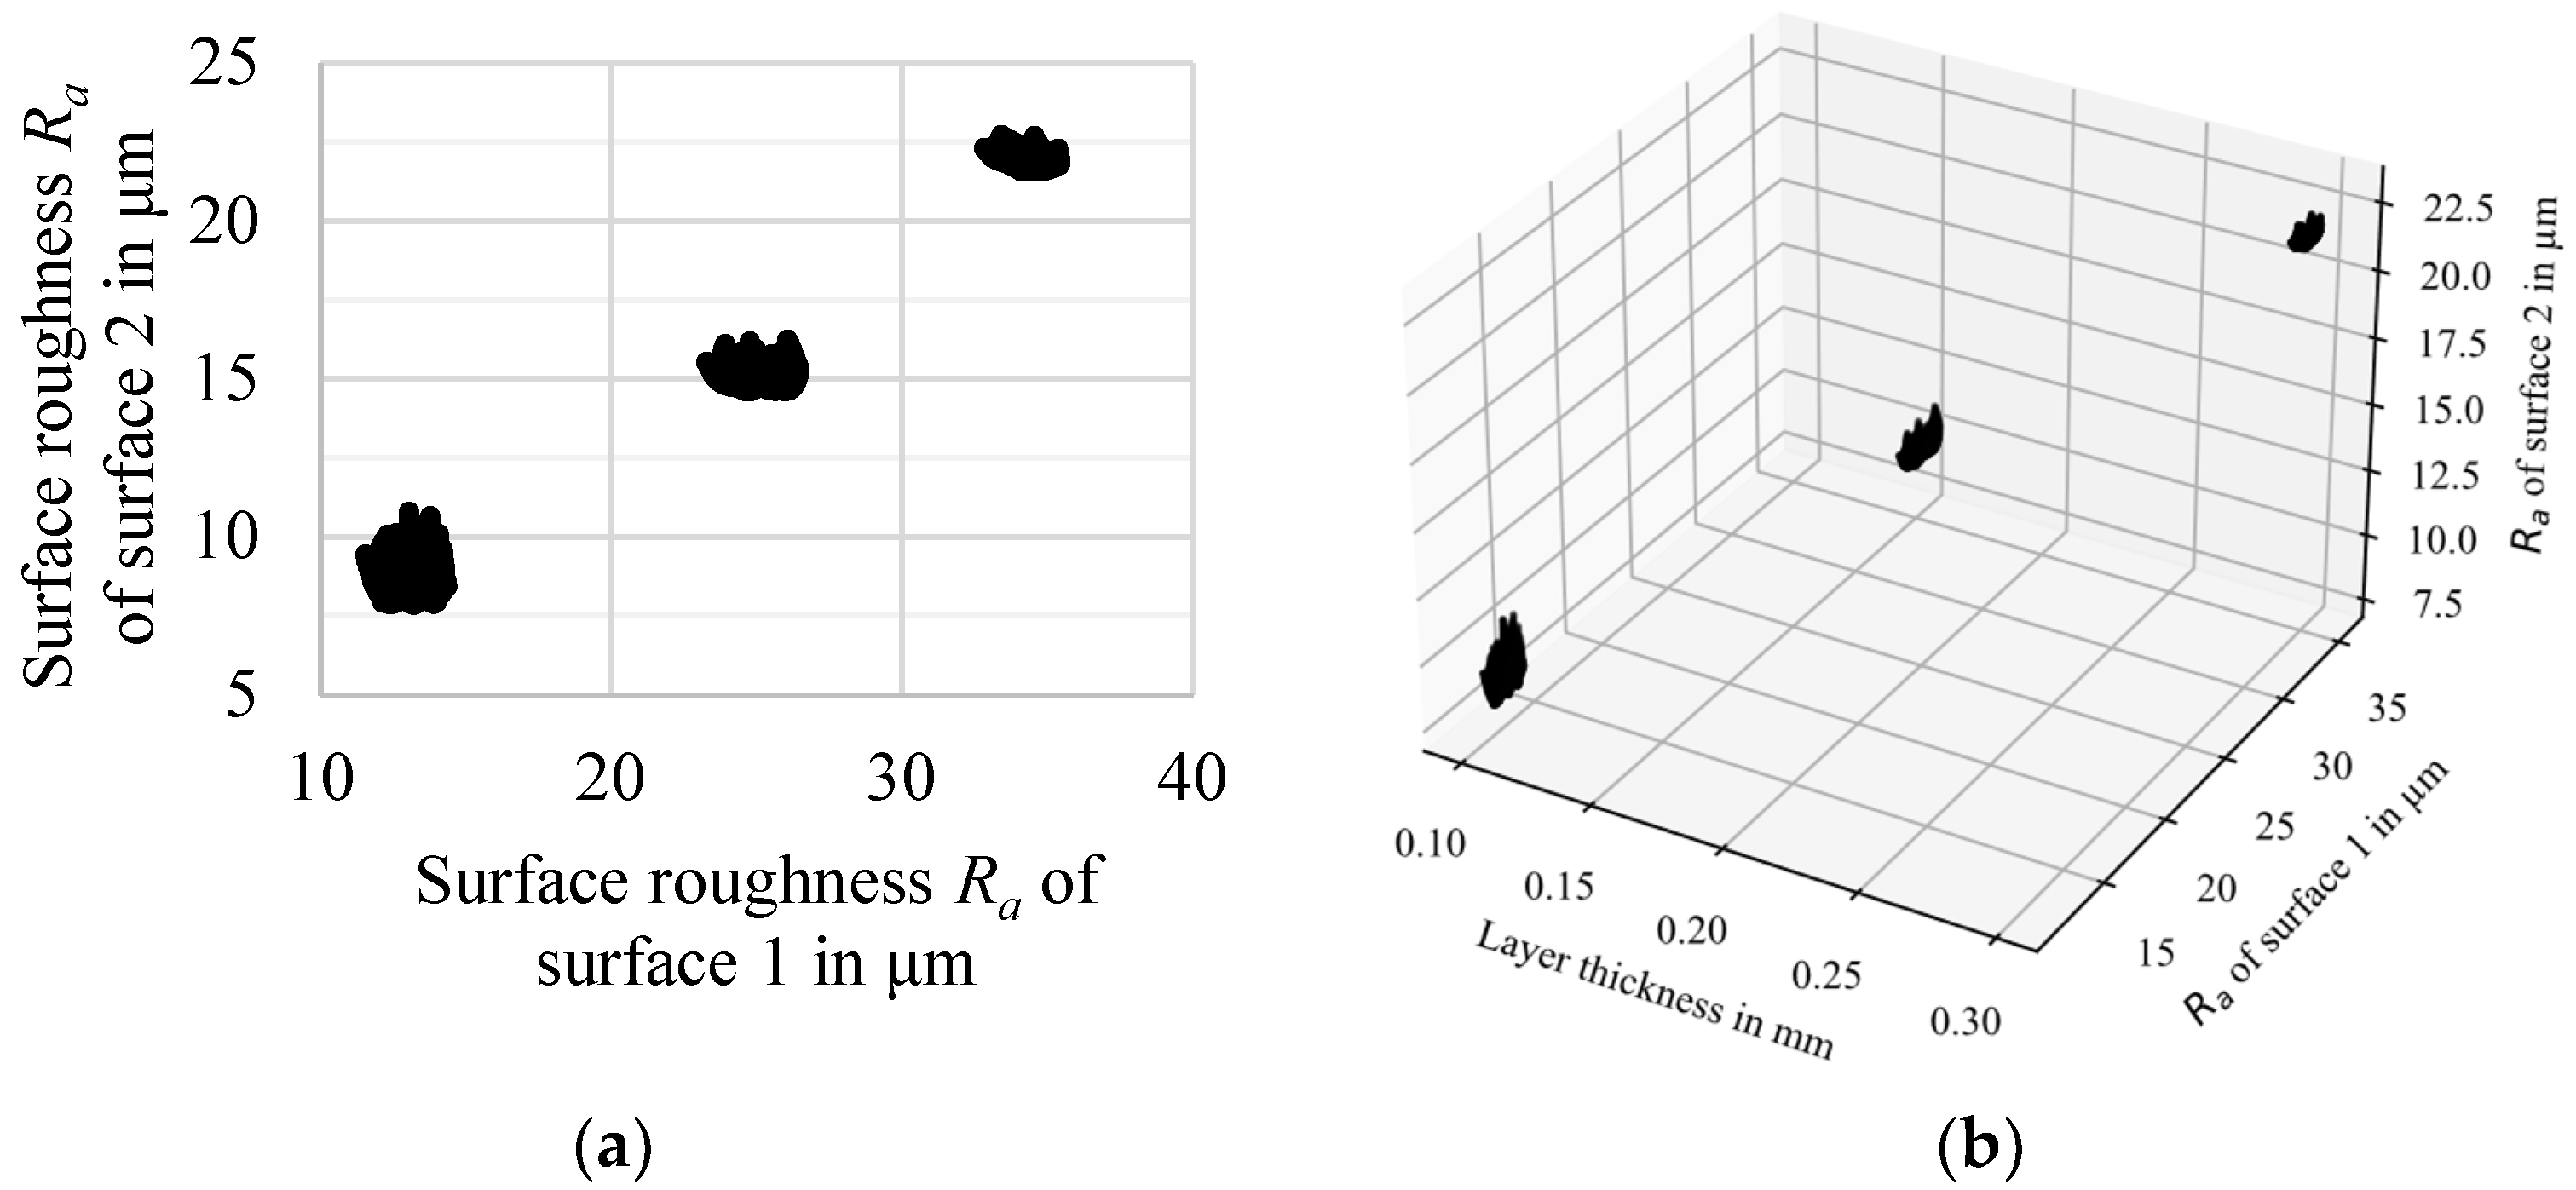
In the case of vertical surfaces, the minimum surface roughness of the solution space was found to be 7.87 μm, while the maximum was 22.89 μm. For surfaces with a 45°-degree build up, a higher minimum (11.52 μm) and maximum surface roughness (35.43 μm) were found. The solution space has three separated clusters (see (a) in
Figure 11). This clustering effect can be attributed to the significant influence of the layer thickness. This can be seen in (b) in
Figure 11, where the clusters are separated by the layer thickness values. In contrast, other observed parameters had low (below 12.5 μm), medium (12.5 to 20 μm) and high (above 20 μm) values at each process parameter step. This stepwise behavior has a direct impact on the optimization freedom, as some values are not achievable with the considered parameters (free space between clustered dots). In addition, optimizing the surface roughness may limit the optimization for the other quality characteristics, since low values can only be achieved with a layer thickness of 0.1 mm.
4.2. Testing of the Developed Methodology
In the following, the determination procedure is tested using four exemplary parameter sets. For testing, the samples of
Section 3.1 were used to measure if the procedure resulted in satisfying results. They were determined by the exemplary use-case requirements given in
Table 6. In
T1, specifications of tensile strength and surface roughness were determined, and an optimization of the print time was targeted. In
T2, dimensional accuracy requirements were applied and the requirements of tensile strength and surface roughness were changed. In
T3, only requirements in the X- and Y-direction were applied. Material consumption was selected as the optimization factor in both cases.
T4 deviates from the aforementioned quality requirements. First, the tensile strength was used as an optimization factor. This should result in a parameter set that fulfills the quality requirements and optimizes the strength of the resulting part. Additionally, the use-case targets dimensions with a value of 5000 μm or lower, simulating a use-case of a small part. The determined parameter sets are given in
Table 7.
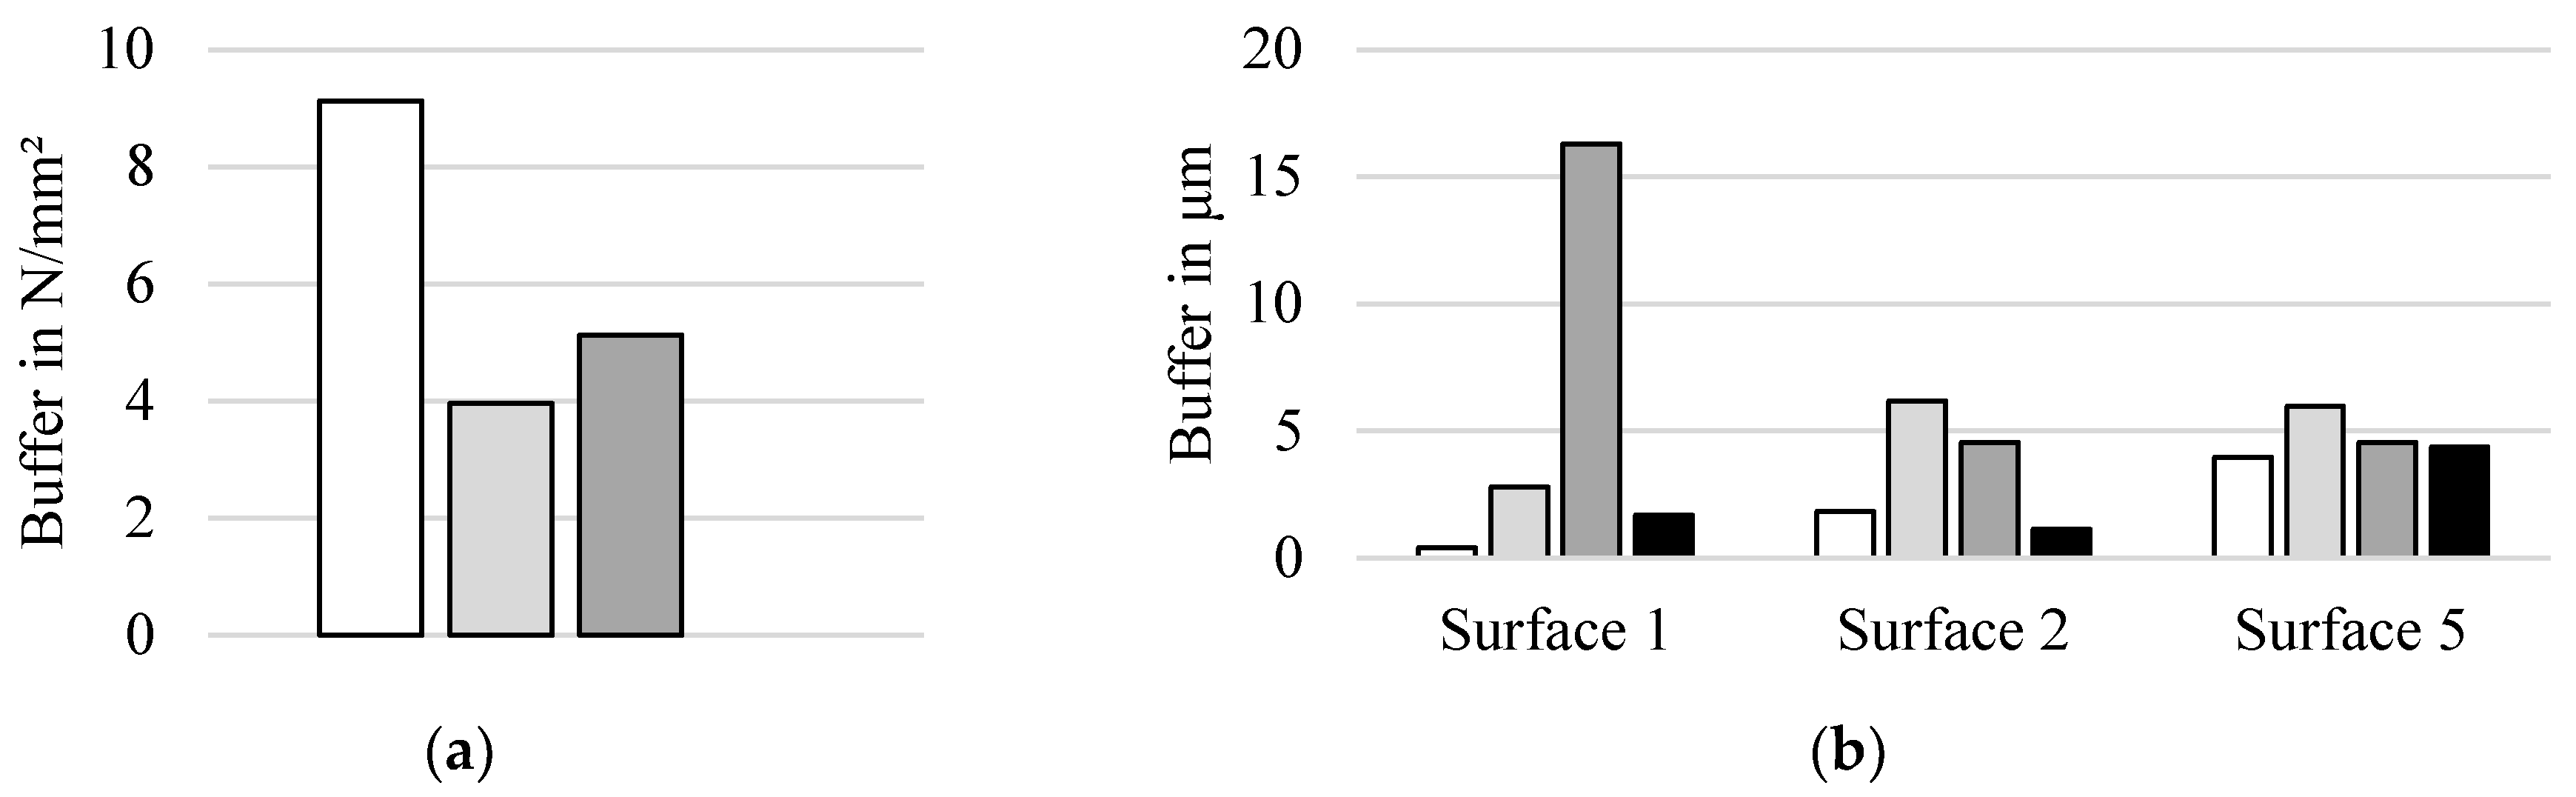
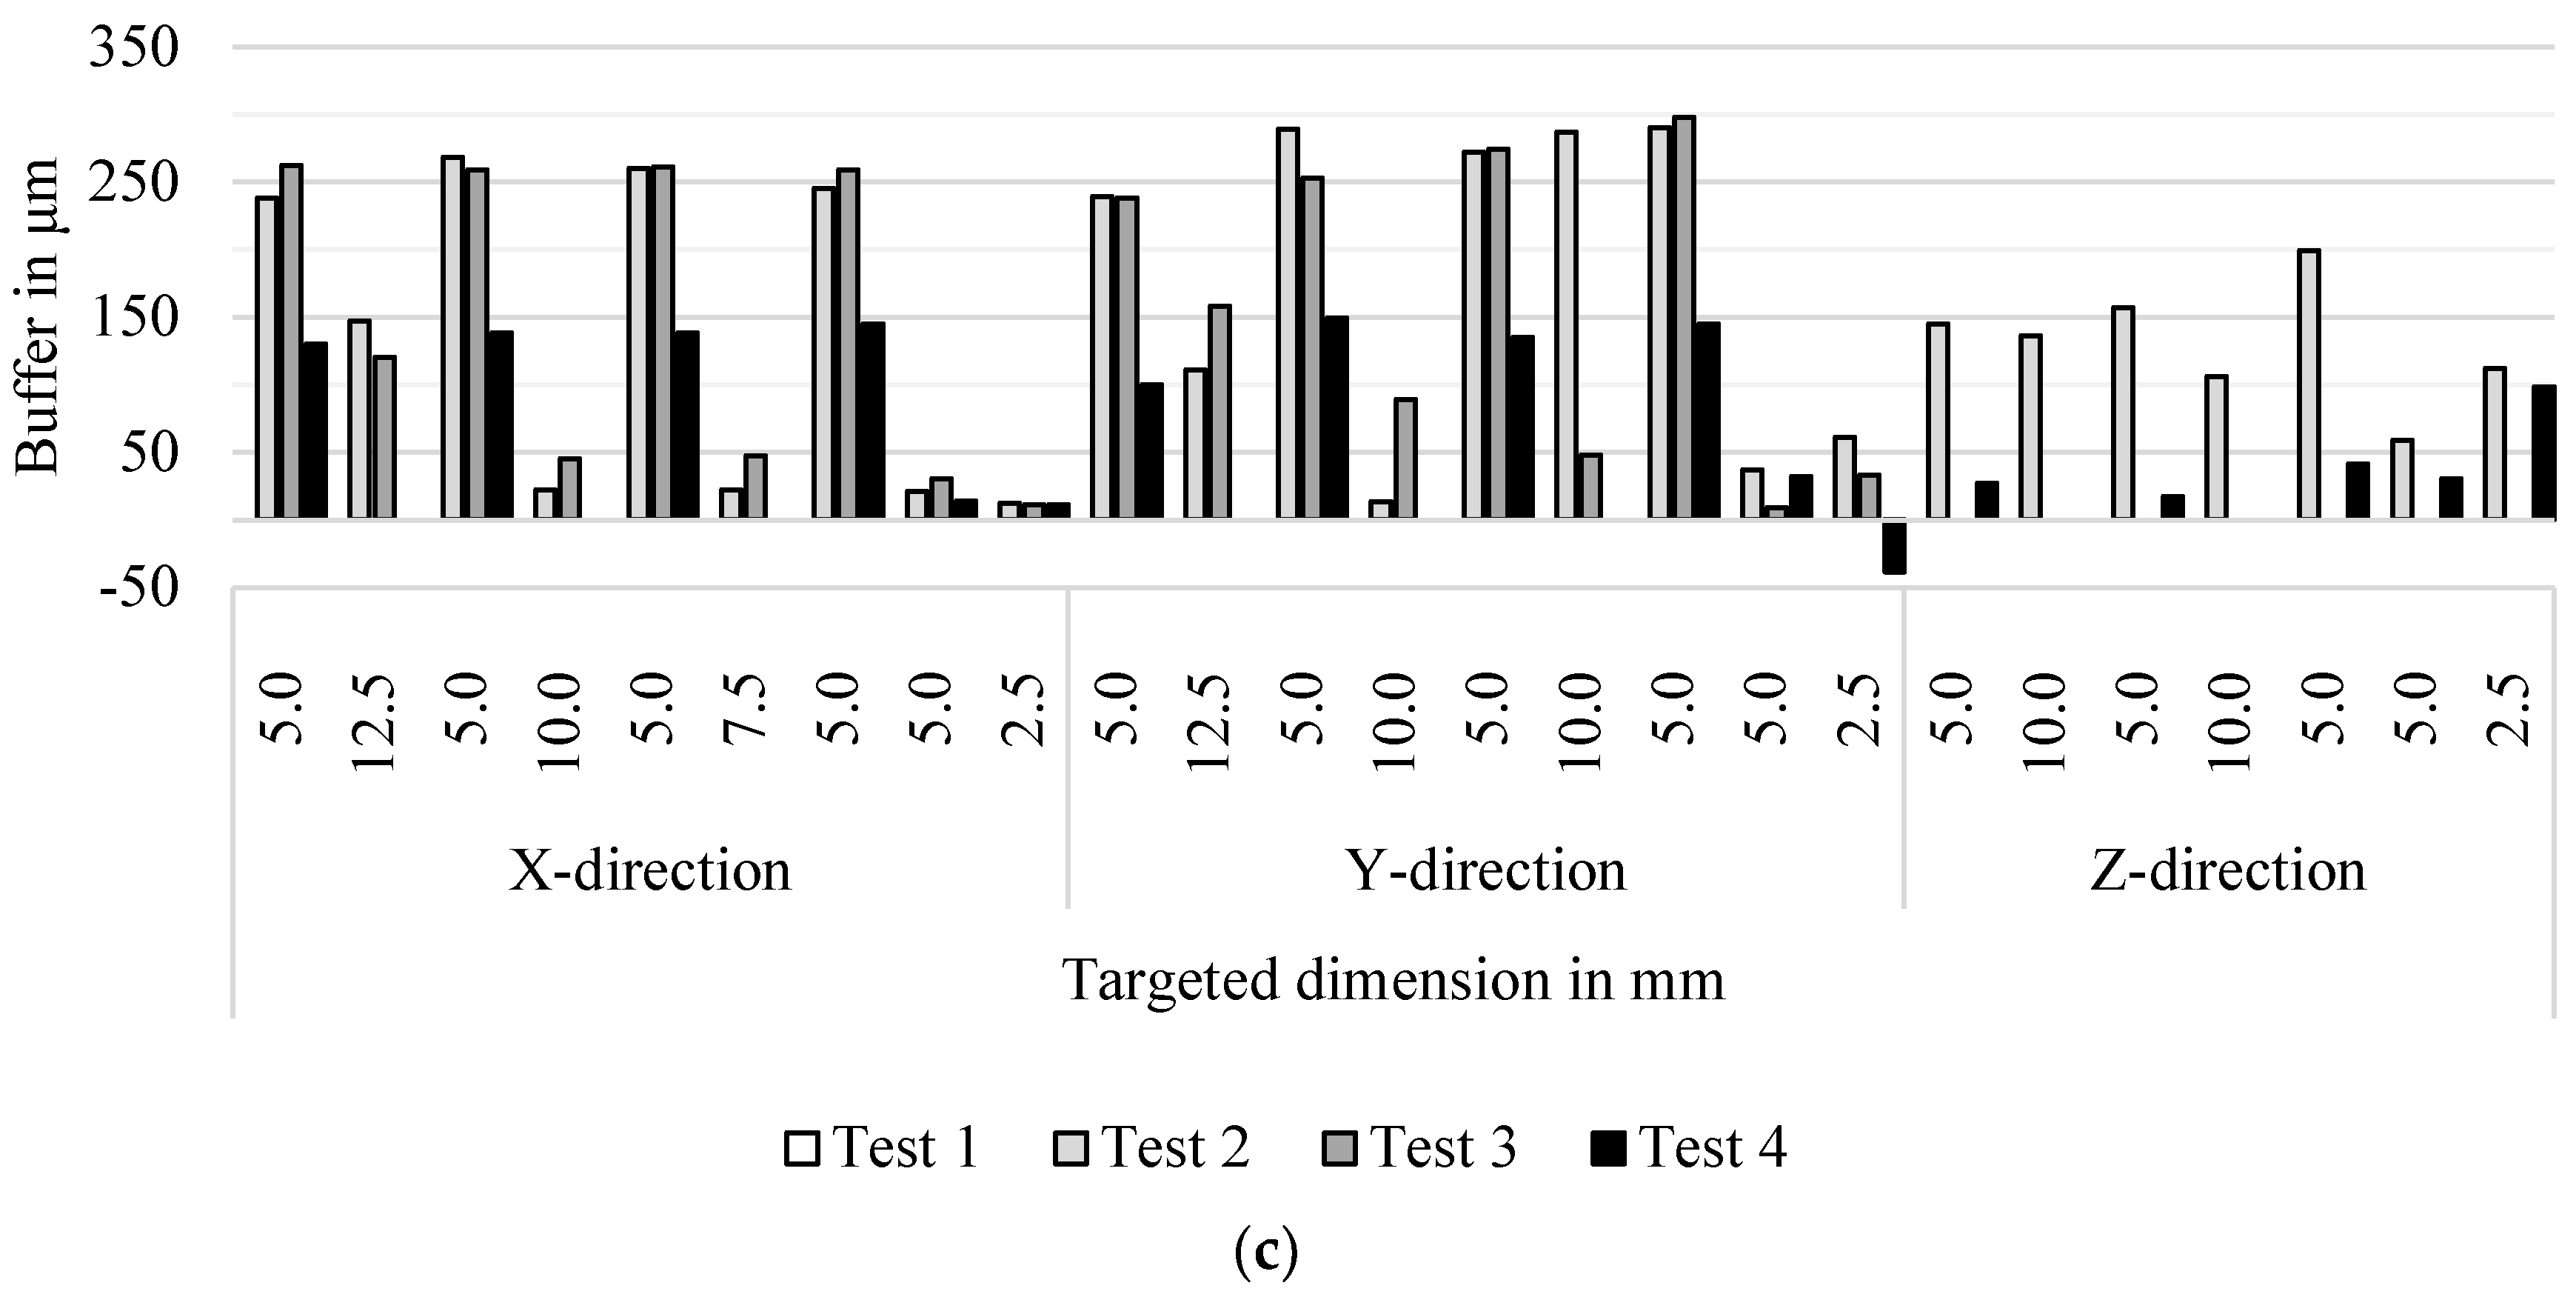
Figure 12 shows the buffer—lowest absolute difference between the measured value and the target limit (upper or lower limit)—of the results. For the use-case tested, the tensile strength and surface roughness requirements were successfully met (see (a) and (b) in
Figure 12). The minimum buffer of tensile strength was 2.6 N/mm
2, and that of surface roughness was 0.39 μm. In the case of dimensional accuracy, one negative buffer was found at
T4—i.e., the
T4 part did not achieve the quality requirements. A targeted dimension of 2500 μm in the Y-direction resulted in a negative buffer of 39 μm (see (c) in
Figure 12). This indicates that for this parameter combination, the safety factor was not sufficient to absorb the resulting prediction inaccuracy. This could be caused by a poor prediction of the model for this specific parameter combination, a print process error caused by the machine (such as changes in fixed parameters during the print process) or an insufficient measurement. The latter can be excluded as the measurement was repeated. The other tests successfully met the requirements. In the case of
T4, a tensile strength of 35.56 N/mm
2 was achieved.
The result showed that the chosen safety factor (0.95 percentile) on one side enabled a high optimization degree. On the counter side, one negative buffer was observed. This indicates that the used safety factor is sufficient if slight undercuts of the values are acceptable. If not, a more conservative safety factor should be chosen, e.g., the 0.99 percentile. Nevertheless, this would reduce the optimization freedom. It should be noted that the prediction models tend to have inaccuracies at the minimum and maximum values of the training data. In the tests, the buffer was exceeded at a distance of 2.5 mm (lowest distance of sample). Thus, it is recommended to use the presented methodology for dimensions that do not correspond to the limiting values.
4.3. Application Example of Developed Methodology
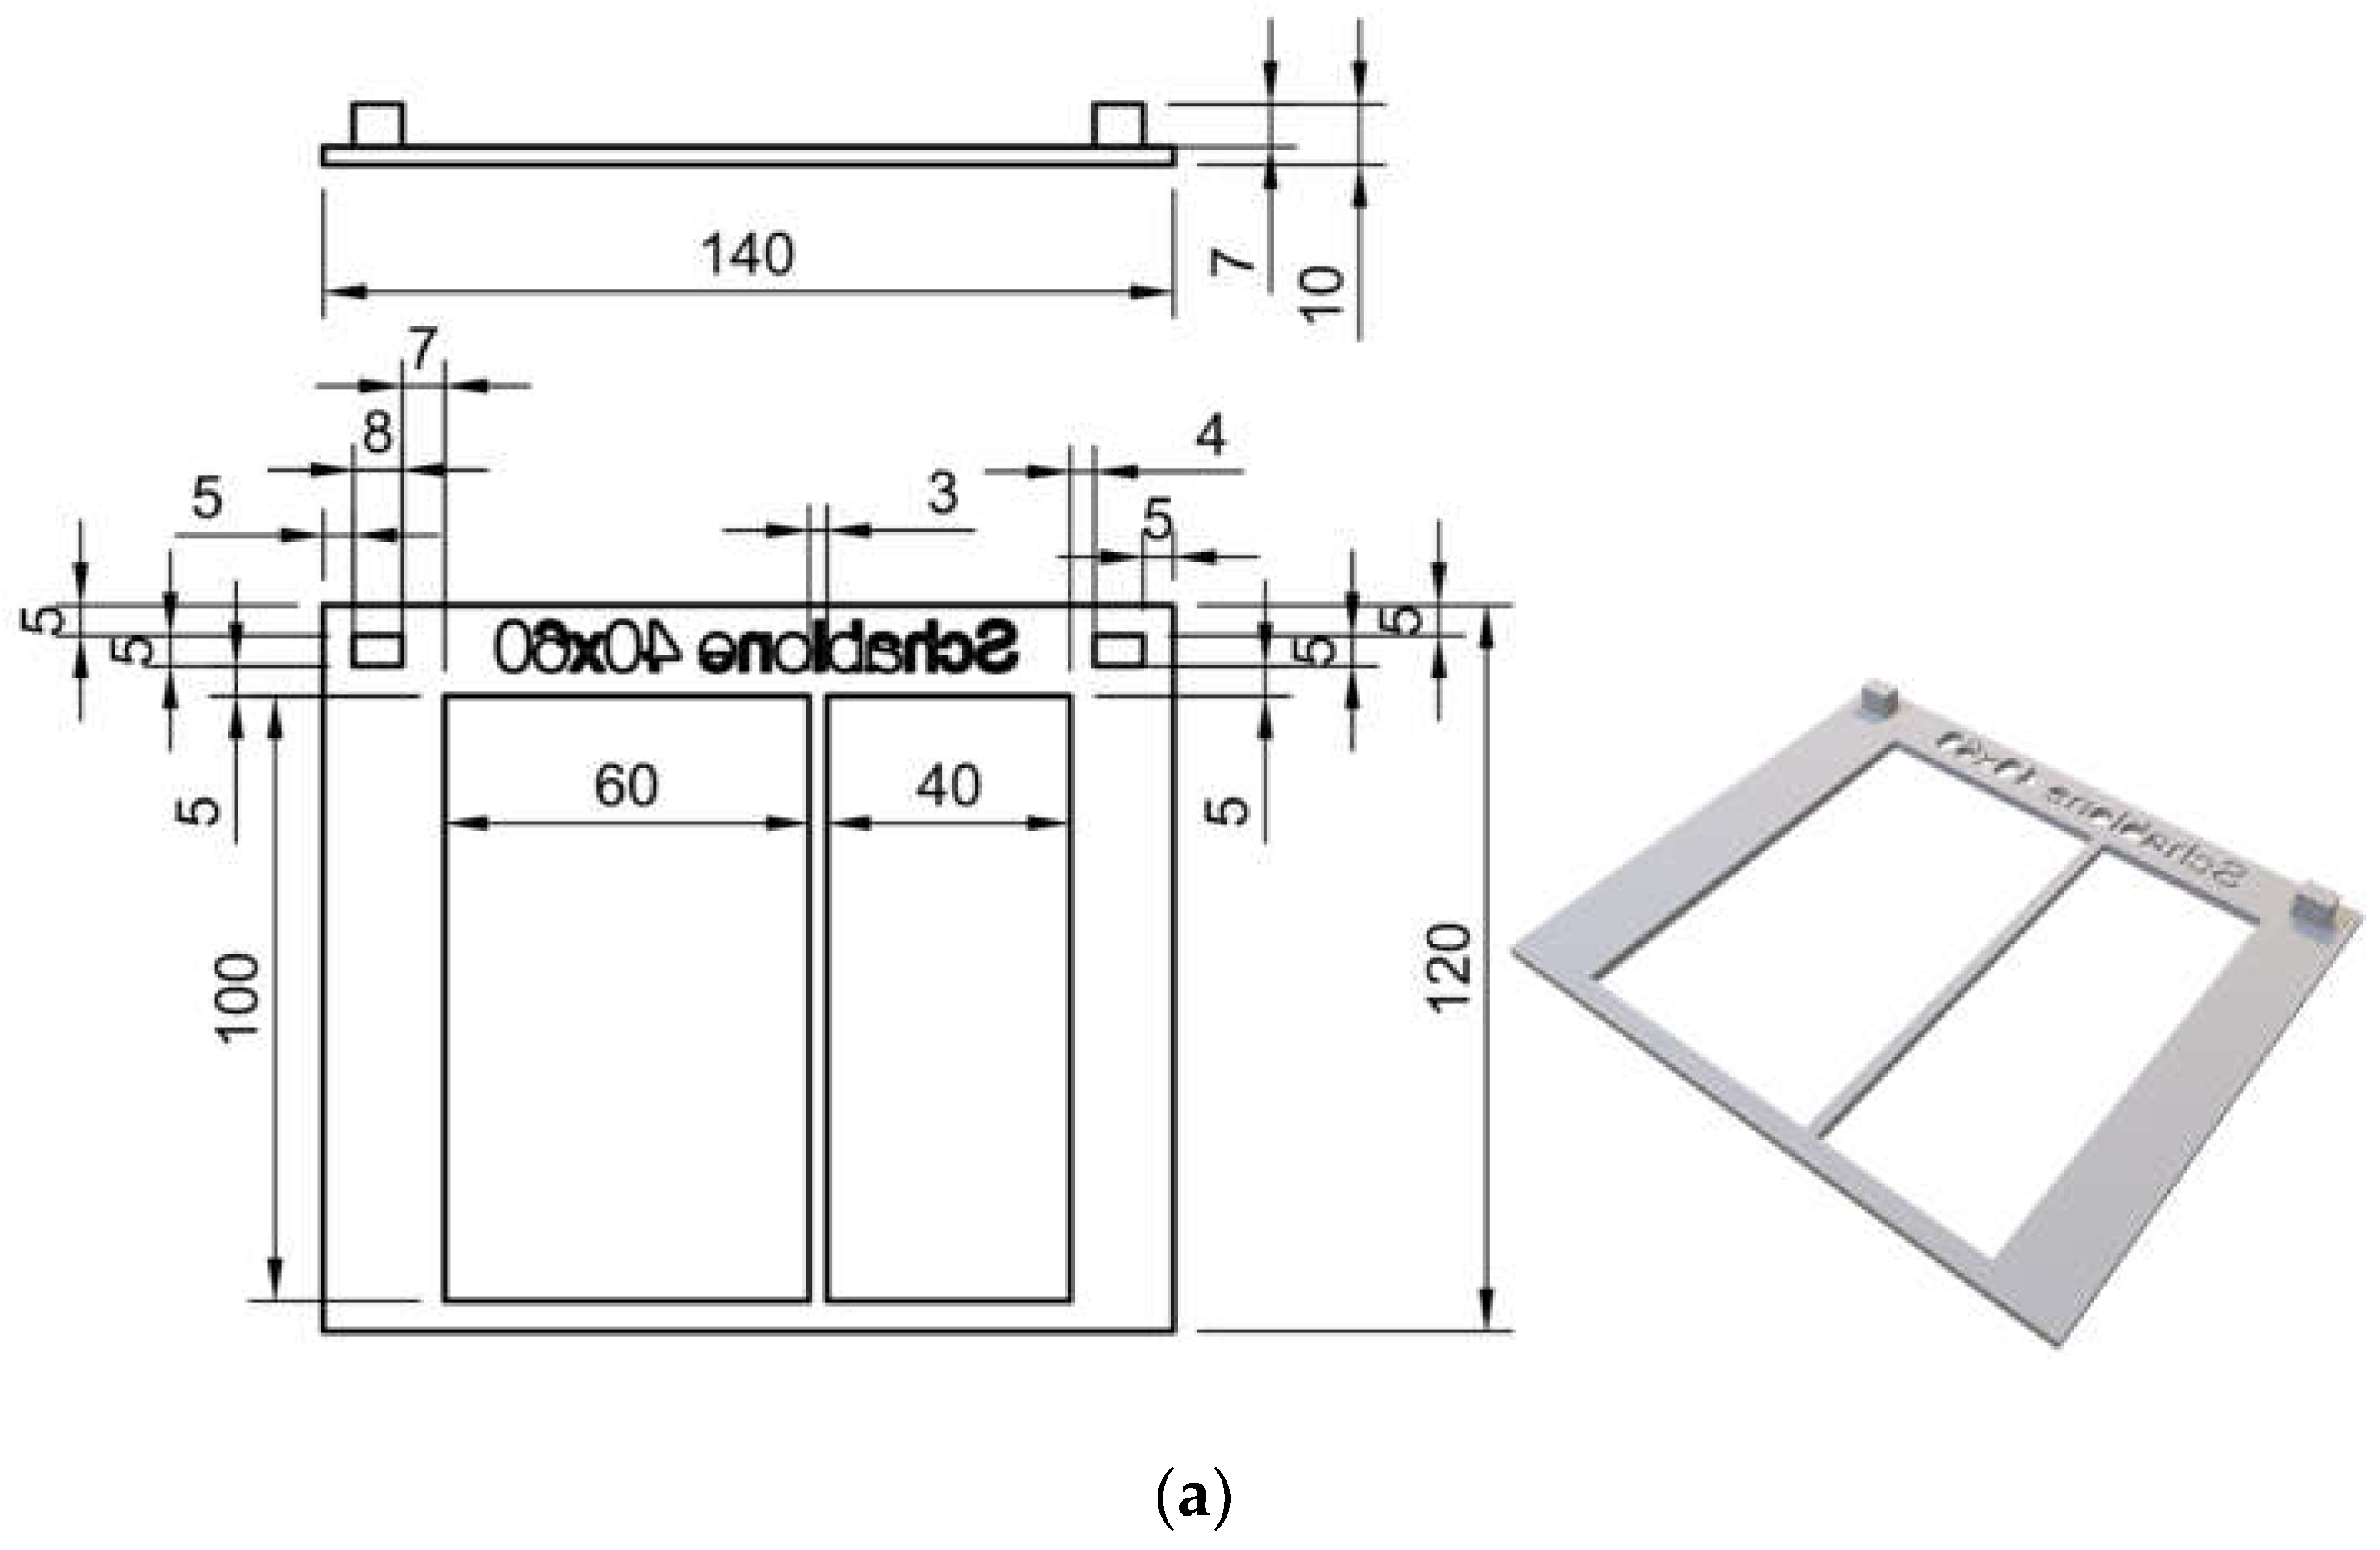
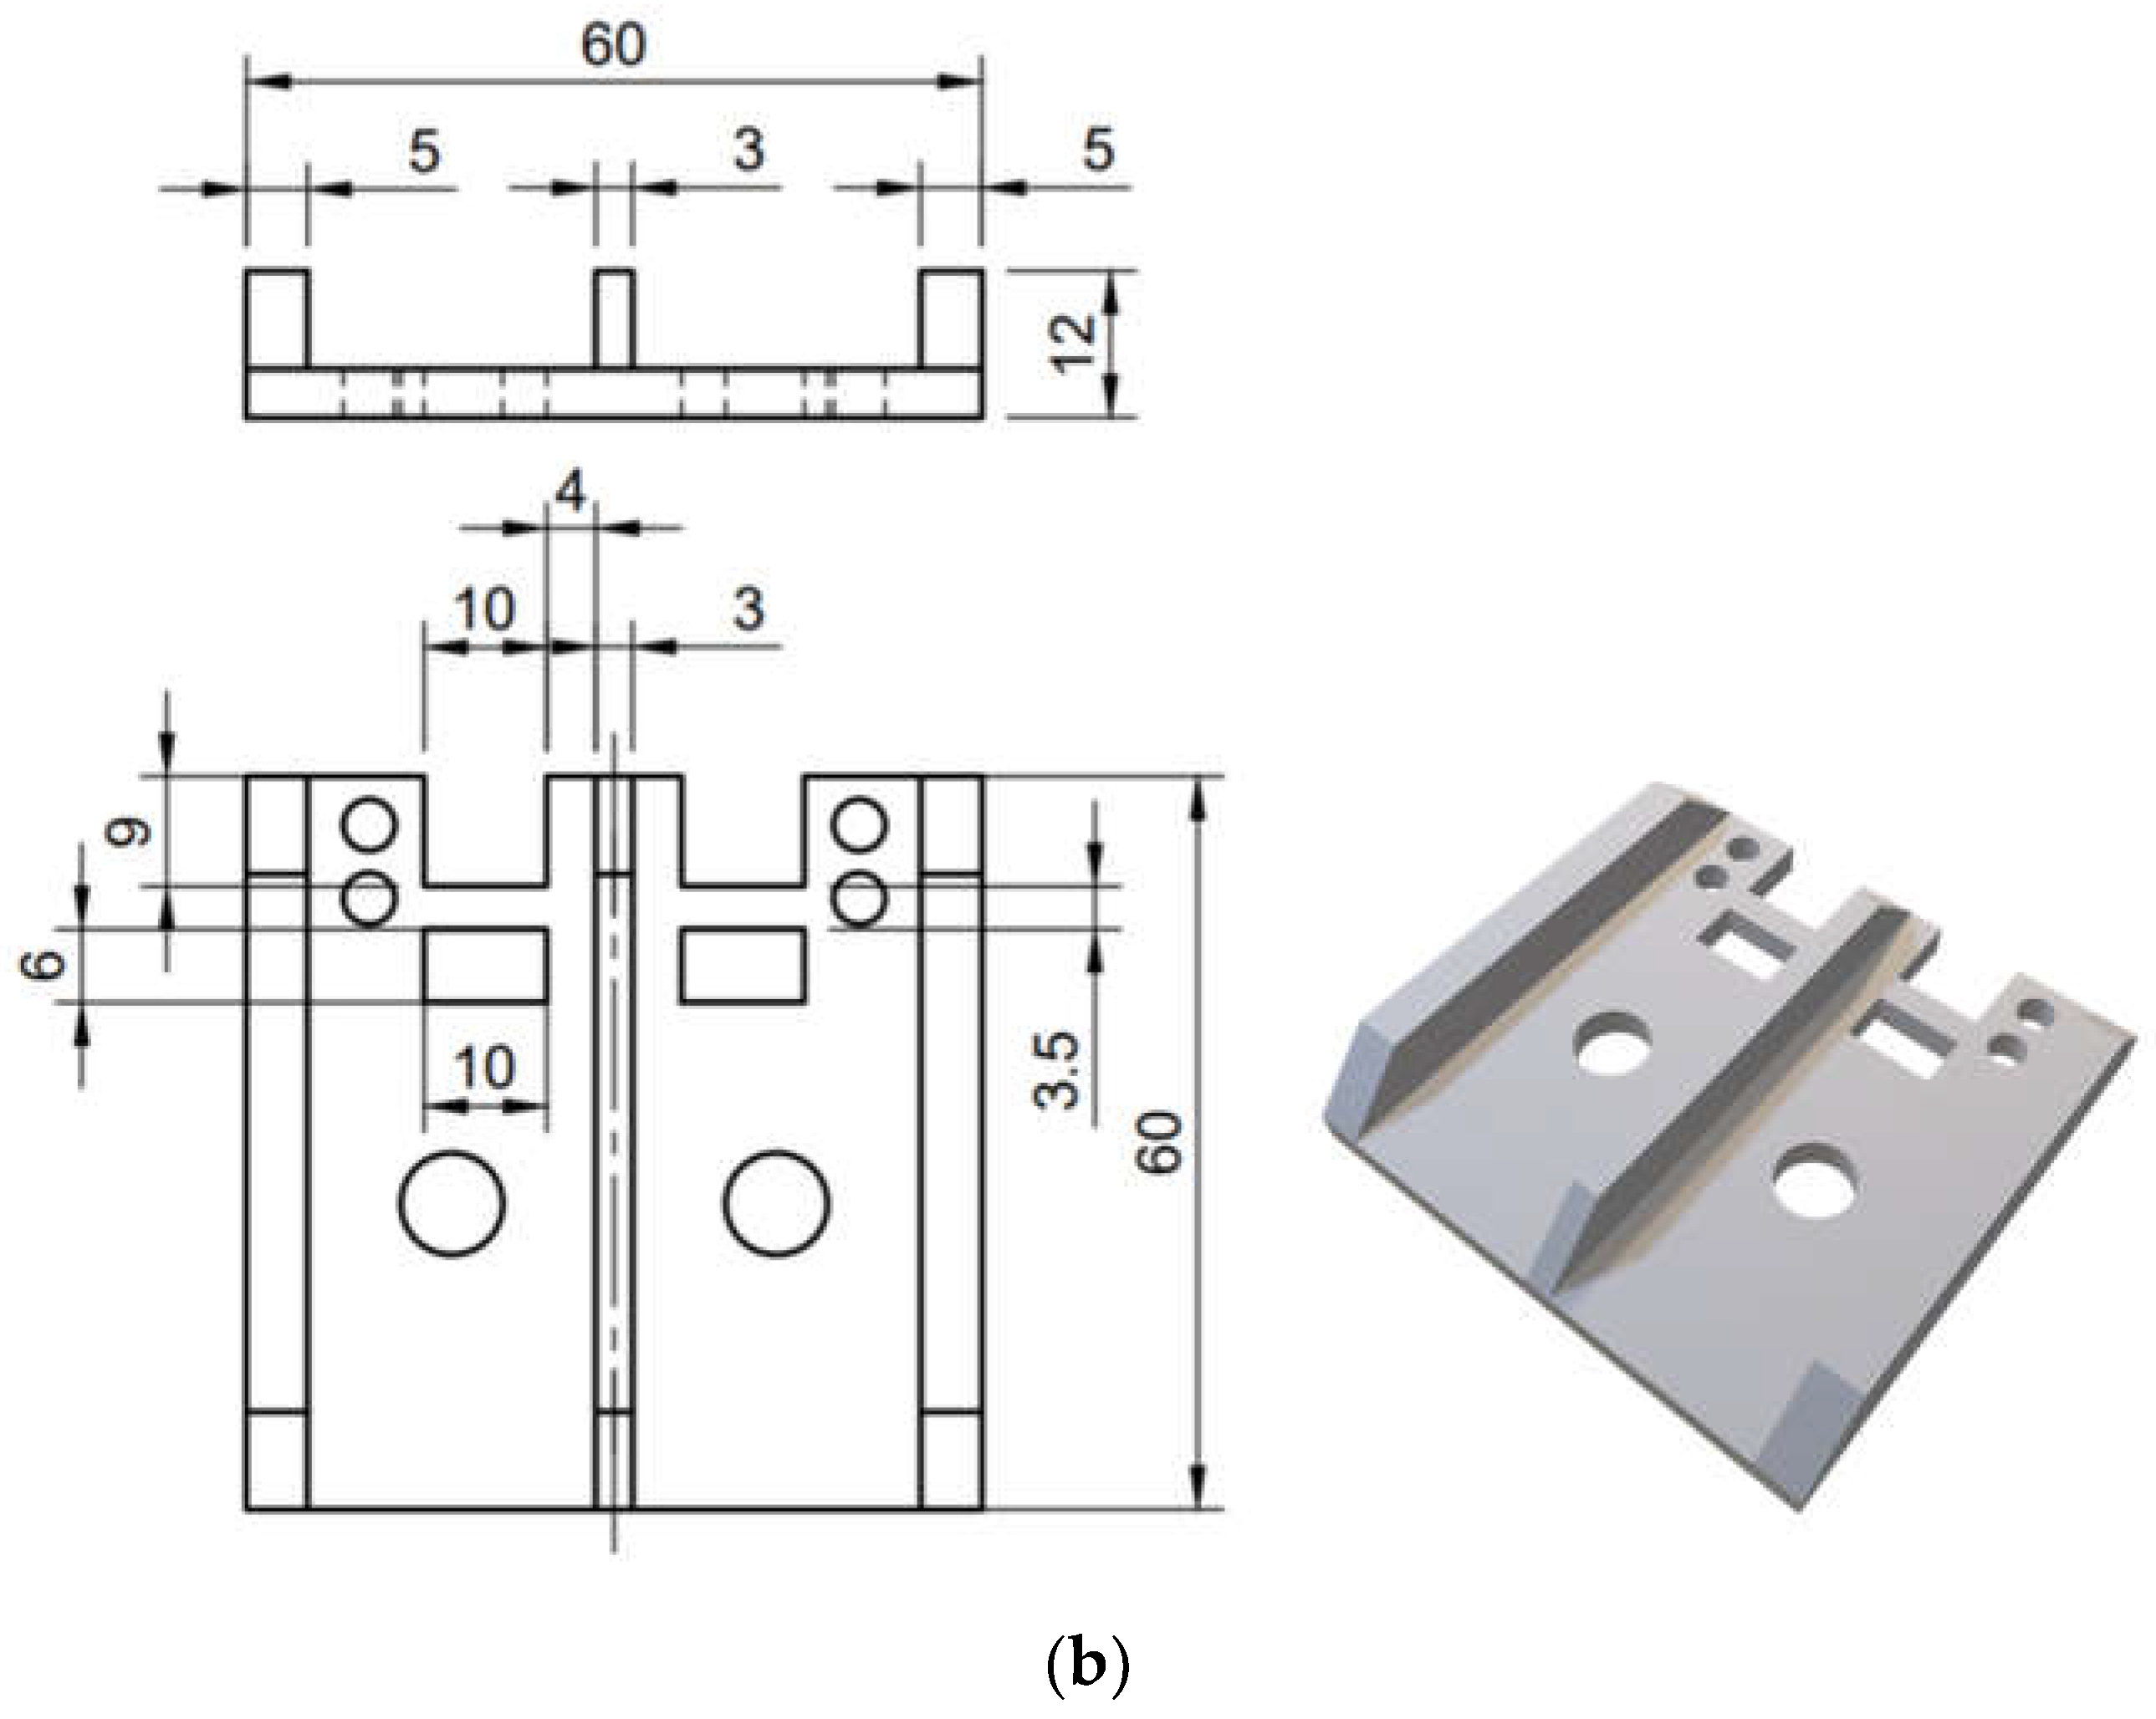
After successful testing, the developed methodology is applied to two use cases of the Additive Design and Manufacturing Lab (Karlsruhe University of Applied Sciences, Karlsruhe, Germany) as part of its service activities. The parts are a stencil for accurate labeling and a holder for electronics implemented in a robot (see
Figure 13). For this purpose, the quality requirements were recorded with the clients, in this case solely dimensional requirements. In addition, for the stencil, the print time was optimized, and for the holder, the material consumption was optimized. The requirements are summarized in
Table 8. The parts were manufactured with PETG material using a Prusa i3MK3S+ (Prag, Czech republic, Prusa Research) as in testing.
A suitable parameter set was determined using the presented methodology. Subsequently, the samples were printed and measured. In parallel, a parameter set was optimized by the machine operator—in this use-case, a scientific assistant of the laboratory—based on the standard parameter sets given by the associated slicer. This parameter set was also printed and measured. The resulting parts are compared considering dimensional accuracy, print time and material consumption.
Table 9 summarizes the results of the different parameter sets. The measured buffers are given in the
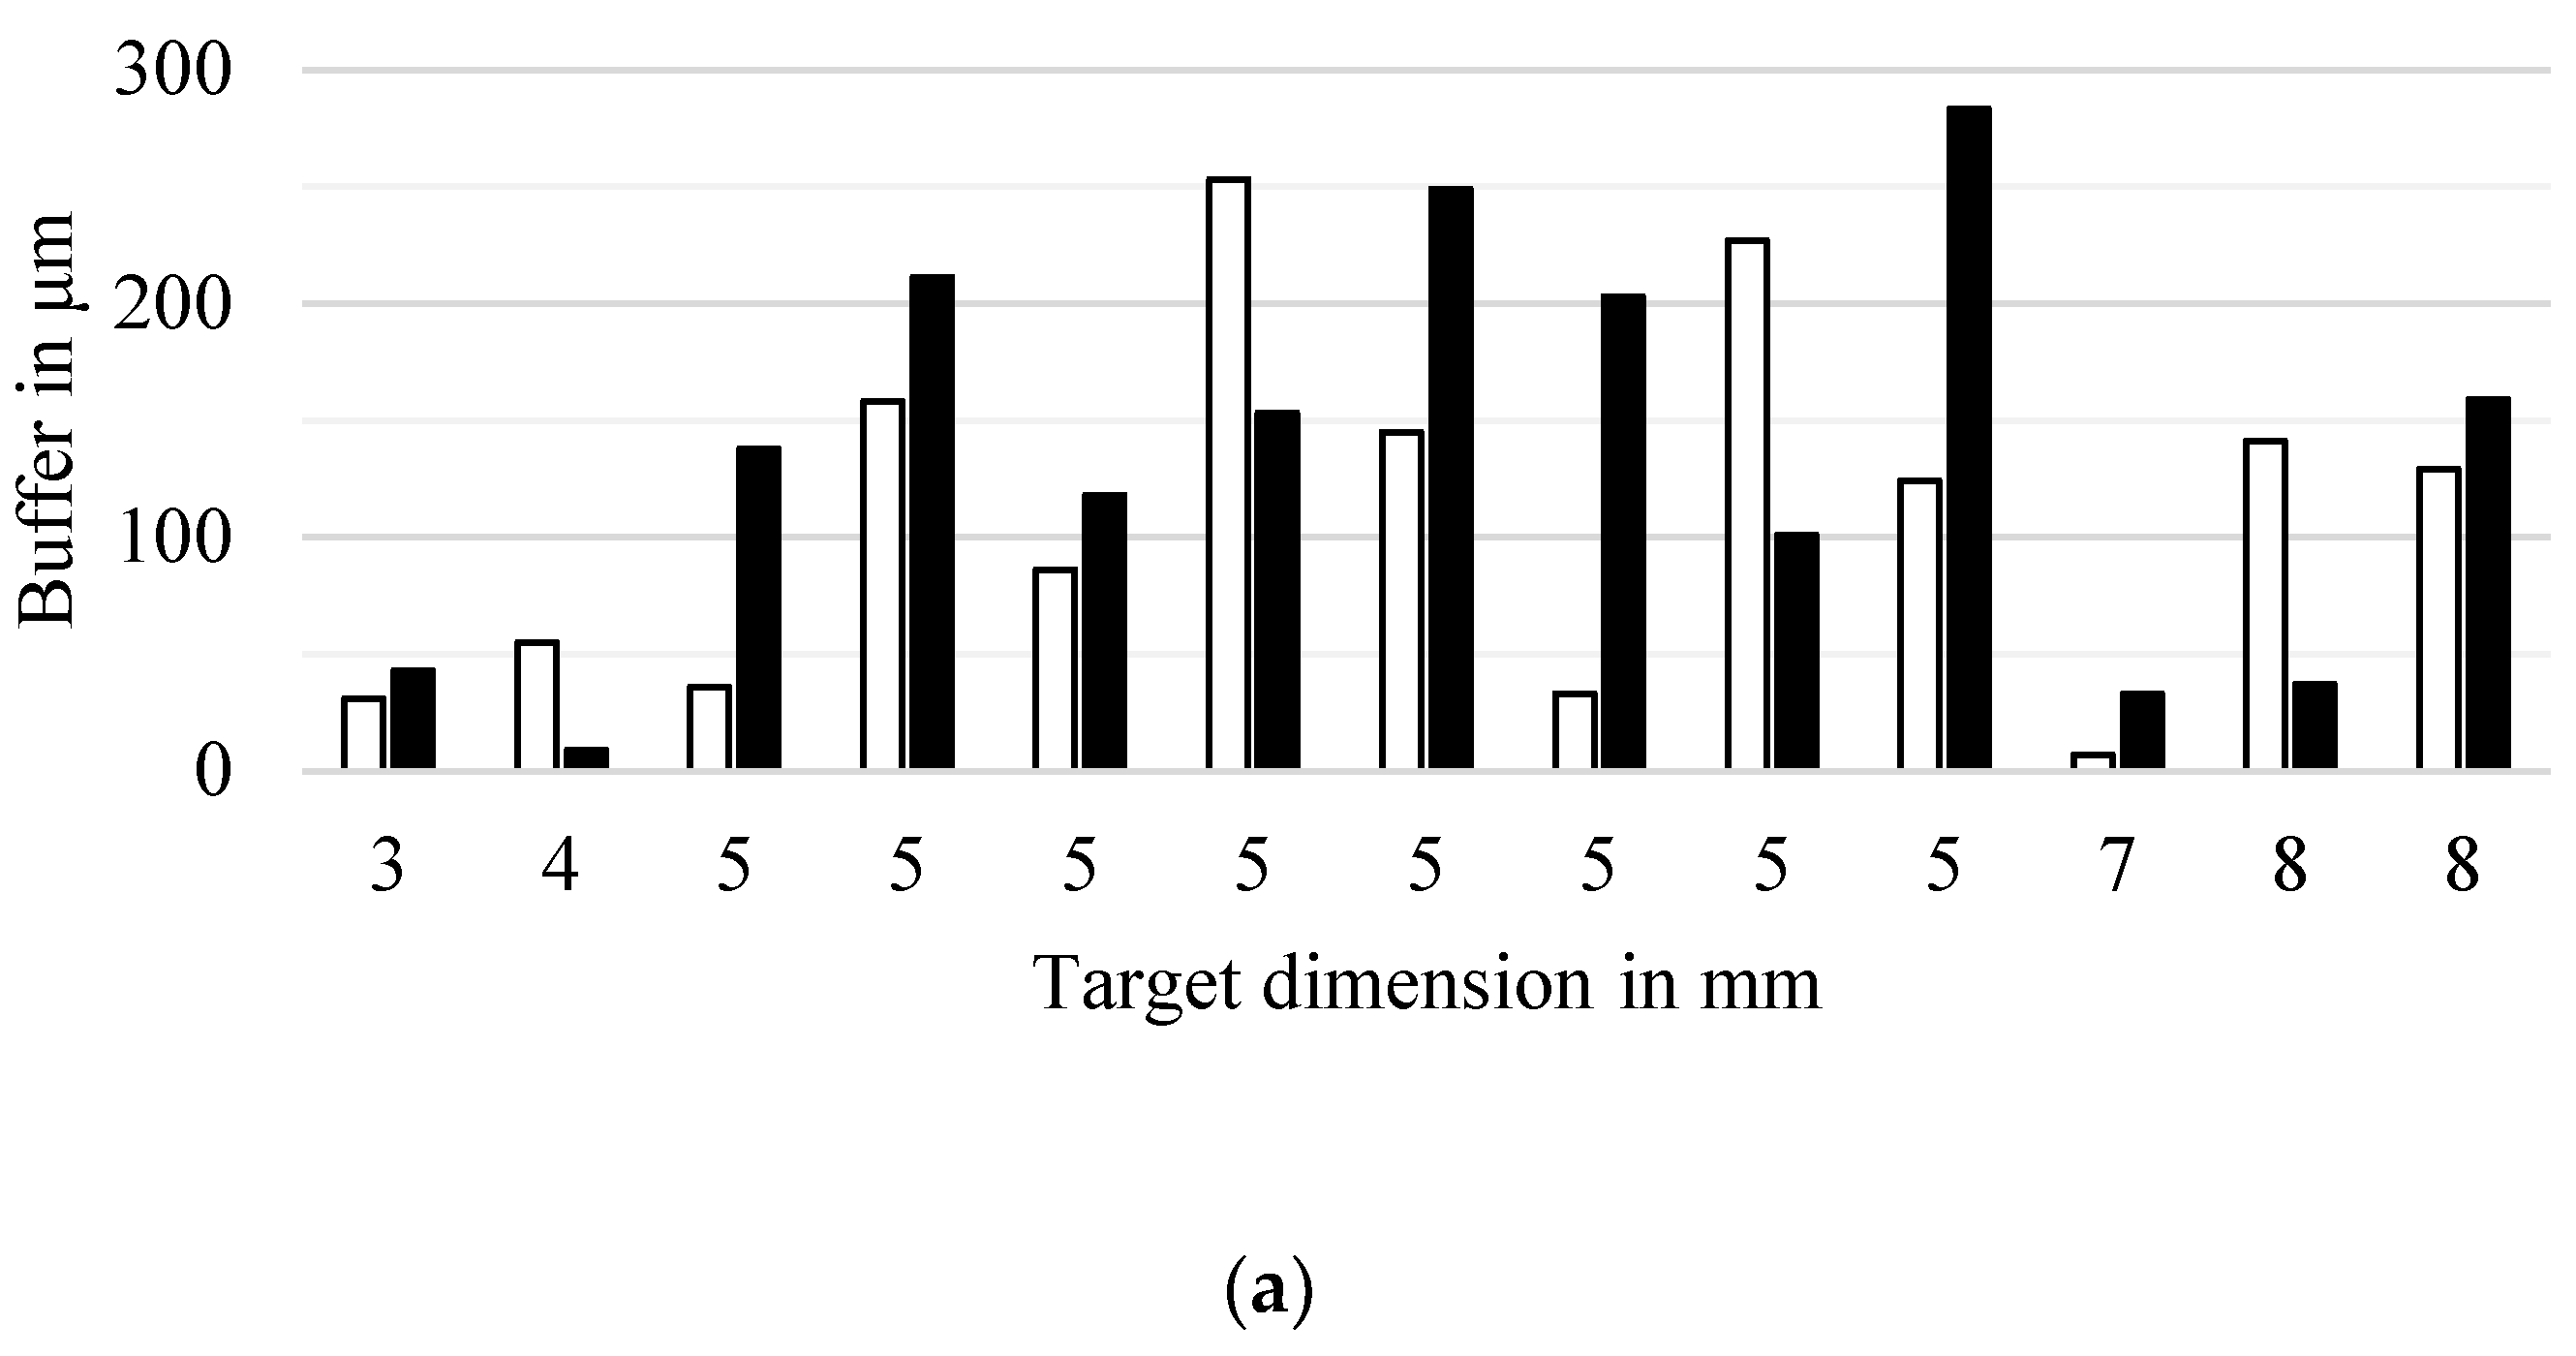
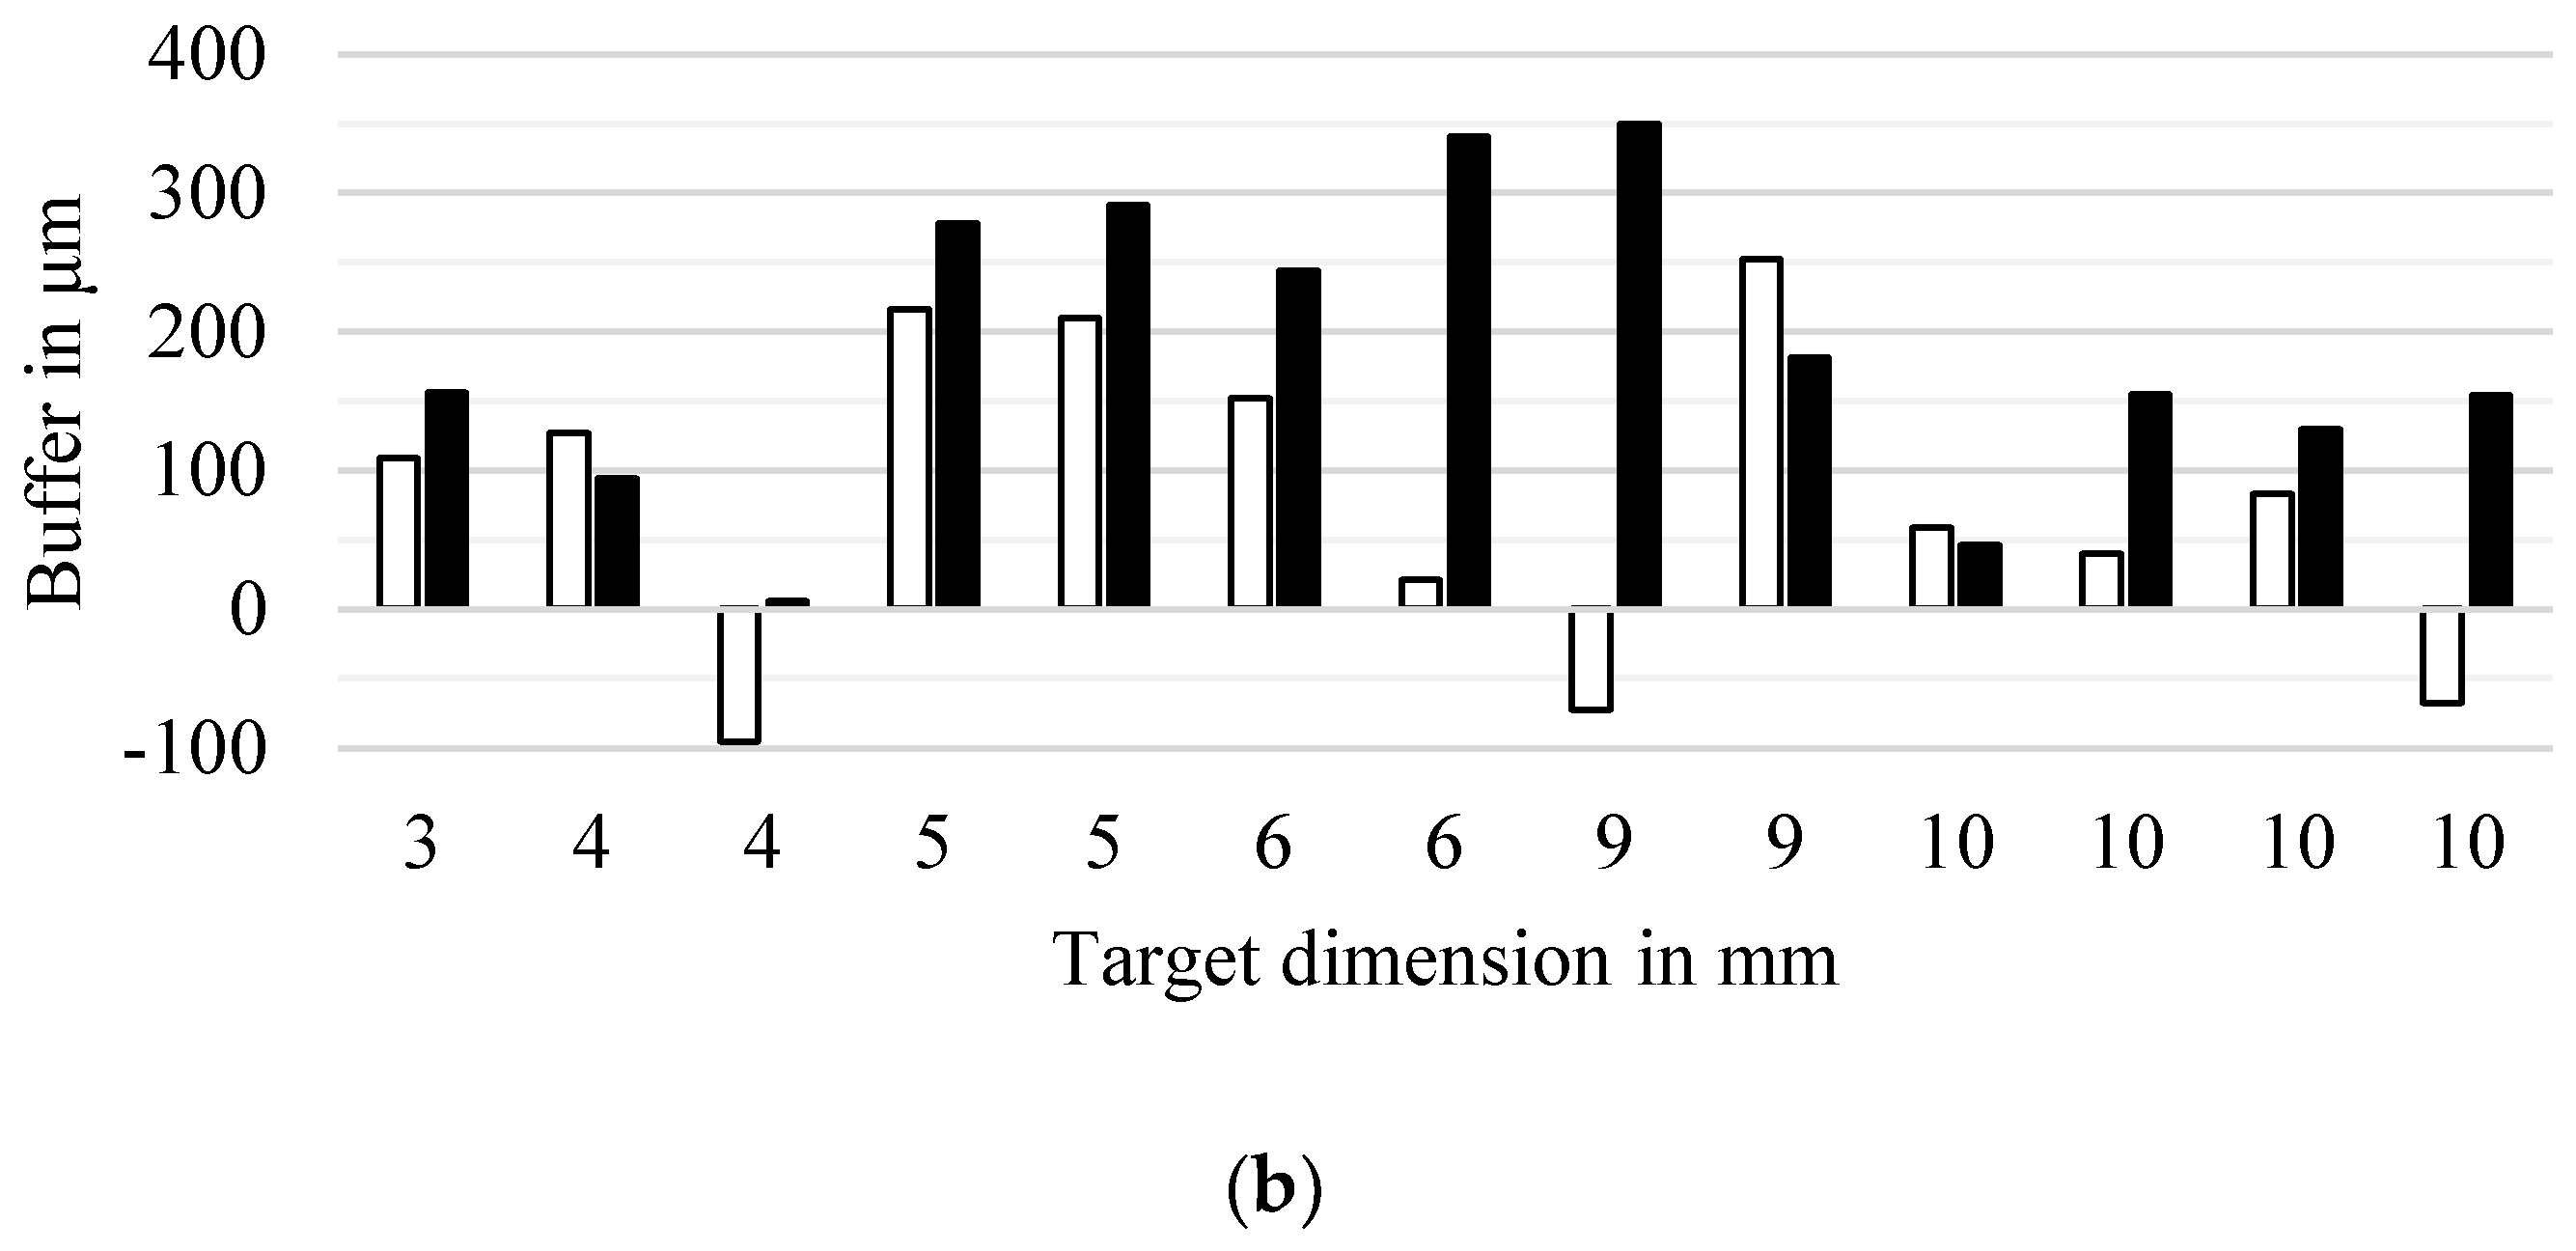
Appendix A. In the case of the stencil, both parameter sets achieved the required quality. However, the prediction-based parameter optimization reduced the print time by 49% compared to the standard parameter sets. In the case of the holder, the printed part of the standard parameter sets did not achieve the quality requirements. A 4 mm and a 9 mm distance exceeded the tolerance. In contrast, the part of the prediction-based methodology achieved the quality requirements. The optimized parameter set resulted in a higher material consumption (+13%).
The performed use cases showed that the developed procedure can be applied to ensure that the required quality is met by still optimizing print time or material consumption. In both tested examples the parameter optimization outperformed standard sets, either by meeting the quality requirements or by reducing the optimization factor.
4.4. Critical Appraisal and Limitations
The presented methodology has its limitations arising from the prediction models, simplifications and the chosen procedure. These are discussed in the following.
The methodology is widely applicable, yet it is linked to existing prediction models. If prediction models do not exist for the intended application, models must first be developed. This depends on the observed quality characteristics and used process parameters, material and printer of the use-case. The used prediction models have limitations that influence the determination procedure—e.g., prediction inaccuracies, considered quality characteristics, considered parameters and chosen parameter limits. Additionally, it is hardly possible to integrate models with unmatching process parameters into existing models. However, prediction approaches are widely applicable and transfer learning enables the use of existing models and their data for similar use cases. Such concepts can encounter the described downsides.
The methodology itself has limitations separately from the prediction models. First, the solution space is influenced by the stepwise parameter representation in the lookup table. This can be excluded by predicting each value, which is possible yet accompanied by a data increase and a higher data handling effort. In contrast, covering the parameter space too thinly may lead to poor optimization results. The assurance that the part quality of the optimized process parameters is within the intended limits depends on the safety factor. The choice of this factor is a trade-off between the freedom of optimization and the risk of exceeding the limits. Future research aiming at optimizing the safety factor seems promising. It is recommended to aim for a buffer that is as small as possible while still guaranteeing that the predicted quality characteristic is satisfied by the resulting part.
A further limitation is the assumption of the print time and material consumption. It is based on an exemplary part and not the actual part. This can be eliminated by connecting the slicer data with the used methodology.
A further limitation is the need for quantified quality requirements. This is not a basic condition in the current state, since in many cases the best possible part quality is aimed for, especially in the background of uncertain part quality. Therefore, it is necessary to quantify the required quality beforehand, in order to yield the full potential of the presented methodology.
Further limitations of this paper are caused by the research design focusing on MEX, PETG material and the investigated part-quality characteristics—tensile strength, linear dimensional accuracy and surface roughness.
However, the methodology is transferable to other materials, quality characteristics and additive processes, as prediction models exist in these areas. Thus, the developed methodology is universally applicable, yet there are limiting factors, especially data scarcity. It is not assumed that these limitations drastically limit the applicability of the methodology, as the application to two use cases has shown.
5. Conclusions
In this paper, a methodology was presented to enable predictive quality assurance in the pre-processing of material extrusion (MEX). The procedure is based on prediction models and was tested and applied to two use-cases.
Overall, this paper showed that with the results of this work, a MEX process is enabled that ensures part quality—with a certain amount of trustworthiness—and prevents timely and costly manufacturing loops. The performed tests and presented use cases showed the applicability of the methodology for quality assurance in pre-processing. The methodology can be easily integrated into existing workflows and helps both untrained and skilled operators to make a well-founded selection of process parameters. Thanks to the developed methodology, no programming knowledge is required from the operator and the process can be performed quickly and variably. In addition, the developed methodology can be easily extended as more models with relevant quality characteristics become available. Determined parameter sets are optimized based on part quality, print time and material consumption following the three dimensions of the iron triangle. The trustworthiness of the prediction depends on the chosen safety factor. In this paper, the 0.95 percentile was used. This work bridges the gap between research and practice and allows companies to benefit from the progress of quality prediction in MEX. This work also helps to qualify MEX for stressed parts.
We plan to further expand the methodology for other quality characteristics. Future work will focus on the evaluation of alternative safety factors, e.g., fix values or calculations based on the mean absolute error (MAE). In addition, an investigation of the trade-off between the optimization freedom and safety factor is planned. Another focus is the implementation of the presented methodology in industrial practice with the help of corporate partners. Besides improving the methodology, the authors of this research aim to predict other quality characteristics in order to expand the capabilities of the methodology.
Author Contributions
Conceptualization and methodology, C.S., R.G., J.T.S. and F.F.; formal analysis, data curation, writing—original draft preparation, C.S.; writing—review and editing, C.S., R.G., J.T.S. and F.F.; visualization, C.S. All authors have read and agreed to the published version of the manuscript.
Funding
This research received no external funding.
Data Availability Statement
Data from this paper are available upon request from the authors.
Conflicts of Interest
The authors declare no conflicts of interest.
Appendix A
Figure A1.
Buffer achieved by the parameter set selected by machine operator (white) and the developed determination methodology (black) for the use-cases of (a) stencil and (b) holder.
Figure A1.
Buffer achieved by the parameter set selected by machine operator (white) and the developed determination methodology (black) for the use-cases of (a) stencil and (b) holder.
References
- The Association of German Engineers. Additive Manufacturing Processes, Rapid Manufacturing: Basics, Definitions, Processes; Verein Deutscher Ingenieure: Harzgerode, Germany, 2014. [Google Scholar]
- Gebhardt, A.; Kessler, J.; Thurn, L. 3D-Drucken: Grundlagen und Anwendungen des Additive Manufacturing (AM), 2nd ed.; Hanser: München, Germany, 2016. [Google Scholar]
- Singh, R.; Singh, S.; Singh, I.P.; Fabbrocino, F.; Fraternali, F. Investigation for surface finish improvement of FDM parts by vapor smoothing process. Compos. Part B Eng. 2017, 111, 228–234. [Google Scholar] [CrossRef]
- Kastner, T.; Troschitz, J.; Vogel, C.; Behnisch, T.; Gude, M.; Modler, N. Investigation of the Pull-Out Behaviour of Metal Threaded Inserts in Thermoplastic Fused-Layer Modelling (FLM) Components. J. Manuf. Mater. Process. 2023, 7, 42. [Google Scholar] [CrossRef]
- Dey, A.; Yodo, N. A Systematic Survey of FDM Process Parameter Optimization and Their Influence on Part Characteristics. J. Manuf. Mater. Process. 2019, 3, 64. [Google Scholar] [CrossRef]
- DIN EN ISO/ASTM 52921; Standard Terminology for Additive Manufacturing: Coordinate Systems and Test Methodologies. DIN German Institute for Standardization: Berlin, Germany, 2019.
- Soto, J.; Melin, P.; Castillo, O. Ensembles of Type 2 Fuzzy Neural Models and Their Optimization with Bio-Inspired Algorithms for Time Series Prediction; Springer eBook Collection Engineering; Springer: Cham, Switzerland, 2018. [Google Scholar]
- Deshwal, S.; Kumar, A.; Chhabra, D. Exercising hybrid statistical tools GA-RSM, GA-ANN and GA-ANFIS to optimize FDM process parameters for tensile strength improvement. CIRP J. Manuf. Sci. Technol. 2020, 31, 189–199. [Google Scholar] [CrossRef]
- Tura, A.D.; Lemu, H.G.; Mamo, H.B.; Santhosh, A.J. Prediction of tensile strength in fused deposition modeling process using artificial neural network and fuzzy logic. Prog. Addit. Manuf. 2022, 8, 529–539. [Google Scholar] [CrossRef]
- Grozav, S.D.; Sterca, A.D.; Kočiško, M.; Pollák, M.; Ceclan, V. Feasibility of Predictive Models for the Quality of Additive Manufactured Components Based on Artificial Neural Networks. Machines 2022, 10, 128. [Google Scholar] [CrossRef]
- Bayraktar, Ö.; Uzun, G.; Çakiroğlu, R.; Guldas, A. Experimental study on the 3D-printed plastic parts and predicting the mechanical properties using artificial neural networks. Polym. Adv. Technol. 2016, 28, 1044–1051. [Google Scholar] [CrossRef]
- Yadav, D.; Chhabra, D.; Garg, R.K.; Ahlawat, A.; Phogat, A. Optimization of FDM 3D printing process parameters for multi-material using artificial neural network. Mater. Today Proc. 2019, 21, 1583–1591. [Google Scholar] [CrossRef]
- Schmidt, C.; Berchtold, F.; Griesbaum, R.; Sehrt, J.T.; Finsterwalder, F. Predicting tensile strength of material extrusion parts during the pre-process using neural networks. Int. J. Adv. Manuf. Technol. 2023, 128, 5129–5138. [Google Scholar] [CrossRef]
- Sood, A.K.; Ohdar, R.; Mahapatra, S. Improving dimensional accuracy of Fused Deposition Modelling processed part using grey Taguchi method. Mater. Des. 2009, 30, 4243–4252. [Google Scholar] [CrossRef]
- Mohamed, O.A.; Masood, S.H.; Bhowmik, J.L. Experimental investigation for dynamic stiffness and dimensional accuracy of FDM manufactured part using IV-Optimal response surface design. Rapid Prototyp. J. 2017, 23, 736–749. [Google Scholar] [CrossRef]
- Sahu, R.K.; Mahapatra, S.; Sood, A.K. A Study on Dimensional Accuracy of Fused Deposition Modeling (FDM) Processed Parts using Fuzzy Logic. J. Manuf. Sci. Prod. 2013, 13, 183–197. [Google Scholar] [CrossRef]
- Boschetto, A.; Bottini, L. Accuracy prediction in fused deposition modeling. Int. J. Adv. Manuf. Technol. 2014, 73, 913–928. [Google Scholar] [CrossRef]
- Vyavahare, S.; Kumar, S.; Panghal, D. Experimental study of surface roughness, dimensional accuracy and time of fabrication of parts produced by fused deposition modelling. RPJ 2020, 26, 1535–1554. [Google Scholar] [CrossRef]
- Yang, H.D.; Zhang, S. Precision prediction model in FDM by the combination of genetic algorithm and BP neural network algorithm. J. Meas. Eng. 2017, 5, 134–141. [Google Scholar] [CrossRef]
- Mohamed, O.A.; Masood, S.H.; Bhowmik, J.L. Modeling, analysis, and optimization of dimensional accuracy of FDM-fabricated parts using definitive screening design and deep learning feedforward artificial neural network. Adv. Manuf. 2021, 9, 115–129. [Google Scholar] [CrossRef]
- Sharma, P.; Vaid, H.; Vajpeyi, R.; Shubham, P.; Agarwal, K.M.; Bhatia, D. Predicting the dimensional variation of geometries produced through FDM 3D printing employing supervised machine learning. Sensors Int. 2022, 3, 100194. [Google Scholar] [CrossRef]
- Schmidt, C.; Funk, J.; Griesbaum, R.; Sehrt, J.T.; Finsterwalder, F. Predicting Linear Dimensional Accuracy of Material Extrusion Parts in Dependence of Process Parameters Using Neural Networks Optimized by an Evolutionary Algorithm. In 3D Printing and Additive Manufacturing: Special Issue on Artificial Intelligence and Additive Fabrication; Mary Ann Liebert, Inc.: Larchmont, NY, USA, 2024. [Google Scholar]
- Ahn, D.K.; Kim, H.C.; Lee, S.H. Determination of fabrication direction to minimize post-machining in FDM by prediction of non-linear roughness characteristics. J. Mech. Sci. Technol. 2005, 19, 144–155. [Google Scholar] [CrossRef]
- Ahn, D.; Kim, H.; Lee, S. Surface roughness prediction using measured data and interpolation in layered manufacturing. J. Am. Acad. Dermatol. 2009, 209, 664–671. [Google Scholar] [CrossRef]
- Rahmati, S.; Vahabli, E. Evaluation of analytical modeling for improvement of surface roughness of FDM test part using measurement results. Int. J. Adv. Manuf. Technol. 2015, 79, 823–829. [Google Scholar] [CrossRef]
- Barrios, J.M.; Romero, P.E. Decision Tree Methods for Predicting Surface Roughness in Fused Deposition Modeling Parts. Materials 2019, 12, 2574. [Google Scholar] [CrossRef]
- Sohnius, F.; Schlegel, P.; Ellerich, M.; Schmitt, R.H. Data-driven Prediction of Surface Quality in Fused Deposition Modeling using Machine Learning. In Production at the Leading Edge of Technology; Wulfsberg, J.P., Hintze, W., Behrens, B.-A., Eds.; Springer: Berlin/Heidelberg, Germany, 2019; pp. 473–481. [Google Scholar]
- Molero, E.; Fernández, J.J.; Rodríguez-Alabanda, O.; Guerrero-Vaca, G.; Romero, P.E. Use of Data Mining Techniques for the Prediction of Surface Roughness of Printed Parts in Polylactic Acid (PLA) by Fused Deposition Modeling (FDM): A Practical Application in Frame Glasses Manufacturing. Polymers 2020, 12, 840. [Google Scholar] [CrossRef] [PubMed]
- Cerro, A.; Romero, P.E.; Yiğit, O.; Bustillo, A. Use of machine learning algorithms for surface roughness prediction of printed parts in polyvinyl butyral via fused deposition modeling. Int. J. Adv. Manuf. Technol. 2021, 115, 2465–2475. [Google Scholar] [CrossRef]
- Boschetto, A.; Giordano, V.; Veniali, F. Surface roughness prediction in fused deposition modelling by neural networks. Int. J. Adv. Manuf. Technol. 2013, 67, 2727–2742. [Google Scholar] [CrossRef]
- Vahabli, E.; Rahmati, S. Application of an RBF neural network for FDM parts’ surface roughness prediction for enhancing surface quality. Int. J. Precis. Eng. Manuf. 2016, 17, 1589–1603. [Google Scholar] [CrossRef]
- Vahabli, E.; Rahmati, S. Improvement of FDM parts’ surface quality using optimized neural networks—Medical case studies. Rapid Prototyp. J. 2017, 23, 825–842. [Google Scholar] [CrossRef]
- Saad, M.S.; Nor, A.M.; Rahim, I.A.; Syahruddin, M.A.; Darus, I.Z.M. Optimization of FDM process parameters to minimize surface roughness with integrated artificial neural network model and symbiotic organism search. Neural Comput. Appl. 2022, 34, 17423–17439. [Google Scholar] [CrossRef]
- Otte, R.; Wippermann, B.; Schade, S.; Otte, V. Von Data Mining bis Big Data: Handbuch für die industrielle Praxis: Inklusive Small Data und Mind Data; Hanser: München, Germany, 2020; Available online: https://www.hanser-elibrary.com/doi/book/10.3139/9783446457171 (accessed on 19 February 2024).
- Wittpahl, V. Künstliche Intelligenz; Springer: Berlin/Heidelberg, Germany, 2019. [Google Scholar]
- Silaparasetty, N. Machine Learning Concepts with Python and the Jupyter Notebook Environment; Apress: Berkeley, CA, USA, 2020. [Google Scholar]
- Géron, A. Hands-on Machine Learning with Scikit-Learn, Keras, and TensorFlow: Concepts, Tools, and Techniques to Build Intelligent Systems; COVID-19 Collection; O’Reilly: Beijing, China; Boston, MA, USA; Farnham, UK; Sebastopol, CA, USA; Tokyo, Japan, 2019. [Google Scholar]
- Bergstra, J.; Bengio, Y. Random search for hyper-parameter optimization. J. Mach. Learn. Res. 2012, 13, 281–305. [Google Scholar]
- Reeves, C.R. Genetic Algorithms. In Encyclopedia of Database Systems; Liu, L., Özsu, M.T., Eds.; Springer: New York, NY, USA, 2016; pp. 1–5. [Google Scholar]
- Pajankar, A.; Joshi, A. Hands-on Machine Learning with Python; Apress: Berkeley, CA, USA, 2022. [Google Scholar]
- DIN EN ISO 527-1; Plastics—Determination of Tensile Properties—Part 1: General Principles. DIN German Institute for Standardization: Berlin, Germany, 2019.
- DIN EN ISO 3167; Plastics—Multipurpose Test Specimens. DIN German Institute for Standardization: Berlin, Germany, 2014.
- Schmidt, C.; Morlock, A.; Griesbaum, R.; Sehrt, J.T.; Finsterwalder, F. Investigation of Part Quality Achieved by Material Extrusion Printers in Relation to Their Price. J. Manuf. Mater. Process. 2023, 7, 152. [Google Scholar] [CrossRef]
- DIN EN ISO 21920-1; Geometrical Product Specifications (GPS)—Surface Texture: Profile—Part 1: Indication of Surface Texture. DIN German Institute for Standardization: Berlin, Germany, 2022.
Figure 1.
Sketch of a material extrusion printer.
Figure 1.
Sketch of a material extrusion printer.
Figure 2.
Visualization of process parameters: (a) sketch of build orientations, (b) sketch of an extruded layer and (c) visualization of the structure of a material extrusion part.
Figure 2.
Visualization of process parameters: (a) sketch of build orientations, (b) sketch of an extruded layer and (c) visualization of the structure of a material extrusion part.
Figure 3.
Illustration of a neural network.
Figure 3.
Illustration of a neural network.
Figure 4.
Visualization of data splitting into training and test data in the case of using cross validation.
Figure 4.
Visualization of data splitting into training and test data in the case of using cross validation.
Figure 5.
Tensile strength sample: (a) dimension and (b) central positioning.
Figure 5.
Tensile strength sample: (a) dimension and (b) central positioning.
Figure 6.
Dimensional accuracy sample.
Figure 6.
Dimensional accuracy sample.
Figure 7.
Surface roughness sample and naming of the surfaces.
Figure 7.
Surface roughness sample and naming of the surfaces.
Figure 8.
Procedure for use-case-specific determination of parameter sets.
Figure 8.
Procedure for use-case-specific determination of parameter sets.
Figure 9.
Solution space considering print time, material consumption and tensile strength.
Figure 9.
Solution space considering print time, material consumption and tensile strength.
Figure 10.
Solution space for linear dimensional accuracy in X-, Y- and Z-directions for a targeted distance of (a) 2500 μm and (b) 8000 μm.
Figure 10.
Solution space for linear dimensional accuracy in X-, Y- and Z-directions for a targeted distance of (a) 2500 μm and (b) 8000 μm.
Figure 11.
Solution space of surface roughness (a) of 45-°degree build up (surface 1) and a vertical oriented surface (surface 2) and (b) according to layer thickness.
Figure 11.
Solution space of surface roughness (a) of 45-°degree build up (surface 1) and a vertical oriented surface (surface 2) and (b) according to layer thickness.
Figure 12.
Buffer of the test parts for (a) tensile strength, (b) surface roughness and (c) linear dimensional accuracy.
Figure 12.
Buffer of the test parts for (a) tensile strength, (b) surface roughness and (c) linear dimensional accuracy.
Figure 13.
Parts for process parameter determination: (a) a stencil for labeling and (b) a holder for electronics.
Figure 13.
Parts for process parameter determination: (a) a stencil for labeling and (b) a holder for electronics.
Table 1.
Considered hyperparameters for tuning.
Table 1.
Considered hyperparameters for tuning.
| Parameter | Values | Parameter | Values |
|---|
| Neurons | 32, 64, 128 | Batch size | None, 8, 16, 32 |
| Batch normalization | False, True | Optimizer | Adam, RMSprop, SGD |
| Dropout | None, 0.05, 0.1, 0.5, 0.8 | Learning rate | 0.01, 0.001, 0.0001, |
| Epochs | 200 | Activation function | ReLu |
Table 2.
Used process parameters.
Table 2.
Used process parameters.
| Parameter | Prusa i3 MK3s |
|---|
| Minimum | Middle | Maximum |
|---|
| Infill density in % | 20 | 50 | 80 |
| Layer thickness in mm | 0.1 | 0.2 | 0.3 |
| Nozzle temperature in °C | 230 | 240 | 250 |
| Number of shells in layers | 2 | 4 | 6 |
| Print speed mode | Quality | Medium | Speed |
Table 3.
Used speed modes.
Table 3.
Used speed modes.
| | Prusa i3 MK3s |
|---|
| Print Speed at … | Quality Mode | Medium Mode | Speed Mode |
|---|
| Contours | 45 mm/s | 52.5 mm/s | 60 mm/s |
| Thin outer contours | 25 mm/s | 25 mm/s | 25 mm/s |
| Outer contours | 25 mm/s | 30 mm/s | 35 mm/s |
| Infill | 80 mm/s | 140 mm/s | 200 mm/s |
Table 4.
Prediction accuracy of used neural network models for each quality characteristic, print time and material consumption.
Table 4.
Prediction accuracy of used neural network models for each quality characteristic, print time and material consumption.
| Quality Characteristic | MAPE | MAE | RMSE |
|---|
| Tensile strength in XYZ-orientation | 2.54% | 0.76 N/mm2 | 1.13 N/mm2 |
| Dimensional accuracy in X-direction | 0.69% | 39.42 μm | 52.06 μm |
| Dimensional accuracy in Y-direction | 0.71% | 39.32 μm | 51.70 μm |
| Dimensional accuracy in Z-direction | 2.21% | 135.31 μm | 161.49 μm |
| Surface roughness for a 45-degree build up | 4.05% | 0.50 μm | 0.61 μm |
| Surface roughness for a horizontal wall in XY-plane | 7.21% | 1.32 μm | 2.52 μm |
| Print time | 2.42% | 1.08 min | 1.54 min |
| Material consumption | 0.97% | 0.08 g | 0.11 g |
Table 5.
Representation of process parameters for the determination procedure.
Table 5.
Representation of process parameters for the determination procedure.
| Parameter | Minimum | Maximum | Values Steps | Count of Parameter Values |
|---|
| Infill density | 20% | 80% | 5% | 13 |
| Layer thickness | 0.1 mm | 0.3 mm | 0.1mm | 3 |
| Nozzle temperature | 230 °C | 250 °C | 1 °C | 21 |
| Number of shells | 2 layers | 6 layers | 1 layer | 5 |
| Print speed mode | Quality | Speed | 1 middle value | 3 |
Table 6.
Used exemplary quality requirements and optimization factor.
Table 6.
Used exemplary quality requirements and optimization factor.
| Test ID | Tensile Strength in N/mm2 | Surface Roughness in μm | Linear Absolute Deviation in Percent of Target Dimension | Material
Consumption | Print Time |
|---|
| Surface 1 | Surface 2 and 5 | X- and Y-
Direction | Z-Direction |
|---|
| T1 | >23 | <14 | <10 | n.spec. | n.spec. | n.spec. | |
| T2 | >30 | <15 | <15 | 5% | 5% | | n.spec. |
| T3 | >18 | <30 | <12 | 6% | n.spec. | | n.spec. |
| T4 | | <22 | <24 | 4% * | 4% * | n.spec. | n.spec. |
Table 7.
Determined parameter sets from developed methodology.
Table 7.
Determined parameter sets from developed methodology.
| Parameter | T1 | T2 | T3 | T4 |
|---|
| Infill density in % | 20 | 20 | 20 | 40 |
| Layer thickness in mm | 0.1 | 0.1 | 0.1 | 0.1 |
| Nozzle temperature in °C | 232 | 243 | 243 | 249 |
| Number of shells | 4 | 6 | 3 | 6 |
| Print speed mode | speed | speed | speed | speed |
Table 8.
Requirements of the considered use cases.
Table 8.
Requirements of the considered use cases.
| Part | Requirements |
|---|
| Stencil | Squares on the top left and top right ±0.3 mm; 3 mm space holder between squares ±0.2 mm; distances with 7 and 4 mm ±0.3 mm; print time should be as short as possible |
| Holder | Outer walls ±0.3 mm; inner wall ±0.2 mm; holed squares on top and within the part ±0.5 mm; distance of squares to middle wall ±0.2 mm; material consumption should be as low as possible (weight reduction) |
Table 9.
Comparison of the previous and optimized parameter sets for the investigated use cases.
Table 9.
Comparison of the previous and optimized parameter sets for the investigated use cases.
| | Stencil | Holder |
|---|
| Requirements | Parameter Sets Determined by … | Δ in % | Parameter Sets Determined by … | Δ in % |
|---|
Machine
Operator | Developed
Methodology | Machine
Operator | Developed
Methodology |
|---|
| Sufficient quality? | Yes | Yes | - | No | Yes | - |
| Print time | 177 min | 90 min | –49% | 145 min | 61 min | –58% |
| Material consumption | 19.5 g | 24.9 g | +28% | 15.6 g | 17.7 g | +13% |
| Disclaimer/Publisher’s Note: The statements, opinions and data contained in all publications are solely those of the individual author(s) and contributor(s) and not of MDPI and/or the editor(s). MDPI and/or the editor(s) disclaim responsibility for any injury to people or property resulting from any ideas, methods, instructions or products referred to in the content. |
© 2024 by the authors. Licensee MDPI, Basel, Switzerland. This article is an open access article distributed under the terms and conditions of the Creative Commons Attribution (CC BY) license (https://creativecommons.org/licenses/by/4.0/).


