Review

INCONEL® Alloy Machining and Tool Wear Finite Element Analysis Assessment: An Extended Review

by
André F. V. Pedroso
1,
Naiara P. V. Sebbe
1,2,
Rúben D. F. S. Costa
2,3,
Marta L. S. Barbosa
2,
Rita C. M. Sales-Contini
1,4,
Francisco J. G. Silva
1,3,*,
Raul D. S. G. Campilho
1,3 and
Abílio M. P. de Jesus
2,3
1
CIDEM, ISEP, Polytechnic of Porto, Rua Dr. António Bernardino de Almeida, 4249-015 Porto, Portugal
2
Department of Mechanical Engineering, Faculty of Engineering, University of Porto, Rua Dr. Roberto Frias 400, 4200-465 Porto, Portugal
3
LAETA-INEGI, Associate Laboratory for Energy, Transports and Aerospace, Rua Dr. Roberto Frias 400, 4200-465 Porto, Portugal
4
Technological College of São José dos Campos, Centro Paula Souza, Avenida Cesare Mansueto Giulio Lattes, 1350 Distrito Eugênio de Melo, São José dos Campos 12247-014, Brazil
*
Author to whom correspondence should be addressed.
J. Manuf. Mater. Process. 2024, 8(1), 37; https://doi.org/10.3390/jmmp8010037
Submission received: 19 January 2024 / Revised: 5 February 2024 / Accepted: 7 February 2024 / Published: 9 February 2024

Abstract

:
Machining INCONEL® presents significant challenges in predicting its behaviour, and a comprehensive experimental assessment of its machinability is costly and unsustainable. Design of Experiments (DOE) can be conducted non-destructively through Finite Element Analysis (FEA). However, it is crucial to ascertain whether numerical and constitutive models can accurately predict INCONEL® machining. Therefore, a comprehensive review of FEA machining strategies is presented to systematically summarise and analyse the advancements in INCONEL® milling, turning, and drilling simulations through FEA from 2013 to 2023. Additionally, non-conventional manufacturing simulations are addressed. This review highlights the most recent modelling digital solutions, prospects, and limitations that researchers have proposed when tackling INCONEL® FEA machining. The genesis of this paper is owed to articles and books from diverse sources. Conducting simulations of INCONEL® machining through FEA can significantly enhance experimental analyses with the proper choice of damage and failure criteria. This approach not only enables a more precise calibration of parameters but also improves temperature (T) prediction during the machining process, accurate Tool Wear (TW) quantity and typology forecasts, and accurate surface quality assessment by evaluating Surface Roughness (SR) and the surface stress state. Additionally, it aids in making informed choices regarding the potential use of tool coatings.

1. Introduction

1.1. Material Numerical Modelling

INCONEL® alloys are hard-to-cut metals that pose machinability challenges yet to be overcome [1]. An application upsurge for these Ni-superalloys has been observed across several industries, including aeronautics, automotive, and energy power plants [2]. Renowned for their ability to withstand high temperatures (T) without succumbing to creep, these superalloys proved to be highly attractive and well suited for producing items like jet engines and steam turbines. Following the work of Pedroso et al. [2] and Thornton et al. [3], it becomes evident that understanding the chip formation mechanism is one of the crucial factors that will lead to a comprehensive understanding of the entire cutting process in conventional manufacturing (CM) [4,5]. When a material exceeds its yield point (σy, yield stress), it experiences a strain-hardening phenomenon, leading to increased load and energy [6] required for material deformation [7]. Two hardening models address elastoplastic scenarios: (1) isotropic hardening, which refers to a material’s ability to uniformly increase its yield strength and stiffness under repeated loading without changing the shape or orientation of its yield surface [8], and (2) kinematic hardening, which, in turn, involves changes in the material’s yield surface shape and orientation, but not its size, in response to plastic deformation [9]. Understanding the depiction of material behaviour is paramount, particularly concerning how strain (ε), the strain rate ( ε ˙ ), and T impact the material’s flow stress (σ). Table 1 displays several integrated material constitutive models in use. For a better grasp of the additional variables outlined in Table 1, it is recommended to refer to the research by Iturbe et al. [10], Lewis et al. [11], Lin et al. [12], and Rudnytskyj et al. [13].
In FEA simulations [19,20,21,22], INCONEL® alloys are typically represented as materials exhibiting elastoplastic behaviour and isotropic hardening, with σ influenced by ε, ε ˙ , and T [23]. The prevalent analytical model used to reproduce the elastoplastic behaviour of INCONEL® alloys is the JC constitutive model [14,15,16,17,18]. The JC model has some derivations: (1) the Baumann–Chiesa–Johnson (BCJ) model [24], which incorporates ε ˙ and T sensitivity, as well as damage, through a yield surface [25], and (2) the Steinberg–Cochran–Guinan (SCG) model [26], which describes the shear modulus (G) and σy at high ε ˙ . Due to the inherent flaws of the JC model, as addressed in this section, some improvements have been developed, such as the derivations in [25,26,27]. The JC model is deemed a rate-independent constitutive model [28], along with the other models detailed in Table 1, and the expression for the stress in the JC constitutive model (σJC) is provided in Equation (1):
σ J C = A + B ε p n 1 + C ln ε ˙ p ε ˙ p 0 1 T T 0 T m T 0 m
where εp is the equivalent strain; ε ˙ p is the equivalent strain rate; ε ˙ p 0 is the reference strain rate; T0 is the ambient temperature; and Tm is the melting temperature. The yield stress (A), strain-hardening constant (B), modulus of strain rate hardening (C), strain-hardening coefficient (n), and thermal softening coefficient (m) [29,30] are material constants and exponents derived by fitting the data obtained from the tensile test, Split Hopkinson Pressure Bar (SHPB) test [30,31] (not following any agreed-upon standards regarding the operation or design of the apparatus), and dilatometer test under various T and ε ˙ . Equation (2) provides insight into the linear relationship between ln(σJCA) and ln(εp). In quasi-static conditions, viscous–plastic deformation and thermal softening hold little significance, resulting in this trivial expression:
σ J C = A + B ε p n ln σ J C A = n ln ε p + ln B
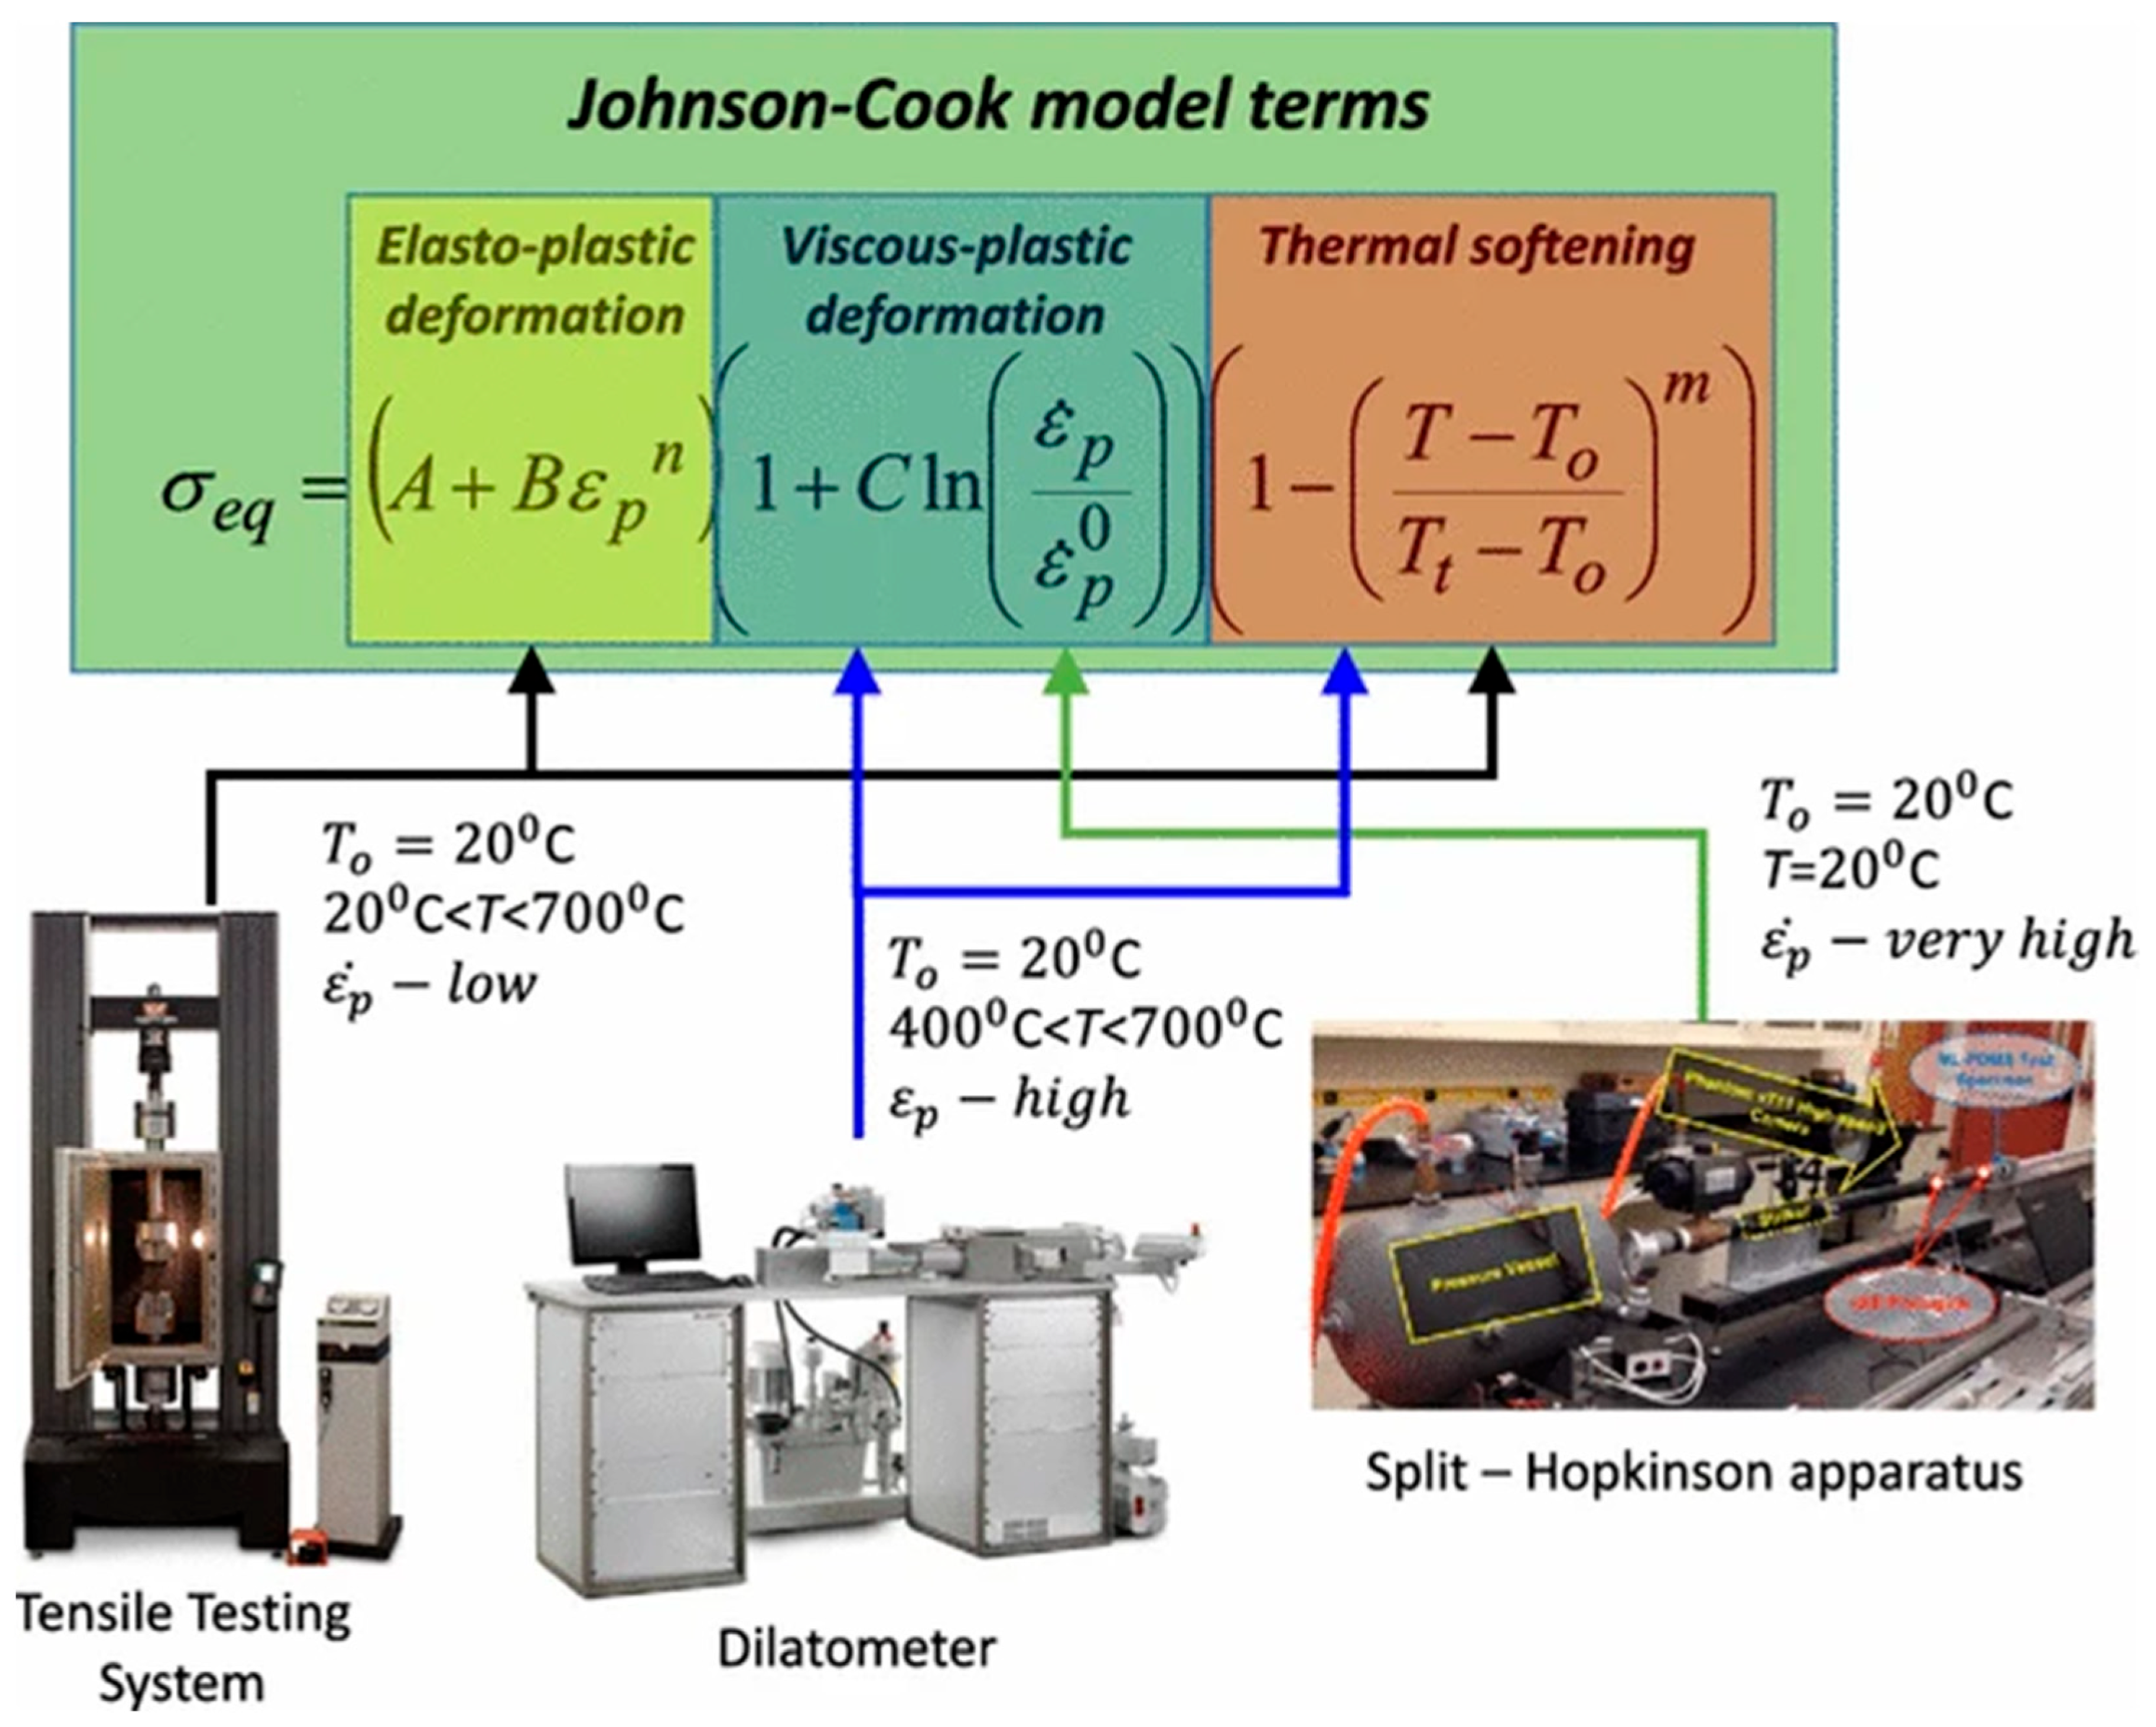
Figure 1 illustrates the JC constitutive model equation segregated into three phenomena, each associated with their specific experimental tests and conditions. In order to establish the A, B, C, m, and n constants of the JC model, an initial tensile test is conducted following ASTM A 370-17 [32] guidelines. As shown in Equation (3), the thermal softening effect is deemed negligible for determining C, leading to a rearranged expression. The value of C is derived through a linear regression model using different ε ˙ values obtained from the SHPB test [33].
σ J C = A + B ε p n 1 + C ln ε ˙ p ε ˙ p 0 σ J C A + B ε p n = 1 + C ln ε ˙ p ε ˙ p 0
The JC model can be reorganised to determine the m parameter, overlooking ε ˙ strengthening effects, as demonstrated in Equation (4) [33]. Estimating m involves performing the push-rod dilatometer test under ASTM E 228-17 [34], analysing the linear thermal expansion, and evaluating m in Equation (4) using the linear regression model graph [35].
σ J C = A + B ε p n 1 T T 0 T m T 0 m ln 1 σ J C A + B ε p n = m ln T T 0 T m T 0
The JC material model remains extensively employed in metal-cutting simulations [36]. Equation (1) describes strain-hardening (B × εpn) as an ascending function [37] that tends towards infinity and does not account for strain-softening effects [10]. Softening phenomena are crucial for instigating and amplifying the chip plastic state by forming adiabatic shear bands during machining operation simulations.
Figure 1. Subdivision of the JC constitutive model equation according to distinct deformation phenomena and the corresponding experimental trials and conditions [38].
Jmmp 08 00037 g001
In recent times, parameter determination has seen advancements, notably by Škrlec and Klemenc [39], who devised optimisation algorithms to streamline the determination of material constants for E185 structural steel. Murugesan and Jung [15] formulated surrogate models based on constitutive relations, and the model constants were estimated using experimental data. Souza, et al. [33] successfully predicted the behaviour of INCONEL® 625 by integrating the JC and Avrami models [40], as demonstrated in Equation (5), for the resulting stress (sJC + A):
σ J C + A = σ J C X σ s σ s s   f o r   ε > ε p
where σJC saturation stress (σs), the fraction of microstructure (X, 0 ≤ X ≤ 1) that underwent dynamic recrystallisation (DRX) [41], and the steady-state stress (σss) are acknowledged. The FEA-predicted behaviour surpassed the existing data in the material database. Lewis et al. [11] aimed to establish suitable constitutive models for simulating the mechanical behaviour of INCONEL® 625 components fabricated using Laser Powder Bed Fusion (LPBF) for aerospace applications. SHPB testing results were used to calculate the coefficients for five constitutive models: JC, modified JC, Hensel–Spittel, modified Hensel–Spittel, and modified Zerilli–Armstrong models. It was determined that the last model referred to has the lowest absolute relative error values of the models used: 2.88% for as-printed and 2.71% for annealed specimens. Hokka et al. [42] studied the mechanical behaviour of Ti-6246 and an INCONEL® 625-like alloy while obtaining JC material model parameters from the experimental data. The model was used to describe the plastic behaviour of the studied alloys in simulations of the orthogonal cutting of the material. The JC model for the INCONEL® 625-like alloy was improved by introducing an additional strain-softening term (ΔT in Equations (6) and (7)) that allowed a decrease in ε ˙ hardening at large deformations.
σ J C = A + B ε p n 1 + C ln ε ˙ p ε ˙ p 0 1 T + Δ T T 0 T m T 0 m
Δ T = β ρ C p 0 ε σ d ε
For better comprehension of the Equation (7) variables, it is suggested to consult Hokka et al. [42]. Table 2 provides the A, B, C, m, and n values for INCONEL® alloys. Notably, information is abundant regarding INCONEL® 718, while there is a dearth of information about the INCONEL® 625 alloy. Heat treatment is a variable that significantly influences JC model parameters [10]; hence, substantial variations can be observed between research groups, particularly for INCONEL® 718.
INCONEL® machinability modelling in FEA must rely on a proper damage evolution model. Since INCONEL® 718 and 625 present elastoplastic behaviour, as shown in Figure 2, from T0 through different T values until reaching T ≈ 1200 °C, a ductile material damage model is the most suitable [52,53,54,55,56,57,58] to predict the damage caused by machining.
In ductile materials, the ultimate failure unfolds through three distinct phases. While true-stress curves are attractive to study materials in some ways, FEA software works essentially with engineering stress curves, and in Figure 3, a typical uniaxial engineering σ-ε response for a ductile material is illustrated. Phase one is the linear behaviour of the elastic regime deformation that ends in B; in phase two, the material transitions into plastic deformation (curve BCDE), where C, or equivalent plastic strain at damage initiation ( ε ¯ 0 p ), is the point of damage (D) initiation in the plastic regime (D = 0, and cumulative damage parameter ω = 1). D is an intermediate point of damage evolution, and point E, a boundary between the plastic regime (phase two) and complete fracture (phase three), indicates the point of ε ¯ f p , and the straight line d’ depicts ε hardening [60].
The principle of damage classification in a plasticised material is the characterisation of a degraded Young’s modulus (E* in Equation (8)), which is a function of the pristine Young’s modulus (E), and degraded material flow stress, or mechanical strength (σ* in Equation (9)), which is calculated using the intact material flow stress ( σ ¯ ) [55].
E = ( 1 D ) E
σ = ( 1 D ) σ ¯
The JC shear fracture damage model [61,62] can forecast the D sustained by tracking the increment in equivalent plastic strain ( Δ ε ¯ p ) and equivalent plastic strain at fracture ( ε ¯ f p ). Equation (10) demonstrates the ω calculus, which is updated in every FEA solving step.
ω = Δ ε ¯ p ε ¯ f p
The material element removal criterion embedded within FEA programs, such as ABAQUS or ANSYS®, is the trivial relation between ε ̿ f p and equivalent plastic strain ( ε ¯ p ) [62], as described in Equation (11),
ε ¯ p ε ¯ f p
and in Equation (12), which shows the calculus of ε ¯ f p [16,63,64]:
ε ¯ f p = D 1 + D 2 e D 3 σ m σ J C 1 + D 4 ln ε ˙ p ε ˙ p 0 [ 1 + D 5 T T 0 T m T 0 ]
where σm is the average stress, and D1 and D3 depict how stress triaxiality influences the initial failure ε and the impact of the equivalent plastic strain rate ( ε ¯ ˙ p ). D2 is an exponential factor of JC, and the thermal effects are denoted by D4 and D5 [65]. Table 3 provides values of the INCONEL® 718 damage constants for the JC shear fracture damage model. For INCONEL® 625, a literature gap exists since no values were found.
The employment of the JC shear fracture damage model in isolation corresponds to an instance of abrupt failure (Figure 3, curve described by ABC ε ¯ 0 p ), not capturing D evolution. Instead, when combined with the D evolution approach, the JC shear fracture damage model is exclusively employed as a criterion to represent the onset of D. In contrast, an evolution criterion controls the behaviour of the material through curve CE (Figure 3). Table 4 compiles some of the fracture energy-based criteria that characterise the propagation of damage in a crack [60]. Cohesive Zone Model (CZM) and R-curve approach are also mentionable fracture-energy-based criteria.
These fracture-energy-based criteria have been widely used for machining simulations, particularly Hillerborg’s fracture energy criterion [54,55,56]. The model’s second form of the equation is solved in order to obtain u ¯ p , a change of variable that is very useful so that u ¯ f p can be calculated according to Equation (13):
u ¯ f p = 2 G f σ y 0
where σy0 stands for yield strength at the damage initiation state (point C in Figure 3). The D evolution depends on the rate of stiffness degradation ( D ˙ , from point C to point E in Figure 3) and can be expressed either linearly (Equation (14)) or exponentially (Equation (15)):
D ˙ = L ε ¯ ˙ p u ¯ f p = u ¯ ˙ p u ¯ f p
D ˙ = 1 e 0 u ¯ f p σ ¯ u ¯ ˙ p G f   d u ¯ p
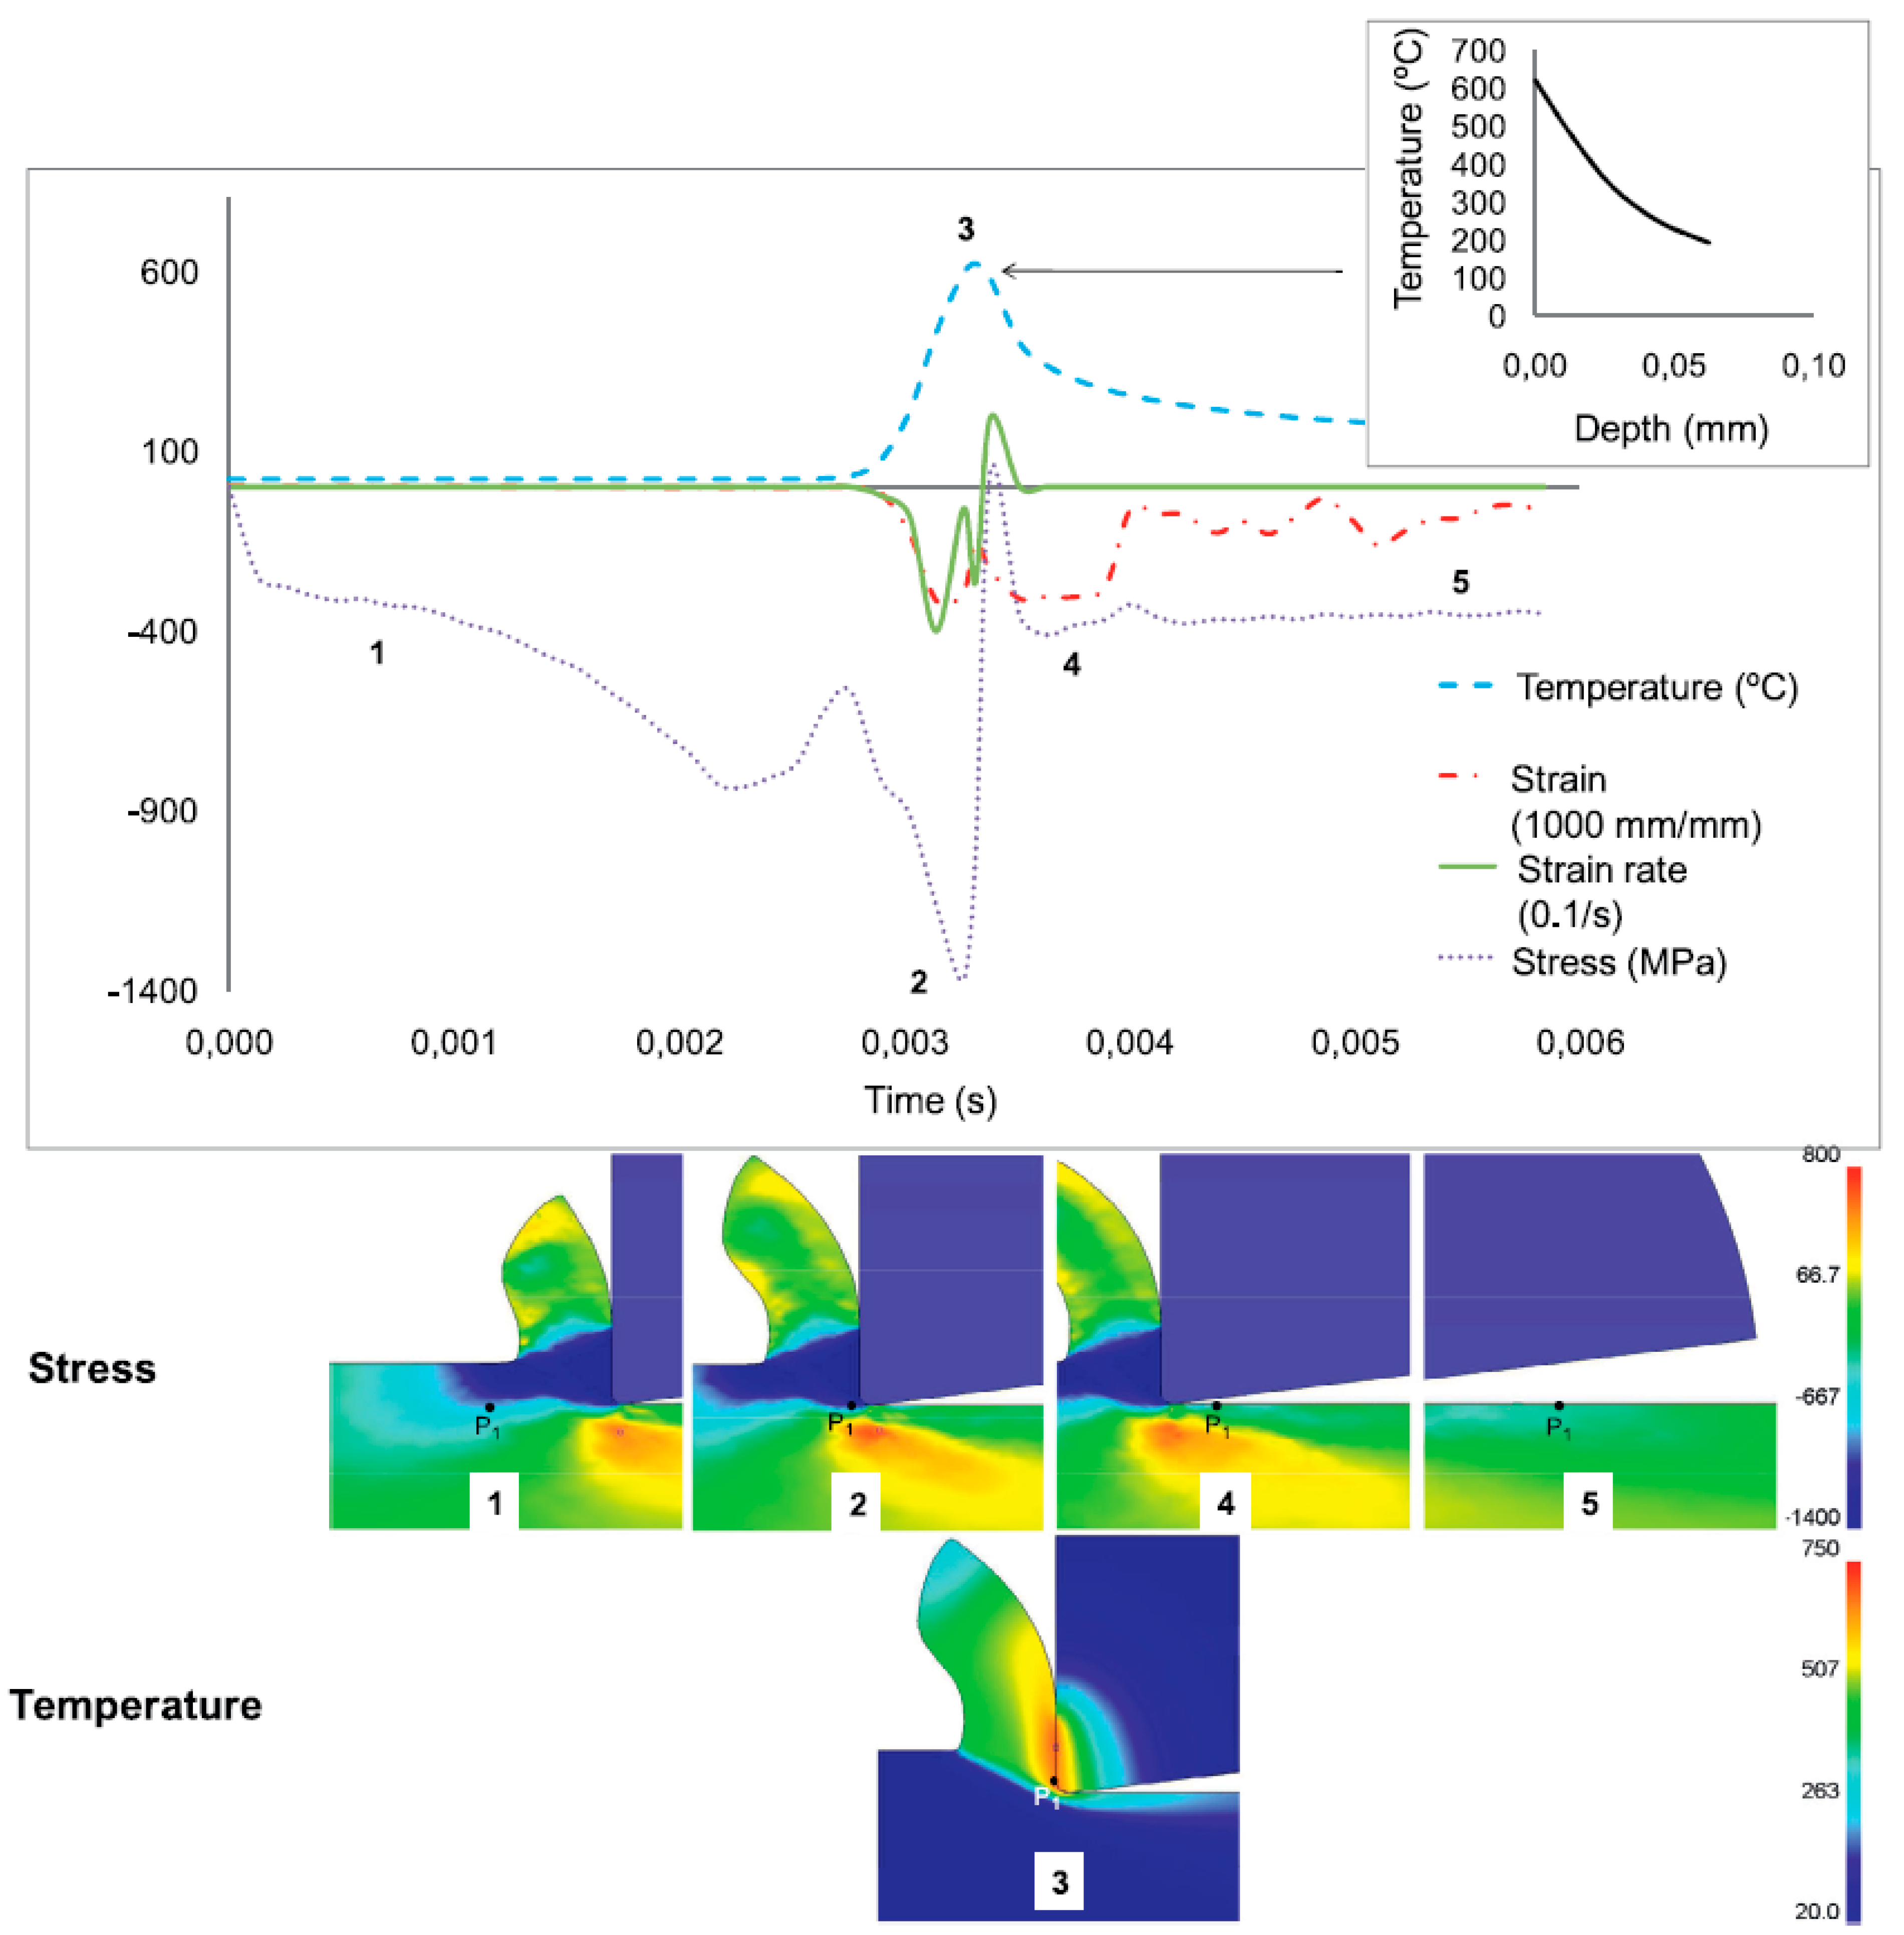
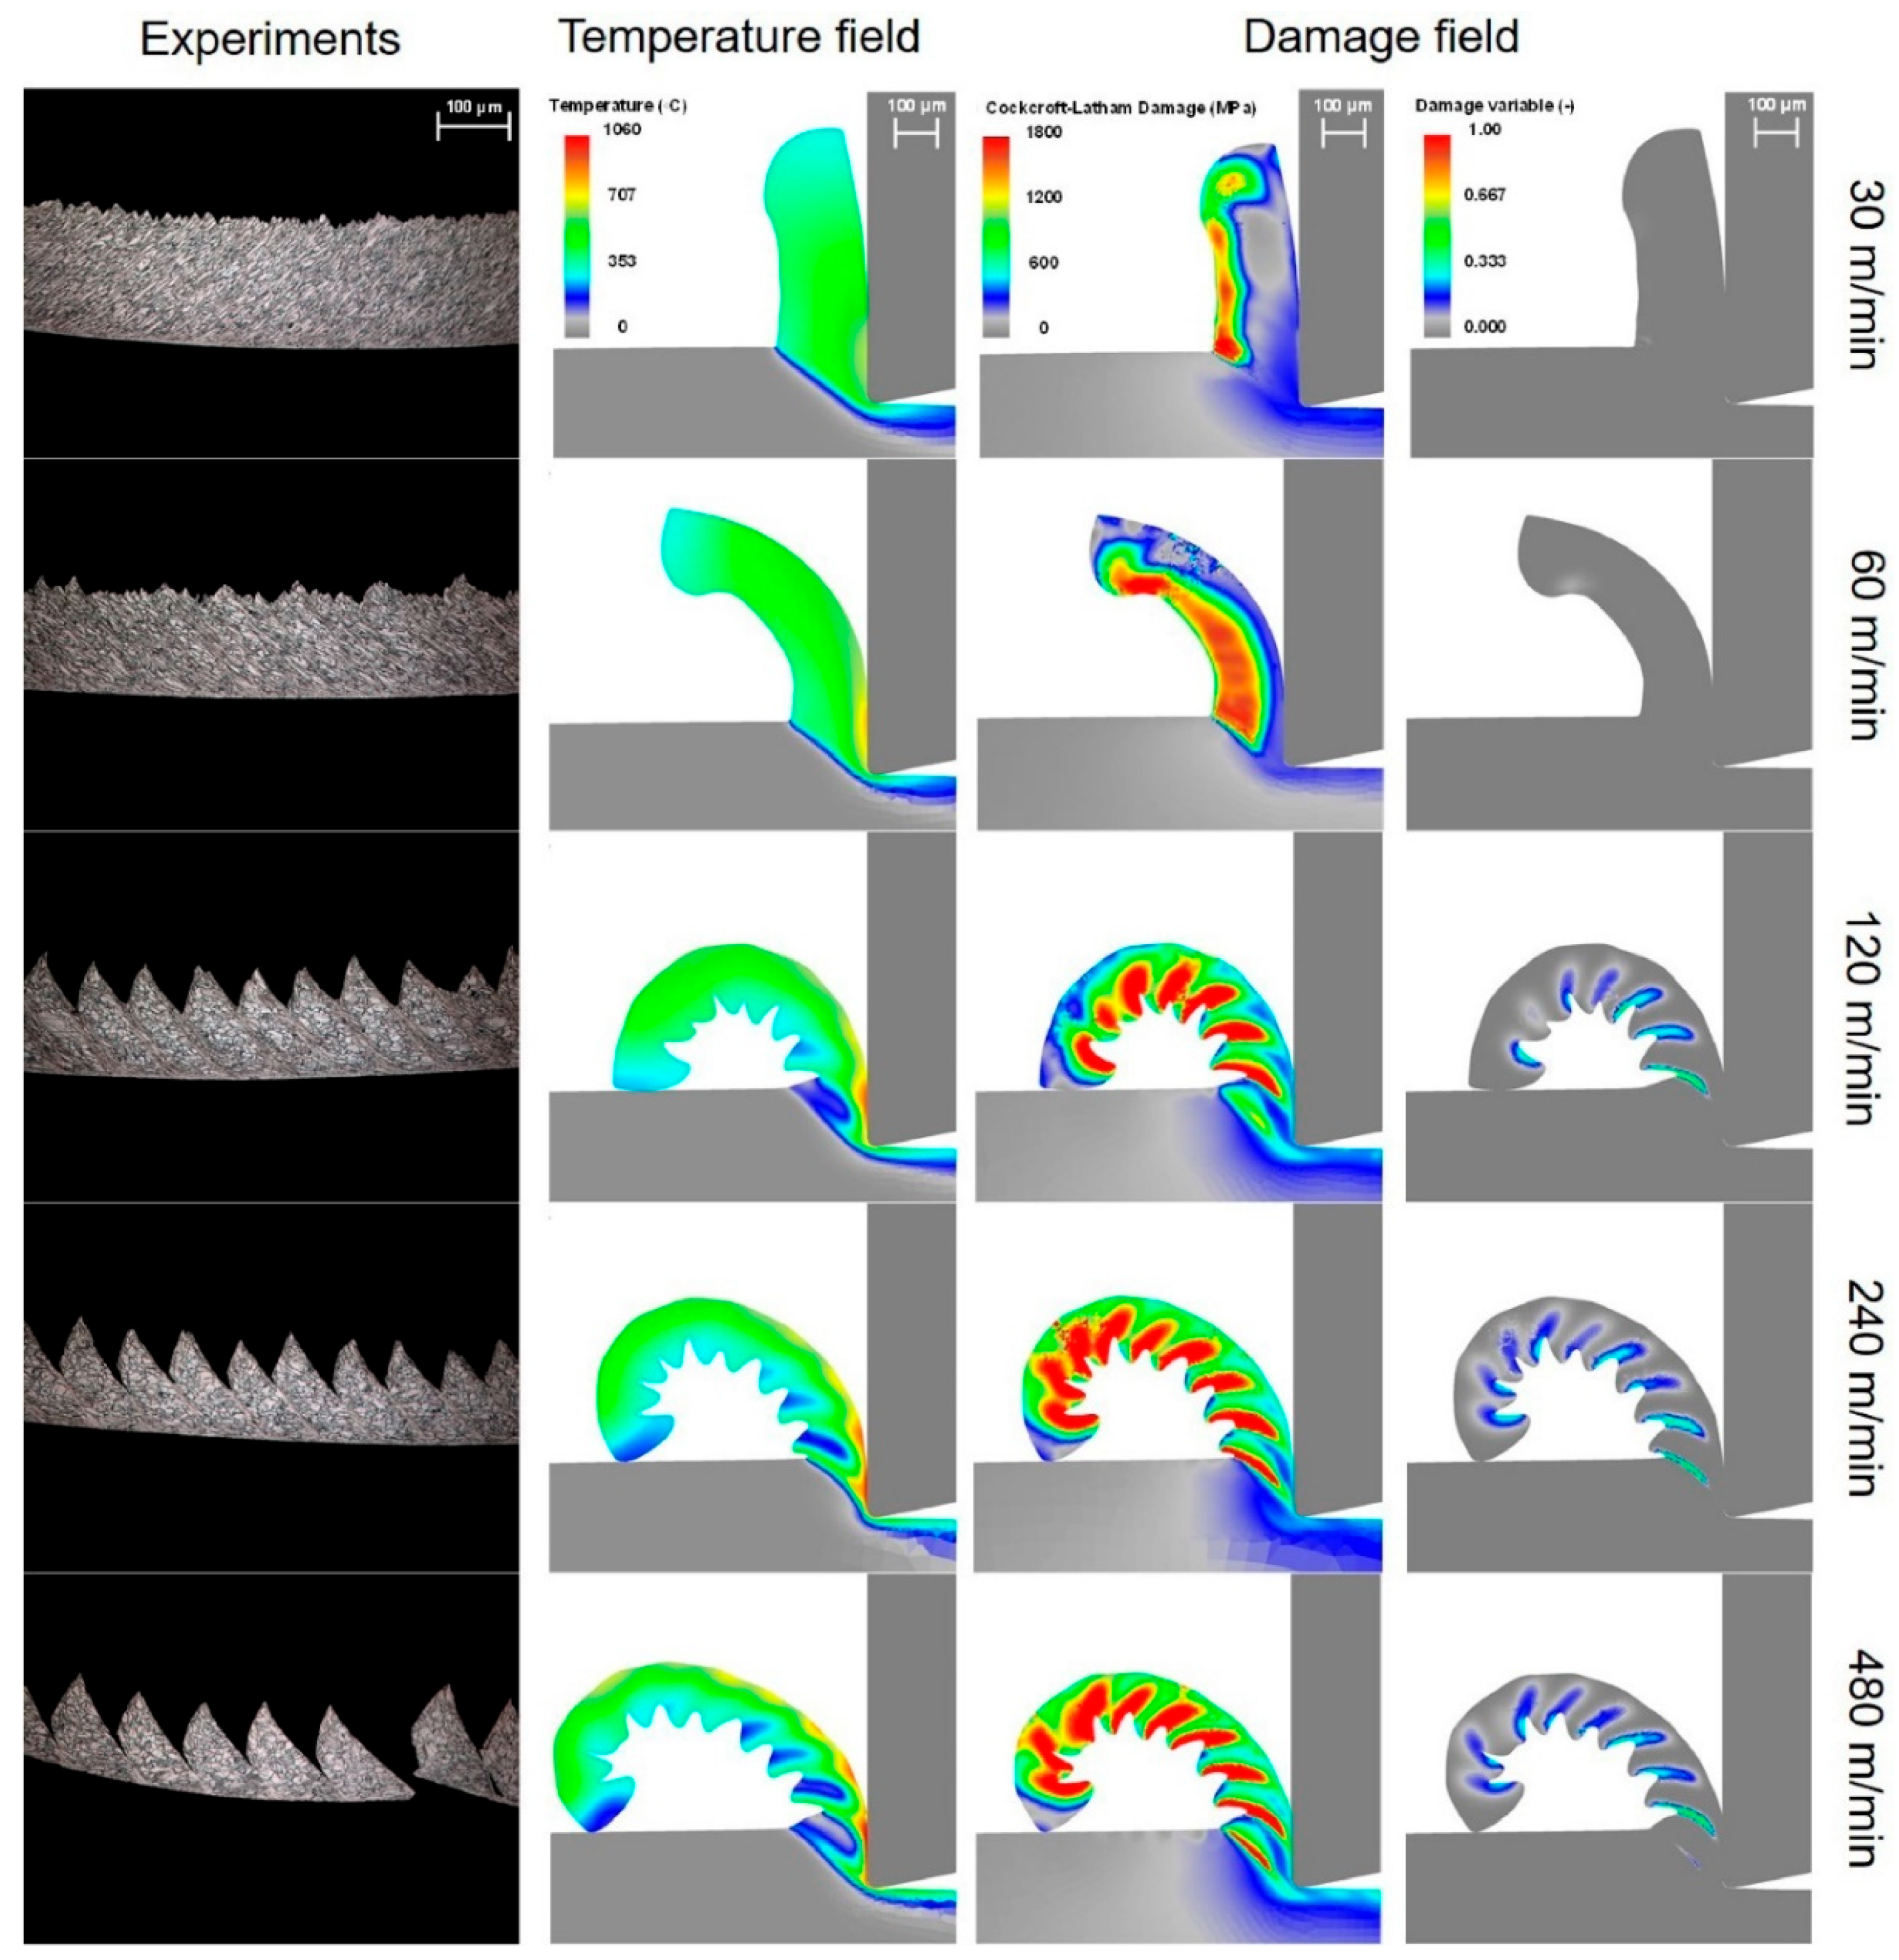
As an example of the applicability and culmination of material damage models, Liu et al. [60] investigated the residual stress evolution in INCONEL® 718 affected by multiple cutting operations, making use of the JC shear fracture damage model alongside the Hillerborg’s fracture energy criterion to predict the serrated chip morphology, as depicted in Figure 4. The resulting FEA simulations showed that the residual stress level might be controlled by optimising the previous cuts to obtain the desired surface integrity.
In addition to material modelling, damage initiation, and propagation characterisation, it is essential to model tool wear (TW) to predict tool life (TL). While some authors may treat the tool as a rigid body in FEA when their primary aim is to study INCONEL®’s chip morphology, this review also aims to shed light on the existing mathematical models for TW and findings on improving TL.

1.2. Tool Numerical Modelling

TW significantly impacts both quality and productivity, particularly in the case of INCONEL® alloys like 718 and 625, whether considering coated tools [66], ceramics, or even PcBN. Sousa et al. [67] scrutinised recent advancements in TiAlN-based coatings, including nanolayered, nanocomposite, and Ru-, Mo-, and Ta-doped coatings, evaluating their mechanical properties and comparing their cutting behaviours during turning and milling processes. Later on, Sousa et al. [68] experimentally investigated the wear characteristics of multilayered TiN/TiAlN-coated end mills through Physical Vapour Deposition (PVD) [69] and High-Power Impulse Magnetron Sputtering (HiPIMS). These tools were employed in finishing operations on INCONEL® 718 to advance the comprehension of the wear patterns exhibited by coated tools during the machining of these alloys. Silva et al. [70] evaluated machined surfaces’ integrity and TW resistance using cutting tools coated through PVD HiPIMS with TiAlYN during the end milling of INCONEL® 718. These efforts demonstrate that experimental work is time-consuming and simulation can save resources and time for researchers. Three-dimensional (3D) modelling is essential to analyse and predict flank wear (VB), and FEA enables predictive insights into the sequence of TW mechanisms [2]. The ISO 8688-2:1989(E) [71] standard defines a milling tool as worn when a uniform VB = 300 μm is achieved or the local maximum flank wear (VBmax) is 500 μm. The ISO 3685:1993(E) [72] standard provides relevant turning tool guidelines, considering the same VB limits. Table 5, summarised by Pedroso, et al. [2], presents typical mathematical models characterising various TW mechanisms. For a deeper understanding of the additional variables outlined, it is advisable to consult Wang et al. [73].
The JC model, among those presented in Table 1, has enhanced the ability to predict the behaviour of INCONEL® alloys during machining, and presently, the academic community can predict elastoplastic phenomena [89]; nonetheless, TW behaviour predictability while machining is an ongoing challenge in the academic community. Computationally, the authors must pre-process TW via Computer-Aided Design (CAD) according to experimentally obtained geometries. A simulation of the entire TL is unreasonable due to the long computing time (t) taken [90]. Figure 5 presents a schematic of the actual procedure used by many authors to simulate machining when considering TW. From the point of view of studying the T distribution, considering TW is paramount because cutting becomes less effective with each machining pass, and therefore, T rises as the tool deteriorates. Although it is not an explicit simulation where material machining and TW coexist, speaking in computational terms, a quasi-transient situation can still be examined. Thus, the continuous progress of TW is discretised into finite steps for simulation [90].
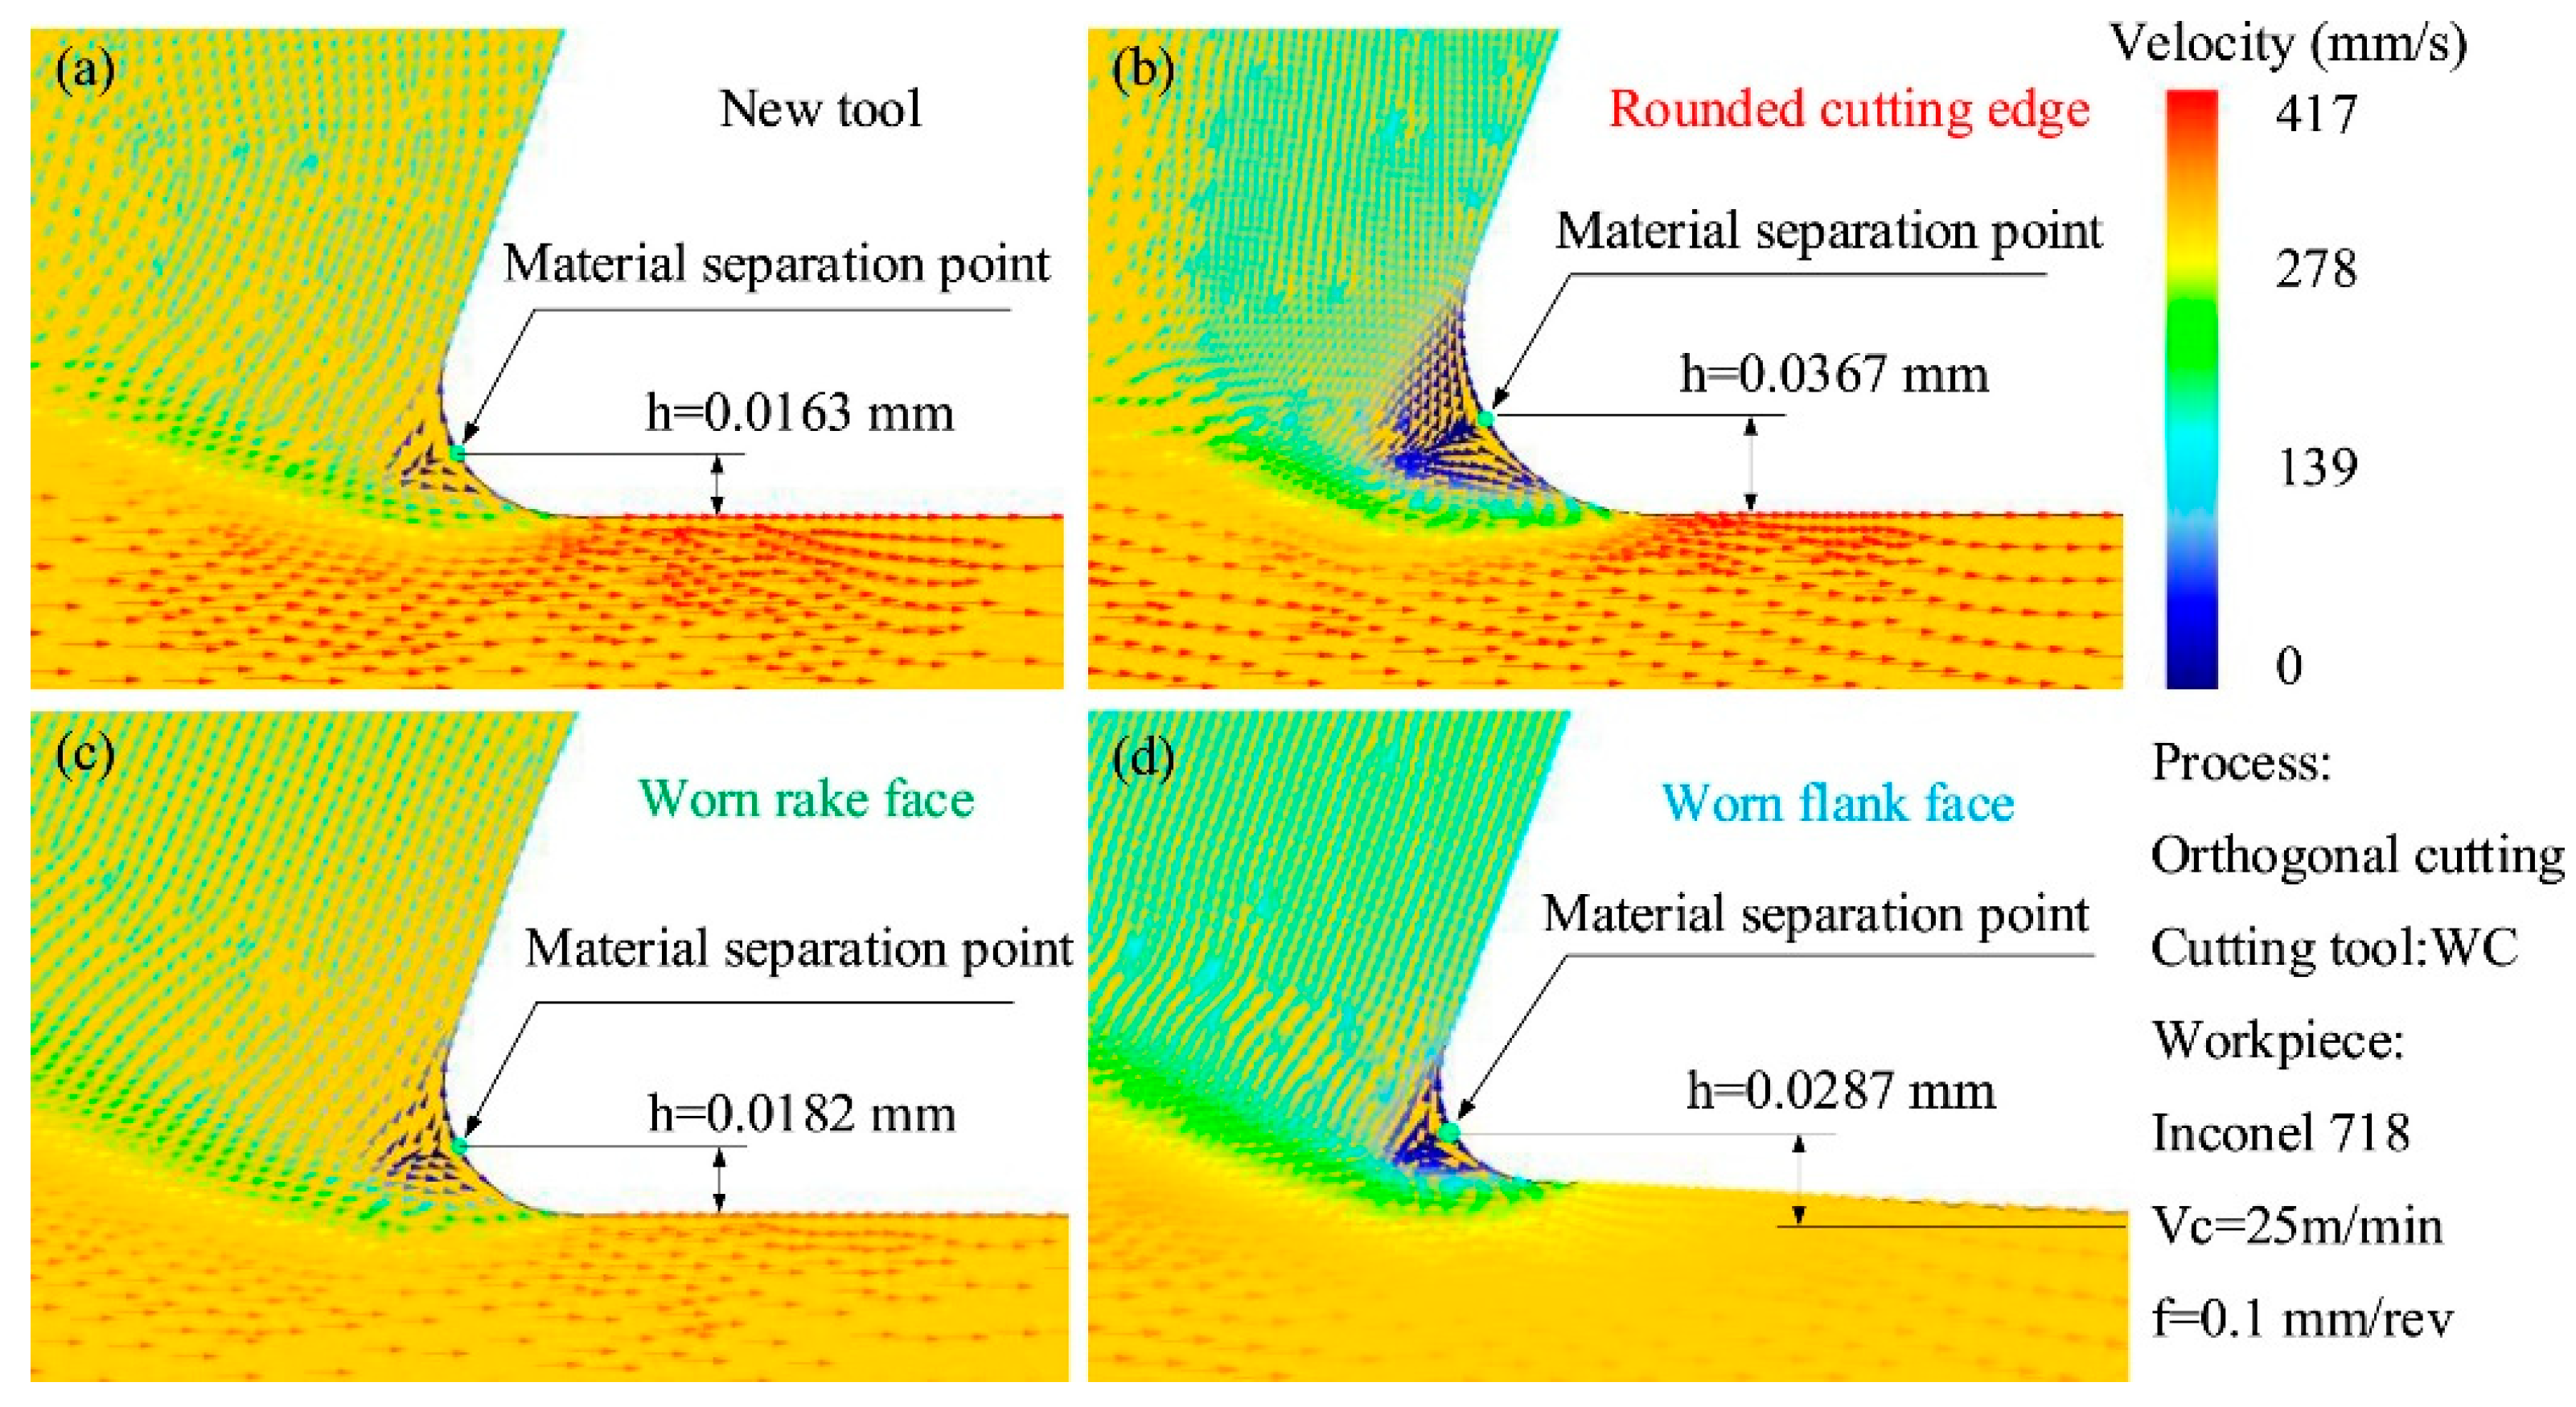
For instance, Liang et al. [92] studied the experimental orthogonal cutting process of Ti-6Al-4V, and VB was considered the only tool failure standard despite both the crater wear and VB appearing simultaneously. Afterwards, a numerical model was built with three distinct tool CAD models: (1) new, VB = 0 mm; (2) semi-worn, VB = 150 μm; and (3) worn, VB = 300 μm; these were used to determine initial, regular, and failure stages. Both simulated and experimental findings revealed that the evolution of local plastic behaviour was primarily driven by the thermo-mechanical loads resulting from TW effects. Shi et al. [37] carried out a study employing Usui’s model [46,76,77], analysing output variables like the tool–chip contact area (w), pressure, sliding, velocity, and initial T. Hosseinkhani and Ng [90] developed a new empirical model (Equation (16)) to predict TW in the initial or break-in period as a function of the Von Mises stress (σVM) field while experimentally turning AISI 1045 annealed steel, comparing it afterwards with the experimental results and Usui’s model [46,76,77]. Experimental validation demonstrates that the recently devised model has significantly enhanced the initial TW rate in both its pattern and magnitude.
d W d t = C e D σ V M
Zhang et al. [93] also used Usui’s model [46,76,77] to study adhesion and diffuse wear mechanisms, which are found to be the main wear mechanisms during the machining of INCONEL® 718 with TiAlN-coated carbide tools. The predictive inaccuracy is below 15% compared to the experimental data, proving an enhancement in the precision of TW crater predictions. Binder et al. [94] proposed a better understanding of Usui’s model [46,76,77] by considering normal stress (σn0) in the equation instead of the maximum shear flow stress ( τ ¯ m a x ) that can be exerted on the tool. The authors experimentally assessed the orthogonal cutting of AISI 1045 steel with Physical-Vapour-Deposited (PVD) [95] TiAlN-coated and uncoated carbide tools. The predicted crater depth aligns well with experimental data, and the projected position of the crater on the rake face appears to be near the cutting edge; nevertheless, the outcomes of this study indicate that the challenges in predicting the crater width stem from an underestimated contact length in the chip formation simulation. Liu et al. [96] validated numerical simulations performed for six different VB values using Usui’s model [46,76,77], culminating in a study on an expression for VB dependent on the spindle (s), feed per tooth (fz), axial depth of cut (ap or ADOC), and radial depth of cut (ae or EDOC) while end milling TC4 alloy. The authors stated that FEA can directly determine TW and morphology. However, due to the limitations of t and complex boundary conditions, FEA is not commonly used in TL prediction. The TW model’s efficacy was confirmed by comparing the experimental findings with the simulation results.
Additionally, to expedite tool life prediction, an empirical formula for forecasting TW was formulated, allowing for the characterisation of the evolution of TW over time. Tool compatibility with the workpiece and other parameters unaccounted for in the model have spurred recent research efforts to further enhance machining and TW behaviour predictability. The necessity of having numerous models, as depicted in Table 5, demonstrates how thermodynamically, tribologically, and material-dependent milling, turning, and drilling are, not to mention the complexity of each inherent subject.

1.3. Assembly Numerical Modelling

The numerical formulation is only complete if an assembly between the workpiece and a cutting tool exists [97] in order to assess, for instance, the cutting forces (Fcut) [98] inherent to the machining process. This model must encompass the constitutive material, TW models, adequate friction models, mathematically simulated elastoplastic deformations [99], and boundary conditions. CAD software conducts numerical analyses, simulating the tool and workpiece with specified boundary conditions and meshing generation [36]. Table 6 offers insights into the available meshing approaches when conducting FEA machining and their advantages and disadvantages.
In traditional practice, the LAG formulation typically modelled metal-cutting processes [100]. The computational mesh grid deforms with the material [107]; nevertheless, the concentrated plastic deformation close to the cutting edge significantly distorts the finite elements (FEs), resulting in numerical and computational inaccuracies [108]. The Eulerian approach [109] is commonly employed to analyse processes involving substantial deformation [100] in plastic and visco-plastic materials, with minimal consideration for elastic deformation [108] and the mesh grid in which it is fixed in space [107]. While the disparity in errors between the Eulerian and LAG approaches varies based on the specific problem, errors within the Eulerian framework generally tend to be more significant than those within the LAG framework [110]. The ALE method [111,112] finds extensive use among researchers, as it aids in overcoming certain limitations inherent in the LAG method [108]. Integrating the Eulerian and LAG approaches offers a viable solution to address the distortion of elements and effectively model the extensive plastic deformation characteristic of machining [100]. Employing an adaptive re-meshing technique aids the process. Nonetheless, it is essential to note that the Eulerian formulation models the local deformation zone, resulting in typically continuous chip formation.
Consequently, accurately predicting processes that yield segmented chips proves challenging with this approach. The CEL formulation [54,101] describes the workpiece using the Eulerian formulation and the tool using the LAG approach [113]. The CEL meshing approach was not applied to metal cutting until 2016 in a study by Ducobu et al. [113], typically being only used to study fluid–structure interactions until that time. It constitutes a specific variant of the ALE framework. 
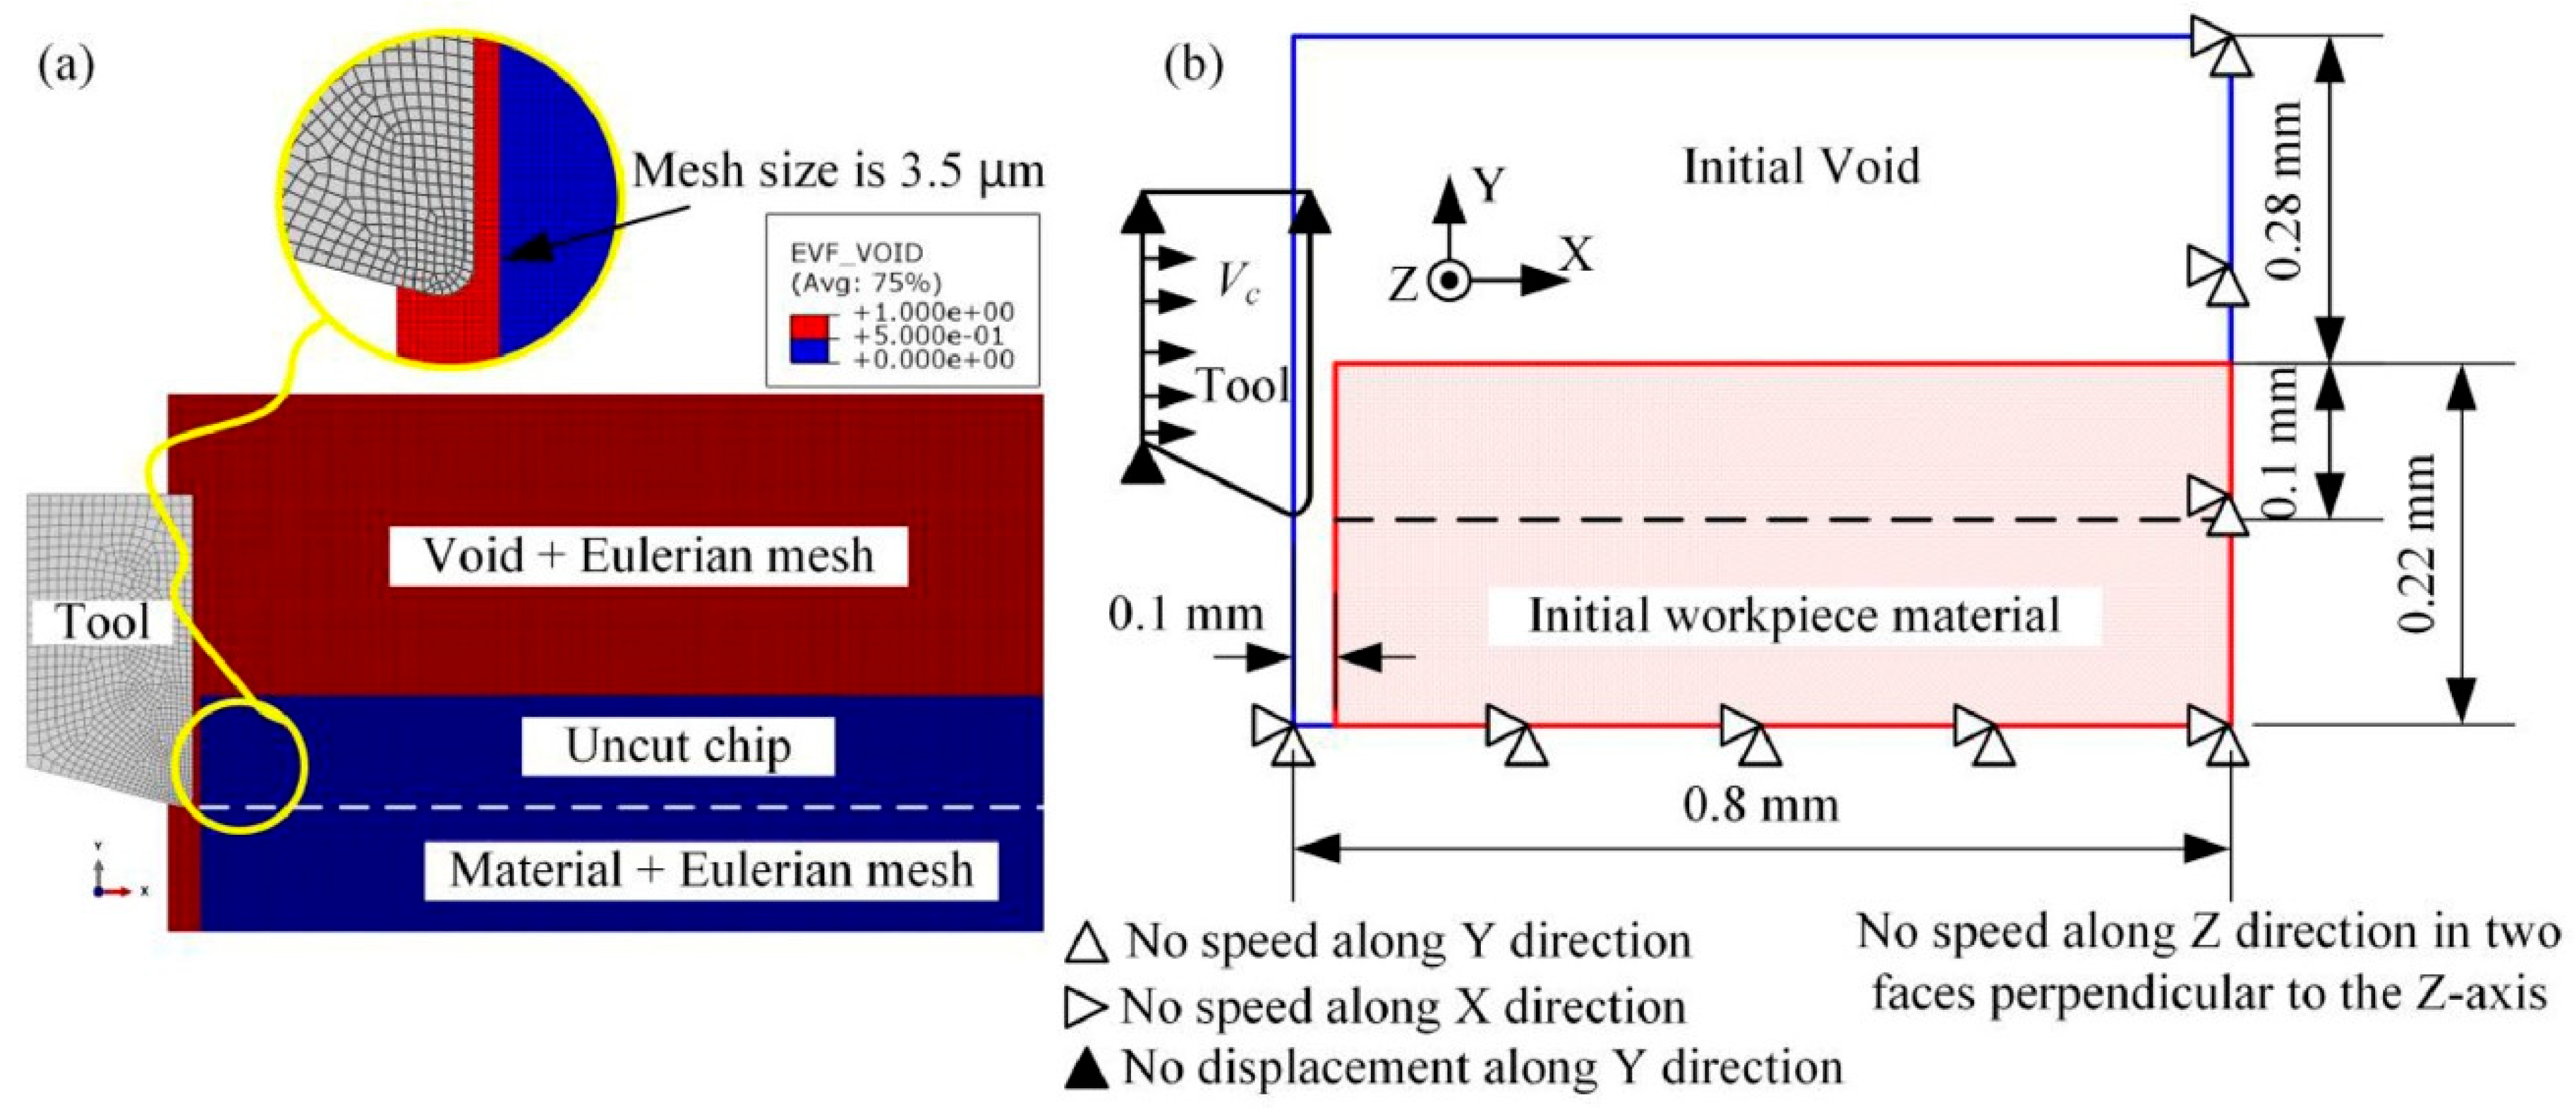
Figure 6 depicts Xu et al. [114]’s CEL [54,101] application to the properties of each domain, namely, the tool and the workpiece, within the numerical model in ABAQUS. The workpiece, including the void and material regions, is meshed using EC3D8RT elements (eight-node thermally coupled linear brick, multi-material, reduced integration with shear locking effect control [115], also called hourglass effect control), and the tool is meshed as C3D8RT elements (eight-node thermally coupled brick, trilinear displacement and T, reduced integration, shear locking effect control [115]). The boundary conditions and mesh size are also described. While not explicitly stated, the tool is considered a LAG domain.
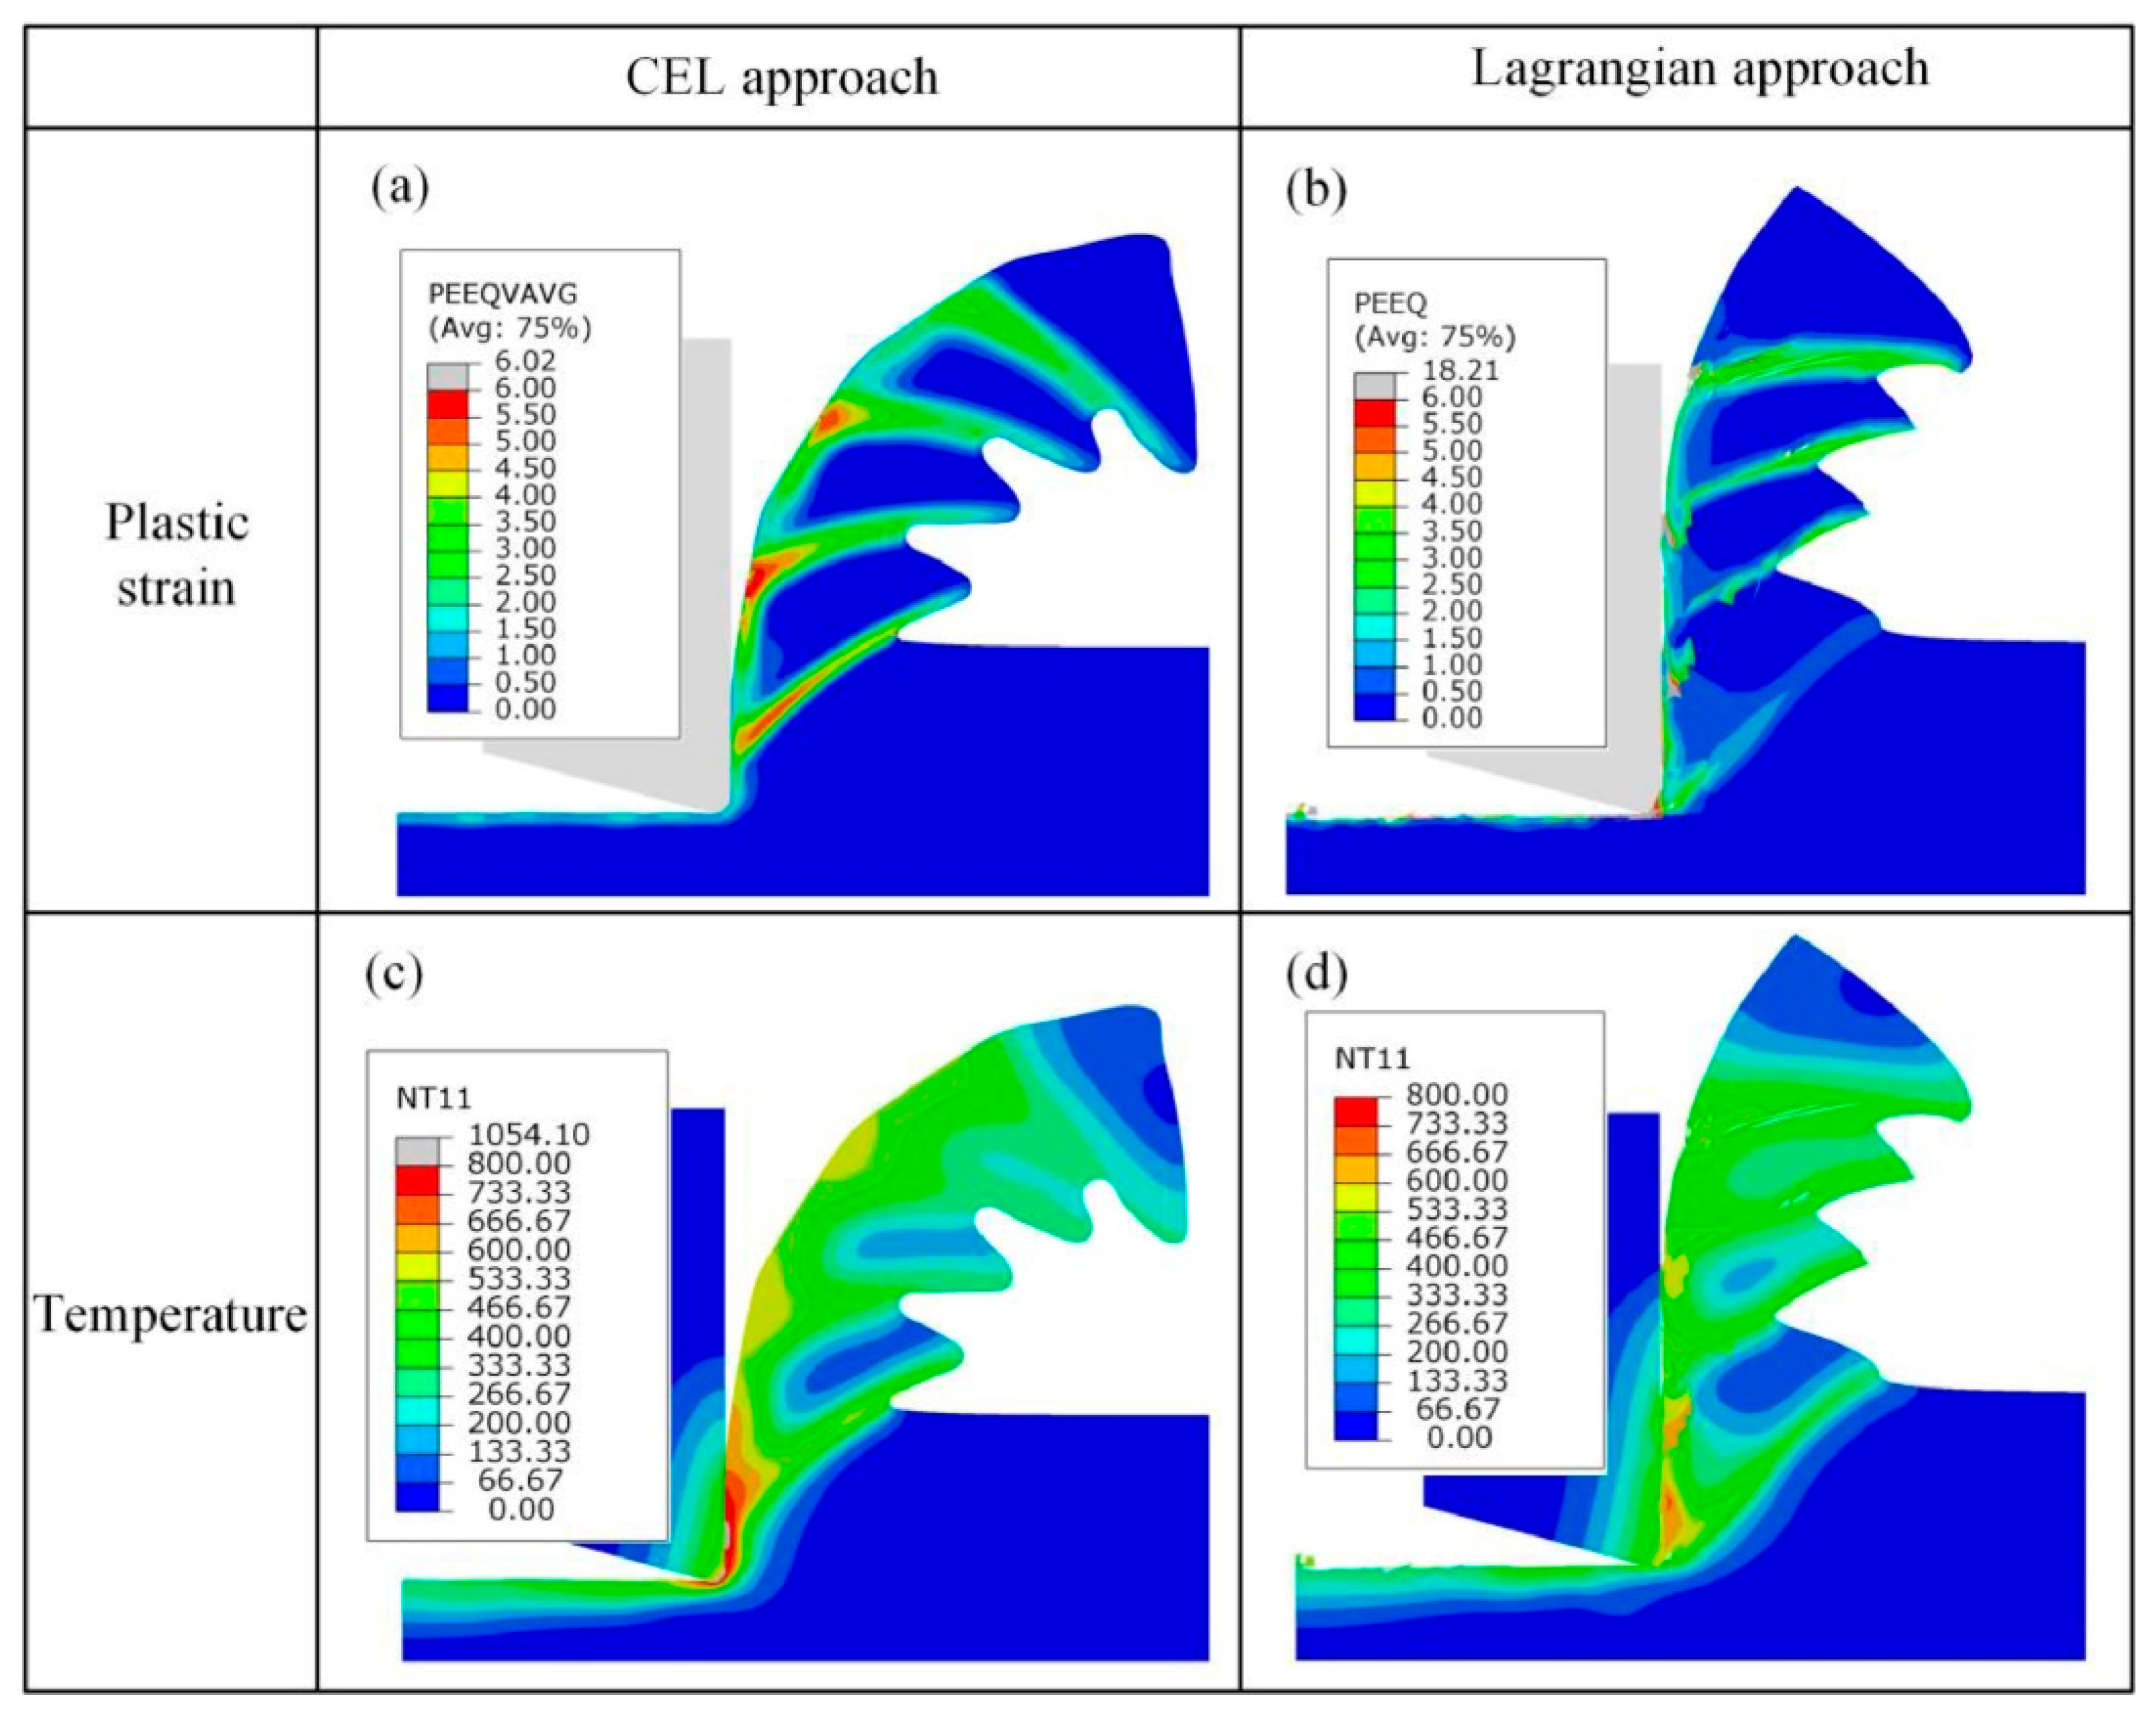
Figure 7 demonstrates the chip morphological difference between the CEL and LAG meshing approaches. Due to the different mathematical formulations in each approach, the two approaches were expected to reveal differences when focusing on the ε ¯ p and T distributions.
When analysing machining via FEA, it is vital to understand the T distribution, which refers to the varying heat levels during machining, impacting material properties and TW, and ε ¯ p , which measures u ¯ p , aiding in identifying potential failure areas. Accurate FEA simulations consider cutting parameters, material models, and heat generation to optimise machining processes. During heat generation, a friction model [102] should accurately simulate the interactions between the tool and workpiece during machining. These thermodynamic considerations are critical assessments for carrying out the machining simulation. Table 7 shows some of the most used friction models in machining simulations.
For μ calculus, Equation (17) presents the dependency of this coefficient on the tangential and radial cutting force components (Ft and Fr, respectively) and on γ [119].
μ = F t tan γ + F r F t F r tan γ
While the friction models allow for the simulation of the heat and thus T distribution, it is also interesting to study how the generated heat is shared between the tool and workpiece. The heat partition coefficient (HPC) [120] represents the proportion of heat generated during machining that is transferred to the workpiece and the cutting tool. As demonstrated in Equation (18), the HPC is a ratio between heat entering the workpiece (Qworkpiece) and the total heat generated during machining (Qtotal).
H P C = Q w o r k p i e c e Q t o t a l
For instance, if HPC = 0.8, 80% of the total heat generated during machining enters the workpiece, while the remaining 20% goes into the tool. Higher HPC values might lead to thermal distortion in the workpiece, whereas lower HPC values lead to increased TW and potentially shorter TL. Once the HPC is calculated for a specific machining process, it can be applied to optimise and improve the machining operation, such as (1) tool material and coating optimisation, (2) machining parameter optimisation, (3) TL prediction, (4) material selection and machining strategy, (5) process improvement and innovation, and (6) heat management and cooling strategies. Table 8 demonstrates no unified model for the HPC since it depends on several material parameters and the affinity between the tool and the workpiece. To better comprehend the proposed models, it is suggested to consult the work of Zhao et al. [121] and Hao and Liu [122].
In the extensive experimental work of Zhao et al. [121], it was found that in INCONEL® 718 machining, the HPC could be calculated by some of the models from Table 8 with a reasonably low sum of relative errors (Σ|δ|) for the different tested vc with the predictive models compared to the measured T. Considering three different vc = 40, 80, and 120 m/min for a PVD AlTiN-coated carbide tool, the lowest Σ|δ| = 52.61% value was from the RR model, and for tungsten carbide (WC), the lowest Σ|δ| = 31.83% was obtained from the RG-W model. The higher Σ|δ| value for the PVD AlTiN-coated tool is explained by the change in the thermal characteristics at the tool–chip contact interface compared with the WC tool. The numerical calculation of conventional processes is complete once the simulation has been constituted with all these considerations.

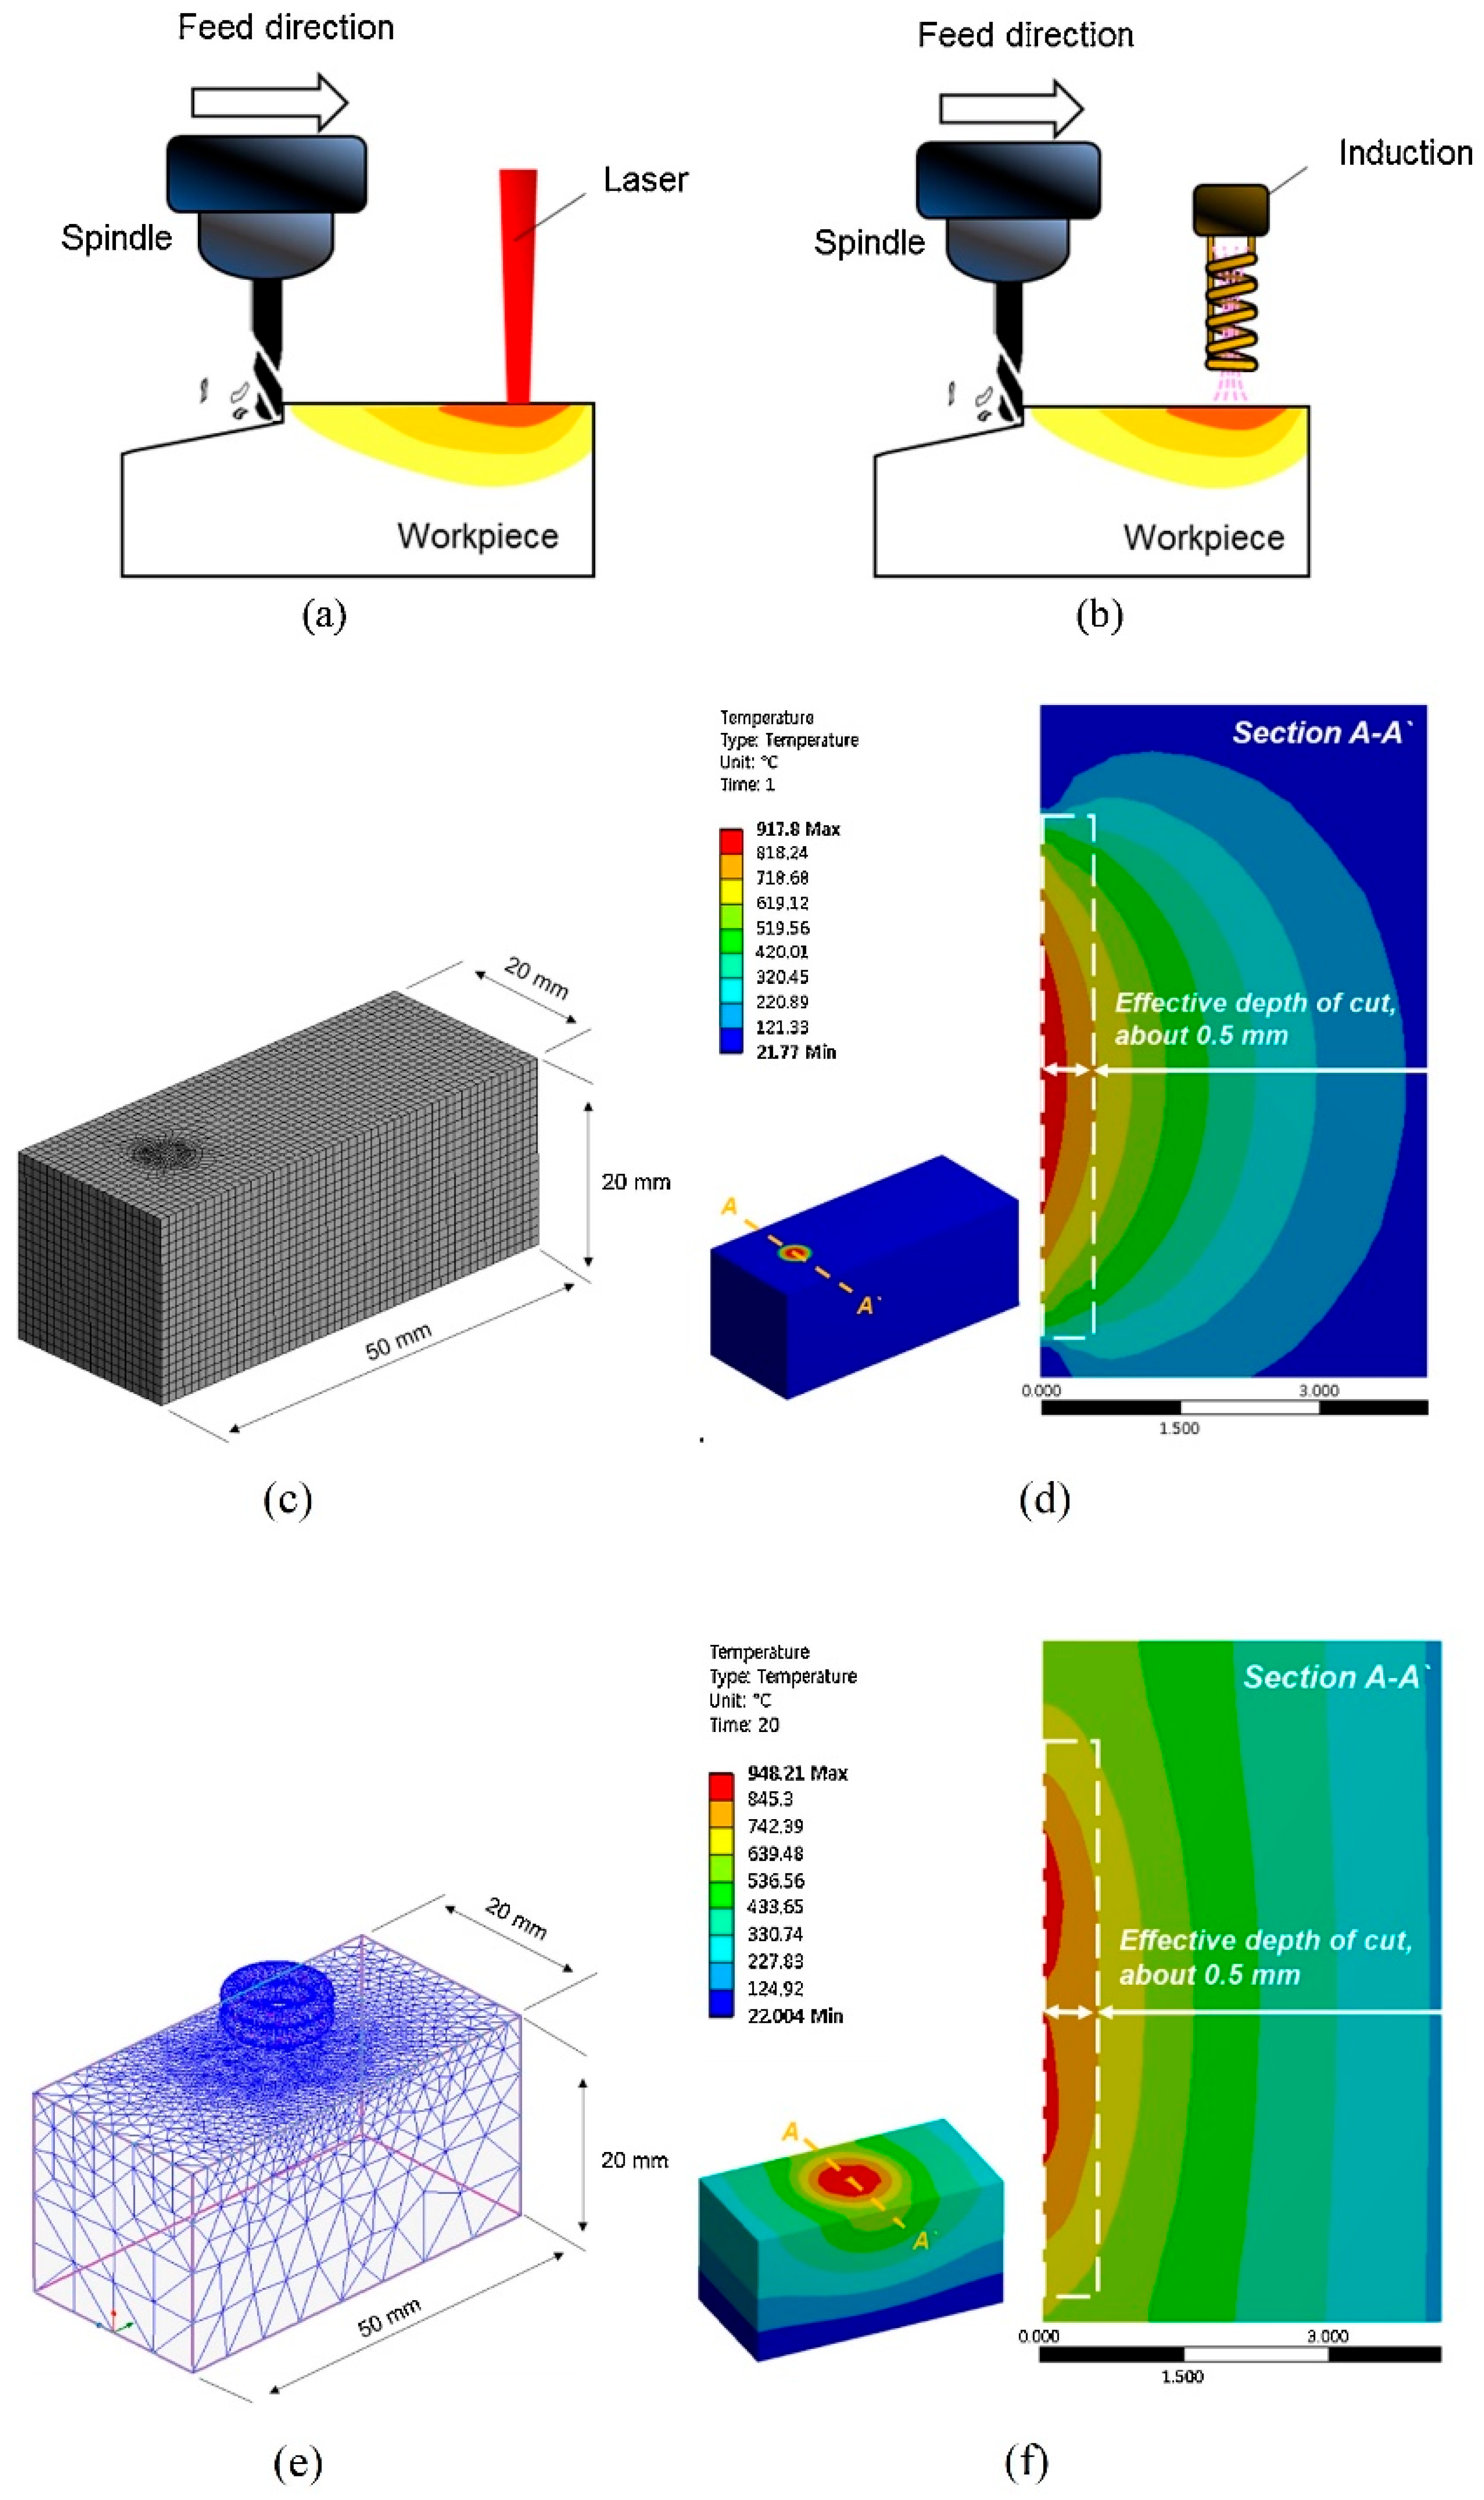
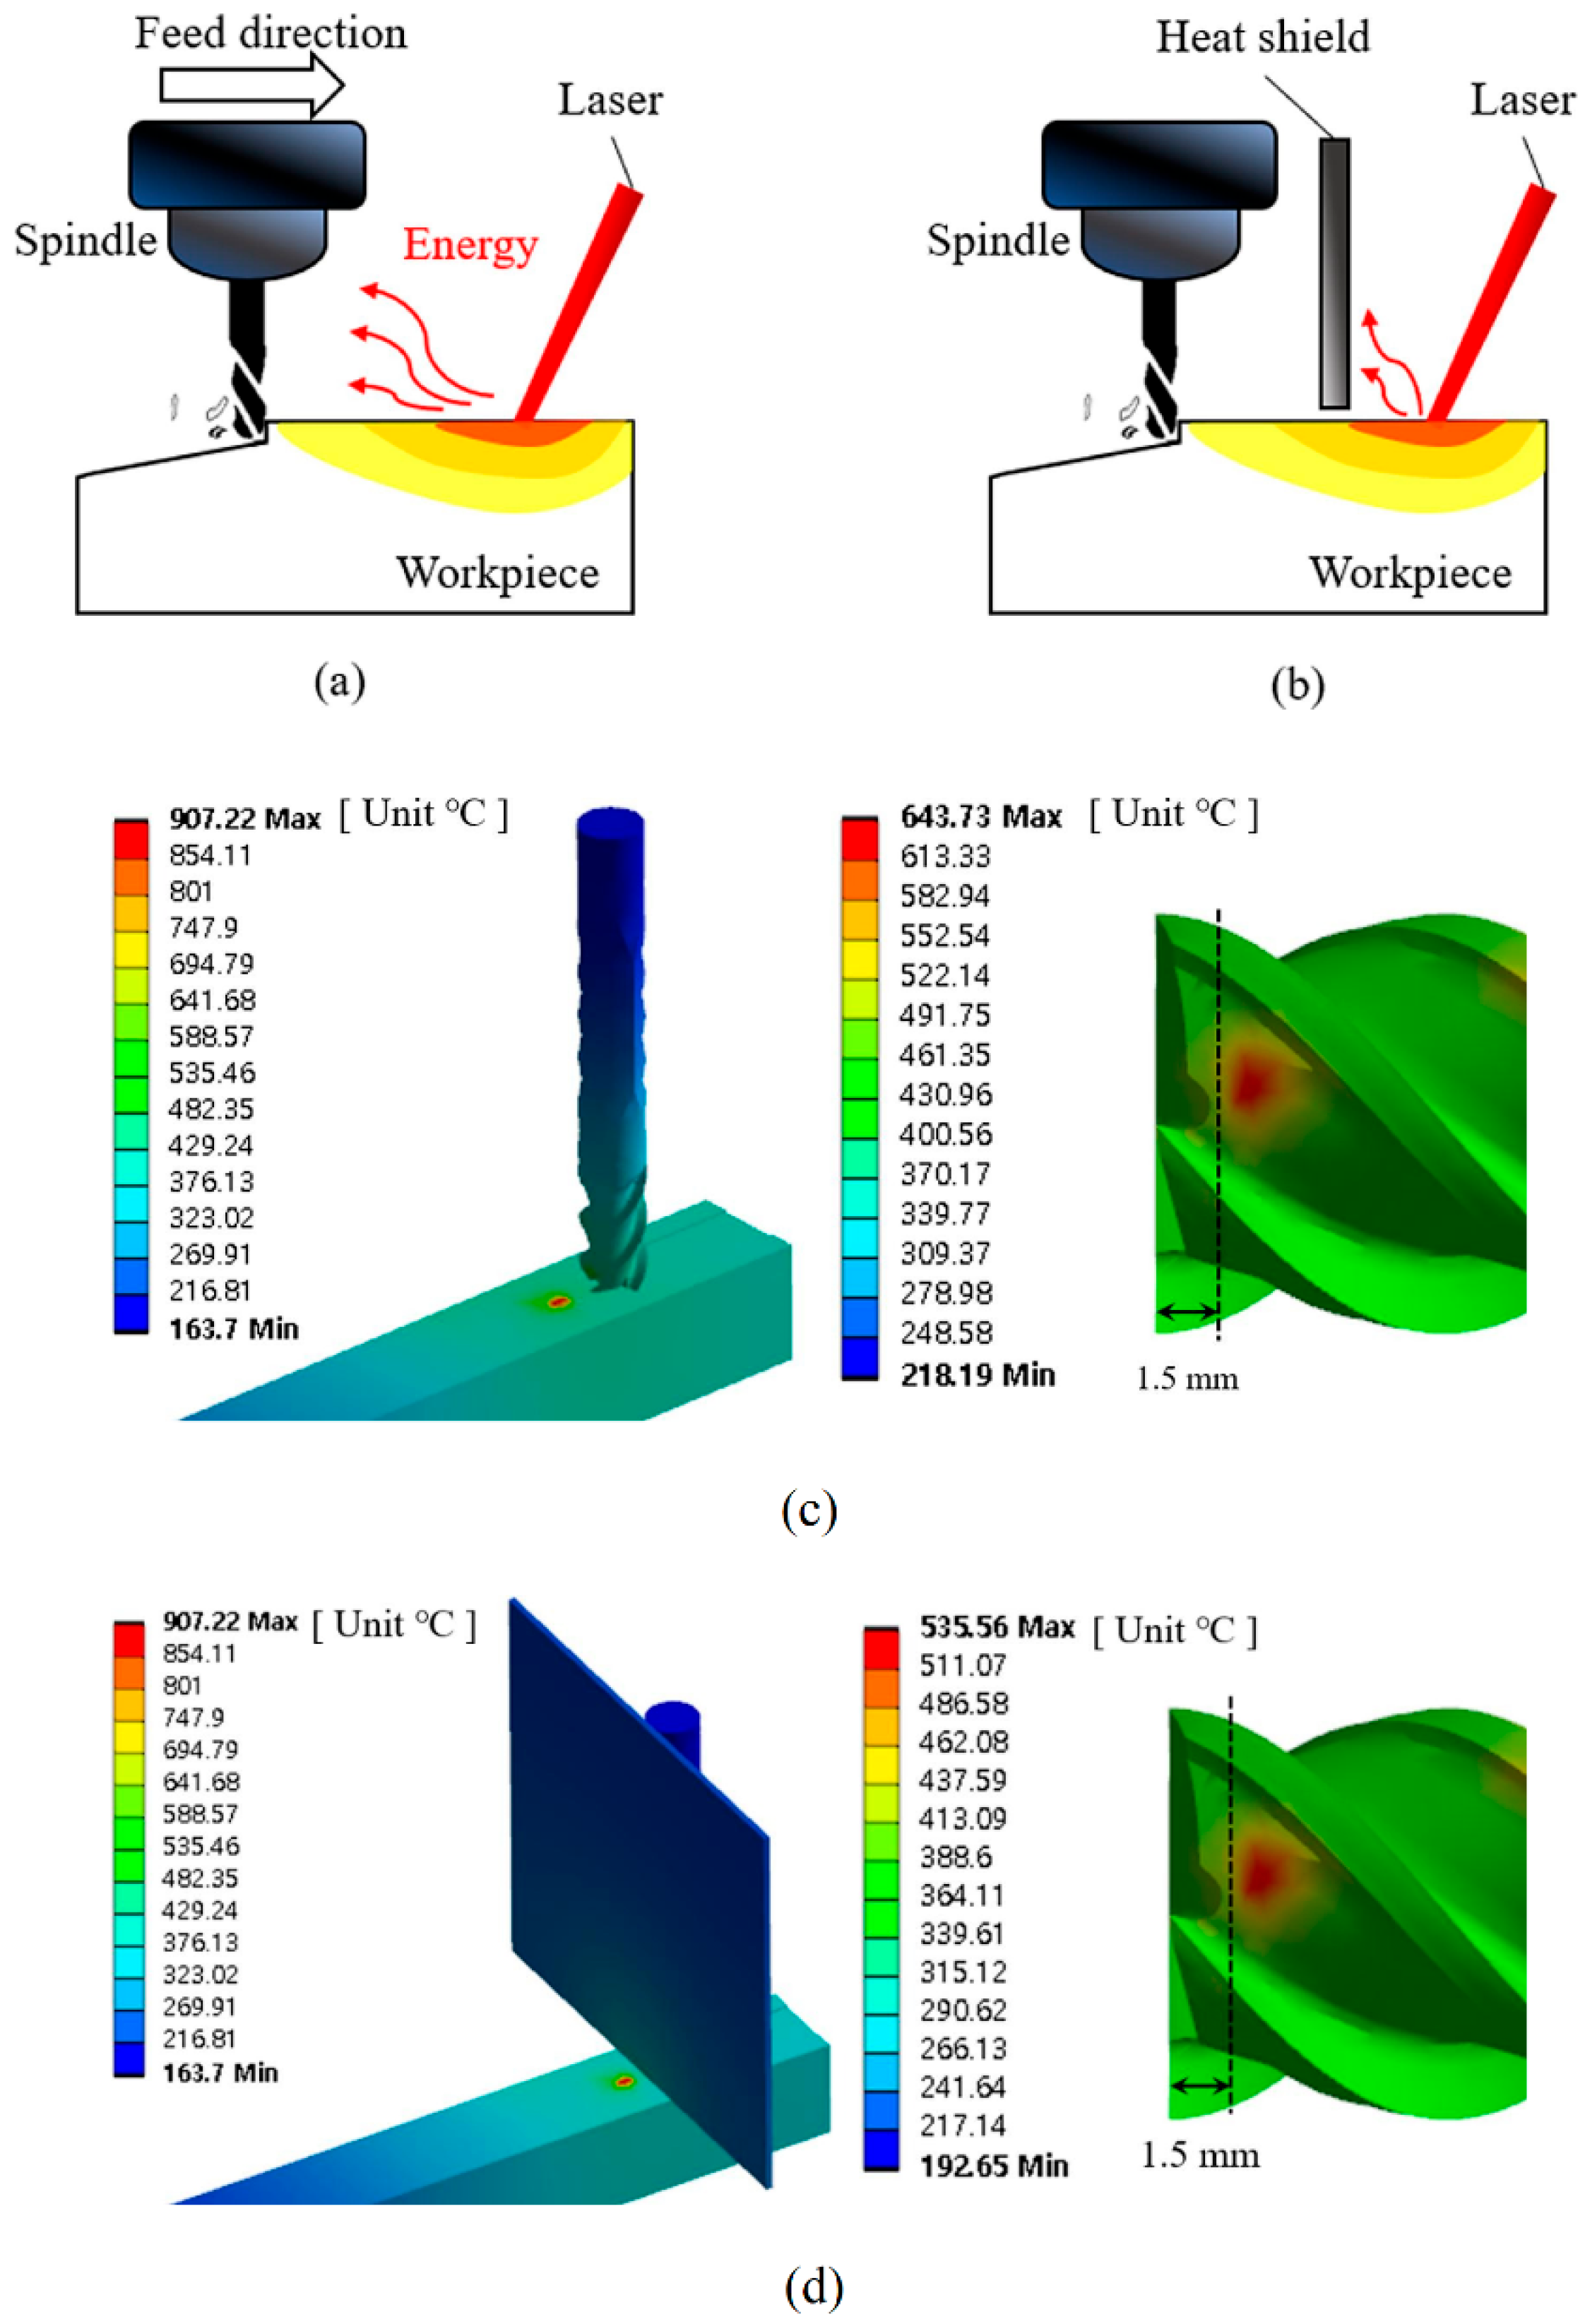
1.4. Hybrid Manufacturing Process Modelling: Thermally Assisted Machining (TAM)

Hybrid non-conventional processes with CM as a base factor have been investigated numerically to efficiently improve Laser-Assisted Machining (LAM) and Induction-Assisted Machining (IAM). Before experiments, thermal FEA of LAM is usually conducted to determine the preheating T and effective ap [130]. Taking INCONEL® 718, for instance, the preferable range of preheating T is between 700 and 900 °C, where σu sharply decreases [131]. On the other hand, the INCONEL® 625 preheating T was chosen by Parida and Maity [132] to be 600 °C. Thermal FEA for laser heating simulation is governed by Equation (19) [133]:
α 2 T x 2 + 2 T y 2 + 2 T z 2 + Q ˙ = T t
where α and Q ˙ are thermal diffusivity (Equation (20)) and power generation per unit volume,
α = k ρ c p
and the constants ρ, cp, and k represent the volumetric mass density, specific heat, and thermal conductivity, respectively. Equation (21) gives the initial condition at t = 0 s:
T x , y , z , 0 = T 0
Equation (22) [133] gives the boundary condition:
k δ T δ z = q x , y h T s T 0 + ε E σ S B T s 4 T s u r 4
where q, h, εe, σSB, Ts, and Tsur represent the heat flux, heat transfer coefficient, emissivity, Stefan–Boltzmann constant, surface temperature, and radiated surface temperature, respectively. The Gaussian Equation (Equation (23) [134]) is employed to elucidate the distribution of laser power on the focal plane of the laser beam:
q x , y = 2 P l a s e r π r 2 e 2 x 2 + y 2 r 2
where PLaser is the laser’s total power input, and r is the laser spot radius. This numerical approach to LAM is applied to hybridised milling and turning operations. 
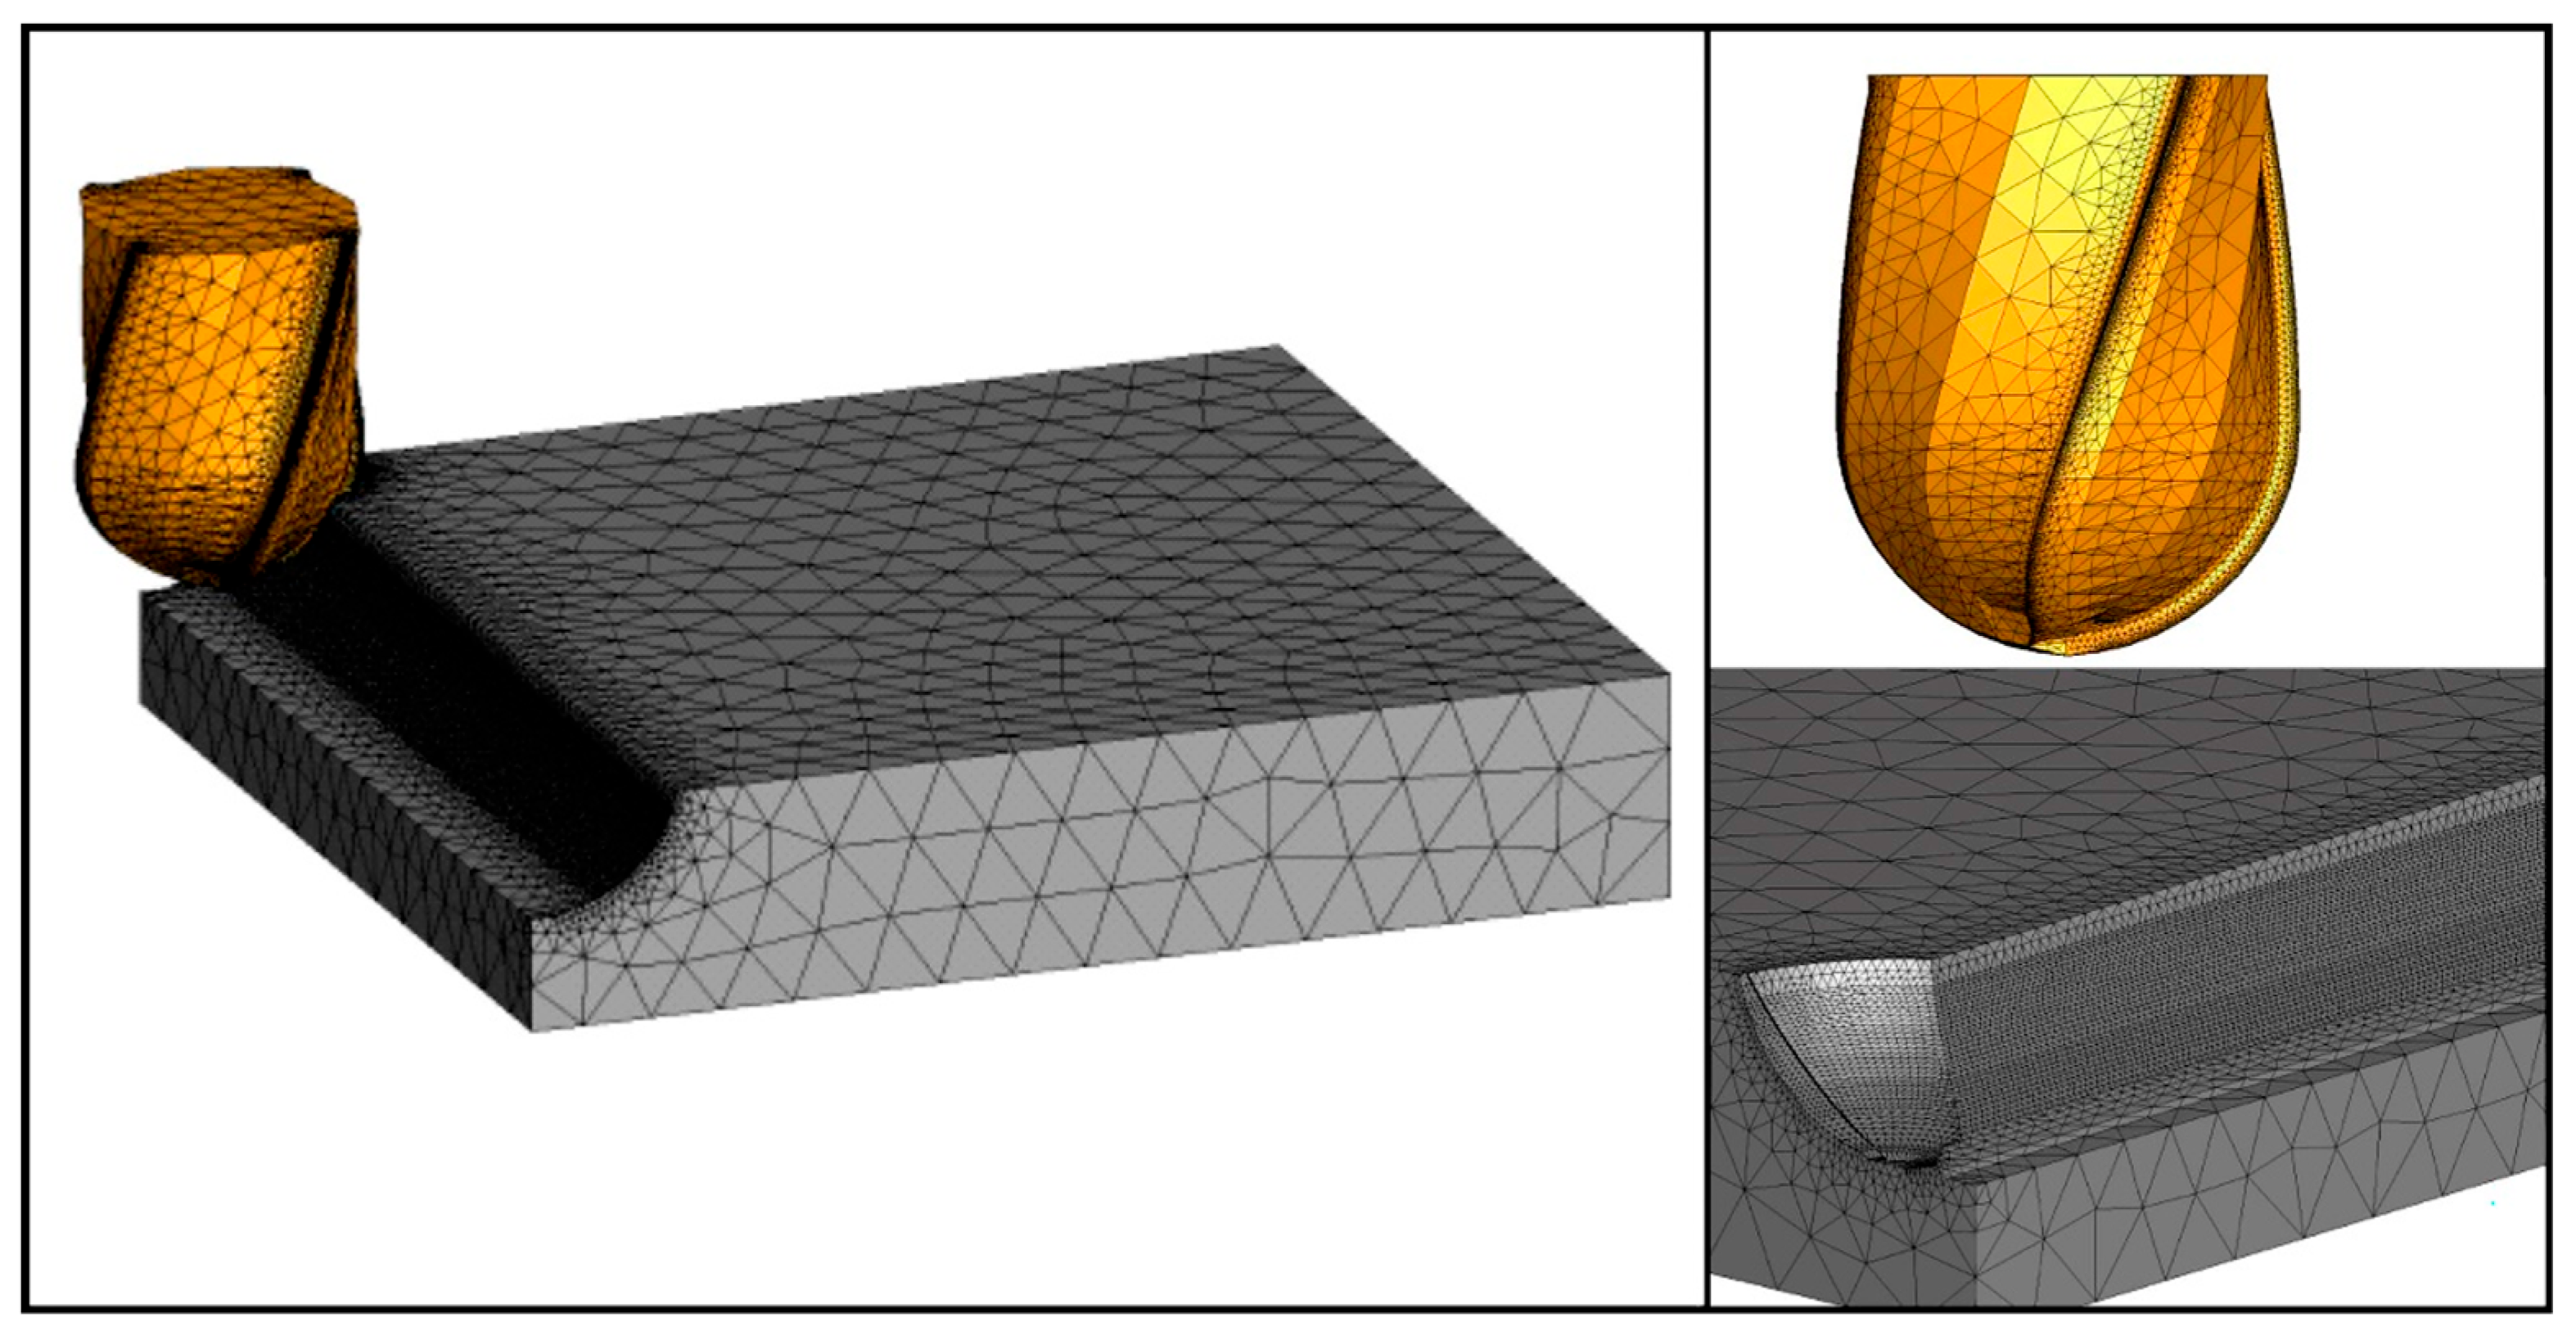
Figure 8 illustrates a 3D CAD model to plan the laser heat source path.
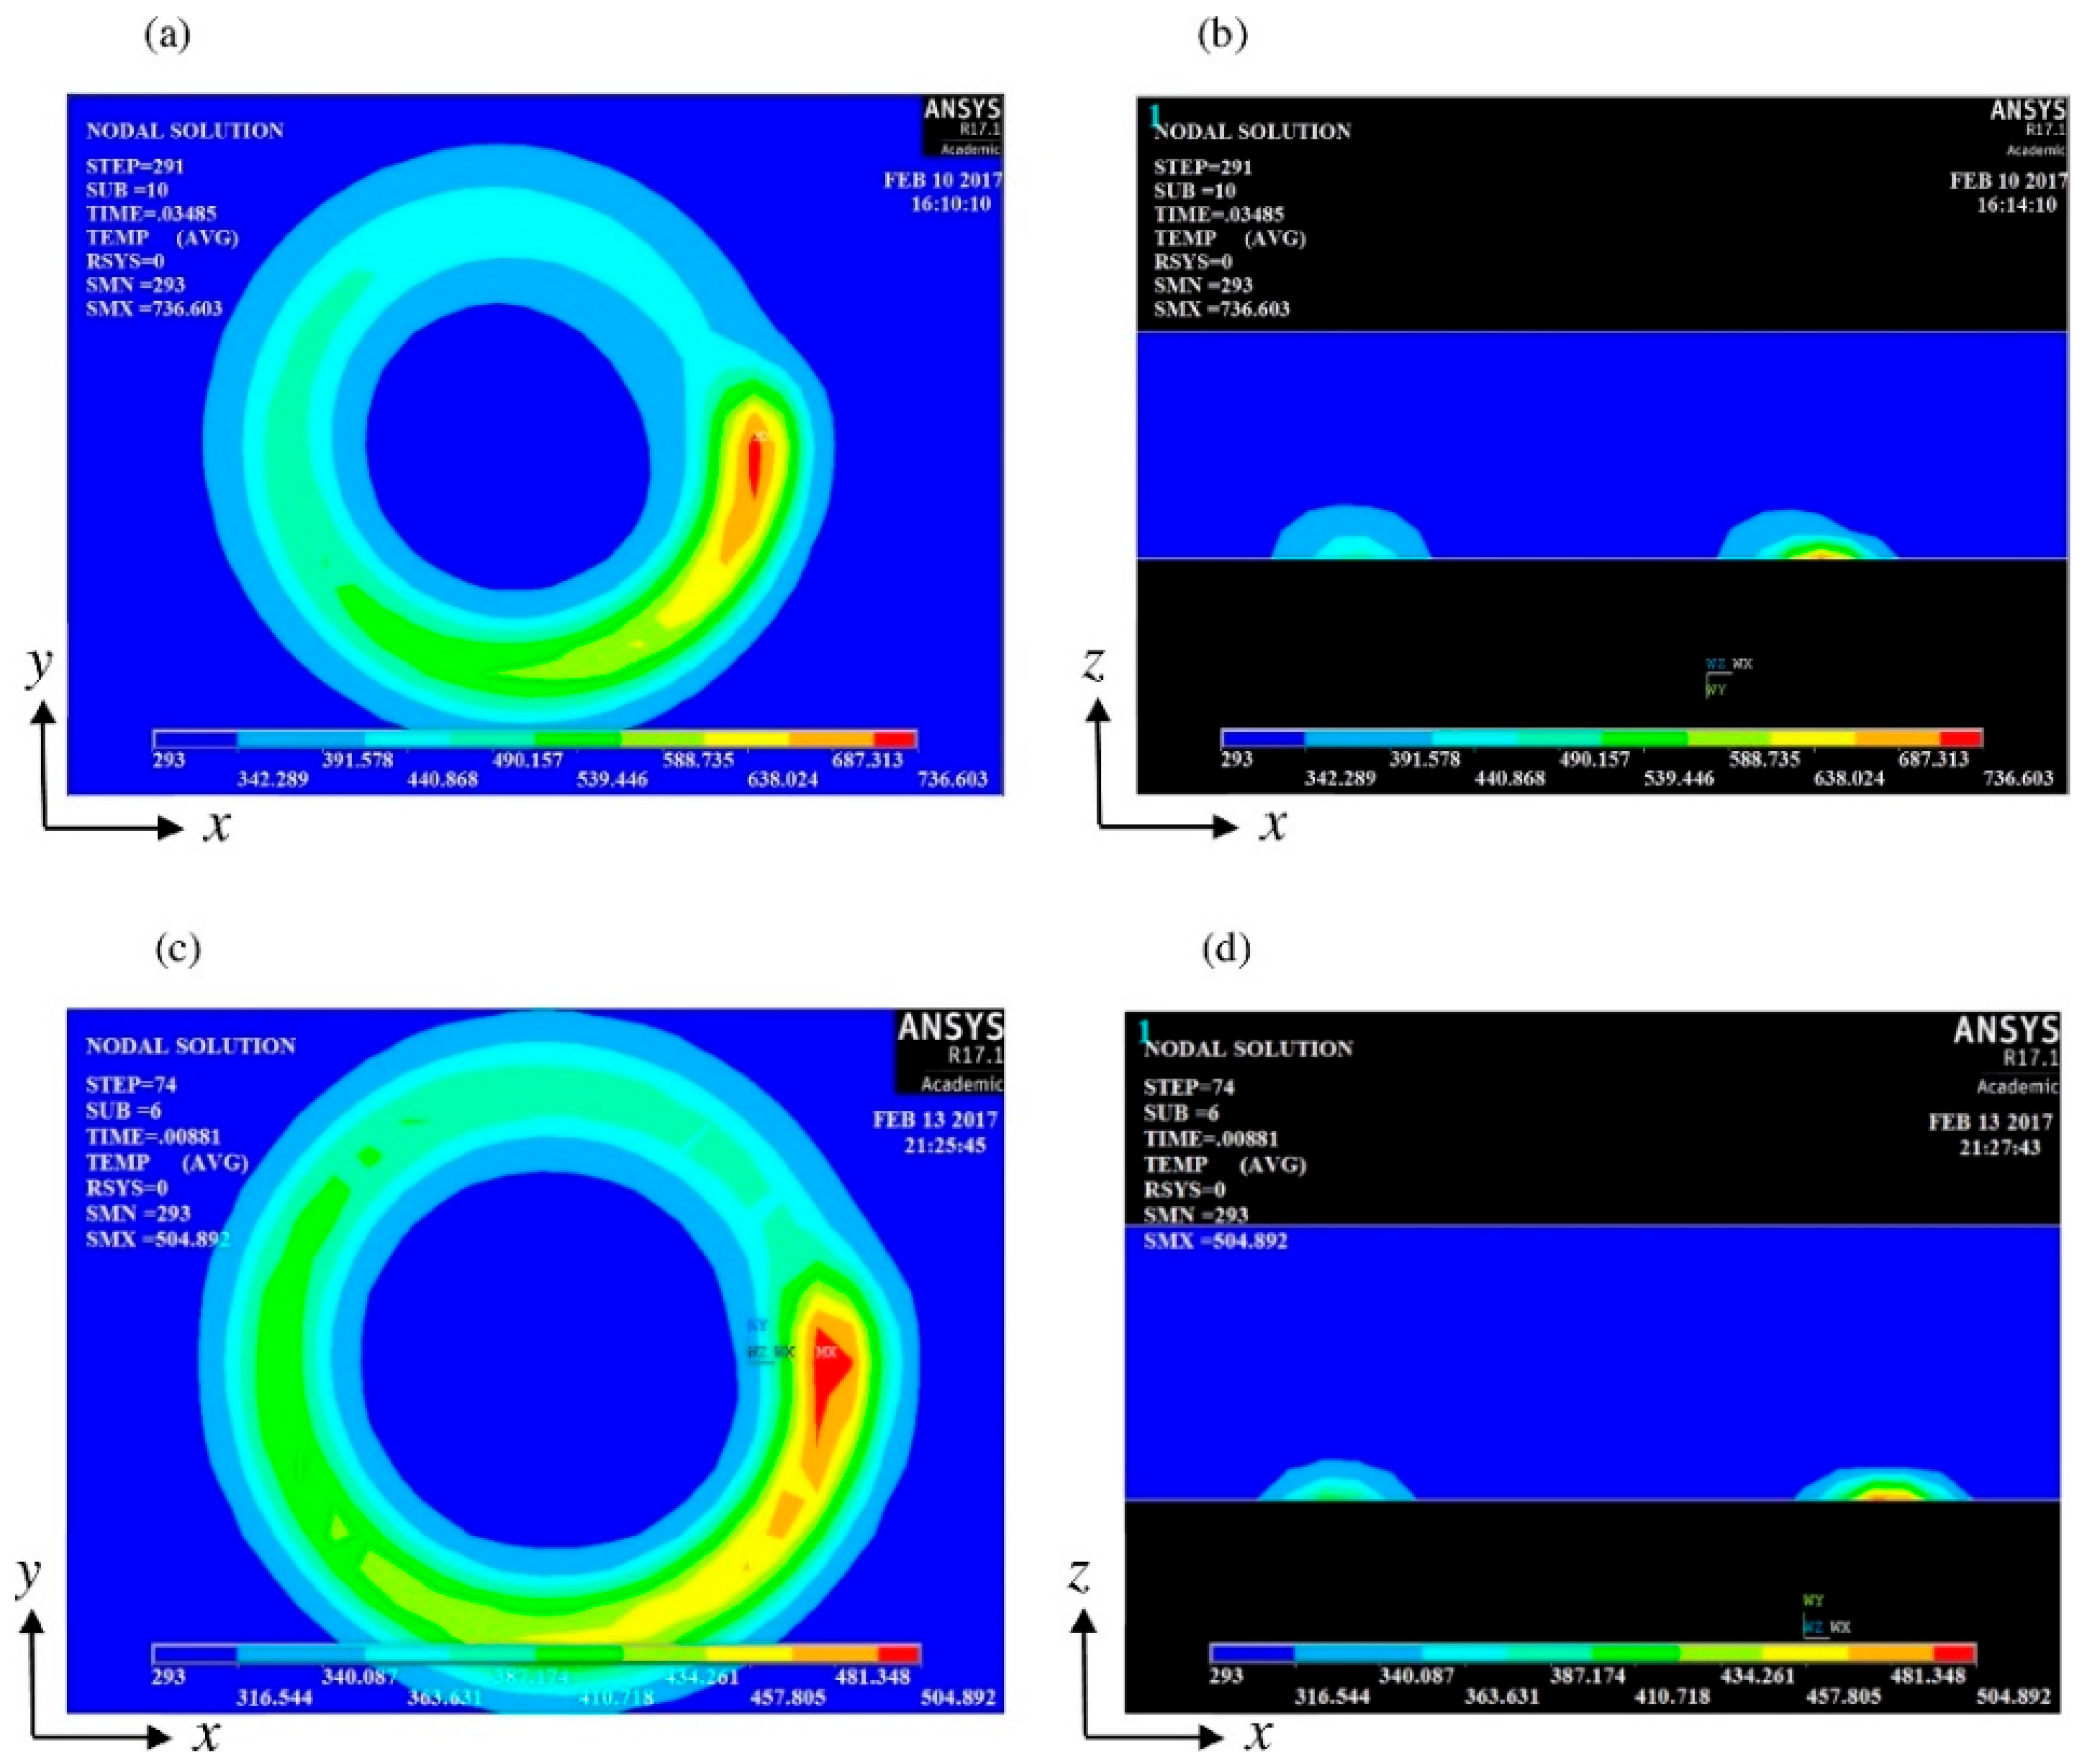
Electromagnetic FEA is a suitable type of numerical analysis for IAM. The primary aspects for the investigation of IAM are the dwell t required to attain the intended preheating T and the EDOC. The governing equation of the electromagnetic analysis can be expressed using Maxwell’s Equation (24) [131,135,136]:
× 1 μ 0 μ r × A m a g + σ e l c δ A m a g δ t J s = 0
where μ0 is the vacuum magnetic permeability, μr is the relative magnetic permeability, Amag is the magnetic vector potential, σelc is the electrical conductivity, and Js is the source current density. As described in the LAM section, the preferable range of preheating T for INCONEL® 718 and INCONEL® 625 is the same.
Following the presentation of the theoretical framework in Section 1, Section 2 delineates the methodology employed in this study, which is based on the Systematic Literature Review (SLR) approach [137] aimed at summarising how the research was conducted. In Section 3, the state of the art is demonstrated for different types of machining, depicting evolutionary trends and remarks from the researchers’ work. Section 4 discusses findings derived from content analysis, and Section 5 succinctly summarises the findings and offers a brief outlook on INCONEL® alloy machining simulation.

2. Materials and Methods

The research and information-compiling phases were carried out through the SLR approach since it is based on a systematic, method-driven, and replicable approach [138,139]. The platform used for SLR was Dimensions.ai, which is connected to all data in Scopus through quality criteria by consulting each journal’s influence within the academic community on the basis of the impact factor (IF). Thanks to Elsevier, Springer, AIP Publishing, ASME, MDPI, and IMeche articles and books from Woodhead Publishing, Butterworth-Heinemann, Elsevier, Academic Press, CRC Press, and Publindustria, this article collects information from 125 reports, 25 book chapters, and 5 standards from 266 articles and 20 books researched. The research procedure is described next:
  • Information was searched with the “INCONEL® 718”, “INCONEL® 625”, and “Johnson-Cook criteria” keywords to gather a broad range of information about material modelling.
  • The keywords “FEA” and “Traditional machining processes” were added to enable a search for information about the numerical modelling of traditional manufacturing processes. To refine the data even further, “Numerical models”, “ABAQUS”, “ANSYS®”, and “DEFORM®” keywords were included to gather the desired information.
  • After collecting the articles, the journal’s influence was evaluated with its Web of Science score from 2022 (ignoring quartiles). All journals with an IF value less than three were excluded, although rounding to the unit was allowed.
  • The abstracts and conclusions from the collected articles were analysed.
  • Knowledge from 2013 to 2023 about the modelling of traditional INCONEL® 718 and 625 processes was compiled.
The review article regarding INCONEL® alloy’s numerical analysis on traditional machining predictability was written down.

3. Literature Review

3.1. CM Processes

This section addresses FEA applied to more traditional manufacturing processes, such as milling, turning, and drilling.

3.1.1. Milling

Jia et al. [140] developed a simulation model using ABAQUS to replicate a milling experiment involving the micro-milling of thin-walled parts made of INCONEL® 718. The aim was to predict the cutting force (Fc) and anticipate wall deflection in these parts using an element birth/death technique. The mesh type of the tool model was set as C3D4 (four-node tetrahedral element for general purpose), and the mesh type of the thin-walled part model was set as C3D8R (eight-node brick element with reduced integration and shear locking effect control [141]). Comparing the simulation output for Fc with experimentally measured values, the model showcased maximum and average relative errors of 7.8% and 2.2%, respectively, validating its accuracy. The results underscored the accuracy of the proposed simulation model for micro-milling thin-walled parts, as depicted in Figure 9, and highlighted the precision of the Fc prediction.
Okafor and Sultan [142] constructed a mechanistic model aimed at predicting Fc during the high-speed end milling of INCONEL® 718, employing a wavy-edge, bull-nose, helical end mill (WEBNHE) as illustrated in Figure 10. The authors proceeded to conduct end-milling experiments to validate the output of the mechanistic model. The MATLAB® mathematical model of the end-mill geometry was simulated. Upon comparing the predicted Fc values with the experimentally measured ones, the authors concluded that the values in Table 9 accurately supported the mechanistic model.
Ducroux et al. [143] (Figure 11) presented numerical and experimental milling comparisons between wrought and additively manufactured (AM) INCONEL® 718 specimens. The machinability was investigated through microstructure observation and Fc analysis, followed by TW characterisations for both specimens. Novel formulations of the Fc model in milling were developed and modelled with a fully parameterised mechanistic approach. Additionally, the tool geometry and the model concerning local forces consider the VB effect. The additively manufactured INCONEL® 718 showed better machinability. TL was double compared with the wrought-stock. Considering that TW significantly and directly affects Fc, a local model formulation, as proposed with the tool geometry evolution, has to be considered to improve the model precision; however, it is challenging to consider VBmax > 0.25 mm in a predictive model, as it creates too many random TW profiles.
Zheng et al. [144] numerically (Figure 12) and experimentally assessed the machinability of INCONEL® 718 in milling. The FEA model, produced in AdvantEdge® v7.1 from Third Wave System©, was used to analyse the stress field, T distribution, and Fc. Milling experiments on INCONEL® 718 were designed, the results obtained were compared with the FEA model to validate it, and MATLAB® was used to further optimise the experimental processing parameters. FEA revealed notable T increases in the machining zone with rising s, ae, ap, and fz. Validation against experiments and the calculated results from the milling force model and FEA exhibited minor deviations. The optimal experimental parameters were s = 3199.2 rpm, a feed rate (f) of 80 mm/min, and ap = 0.25 mm.

3.1.2. Turning

Díaz-Álvarez et al. [45] evaluated the progression of TW and the T distribution during the turning of INCONEL® 718 in a TiN-coated insert. This assessment encompassed both experimental and FEA approaches in DEFORM® 3D software, as depicted in Figure 13, varying the tool cutting edge angle (κr). The numerical model was validated through turning experiments, and the principal wear mechanisms, such as chipping, notching, and built-up edge (BUE), were compared with variables forecasted by the numerical model.
Zhang et al. [93] devised an innovative numerical forecasting approach for the tool VB rate of PVD TiAlN-coated carbide tools. This method is grounded on the positive feedback interconnection between the tool geometry and TW rate during the dry orthogonal cutting of INCONEL® 718, featuring various scenarios, as demonstrated in Figure 14. The numerical model made in AdvantEdge® v7.0 from Third Wave System© has a margin of error below 15% when juxtaposed with experimental findings, highlighting the potential of this method to predict TW accurately.
Yadav et al. [46] experimentally and numerically assessed the material removal rate (MRR) and VB during the turning of INCONEL® 718. A Chemical Vapour Deposition (CVD)-coated WC tool was used for experimental studies. In parallel, a 3D model was developed using the LAG approach in the DEFORM® 3D software. The comparative error between the experimental and simulated results for the MRR and VB remained under 7%. The simulations consistently projected higher values for MRR and VB than those observed in the experimental data (Figure 15). The authors concluded that the simulations could significantly economise valuable t and material resources owing to the demonstrated accuracy.
Xu et al. [47] devised an experimental and numerical investigation of the turning process for INCONEL® 718 utilising worn tools. The study encompassed an assessment of chip formation, as depicted in Figure 16, force variation, TW, and thermal distribution in ABAQUS. The element type used for the workpiece was EC3D8RT, and the tool was C3D8T (an eight-node trilinear thermally coupled brick element). The numerical meshing approach was CEL. Empirical findings revealed that, at higher vc, more distinct serrated chips were evident, with a narrower shear band compared to lower vc. The study demonstrated a strong agreement between the experimentally observed results and the simulated outputs, particularly concerning Fc, chip morphology, and thermal distribution, which substantiates the capability of the numerical model to replicate the machining process, even with worn tools, accurately.
Jafarian et al. [145] proposed a new and efficient method based on an evolutionary optimisation algorithm to identify JC material constants for INCONEL® 718. The subsequent orthogonal cutting process of INCONEL® 718 was numerically simulated in DEFORM® 2D using the new material model and two tool edges (chamfered and honed), and the outcomes were compared with experimental results. The numerical Fc, maximum temperature (Tmax), and chip geometry, the last one shown in Figure 17, were validated. The overall error of the simulations in the first and second steps was reported at 12.8% and 11.3%, respectively, enhancing the knowledge of modelling surface integrity in machining processes.
López-Gálvez and Soldani [48] focused on determining optimal numerical parameters, such as mesh size and element deletion criterion, to model the chip-removing process, as Figure 18 shows. The numerical model was built in ABAQUS with a LAG approach. The thermo-mechanical analysis was realised using C3D8R elements. The comparison between numerical and experimental measurements exhibited excellent accuracy, manifested by an average relative error of 2% between numerical and experimental Fc, considering vc = 300 m/min.
Gong et al. [146] applied DOE to a developed numerical model in AdvantEdge® to assess a turning simulation of INCONEL® 718 in dry and cryogenic N2(l) cooling/lubrication environments and then compared the results with Tcut and Fc obtained in experimental tests carried out with the same input parameters. As illustrated in Figure 19, numerically, it was found that the cryogenic strategy reduced Tcut by 11.68%, 9.42%, and 11.98% for vc = 70 m/min, 100 m/min, and 130 m/min, respectively. On the other hand, the peak tool temperature (Tt) was reduced in cryogenic conditions by 9.36%, 8.81%, and 9.23% for vc = 70 m/min, 100 m/min, and 130 m/min, respectively. These values enhance the predictability of numerical modelling for improving machining performance.
Jafarian et al. [147] adopted new strategies to improve the accuracy of FEA modelling of the INCONEL® 718 cutting process in the software DEFORM® 2D v10.0. A novel hybrid strategy was established to simultaneously calibrate controllable simulation parameters, implemented based on DOE, intelligent systems, and the FEA of the cutting process. The numerical data were validated based on experimental results, verifying significant improvements in predicting the chip geometry, Fc, and Tmax (the last two portrayed in Figure 20). Experimental grain size and hardness variation results were compared with the corresponding numerical counterparts obtained using the JC and new material models. It was shown that implementing a grain-size-based method increased the simulation accuracy.
Qiu et al. [148] built a 3D FEA model in AdvantEdge® v7.1, and the simulation’s reliability was confirmed through a comparative analysis of the outcomes with a hybrid orthogonal experiment, as shown in Figure 21. A sensitivity analysis of JC parameters and μ in the simulation results under low- and high-vc conditions was carried out. The authors found that the simulation accuracy of INCONEL® 718 is susceptible to ε hardening and thermal softening parameter evaluation with the JC constitutive model, which significantly influences the residual stress, hch, Fc, and T. The μ parameter only significantly affects Fa and Fr in the high-vc condition.
Liu et al. [54] experimentally and numerically analysed the effect of the tool geometry on the thermal–mechanical load and residual stresses in the orthogonal machining of INCONEL® 718. In ABAQUS, the CEL method was selected to simulate the effect of the tool geometry on T, Fc, PEEQ, and residual stresses. The element type used in the Eulerian-part domain was EC3D8RT, and the tool was defined as rigid by using an eight-node thermally coupled brick element. The experimental results validated the numerical model, and the CEL model was able to cope with reality regarding the T distribution, Fc, and residual stress profiles. Figure 22 demonstrates the T distribution around the tool edge and along the workpiece depth, influenced by different tool geometries when turning INCONEL® 718.
Tian et al. [18] conducted a reverse identification of JC parameters for INCONEL® 718, considering specimens in both the solution-annealed and precipitation-hardened states. Experimental orthogonal cutting was employed to obtain the average Fc and hch, validating the FEA model produced in DEFORM® 2D v12.0. In the experimental analysis, the Waldorf model [149] was integrated to describe the deformation characteristics (ε, T, ε ˙ , and σ) of the primary shear zone, incorporating the influence of the cutting-edge radius on Fc during the cutting process. Figure 23 demonstrates an evaluation of how TW affects the material separation point during turning. The study determined JC constitutive constants for specimens in both solution-annealed and precipitation-hardened states, revealing a notable divergence in the mechanical response as evidenced in the constitutive parameters, Fc, and chip morphology. The error of Fc was found to be within 5%, indicating that the proposed method significantly improves the accuracy of the simulation results. Furthermore, it was established that the type of TW influenced the distribution pattern of the thermal–mechanical load during cutting by altering the length of the tool–workpiece contact and the position of the separation point. However, the authors stated that the proposed method only applies to low vc in challenging-to-machine materials.
Peng et al. [150] focused on proposing a novel empirical equation for predicting residual stress on the turned surface of INCONEL® 718, considering tool parameters such as κr, γ, and inclination angle (λs). Initially, the accuracy of the parameters set for the 3D FEA model through AdvantEdge® v7.4015 was validated by comparing the residual stresses and chips with the experimental results (Figure 24). According to the obtained results, the predictive equation of surface residual stress accurately predicted turned surface residual stress for INCONEL® 718 materials. However, some flaws arose: γ and λs cannot be zero at the same time, and |γ| cannot equal |λs| when κr = 45° or 135°. The absolute mean discrepancy and the Pearson correlation coefficient (R) were 13.40% and 0.9624, respectively, indicating that this model can be used in the real-time monitoring of turning INCONEL® 718 and can also predict the residual stress level to guide process planning.
Tu et al. [151] systematically investigated the TW characteristic of cubic Boron Nitride (cBN) at different vc values in the dry turning of INCONEL® 718 in experiments and FEA simulations (Figure 25). The FEA model developed in AdvantEdge® with initial VB was established and validated. The parameter μ as a function of VB between the tool and workpiece in the turning process was determined to be in the range of 0.3–0.7 by Fc component measurements. Differences were attributed to the varied TW and Fc. FEA simulations visually presented the tool flank T distribution dependent on VB. Tmax was located at the tool cutting edge and tooltip and decreased in the tool substrate. The dominant TW mechanisms were described as adhesive wear and cutting-edge chipping at the flank face and rake face. The tool failed due to the catastrophic fracture of the cutting edge.
Kortabarria et al. [152] estimated machining-induced residual stresses in INCONEL® 718 orthogonal cutting. An FEA model was constructed using DEFORM® 2D v10.2 software, and a sensitivity analysis was performed to evaluate how the input data within the model affected the predicted residual stresses, as depicted in Figure 26. After analyses, it was concluded that only the material constitutive law was significant in predicting residual stresses. Moreover, the material behaviour at a high heating rate was crucial for realising accurate predictions.
Pervaiz et al. [153] conducted a machinability analysis for INCONEL® 718 using a numerical approach undertaken in AdvantEdge®, substantiated by experimental validations. Dry and N2(l) methods were compared based on relevant parameters, including the chip compression ratio, shear angle, contact length, Fc, and energy consumption (Pin) for the primary deformation zone (PDZ) and SDZ. In addition, parameters related to chip morphology were also investigated. Observations from experimentation and numerical analysis (Figure 27) demonstrated a lower chip compression ratio when using N2(l) cooling, accompanied by a larger shear plane angle. Consequently, this configuration reduced the tool-to-chip contact length and improved lubrication.
Razanica et al. [53] suggested an innovative model, the Progressive Ductile Damage (PDD) model, to depict and simulate the chip formation process of INCONEL® 718, incorporating a novel approach based on rigid visco-plastic flow and continuous damage evolution. FEA was performed using DEFORM® 2D software. The resultant material response with this approach is depicted in Figure 28. The JC model was employed at the onset of damage initiation, while a modified CL failure criterion controlled the damage evolution. The accuracy of numerical outcomes was validated through experimental machining tests by observing, analysing, and comparing the formation of continuous and serrated chips (depending on vc), Fc, chip shapes, and tool–chip contact lengths.
Bücker et al. [49] presented a new approach that combines high-pressure fluid supply and high cooling performance using a Deep Temperature Emulsion (DTE) to improve cooling effectiveness. DEFORM® 3D FEA was carried out on the high-speed turning of INCONEL® 718, and the model (Figure 29) was validated through experimental measurements of Fc, TW, chip formation, and surface integrity. Machining and heat transfer FEA at the cutting zone indicated the importance of cutting fluid penetrability into the cutting zone due to the low thermal conductivity of the workpiece, chips, and cutting tool, which augments conductive heat transfer.

3.1.3. Drilling

In the context of traditional drilling processes, Chenegrin et al. [103] carried out computational calculations in a numerical model focused on INCONEL® 718 drilling. The aim was to analyse heat transfer as a function of drilling parameters and analytically depict chip geometries (as shown in Figure 30) using process parameters and the drill tool’s geometry. In the 2D Merchant’s software, the R-ALE method modelling approach was applied to simulate the drilling of a 17 mm deep hole in a cylindrical workpiece. Notably, the numerical model successfully predicted the T distribution at the hole’s mid-depth and the drilling operation’s beginning and end.
Attanasio et al. [154] aimed to model (Figure 31a,b) and simulate TW (Figure 31c,d) in the drilling of INCONEL® 718 using an innovative numerical procedure to update the worn tool’s geometry in DEFORM® 3D software. Experimental tests were performed to measure TW in drilling and to validate the numerical models. Conventional Metal Working Fluids (MWFs) [155] and N2(l) cryogenic cooling environments were used in both approaches. The comparison between simulated and measured results demonstrated the suitability of the developed drilling model to predict TW under MWF and N2(l) cooling conditions. Thus, the formulated model is adept at effectively assessing the impact of the cutting process and cooling conditions on TW, minimising the number of expensive tests.

3.2. Non-Conventional Manufacturing Processes

This section addresses FEA applied to non-conventional manufacturing processes.

3.2.1. Electrochemical Machining (ECM)

In the context of non-conventional manufacturing, such as ECM, Niu et al. [156] concluded that enhanced tool designs for the initial machining phase could be achieved by modifying the configuration and arrangement of tool-sidewall outlet holes in the electrochemical mill grinding (ECMG) of INCONEL® 718 using the FLUENT 15 computational fluid dynamics software. Four distinct tools, each featuring varying numbers of rows of tool-sidewall outlet holes, were conceived and subjected to numerical analysis. The FEA outcomes demonstrated that an abrasive tool with four rows of tool-sidewall outlet holes yielded a superior MRR, f parameter, and electrolyte pressure due to an optimal flow velocity distribution, as depicted in Figure 32. Experimental assessments of machining a slot using this tool indicated an amplified MRR with a higher applied voltage (U), electrolyte pressure, and f. In the rough machining phase, the original tool yielded an average sidewall flatness and an arithmetic average of profile height deviation (Ra) of 549.6 μm and 2.509 μm, respectively. The results of the average sidewall flatness and sidewall Ra attained with the newer tool were markedly reduced to 340.5 μm and 1.65 μm, respectively. The new tool was also employed for finishing machining, resulting in an average sidewall flatness and sidewall Ra of 69.5 μm and 0.648 μm, respectively.

3.2.2. Thermally Assisted Machining (TAM)

Hybrid manufacturing processes like TAM can feature conventional milling and lathing. Kim and Lee [130] investigated the deployment of LAM for the machining of an INCONEL® 718 workpiece with a 3D curved shape by employing Non-Uniform Rational B-Spline (NURBS) techniques and employing different tool paths, such as ramping and contouring, while varying machining conditions. The authors utilised ANSYS® v.18 software for the numerical evaluation of the varied tool paths, employing different meshing approaches, as depicted in Figure 33. Furthermore, the authors examined the T resulting from laser heating on the INCONEL® 718 workpiece. Experimentally, they scrutinised ap obtained in thermal FEA, Fc, Specific Cutting Energy (SCE), and Ra. These parameters were meticulously measured, analysed, and set against CM and LAM. Remarkably, LAM demonstrated a significant enhancement in these machining characteristics compared to conventional machining. The numerical results obtained in the reported study employed experimental LAM endeavours involving a diversity of 3D shapes.
Kim and Lee [131] assessed machining efficiency in the context of INCONEL® 718 machining, utilising Pin as a metric. The study encompassed three machining approaches: CM, LAM, and IAM, as depicted in Figure 34a,b. Utilising ANSYS® software, the researchers conducted numerical thermal and thermal–electromagnetic analyses to validate the EDOC and dwell time resulting from preheating, presented in Figure 34c–f, revealing that the optimal dwell t = 20 s, and the effective ap = 0.5 mm. Parameters including Pin, Fc, and Ra were thoroughly experimentally analysed under LAM and IAM approaches’ machining conditions. Pin increased with an increase in f, primarily due to the necessity to sustain the preheating T. Notably, IAM exhibited the highest Pin as it necessitated a lengthier preheating duration due to lower thermal energy concentration. Compared with CM, a 32% increase in Pin was observed in LAM, accompanied by 41% and 51% reductions in Fc and Ra, respectively.
Similarly, when compared with CM, a 66% increase in Pin was noted in LAM, alongside 45% and 32% decreases in Fc and Ra, respectively. It was observed that both LAM and IAM consumed more power than CM; nevertheless, they exhibited enhanced machinability. Ultimately, this study identified LAM as the most suitable hybrid machining process.
Jeong and Lee [133] made significant strides in enhancing the machinability of INCONEL® 718 by applying LAM and a heat shield, as illustrated in Figure 35a,b. The authors conducted experimental analyses, specifically TL experiments, with a uniform MRR while varying the usage of the heat shield. A numerical thermal analysis was also conducted in ANSYS® software to ascertain the EDOC. The study provided a comprehensive account of the alterations in TL and machining efficiency resulting from implementing the heat shield, elucidating its effectiveness. The FEA thermal analysis determined that an optimal ap = 0.3 mm could be achieved with a preheating T = 900 °C. In terms of Tt, it was observed that, without the heat shield, Tt = 643.73 °C (Figure 35c), whereas with the heat shield, Tt = 535.56 °C (Figure 35d), effectively mitigating the dissipation of laser-generated heat to the tool. Concerning TL, LAM increased it by approximately 53% compared to CM. Conversely, using LAM in conjunction with the heat shield resulted in a remarkable 78.3% increase in TL compared to CM, attributed to the protective function of the heat shield, which reduced the detrimental effects of heat transferred to the tool, thereby minimising abrasions, cracks, and fractures in the tool.
Zhang et al. [51] employed LAM to enhance the machinability of INCONEL® 718 and focused on investigating the Heat-Affected Zone (HAZ). The paper details a proposed and developed theoretical model to describe the gradient of σ within the HAZ during the LAM process on INCONEL® 718 based on the workpiece’s strengthening mechanisms, microstructure, and T distribution. Comparative analysis with the JC equation revealed that the model successfully predicts the HAZ range, quantitatively characterises the EDOC within the HAZ, and also predicts σ of the HAZ and determines its range during LAM, as depicted in Figure 36a and Figure 36b, respectively. The T amplitude at different depths decreased with increasing distance from the surface. The error between the σ predicted by the proposed model at T0 and the experimental data remained within a 5% tolerance, confirming the accuracy of the predicted results, as they aligned with the experimental outcomes.
Additionally, it was observed that the gradient of σ decreased with higher PLaser and reduced laser scanning speed. During the heating process, when T < 700 °C, the precipitation strengthening component (σp) contributed to over 50% of σ, surpassing the contributions of the solid solution strengthening component (σSS), grain boundary strengthening component (σD), and Ni-matrix strength component (σNi). As the T amplitude increased, σp significantly decreased, σSS increased, and σD and σNi experienced a gradual reduction. The slow rise in σ during the cooling stage was attributed to σD and σNi.
Zhang et al. [157] assessed the Laser-Assisted Micro-Milling (LAMM) process of INCONEL® 718 using a combination of experiments and FEA simulations in ABAQUS (Figure 37). First, a 3D thermal–mechanical coupled FEA model of LAM was established, followed by experiments and FEA simulations to investigate the impact of LAM on Fc, chip morphology, TW, and surface topography. The milling tool was discretised by R3D4 (rigid tetrahedral elements). C3D8RT elements were considered to discretise the workpiece, and the Coloumb [115,116] friction model described the friction behaviour between the milling tool and the workpiece with a μ = 0.2. The results indicated that LAM enables σu and G reduction, which improved the cutting performance, reducing Fc by 40.5% while enhancing surface integrity and chip continuity and prolonging TL, compared with CM.

3.2.3. Laser-Beam Machining and Laser Drilling Machining (LBM and LDM)

In the context of LBM, Pan et al. [134] conducted an experimental investigation to characterise the shape of the melting zone for INCONEL® 718. The authors explored the impact of the laser scanning speed, utilising a trochoidal path and varying PLaser, on the absorption ratio. Additionally, a 3D FEA was proposed to predict the T distribution in parallel with experiments by utilising ANSYS®, as portrayed in Figure 38. This FEA successfully predicted the T distribution field of the coaxial laser preheating system for INCONEL® 718 LBM, closely approximating the experimental conditions. The study observed that the melting zone area, depth, and width (MZA, MZD, and MZW, respectively) consistently decreased with increasing laser scanning speed for each PLaser value utilised (400, 600, and 1000 W). Furthermore, higher PLaser values were found to positively influence MZA’s increase.

4. Discussion

Considering all the reviewed content, some previous conclusions can be drawn and discussed. Starting with the work of Chenegrin et al. [103], the authors demonstrated that chip formation is crucial for drilling and milling; nonetheless, pre-modelling may be necessary to start the material cutting. Additionally, it was noted that most of the reviewed works were based on orthogonal cutting. This situation is tied to the fact that the measuring equipment used in turning is more accessible for the practical validation of numerical values than the equipment used in milling or drilling, posing a challenge for researchers attempting milling operations in association with FEA. Regarding numerical strategies, Outeiro [6] and Mir et al. [100] highlighted a significant limitation of both ALE and CEL formulations for metal-cutting simulations—the inability to accurately simulate chip geometry, which is particularly problematic for the serrated chip formation observed when machining challenging-to-cut materials like INCONEL® alloys and is a subject that needs future improvements in order to fine-tune the accuracy of the outcomes. Iturbe et al. [10] emphasised the importance of considering thermal softening phenomena in initiating and amplifying chipping morphology, leading to the formation of adiabatic shear bands in machining simulations, and it was found that Hokka et al. [42] improved the numerical results by applying an additional ε softening term to the INCONEL® 625-like alloy JC model, allowing a decrease in ε ˙ hardening at large deformations. On the other hand, Wang and Liu [65] demonstrated that JC parameters have a notable impact on the chip shape for Ti6Al4V, underscoring the need to adjust JC constants through experimental results, which, in this case, can be very much extrapolated to the INCONEL® alloy study.

5. Conclusions

A concise overview of FEA strategies is presented to systematically summarise and analyse the recent advancements in predicting INCONEL® machining using FEA from 2013 to 2023. This review also highlights the most recent numerical solutions, prospects, and limitations that researchers have faced. The numerical predictive models developed by these researchers were validated through experimental testing. Notably, a prevalent trend among researchers was observed:
  • Seventeen reviews for orthogonal cutting or turning;
  • Seven reviews for milling;
  • Two reviews for drilling;
  • One review for LBM/LDM.
Hybrid manufacturing processes were considered within each category, depending on CM. Regarding the preference for FEA turning in the context of INCONEL® machining, it can be explained as follows:
  • FEA models of the turning process are more straightforward to simulate than those for milling or drilling processes.
Regarding the model design, two primary approaches were identified:
  • The tool is fixed and rigid while the material is moved against it;
  • The material is secured in the chuck (as in real-life scenarios) while the tool moves along the workpiece.
Nowadays, there is still a necessity to have numerous models for TW behaviour predictability since machining is a very highly thermodynamically, tribologically, and material-dependent process. In this regard, the following is noticeable:
  • Most of the authors prefer Usui’s diffusive wear model since Taylor’s empirical TL model requires extensive calibration work, and material adhesion is difficult to measure (considering all adhesion models addressed);
  • The JC constitutive model does not adequately address thermal softening phenomena, which may lead to divergent outcomes when compared to experimental results;
  • Although it has been determined that the major setback in terms of numerical approaches is the material constitutive model chosen, FEA applied to the machining of INCONEL® alloys has shown promise in providing accurate results, effectively addressing certain drawbacks inherent in JC application in numerical material modelling, a preferred approach for many researchers;
  • There is high confidence that future studies will increasingly utilise FEA to predict and support experimental tests by improving INCONEL® alloy machining and material modelling and considering all thermodynamical and tribological phenomena in the tool–workpiece interface.
INCONEL® machining simulation through FEA effectively enhances experimental analyses. It provides a more precise calibration of parameters, the improved prediction of process T, a more accurate forecast of TW and surface quality assessment, and a more informed selection of potential coatings for tools. This knowledge is poised to facilitate broader accessibility to INCONEL® machining for researchers and practitioners alike.

Author Contributions

Conceptualisation: A.F.V.P., F.J.G.S. and R.D.S.G.C.; methodology: A.F.V.P., F.J.G.S., R.D.S.G.C. and R.C.M.S.-C.; validation: R.D.S.G.C., R.D.F.S.C., M.L.S.B., N.P.V.S. and A.M.P.d.J.; formal analysis: R.D.F.S.C., M.L.S.B. and R.C.M.S.-C.; investigation: A.F.V.P. and N.P.V.S.; data curation: F.J.G.S., R.D.S.G.C., R.C.M.S.-C. and A.M.P.d.J.; writing—original draft preparation: A.F.V.P.; writing—review and editing: F.J.G.S., R.D.S.G.C., R.C.M.S.-C. and A.M.P.d.J.; visualisation: N.P.V.S., R.D.S.G.C. and R.C.M.S.-C.; supervision: F.J.G.S., R.D.S.G.C. and A.M.P.d.J.; project administration: F.J.G.S.; funding acquisition: F.J.G.S. All authors have read and agreed to the published version of the manuscript.

Funding

This work was developed under the “DRIVOLUTION—Transition to the factory of the future”, with the reference DRIVOLUTION C644913740-00000022 research project, supported by European Structural and Investments Funds with the “Portugal2020” programme scope.

Data Availability Statement

No new data were created.

Acknowledgments

The authors thank ISEP, INEGI, and CIDEM for their institutional support.

Conflicts of Interest

The authors declare no conflicts of interest.

References

  1. ASTM B 637-16; Standard Specification for Precipitation-Hardening and Cold Worked Nickel Alloy Bars, Forgings, and Forging Stock for Moderate or High Temperature Service. ASTM International: West Conshohocken, PA, USA, 2016; p. 7. [CrossRef]
  2. Pedroso, A.F.V.; Sousa, V.F.C.; Sebbe, N.P.V.; Silva, F.J.G.; Campilho, R.D.S.G.; Sales-Contini, R.C.M.; Jesus, A.M.P. A Comprehensive Review on the Conventional and Non-Conventional Machining and Tool-Wear Mechanisms of INCONEL®. Metals 2023, 13, 585. [Google Scholar] [CrossRef]
  3. Thornton, E.-L.; Zannoun, H.; Vomero, C.; Caudill, D.; Schoop, J. A Review of Constitutive Models and Thermal Properties for Nickel-Based Superalloys Across Machining-Specific Regimes. J. Manuf. Sci. Eng. 2023, 145, 080801. [Google Scholar] [CrossRef]
  4. Wan, M.; Liu, C.; Ren, Y.-Y.; Wen, D.-Y. Determination of fracture toughness and yield strength of Inconel 718 by milling operation. J. Manuf. Process. 2023, 101, 770–783. [Google Scholar] [CrossRef]
  5. Zannoun, H.; Schoop, J. Analysis of burr formation in finish machining of nickel-based superalloy with worn tools using micro-scale in-situ techniques. Int. J. Mach. Tools Manuf. 2023, 189, 104030. [Google Scholar] [CrossRef]
  6. Outeiro, J.C. Residual stresses in machining. In Mechanics of Materials in Modern Manufacturing Methods and Processing Techniques; Silberschmidt, V.V., Ed.; Elsevier: Amsterdam, The Netherlands, 2020; pp. 297–360. [Google Scholar]
  7. Dixit, U.S.; Shufen, R. 2—Finite element method modeling of hydraulic and thermal autofrettage processes. In Mechanics of Materials in Modern Manufacturing Methods and Processing Techniques; Silberschmidt, V.V., Ed.; Elsevier: Amsterdam, The Netherlands, 2020; pp. 31–69. [Google Scholar]
  8. Ciftci, K.; Hackl, K. Model-free data-driven inelasticity in Haigh–Westergaard space—A study how to obtain data points from measurements. Comput. Methods Appl. Mech. Eng. 2023, 416, 116352. [Google Scholar] [CrossRef]
  9. Benallal, A.; Billardon, R.; Lemaitre, J. Continuum damage mechanics and local approach to fracture: Numerical procedures. Comput. Methods Appl. Mech. Eng. 1991, 92, 141–155. [Google Scholar] [CrossRef]
  10. Iturbe, A.; Giraud, E.; Hormaetxe, E.; Garay, A.; Germain, G.; Ostolaza, K.; Arrazola, P.J. Mechanical characterization and modelling of Inconel 718 material behavior for machining process assessment. Mater. Sci. Eng. A 2017, 682, 441–453. [Google Scholar] [CrossRef]
  11. Lewis, J.; Pasco, J.; McCarthy, T.; Chadha, K.; Harding, M.; Aranas, C. High strain rate and high temperature mechanical response of additively manufactured alloy 625. J. Manuf. Process. 2022, 81, 922–944. [Google Scholar] [CrossRef]
  12. Lin, Y.C.; Huang, J.; Li, H.-B.; Chen, D.-D. Phase transformation and constitutive models of a hot compressed TC18 titanium alloy in the α+β regime. Vacuum 2018, 157, 83–91. [Google Scholar] [CrossRef]
  13. Rudnytskyj, A.; Simon, P.; Jech, M.; Gachot, C. Constitutive modelling of the 6061 aluminium alloy under hot rolling conditions and large strain ranges. Mater. Des. 2020, 190, 108568. [Google Scholar] [CrossRef]
  14. Wang, X.; Huang, C.; Zou, B.; Liu, H.; Zhu, H.; Wang, J. Dynamic behavior and a modified Johnson–Cook constitutive model of Inconel 718 at high strain rate and elevated temperature. Mater. Sci. Eng. A 2013, 580, 385–390. [Google Scholar] [CrossRef]
  15. Murugesan, M.; Jung, D.W. Johnson Cook Material and Failure Model Parameters Estimation of AISI-1045 Medium Carbon Steel for Metal Forming Applications. Materials 2019, 12, 609. [Google Scholar] [CrossRef] [PubMed]
  16. Zheng, Z.; Ni, C.; Yang, Y.; Bai, Y.; Jin, X. Numerical Analysis of Serrated Chip Formation Mechanism with Johnson-Cook Parameters in Micro-Cutting of Ti6Al4V. Metals 2021, 11, 102. [Google Scholar] [CrossRef]
  17. Partovi, A.; Shahzamanian, M.M.; Wu, P. Effect of Strain Rate Sensitivity on Fracture of Laminated Rings under Dynamic Compressive Loading. Materials 2022, 15, 472. [Google Scholar] [CrossRef] [PubMed]
  18. Tian, P.; He, L.; Zhou, T.; Du, F.; Zou, Z.; Zhou, X.; Jiang, H. Reverse identification of constitutive parameters of Inconel 718 alloy based on analytical model and thermo-mechanical loads analysis of machined surface. J. Mater. Res. Technol. 2022, 16, 1353–1370. [Google Scholar] [CrossRef]
  19. Pietrzyk, M.; Madej, L.; Rauch, L.; Szeliga, D. (Eds.) Chapter Three—Conventional Modeling. In Computational Materials Engineering; Butterworth-Heinemann: Boston, MA, USA, 2015; pp. 69–151. [Google Scholar]
  20. Campilho, R.D.S.G. Método de Elementos Finitos—Ferramentas para Análise Estrutural; Publindústria, Produção de Comunicação Lda.: Porto, Portugal, 2012. (In Portuguese) [Google Scholar]
  21. Zhang, L.; Zeigler, B.P.; Laili, Y. (Eds.) Chapter 1—Introduction to Model Engineering for Simulation. In Model Engineering for Simulation; Academic Press: Cambridge, MA, USA, 2019; pp. 1–23. [Google Scholar]
  22. Brenner, S.C.; Carstensen, C. Finite Element Methods. In Encyclopedia of Computational Mechanics, 2nd ed.; John Wiley & Sons, Ltd.: Hoboken, NJ, USA, 2018; pp. 1–47. [Google Scholar]
  23. Liu, C.; Wan, M.; Zhang, W.; Yang, Y. Chip Formation Mechanism of Inconel 718: A Review of Models and Approaches. Chin. J. Mech. Eng. 2021, 34, 34. [Google Scholar] [CrossRef]
  24. Hou, X.; Liu, Z.; Wang, B.; Lv, W.; Liang, X.; Hua, Y. Stress-Strain Curves and Modified Material Constitutive Model for Ti-6Al-4V over the Wide Ranges of Strain Rate and Temperature. Materials 2018, 11, 938. [Google Scholar] [CrossRef] [PubMed]
  25. Guo, Y.B.; Wen, Q.; Woodbury, K.A. Dynamic Material Behavior Modeling Using Internal State Variable Plasticity and Its Application in Hard Machining Simulations. J. Manuf. Sci. Eng. 2005, 128, 749–759. [Google Scholar] [CrossRef]
  26. Steinberg, D.J.; Cochran, S.G.; Guinan, M.W. A constitutive model for metals applicable at high-strain rate. J. Appl. Phys. 2008, 51, 1498–1504. [Google Scholar] [CrossRef]
  27. Shokry, A.; Gowid, S.; Mulki, H.; Kharmanda, G. On the Prediction of the Flow Behavior of Metals and Alloys at a Wide Range of Temperatures and Strain Rates Using Johnson–Cook and Modified Johnson–Cook-Based Models: A Review. Materials 2023, 16, 1574. [Google Scholar] [CrossRef]
  28. Yang, X.; Zeng, X.; Wang, F.; Zhao, H.; Chen, J.; Wang, Y. A modified Steinberg–Cochran–Guinan model applicable to solid–liquid mixed zone along the principle Hugoniot. Mech. Mater. 2021, 155, 103775. [Google Scholar] [CrossRef]
  29. Dixit, U.S. 1—Modeling of metal forming: A review. In Mechanics of Materials in Modern Manufacturing Methods and Processing Techniques; Silberschmidt, V.V., Ed.; Elsevier: Amsterdam, The Netherlands, 2020; pp. 1–30. [Google Scholar]
  30. Dumanić, I.; Jozić, S.; Bagavac, P.; Bajić, D. Orthogonal cutting simulation of EN AW 6082 T6 alloy using a coupled Eulerian-Lagrangian approach. Heliyon 2023, 9, e14821. [Google Scholar] [CrossRef] [PubMed]
  31. Suwas, S.; Bisht, A.; Jagadeesh, G. 12—Microstructural changes in materials under shock and high strain rate processes: Recent updates. In Mechanics of Materials in Modern Manufacturing Methods and Processing Techniques; Silberschmidt, V.V., Ed.; Elsevier: Amsterdam, The Netherlands, 2020; pp. 361–392. [Google Scholar]
  32. ASTM A 370-17; Standard Test Methods and Definitions for Mechanical Testing of Steel Products. ASTM International: West Conshohocken, PA, USA, 2017; p. 49. [CrossRef]
  33. Souza, P.M.; Sivaswamy, G.; Bradley, L.; Barrow, A.; Rahimi, S. An innovative constitutive material model for predicting high temperature flow behaviour of inconel 625 alloy. J. Mater. Sci. 2022, 57, 20794–20814. [Google Scholar] [CrossRef]
  34. ASTM E 228-17; Standard Test Method for Linear Thermal Expansion of Solid Materials with a Push-Rod Dilatometer. ASTM International: West Conshohocken, PA, USA, 2017; p. 10. [CrossRef]
  35. Osorio-Pinzon, J.C.; Abolghasem, S.; Casas-Rodriguez, J.P. Predicting the Johnson Cook constitutive model constants using temperature rise distribution in plane strain machining. Int. J. Adv. Manuf. Technol. 2019, 105, 279–294. [Google Scholar] [CrossRef]
  36. George, P.L.; Borouchaki, H.; Alauzet, F.; Laug, P.; Loseille, A.; Marcum, D.; Maréchal, L. Mesh Generation and Mesh Adaptivity: Theory and Techniques. In Encyclopedia of Computational Mechanics, 2nd ed.; John Wiley & Sons, Ltd.: Hoboken, NJ, USA, 2018; pp. 1–51. [Google Scholar]
  37. Shi, Z.; Li, X.; Duan, N.; Yang, Q. Evaluation of tool wear and cutting performance considering effects of dynamic nodes movement based on FEM simulation. Chin. J. Aeronaut. 2021, 34, 140–152. [Google Scholar] [CrossRef]
  38. Grzesik, W.; Niesłony, P.; Laskowski, P. Determination of Material Constitutive Laws for Inconel 718 Superalloy Under Different Strain Rates and Working Temperatures. J. Mater. Eng. Perform. 2017, 26, 5705–5714. [Google Scholar] [CrossRef]
  39. Škrlec, A.; Klemenc, J. Estimating the Strain-Rate-Dependent Parameters of the Johnson-Cook Material Model Using Optimisation Algorithms Combined with a Response Surface. Mathematics 2020, 8, 1105. [Google Scholar] [CrossRef]
  40. Hamed, A.; Rayaprolu, S.; Winther, G.; El-Azab, A. Impact of the plastic deformation microstructure in metals on the kinetics of recrystallization: A phase-field study. Acta Mater. 2022, 240, 118332. [Google Scholar] [CrossRef]
  41. Chen, F.; Li, K.; Tang, B.; Liu, D.; Zhong, H.; Li, J. Deformation Behavior and Microstructural Evolution of Inconel 625 Superalloy during the Hot Compression Process. Metals 2021, 11, 824. [Google Scholar] [CrossRef]
  42. Hokka, M.; Gomon, D.; Shrot, A.; Leemet, T.; Bäker, M.; Kuokkala, V.T. Dynamic Behavior and High Speed Machining of Ti-6246 and Alloy 625 Superalloys: Experimental and Modeling Approaches. Exp. Mech. 2014, 54, 199–210. [Google Scholar] [CrossRef]
  43. Jafarian, F.; Imaz Ciaran, M.; Umbrello, D.; Arrazola, P.J.; Filice, L.; Amirabadi, H. Finite element simulation of machining Inconel 718 alloy including microstructure changes. Int. J. Mech. Sci. 2014, 88, 110–121. [Google Scholar] [CrossRef]
  44. Uhlmann, E.; von der Schulenburg, M.G.; Zettier, R. Finite Element Modeling and Cutting Simulation of Inconel 718. CIRP Ann. 2007, 56, 61–64. [Google Scholar] [CrossRef]
  45. Díaz-Álvarez, J.; Cantero, J.L.; Miguélez, H.; Soldani, X. Numerical analysis of thermomechanical phenomena influencing tool wear in finishing turning of Inconel 718. Int. J. Mech. Sci. 2014, 82, 161–169. [Google Scholar] [CrossRef]
  46. Yadav, R.K.; Abhishek, K.; Mahapatra, S.S. A simulation approach for estimating flank wear and material removal rate in turning of Inconel 718. Simul. Model. Pract. Theory 2015, 52, 1–14. [Google Scholar] [CrossRef]
  47. Xu, D.; Liu, Y.; Ding, L.; Zhou, J.; M’Saoubi, R.; Liu, H. Experimental and numerical investigation of Inconel 718 machining with worn tools. J. Manuf. Process. 2022, 77, 163–173. [Google Scholar] [CrossRef]
  48. López-Gálvez, H.; Soldani, X. Determination of optimum numerical parameters in a 3D model of finish turning operation applied to Inconel 718. Simul. Model. Pract. Theory 2020, 99, 102035. [Google Scholar] [CrossRef]
  49. Bücker, M.; De Bartolomeis, A.; Oezkaya, E.; Shokrani, A.; Biermann, D. Experimental and computational investigations on the effects of deep-temperature emulsion on the turning of Inconel 718 alloy. CIRP J. Manuf. Sci. Technol. 2020, 31, 48–60. [Google Scholar] [CrossRef]
  50. Wang, B.; Liu, Z.; Hou, X.; Zhao, J. Influences of Cutting Speed and Material Mechanical Properties on Chip Deformation and Fracture during High-Speed Cutting of Inconel 718. Materials 2018, 11, 461. [Google Scholar] [CrossRef]
  51. Zhang, H.; Deng, B.; Lin, J.; Tang, X.; Yan, R.; Peng, F. Spatial gradient prediction and characterization of yield strength in the heat-affected zone in laser-assisted machining of Inconel 718. Opt. Laser Technol. 2023, 163, 109409. [Google Scholar] [CrossRef]
  52. Martinez, A.B.; Gamez-Perez, J.; Sanchez-Soto, M.; Velasco, J.I.; Santana, O.O.; Ll Maspoch, M. The Essential Work of Fracture (EWF) method—Analyzing the Post-Yielding Fracture Mechanics of polymers. Eng. Fail. Anal. 2009, 16, 2604–2617. [Google Scholar] [CrossRef]
  53. Razanica, S.; Malakizadi, A.; Larsson, R.; Cedergren, S.; Josefson, B.L. FE modeling and simulation of machining Alloy 718 based on ductile continuum damage. Int. J. Mech. Sci. 2020, 171, 105375. [Google Scholar] [CrossRef]
  54. Liu, Y.; Xu, D.; Agmell, M.; Saoubi, R.M.; Ahadi, A.; Stahl, J.-E.; Zhou, J. Numerical and experimental investigation of tool geometry effect on residual stresses in orthogonal machining of Inconel 718. Simul. Model. Pract. Theory 2021, 106, 102187. [Google Scholar] [CrossRef]
  55. Ammar, M.M.A.; Shirinzadeh, B.; Elgamal, H.; Nasr, M.N.A. On the Role of Damage Evolution in Finite Element Modeling of the Cutting Process and Sensing Residual Stresses. Sensors 2022, 22, 8547. [Google Scholar] [CrossRef] [PubMed]
  56. Zhou, B.; Zhang, W.; Gao, Z.; Luo, G. Machining-Induced Work Hardening Behavior of Inconel 718 Considering Edge Geometries. Materials 2022, 15, 397. [Google Scholar] [CrossRef] [PubMed]
  57. Amsterdam, E.; Willem, E.; Wiegman, J.; Nawijn, M.; De Hosson, J.T.M. On the strain energy release rate and fatigue crack growth rate in metallic alloys. Eng. Fract. Mech. 2023, 286, 109292. [Google Scholar] [CrossRef]
  58. Bechler, N.; Seifert, T. Three-dimensional J-integral evaluation for thermomechanically loaded cracks and temperature-dependent incremental plasticity. Eng. Fract. Mech. 2023, 288, 109342. [Google Scholar] [CrossRef]
  59. Malmelöv, A.; Fisk, M.; Lundbäck, A.; Lindgren, L.-E. Mechanism Based Flow Stress Model for Alloy 625 and Alloy 718. Materials 2020, 13, 5620. [Google Scholar] [CrossRef]
  60. Liu, Y.; Xu, D.; Agmell, M.; Ahadi, A.; Stahl, J.-E.; Zhou, J. Investigation on residual stress evolution in nickel-based alloy affected by multiple cutting operations. J. Manuf. Process. 2021, 68, 818–833. [Google Scholar] [CrossRef]
  61. Johnson, G.R.; Cook, W.H. Fracture characteristics of three metals subjected to various strains, strain rates, temperatures and pressures. Eng. Fract. Mech. 1985, 21, 31–48. [Google Scholar] [CrossRef]
  62. Liu, J.; Bai, Y.; Xu, C. Evaluation of Ductile Fracture Models in Finite Element Simulation of Metal Cutting Processes. J. Manuf. Sci. Eng. 2013, 136, 011010. [Google Scholar] [CrossRef]
  63. Erdogan, C.; Vural, H.; Karakaş, A.; Fenercioğlu, T.O.; Yalçinkaya, T. Ductile failure of Inconel 718 during flow forming process and its numerical investigation. Eng. Fail. Anal. 2023, 152, 107424. [Google Scholar] [CrossRef]
  64. Cao, X.; Ren, X.; Zhao, T.; Li, Y.; Xiao, D.; Fang, D. Numerical and theoretical analysis of the dynamic mechanical behaviour of a modified rhombic dodecahedron lattice structure. Int. J. Mech. Mater. Des. 2021, 17, 271–283. [Google Scholar] [CrossRef]
  65. Wang, B.; Liu, Z. Shear localization sensitivity analysis for Johnson–Cook constitutive parameters on serrated chips in high speed machining of Ti6Al4V. Simul. Model. Pract. Theory 2015, 55, 63–76. [Google Scholar] [CrossRef]
  66. Sousa, V.F.C.; Silva, F.J.G. Recent Advances on Coated Milling Tool Technology—A Comprehensive Review. Coatings 2020, 10, 235. [Google Scholar] [CrossRef]
  67. Sousa, V.F.C.; Da Silva, F.J.G.; Pinto, G.F.; Baptista, A.; Alexandre, R. Characteristics and Wear Mechanisms of TiAlN-Based Coatings for Machining Applications: A Comprehensive Review. Metals 2021, 11, 260. [Google Scholar] [CrossRef]
  68. Sousa, V.F.C.; Fernandes, F.; Silva, F.J.G.; Costa, R.D.F.S.; Sebbe, N.; Sales-Contini, R.C.M. Wear Behavior Phenomena of TiN/TiAlN HiPIMS PVD-Coated Tools on Milling Inconel 718. Metals 2023, 13, 684. [Google Scholar] [CrossRef]
  69. Baptista, A.; Silva, F.J.G.; Porteiro, J.; Míguez, J.L.; Pinto, G.; Fernandes, L. On the Physical Vapour Deposition (PVD): Evolution of Magnetron Sputtering Processes for Industrial Applications. Procedia Manuf. 2018, 17, 746–757. [Google Scholar] [CrossRef]
  70. Silva, F.J.G.; Sebbe, N.P.V.; Costa, R.D.F.S.; Pedroso, A.F.V.; Sales-Contini, R.C.M.; Barbosa, M.L.S.; Martinho, R.P. Investigations on the Surface Integrity and Wear Mechanisms of TiAlYN-Coated Tools in Inconel 718 Milling Operations. Materials 2024, 17, 443. [Google Scholar] [CrossRef] [PubMed]
  71. ISO 8688-2:1989(E); Tool Life Testing in Milling—Part 2: End Milling. ISO: Geneva, Switzerland, 1989; p. 26.
  72. ISO 3685:1993(E); Tool-Life Testing with Single-Point Turning Tools. ISO: Geneva, Switzerland, 1993; p. 53.
  73. Wang, C.; Ming, W.; Chen, M. Milling tool’s flank wear prediction by temperature dependent wear mechanism determination when machining Inconel 182 overlays. Tribol. Int. 2016, 104, 140–156. [Google Scholar] [CrossRef]
  74. Zhang, X.; Peng, Z.; Liu, L.; Zhang, X. A Tool Life Prediction Model Based on Taylor’s Equation for High-Speed Ultrasonic Vibration Cutting Ti and Ni Alloys. Coatings 2022, 12, 1553. [Google Scholar] [CrossRef]
  75. Archard, J.F. Contact and Rubbing of Flat Surfaces. J. Appl. Phys. 1953, 24, 981–988. [Google Scholar] [CrossRef]
  76. Usui, E.; Shirakashi, T.; Kitagawa, T. Analytical Prediction of Three Dimensional Cutting Process—Part 3: Cutting Temperature and Crater Wear of Carbide Tool. J. Manuf. Sci. Eng. 1978, 100, 236–243. [Google Scholar] [CrossRef]
  77. Usui, E.; Shirakashi, T.; Kitagawa, T. Analytical prediction of cutting tool wear. Wear 1984, 100, 129–151. [Google Scholar] [CrossRef]
  78. Takeyama, H.; Murata, R. Basic Investigation of Tool Wear. J. Manuf. Sci. Eng. 1963, 85, 33–37. [Google Scholar] [CrossRef]
  79. Childs, T.H.C.; Maekawa, K.; Obikawa, T.; Yamane, Y. Metal Machining: Theory and Applications; Arnold: Boston, MA, USA, 2000. [Google Scholar]
  80. Schmidt, C.; Frank, P.; Weule, H.; Schmidt, J.; Yen, Y.; Altan, T. Tool wear prediction and verification in orthogonal cutting. In Proceedings of the 6th CIRP Workshop on Modeling of Machining, Hamilton, ON, Canada, 20 May 2003; Woodhead Publishing: Sawston, UK, 2003; pp. 93–100. [Google Scholar]
  81. Luo, X.; Cheng, K.; Holt, R.; Liu, X. Modeling flank wear of carbide tool insert in metal cutting. Wear 2005, 259, 1235–1240. [Google Scholar] [CrossRef]
  82. Astakhov, V.P. Effects of the cutting feed, depth of cut, and workpiece (bore) diameter on the tool wear rate. Int. J. Adv. Manuf. Technol. 2007, 34, 631–640. [Google Scholar] [CrossRef]
  83. Astakhov, V.P. Chapter 4 Cutting tool wear, tool life and cutting tool physical resource. In Tribology and Interface Engineering Series; Briscoe, B.J., Ed.; Elsevier: Amsterdam, The Netherlands, 2006; Volume 52, pp. 220–275. [Google Scholar]
  84. Halila, F.; Czarnota, C.; Nouari, M. A new abrasive wear law for the sticking and sliding contacts when machining metallic alloys. Wear 2014, 315, 125–135. [Google Scholar] [CrossRef]
  85. Halila, F.; Czarnota, C.; Nouari, M. New stochastic wear law to predict the abrasive flank wear and tool life in machining process. Proc. Inst. Mech. Eng. Part J J. Eng. Tribol. 2014, 228, 1243–1251. [Google Scholar] [CrossRef]
  86. Pálmai, Z. Proposal for a new theoretical model of the cutting tool’s flank wear. Wear 2013, 303, 437–445. [Google Scholar] [CrossRef]
  87. Attanasio, A.; Ceretti, E.; Fiorentino, A.; Cappellini, C.; Giardini, C. Investigation and FEM-based simulation of tool wear in turning operations with uncoated carbide tools. Wear 2010, 269, 344–350. [Google Scholar] [CrossRef]
  88. Attanasio, A.; Ceretti, E.; Rizzuti, S.; Umbrello, D.; Micari, F. 3D finite element analysis of tool wear in machining. CIRP Ann. 2008, 57, 61–64. [Google Scholar] [CrossRef]
  89. Leopold, J. 7—Modeling of machining processes. In Mechanics of Materials in Modern Manufacturing Methods and Processing Techniques; Silberschmidt, V.V., Ed.; Elsevier: Amsterdam, The Netherlands, 2020; pp. 197–227. [Google Scholar]
  90. Binder, M.; Klocke, F.; Doebbeler, B. An advanced numerical approach on tool wear simulation for tool and process design in metal cutting. Simul. Model. Pract. Theory 2017, 70, 65–82. [Google Scholar] [CrossRef]
  91. Hosseinkhani, K.; Ng, E.-G. A Unique Methodology for Tool Life Prediction in Machining. J. Manuf. Mater. Process. 2020, 4, 16. [Google Scholar] [CrossRef]
  92. Liang, X.; Liu, Z.; Chen, L.; Hao, G.; Wang, B.; Cai, Y.; Song, Q. Tool wear induced modifications of plastic flow and deformed material depth in new generated surfaces during turning Ti-6Al-4V. J. Mater. Res. Technol. 2020, 9, 10782–10795. [Google Scholar] [CrossRef]
  93. Zhang, Z.; Liu, Z.; Ren, X.; Zhao, J. Prediction of Tool Wear Rate and Tool Wear during Dry Orthogonal Cutting of Inconel 718. Metals 2023, 13, 1225. [Google Scholar] [CrossRef]
  94. Binder, M.; Klocke, F.; Lung, D. Tool wear simulation of complex shaped coated cutting tools. Wear 2015, 330–331, 600–607. [Google Scholar] [CrossRef]
  95. Baptista, A.; Silva, F.; Porteiro, J.; Míguez, J.; Pinto, G. Sputtering Physical Vapour Deposition (PVD) Coatings: A Critical Review on Process Improvement and Market Trend Demands. Coatings 2018, 8, 402. [Google Scholar] [CrossRef]
  96. Liu, Z.; Yue, C.; Li, X.; Liu, X.; Liang, S.Y.; Wang, L. Research on Tool Wear Based on 3D FEM Simulation for Milling Process. J. Manuf. Mater. Process. 2020, 4, 121. [Google Scholar] [CrossRef]
  97. Auricchio, F.; da Veiga, L.B.; Brezzi, F.; Lovadina, C. Mixed Finite Element Methods. In Encyclopedia of Computational Mechanics, 2nd ed.; John Wiley & Sons, Ltd.: Hoboken, NJ, USA, 2018; pp. 1–53. [Google Scholar]
  98. Sousa, V.F.C.; Silva, F.J.G.; Fecheira, J.S.; Lopes, H.M.; Martinho, R.P.; Casais, R.B.; Ferreira, L.P. Cutting Forces Assessment in CNC Machining Processes: A Critical Review. Sensors 2020, 20, 4536. [Google Scholar] [CrossRef]
  99. Daya Reddy, B. Mathematical Foundations of Elastoplastic Deformations in Solids. In Encyclopedia of Computational Mechanics, 2nd ed.; John Wiley & Sons, Ltd.: Hoboken, NJ, USA, 2018; pp. 1–27. [Google Scholar]
  100. Mir, A.; Luo, X.; Llavori, I.; Roy, A.; Zlatanovic, D.L.; Joshi, S.N.; Goel, S. Challenges and issues in continuum modelling of tribology, wear, cutting and other processes involving high-strain rate plastic deformation of metals. J. Mech. Behav. Biomed. Mater. 2022, 130, 105185. [Google Scholar] [CrossRef]
  101. Ducobu, F.; Rivière-Lorphèvre, E.; Filippi, E. Finite element modelling of 3D orthogonal cutting experimental tests with the Coupled Eulerian-Lagrangian (CEL) formulation. Finite Elem. Anal. Des. 2017, 134, 27–40. [Google Scholar] [CrossRef]
  102. Ambrosio, D.; Tongne, A.; Wagner, V.; Dessein, G.; Cahuc, O. A new damage evolution criterion for the coupled Eulerian-Lagrangian approach: Application to three-dimensional numerical simulation of segmented chip formation mechanisms in orthogonal cutting. J. Manuf. Process. 2022, 73, 149–163. [Google Scholar] [CrossRef]
  103. Chenegrin, K.; Roux, J.-C.; Helfenstein-Didier, C.; Pouvreau, C.; Girinon, M.; Karaouni, H.; Bergheau, J.-M.; Feulvarch, E. 3D numerical simulation of heat transfer during dry drilling of Inconel 718. J. Manuf. Process. 2021, 64, 1143–1152. [Google Scholar] [CrossRef]
  104. Robe, H.; Claudin, C.; Bergheau, J.-M.; Feulvarch, E. R-ALE simulation of heat transfer during friction stir welding of an AA2xxx/AA7xxx joint on a large process window. Int. J. Mech. Sci. 2019, 155, 31–40. [Google Scholar] [CrossRef]
  105. De, T.; Das, A.; Singh, M.; Kumar, J. Enhancing efficiency in particle aggregation simulations: Coarse-grained particle modeling in the DEM-PBM coupled framework. Comput. Methods Appl. Mech. Eng. 2023, 417, 116436. [Google Scholar] [CrossRef]
  106. Schnabel, D.; Özkaya, E.; Biermann, D.; Eberhard, P. Modeling the motion of the cooling lubricant in drilling processes using the finite volume and the smoothed particle hydrodynamics methods. Comput. Methods Appl. Mech. Eng. 2018, 329, 369–395. [Google Scholar] [CrossRef]
  107. Özel, T.; Zeren, E. Finite element modeling the influence of edge roundness on the stress and temperature fields induced by high-speed machining. Int. J. Adv. Manuf. Technol. 2007, 35, 255–267. [Google Scholar] [CrossRef]
  108. Rajaguru, J.; Dwivedi, M.; Natarajan, S.; Krishnaswamy, H.; Arunachalam, N. Machining induced residual stress prediction during orthogonal cutting of super duplex stainless steel using CEL approach. J. Manuf. Process. 2022, 82, 474–487. [Google Scholar] [CrossRef]
  109. Lorez, F.; Pundir, M.; Kammer, D.S. Eulerian framework for contact between solids represented as phase fields. Comput. Methods Appl. Mech. Eng. 2024, 418, 116497. [Google Scholar] [CrossRef]
  110. Idelsohn, S.; Oñate, E.; Nigro, N.; Becker, P.; Gimenez, J. Lagrangian versus Eulerian integration errors. Comput. Methods Appl. Mech. Eng. 2015, 293, 191–206. [Google Scholar] [CrossRef]
  111. Donea, J.; Huerta, A.; Ponthot, J.-P.; Rodríguez-Ferran, A. Arbitrary Lagrangian–Eulerian Methods. In Encyclopedia of Computational Mechanics, 2nd ed.; John Wiley & Sons, Ltd.: Hoboken, NJ, USA, 2018; pp. 1–23. [Google Scholar]
  112. Lewandowski, K.; Barbera, D.; Blackwell, P.; Roohi, A.H.; Athanasiadis, I.; McBride, A.; Steinmann, P.; Pearce, C.; Kaczmarczyk, Ł. Multifield finite strain plasticity: Theory and numerics. Comput. Methods Appl. Mech. Eng. 2023, 414, 116101. [Google Scholar] [CrossRef]
  113. Ducobu, F.; Rivière-Lorphèvre, E.; Filippi, E. Application of the Coupled Eulerian-Lagrangian (CEL) method to the modeling of orthogonal cutting. Eur. J. Mech.—A/Solids 2016, 59, 58–66. [Google Scholar] [CrossRef]
  114. Xu, X.; Outeiro, J.; Zhang, J.; Xu, B.; Zhao, W.; Astakhov, V. Machining simulation of Ti6Al4V using coupled Eulerian-Lagrangian approach and a constitutive model considering the state of stress. Simul. Model. Pract. Theory 2021, 110, 102312. [Google Scholar] [CrossRef]
  115. Özel, T. The influence of friction models on finite element simulations of machining. Int. J. Mach. Tools Manuf. 2006, 46, 518–530. [Google Scholar] [CrossRef]
  116. Dixit, U.S.; Yadav, V.; Pandey, P.M.; Roy, A.; Silberschmidt, V.V. 14—Modeling of friction in manufacturing processes. In Mechanics of Materials in Modern Manufacturing Methods and Processing Techniques; Silberschmidt, V.V., Ed.; Elsevier: Amsterdam, The Netherlands, 2020; pp. 415–444. [Google Scholar]
  117. Popov, V.L.; Gray, J.A.T. Prandtl-Tomlinson Model: A Simple Model Which Made History. In The History of Theoretical, Material and Computational Mechanics—Mathematics Meets Mechanics and Engineering; Stein, E., Ed.; Springer: Berlin/Heidelberg, Germany, 2014; pp. 153–168. [Google Scholar]
  118. Jankowski, K.; Saha, A.; Stefański, A. Introduction of novel model of friction and analysis of presliding domain of friction with non-local memory effect based upon Maxwell slip model structures. Tribol. Int. 2016, 102, 378–391. [Google Scholar] [CrossRef]
  119. Xu, D.; Ding, L.; Liu, Y.; Zhou, J.; Liao, Z. Investigation of the Influence of Tool Rake Angles on Machining of Inconel 718. J. Manuf. Mater. Process. 2021, 5, 100. [Google Scholar] [CrossRef]
  120. Zhao, J.; Liu, Z. Modelling for prediction of time-varying heat partition coefficient at coated tool-chip interface in continuous turning and interrupted milling. Int. J. Mach. Tools Manuf. 2019, 147, 103467. [Google Scholar] [CrossRef]
  121. Zhao, J.; Liu, Z.; Wang, B.; Hu, J. PVD AlTiN coating effects on tool-chip heat partition coefficient and cutting temperature rise in orthogonal cutting Inconel 718. Int. J. Heat Mass Transf. 2020, 163, 120449. [Google Scholar] [CrossRef]
  122. Hao, G.; Liu, Z. The heat partition into cutting tool at tool-chip contact interface during cutting process: A review. Int. J. Adv. Manuf. Technol. 2020, 108, 393–411. [Google Scholar] [CrossRef]
  123. Loewen, E.G.; Shaw, M.C. On the Analysis of Cutting-Tool Temperatures. Trans. Am. Soc. Mech. Eng. 2022, 76, 217–225. [Google Scholar] [CrossRef]
  124. Shaw, M.C.; Cookson, J. Metal Cutting Principles; Oxford University Press: New York, NY, USA, 2005; Volume 2. [Google Scholar]
  125. Kato, T.; Fujii, H. Energy Partition in Conventional Surface Grinding. J. Manuf. Sci. Eng. 1999, 121, 393–398. [Google Scholar] [CrossRef]
  126. List, G.; Sutter, G.; Bouthiche, A. Cutting temperature prediction in high speed machining by numerical modelling of chip formation and its dependence with crater wear. Int. J. Mach. Tools Manuf. 2012, 54–55, 1–9. [Google Scholar] [CrossRef]
  127. Gecim, B.; Winer, W.O. Transient Temperatures in the Vicinity of an Asperity Contact. J. Tribol. 1985, 107, 333–341. [Google Scholar] [CrossRef]
  128. Reznikov, A.; Reznikov, A. Thermophysical Aspects of Metal Cutting Processes; Mashinostroenie: Moscow, Russia, 1981; Volume 212. [Google Scholar]
  129. Grzesik, W. Advanced Machining Processes of Metallic Materials: Theory, Modelling and Applications; Elsevier: Amsterdam, The Netherlands, 2008. [Google Scholar]
  130. Kim, E.J.; Lee, C.M. A Study on the Machining Characteristics of Curved Workpiece Using Laser-Assisted Milling with Different Tool Paths in Inconel 718. Metals 2018, 8, 968. [Google Scholar] [CrossRef]
  131. Kim, E.-J.; Lee, C.-M. Experimental study on power consumption of laser and induction assisted machining with inconel 718. J. Manuf. Process. 2020, 59, 411–420. [Google Scholar] [CrossRef]
  132. Parida, A.K.; Maity, K. Comparison the machinability of Inconel 718, Inconel 625 and Monel 400 in hot turning operation. Eng. Sci. Technol. Int. J. 2018, 21, 364–370. [Google Scholar] [CrossRef]
  133. Jeong, H.-I.; Lee, C.-M. A study on improvement of tool life using a heat shield in laser assisted machining to Inconel 718. Opt. Laser Technol. 2021, 142, 107208. [Google Scholar] [CrossRef]
  134. Pan, Z.; Feng, Y.; Hung, T.-P.; Jiang, Y.-C.; Hsu, F.-C.; Wu, L.-T.; Lin, C.-F.; Lu, Y.-C.; Liang, S.Y. Heat affected zone in the laser-assisted milling of Inconel 718. J. Manuf. Process. 2017, 30, 141–147. [Google Scholar] [CrossRef]
  135. Kim, D.-H.; Lee, C.-M. A study of cutting force and preheating-temperature prediction for laser-assisted milling of Inconel 718 and AISI 1045 steel. Int. J. Heat Mass Transf. 2014, 71, 264–274. [Google Scholar] [CrossRef]
  136. Kim, E.J.; Lee, C.M. A Study on the Optimal Machining Parameters of the Induction Assisted Milling with Inconel 718. Materials 2019, 12, 233. [Google Scholar] [CrossRef]
  137. Liao, Y.; Deschamps, F.; Loures, E.d.F.R.; Ramos, L.F.P. Past, present and future of Industry 4.0—A systematic literature review and research agenda proposal. Int. J. Prod. Res. 2017, 55, 3609–3629. [Google Scholar] [CrossRef]
  138. Azarian, M.; Yu, H.; Shiferaw, A.T.; Stevik, T.K. Do We Perform Systematic Literature Review Right? A Scientific Mapping and Methodological Assessment. Logistics 2023, 7, 89. [Google Scholar] [CrossRef]
  139. Tóth, Á.; Suta, A.; Pimentel, J.; Argoti, A. A comprehensive, semi-automated systematic literature review (SLR) design: Application to P-graph research with a focus on sustainability. J. Clean. Prod. 2023, 415, 137741. [Google Scholar] [CrossRef]
  140. Jia, Z.; Lu, X.; Gu, H.; Ruan, F.; Liang, S.Y. Deflection prediction of micro-milling Inconel 718 thin-walled parts. J. Mater. Process. Technol. 2021, 291, 117003. [Google Scholar] [CrossRef]
  141. Harari, I.; Balbes, C.; Albocher, U. Embedded boundary conditions for shear-deformable plate bending. Comput. Methods Appl. Mech. Eng. 2023, 417, 116287. [Google Scholar] [CrossRef]
  142. Okafor, A.C.; Sultan, A.A. Development of a mechanistic cutting force model for wavy-edge bull-nose helical end-milling of inconel 718 under emulsion cooling strategy. Appl. Math. Model. 2016, 40, 2637–2660. [Google Scholar] [CrossRef]
  143. Ducroux, E.; Fromentin, G.; Viprey, F.; Prat, D.; D’Acunto, A. New mechanistic cutting force model for milling additive manufactured Inconel 718 considering effects of tool wear evolution and actual tool geometry. J. Manuf. Process. 2021, 64, 67–80. [Google Scholar] [CrossRef]
  144. Zheng, J.; Zhang, Y.; Qiao, H. Milling Mechanism and Chattering Stability of Nickel-Based Superalloy Inconel 718. Materials 2023, 16, 5748. [Google Scholar] [CrossRef]
  145. Jafarian, F.; Umbrello, D.; Jabbaripour, B. Identification of new material model for machining simulation of Inconel 718 alloy and the effect of tool edge geometry on microstructure changes. Simul. Model. Pract. Theory 2016, 66, 273–284. [Google Scholar] [CrossRef]
  146. Gong, L.; Su, Y.; Liu, Y.; Zhao, W.; Khan, A.M.; Jamil, M. Investigation on Machinability Characteristics of Inconel 718 Alloy in Cryogenic Machining Processes. Lubricants 2023, 11, 82. [Google Scholar] [CrossRef]
  147. Jafarian, F.; Masoudi, S.; Umbrello, D.; Filice, L. New strategies for improvement of numerical model accuracy in machining of nickel-based alloy. Simul. Model. Pract. Theory 2019, 94, 134–148. [Google Scholar] [CrossRef]
  148. Qiu, X.; Cheng, X.; Dong, P.; Peng, H.; Xing, Y.; Zhou, X. Sensitivity Analysis of Johnson-Cook Material Constants and Friction Coefficient Influence on Finite Element Simulation of Turning Inconel 718. Materials 2019, 12, 3121. [Google Scholar] [CrossRef] [PubMed]
  149. Waldorf, D.J.; DeVor, R.E.; Kapoor, S.G. A Slip-Line Field for Ploughing During Orthogonal Cutting. J. Manuf. Sci. Eng. 1998, 120, 693–699. [Google Scholar] [CrossRef]
  150. Peng, H.; Tang, W.; Xing, Y.; Zhou, X. Semi-Empirical Prediction of Turned Surface Residual Stress for Inconel 718 Grounded in Experiments and Finite Element Simulations. Materials 2021, 14, 3937. [Google Scholar] [CrossRef] [PubMed]
  151. Tu, L.; Lin, L.; Liu, C.; Zheng, T.; Deng, Y.; Han, L.; An, Q.; Ming, W.; Chen, M. Tool wear characteristics analysis of cBN cutting tools in high-speed turning of Inconel 718. Ceram. Int. 2023, 49, 635–658. [Google Scholar] [CrossRef]
  152. Kortabarria, A.; Armentia, I.; Arrazola, P. Sensitivity analysis of material input data influence on machining induced residual stress prediction in Inconel 718. Simul. Model. Pract. Theory 2016, 63, 47–57. [Google Scholar] [CrossRef]
  153. Pervaiz, S.; Kannan, S.; Anwar, S.; Huo, D. Machinability analysis of dry and liquid nitrogen–based cryogenic cutting of Inconel 718: Experimental and FE analysis. Int. J. Adv. Manuf. Technol. 2022, 118, 3801–3818. [Google Scholar] [CrossRef]
  154. Attanasio, A.; Ceretti, E.; Outeiro, J.; Poulachon, G. Numerical simulation of tool wear in drilling Inconel 718 under flood and cryogenic cooling conditions. Wear 2020, 458–459, 203403. [Google Scholar] [CrossRef]
  155. Evans, R. 2—Selection and testing of metalworking fluids. In Metalworking Fluids (MWFs) for Cutting and Grinding; Astakhov, V.P., Joksch, S., Eds.; Woodhead Publishing: Sawston, UK, 2012; pp. 23–78. [Google Scholar]
  156. Niu, S.; Qu, N.; Yue, X.; Li, H. Effect of tool-sidewall outlet hole design on machining performance in electrochemical mill-grinding of Inconel 718. J. Manuf. Process. 2019, 41, 10–22. [Google Scholar] [CrossRef]
  157. Zhang, H.; Chen, F.; Li, Z.; Hu, W.; Sun, T.; Zhang, J. Investigation of Laser-Assisted Micro-Milling Process of Inconel 718. J. Manuf. Mater. Process. 2023, 7, 149. [Google Scholar] [CrossRef]
Figure 2. Measured true-stress–strain (σtr-εtr) curves (discrete points) for (a) INCONEL® 718 and (b) INCONEL® 625. Corresponding computed results (solid lines) from the material model after calibration. The tests were performed with a nominal ε ˙ = 0.01 Hz for INCONEL® 625, while INCONEL® 718 was tested with 0.01 < ε ˙ < 1 Hz (adapted from [59]).
Jmmp 08 00037 g002
Figure 3. Standard uniaxial engineering σ-ε behaviour characteristic of a ductile material (adapted from [16]).
Jmmp 08 00037 g003
Figure 4. The development of chip morphology is impacted by prior machining operations, including (a) the influence of the initial chip thickness (hch), (b) the impact of the rake angle (γ) of the tool, (c) the ramifications of the tool’s edge radius (rβ), and (d) the effects of intervening cuts [60].
Jmmp 08 00037 g004
Figure 5. Procedure of Hosseinkhani and Ng’s [91] proposed methodology.
Jmmp 08 00037 g005
Figure 6. Orthogonal cutting model with a minimal width of cut (merely 4 μm) employing the CEL approach: (a) mesh structure and (b) specifications of boundary conditions [114].
Jmmp 08 00037 g006
Figure 7. Difference in numerical behaviour between the CEL and LAG approaches when studying ε ¯ p (a,b) and T (c,d). Cutting speed, vc = 250 m/min [114].
Jmmp 08 00037 g007
Figure 8. The 3D model and conceptualisation of a mobile laser heat source [133].
Jmmp 08 00037 g008
Figure 9. Mesh division of the micro-milling tool: (a) end face and (b) side [140].
Jmmp 08 00037 g009
Figure 10. (a) The WEBNHE partially immersed radially during up-milling; (b) the axial segmentation of the end mill and the various Ft, Fr, and axial cutting force (Fa) components experienced at the cutting edge of a representative disk; (c) the distinct Ft, Fr, and Fa [142].
Jmmp 08 00037 g010
Figure 11. Graphical summary of Ducroux et al. [143]’s work.
Jmmp 08 00037 g011
Figure 12. FEA model of the tool (in orange) and workpiece (in grey) [144].
Jmmp 08 00037 g012
Figure 13. Effective plastic strain during cutting: (a) κr = 0° and κr = 45° (vc = 70 m/min); (b) progression of effective plastic strain across three specific zones considered versus vc [45].
Jmmp 08 00037 g013
Figure 14. Distribution of σn0 on a worn tool: (a) vc = 50 m/min and cutting time (tcut) 100 s; (b) vc = 70 m/min and tcut = 35 s [93].
Jmmp 08 00037 g014
Figure 15. (a) Comparative analysis of simulated and experimental outcomes for VB; (b) comparative assessment of simulated and experimental results for MRR (adapted from [46]).
Jmmp 08 00037 g015
Figure 16. Distribution of equivalent plastic deformation (PEEQ) within the workpiece surrounding the tool at (a) vc = 30 m/min; (b) vc = 100 m/min [47].
Jmmp 08 00037 g016
Figure 17. FEA simulation illustrating the creation of serrated chips during the orthogonal cutting procedure of INCONEL® 718 alloy [145].
Jmmp 08 00037 g017
Figure 18. Chip morphologies observed for varying shear failure εpf (chip). (a) vc = 300 m/min, (b) vc = 900 m/min. Element size = 15 μm; length of cut (Lcut) of 1.25 mm [48].
Jmmp 08 00037 g018
Figure 19. Fluctuation of Tt in different T distributions concerning vc and different lubrication/cooling conditions, maintaining a constant f of 0.2 mm/rev and ap = 0.2 mm constant: (a) dry vc = 70 m/min, (b) cryogenic vc = 70 m/min, (c) dry vc = 100 m/min, (d) cryogenic vc = 100 m/min, (e) dry vc = 130 m/min, (f) cryogenic vc = 130 m/min [146].
Jmmp 08 00037 g019
Figure 20. Simulation results for test number 16: (a) T distribution and (b) Fc time-evolution [147].
Jmmp 08 00037 g020
Figure 21. hch compared experimentally and numerically in low- and high-vc conditions [148].
Jmmp 08 00037 g021
Figure 22. Workpiece T distribution around tool edge and along workpiece depth with different tool geometries. Effect of (a) tool’s γ, (b) tool’s rβ, and (c) VB [54].
Jmmp 08 00037 g022
Figure 23. Effect of different wear types on material separation point with (a) new tool, (b) rounded cutting edge, (c) worn rake face and (d) worn flank face [18].
Jmmp 08 00037 g023
Figure 24. The comparison of hch between experiments and simulations [150].
Jmmp 08 00037 g024
Figure 25. Stress profile in INCONEL® 718 emanating from the machined surface using a cBN tool at different VB and (a) vc = 200 m/min and (b) vc = 350 m/min [151].
Jmmp 08 00037 g025
Figure 26. Progression of the near-surface point P1 during machining at T0: (1) the material adjacent to point P1 experienced compressive stress; (2) point P1 attained the peak compressive stress; (3) point P1 came into contact with the tool, reaching Tmax = 600 °C; (4) upon contact, the stress direction at point P1 shifted towards tensile, followed by a rapid cooling process and the relaxation of compressive stresses; (5) subsequently, due to a gradual cooling process, the stress at point P1 transitioned towards tensile [152].
Jmmp 08 00037 g026
Figure 27. Analysis encompassing the comparison of chip morphologies and related assessments between experimentally obtained chips and their simulated counterparts [153].
Jmmp 08 00037 g027
Figure 28. Comparison of T, CL, and damage fields in the PDD modelling approach at varying vc together with the experimental chip shapes [53].
Jmmp 08 00037 g028
Figure 29. Meshing process depiction of numerical lathing [49].
Jmmp 08 00037 g029
Figure 30. Configuration of the chip based on the drill tool geometry and the process parameters [103].
Jmmp 08 00037 g030
Figure 31. (a) A 3D FEA model representing the drilling process, (b) elaborate mesh details concerning the cutting edge of the drill bit. Simulations were conducted to analyse (c) T and (d) σeq distributions within the drill under cryogenic cooling after tcut = 6 min duration [154].
Jmmp 08 00037 g031
Figure 32. Numerical analysis on flow velocity distributions of the different initial arrangements of ECMG tools with distances between the hole centres of any two adjacent rows of (a) 6.8 mm, (b) 3.4 mm, (c) 2.3 mm, and (d) 1.7 mm [156].
Jmmp 08 00037 g032
Figure 33. FEA models of (a) contour milling and (b) ramp milling of INCONEL® 718 [130].
Jmmp 08 00037 g033
Figure 34. Schematic diagram of (a) LAM, (b) IAM, (c) FEA model, and (d) results of laser thermal induction; (e) FEA model and (f) results of magnetic induction (adapted from [131]).
Jmmp 08 00037 g034
Figure 35. Conceptual diagram of (a) LAM and (b) LAM with heat shield, (c) thermal FEA of LAM, (d) thermal FEA of LAM with heat shield (adapted from [133]).
Jmmp 08 00037 g035
Figure 36. Distribution of T and σ along the depth direction during laser scan, (a) T amplitude at different depths decreases with the increase of the distance from the surface, (b) as time changes, σy at different depths decreases first and then increases slightly with the T change [51].
Jmmp 08 00037 g036
Figure 37. Three-dimensional meshing of (a) milling tool and (b) INCONEL® 718 workpiece. FEA results of chip morphology with (c) CM and (d) LAM (adapted from [157]).
Jmmp 08 00037 g037
Figure 38. (a) The top-section and (b) cross-section perspectives of the T distribution generated by a laser rotating at 3500 rpm. (c) The top-section and (d) cross-section perspectives at a rotational speed of 7000 rpm, featuring r = 0.2 mm and a moving speed of 1000 mm/min (following a trochoidal path, with T denoted in units of Kelvin). [134].
Jmmp 08 00037 g038
Table 1. Different coupled material constitutive equations (adapted from [10,11,12,13]).
ModelEquation
Johnson–Cook (JC) [14,15,16,17,18] σ J C = A + B ε p n 1 + C ln ε ˙ p ε ˙ p 0 ( 1 ( T T 0 T m T 0 ) m )
Modelling strain softening
Calamaz σ = σ J C [ D + 1 D tanh ( 1 ε + ε a ) ]
D = 1 ( p ε r 1 + p ε r ) tanh [ ( T T 0 T r e c T 0 ) q ]
Sima and Ozel σ = σ J C D + 1 D tanh 1 ε + S r S
Lurdos σ = σ S + σ 0 σ S + A ε n e r ε
Modelling the coupling between T and ε ˙
Lin σ = A 1 + B 1 ε + B 2 ε 2 1 + C 1 ln ε ˙ p ε ˙ p 0 e   λ 1 + λ 2 ln ε ˙ p ε ˙ p 0 T T r e f
Arrhenius σ = 1 a ln Z A 1 n + Z A 2 n + 1 1 2   a n d   Z = ε ˙ e Q R T
Wang σ J C + W = A + B ε p n 1 + C T ln ε ˙ p ε ˙ p 0 1 T T 0 T m T 0 m
C T = 0.0232 0.00372 + 0.0021 sin ε ˙ 5000 3000 π sin T 500 150 π
Modified Johnson–Cook σ M J C = A + B 1 ε + B 2 ε 2 1 + C ln ε ˙ p ε ˙ p 0 e   λ 1 + λ 2 ln ε ˙ p ε ˙ p 0 T T 0
Hensel–Spittel σ H S = A H S e m 1 T ε m 2 ε ˙ m 3 + m 8 T e m 4 ε 1 + ε m 5 T e m 7 ε T m 9
Modified Hensel–Spittel sinh α σ H S = A H S e m 1 T ε m 2 ε ˙ m 3 e m 4 ε 1 + ε m 5 T e m 7 ε
Z = ε ˙ e Q R T = A σ H S n 1   ,   f o r   ,   α σ H S < 0.8
Z = ε ˙ e Q R T = A e β σ H S   ,   f o r   ,   α σ H S > 0.8
Modified Zerilli–Armstrong σ Z A M = C 1 + C 2 ε n e C 3 + C 4 ε T T 0 T m T 0 + C 5 + C 6 ε ln ε ˙ p ε ˙ p 0
Z—Zenner–Hollomon parameter.
Table 2. Values of A, B, C, m, and n for INCONEL® 718 and 625 were obtained from different authors.
MaterialA (MPa)B (MPa)CmnHeat TreatmentReference
INCONEL® 71845017980.031200.0000.9143Annealed[10]
135011390.013400.0000.6522Aged
45017000.017001.3000.6500Annealed
12416220.013400.0000.6522Aged
12416220.013401.3000.6522Aged
10123930.027102.4200.1250-[38]
10125110.027104.3300.3960-
10125130.027102.5400.4220-
12416220.013401.3000.6520-[43]
4859040.015001.6900.7770-[44]
7906100.011003.2800.2300-[45]
45017000.017001.3000.6500-[46]
137712430.004501.2000.6767-[47]
7906100.011003.2800.2300-[48]
45017000.017001.3000.6500-[49]
12908950.016001.5500.5260-[50]
124010240.015200.8330.7189-[51]
INCONEL® 62522334140.0007421.2166500.660803As-printed[11]
3093532−0.038251.3416910.665168Annealed
12048980.072521.0510.8945-[33]
(-) Information not mentioned.
Table 3. The constant parameters of INCONEL® alloys for JC shear fracture damage model.
MaterialD1D2D3D4D5Reference
INCONEL® 7180.110.75−1.450.040.89[56]
Table 4. Fracture-energy-based criteria for damage progression.
ModelEquation
Griffith’s critical stress intensity factor [57] K I C = Y σ u π a = G c E
J-integral [58] J = Γ W n 1 t i u i x 1   d Γ ,   t = σ · n
Essential Work of Fracture (EWF) [52] W f = W e + W p = w e A f + β w p A f
Cockcroft–Latham (CL) [53] σ σ y 2 + ε ε f 2 = 1
Hillerborg’s fracture energy criterion [54,55,56] G f = ε ¯ 0 p ε ¯ f p L σ ¯   d ε ¯ p = 0 u ¯ f p σ ¯   d u ¯ p
u i x 1 —displacement gradient vector; a—crack dimension; Af—fracture area; Gc—critical energy release rate; Gf—fracture dissipation energy; J—energy release rate; KIC—critical stress intensity factor; L—characteristic length; n—normal vector to the boundary; t—coordinate directions; u ¯ p —equivalent plastic displacement; u ¯ f p —equivalent plastic displacement at failure; Y—geometrical constant; we—specific essential work of fracture; We—essential work of fracture; Wf—work of fracture; Wn1—strain energy density; wp—specific work of propagation; Wp—work of propagation; β—shape parameter; Γ—chosen boundary; [σ]—Cauchy stress tensor; σu—tensile strength.
Table 5. Typical TW mathematical models (adapted from [73]).
ModelTW ModelComments
Taylor [74] C = v c T t o o l n   o r   T t o o l = C v c p f q a p r Taylor’s empirical TL model.
Archard [75] V = k P L 3 σ S = k P L H Abrasive wear model.
Usui [46,76,77] d w d t = A 1 σ n v s e B 1 T Diffusive wear model.
Takeyama and Murata [78] d w d t = G v , f + D e Q R T Abrasive and adhesive wear model.
Childs [79] d w d t = A H σ n v s
Schmidt [80] d w d t = B e Q R T Diffusive wear model.
Luo [81] d w d t = A H F n v c f v s + B e Q R T Abrasive, adhesive, and diffusive wear model.
Astakov [82,83] h s = d h r d S = 100 h r h r i 1 l i f Surface wear model.
Halila [84,85] W = N i i   min   j = 1 I P r R R i P r ϕ ϕ j R i 2 P 2 H t tan ϕ j v c TW model is dependent on the material removal rate.
Pálmai [86] d W d t = v c W A α + A t h e B v c x + K W TW model, considering the effects of wear-induced cutting, force, and T rise on TW.
Attanasio [87,88] d w d t = D T e Q R T D T = D 1 T 3 + D 2 T 2 + D 3 T + D 4 Diffusive TW model, presenting the T-dependent diffusive coefficient.
Table 6. Summarised performance comparison of approaches for machining studies (adapted from [100]).
FormulationTypeAdvantagesDisadvantages
Lagrangian (LAG)Classical FEABetter results approximationChip separation required, mesh distortion, difficult-to-mesh complex geometries.
EulerianNo chip separation is required, and direct steady-state chip conditions are computationally efficient.A predefined chip geometry is required, as it is difficult to locate free surfaces.
Arbitrary Lagrangian–Eulerian (ALE)Combines features of LAG and Eulerian to avoid mesh distortion.Computationally expensive, difficult to apply for brittle materials, re-meshing required in extreme deformation, error in the history of the state variable, inefficient in small deformation areas.
Coupled Eulerian–Lagrangian (CEL) [30,101]Mesh distortion is eliminated [102], and chip geometry and separation criteria are not defined. -
Rigid Arbitrary Lagrangian–Eulerian (R-ALE) [103,104]Combines rigid movements of the mesh to avoid distortions.-
SPH, DEM, FPM (Lagrangian) [29,105,106]Particle (meshless)Particle-based (no mesh distortion), better interface friction criteria, ideal for simulating brittle behaviour.Not suitable for more minor deformation, suffers tensile instability.
PFEM (Lagrangian)Particle (mesh-based)Uses particle- and mesh-based approach features, no chip separation criteria required, and new mesh adjustment according to node positions.Computationally expensive, limited performance evaluation.
(-) Information not mentioned; DEM—Discrete Element Method; FPM—Finite Pointset Method; PFEM—Particle Finite Element Method; SPH—Smoothed Particle Hydrodynamics.
Table 7. Some of the existing friction models for tool–workpiece interaction simulation.
ModelEquation
Amonton–Coloumb [115,116] τ f = μ σ n
Prandtl–Tomlinson [117] τ f = k f τ max
Amonton–Coloumb–Prandtl hybrid [118] τ f = μ σ n ,   μ σ n < k f τ max k f τ max ,   μ σ n k f τ max  
Zorev [92,119] τ f = μ σ n ,   τ f < τ ¯ max   s l i d i n g τ ¯ max ,   τ f > τ ¯ max s t i c k i n g  
Usui and Shirakashi [115] τ f = τ ¯ 1 e μ σ n τ ¯
Usui and Hoshi [89] τ f = k f σ ¯ 1 e μ σ n σ ¯
kf—friction factor; μ—friction coefficient; σn—interface pressure; τ ¯ —shear flow stress; τf—frictional stress; τ ¯ max —maximum shear flow stress; τy—yield shear stress.
Table 8. Predictive models based on physics and experiments for HPC [121,122].
A Predictive Model for HPCEquationEstablishment Basis
Loewen–Shaw [123] H P C L S H = q F l c λ T A Δ θ p   max + θ 0 q F l c λ T A + q F 0.377 l c λ W v c h l c 4 α W Dry-cutting process of AISI 1113 steel with K2S cemented carbide tool, vc = 30 − 182 m/min.
Shaw [124] H P C S H = 1 1 + 0.754 λ T λ W / A S F v c h l c 2 α W
Kato–Fujii [125] H P C K F = 1 1 + λ T λ W α W α T Surface grinding process of stainless steel/carbon steel with Al-oxide wheel.
List–Sutter [126] H P C L S U = 1 1 + 0.754 λ T v c h l c λ W α W 2 π ln 2 w l c + 1 3 l c w + 1 2 Dry-cutting process of AISI 1018 mild steel with uncoated carbide tool (vc = 23 − 60 m/min; undeformed 0.26 < hch < 0.38 mm).
Gecim–Winer [127] H P C G W = 0.807 λ W v c h l c α W λ T + 0.807 λ W v c h l c α W Based on the thermal behaviour of the two-dimensional transient T distribution near a small, stationary, circular heat source equation of the average T of the moving and stationary heat sources between frictional contacts.
Reznikov [128] H P C R = 1 1 + 1.5 λ T λ W α W α T Based on the Green function to analyse the chip deformation and friction work along the tool rake face.
Berliner–Krajnov [129] H P C B K = 1 1 + 0.45 λ T λ W π α W v c h l c
Tian–Kennedy [129] H P C T K = 1 1 + λ T λ W 1 + v c h l c α T 1 + v c h l c α W Considers Peclet numbers for the tool and workpiece materials in sliding tribological contact.
ASF—area shape factor; lc—tool–chip contact length; qF—frictional heat flux generated in the secondary deformation zone (SDZ); Rchip—heat partition coefficient representing heat entering the moving chip from the SDZ; vch—chip moving speed; αT—tool thermal diffusivity; αW—workpiece thermal diffusivity; Δθp max—maximum tool–chip interface temperature rise due to heat generation in PDZ; θ0—environmental temperature; λT—tool thermal conductivity; λW—workpiece thermal conductivity.
Table 9. Maximum percentile prediction error for the cutting forces according to the orthogonal axis (Fx, Fy, and Fz) components at 62 and 93 rpm [142].
62 rpm93 rpm
Fx−0.09%11.38%
Fy13.96%−0.46%
Fz22.70%11.00%
Disclaimer/Publisher’s Note: The statements, opinions and data contained in all publications are solely those of the individual author(s) and contributor(s) and not of MDPI and/or the editor(s). MDPI and/or the editor(s) disclaim responsibility for any injury to people or property resulting from any ideas, methods, instructions or products referred to in the content.

