Article

Innovative Fabrication Design for In Situ Martensite Decomposition and Enhanced Mechanical Properties in Laser Powder Bed Fused Ti6Al4V Alloy

by
Behzad Farhang
1,
Ahmet Alptug Tanrikulu
2,3,
Aditya Ganesh-Ram
1,
Sadman Hafiz Durlov
1 and
Narges Shayesteh Moghaddam
1,*
1
Mechanical and Aerospace Engineering, University of Texas at Arlington, Arlington, TX 76010, USA
2
Materials Science and Engineering, University of Texas at Arlington, Arlington, TX 76010, USA
3
Turkish Aerospace Industries, Ankara 06980, Turkey
*
Author to whom correspondence should be addressed.
J. Manuf. Mater. Process. 2023, 7(6), 226; https://doi.org/10.3390/jmmp7060226
Submission received: 3 November 2023 / Revised: 9 December 2023 / Accepted: 13 December 2023 / Published: 16 December 2023

Abstract

:
Ti6Al4V alloy (Ti64) is a popular material used in the aerospace, medical, and automotive industries due to its excellent mechanical properties. Laser Powder Bed Fusion (LPBF) is a promising manufacturing technique that can produce complex and net-shaped components with comparable mechanical properties to those produced using conventional manufacturing techniques. However, during LPBF, the rapid cooling of the material can limit its ductility, making it difficult to achieve high levels of ductility while maintaining the required tensile strength for critical applications. To address this challenge, this study presents a novel approach to controlling the microstructure of Ti64 during LPBF by using a border design surrounding the main parts. It is hypothesized that the design induces in situ martensitic decomposition at different levels during the fabrication process, which can enhance the ductility of the material without compromising its tensile strength. To achieve this aim, a series of Ti64 samples were fabricated using LPBF with varying border designs, including those without borders and with gaps from 0.5 to 4 mm. The microstructure, composition, and mechanical properties of the Reference sample were compared with those of the samples fabricated with the surrounding border design. It was found that the latter had a more homogenized microstructure, a higher density, and improvements in both ductility and tensile strength. Moreover, it was discovered that the level of property improvement and martensitic transformation can be controlled by adjusting the gap space between the border and the main part, providing flexibility in the fabrication process. Overall, this study presents a promising approach for enhancing the mechanical properties of Ti64 produced via LPBF, making it more suitable for critical applications in various industries.

1. Introduction

Titanium (Ti) and its alloys possess a wide range of properties that make them highly suitable for various applications. These properties include exceptional corrosion resistance, a high strength-to-weight ratio, and remarkable fracture toughness [1,2,3,4]. The aerospace and marine industries have long leveraged these properties to their advantage [1,5,6,7]. In addition, the biomedical field has shown a keen interest in titanium alloys due to their biocompatibility, as they can be used for producing hard tissue replacements and cardiovascular devices, thereby improving the quality of life for patients [1,8,9,10,11]. Among the titanium alloys, Ti6Al4V, also known as Ti64, is one of the most versatile and extensively used in these industries. This alloy not only exhibits the aforementioned properties but is also cost-effective while providing a performance comparable to that of other titanium alloys [12,13,14,15].
Although conventional methods such as casting, forging, and powder metallurgy can yield Ti64 components with comparable mechanical properties [16,17,18,19,20], they are often limited by restricted forging temperature ranges, deficient formability, high material and equipment costs, and inefficient machining times, making it difficult to fabricate complex geometries [21,22]. To address these challenges, Additive Manufacturing (AM) has emerged as a promising solution, allowing for the fabrication of near-net-shaped components using materials like Ti64 while still maintaining superior or comparable strength levels [23,24]. Among the AM techniques, Laser Powder Bed Fusion (LPBF) is particularly suitable for manufacturing complex 3D geometries requiring precision and has been extensively utilized for producing a variety of metallic materials [25,26,27,28,29], with Ti64 being a popular candidate [30,31,32,33,34]. LPBF has the capability to produce Ti64 components that exhibit a wide range of distinct crystallographic phases and microstructures, resulting in a more efficient and productive manufacturing process [22]. Given the growing popularity of LPBF as an AM method, numerous studies have been conducted to analyze the composition, microstructure, and mechanical properties of LPBF Ti64.
The field of LPBF Ti64 fabrication has been extensively researched, with multiple studies exploring ways to improve the mechanical properties of the produced components by adjusting the processing parameters. One example of such research is the study conducted by Khorasani et al. [35], which examined the correlation between the laser process parameters, density, and hardness of Ti64. The researchers found a direct correlation between the laser power and the hardness and density of the material, whereas they observed an inverse relationship between scanning speed and these properties. Maleki et al. [36] used a neural network model to optimize the process parameters and enhance the mechanical properties of Ti64. The analysis revealed that the laser process parameters had the same effect on yield and ultimate tensile strengths, with scanning speed having the most significant impact on the variation in yield and ultimate tensile strengths, followed by laser power and hatch spacing. In a study conducted by Plessis [37], the formation of defects in LPBF Ti64 was examined under the influence of process parameters. The study found that increasing laser power resulted in more keyhole formations, while higher scanning speeds offered a safer processing window for avoiding pore formation. However, despite these studies’ efforts to optimize the processing parameters for LPBF Ti64 fabrication, there are limits to adjusting the material’s properties due to the microstructure’s inability to change.
In recent years, attention has shifted toward techniques aimed at promoting the decomposition of needle-shaped α′ martensite and hence improving the final mechanical properties of LPBF-processed Ti64 [38,39,40,41,42]. For instance, Liu et al. [43] achieved improvements in both tensile strength and ductility of LPBF-processed Ti64 by tailoring the process parameters to limit α′ martensite formation. A similar study by Xu et al. [44] obtained in situ martensitic decomposition by fine-tuning the LPBF fabrication parameters, particularly the laser focal offset distance, resulting in strong and ductile Ti64 parts. Heat treatment has also been investigated as a way to promote decomposition and improve the mechanical properties of LPBF-fabricated Ti64 [45,46,47,48]. Nevertheless, this method has been found to be time-consuming and expensive and may even lead to a loss of strength for the part [45,47,49,50]. While the studies on promoting the decomposition of α′ martensite have shown improvements in the mechanical properties of LPBF-processed Ti64, they have required significant optimization of process parameters and machine-dependent variables using design-of-experiment approaches and trial-and-error attempts. Despite these efforts, the resulting level of improvement may not meet the set requirements of critical industries, indicating a need for further research in this area.
In our previous study on spatial heat transfer conditions during LPBF [51], we found that regions near the surfaces of fabricated parts experience more convection heat transfer, resulting in microstructural inhomogeneity. To address this issue, we designed a border surrounding the main part during LPBF in another study [52] to control heat transfer and achieve a more homogeneous microstructure and composition. Building upon this success, we conducted a new study to investigate the potential of this method for in situ martensitic transformation during LPBF of Ti64, with the goal of improving its mechanical properties, such as microhardness and ductility, without compromising ultimate tensile strength. This approach involves designing the border to mitigate undesirable convection heat transfer near the part surfaces, which could lead to in situ martensitic transformation, thereby improving the mechanical properties of the Ti64 parts. Our study aims to contribute to the development of LPBF processing techniques that can improve the mechanical properties of critical components used in various industries.

2. Fabrication and Experimental Procedure

2.1. Powder Preparation and Fabrication

In this study, gas-atomized Ti64 (grade 5) powder was obtained from EOS North America (Pflugerville, TX, USA) for sample fabrication. Prior to fabrication, the powder underwent particle size analysis using scanning electron microscopy (SEM), as shown in Figure 1. The SEM images were analyzed using Image J software [64 bit Java 8] to determine the distribution of the powder, revealing an average particle size of approximately 22 µm [53]. Moreover, the powder analysis indicated that the majority of the particles had a spherical shape, which is favorable for achieving a high packing density during LPBF processes [54,55]. The spherical shape of the powder particles can also improve flowability, reduce powder accumulation, and enhance uniformity during the powder deposition process, ultimately leading to improved mechanical properties of the fabricated parts [56,57].
The fabrication process was performed using an EOS M290 LPBF process printer (EOS GmbH, Electro Optical Systems, Krailling, Germany) with a 400 W Ytterbium fiber laser. The process parameters recommended by the manufacturer, including a laser power of 285 W, hatch distance of 110 µm, scanning speed of 960 mm/s, layer thickness of 40 µm, and stripes scanning strategy with a hatch angle of 67°, were applied for all the samples. The samples were fabricated in an argon atmosphere to prevent oxidation of the Ti64 powder. The temperature of the build plate was maintained at 80 °C during the fabrication process to reduce the thermal gradient within the first few layers. For samples surrounded by a border, both the main part and the border were laser scanned and fabricated at the same time as a single part. To ensure the effectiveness of the heat transfer control at the border, a standardized approach was adopted for all samples in the present study. The fabrication process involved first constructing the border for each sample, followed by the fabrication of the associated main part. This fabrication order was applied to ensure heat confinement inside the border and avoid lateral heat transfer that might occur in the absence of the border section. This consistent methodology was applied to maintain uniformity and accurately assess the impact of the border on heat transfer. The as-built specimens were removed from the building plate using a wire Electrical Discharge Machining (EDM) cutter (EDM Network, Inc., Sugar Grove, IL, USA). The fabricated samples that were developed both for microstructural analysis and tensile testing are shown in Figure 2.
For analyzing both the microstructure and mechanical response of the fabricated sample, two separate specimens were fabricated. Their design details are documented in Table 1 below. Also, the schematic of the dog-bone specimen for evaluating mechanical properties is shown in Figure 3.

2.2. Experimental Procedure

For microstructure analysis, the cubic samples were sectioned using a TECHCUT 5™ precision low-speed cutter (Allied High-Tech Products, Inc., Rancho Dominguez, CA, USA), with the cutting plane parallel to the build direction. An area of 3 by 3 mm at the center of the cutting section, close to the border, was used for microstructural analysis for all the samples. Scanning Electron Microscopy (SEM) was performed using a Hitachi S-3000 N variable pressure (Hitachi, Santa Clara, CA, USA). In addition to the porosity analysis, lath thickness analysis was performed using the SEM images. To ensure a robust analysis, at least ten images were selected for each sample to be processed using Image J (a commercially available image analysis software). The image processing includes the conversion of SEM images into RGB stack files and then adjusting the thresholding to generate the gray-scale images with clear contrast, from which α/α′ phases can be distinguished from the β phase. The average value reported by Image J was used for the comparison of α/α′ lath thickness between samples, with the standard deviation extracted from the whole data being included in the plot for all samples. To prepare the samples for SEM, they were first mounted into a mixture of epoxy resin and hardener, followed by grinding and polishing using an E-prep 4™ polisher (Allied High-Tech Products Inc., Rancho Dominguez, CA, USA). The grinding process was conducted using carbide (SiC) abrasive disks ranging from 180 to 1200 Grit sizes. The surface of the samples was checked for scratch patterns using magnifier lenses of a metallographic microscope XJP-H100 (Amscope, Irvine, CA, USA), and the grinding was repeated for each step until a uniform scratch pattern was achieved. The first polishing step was performed on a DiaMat polishing cloth with frequent addition of 1 µm diamond suspension droplets. For the final polishing step, 0.04 µm colloidal silica suspension was spread on a Red Final C polishing pad. After polishing, the samples were rinsed in Micro Organic Soap, cleaned using isopropyl alcohol, and finally dried via compressed air. Prior to microstructural tests, samples were etched for a few seconds using Kroll’s Reagent (1–3 mL HF, 2–6 mL HNO3, 100 mL water).
A Bruker D8 Advance X-ray diffractometer (Bruker Corporation, Madison, WI, USA) was used to perform compositional analysis of the samples. The Cu K-alpha X-ray source had a wavelength of 1.5406 Å, a current of 40 mA, and a voltage of 40 kV. Measurements were taken at room temperature with step intervals and scan speeds of 0.04° and 1 s/step, respectively, as 2θ varied between 30° and 70°. The volume fraction of each phase was calculated using Equation (1) [58], where Ai represents the total integrated area of each phase, and ∑Ai is the total area of all phases. XRD diffractograms were analyzed, and the integrated area of each phase was calculated using X’Pert HighScore Plus software (Malvern Panalytical Ltd., Westborough, MA, USA) equipped with ICDD PDF-2 databases (International Centre for Diffraction Data, Newtown Square, PA, USA).
V f , i = A i A i
Vickers hardness measurements were taken at 10 marked locations along the build direction, and their average values were reported for all samples. The measurements were conducted using a LECO LM 300 AT Micro Hardness Tester (LECO, St. Joseph, MI, USA) with an indentation force of 1 kg, and the indentation was applied for 10 s in accordance with ASTM E92 standard [59].
The tensile tests were conducted using a Shimadzu EHF E-series (100 KN) machine equipped with a 4830 Servo Controller (Shimadzu Scientific Instruments, Inc., Missouri City, TX, USA) at a constant loading rate of 1.2 mm/min. For all the samples, the tensile test direction was perpendicular to the building direction. Digital image correlation (DIC) was employed to obtain full-field strain measurements and evaluate localized strains during the tests. A random, high-contrast speckle pattern of black micron-sized speckles on a white base coat was used for the DIC analysis. The specimen surface displacements and strains were calculated by tracking the light intensity patterns corresponding to the speckle pattern using a Grasshopper3 GS3-U3-23S6M CCD camera (FLIR Systems, Inc., Santa Barbara, CA, USA) with a pixel array of 1920 × 1200 pixels. The VIC-3D® correlation software (Correlated Solutions, Inc., Irmo, SC, USA) was used for image processing and correlation analysis. A region of interest covering the entire gauge length of the samples was selected for analysis, with a subset size and step size of 9 mm and 1 mm, respectively, to achieve the highest accuracy.

3. Results

3.1. Microstructure Analysis

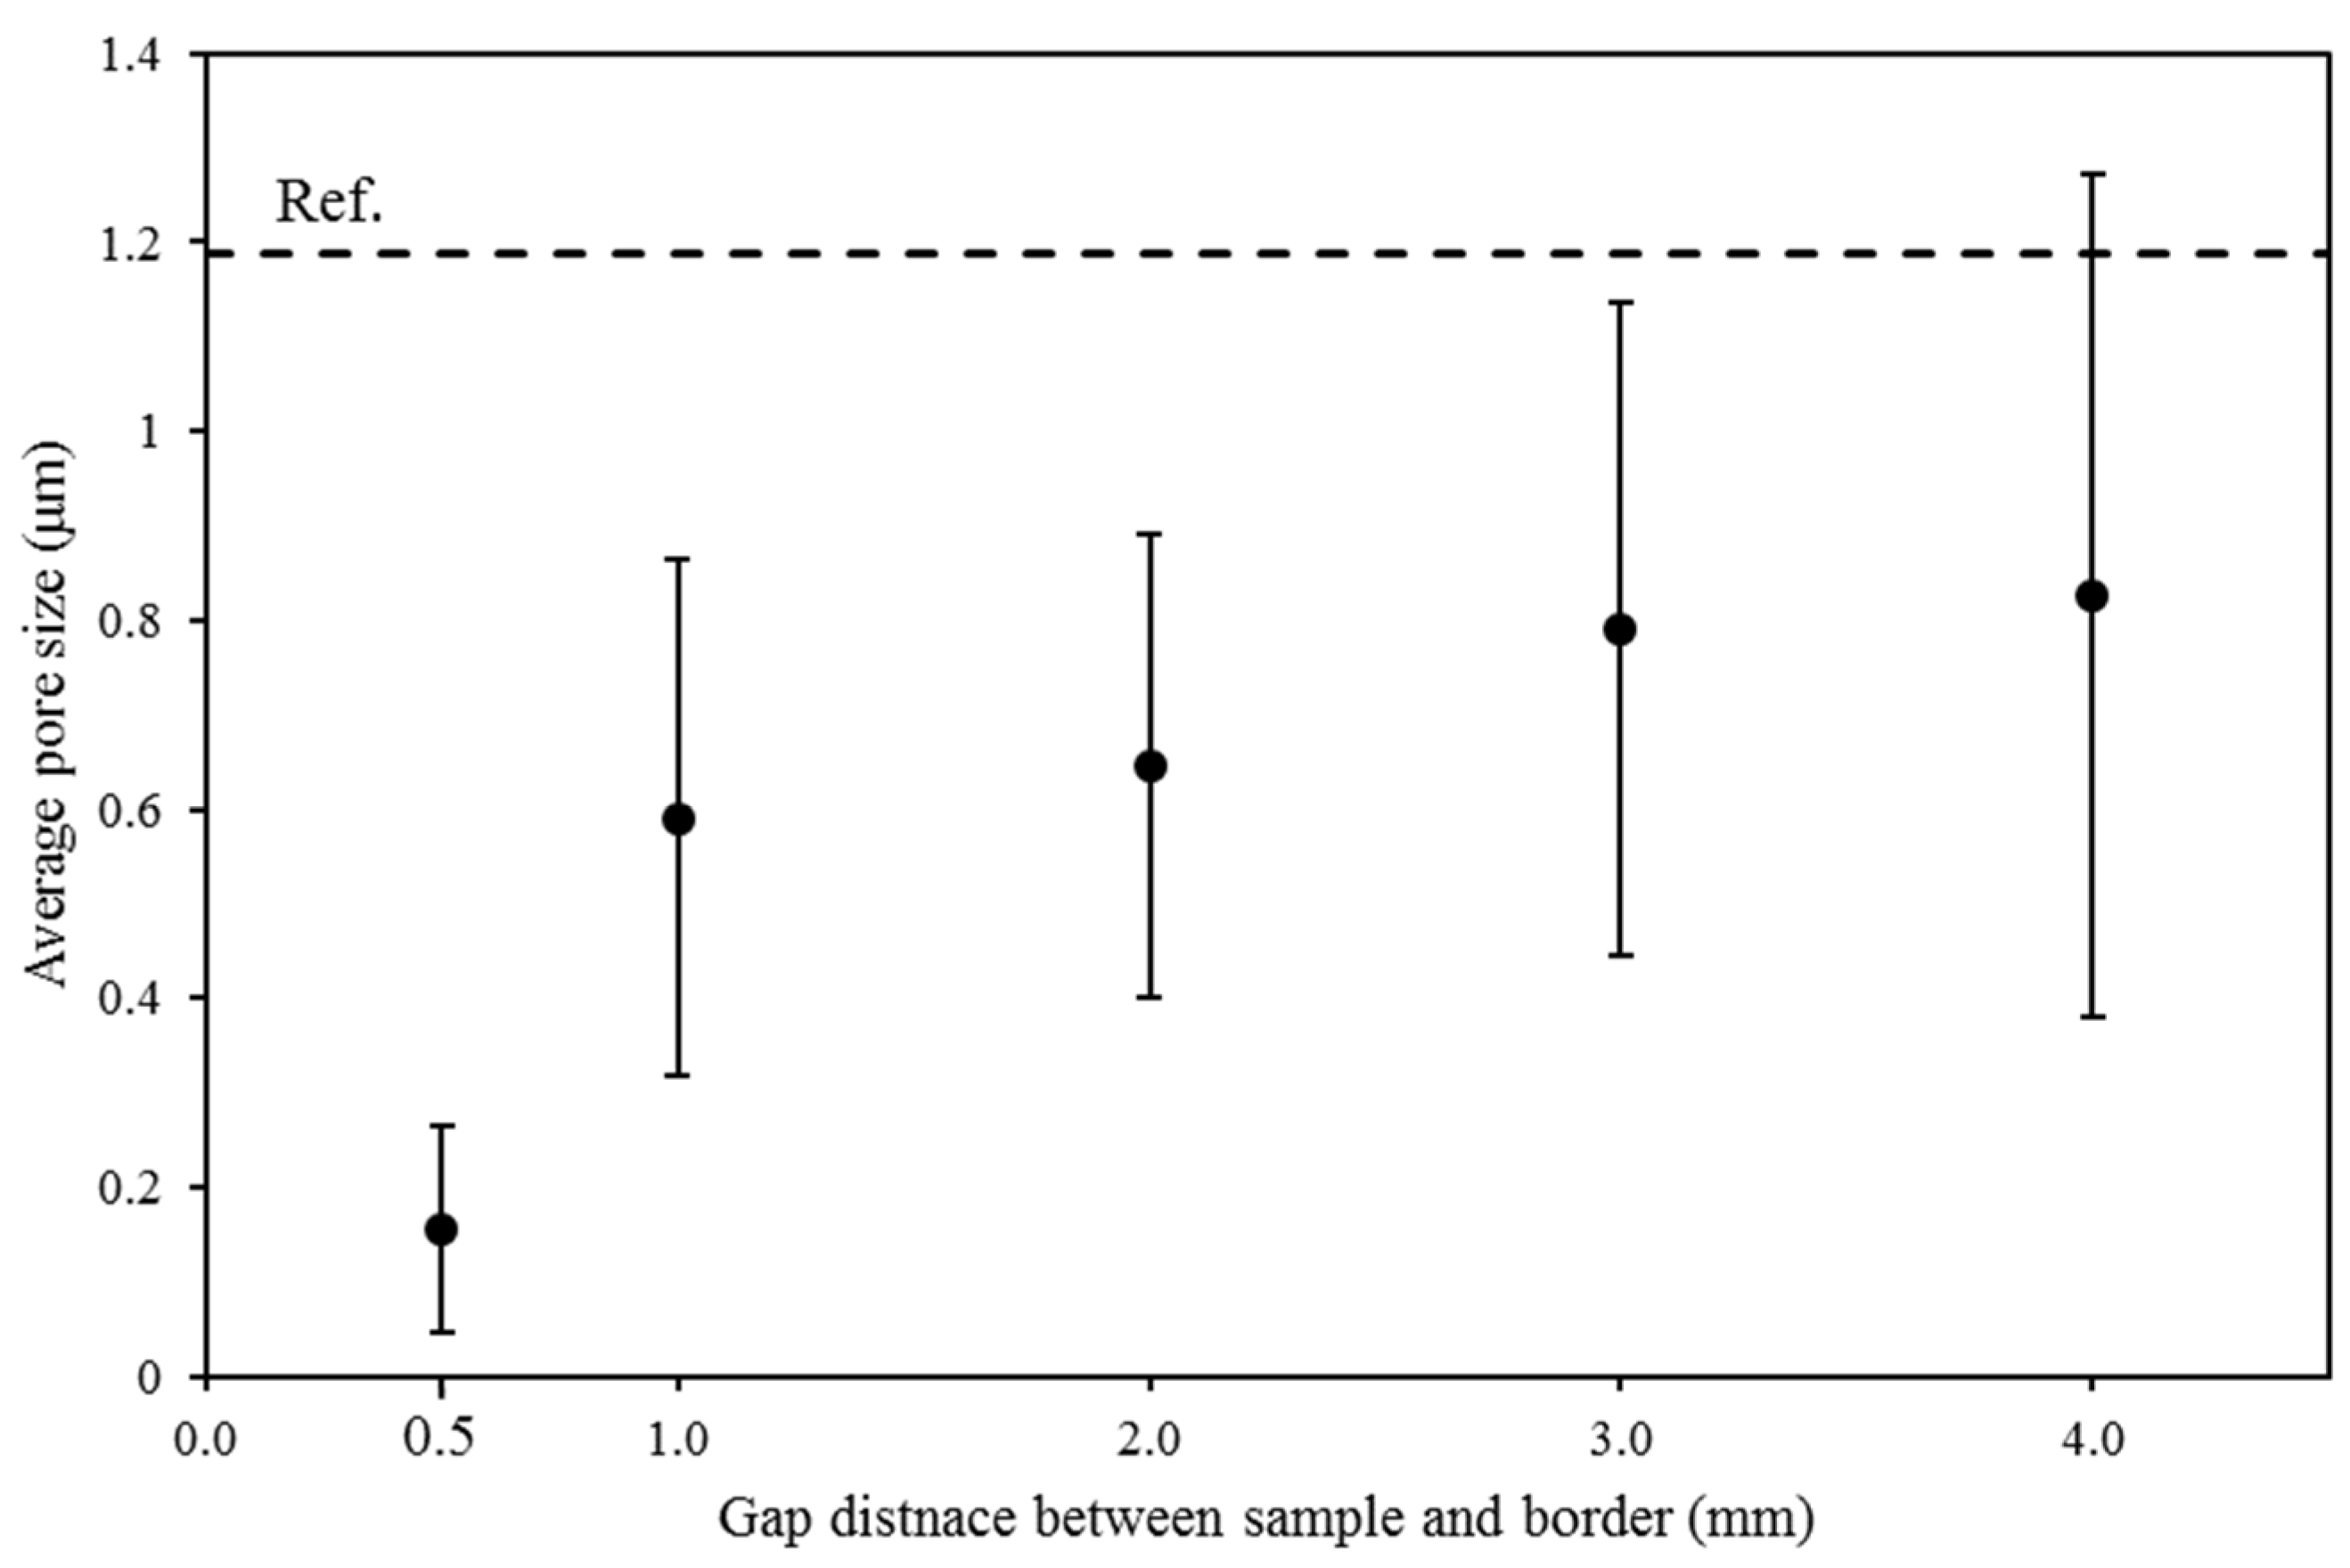
3.1.1. Porosity Analysis

The level of residual porosity for all the samples was analyzed by examining SEM micrographs taken from 20 different areas of each sample. Figure 4 shows a representative SEM image for the Reference and Gap 0.5 samples, which, respectively, had the highest and lowest porosity values. Using data analysis, we calculated the average porosity percentage for all the samples, as shown in Figure 5. While there was relatively high variation among each sample, the average porosity percentage followed a general trend. Specifically, we observed an increase in the level of porosity with an increase in the gap distance between the sample and the border. However, regardless of the gap distance, the average rate of residual porosity was lower for all the samples fabricated with a border compared to that of the Reference sample. Notably, for the Gap 4.0 sample, some micrographs showed the formation of pores that were greater than the average porosity calculated for the Reference sample.
We also calculated the average pore size for all the samples, which is shown in Figure 6. Similar to the residual porosity, we found a general trend for the size. However, the average pore size for the Gap 0.5 sample was significantly smaller than all the samples, with only minor variation being observed for the rest of the samples fabricated with a border. Regardless of the gap distance, the Reference sample possessed the highest average pore size. Overall, the results suggest that the use of borders during the LPBF process can significantly reduce the occurrence of porosity and improve the quality of fabricated parts, with the optimal gap distance being 0.5 mm.

3.1.2. Phase Morphologies and Variations

The microstructure of the samples was examined in detail by capturing SEM images from 20 different regions of each sample. The resulting micrographs revealed that the morphology and proportion of the phases (i.e., α, α′, and β) varied to some extent between samples. The most significant variation was observed between the Reference and Gap 0.5 samples. The former mainly consisted of acicular α′ phase, whereas the latter contained a mixture of α + β basket-weave matrix, lamellar α, and acicular α′ (see Figure 7). The microstructure of the other samples fell between these two cases, with varying proportions of the different phases. Specifically, the Gap 1.0 and Gap 2.0 samples exhibited a greater prevalence of acicular-like α phase, with a reduction in the formation of the α + β matrix. Additionally, the microstructure of the Gap 3.0 and Gap 4.0 samples was similar to that of the Reference sample, as almost entirely acicular α′ morphology was observed for these samples.
The impact of the border gap on the size of the α/α′ phase formed in the samples was investigated by measuring the thickness of α/α′ lamellar/acicular instances in the SEM micrographs. Figure 8 presents the results, which indicate that the average thickness of α/α′ increased as the gap value decreased. Furthermore, the average lath thickness was higher for all samples fabricated with a border compared to the Reference sample. These results suggest that the border gap has a significant impact on the formation of the α/α′ phase and the microstructure of the samples.

3.2. Compositional Analysis

3.2.1. Energy Dispersive Spectroscopy (EDS) Analysis

Energy Dispersive Spectroscopy (EDS) analysis was used to compare the chemical composition of all samples. While this technique provides only semi-quantitative results and cannot offer high accuracy for the chemical composition of samples, it serves a comparative purpose among samples [60]. To ensure comprehensive analysis, 30 instances of the α lamellar/α′ acicular phase were selected for each sample, and the vanadium content was sleeted to be compared among samples. The results of the analysis are presented in Table 2, which shows that the vanadium percentage was lowest for the Gap 0.5 sample and increased as the gap value became larger. Conversely, the α/α′ needles in the Reference sample had the highest content of vanadium regardless of the gap size.

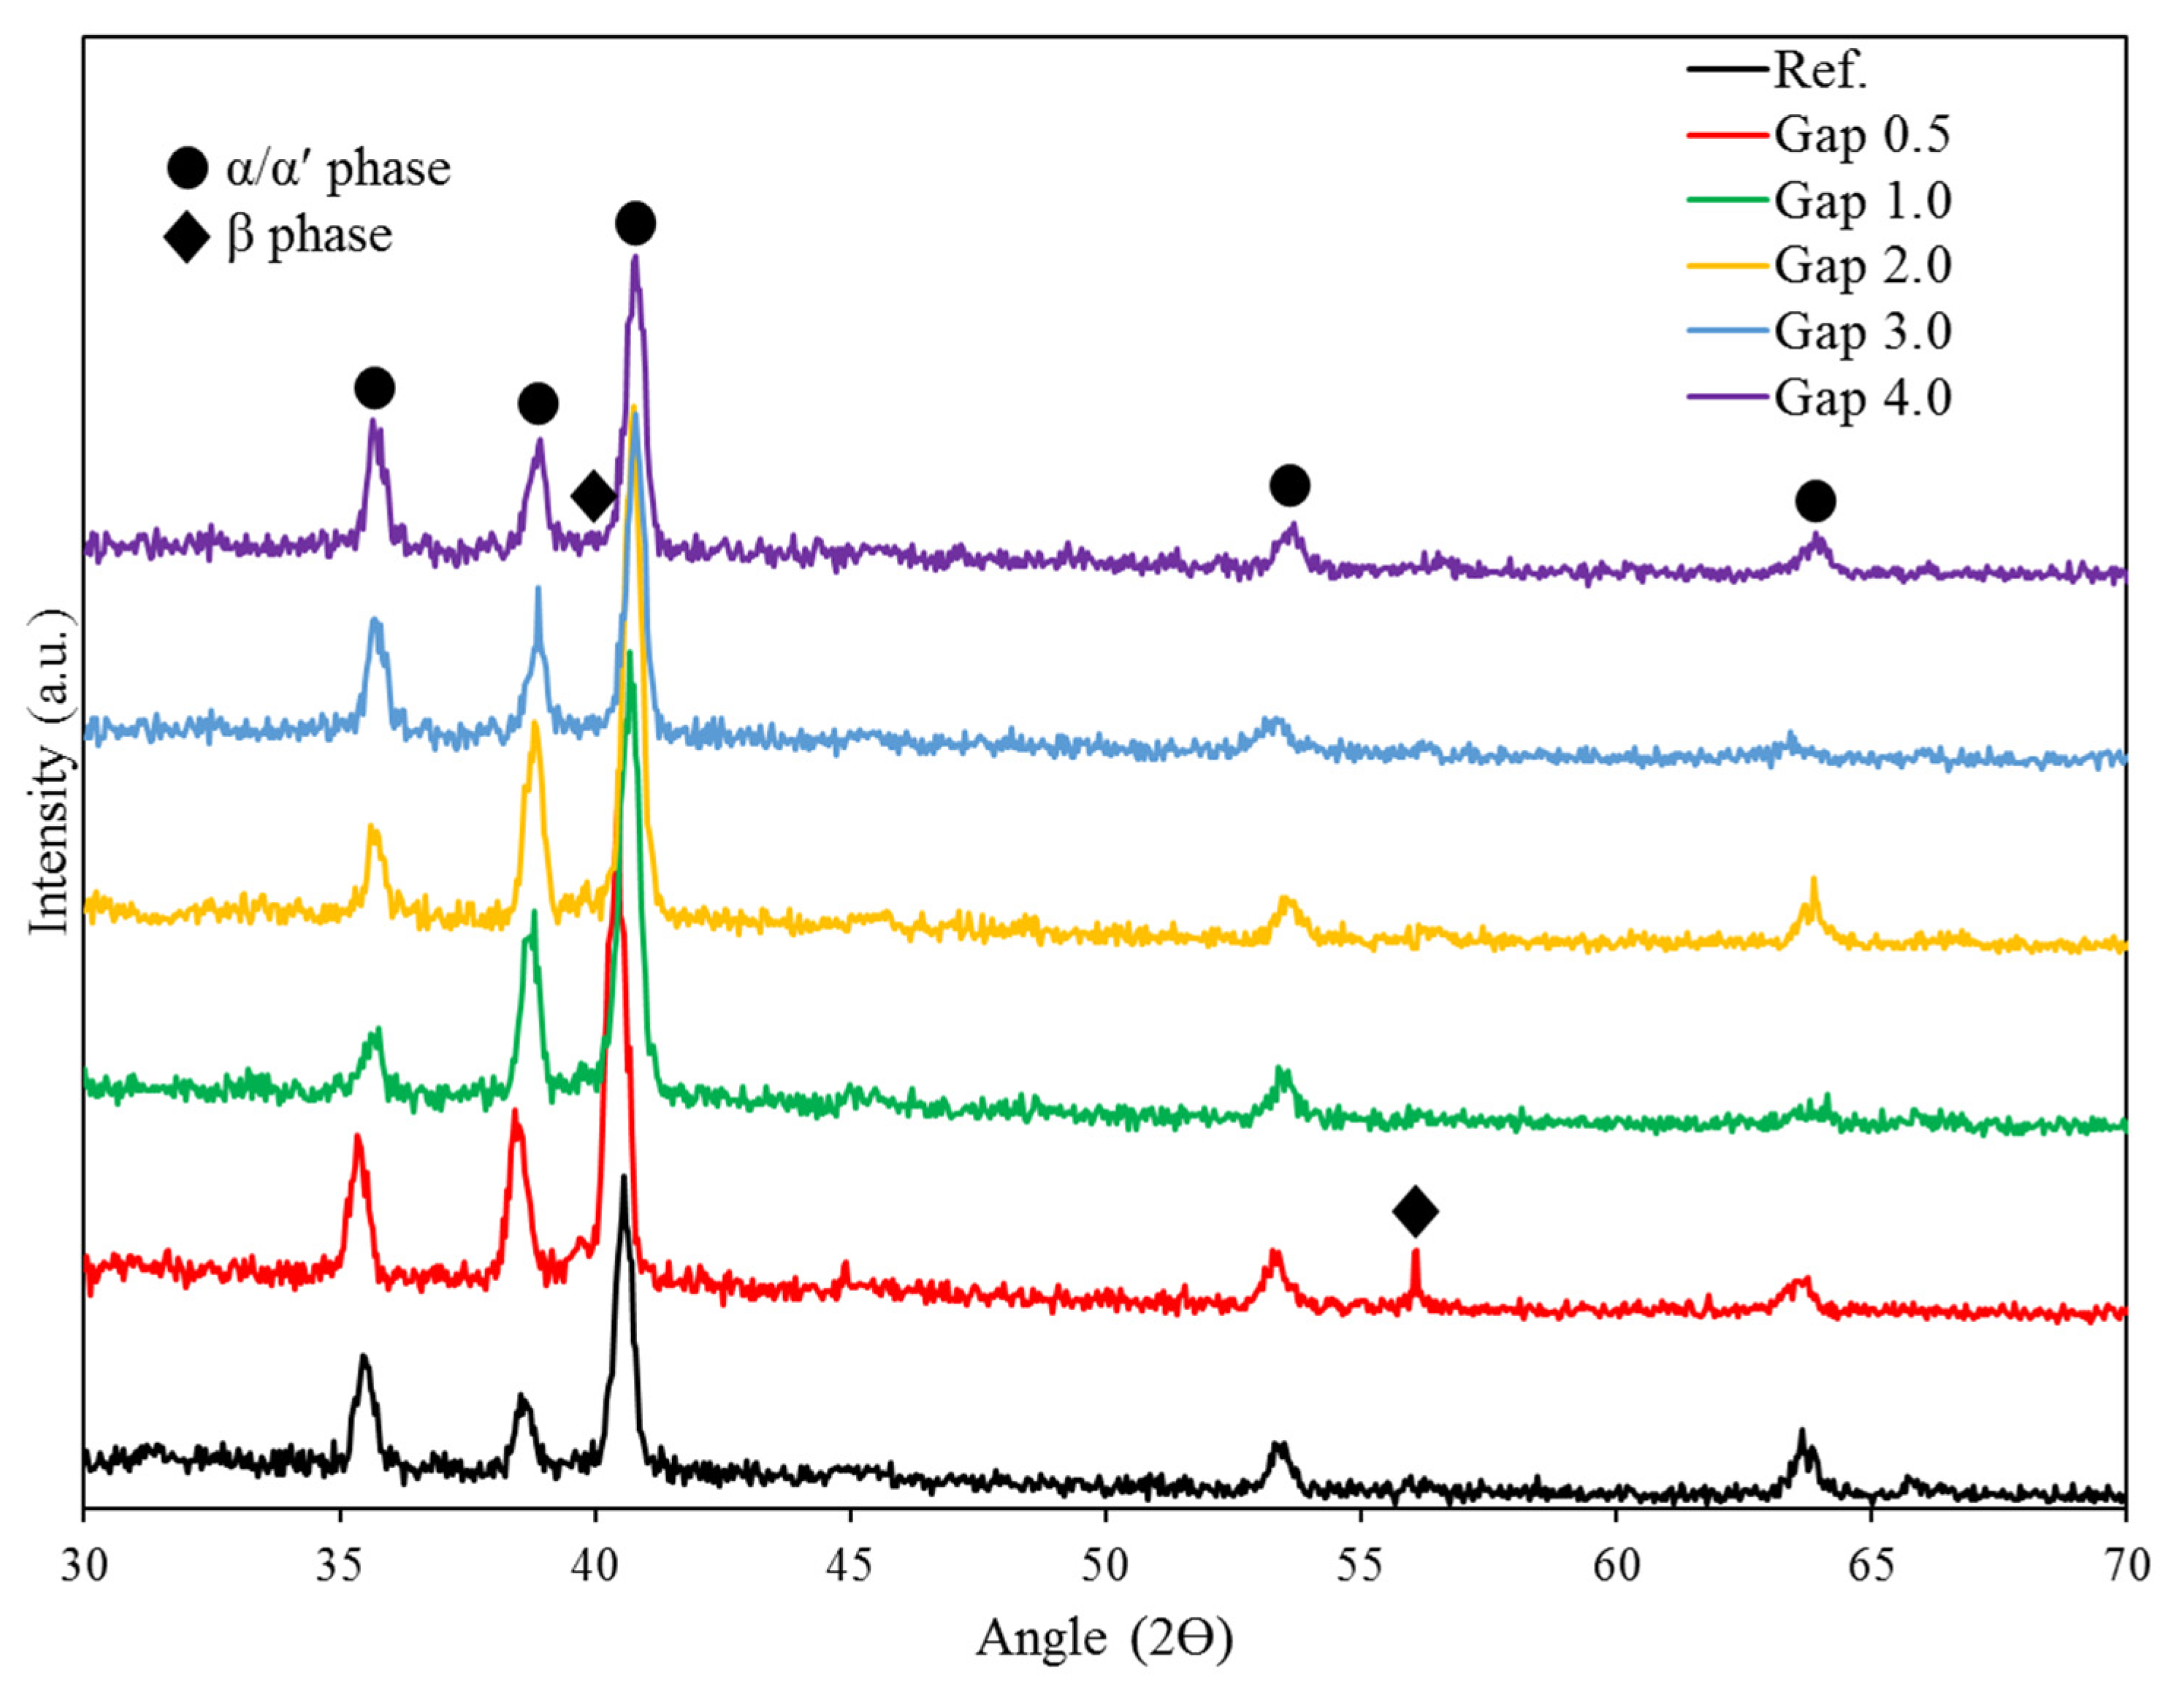
3.2.2. X-ray Diffraction (XRD) Analysis

Figure 9 illustrates the X-ray Diffraction (XRD) patterns of the Reference sample and parts fabricated with border, with the spectrographs displayed for the 2θ angles between 30 and 70°. The XRD patterns obtained from the samples showed similarity to those reported for Ti64 LPBF-processed specimens [61,62,63,64]. The dominant crystallographic phase in all the samples is the hexagonal close-packed (hcp) α/α′ phase, with minor peak(s) attributed to the β-Ti phase. It should be noted that the similar lattice constant and crystal system of α and α′ phases make them difficult to distinguish using XRD data [64,65]. Although the spectrographs for all the samples follow a similar pattern, a few differences exist between some of the samples. Comparing the position of the main α/α′ peak (around 2θ = 40.5°) for all the samples, the largest discrepancy is observed between the Reference and Gap 0.5 sample. Specifically, the peak for the Gap 0.5 sample is shifted toward lower angles compared to the Reference sample, with this difference decreasing as the gap value increases. Concerning the β phase peaks, a weak peak (at 2θ = 39.5°) was detected in the XRD patterns of the Reference, Gap 3.0, and Gap 4.0 samples, reflecting a low content of this phase. In contrast, the XRD pattern of Gap 0.5, Gap 1.0, and Gap 2.0 samples revealed a noticeable peak at 2θ = 39.5°, indicating a higher content of the β phase in these samples. Notably, the highest content of the β phase is expected for the Gap 0.5 sample, as indicated by the additional peak attributed to the β phase (at 2θ = 57.5°) present in its XRD pattern. Table 3 provides the β phase content of all the samples, determined via quantitative analysis of their XRD patterns.
To determine the range of variation in the size of the crystallite size (in this case, acicular α′ or ultrafine lamellar α) and lattice parameters among the samples, the full width at half maximum (FWHM) [45] corresponding to the dominant α/α′ peak (at 2θ = 40.5°) and the average ratio of c/a for the hcp structure were calculated. The Reference and Gap 0.5 samples were selected for analysis to demonstrate the range of variation. As shown in Table 4, the FWHM value for the Gap 0.5 sample was relatively lower, indicating a larger size of α/α′ phase for this sample compared to the Reference sample. However, there was no significant variation in the c/a ratio for any of the samples. This indicates that the deviation found in the XRD for the peak position of the samples was not significant and can be ignored [65,66].

3.3. Vickers Hardness Analysis

The microhardness of the samples was determined by measuring the Vickers Hardness (HV) at the interest region specified in the experimental procedure. Figure 10 shows the average HV value of ten indentations for all the samples. The results indicate a consistent trend in the hardness of the samples. As the gap value decreased from 4 to 0.5 mm, the hardness increased slightly from 389 to 403 HV. However, the Reference sample exhibited the lowest microhardness value of 388 HV, regardless of the variation observed in the hardness values of the specimens fabricated with border. The Vickers hardness values obtained in this study fall within the range reported in previous publications [65,67,68].

3.4. Mechanical Properties

The tensile testing involved the Reference sample, Gap 0.5, Gap 1.0, and Gap 2.0 samples, as shown in Figure 11. It is important to note that the microstructure and composition of Gap 3.0 and Gap 4.0 samples were similar to the Reference sample; hence, they were not tested. Although there was a minor variation in fracture strain values, the ultimate tensile strength (UTS) values differed significantly. Table 5 provides the UTS values and strain at fracture for each sample. The Gap 0.5 sample exhibited an improvement of about 15% and 9% in UTS and fracture strain, respectively, compared to the Reference sample. The other two samples fabricated with borders also showed slight increases in both parameters compared to the Reference sample. As confirmed also by the DIC analysis, the fracture mode was found ductile for all the samples.
The digital image correlation (DIC) technique was used to obtain a more detailed strain analysis of the samples. Specifically, the strain mapping corresponding to the last frame before fracture (100 ms before failure) was extracted for all samples. In Figure 12, the maximum local strain value and the location where the fracture was initiated are displayed. The maximum local strain value showed a similar trend to the fracture strain, meaning that the Gap 0.5 sample had the highest maximum local strain value, followed by the samples produced with border and the Reference sample. However, the range of variation was higher for the maximum local strain value. The Gap 0.5 sample experienced a maximum local strain that was about 30% higher than that of the Reference sample and considerably higher than that of the Gap 1.0 and Gap 2.0 samples. This information provides additional insight into the behavior of the samples during tensile testing and further supports the findings of the ultimate tensile strength and fracture strain results.

4. Discussion

The present study established that incorporating a border surrounding the main sample can effectively enhance the density level of LPBF-fabricated Ti64 samples. This was verified by SEM micrograph analysis, which demonstrated that reducing the gap size between the border and the main sample resulted in higher density and lower average pore size. The observed improvement in density was attributed to the longer maintenance of molten material at high temperatures, which facilitated the complete melting of powders. Interestingly, a longer period of maintaining material at elevated temperatures was achieved by reducing the gap size despite keeping the laser power constant for all samples. This finding aligns with previous studies that reported higher density for LPBF-built Ti64 samples with increased energy input while maintaining the same laser power [64,65,67,69]. Therefore, this study highlights the crucial role of optimizing process parameters, including gap size, in achieving high-quality LPBF-fabricated parts. Superior mechanical properties can be attained by eliminating residual porosity and reducing pore size, making it an important consideration to note [70,71].
The microstructure analysis of the samples revealed a change in the proportion of the α/α′ and β phases, with the largest variation observed between the Reference and Gap 0.5 samples. This change can be attributed to the cooling rate and the temperature at which the samples undergo cyclic heating and cooling processes. In particular, the presence of a border helps maintain a higher temperature for a longer duration during the LPBF process, facilitating the formation of the β phase. Such an effect is especially pronounced in the Gap 0.5 sample, where the border is closest to the sample, resulting in a slower cooling rate and higher temperature retention. This finding is consistent with previous research that has reported the formation of the β phase occurring at temperatures above 750 °C [72]. The formation of the α + β matrix in the microstructure of the Gap 0.5 sample is due to the precipitation of the β phase, which causes vanadium atoms to be expelled from the α′ phase, leading to nucleation of α along the boundaries of the α′ phase [44,68]. This is in contrast to the fully α′ microstructure observed in the Reference sample, which resulted from a higher solidification rate that was further away from equilibrium [65]. A more detailed explanation of the variation in phases among samples is provided in the following paragraphs, where the sample composition is discussed in more detail. Studies have shown that heating and cooling cycles with higher energy density lead to the coarsening of the α/α′ phases, particularly the acicular α′ phase [33,73,74,75]. The thickness of the α/α′ lath is also reported to increase significantly under heat treatment processes [76]. Research studies observed lath coarsening for Ti64 samples when the temperature was higher during heat treatment and closer to the β transus temperature [50,77,78,79]. These observations are in line with the coarsening of the α/α′ phases for the samples fabricated with a border. As the gap value between the sample and border reduces, the heat dissipation is minimized, which keeps the sample at a higher temperature during fabrication. This condition resembles what a sample undergoes during a heat treatment process and therefore supports the coarsening of the α/α′ lath for the samples surrounded by borders. It is a well-known fact that coarsening the α/α′ lath in Ti64 results in a higher level of ductility and improvement in fracture strain [64,80,81].
A comparison of the composition of the α/α′ phase spots in all samples revealed that the average weight percentage of vanadium decreased for the samples fabricated with a border. This finding indicates that the decrease in gap value led to a decrease in the proportion of the α′ phase, which contains a higher percentage of vanadium, and an increase in the proportion of the α phase, which contains a lower percentage of vanadium. This change in phase composition could be due to two stages of decomposition: the transformation of the β phase into α or α′ during the cooling stage [65,82] and the decomposition of the α′ phase into α + β due to the consecutive fabrication of layers [44,83,84]. These findings are discussed in more detail in the following paragraph. A study by Gong et al. [60] compared the microstructure of Ti64 samples processed by LPBF and electron beam melting (EBM) and found that keeping the temperature in the EBM process at a higher level (650–700 °C) facilitates the transformation of β to α phase, while the higher cooling rate experienced in the LPBF process results in the transformation to α′ phase. This is consistent with the results observed in the present study, where lower vanadium content (associated with α′ phase) was detected for samples fabricated with a border compared to the Reference sample. This suggests that by inducing a border surrounding the sample, the temperature is maintained at a higher level for a longer time, and the cooling rate is reduced, which resembles a heat treatment process to some extent, particularly for samples with lower gap sizes (Gap 0.5 and Gap 1.0 samples). Simonelli et al. [85] observed a variation in the composition of the Ti64 LPBF fabricated samples between areas with different building heights, where they used a long laser–powder interaction time and found higher fabricated layers to be rich in vanadium compared to the initially printed layers. This was attributed to the lower cooling rate applied to the initial layers, achieved by controlling the laser–material interaction time and maintaining the platform’s temperature. This cooling approach exhibits resemblances to the post-annealing heat treatment process, as it facilitates the decomposition of the initial martensitic phase observed predominantly during annealing, particularly for the initial layers. In another study on Ti64 [86], applying post-treatment (hot isostatic pressing) to samples resulted in a reduction in vanadium, as observed for the samples fabricated with a border in the present study. Although the range of variation seen in the current study is not as high as applying heat treatment processes, the trend confirms that an appropriate border design can control and achieve the desired level of variation. It should be noted that the formation of the α phase with a lower level of vanadium results in lower residual stress and higher ductility [64,85].
Upon comparing the XRD patterns of the samples, it was noticed that only Gap 0.5 possessed an additional peak corresponding to the β phase, indicating a higher content of the β phase compared to the other samples (Table 3). This suggests that repeated cooling and heating stages during layer-by-layer fabrication may have led to a decomposition of the α′ phase into α and β phases. This decomposition may have occurred via the transformation of α′ into (α + β) structure or directly into the β phase by heating above the β transus temperature (995 °C) and changing the hcp crystal into bcc [66]. However, based on the calculated unit cell parameters, there was no significant change in the c/a ratio for the samples, indicating that the transformation of α′ into β phase was not the main mechanism of decomposition. Rather, the decomposition of α′ into the (α + β) structure accounted for the main transformation. In a study by Xu et al. [44], the decomposition of the α′ phase during the LPBF process was investigated, and the effects of layer thickness, focal offset distance, and energy density on the transformation of this phase were reported. They found that increasing the energy density improved the in situ decomposition of α′ phase into ultrafine lamellar (α + β) structure. This is consistent with the findings of this study, where the Gap 0.5 sample, with the highest content of β phase and an α + β structure, was produced using a border to preserve the heat input at a higher level for a longer time. As the gap value increased, heat dissipation occurred at a higher level, resembling a lower energy density, resulting in a Full α′ structure found for the Gap 4.0 sample, similar to the Reference sample. A similar relationship between the energy density and FWHM value was reported for LPBF-fabricated Ti64 samples. Cepeda-Jiménez et al. [65] showed that the FWHM value reduced with an increase in energy density, attributed to the gradual transformation of the α′ phase into α and β phases under the effect of higher energy input. During the decomposition of the α′ phase, vanadium diffused into the matrix, resulting in the formation of α phase with a coarsened crystal structure, which was seen in the EDS results showing lower vanadium content for the Gap 0.5 sample. The reduction in FWHM value indicated the formation of a coarsened structure (α + β) induced by the border and preserved heat input at a higher level. Furthermore, the decomposition of α′ phase into α and β phases, as observed for the Gap 0.5 sample, led to a decrease in the level of lattice distortion and internal stresses [87,88], as evidenced by the shift in the position of the dominant peak toward lower values, indicating a reduction in strain and improvement in crystallinity [66]. This may have contributed to the outstanding mechanical properties, and higher ductility of the Ti64 LPBF-processed parts [44], as observed in the mechanical properties of the Gap 0.5 sample in this study.
The comparison of microhardness values for the samples revealed that those fabricated with borders had higher hardness, with the Gap 0.5 sample displaying the highest value. This finding aligns with previous studies on LPBF-fabricated Ti64 samples, where an increase in energy density led to a higher level of density and, in turn, a higher microhardness value [67]. Other studies have also shown that LPBF process parameter variations have a similar impact on both microhardness and density [35]. Therefore, it was expected that the samples with borders, which had a higher density level, would have a higher hardness value. However, it is important to consider the effect of α/α′ lath thickness on microhardness, as an increase in thickness typically results in a reduction in hardness [64]. In addition, in situ martensitic decomposition can also influence the hardness value. For example, studies have shown that heat-treated Ti64 samples with finer α grains, resulting from the in situ transformation of α′ to α phase, have improved hardness compared to fully martensitic as-built samples [76]. Additionally, a microstructure containing both α and α′ phases instead of a fully α′ phase has been found to increase the microhardness of Ti64 [68]. Taking these findings into account, the higher level of density and martensitic decomposition found in the samples fabricated with borders (specifically, the Gap 0.5 sample) exceeded the effect of lath thickening and resulted in an increase in the microhardness value.
The stress–strain curves of the samples indicate that the parts fabricated with border exhibit higher tensile strength and elongation compared to the Reference sample. The use of borders also results in more ductile behavior, as confirmed by DIC analysis, which showed a considerably higher local fracture strain for the Gap 0.5 sample. It is known that the mechanical properties of Ti64 depend on the thickness of its constituent phases, the level of defects, and the size of the α/α′ phases [50,68,89,90]. It is well-established that increasing the thickness of the α/α′ lath in Ti64 results in lower strength but higher ductility [44,64,76,91]. However, the effect on strength and ductility is not equal. In fact, Galarraga et al. [92] found that coarsening the α/α′ phases has a greater impact on improving ductility than reducing the ultimate tensile strength (UTS). Therefore, it can be inferred that the higher average thickness of α/α′ acicular/lamellar phases in the samples fabricated with border led to an improvement in ductility while having only a minor effect on UTS. In addition, to enhance the ductility of Ti64, it is crucial to reduce the occurrence and size of defects in the samples, especially the micro-pores that form at the interlayers, as they can ultimately result in microscopic cracks and catastrophic failure. These pores have a detrimental impact on the ductility of Ti64 and can lead to the formation of microscopic cracks, which ultimately result in failure [43,93,94]. This finding is supported by Yan et al. [79], who also attributed the enhancement of ductility in Ti64 LPBF-processed samples to the removal of internal defects. While previous studies have shown that the improvement in ductility of Ti64 resulted in a reduction in ultimate tensile strength (UTS) [41,50,64,68,90], in the current study, the use of borders surrounding the main sample resulted in improvements in both ductility and UTS. Of the factors affecting the mechanical properties of Ti64, variations in microstructure and crystal system resulting from phase changes have the most significant impact [90]. Improved ductility of Ti64 without sacrificing its strength can be achieved by controlling a microstructure that includes lamellar (α + β) [77,95]. In a previous study, an ultrafine lamellar (α + β) microstructure was achieved via in situ martensite decomposition, resulting in significantly better UTS and ductility compared to as-built LPBF fabricated samples [44]. In the current study, the use of borders surrounding the main sample led to the formation of thicker α/α′ acicular/lamellar phases and a lamellar (α + β) microstructure. While the former negatively impacted UTS, the latter increased strength. Despite some variation in lath thickness, the lamellar (α + β) microstructure ultimately outweighed the effect of lath size and resulted in superior mechanical properties for the samples fabricated with borders. Gap 0.5 had the highest elongation and strength among these samples. Additionally, a previous study by Zhou et al. [96] found that increasing energy density improves Ti64 strength, which aligns with the current study’s observation that the sample with the lowest gap value (experiencing higher temperature for a longer time) had the maximum UTS. The finer and higher proportion of (α + β) microstructure in this sample’s microstructure confirmed its superior mechanical properties (Figure 7b). In situ martensite decomposition can be achieved at 400 °C, but this phase transformation can be further facilitated by maintaining the sample at higher temperatures for a longer period [44], as observed in the current study. It is important to note that DIC results showed crack imitation, leading to fracture for all parts, started near the edges of the samples, but no specific trend was observed for the location of crack imitation among the samples.

5. Conclusions

In conclusion, the findings from this study highlight the significant impact of implementing cubic borders and adjusting the gap space in LPBF-processed Ti64 on the properties of the fabricated samples. The use of a border surrounding the main part was found to positively affect the density achieved during LPBF processing, resulting in higher density levels and smaller pore sizes as the gap space was reduced. Furthermore, the presence of a border surrounding the part was found to significantly influence the morphology and proportion of phases in the LPBF-processed Ti64 samples. In particular, while the Reference sample predominantly exhibited an acicular α′ phase, the Gap 0.5 sample displayed a mix of α and β phases in a basket-weave matrix, along with lamellar α in addition to the acicular α′ phase. The microstructure of other samples varied depending on the gap space, with the thickness of the α/α′ lath increasing as the gap value decreased. Additionally, a comparison of the spots associated with the α/α′ phases revealed that the samples fabricated with a border had a lower average weight percentage of vanadium, while the Reference sample had the highest level. Although the range of variation was limited, the observed trend suggested that adjusting the gap may potentially extend the variation range. XRD analysis confirmed that the Gap 0.5 sample had the highest amount of β phase, which was notably different from the fully martensitic microstructure observed in the Reference sample. The microstructure of the Gap 3.0 and 4.0 samples was similar to that of the Reference sample, while the Gap 1.0 and Gap 2.0 samples displayed a mix of martensitic and lamellar (α + β) microstructure, consistent with the observed amount of β phase. The microhardness measurements showed a slightly increasing trend as the gap value was reduced, with the Reference sample exhibiting the lowest value. It was observed that, for microhardness, the level of density and martensitic decomposition may play a more significant role than α/α′ lath thickening. Finally, the stress–strain curves of the samples revealed that the samples fabricated with a border exhibited higher tensile strength and ductility compared to the Reference sample. The more ductile behavior achieved via the implementation of borders was further confirmed by DIC (Digital Image Correlation) analysis, which showed a significantly higher local fracture strain for the Gap 0.5 sample.

Author Contributions

Conceptualization, B.F.; Methodology, B.F. and A.A.T.; Software, A.A.T., A.G.-R. and S.H.D.; Validation, B.F. and A.G.-R.; Formal analysis, B.F. and A.G.-R.; Investigation, A.A.T.; Data curation, A.A.T. and A.G.-R.; Writing—original draft, B.F. and A.A.T.; Writing—review & editing, S.H.D.; Visualization, A.G.-R. and S.H.D.; Supervision, N.S.M.; Project administration, N.S.M.; Funding acquisition, N.S.M. All authors have read and agreed to the published version of the manuscript.

Funding

This research received no external funding.

Data Availability Statement

Data are contained within the article.

Conflicts of Interest

The authors declare no conflict of interest.

References

  1. Yadav, P.; Saxena, K.K. Effect of heat-treatment on microstructure and mechanical properties of Ti alloys: An overview. Mater. Today Proc. 2020, 26, 2546–2557. [Google Scholar] [CrossRef]
  2. Romero, C.; Yang, F.; Bolzoni, L. Fatigue and fracture properties of Ti alloys from powder-based processes—A review. Int. J. Fatigue 2018, 117, 407–419. [Google Scholar] [CrossRef]
  3. Boyer, R.R. An overview on the use of titanium in the aerospace industry. Mater. Sci. Eng. A 1996, 213, 103–114. [Google Scholar] [CrossRef]
  4. Lütjering, G.; Williams, J.C. Titanium; Springer: Berlin/Heidelberg, Germany, 2013. [Google Scholar]
  5. Liu, Z.; He, B.; Lyu, T.; Zou, Y. A Review on Additive Manufacturing of Titanium Alloys for Aerospace Applications: Directed Energy Deposition and beyond Ti-6Al-4V. JOM 2021, 73, 1804–1818. [Google Scholar] [CrossRef]
  6. Nyakana, S.L.; Fanning, J.C.; Boyer, R.R. Quick reference guide for β titanium alloys in the 00s. J. Mater. Eng. Perform. 2005, 14, 799–811. [Google Scholar] [CrossRef]
  7. Fanning, J.C.; Fox, S.P. Recent developments in metastable β strip alloys. J. Mater. Eng. Perform. 2005, 14, 703–708. [Google Scholar] [CrossRef]
  8. Rack, H.J.; Qazi, J.I. Titanium alloys for biomedical applications. Mater. Sci. Eng. C 2006, 26, 1269–1277. [Google Scholar] [CrossRef]
  9. Liu, X.; Chu, P.K.; Ding, C. Surface modification of titanium, titanium alloys, and related materials for biomedical applications. Mater. Sci. Eng. R Rep. 2004, 47, 49–121. [Google Scholar] [CrossRef]
  10. González, J.E.G.; Mirza-Rosca, J.C. Study of the corrosion behavior of titanium and some of its alloys for biomedical and dental implant applications. J. Electroanal. Chem. 1999, 471, 109–115. [Google Scholar] [CrossRef]
  11. Arab, A.; Chen, P.; Guo, Y. Effects of microstructure on the dynamic properties of TA15 titanium alloy. Mech. Mater. 2019, 137, 103121. [Google Scholar] [CrossRef]
  12. Welsch, G.; Boyer, R.; Collings, E.W. Materials Properties Handbook: Titanium Alloys; ASM International: Almere, The Netherlands, 1993. [Google Scholar]
  13. Natali, A.N. Dental Biomechanics; CRC Press: Boca Raton, FL, USA, 2003. [Google Scholar]
  14. Oberwinkler, B.; Riedler, M.; Eichlseder, W. Importance of local microstructure for damage tolerant light weight design of Ti–6Al–4V forgings. Int. J. Fatigue 2010, 32, 808–814. [Google Scholar] [CrossRef]
  15. Wu, G.Q.; Shi, C.L.; Sha, W.; Sha, A.X.; Jiang, H.R. Effect of microstructure on the fatigue properties of Ti–6Al–4V titanium alloys. Mater. Des. 2013, 46, 668–674. [Google Scholar] [CrossRef]
  16. Zhou, Y.; Zeng, W.; Yu, H. An investigation of a new near-beta forging process for titanium alloys and its application in aviation components. Mater. Sci. Eng. A 2005, 393, 204–212. [Google Scholar] [CrossRef]
  17. Leyens, C.; Peters, M. Titanium and Titanium Alloys: Fundamentals and Applications; John Wiley & Sons: Hoboken, NJ, USA, 2003. [Google Scholar]
  18. Stráský, J.; Janeček, M.; Harcuba, P.; Bukovina, M.; Wagner, L. The effect of microstructure on fatigue performance of Ti–6Al–4V alloy after EDM surface treatment for application in orthopaedics. J. Mech. Behav. Biomed. Mater. 2011, 4, 1955–1962. [Google Scholar] [CrossRef]
  19. Reda, R.; Nofal, A.; Hussein, A.-H. Effect of Quenching Temperature on the Mechanical Properties of Cast Ti-6Al-4V Alloy. J. Metall. Eng. (ME) 2013, 2, 48–54. [Google Scholar]
  20. Froes, F.H.S.; Gungor, M.N.; Ashraf Imam, M. Cost-affordable titanium: The component fabrication perspective. JOM 2007, 59, 28–31. [Google Scholar] [CrossRef]
  21. Park, N.-K.; Yeom, J.-T.; Na, Y.-S. Characterization of deformation stability in hot forging of conventional Ti–6Al–4V using processing maps. J. Mater. Process. Technol. 2002, 130–131, 540–545. [Google Scholar] [CrossRef]
  22. Murr, L.E.; Quinones, S.A.; Gaytan, S.M.; Lopez, M.I.; Rodela, A.; Martinez, E.Y.; Hernandez, D.H.; Martinez, E.; Medina, F.; Wicker, R.B. Microstructure and mechanical behavior of Ti–6Al–4V produced by rapid-layer manufacturing, for biomedical applications. J. Mech. Behav. Biomed. Mater. 2009, 2, 20–32. [Google Scholar] [CrossRef]
  23. Trevisan, F.; Calignano, F.; Aversa, A.; Marchese, G.; Lombardi, M.; Biamino, S.; Ugues, D.; Manfredi, D. Additive manufacturing of titanium alloys in the biomedical field: Processes, properties and applications. J. Appl. Biomater. Funct. Mater. 2018, 16, 57–67. [Google Scholar] [CrossRef]
  24. Dutta, B.; Froes, F.H. The Additive Manufacturing (AM) of titanium alloys. Met. Powder Rep. 2017, 72, 96–106. [Google Scholar] [CrossRef]
  25. Safaei, K.; Andani, N.T.; Nematollahi, M.; Benafan, O.; Poorganji, B.; Elahinia, M. The Build Orientation Dependency of NiTi Shape Memory Alloy Processed by Laser Powder Bed Fusion. Shape Mem. Superelast. 2022, 8, 265–276. [Google Scholar] [CrossRef]
  26. Safaei, K.; Nematollahi, M.; Bayati, P.; Kordizadeh, F.; Abedi, H.; Andani, N.T.; Poorganji, B.; Elahinia, M.; Andani, M.T.; Benafan, O. Controlling crystallographic texture and thermomechanical properties of NiTi shape memory alloy through laser powder bed fusion. In Proceedings of the International Conference on Shape Memory and Superelastic Technologies (SMST 2022), Carlsbad, CA, USA, 16–20 May 2022; ASM International: Almere, The Netherlands, 2022. [Google Scholar]
  27. Ganesh-Ram, A.; Hanumantha, M.; Ravichander, B.; Farhang, B.; Ramachandra, S.; Shayesteh Moghaddam, N.; Amerinatanzi, A. Study of Spatter Formation and Effect of Anti-Spatter Liquid in Laser Powder Bed Fusion Processed Ti-6Al-4V Samples. In Proceedings of the 2021 International Solid Freeform Fabrication Symposium, Online, 2–4 August 2021; University of Texas: Austin, TX, USA, 2021. [Google Scholar]
  28. Ramachandra, S.; Ravichander, B.; Farhang, B.; Ganesh-Ram, A.; Hanumantha, M.; Marquez, J.; Humphrey, G.; Swails, N.; Amerinatanzi, A. Impact of Porosity Type on Microstructure and Mechanical Properties in Selectively Laser Melted IN718 Lattice Structures. In Proceedings of the 2021 International Solid Freeform Fabrication Symposium, Online, 2–4 August 2021; University of Texas: Austin, TX, USA, 2021. [Google Scholar]
  29. Ravichander, B.; Farhang, B.; Ganesh-Ram, A.; Hanumantha, M.; Ramachandra, S.; Shinglot, Y.; Amerinatanzi, A.; Shayesteh Moghaddam, N. Investigation of the Properties of Reinforced IN718 Structures Fabricated using Laser Powder Bed Fusion. In Proceedings of the 2021 International Solid Freeform Fabrication Symposium, Online, 2–4 August 2021; University of Texas: Austin, TX, USA, 2021. [Google Scholar]
  30. Sow, M.C.; De Terris, T.; Castelnau, O.; Hamouche, Z.; Coste, F.; Fabbro, R.; Peyre, P. Influence of beam diameter on Laser Powder Bed Fusion (L-PBF) process. Addit. Manuf. 2020, 36, 101532. [Google Scholar] [CrossRef]
  31. King, W.E.; Barth, H.D.; Castillo, V.M.; Gallegos, G.F.; Gibbs, J.W.; Hahn, D.E.; Kamath, C.; Rubenchik, A.M. Observation of keyhole-mode laser melting in laser powder-bed fusion additive manufacturing. J. Mater. Process. Technol. 2014, 214, 2915–2925. [Google Scholar] [CrossRef]
  32. Oliveira, J.P.; LaLonde, A.D.; Ma, J. Processing parameters in laser powder bed fusion metal additive manufacturing. Mater. Des. 2020, 193, 108762. [Google Scholar] [CrossRef]
  33. Thijs, L.; Verhaeghe, F.; Craeghs, T.; Humbeeck, J.V.; Kruth, J.-P. A study of the microstructural evolution during selective laser melting of Ti–6Al–4V. Acta Mater. 2010, 58, 3303–3312. [Google Scholar] [CrossRef]
  34. Baufeld, B.; van der Biest, O. Mechanical properties of Ti-6Al-4V specimens produced by shaped metal deposition. Sci. Technol. Adv. Mater. 2009, 10, 015008. [Google Scholar] [CrossRef]
  35. Khorasani, A.; Gibson, I.; Awan, U.S.; Ghaderi, A. The effect of SLM process parameters on density, hardness, tensile strength and surface quality of Ti-6Al-4V. Addit. Manuf. 2019, 25, 176–186. [Google Scholar] [CrossRef]
  36. Maleki, E.; Bagherifard, S.; Guagliano, M. Application of artificial intelligence to optimize the process parameters effects on tensile properties of Ti-6Al-4V fabricated by laser powder-bed fusion. Int. J. Mech. Mater. Des. 2022, 18, 199–222. [Google Scholar] [CrossRef]
  37. du Plessis, A. Effects of process parameters on porosity in laser powder bed fusion revealed by X-ray tomography. Addit. Manuf. 2019, 30, 100871. [Google Scholar] [CrossRef]
  38. Chen, L.Y.; Huang, J.C.; Lin, C.H.; Pan, C.T.; Chen, S.Y.; Yang, T.L.; Lin, D.Y.; Lin, H.K.; Jang, J.S.C. Anisotropic response of Ti-6Al-4V alloy fabricated by 3D printing selective laser melting. Mater. Sci. Eng. A 2017, 682, 389–395. [Google Scholar] [CrossRef]
  39. Qiu, C.; Adkins, N.J.E.; Attallah, M.M. Microstructure and tensile properties of selectively laser-melted and of HIPed laser-melted Ti–6Al–4V. Mater. Sci. Eng. A 2013, 578, 230–239. [Google Scholar] [CrossRef]
  40. Shi, X.; Ma, S.; Liu, C.; Wu, Q.; Lu, J.; Liu, Y.; Shi, W. Selective laser melting-wire arc additive manufacturing hybrid fabrication of Ti-6Al-4V alloy: Microstructure and mechanical properties. Mater. Sci. Eng. A 2017, 684, 196–204. [Google Scholar] [CrossRef]
  41. Simonelli, M.; Tse, Y.Y.; Tuck, C. Effect of the build orientation on the mechanical properties and fracture modes of SLM Ti–6Al–4V. Mater. Sci. Eng. A 2014, 616, 1–11. [Google Scholar] [CrossRef]
  42. Xu, W.; Lui, E.W.; Pateras, A.; Qian, M.; Brandt, M. In situ tailoring microstructure in additively manufactured Ti-6Al-4V for superior mechanical performance. Acta Mater. 2017, 125, 390–400. [Google Scholar] [CrossRef]
  43. Liu, J.; Sun, Q.; Zhou, C.a.; Wang, X.; Li, H.; Guo, K.; Sun, J. Achieving Ti6Al4V alloys with both high strength and ductility via selective laser melting. Mater. Sci. Eng. A 2019, 766, 138319. [Google Scholar] [CrossRef]
  44. Xu, W.; Brandt, M.; Sun, S.; Elambasseril, J.; Liu, Q.; Latham, K.; Xia, K.; Qian, M. Additive manufacturing of strong and ductile Ti–6Al–4V by selective laser melting via in situ martensite decomposition. Acta Mater. 2015, 85, 74–84. [Google Scholar] [CrossRef]
  45. Tsai, M.-T.; Chen, Y.-W.; Chao, C.-Y.; Jang, J.S.C.; Tsai, C.-C.; Su, Y.-L.; Kuo, C.-N. Heat-treatment effects on mechanical properties and microstructure evolution of Ti-6Al-4V alloy fabricated by laser powder bed fusion. J. Alloys Compd. 2020, 816, 152615. [Google Scholar] [CrossRef]
  46. Pathania, A.; Subramaniyan, A.K.; Nagesha, B.K. Influence of post-heat treatments on microstructural and mechanical properties of LPBF-processed Ti6Al4V alloy. Prog. Addit. Manuf. 2022, 7, 1323–1343. [Google Scholar] [CrossRef]
  47. Yadroitsev, I.; Krakhmalev, P.; Yadroitsava, I.; Du Plessis, A. Qualification of Ti6Al4V ELI Alloy Produced by Laser Powder Bed Fusion for Biomedical Applications. JOM 2018, 70, 372–377. [Google Scholar] [CrossRef]
  48. Wu, M.-W.; Chen, J.-K.; Tsai, M.-K.; Wang, S.-H.; Lai, P.-H. Intensification of preferred orientation in the additive manufactured Ti-6Al-4V alloy after heat treatment. Mater. Lett. 2021, 286, 129198. [Google Scholar] [CrossRef]
  49. Mahmud, A.; Huynh, T.; Zhou, L.; Hyer, H.; Mehta, A.; Imholte, D.D.; Woolstenhulme, N.E.; Wachs, D.M.; Sohn, Y. Mechanical behavior assessment of Ti-6Al-4V ELI alloy produced by laser powder bed fusion. Metals 2021, 11, 1671. [Google Scholar] [CrossRef]
  50. Vrancken, B.; Thijs, L.; Kruth, J.-P.; Van Humbeeck, J. Heat treatment of Ti6Al4V produced by Selective Laser Melting: Microstructure and mechanical properties. J. Alloys Compd. 2012, 541, 177–185. [Google Scholar] [CrossRef]
  51. Farhang, B.; Ravichander, B.B.; Venturi, F.; Amerinatanzi, A.; Shayesteh Moghaddam, N. Study on variations of microstructure and metallurgical properties in various heat-affected zones of SLM fabricated Nickel–Titanium alloy. Mater. Sci. Eng. A 2020, 774, 138919. [Google Scholar] [CrossRef]
  52. Farhang, B.; Ravichander, B.B.; Ma, J.; Amerinatanzi, A.; Shayesteh Moghaddam, N. The evolution of microstructure and composition homogeneity induced by borders in laser powder bed fused Inconel 718 parts. J. Alloys Compd. 2022, 898, 162787. [Google Scholar] [CrossRef]
  53. Schindelin, J.; Arganda-Carreras, I.; Frise, E.; Kaynig, V.; Longair, M.; Pietzsch, T.; Preibisch, S.; Rueden, C.; Saalfeld, S.; Schmid, B.; et al. Fiji: An open-source platform for biological-image analysis. Nat. Methods 2012, 9, 676–682. [Google Scholar] [CrossRef]
  54. Brika, S.E.; Letenneur, M.; Dion, C.A.; Brailovski, V. Influence of particle morphology and size distribution on the powder flowability and laser powder bed fusion manufacturability of Ti-6Al-4V alloy. Addit. Manuf. 2020, 31, 100929. [Google Scholar] [CrossRef]
  55. Riener, K.; Albrecht, N.; Ziegelmeier, S.; Ramakrishnan, R.; Haferkamp, L.; Spierings, A.B.; Leichtfried, G.J. Influence of particle size distribution and morphology on the properties of the powder feedstock as well as of AlSi10Mg parts produced by laser powder bed fusion (LPBF). Addit. Manuf. 2020, 34, 101286. [Google Scholar] [CrossRef]
  56. Haferkamp, L.; Haudenschild, L.; Spierings, A.; Wegener, K.; Riener, K.; Ziegelmeier, S.; Leichtfried, G.J. The influence of particle shape, powder flowability, and powder layer density on part density in laser powder bed fusion. Metals 2021, 11, 418. [Google Scholar] [CrossRef]
  57. Sehhat, M.H.; Sutton, A.T.; Hung, C.-H.; Newkirk, J.W.; Leu, M.C. Investigation of Mechanical Properties of Parts Fabricated with Gas- and Water-Atomized 304L Stainless Steel Powder in the Laser Powder Bed Fusion Process. JOM 2022, 74, 1088–1095. [Google Scholar] [CrossRef]
  58. Hamza, H.M.; Deen, K.M.; Haider, W. Microstructural examination and corrosion behavior of selective laser melted and conventionally manufactured Ti6Al4V for dental applications. Mater. Sci. Eng. C 2020, 113, 110980. [Google Scholar] [CrossRef] [PubMed]
  59. ASTM E92-17; Standard Test Methods for Vickers Hardness and Knoop Hardness of Metallic Materials. ASTM International: West Conshohocken, PA, USA, 2017.
  60. Gong, H.; Rafi, K.; Starr, T.; Stucker, B. The effects of processing parameters on defect regularity in Ti-6Al-4V parts fabricated by selective laser melting and electron beam melting. In Proceedings of the 2013 International Solid Freeform Fabrication Symposium, Austin, TX, USA, 12–14 August 2013; University of Texas: Austin, TX, USA, 2013. [Google Scholar]
  61. Huang, J.-Y.; Chang, C.-H.; Wang, W.-C.; Chou, M.-J.; Tseng, C.-C.; Tu, P.-W. Systematic evaluation of selective fusion additive manufacturing based on thermal energy source applied in processing of titanium alloy specimens for medical applications. Int. J. Adv. Manuf. Technol. 2020, 109, 2421–2429. [Google Scholar] [CrossRef]
  62. Lan, L.; Xin, R.; Jin, X.; Gao, S.; He, B.; Rong, Y.; Min, N. Effects of laser shock peening on microstructure and properties of Ti–6Al–4V titanium alloy fabricated via selective laser melting. Materials 2020, 13, 3261. [Google Scholar] [CrossRef] [PubMed]
  63. Cui, Y.-W.; Chen, L.-Y.; Qin, P.; Li, R.; Zang, Q.; Peng, J.; Zhang, L.; Lu, S.; Wang, L.; Zhang, L.-C. Metastable pitting corrosion behavior of laser powder bed fusion produced Ti-6Al-4V in Hank’s solution. Corros. Sci. 2022, 203, 110333. [Google Scholar] [CrossRef]
  64. Zhao, X.; Li, S.; Zhang, M.; Liu, Y.; Sercombe, T.B.; Wang, S.; Hao, Y.; Yang, R.; Murr, L.E. Comparison of the microstructures and mechanical properties of Ti–6Al–4V fabricated by selective laser melting and electron beam melting. Mater. Des. 2016, 95, 21–31. [Google Scholar] [CrossRef]
  65. Cepeda-Jiménez, C.M.; Potenza, F.; Magalini, E.; Luchin, V.; Molinari, A.; Pérez-Prado, M.T. Effect of energy density on the microstructure and texture evolution of Ti-6Al-4V manufactured by laser powder bed fusion. Mater. Charact. 2020, 163, 110238. [Google Scholar] [CrossRef]
  66. Kaschel, F.R.; Vijayaraghavan, R.K.; Shmeliov, A.; McCarthy, E.K.; Canavan, M.; McNally, P.J.; Dowling, D.P.; Nicolosi, V.; Celikin, M. Mechanism of stress relaxation and phase transformation in additively manufactured Ti-6Al-4V via in situ high temperature XRD and TEM analyses. Acta Mater. 2020, 188, 720–732. [Google Scholar] [CrossRef]
  67. Bartolomeu, F.; Faria, S.; Carvalho, O.; Pinto, E.; Alves, N.; Silva, F.S.; Miranda, G. Predictive models for physical and mechanical properties of Ti6Al4V produced by Selective Laser Melting. Mater. Sci. Eng. A 2016, 663, 181–192. [Google Scholar] [CrossRef]
  68. Jaber, H.; Kónya, J.; Kulcsár, K.; Kovács, T. Effects of Annealing and Solution Treatments on the Microstructure and Mechanical Properties of Ti6Al4V Manufactured by Selective Laser Melting. Materials 2022, 15, 1978. [Google Scholar] [CrossRef]
  69. Pal, S.; Lojen, G.; Kokol, V.; Drstvensek, I. Evolution of metallurgical properties of Ti-6Al-4V alloy fabricated in different energy densities in the Selective Laser Melting technique. J. Manuf. Process. 2018, 35, 538–546. [Google Scholar] [CrossRef]
  70. Buhairi, M.A.; Foudzi, F.M.; Jamhari, F.I.; Sulong, A.B.; Radzuan, N.A.M.; Muhamad, N.; Mohamed, I.F.; Azman, A.H.; Harun, W.S.W.; Al-Furjan, M.S.H. Review on volumetric energy density: Influence on morphology and mechanical properties of Ti6Al4V manufactured via laser powder bed fusion. Prog. Addit. Manuf. 2023, 8, 265–283. [Google Scholar] [CrossRef]
  71. Yi, J.H.; Kang, J.W.; Wang, T.J.; Wang, X.; Hu, Y.Y.; Feng, T.; Feng, Y.L.; Wu, P.Y. Effect of laser energy density on the microstructure, mechanical properties, and deformation of Inconel 718 samples fabricated by selective laser melting. J. Alloys Compd. 2019, 786, 481–488. [Google Scholar] [CrossRef]
  72. Brandl, E.; Schoberth, A.; Leyens, C. Morphology, microstructure, and hardness of titanium (Ti-6Al-4V) blocks deposited by wire-feed additive layer manufacturing (ALM). Mater. Sci. Eng. A 2012, 532, 295–307. [Google Scholar] [CrossRef]
  73. Murr, L.E.; Esquivel, E.V.; Quinones, S.A.; Gaytan, S.M.; Lopez, M.I.; Martinez, E.Y.; Medina, F.; Hernandez, D.H.; Martinez, E.; Martinez, J.L.; et al. Microstructures and mechanical properties of electron beam-rapid manufactured Ti–6Al–4V biomedical prototypes compared to wrought Ti–6Al–4V. Mater. Charact. 2009, 60, 96–105. [Google Scholar] [CrossRef]
  74. Vilaro, T.; Colin, C.; Bartout, J.D. As-Fabricated and Heat-Treated Microstructures of the Ti-6Al-4V Alloy Processed by Selective Laser Melting. Metall. Mater. Trans. A 2011, 42, 3190–3199. [Google Scholar] [CrossRef]
  75. Toh, W.Q.; Wang, P.; Tan, X.; Nai, M.L.S.; Liu, E.; Tor, S.B. Microstructure and wear properties of electron beam melted Ti-6Al-4V parts: A comparison study against as-cast form. Metals 2016, 6, 284. [Google Scholar] [CrossRef]
  76. Li, H.; Jia, D.; Yang, Z.; Liao, X.; Jin, H.; Cai, D.; Zhou, Y. Effect of heat treatment on microstructure evolution and mechanical properties of selective laser melted Ti–6Al–4V and TiB/Ti–6Al–4V composite: A comparative study. Mater. Sci. Eng. A 2021, 801, 140415. [Google Scholar] [CrossRef]
  77. Lütjering, G. Influence of processing on microstructure and mechanical properties of (α+β) titanium alloys. Mater. Sci. Eng. A 1998, 243, 32–45. [Google Scholar] [CrossRef]
  78. Tan, X.; Kok, Y.; Toh, W.Q.; Tan, Y.J.; Descoins, M.; Mangelinck, D.; Tor, S.B.; Leong, K.F.; Chua, C.K. Revealing martensitic transformation and α/β interface evolution in electron beam melting three-dimensional-printed Ti-6Al-4V. Sci. Rep. 2016, 6, 26039. [Google Scholar] [CrossRef]
  79. Yan, X.; Yin, S.; Chen, C.; Huang, C.; Bolot, R.; Lupoi, R.; Kuang, M.; Ma, W.; Coddet, C.; Liao, H.; et al. Effect of heat treatment on the phase transformation and mechanical properties of Ti6Al4V fabricated by selective laser melting. J. Alloys Compd. 2018, 764, 1056–1071. [Google Scholar] [CrossRef]
  80. Facchini, L.; Magalini, E.; Robotti, P.; Molinari, A.; Höges, S.; Wissenbach, K. Ductility of a Ti-6Al-4V alloy produced by selective laser melting of prealloyed powders. Rapid Prototyp. J. 2010, 16, 450–459. [Google Scholar] [CrossRef]
  81. Bermingham, M.J.; Nicastro, L.; Kent, D.; Chen, Y.; Dargusch, M.S. Optimising the mechanical properties of Ti-6Al-4V components produced by wire + arc additive manufacturing with post-process heat treatments. J. Alloys Compd. 2018, 753, 247–255. [Google Scholar] [CrossRef]
  82. Tan, P.; Shen, F.; Li, B.; Zhou, K. A thermo-metallurgical-mechanical model for selective laser melting of Ti6Al4V. Mater. Des. 2019, 168, 107642. [Google Scholar] [CrossRef]
  83. Barriobero-Vila, P.; Gussone, J.; Haubrich, J.; Sandlöbes, S.; Da Silva, J.C.; Cloetens, P.; Schell, N.; Requena, G. Inducing Stable α + β Microstructures during Selective Laser Melting of Ti-6Al-4V Using Intensified Intrinsic Heat Treatments. Materials 2017, 10, 268. [Google Scholar] [CrossRef] [PubMed]
  84. Xing, L.-L.; Zhang, W.-J.; Zhao, C.-C.; Gao, W.-Q.; Shen, Z.-J.; Liu, W. Influence of Powder Bed Temperature on the Microstructure and Mechanical Properties of Ti-6Al-4V Alloy Fabricated via Laser Powder Bed Fusion. Materials 2021, 14, 2278. [Google Scholar] [CrossRef] [PubMed]
  85. Simonelli, M.; Tse, Y.Y.; Tuck, C. The formation of α+ β microstructure in as-fabricated selective laser melting of Ti–6Al–4V. J. Mater. Res. 2014, 29, 2028–2035. [Google Scholar] [CrossRef]
  86. Petrovskiy, P.; Travyanov, A.; Cheverikin, V.V.; Chereshneva, A.A.; Sova, A.; Smurov, I. Effect of encapsulated hot isostatic pressing on properties of Ti6Al4V deposits produced by cold spray. Int. J. Adv. Manuf. Technol. 2020, 107, 437–449. [Google Scholar] [CrossRef]
  87. Sallica-Leva, E.; Caram, R.; Jardini, A.L.; Fogagnolo, J.B. Ductility improvement due to martensite α′ decomposition in porous Ti–6Al–4V parts produced by selective laser melting for orthopedic implants. J. Mech. Behav. Biomed. Mater. 2016, 54, 149–158. [Google Scholar] [CrossRef]
  88. Gu, D.; Hagedorn, Y.-C.; Meiners, W.; Meng, G.; Batista, R.J.S.; Wissenbach, K.; Poprawe, R. Densification behavior, microstructure evolution, and wear performance of selective laser melting processed commercially pure titanium. Acta Mater. 2012, 60, 3849–3860. [Google Scholar] [CrossRef]
  89. Xu, Y.; Zhang, D.; Guo, Y.; Hu, S.; Wu, X.; Jiang, Y. Microstructural tailoring of As-Selective Laser Melted Ti6Al4V alloy for high mechanical properties. J. Alloys Compd. 2020, 816, 152536. [Google Scholar] [CrossRef]
  90. Liu, S.; Shin, Y.C. Additive manufacturing of Ti6Al4V alloy: A review. Mater. Des. 2019, 164, 107552. [Google Scholar] [CrossRef]
  91. Ali, H.; Ma, L.; Ghadbeigi, H.; Mumtaz, K. In-situ residual stress reduction, martensitic decomposition and mechanical properties enhancement through high temperature powder bed pre-heating of Selective Laser Melted Ti6Al4V. Mater. Sci. Eng. A 2017, 695, 211–220. [Google Scholar] [CrossRef]
  92. Galarraga, H.; Warren, R.J.; Lados, D.A.; Dehoff, R.R.; Kirka, M.M.; Nandwana, P. Effects of heat treatments on microstructure and properties of Ti-6Al-4V ELI alloy fabricated by electron beam melting (EBM). Mater. Sci. Eng. A 2017, 685, 417–428. [Google Scholar] [CrossRef]
  93. Sun, W.; Ma, Y.e.; Huang, W.; Zhang, W.; Qian, X. Effects of build direction on tensile and fatigue performance of selective laser melting Ti6Al4V titanium alloy. Int. J. Fatigue 2020, 130, 105260. [Google Scholar] [CrossRef]
  94. Cao, S.; Chen, Z.; Lim, C.V.S.; Yang, K.; Jia, Q.; Jarvis, T.; Tomus, D.; Wu, X. Defect, Microstructure, and Mechanical Property of Ti-6Al-4V Alloy Fabricated by High-Power Selective Laser Melting. JOM 2017, 69, 2684–2692. [Google Scholar] [CrossRef]
  95. Agius, D.; Kourousis, K.I.; Wallbrink, C. A Review of the As-Built SLM Ti-6Al-4V Mechanical Properties towards Achieving Fatigue Resistant Designs. Metals 2018, 8, 75. [Google Scholar] [CrossRef]
  96. Zhou, B.; Zhou, J.; Li, H.; Lin, F. A study of the microstructures and mechanical properties of Ti6Al4V fabricated by SLM under vacuum. Mater. Sci. Eng. A 2018, 724, 1–10. [Google Scholar] [CrossRef]
Figure 1. Characterization of EOS Ti64 Grade 5 powder via (a) SEM micrograph and (b) particle size distribution analysis.
Jmmp 07 00226 g001
Figure 2. LPBF-built samples designed for (a) microstructural analysis and (b) tensile testing.
Jmmp 07 00226 g002
Figure 3. Schematic representation of tensile samples used in this study.
Jmmp 07 00226 g003
Figure 4. Representative scanning electron microscopy (SEM) micrographs showing the distribution of pores for the (a) Reference and (b) Gap 0.5 samples.
Jmmp 07 00226 g004
Figure 5. Comparison of average porosity levels between samples fabricated with various gap distances between the sample and border and the Reference sample.
Jmmp 07 00226 g005
Figure 6. Examining the correlation between pore size and gap distance between the sample and border, as compared to the Reference sample.
Jmmp 07 00226 g006
Figure 7. The evolution of different phases in the (a) Reference and (b) Gap 0.5 samples was analyzed using SEM images. The Reference sample mainly consisted of the acicular α′ phase, while the Gap 0.5 sample contained a mixture of α + β basket-weave matrix, lamellar α, and acicular α′.
Jmmp 07 00226 g007
Figure 8. The comparison between border samples and the Reference sample reveals that the average thickness of α/α′ increases as the gap distance between the sample and border decreases.
Jmmp 07 00226 g008
Figure 9. X-ray Diffraction (XRD) spectrographs for the samples showing slight variations in the position of the main α/α′ peak. The largest discrepancy is observed between the Reference and Gap 0.5 samples. The β phase content is higher in the border samples, with the presence of an additional β phase peak at 2θ = 57.5° in the Gap 0.5 sample indicating its highest content.
Jmmp 07 00226 g009
Figure 10. The graph illustrates the variation in the average Vickers Hardness (HV) values plotted against the gap value. The results show a slight increase in microhardness as the gap value decreased from 4 to 0.5 mm. The Reference sample had the lowest microhardness value of 388 HV.
Jmmp 07 00226 g010
Figure 11. Stress–strain plots for the Reference sample, Gap 0.5, Gap 1.0, and Gap 2.0 samples in uniaxial tensile testing. Gap 0.5 sample showed an approximately 15% and 9% improvement in UTS and fracture strain, respectively, compared to the Reference sample.
Jmmp 07 00226 g011
Figure 12. The DIC strain mappings corresponding to the frame before fracture extracted for (a) Reference, (b) Gap 0.5, (c) Gap 1.0, and (d) Gap 2.0 sample. The Gap 0.5 sample experienced a maximum local strain approximately 30% higher than that of the Reference sample and significantly higher than that of the Gap 1.0 and Gap 2.0 samples.
Jmmp 07 00226 g012
Table 1. Geometry and dimensions of fabricated samples.
Sample NameType of GeometrySample Dimensions (mm)Border Dimensions/Thickness (mm)Gap between Sample and Border (mm)
Ref. (Reference sample)Cubic9 × 9 × 9 (w × l × h) *--
Gap 0.5Cubic9 × 9 × 9 (w × l × h)9 × 2 (H × t) +0.5
Gap 1.0Cubic9 × 9 × 9 (w × l × h)9 × 2 (H × t)1.0
Gap 2.0Cubic9 × 9 × 9 (w × l × h)9 × 2 (H × t)2.0
Gap 3.0Cubic9 × 9 × 9 (w × l × h)9 × 2 (H × t)3.0
Gap 4.0Cubic9 × 9 × 9 (w × l × h)9 × 2 (H × t)4.0
Ref. (Reference sample)Dog boneAs depicted--
Gap 0.5Dog boneAs depicted2 × 2 mm (H × t)0.5
Gap 1.0Dog boneAs depicted2 × 2 mm (H × t)1.0
Gap 2.0Dog boneAs depicted2 × 2 mm (H × t)2.0
* w, l, and h are the width, length, and height of the main sample, respectively. + H and t are the height and thickness of the border, respectively.
Table 2. Comparing vanadium composition in α/α′ phase: various samples. The vanadium percentage exhibited an increase with increasing gap value but remained lower compared to the Reference sample.
SampleV (Weight %)
Reference4.62 ± 0.16
Gap 0.53.38 ± 0.17
Gap 1.04.11 ± 0.15
Gap 2.04.30 ± 0.22
Gap 3.04.40 ± 0.20
Gap 4.04.56 ± 0.20
Table 3. Quantitative analysis of the XRD patterns with their possible corresponding microstructure.
SampleReferenceGap 0.5Gap 1.0Gap 2.0Gap 3.0Gap 4.0
β phase (%)0.234.392.181.580.860.87
Possible StructureFull α′α′ + fine
(α + β)
α′ + lamellar
(α + β)
α′ + lamellar
(α + β)
Full α′Full α′
Table 4. Parameters calculated from the XRD patterns for the Reference and Gap 0.5 samples. FWHM for Gap 0.5 sample was lower, indicating larger α/α′ phase size than Reference sample. No significant c/a variation observed, so XRD peak position deviation can be ignored.
Sample/ParameterFWHMc/a
Reference0.39361.597
Gap 0.50.31491.598
Table 5. Tensile test parameters extracted from the stress–strain plots of the samples.
SampleUTS (MPa)Fracture Strain (%)
Reference1046.706.48
Gap 0.51202.537.07
Gap 1.01151.686.92
Gap 2.01091.206.68
Disclaimer/Publisher’s Note: The statements, opinions and data contained in all publications are solely those of the individual author(s) and contributor(s) and not of MDPI and/or the editor(s). MDPI and/or the editor(s) disclaim responsibility for any injury to people or property resulting from any ideas, methods, instructions or products referred to in the content.

