Article

Towards a Simulation-Assisted Prediction of Residual Stress-Induced Failure during Powder Bed Fusion of Metals Using a Laser Beam: Suitable Fracture Mechanics Models and Calibration Methods

Institute for Machine Tools and Industrial Management (iwb), TUM School of Engineering and Design, Technical University of Munich, Boltzmannstr. 15, 85748 Garching, Germany
*
Author to whom correspondence should be addressed.
These authors contributed equally to this work.
J. Manuf. Mater. Process. 2023, 7(6), 208; https://doi.org/10.3390/jmmp7060208
Submission received: 21 October 2023 / Revised: 18 November 2023 / Accepted: 23 November 2023 / Published: 27 November 2023

Abstract

:
In recent years, Additive Manufacturing (AM) has emerged as a transformative technology, with the process of Powder Bed Fusion of Metals using a Laser Beam (PBF-LB/M) gaining substantial attention for its precision and versatility in fabricating metal components. A major challenge in PBF-LB/M is the failure of the component or the support structure during the production process. In order to locate a possible residual stress-induced failure prior to the fabrication of the component, a suitable failure criterion has to be identified and implemented in process simulation software. In the work leading to this paper, failure criteria based on the Rice-Tracey (RT) and Johnson-Cook (JC) fracture models were identified as potential models to reach this goal. The models were calibrated for the nickel-based superalloy Inconel 718. For the calibration process, a conventional experimental, a combined experimental and simulative, and an AM-adapted approach were applied and compared. The latter was devised to account for the particular phenomena that occur during PBF-LB/M. It was found that the JC model was able to capture the calibration data points more precisely than the RT model due to its higher number of calibration parameters. Only the JC model calibrated by the experimental and AM-adapted approach showed an increased equivalent plastic failure strain at high triaxialities, predicting a higher cracking resistance. The presented results can be integrated into a simulation tool with which the potential fracture location as well as the cracking susceptibility during the manufacturing process of PBF-LB/M parts can be predicted.

1. Introduction

Rigorous lightweight design has proven to be a promising way to reduce CO 2 emissions in various industries, such as the automotive and the aviation sectors [1,2]. To ensure the economic success of this design paradigm, customer specific products with geometrically optimized structures have to be manufactured cost- and time efficiently. Powder Bed Fusion of Metals using a Laser Beam (PBF-LB/M) is an innovative manufacturing technology, which meets these requirements. It uses a laser to selectively melt metal powder in the desired 2D plane [3]. By repeating the melting of the geometry layer by layer, a 3D geometry is generated. Due to the layer-wise building process, the technology offers the possibility to efficiently produce complex geometries, such as bionically optimized structures.
However, the PBF-LB/M process also poses technology-specific design restrictions. These originate primarily from thermal heat dissipation or from thermally-induced residual stresses, which can even lead to a component failure during the building process [4,5,6,7]. A particular challenge is residual stress-induced cracking during manufacturing. Hereby, failure occurs in an area of the part, which is already at temperatures significantly below the melting temperature. Currently, classical design specifications for Additive Manufacturing (AM), such as thresholds for minimum wall thicknesses and critical overhang angles, are employed to evaluate whether parts can be additively manufactured [8]. Due to the increasing complexity of the components to be manufactured, this assessment has become inaccurate and inefficient. An automated evaluation of the computer-aided design geometry could be the key to overcoming these limitations. For this purpose, a failure criterion is required, which allows for an estimation of the manufacturability by means of the calculated process-induced residual stresses. Being aware of the potential local damage within a component could enable a better prediction of the product life span [9,10,11].
Various experimental approaches [12,13,14,15] as well as simulative approaches exist to describe or reduce a failure on the meso and the macro scale during the PBF-LB/M process. With regard to the simulation, an approach to predict the possible stress-induced crack initiation between the support structure and the part was suggested by Tran et al. [16]. They applied a novel in-situ experimental method for determining a critical value for the J-integral, an indicator for the non-linear fracture toughness, at the solid-support interface. The critical value was determined in combination with a residual stress simulation for Inconel 718 (IN718), using the modified inherent strain method and a local heat source. A prediction, determining if, but not where, a crack might occur, was realized by comparing the J-integral value of test specimens with the calculated threshold. Critical locations have to be known in advance, to adjust the finite element mesh accordingly. Information about the stability of the crack could not be provided.
The previously described simulation model was modified by Tran et al. [17] in terms of a computational optimization. They applied a global-local approach, where inherent strain analyses for the entire part were performed, while the J-integral was only calculated at critical locations. The lattice support structure was represented as a homogenized material, whose characteristics differed from those of the solid component. This led to a significant reduction in the computation time.
Lee et al. [18] utilized a simulation model based on the Finite Element Method (FEM) specifically for the Powder Bed Fusion of Metals using an Electron Beam process to predict failure locations during the manufacturing process of Inconel 738. For the simulation of the melting process, a point concentrated heat source was implemented. They correlated the results of the model with observations made by an in-situ near-infrared camera with regard to the cracking, the scan strategy, and the geometry of the part. Physical effects responsible for the crack formation were derived based on this comparison. The scan strategy was adapted to achieve reduced local stresses and, therefore, a decreased risk of crack formation. No failure criterion was considered and, hence, no actual crack representation in the simulation model could be realized.
Zhang and Zhang [19] implemented a weakly coupled thermo-mechanical model for the stainless steel 15-5 PH1 also based on the FEM and estimated the crack location by considering the maximum von Mises stress. The authors rated the computational costs of the simulation as high, which was due to the detailed model of the building process. Therefore, the simulation model was scaled down compared with the original part size. The entire simulated part was positioned on a support structure and the crack formation was only considered along the solid-support interface. No failure criterion was applied, which is why no quantitative prediction of a fracture could be established.
Bresson et al. [20] evaluated the predictive capabilities of commercial FEM simulation tools in terms of a crack formation between the part and its support structure in PBF-LB/M for 316L stainless steel. Due to the limitations of these tools, they set up an alternative approach applying a ductile damage criterion with a damage indicator, which allowed for a prediction of an actual part-support failure. The computational effort for the corresponding simulations, however, was characterized as large. The corresponding values of the phenomenological model had no physical basis and were not determined during the actual PBF-LB/M process.
A frequently used model to describe the crack initiation and crack propagation phenomena is the Gurson model from Gurson [21], which was extended by Tvergaard [22] and Tvergaard and Needleman [23]. The resulting model is also known as the Gurson-Tvergaard-Needleman (GTN) model. Considering a ductile fracture prediction of PBF-LB/M parts, Yang et al. [24] applied a modified GTN model to calibrate failure parameters for additively manufactured Ti-6Al-4V parts. They described an approach for the calibration process including a large range of stress states. However, the authors did not elaborate on predicting a failure during the PBF-LB/M manufacturing process. A comparison of different calibration approaches was not conducted.
Shafaie et al. [25] set up an artificial neural network for a less time-consuming and optimized determination of the various model constants of the GTN model for Ti-6Al-4V parts manufactured by PBF-LB/M. Experimental validations showed a good agreement with the determined parameter values. Sarparast et al. [26] improved this modeling approach by varying the number of neurons and hidden layers in the neural network to investigate the effect on the predictive quality. However, for the purpose of the training of the network, experimental and simulative tensile tests were still necessary.
In summary, failure due to residual stress-induced cracking on a macroscopic scale remains a major barrier for the industrial application of PBF-LB/M. Existing methods for the estimation of the manufacturability are primarily of an empirical nature or based on user experience. First numerical approaches exist, but are still computationally expensive and only applicable for certain geometries or features. Current ductile fracture prediction approaches focus on the GNT model, which is characterized by a large number of calibration constants. Also, the aim of these approaches is to model the failure behavior during the part service and not during the manufacturing process. To the best of the authors’ knowledge, a suitability analysis of fracture mechanics models along with a comparison of different calibration approaches for the simulation of residual stress-induced failure on a macroscopic scale of IN718 parts during PBF-LB/M does not exist.
At the Institute for Machine Tools and Industrial Management (iwb) of the Technical University of Munich, the software tool AscentAM (https://www.mec.ed.tum.de/en/iwb/research-and-industry/projects/additive-manufacturing/ascent-am-simulation-des-laserstrahlschmelzens-von-triebwerkskomponenten/, accessed on 22 November 2023) was developed to simulate the PBF-LB/M process. It is based on a weakly coupled thermo-mechanical FEM simulation that predicts deformations and residual stresses in the part [27]. This process simulation of PBF-LB/M could enable a physically motivated assessment of the manufacturability of geometries prone to residual stress-induced failure. For this purpose, suitable fracture models have to be identified and integrated into the simulation software. It is expected that the identified models will allow for both the prediction and localization of crack initiation as well as the calculation of a possible crack propagation. In this regard, this paper explores two research questions:
  • Which type of fracture models are suitable from a physical point of view to model residual stress-induced fracture during PBF-LB/M?
  • How can these models be calibrated to consider the particularities of the PBF-LB/M process and the formed material?
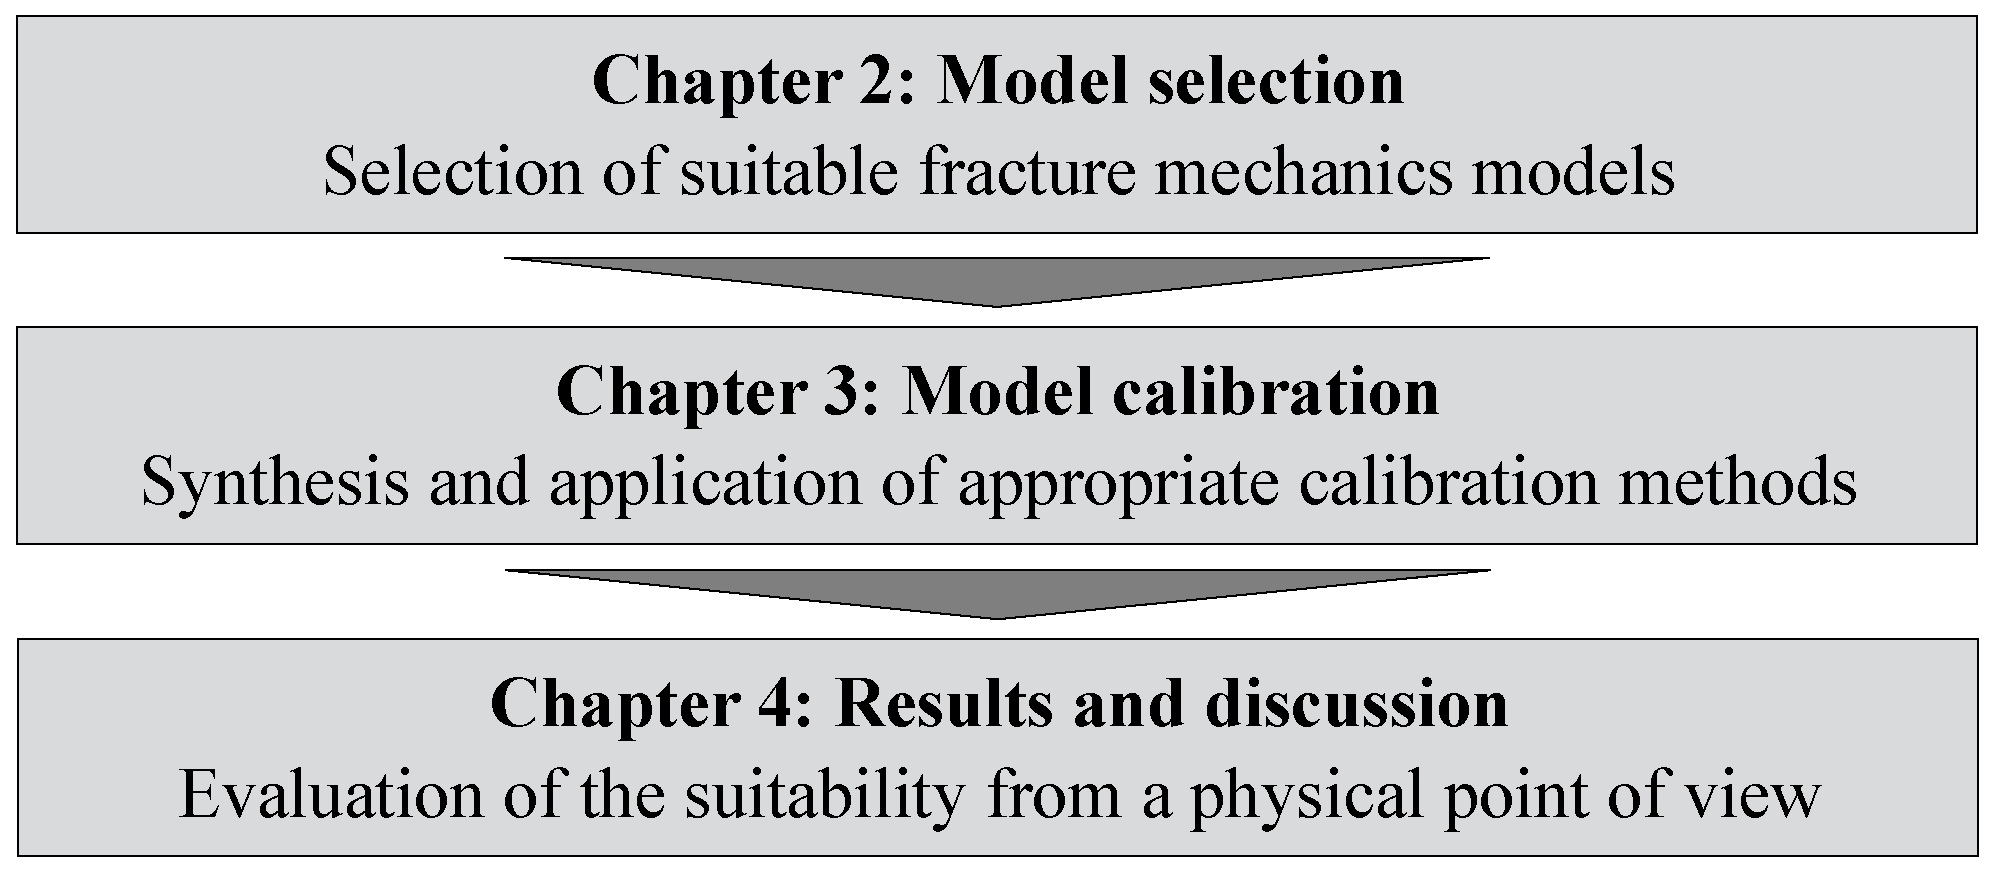
Figure 1 depicts the proposed approach in this paper. Initially, the material and fracture behavior of additively manufactured IN718 was analyzed experimentally and was investigated based on information from the literature. Using the findings, suitable models were selected from the literature. Three calibration methods were postulated and then applied. The aim was to particularly address the characteristics of the PBF-LB/M process and the resulting material. The calibrated models were evaluated theoretically with regard to their suitability to physically modeling the residual stress-induced fracture of parts during PBF-LB/M.

2. Model Selection

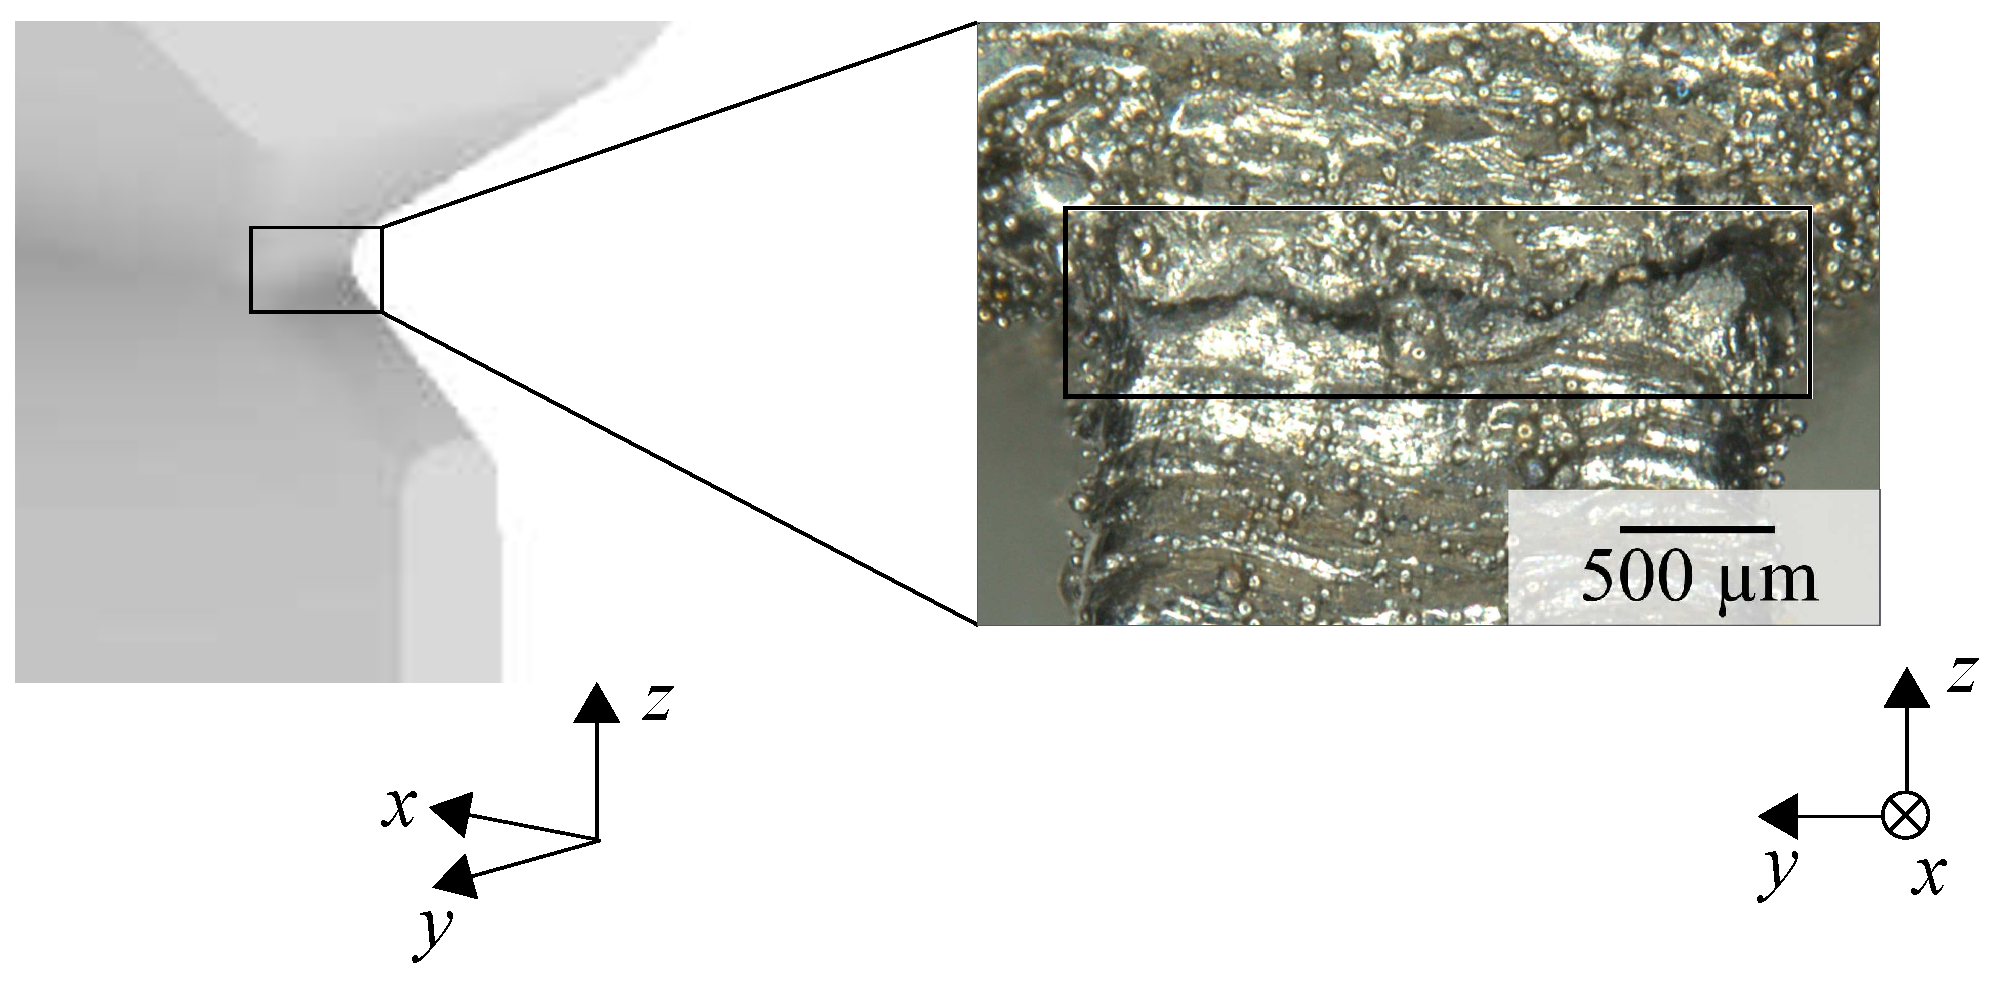
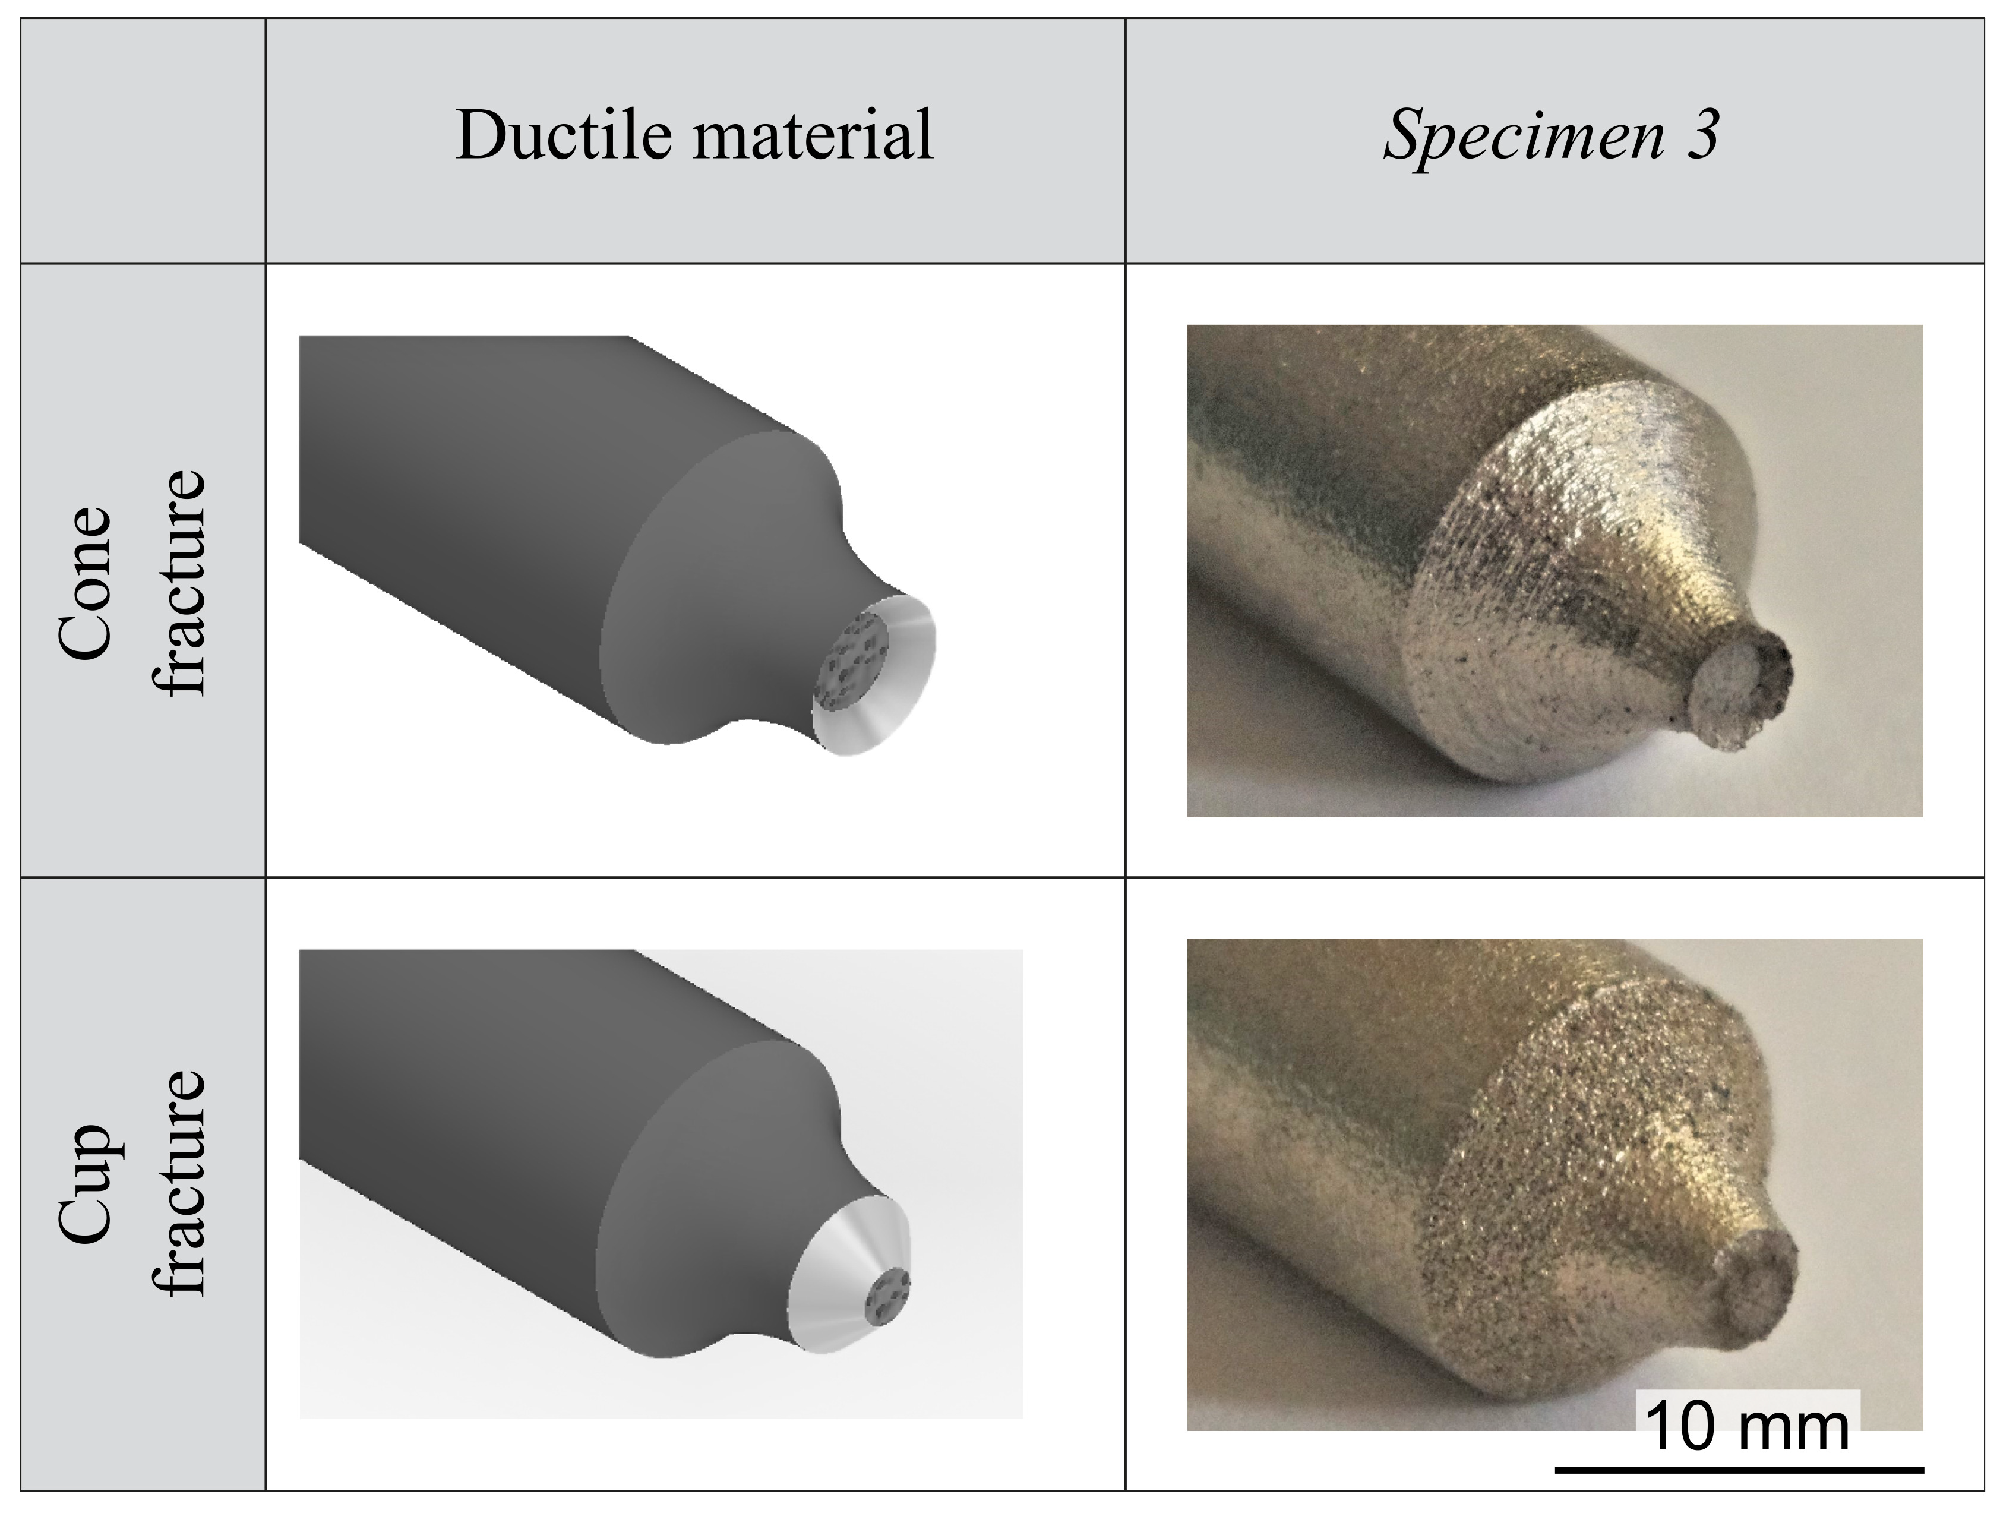
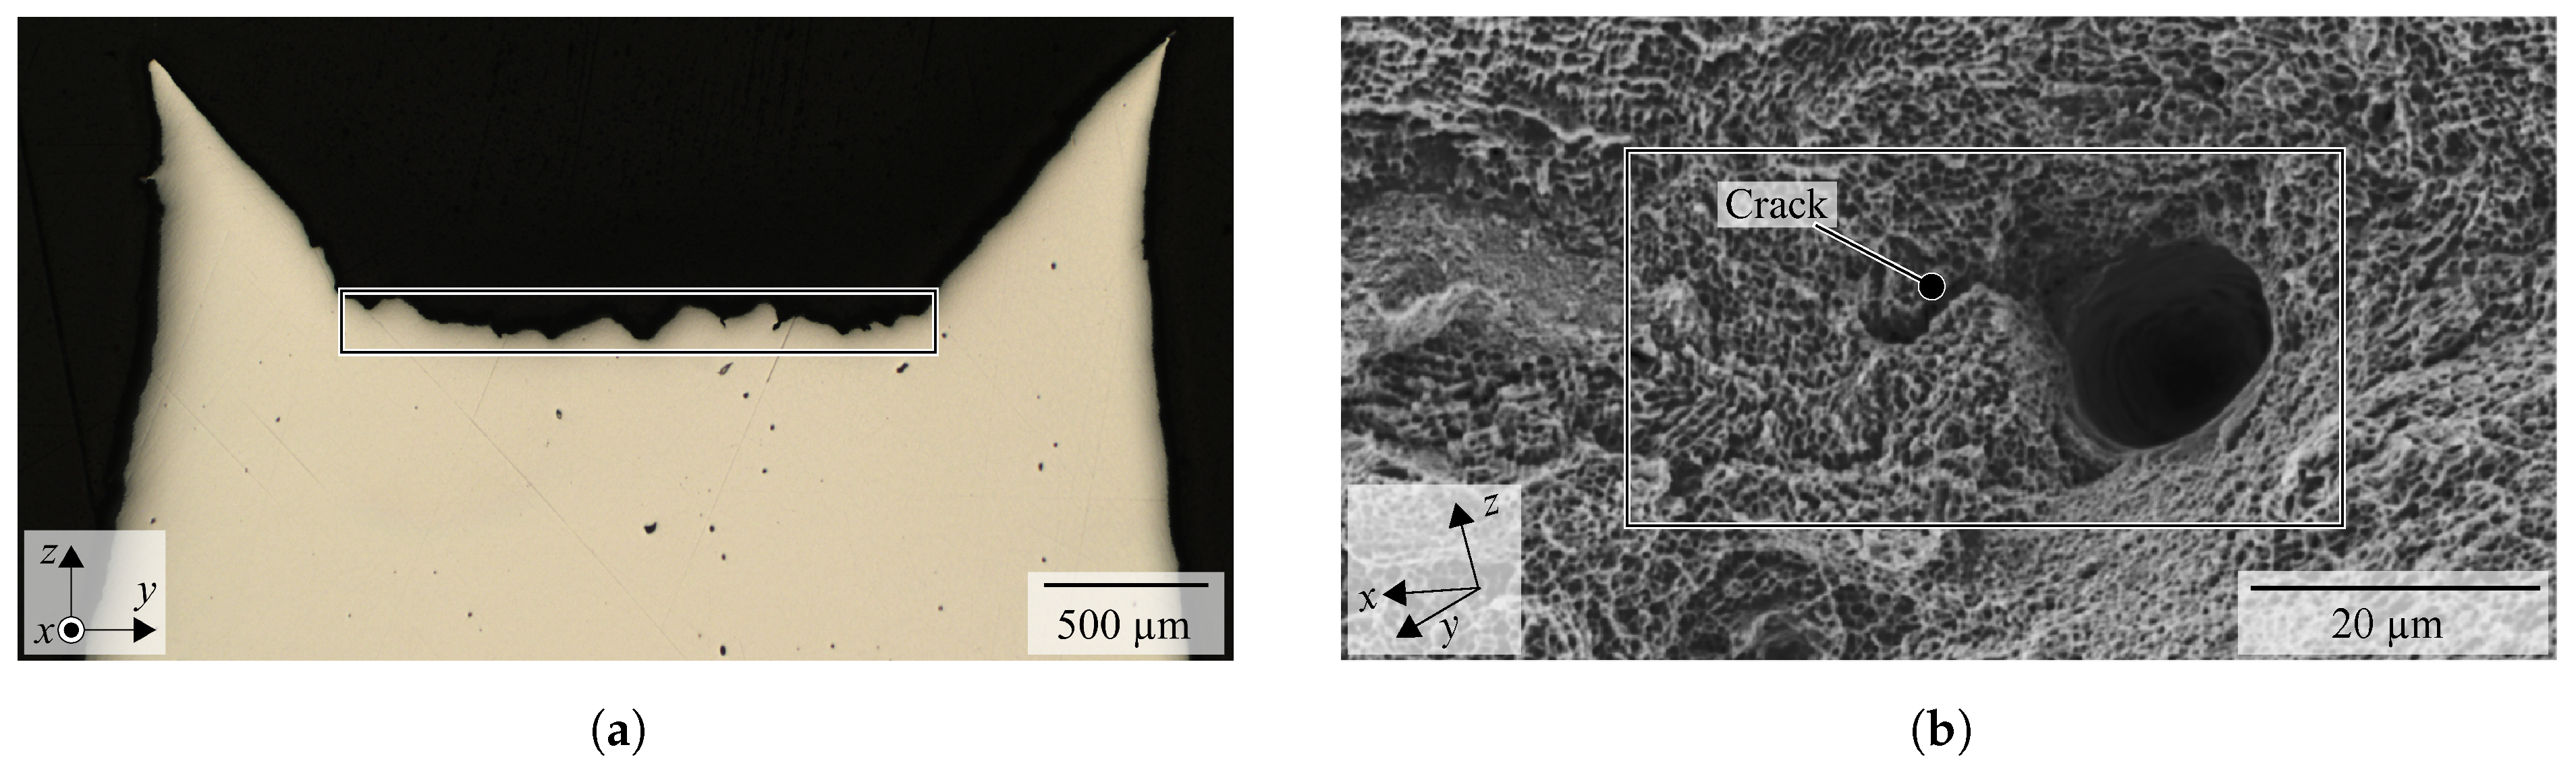
2.1. Examination of Material Behavior and Crack Formation

Initially, it was determined whether the additively produced IN718 material exhibits ductile material behavior.
Experimental tensile tests of axisymmetric specimens were conducted, which indicate a ductile behavior of the investigated material. Detailed results of the conducted tests can be found in Appendix A. The findings about the ductile behavior of IN718 are in accordance with discoveries in the literature for IN718 [28,29,30]. The models for characterizing crack formation in this material have to be selected accordingly.

2.2. Model Description

Various approaches to describe the crack initiation and crack propagation phenomena in ductile materials can be found in the literature. These approaches consider the void formation, the growth, and the coalescence, as observed in Section 2.1.
In order to assess the residual stress-induced failure of a component during PBF-LB/M, models to describe the crack initiation and propagation in IN718 parts should meet the following requirements:
  • Be applicable to ductile materials;
  • Predict a crack initiation due to residual stresses anywhere in the part;
  • Describe a real crack propagation with a magnitude of millimeters;
  • Be usable with an FEM process simulation yielding strains and stresses, and cause low additional computational costs.
Besides the high number of calibration constants, the GTN model requires a quantification of the critical void volume f c , at which coalescence occurs. As opposed to observations in the literature for conventionally manufactured material [31], no global change in this void volume fraction could be observed in the experiments for additively manufactured IN718 specimens (see Figure A2a in Appendix A). This impedes a physically-based determination of f c .
The open voids resulting in the rough surface structure, also known as honeycomb structure, leading to a fracture (see Figure A2a in Appendix A, marked by the black box) are inherently considered in a second model class. The corresponding models also account for the stress triaxiality
σ * = σ m σ eq
with the mean or hydrostatic stress σ m and the von Mises equivalent stress σ eq . The latter describes the energy needed for the distortion of a body and is calculated as
σ eq = 1 2 · σ 1 σ 2 2 + σ 2 σ 3 2 + σ 3 σ 1 2 1 / 2 ,
where the indices 1, 2, and 3 correspond to the stresses in the direction of a main axis system. σ and τ correspond to the normal stress and shear stress, respectively. σ m represents the energy necessary to change the volume of an object, and is determined by
σ m = 1 3 · σ 1 + σ 2 + σ 3 .
Both stress values, σ eq and σ m , can be easily determined in structural simulations, which makes this approach particularly suitable for industrial applications. The stress triaxiality σ * is a geometry-dependent parameter and a measure for the load acting on inclusions and second-phase particles, leading to a void formation. The goal of using this parameter is to determine an equivalent plastic failure strain as a function of σ * , which provides information about the susceptibility to crack initiation.
A first approach was published by Rice and Tracey [32], which provided the basis for the equation of the equivalent plastic fracture strain as a function of σ * . They considered a single pore in an infinite volume, characterized as a non-hardening matrix (see Figure 2). In this figure, the idea behind σ * , acting upon the pore, is illustrated. Rice and Tracey [32] introduced the equation
d r p r p = 0.28 · d ε eq p · exp 3 2 · σ m σ YS
for the change rate of the mean hole radius r p at a high σ * . Hereby, d ε eq p corresponds to the incremental equivalent plastic strain and σ YS to the yield strength of the considered material. According to d’Escatha and Devaux [33], strain hardening can be considered by replacing σ YS with σ eq . Consequently, Equation (1) can be inserted into Equation (4) leading to
d r p r p = 0.28 · d ε eq p · exp 3 2 · σ * .
The failure strain is inversely proportional to the growth rate of the void with good approximation [34] and, thus,
ε eq f r p d r p
applies. The factor 0.28 · d ε eq p in Equation (5) can be condensed to the material constant α that has to be calibrated. Inserting α and Equation (6) into Equation (5) and rearranging yields
ε eq f = α · exp 3 2 · σ * .
To obtain a physically interpretable parameter, α can be replaced with 1.65 · ε 0 by considering a uniaxial stress state [35]. ε 0 represents the critical strain in the uniaxial stress state. This yields, with Equation (8), the expression for the Rice-Tracey (RT) model describing the crack initiation and propagation phenomena in ductile materials. The critical strain at a uniaxial stress state is related to that of a triaxial state by
ε eq f = 1.65 · ε 0 RT · exp 3 2 · σ * .
Johnson and Cook [36] proposed an alternative empirical model as
ε eq f = d 1 + d 2 · exp d 3 · σ * · 1 + d 4 · ln ε ˙ * · ( 1 + d 5 · T * ) .
Equation (9) is the mathematical representation of the Johnson-Cook (JC) model, which was identified as the second suitable model for describing crack initiation and propagation phenomena in ductile materials. In contrast to the RT model, the JC model is comprised of more calibration constants concerning the stress triaxiality, and additionally allows for a calibration of the strain rate and the temperature. The dimensionless temperature T * in Equation (9) is defined as
T * = T T ref T M T ref ,
where T describes the applied temperature, T ref the reference temperature, and T M the melting temperature of the material used.
The dimensionless strain rate ε ˙ * in Equation (9) is defined as
ε ˙ * = ε ˙ eq p ε ˙ 0
with the equivalent plastic strain rate ε ˙ eq p and the reference strain rate ε ˙ 0 .
To utilize these models for the prediction of crack initiation and subsequent crack propagation, a calibration process has to be conducted to determine the material constants ε 0 RT for the RT model and d 1 to d 5 for the JC model, respectively.

3. Model Calibration

3.1. Overview

The models selected according to Section 2, namely the RT and the JC model, were calibrated by adjusting the material constants, such that the models fit the preliminarily determined data points. The Matlab Curve Fitting Toolbox (MATLAB R2020a, The MathWorks Inc., Natick, MA, USA) was used for this purpose. The authors examined three different approaches to determine the data points required for a model calibration. These can be classified as:
  • Experimental approach;
  • Experimental and simulative approach;
  • AM-adapted approach.
The experimental approach represents the classical method, which has been used for decades [34,35,37,38,39,40] and is well understood. However, additively manufactured test specimens are preloaded with an unknown stress state, due to residual stresses from the manufacturing process. This fact is not covered by the experimental approach.
The experimental approach was extended by simulations to address this issue, leading to the experimental and simulative approach. Hereby, the tensile tests were replicated by an FEM simulation to consider the influence of the residual stresses on the failure behavior.
The PBF-LB/M process is characterized by a periodical thermal and resulting cyclic mechanical loading. Neither the purely experimental approach nor the experimental and simulative approach account for these particularities occurring during the PBF-LB/M process. Therefore, the AM-adapted approach was devised to include the loading cycles during the PBF-LB/M process. Increased temperatures and microstructural phenomena leading to crack formation during the build process are, thereby, inherently considered.
Various specimens were manufactured from IN718 (NickelAlloy IN718, EOS GmbH, Krailling, Germany) by PBF-LB/M for these calibration procedures. A PBF-LB/M system (M400-1, EOS GmbH, Krailling, Germany) was employed, with the process parameters to fabricate the specimens given in Table 1.
In the following sections, the different calibration procedures of the failure models will be described in detail and compared from a theoretical point of view.

3.2. Experimental Approach

The experimental approach consisted of a failure model calibration based on experimental data from tensile tests. The intention was to apply a controlled load from the outside that triggers internal forces similar to those acting on a component due to cooling and contraction during the PBF-LB/M process. For this purpose, suitable specimen geometries had to be selected and, subsequently, manufactured through PBF-LB/M. The specimens were designed to exhibit different triaxialities during the tensile tests. It was ensured that sufficient experimental data were obtained to cover a wide range of stress triaxialities. Three types of specimen (Specimen 1–3) were adapted from Ressa [41] and Liutkus [42]. Their geometry and dimensions are illustrated in Appendix B. Modifications, compared with the references, are depicted with dashed lines and detailed views. A description along with the mean values for the achieved σ * determined by Ressa [41] and Liutkus [42] can be found in Table 2.
The specimens were built in their upright position (the z-direction equals the test direction and the building direction). This was done because the microstructure evolution during PBF-LB/M leads to an anisotropic behavior. Therefore, the crack formation and growth has to take place in the same plane in the tensile test specimen and the printed part. The parts were separated from the build plate by a band saw.
The tensile tests were conducted on a tensile test machine (Z050, ZwickRoell Group, Ulm, Germany), for which the specimens were fixed in a pneumatic clamping tool. A laser extensometer (laserXtens7-220HP, ZwickRoell Group, Ulm, Germany) along with its integrated cameras was used to track the longitudinal and the lateral strains as well as the strain rates. It was also utilized to capture pictures of the tested specimens. Each specimen’s geometry was tested at least four times to assess the experimental scatter. Along with data for the stress triaxiality and the equivalent plastic failure strain, the load-displacement curves were captured in all tensile tests. The latter served as an input for the experimental and simulative approach.

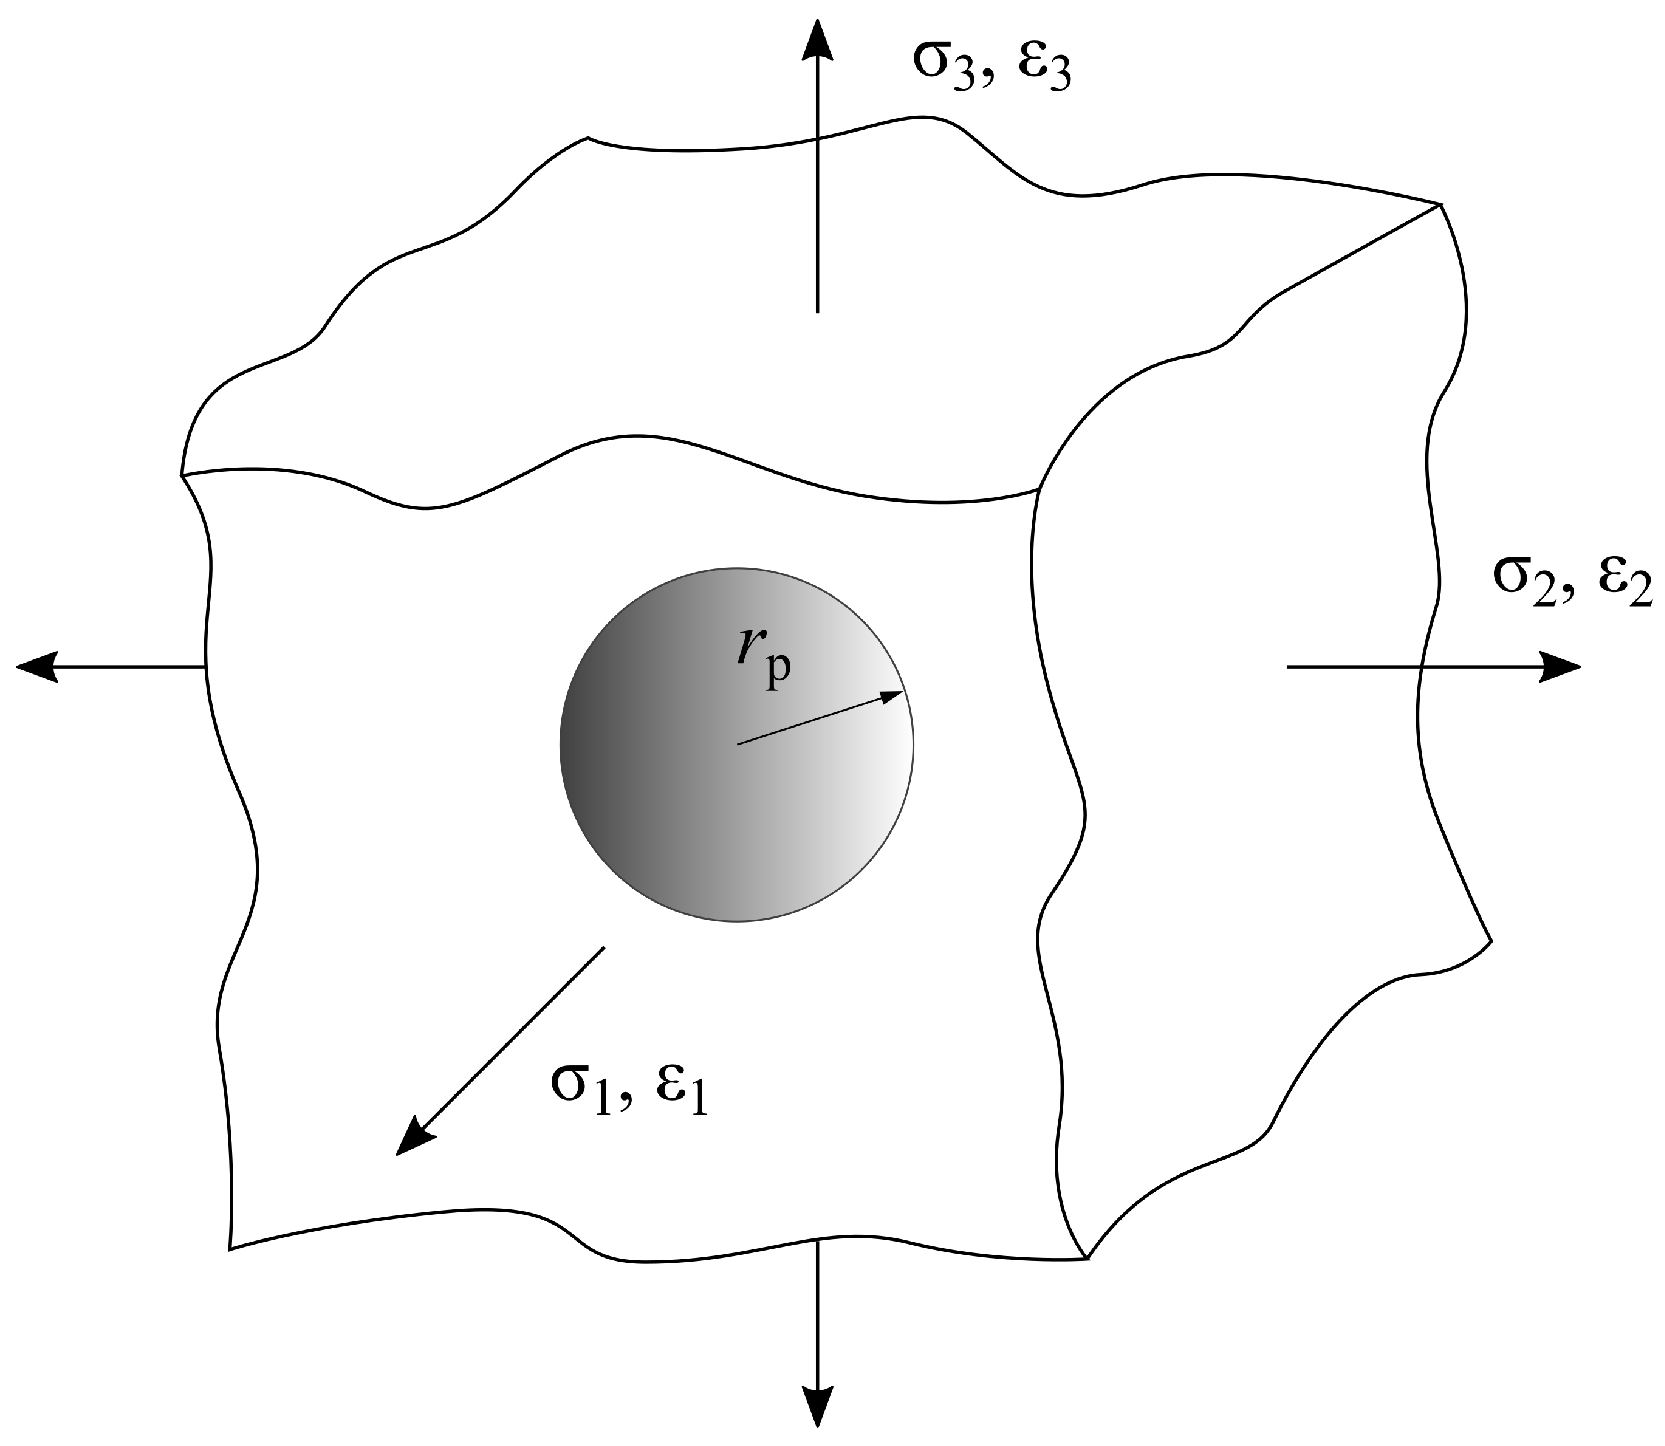
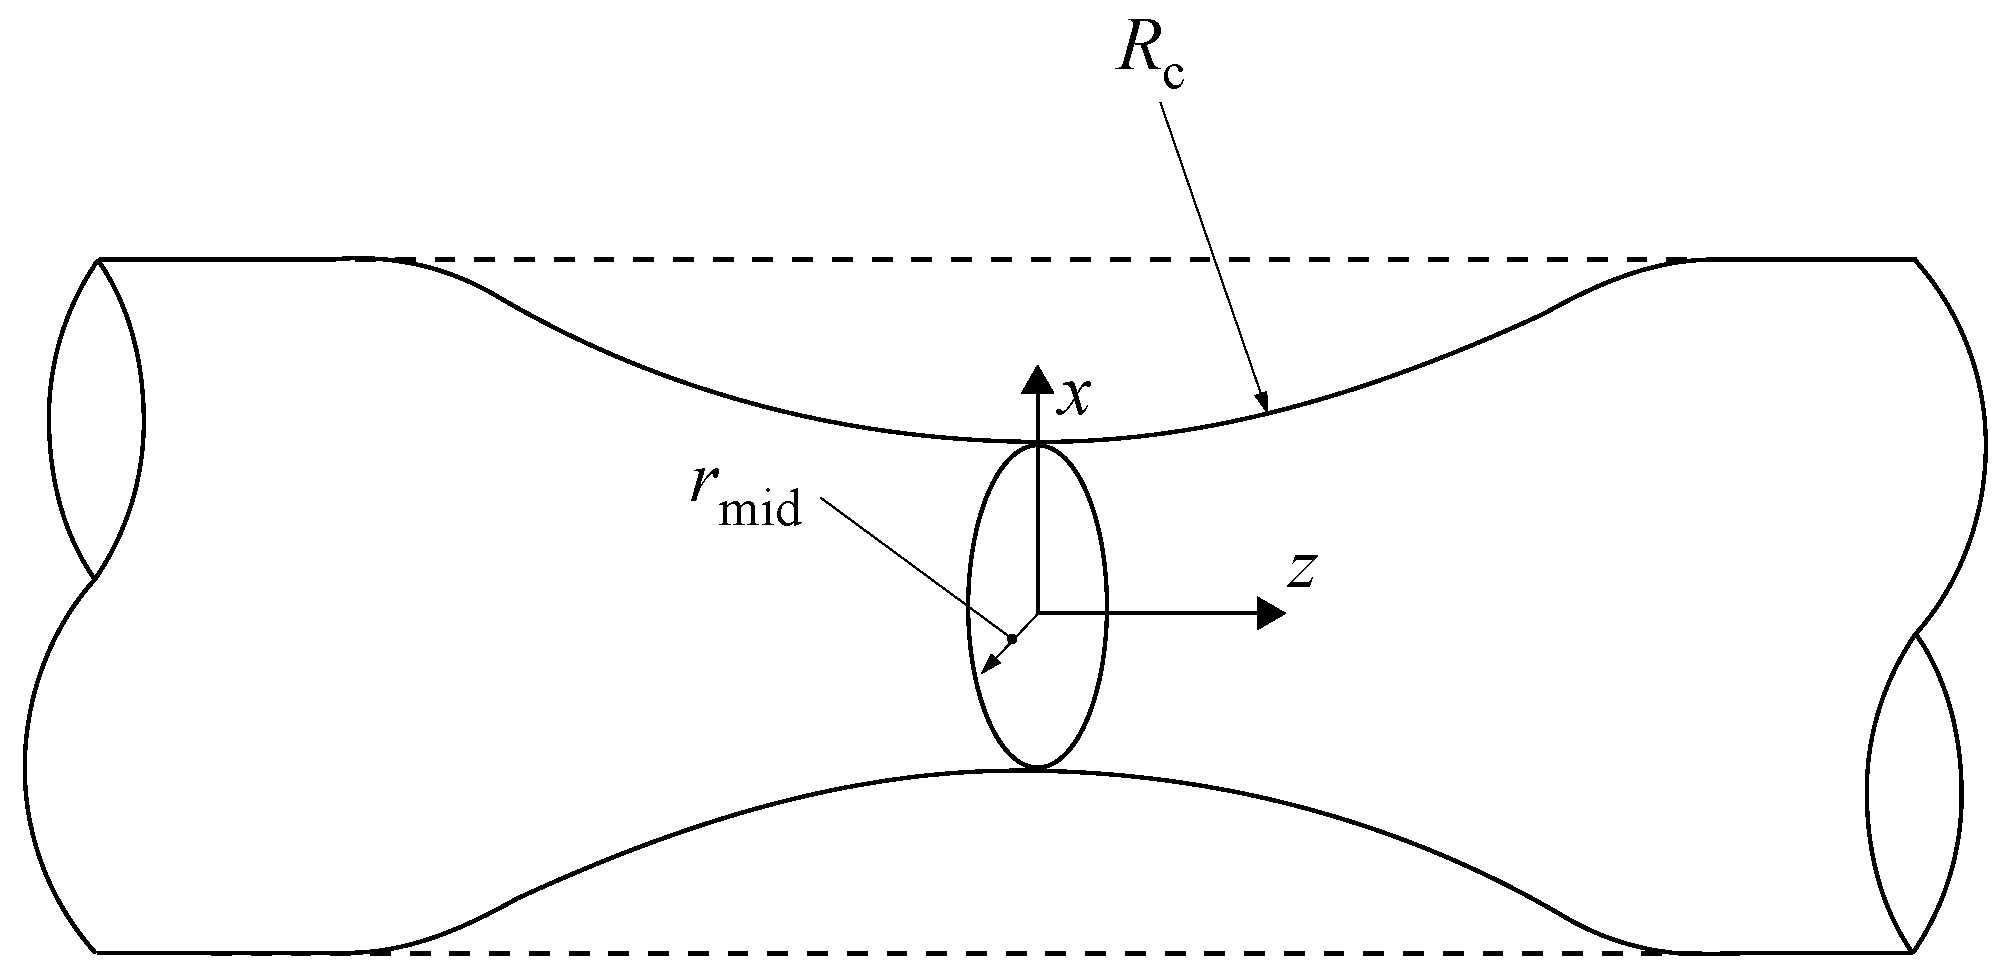
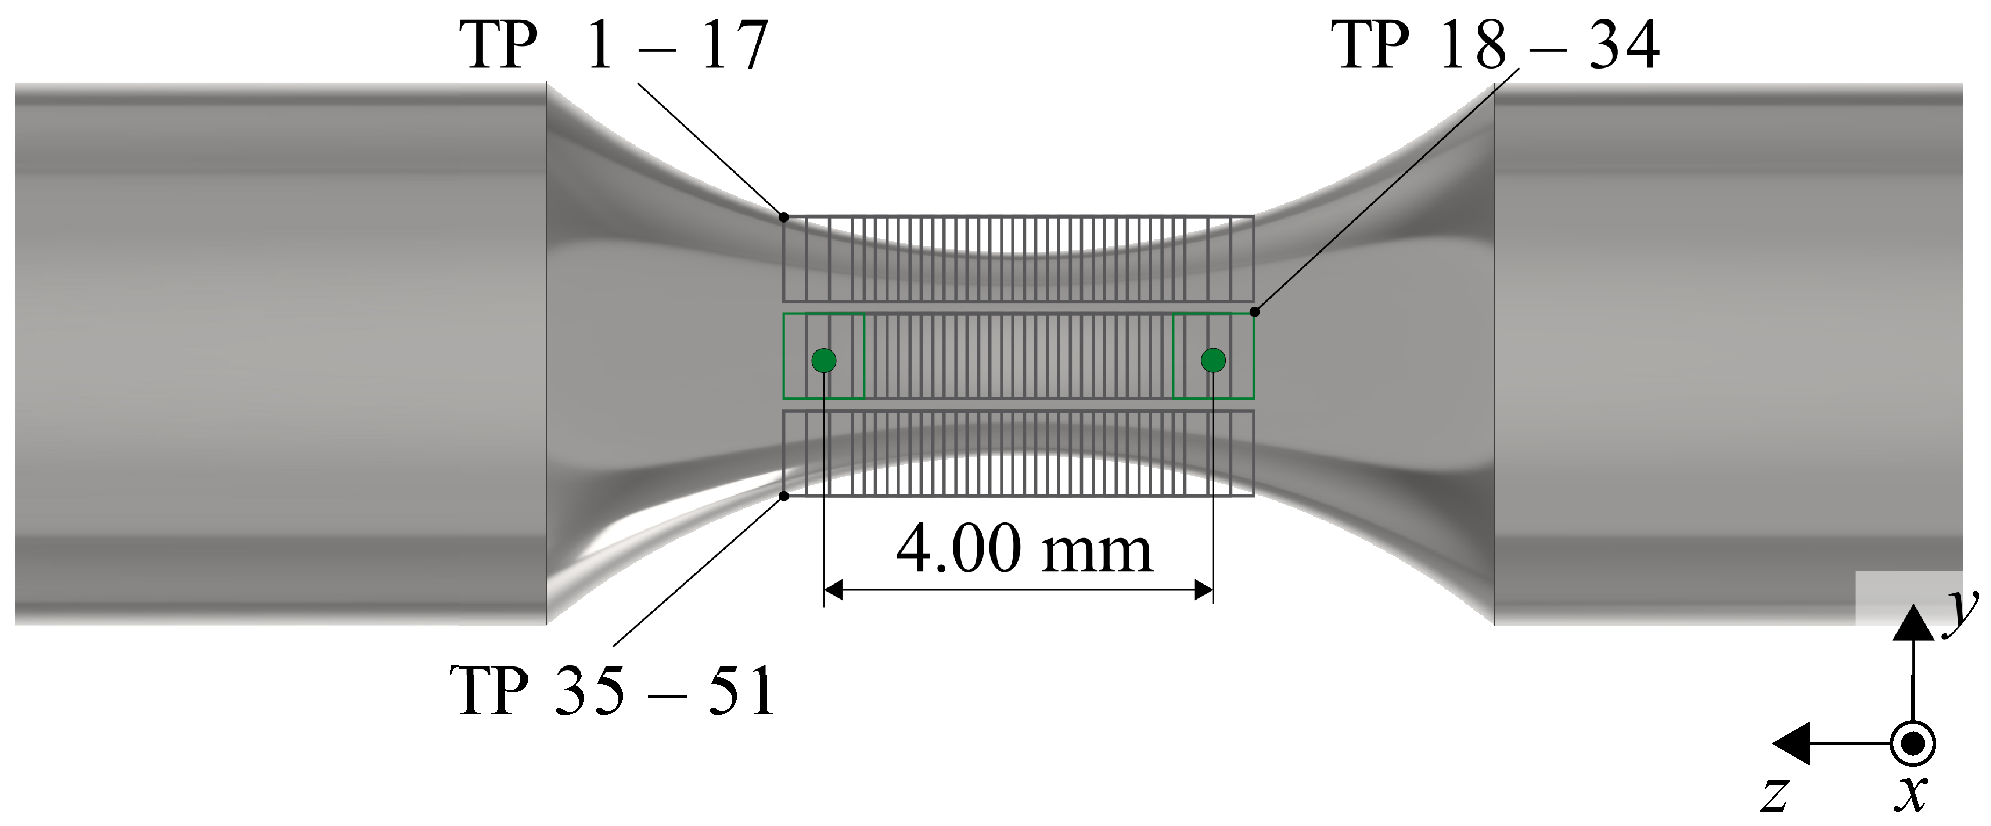
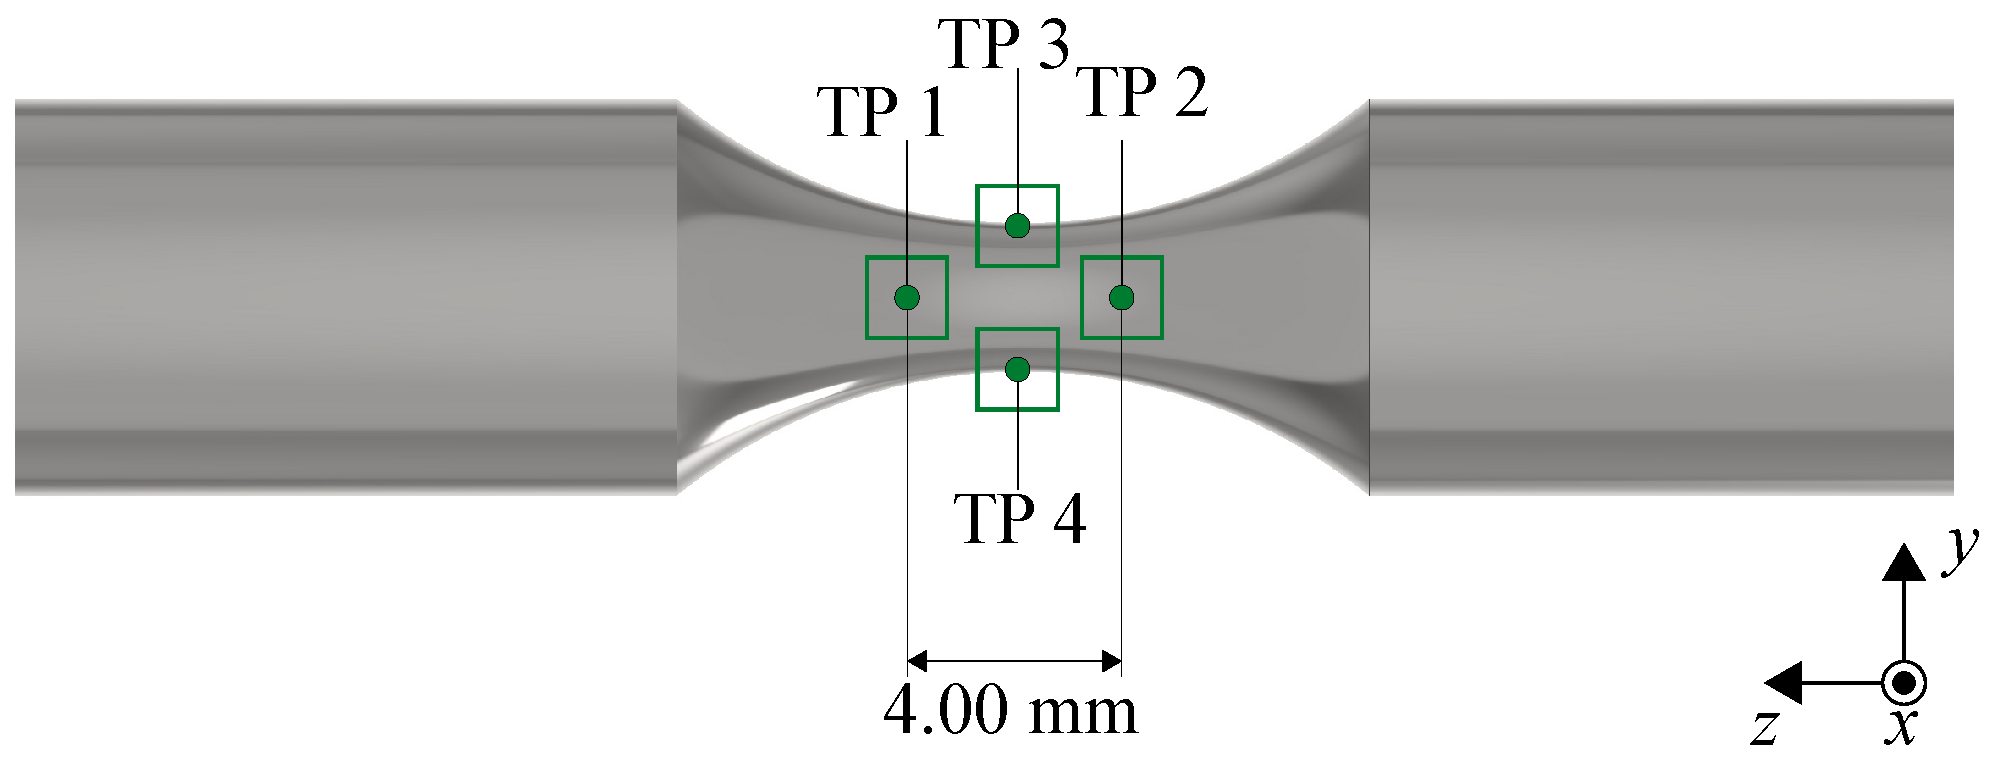
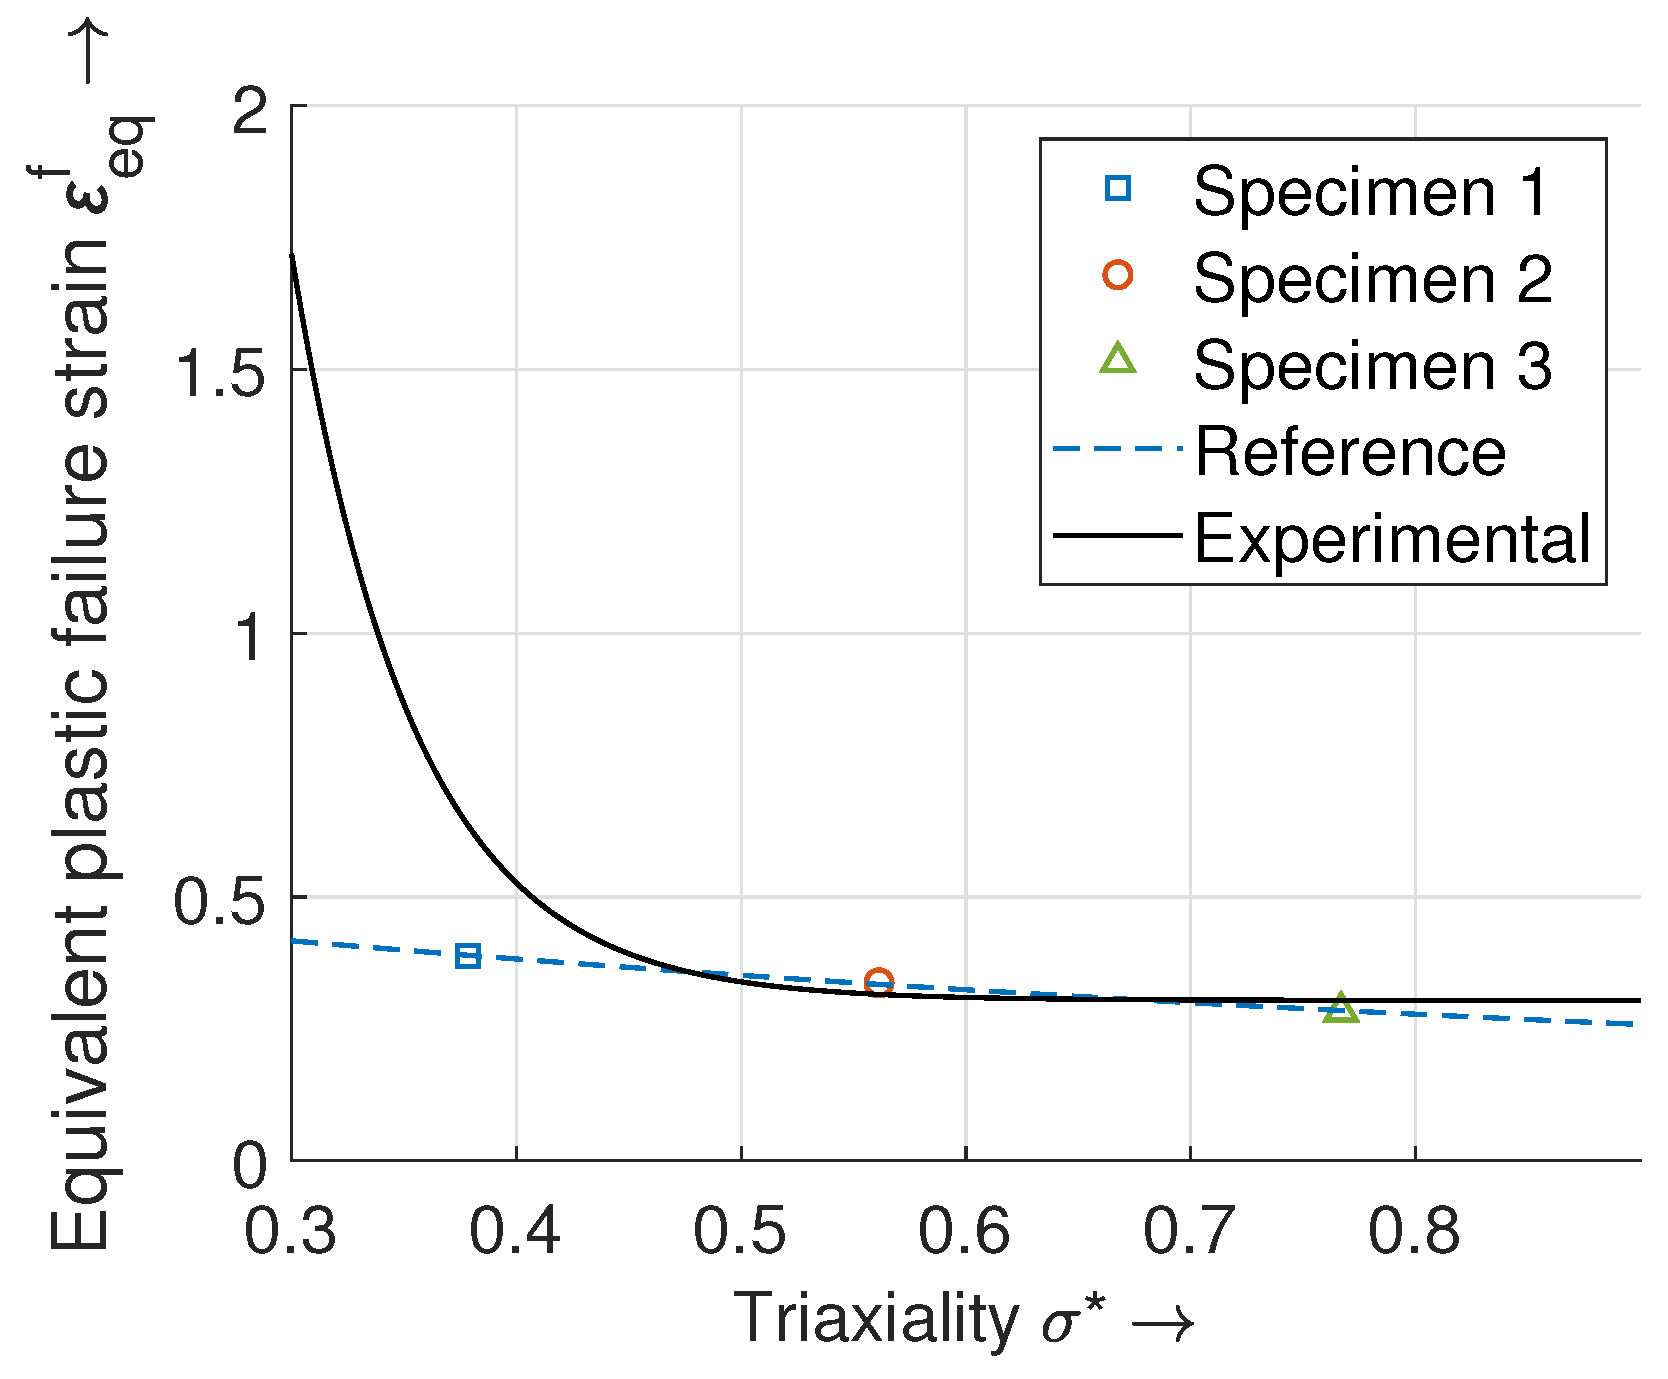
3.2.1. Determination of the Stress Triaxiality and the Equivalent Plastic Failure Strain

Data from the tensile tests conducted at a reference temperature T ref = 24.3 ° C and a reference strain rate ε ˙ 0 of 1· 10 3 s 1 served to determine the material constants ε 0 RT for the RT model and d 1 , d 2 , and d 3 for the JC model. For both models, σ * was calculated analytically based on the necking geometry of the respective specimen immediately before the failure. For this purpose, the formula from Bridgman [43], described as
σ * = 1 3 + ln r mid 2 + 2 · r mid · R c x 2 2 · r mid · R c ,
was used. The parameter r mid corresponds to the specimen radius in the middle of the neck, R c to the curvature radius of the neck, and x to the radial coordinate (see Figure 3). Since the stress triaxiality reaches its highest value in the middle of the specimen as soon as necking occurs [37], x can be set to 0.
The equivalent plastic strain was assumed to be constant across the minimum cross section:
ε eq p = 2 · ln r mid , 0 r mid
with r mid = r mid f , if ε eq f shall be determined. The parameter r mid , 0 corresponds to the initial specimen radius.
According to Choung and Cho [44], using the Bridgman equation to determine σ * and the equivalent plastic strain provides a reliable approximation if the mentioned radii are captured precisely. Consequently, different measuring methods were used, depending on the specimen type.
Specimen 1: The necking geometry was determined manually. An automatic evaluation of the necking geometry was not applicable, since for Specimen 1 the exact location of necking was not known in advance.
Images were taken with a frequency of 5 Hz during the entire tensile test, employing cameras included in the laser extensometer. The picture of the specimen immediately before failure was used for the further analysis. r mid and r mid , 0 could be determined by measuring the pixels of the picture and correlating them with an actual distance. The curvature radius was determined by fitting circles into the location of the necking with the radius R c (see Figure 3).
In the tensile tests, tracking points (TPs) along with the pattern tracking rectangles of the laser extensometer were distributed along the loading direction (see Figure 4) to enable a comparison of the results with those from Ressa [41] and a validation of the material model by means of simulations. For the latter, the stress-strain and the load-displacement curves were compared. Additionally, the distribution of the TPs was necessary because the necking location was not known in advance. The distance between the individual TPs served as a reference length to determine the strain and was set to 4 mm, as suggested by Ressa [41]. In contrast to the necking geometry, which could not be detected automatically, the distribution of the TPs allowed for an automatic measurement of the axial strain at the location of the necking. The locally increased axial strain due to the necking was automatically detected by the software (TestXpert III, ZwickRoell Group, Ulm, Germany).
Specimens 2 and 3: The tests of the remaining two specimen types were realized with a matrix TP system. The advantage is that the values for R c were easier and faster to extract by automating the evaluation process. This was only possible because the location of the necking was known in advance for these specimen types.
R c was determined by constructing a circle passing through three points along the necked curvature. A matrix of TPs was set up, where the longitudinal distance (z-direction) between the points was 0.25 mm. In the perpendicular direction, a distance of r mid , 0 was chosen. This set-up is illustrated in Figure 5. The outermost points of the second row had a distance of 4 mm, again for the determination of the longitudinal strain. The points in the first and third line track the curvature outline. Only the TPs close to the minimum cross section were used for the automated calculation of R c .

3.2.2. Determination of the Strain Rate and the Temperature-Dependent Values

In contrast to the RT model, the JC model additionally allows for a calibration of the influence of the strain rate (material constant d 4 ) and of the temperature (material constant d 5 ). Therefore, two additional test series were performed.
To calibrate the influence of the strain rate, only the geometry of Specimen 2 was used to avoid a change of the stress triaxiality compared with a defined reference. Tensile tests were conducted at a reference temperature of T ref = 24.3 ° C and at strain rates ε ˙ 0 of 1· 10 4 s 1 , 1 · 10 2 s 1 , 5 · 10 2 s 1 , and 1 · 10 1 s 1 . For each strain rate, the test routine was repeated three times.
For the temperature calibration, a temperature chamber (BTE-TC01.00, ZwickRoell Group, Germany) along with Specimen 2T was employed. This specimen type had the same properties as Specimen 2, but with a flattened clamping area (see Figure A3d in Appendix B). This modification was necessary to apply a temperature resistant mechanical clamping tool. The load-displacement curve obtained with the pneumatic clamping of Specimen 2 at a reference temperature of T ref = 24.3 ° C was compared with that of Specimen 2T measured with the temperature resistant mechanical clamping at the same reference temperature. Both load-displacement curves matched, which proved the consistency of the experiments for both clamping devices and specimen geometries.
An experiment with at least 200 ° C was necessary to cover the process temperature during the printing process, as defined by Bayerlein [27]. The process temperature is the temperature that prevails during the PBF-LB/M process in the cold area of the component. The test set-up allowed for a maximum temperature of 250 ° C . Consequently, tensile tests were conducted at a reference strain rate of ε ˙ 0 = 1 · 10 3 s 1 and at reference temperatures of 100 ° C , 150 ° C , and 250 ° C . The melting temperature T M of the processed material was assumed to be 1326.85 ° C, as this was shown by Pottlacher et al. [45] to be an appropriate value for the liquidus temperature of IN718. This constant is necessary for the subsequent curve fitting process, as stated in Equation (10). For each reference temperature level, the test routine was repeated at least three times.
In both test series, r mid and r mid , 0 were determined automatically using the TPs of the laser extensometer for an easier and a faster computation of the failure strain. For this purpose, two TPs were placed in the longitudinal direction, again with a distance of 4 mm. Two points were positioned in the lateral direction at the edges of the smallest cross section (see Figure 6). While the longitudinal points were used for the displacement and the strain measurements in the axis direction of the respective specimen, the lateral points were used to capture the values for r mid .

3.3. Simulative and Experimental Approach
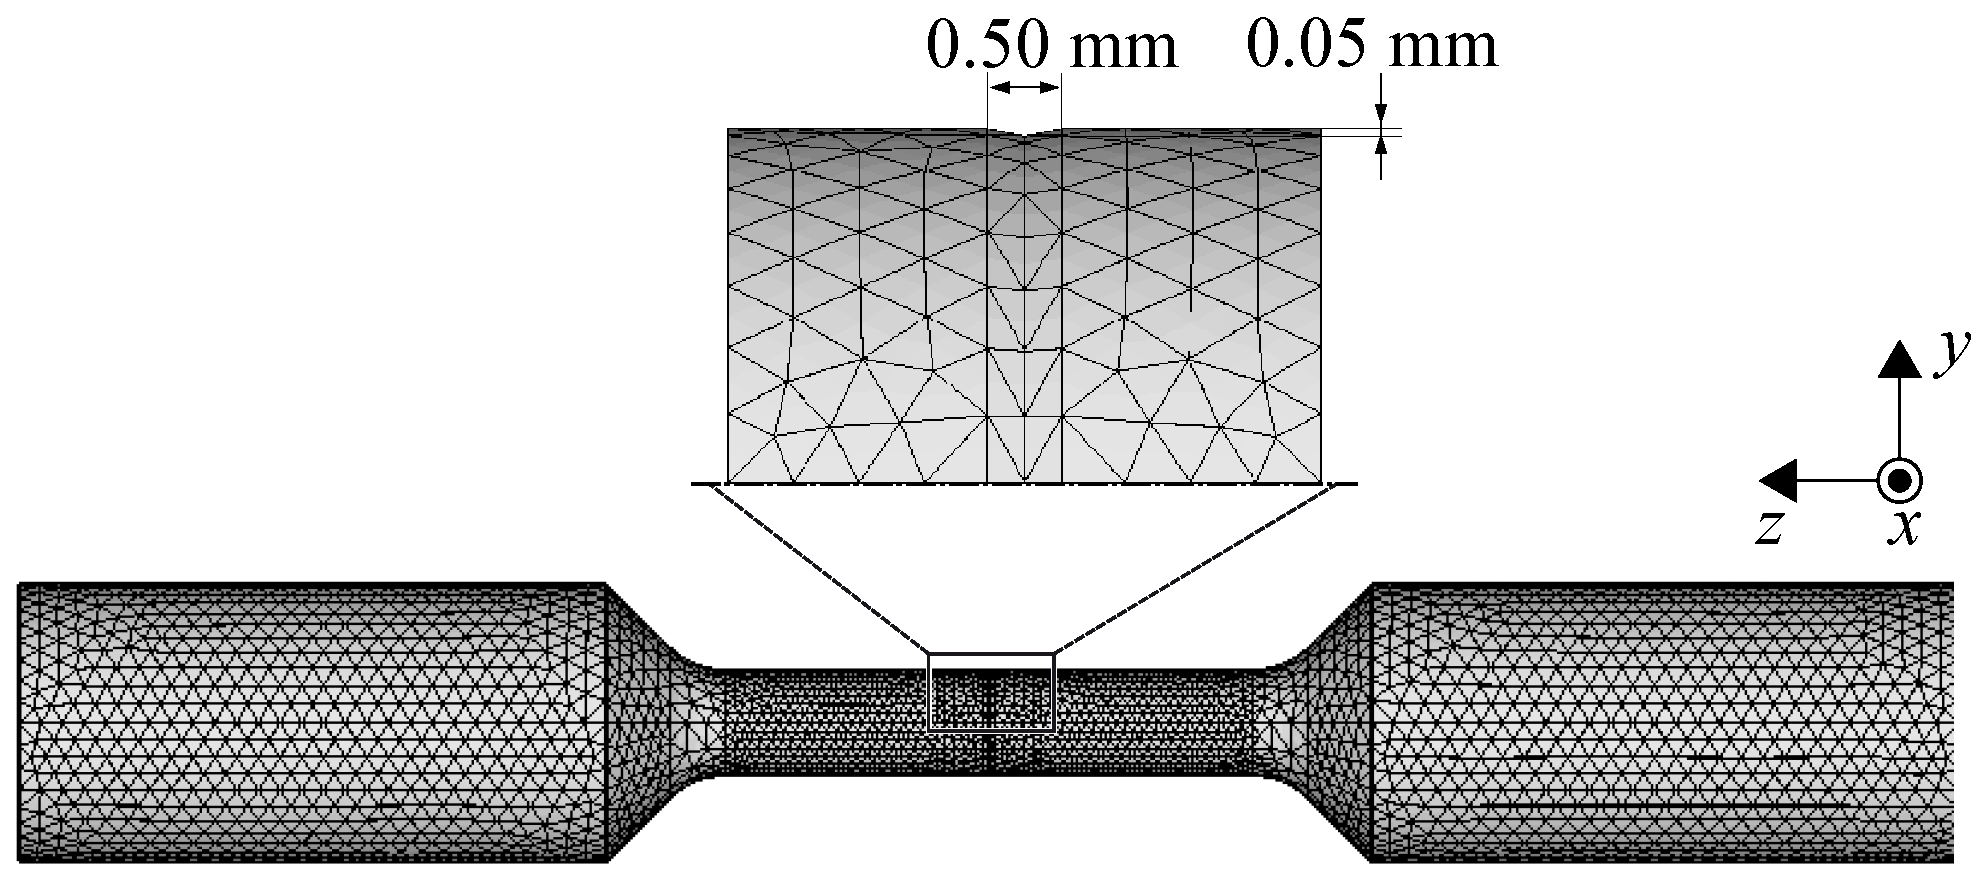
The idea behind this approach was to explicitly determine the stress triaxiality within the tensile test specimens while considering the residual stresses originating from the PBF-LB/M process. For this purpose, the entire experimental approach presented in Section 3.2, encompassing manufacturing and testing, was virtually replicated with the simulation tool AscentAM. In contrast to the standard procedure for simulating tensile tests, the complete tensile test geometries were considered. Usually, the geometry is simplified and symmetries are exploited. This has several advantages, such as reduced computation time and greater robustness due to the applicability of more realistic boundary conditions [46]. However, symmetries can only be exploited if both the geometry and the loading are symmetric, which is not the case for residual stresses induced during PBF-LB/M. These particular residual stresses vary along the building direction [27].
In the simulative and experimental approach, the three steps of meshing, simulation of the manufacturing process, and simulative tensile test were executed sequentially. These steps are comprehensively described in the following.

3.3.1. Meshing

For the meshing of the specimen geometries, meshing software (Hypermesh 2019, Altair Engineering Inc., Troy, MI, USA) was used. Convergence studies conducted in the course of this study suggested an appropriate element size of 0.5 mm in the critical region where the necking and, therefore, high non-linearities in terms of geometry as well as material occur. Outside this area, the element size was increased to 1 mm to reduce the computational costs. Due to the described non-linearities and the risk of locking effects, quadratic tetrahedral elements C3D10 were utilized.
For Specimen 1 (see Figure A3a), the location of the necking could not be predicted in advance. To realize a controlled necking during the simulative tensile tests, an imperfection with a depth of 0.05 mm and a width of 0.5 mm was inserted onto the surface (see Figure 7). The location of the necking for Specimen 2, Specimen 2T, and Specimen 3 was known beforehand. These geometries were not adapted.
For a better comparability of the simulative tensile test results, it was ensured that one node was placed at the critical location within the center of the respective part. The values for the stress triaxiality of the integration points of elements containing this node were extracted and averaged to obtain the mean value of the stress triaxiality in this area. Two nodes, each with a distance of 2 mm above and below the node in the middle, were set to have the same reference length of 4 mm as the extensometer TPs in the experimental tensile tests. Thereby, comparability between the experimental and the simulative tensile tests was ensured.

3.3.2. Simulation of the Manufacturing Process

The PBF-LB/M process simulation of the specimens was performed with the simulation tool AscentAM, which has been developed at the iwb and is based on the open source FEM program CalculiX [47]. A detailed description of the simulation tool and its predictive capabilities on residual stresses during and after PBF-LB/M can be found in Bayerlein [27]. The process simulation enabled a calculation of the residual stresses of each specimen in the as-built state.
The modeling of the melting process during the building process of the part was simplified by a flash exposure of a whole layer compound. Because of the maximum element size of 1 mm, the height of each layer compound was chosen to be 2 mm. This guaranteed that at least one node of each element contributed to the current layer.
The loosening of the build plate as well as the separation of the specimens from the plate were also simulated.

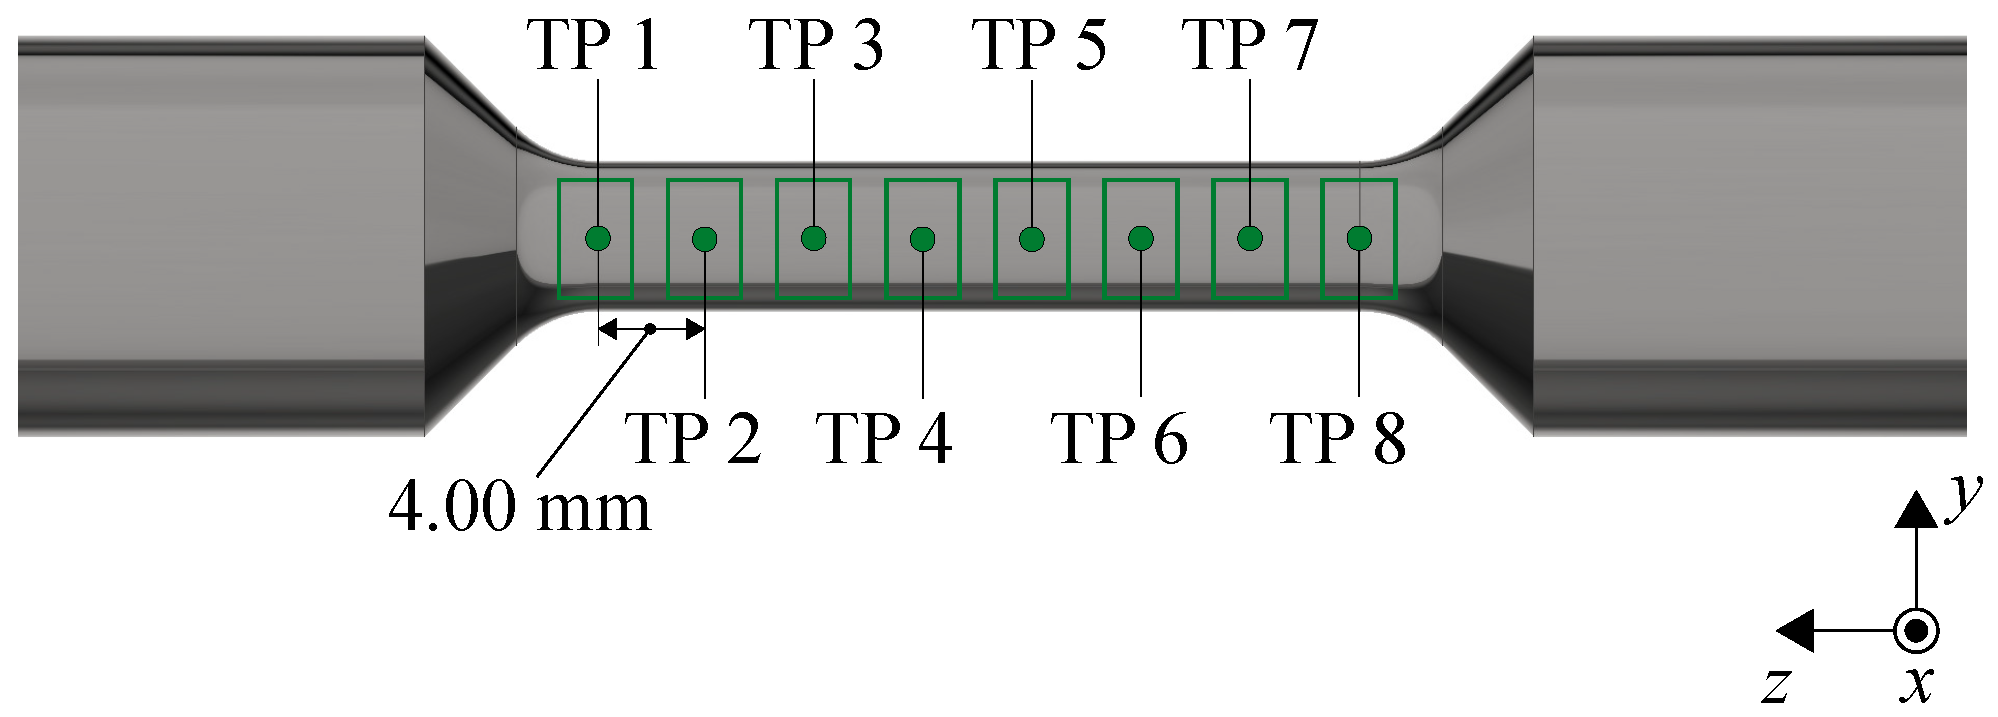
3.3.3. Simulative Tensile Tests

After the separation process, the simulative tensile tests were conducted using CalculiX. The load-displacement curves of the simulative and experimental tensile tests of the corresponding specimen geometries were compared. The simulation was terminated as soon as the displacements reached those from the experiments yielding the last data point. Thereby, the stress triaxiality as well as the equivalent plastic strain at the critical locations were evaluated. Regarding the JC model, neither a calibration of the stress rate nor a calibration of elevated temperatures was conducted by means of the simulation.
Due to a significant change of the geometry and varying stress states during the simulative tensile tests, an average stress triaxiality σ avg * was determined according to
σ avg * = 1 ε eq f · 0 ε eq f σ * · d ε eq .
In the simulation, this integral had to be approximated using a summation by
σ avg * 1 ε eq f i = 1 n σ i * · Δ ε eq , i p
with the index n describing the last strain increment leading to a failure of the structure.

3.4. AM-Adapted Approach

The goal of this calibration approach was to include the conditions during the PBF-LB/M process as realistically as possible. Similarly to the previous approach, simulations were performed to obtain accurate stress and strain values occurring in an experimental counterpart. However, this time, the PBF-LB/M process and a specifically designed specimen geometry were used to deliberately initiate a fracture.

3.4.1. AM Experiments

The specimen geometry that deliberately caused a failure during PBF-LB/M is depicted in Figure 8.
Preliminary experiments proved that the crack initiation occured as intended in the notch between the thin wall and the triangular thickening. For the calibration, it was necessary to determine the stress triaxiality and the equivalent strain for detectable cracks with a depth towards the x-direction of approximately 0.2 mm. This value was defined as the initial crack length, which means that cracks below this length were neglected.
Systematically planned experiments were conducted to find suitable dimensions of the specimen geometry that approximately caused this initial crack depth, but exhibited different triaxialities and differing equivalent failure strains. The factors Length, Thickness, and Radius, as illustrated in Figure 8, were varied. The target value of the experiments was the observed crack length in the notch of the specimen geometry.
Table 3 shows the geometrical parameters that caused the pre-defined initial crack length.
Figure 9 depicts a specimen with such a crack in the notch.

3.4.2. Meshing

Since the plastic deformation of the material in this approach was much smaller than in the case of the simulative tensile tests, linear tetrahedral elements C3D4 were used. This led to a reduction in the computation time. A mesh refinement in the critical failure areas was conducted beforehand. The boundaries of this region were set 0.3 mm above and below the notch tip, and 0.6 mm behind it. A convergence study yielded an appropriate element size in the critical region of 0.03 mm. The maximum size of the remaining elements was set to 0.5 mm. It is emphasized at this point that the mesh refinement was only performed to obtain more precise results, but it is not a prerequisite to capturing regions prone to cracking.

3.4.3. Simulation of the PBF-LB/M Process

The PBF-LB/M process of the critical geometries was replicated again by using the software tool AscentAM with a layer compound height of 1 mm for the flash exposure. The stress triaxialities and the equivalent plastic strain values in the area of the crack initiation were evaluated for each node along the notch in the y-direction. This was due to the fact that the crack extended over the complete notch width (see Figure 9).
The JC model was only calibrated on the stress triaxiality. The strain and the temperature dependency were neglected and the corresponding terms in Equation (9) were set to 1, i.e., d 4 = d 5 = 0 . The reason for this was twofold: The strain rate during the crack formation was not determined and the process parameters, such as the laser power and the scanning velocity, were not altered. Consequently, a calibration of the temperature was not possible.

4. Results and Discussion

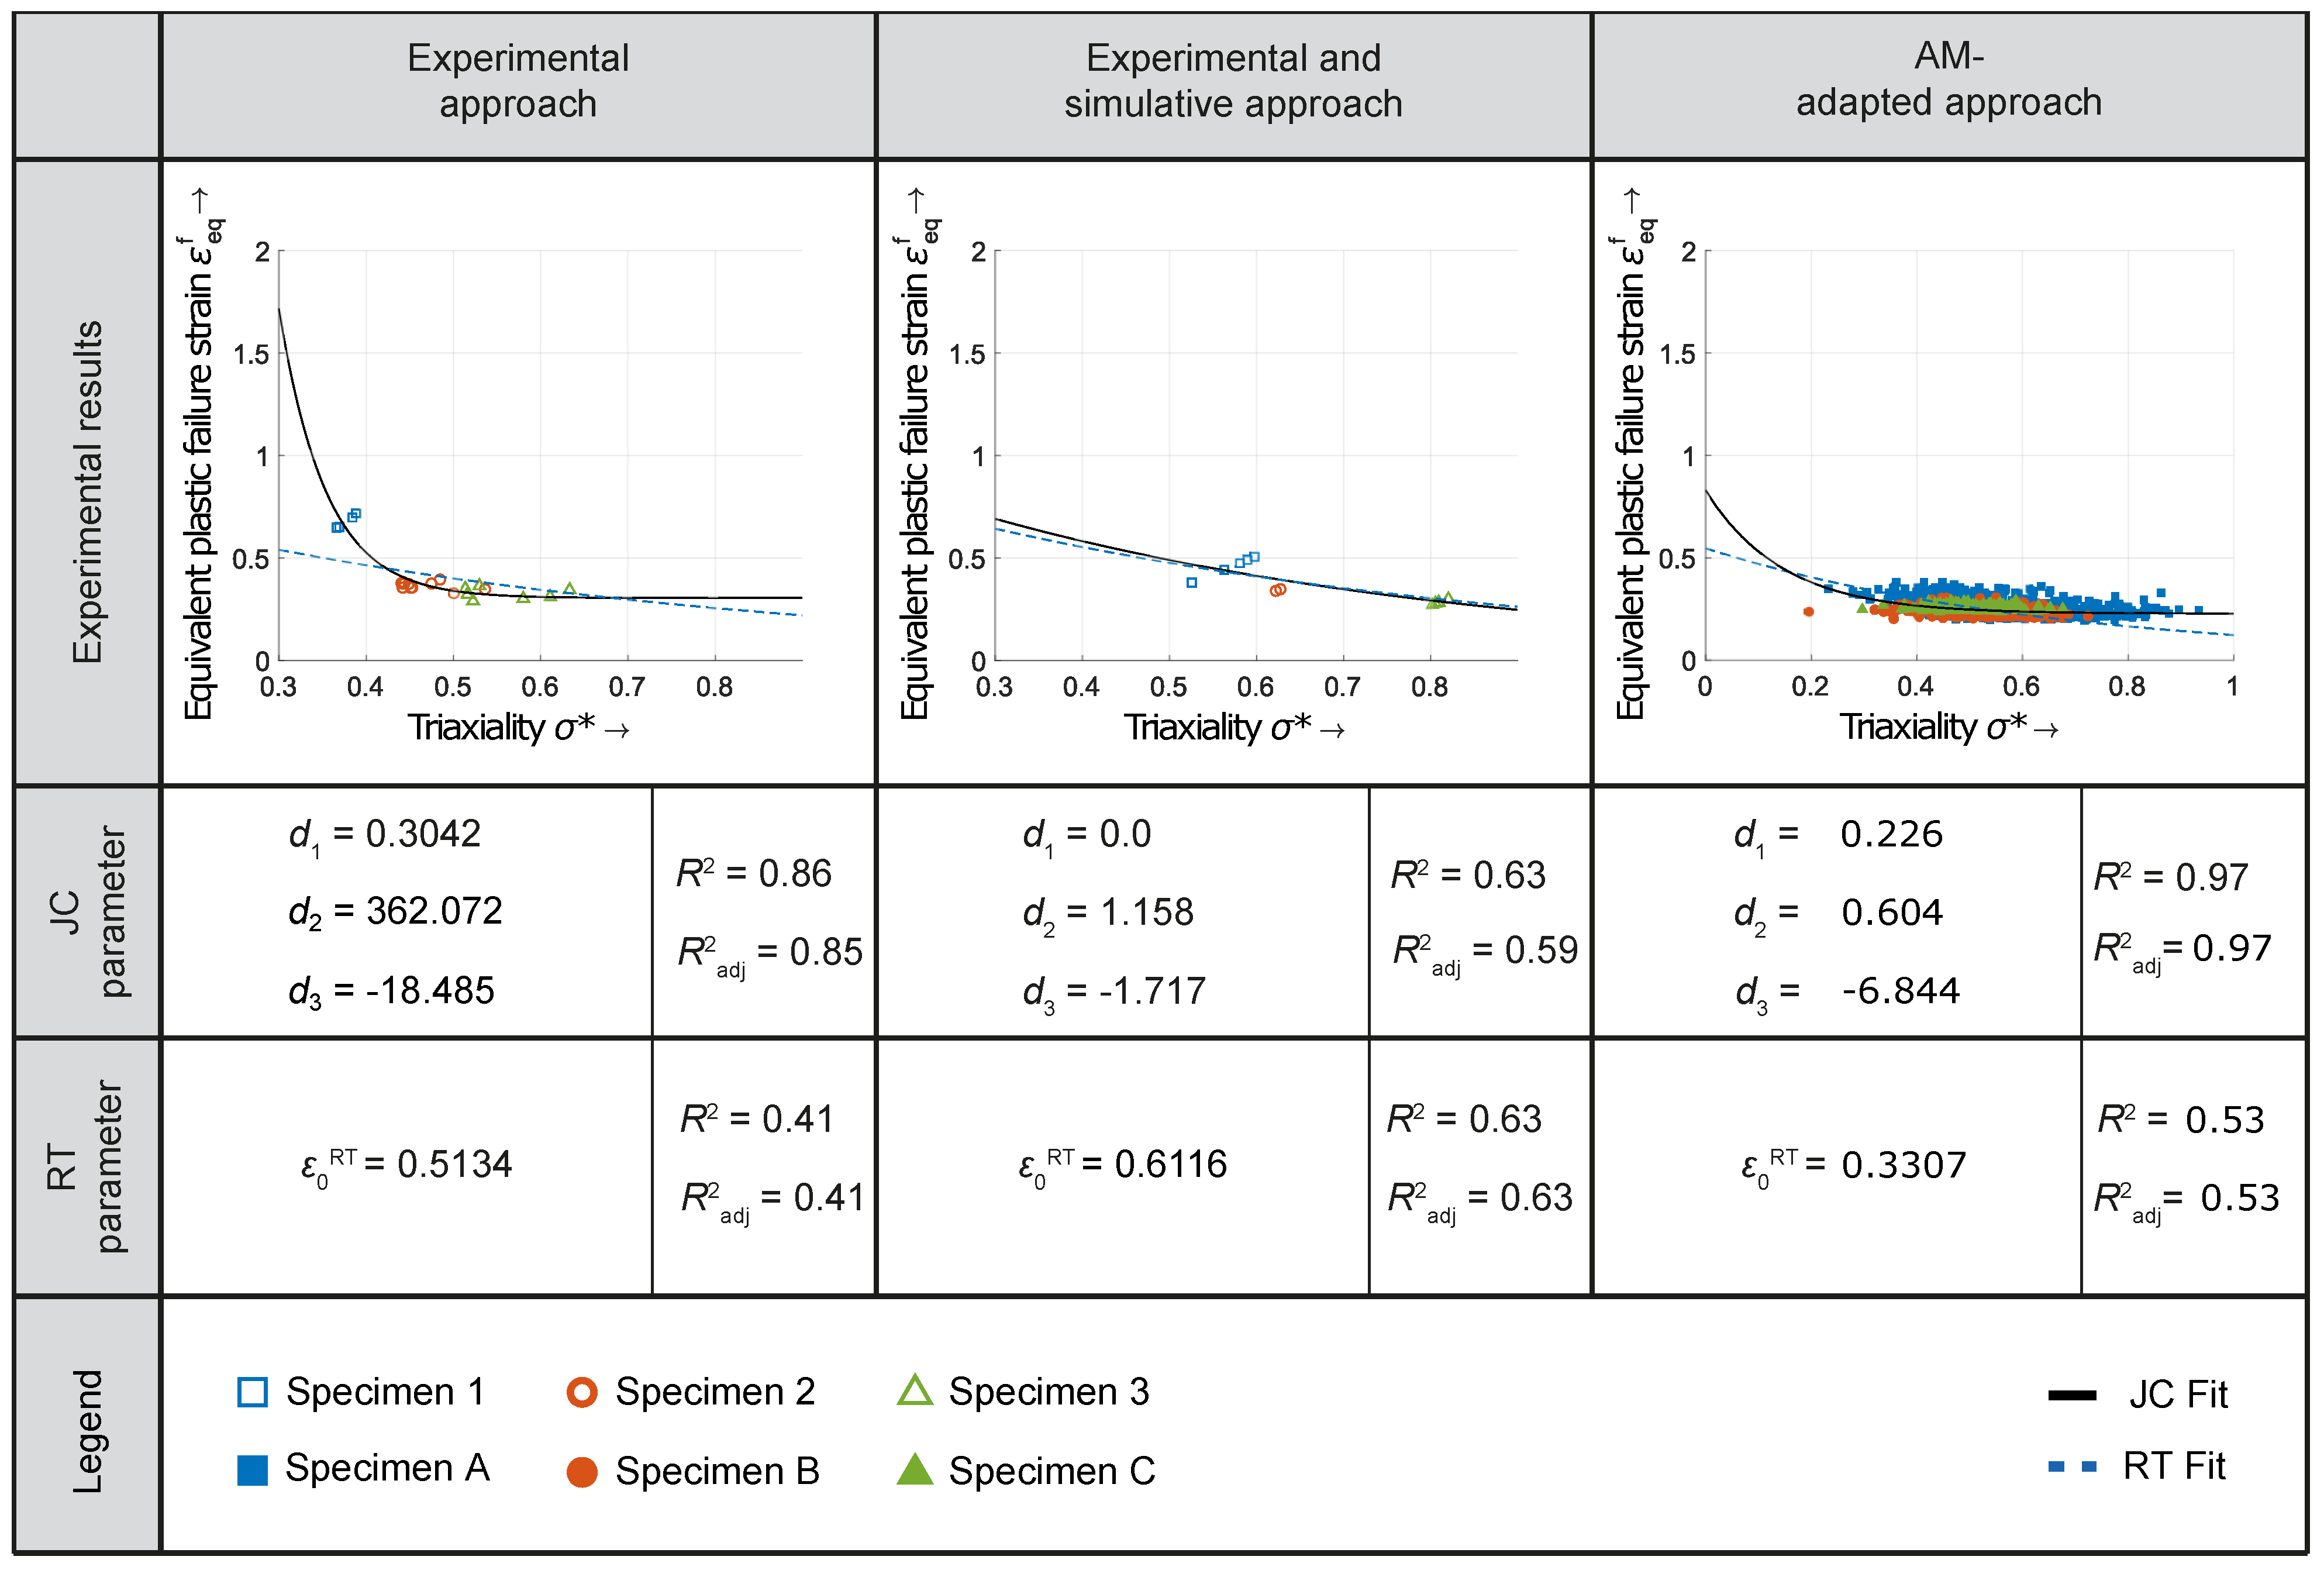
4.1. Calibration Results of the Stress Triaxiality for the RT and JC Model

Figure 10 depicts the data points, determined through the three calibration approaches, along with the fitted model curves according to Rice and Tracey [32] and Johnson and Cook [36]. For the latter, only the term describing the stress triaxiality is taken into account. In both cases, the exponential function was used to predict the failure behavior. Additionally, the fitting quality is given by the parameters R 2 and R adj 2 .

4.1.1. Description and Interpretation of the Results

In the following, the results of the calibration procedures will be described and interpreted.
Experimental approach: The scatter for the experimental approach is assumed to be due to statistical deviations originating from the parts themselves, but also from the utilized equipment, such as the tensile test machine or the laser extensometer. It can be seen that the exponential function, which is part of the JC model, captures the experimental data points without a significant gap between the fitting function and the points. The RT model, however, is not able to track the increased failure strain of Specimen 1. The data points themselves are grouped according to their stress triaxiality and can be clearly distinguished from each other. Only at a stress triaxiality between 0.5 and 0.55 can an overlap be observed. These results show that by using the suggested evaluation method to determine ε eq f and σ * , reproducible results can be obtained. At low triaxialities, the JC model predicts a highly increased failure strain and, therefore, a greater resistance against cracking. The difference between the two models is also present for high values of the stress ratio, where the curve of the RT model tends towards zero. This makes a part with a high stress triaxiality in the prediction highly prone to cracking.
Experimental and simulative approach: The values for Specimen 1 exhibited a significant scattering. This is due to the increased variations of the failure strains of the experimental tensile tests, which were used as input for the simulative tensile tests. As for the experimental approach, the results for the three individual specimen geometries are clustered, indicating a reproducible calibration procedure. Similarly to the purely experimental calibration approach, the exponential function with a negative exponent is able to capture the data points. The graphs for both models do not differ significantly, meaning that both approach zero for high triaxialities. As before, an increased susceptibility to cracking is the result.
AM-adapted approach: The reason for the scatter of the AM-adapted approach results is the significantly increased number of evaluation points, allowing for a comprehensive basis for the fitting process. Despite the wide range of the stress triaxiality of the tested specimens, the equivalent plastic failure strain does not differ significantly for the three different samples, highlighting the general applicability of the AM-adapted approach. The order of magnitude is in the same region as determined by the previously described approaches. With increasing wall thicknesses, an increased range of stress triaxialities is observable. As in the case of the experimental approach, the JC model predicts a higher cracking resistance in regions of low and high triaxialities.

4.1.2. Interpretation of the Fitting Quality

In Figure 10, it is evident that the highest fitting quality was obtained with the AM-adapted calibration approach using the JC model. For the experimental and simulative approach, both model types exhibit a comparable fitting quality. Generally, it can be stated that the fit quality of the JC failure model was always equal to or better than that of the RT model.
A low value of R 2 means that the model utilized to predict the failure strain does not exhibit significantly improved results compared with a constant function, represented by d 1 in the case of the JC model. The RT model does not account for a constant term, which results in the observed lower R 2 values. The curvature, described by the data points, is captured by the JC model by the term containing d 2 and d 3 in Equation (9). The RT model, not allowing for such a readjustment, is limited in this regard, which also explains the mostly reduced fitting quality. The fact that the R 2 and R adj 2 values for all models with their corresponding calibration approach did not differ significantly from each other implies that most of the data points used for the fitting process contribute to the fit of the model.
It is to be emphasized that the fit quality R 2 only reflects the quality of the curve of the fit to the experimental data. That does not necessarily correspond to the physical accuracy of the models, concerning their capability of correctly predicting stress-induced crack formation during the PBF-LB/M process.

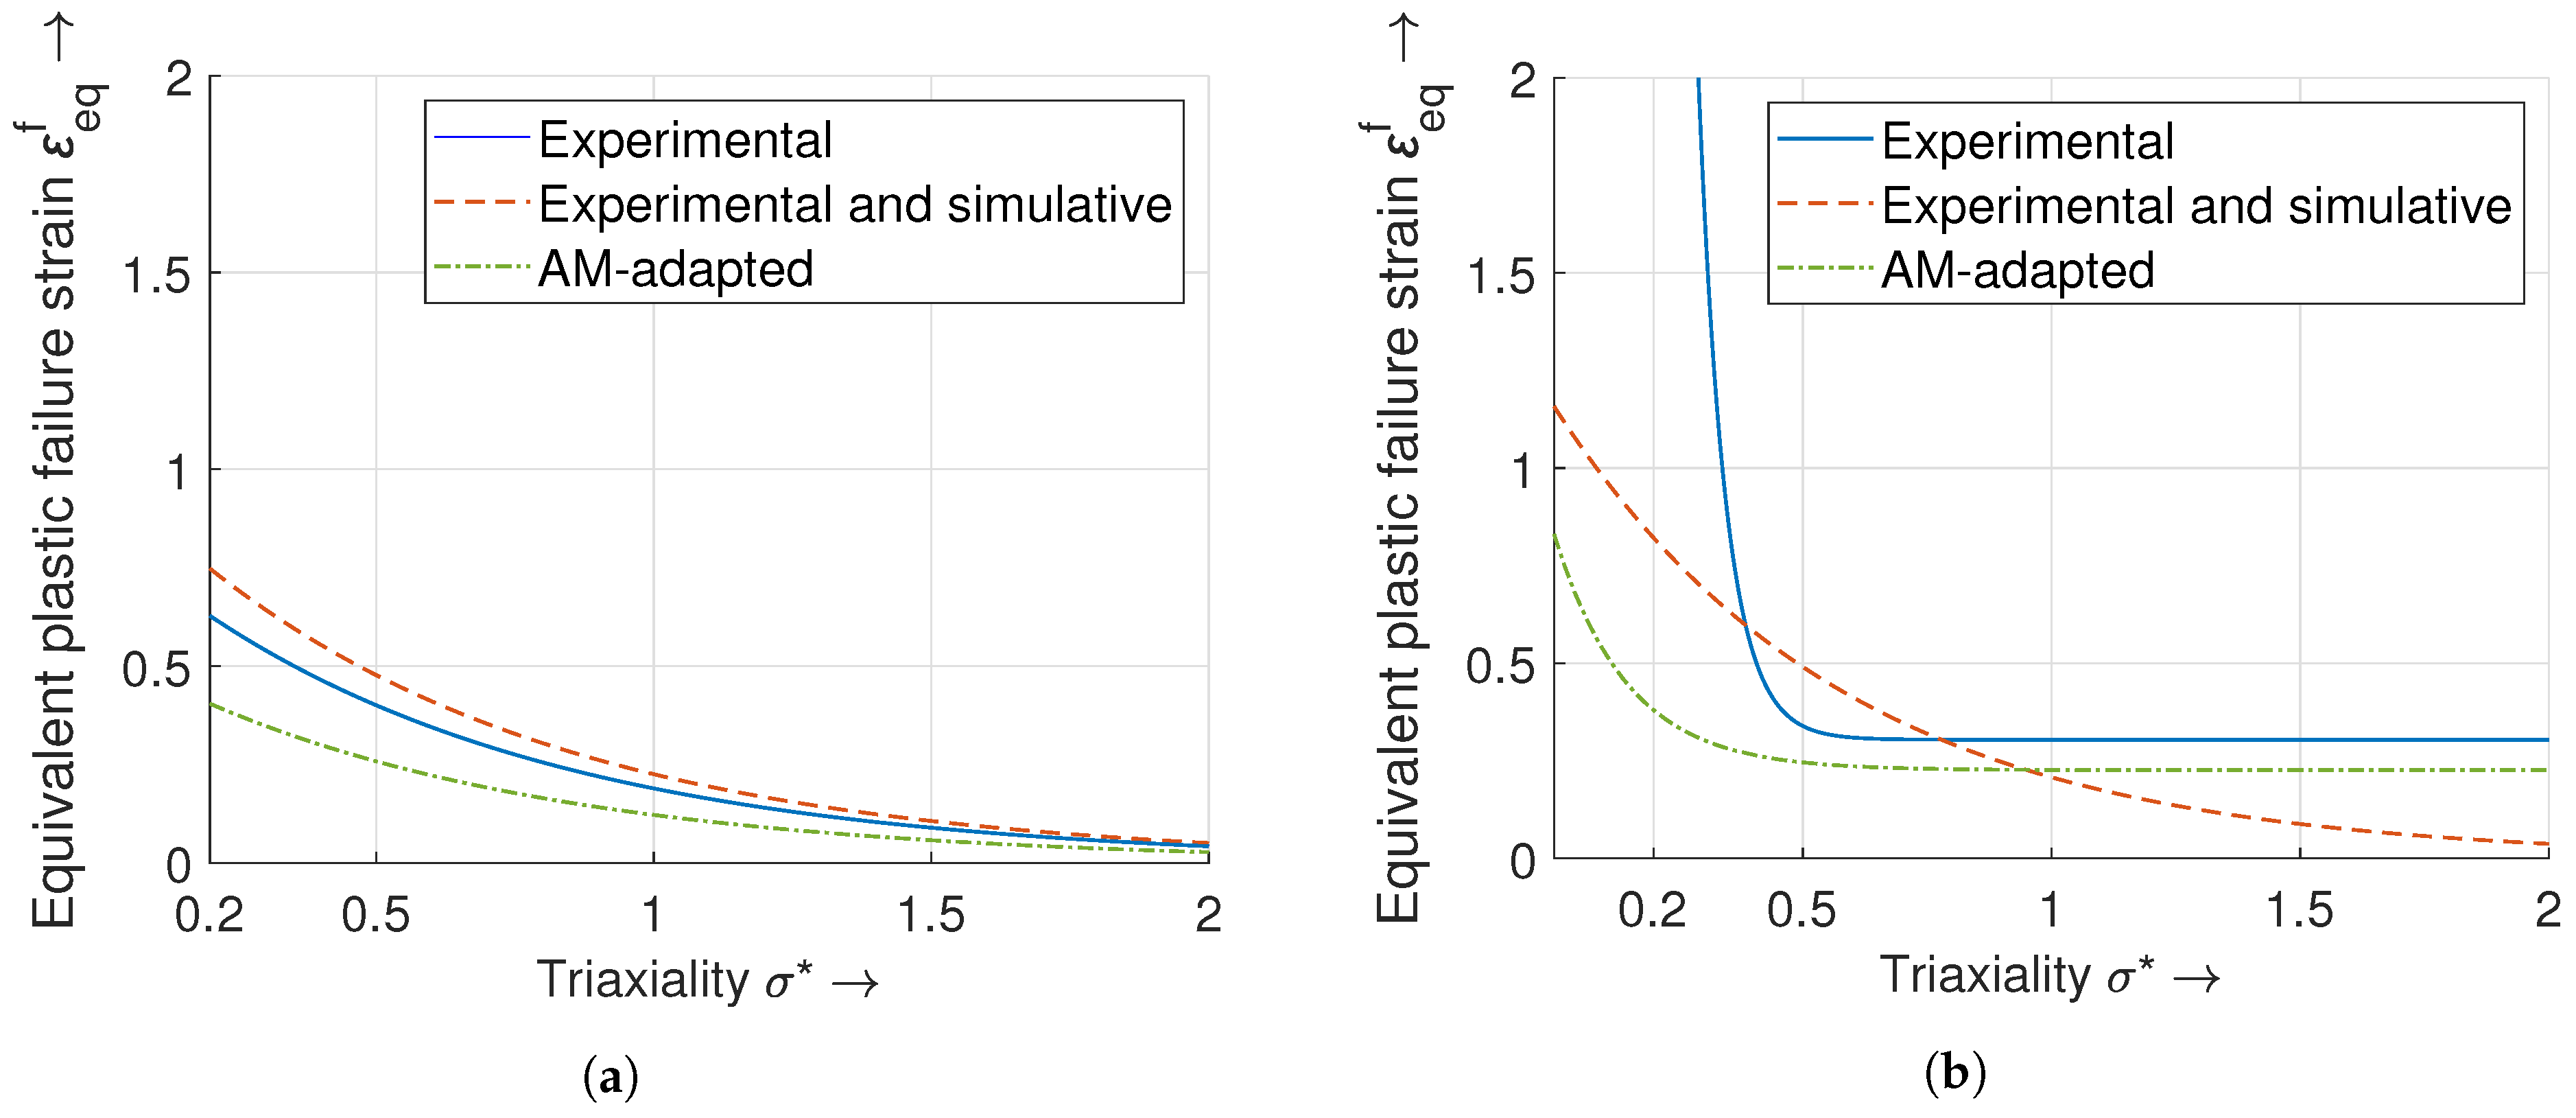
4.1.3. Comparison of the Failure Models

Rice-Tracey model: Figure 11a illustrates the calibration results for the RT model for all three calibration approaches. The fact that the resulting functions for the experimental approach as well as for the experimental and simulative approach do not overlap, even though the concept is the same, is due to the residual stresses. These were considered in the combined experimental and simulative approach, but not by the purely experimental one. Also, the evaluation procedures differed significantly: While semi-empirical formulas were used when analyzing the experiments, integration points and nodal values were assessed in the numerical simulations.
Especially due to the consideration of the residual stresses in the experimental and simulative approach, an overlap with the function of the purely experimental approach was not even to be expected. The lower equivalent plastic failure strain for the AM-adapted approach function compared with the experimental and simulative approach is due to a wider spread of data points with regard to the stress triaxiality, leading to a stretch of the graph in the abscissa direction. The difference of the calibration method results decreases with an increasing stress triaxiality.
Johnson-Cook model: Figure 11b reveals significant differences between the JC model approaches. While the experimental approach and the AM-adapted approach show a nearly constant curve shape at triaxialities greater than 0.6, the equivalent plastic failure strain in the experimental and simulative approach falls strictly monotonically. This is due to the fact that at increased values of the stress ratio, the exponential term of Equation (9) tends towards zero, considering only the term for the stress triaxiality. This eliminates the influence of the material constants d 2 and d 3 , leaving behind only the constant value d 1 . With the experimental and simulative approach, the smallest equivalent plastic failure strain of 0.0 is obtained, giving reason to expect an earlier failure of a specimen at a high stress triaxiality. All graphs show a strong increase of the failure strain with decreasing stress triaxiality. The increase of the AM-adapted approach occurs at the lowest stress triaxiality. Therefore, objects with a low value of this stress ratio are more susceptible to cracking. In addition, the AM-adapted approach with its low d 1 predicts a continuously earlier failure than the experimental approach with a higher d 1 .

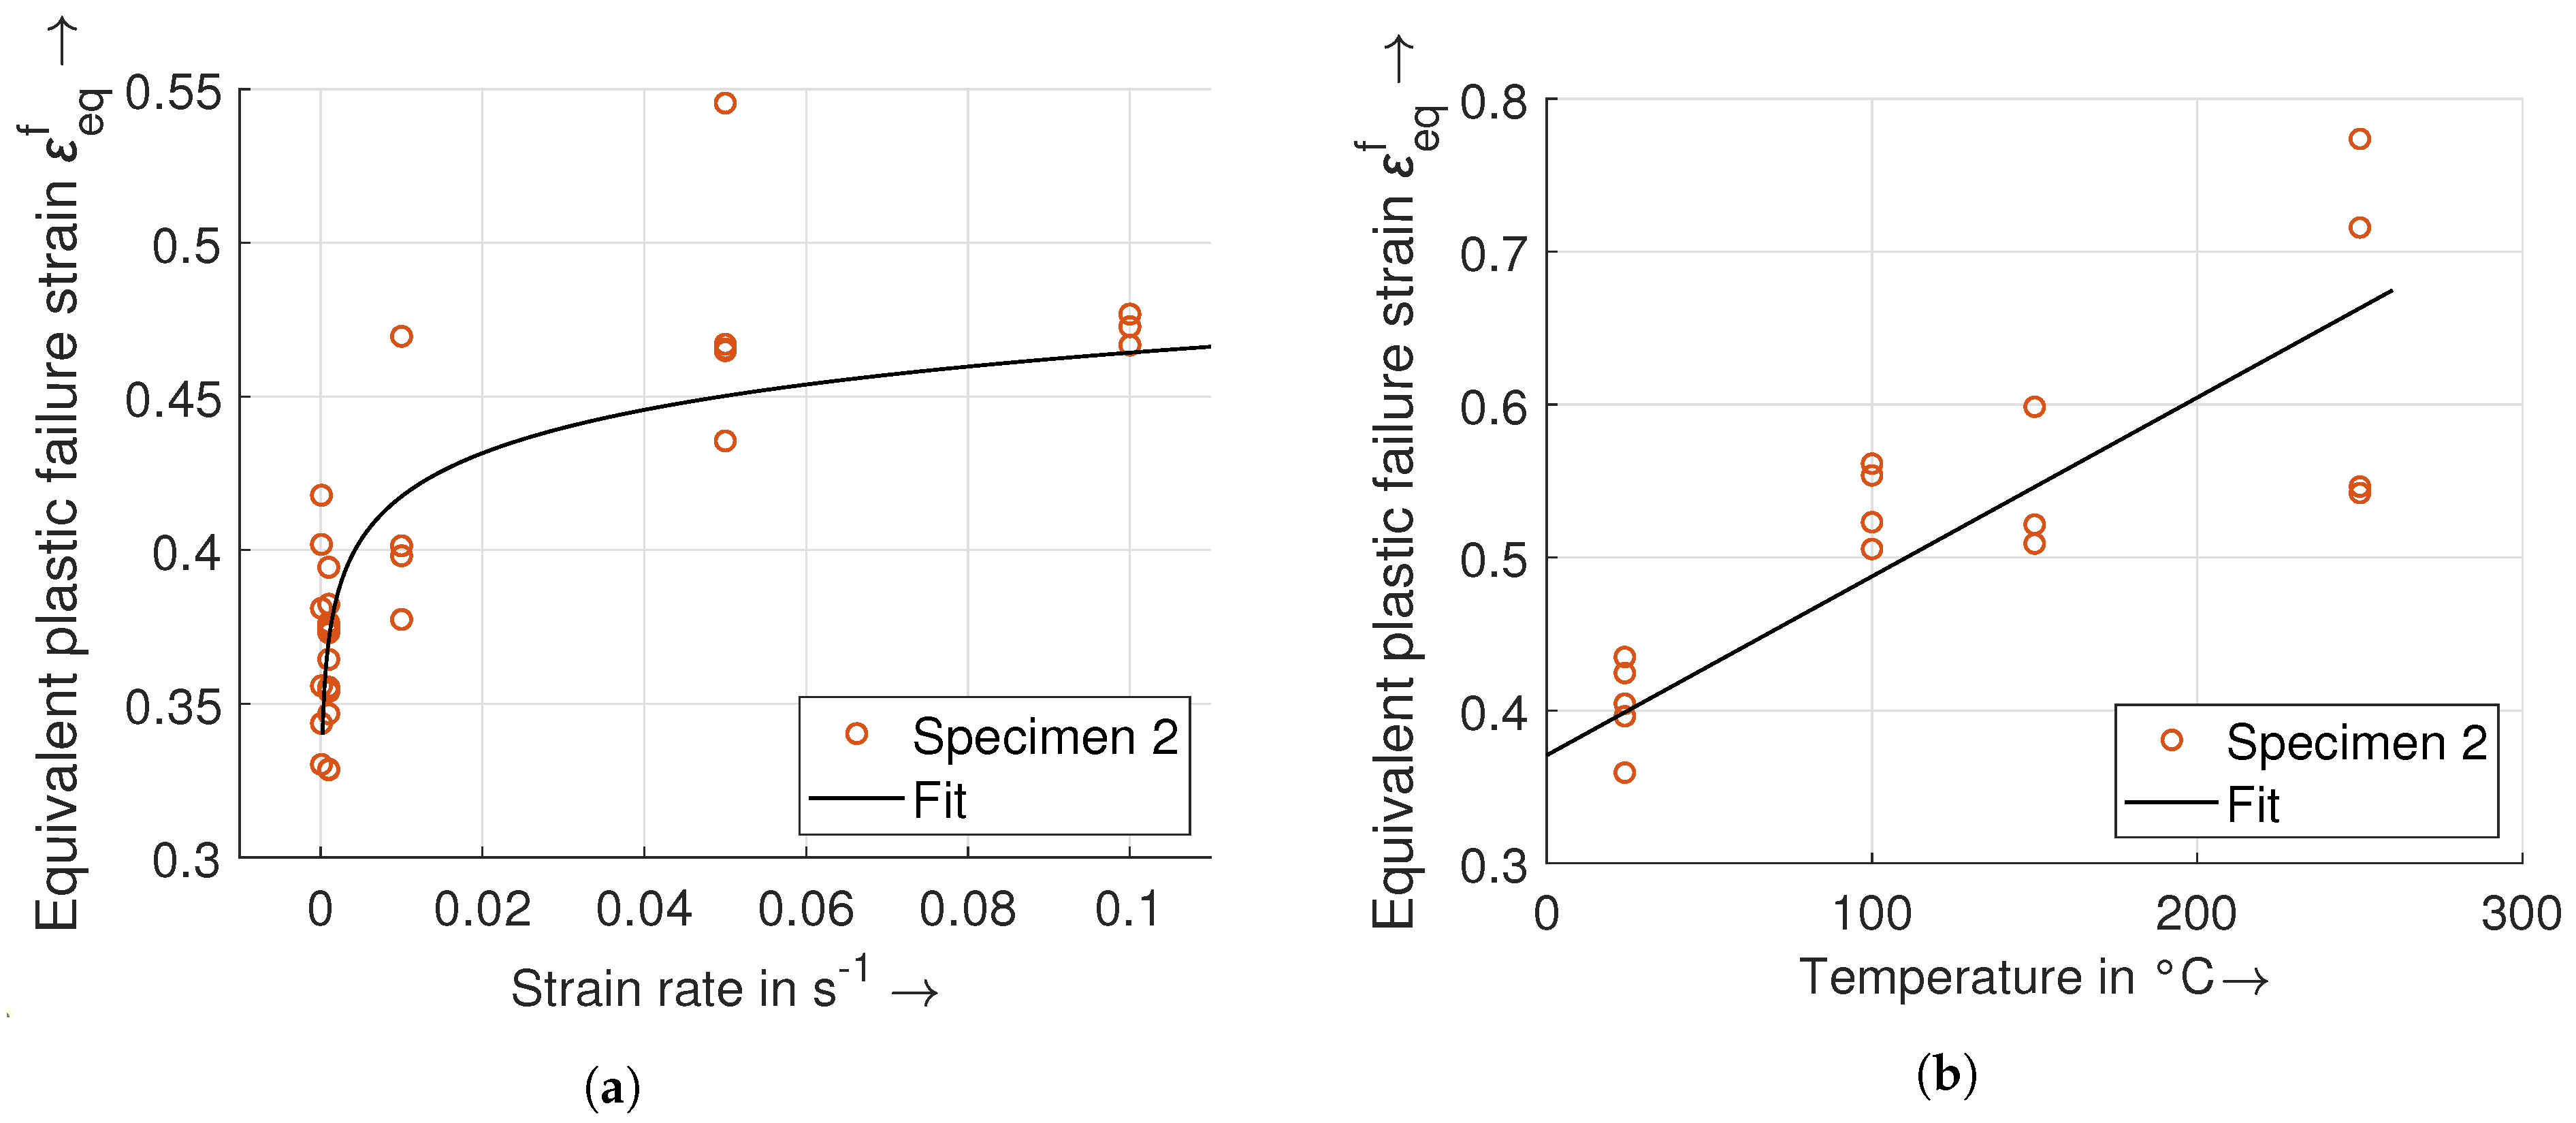
4.2. Calibration Results of the Strain Rate and the Temperature of the JC Model

In contrast to the RT model, the JC model contains two material constants ( d 4 and d 5 ) that account for the strain rate and temperature dependency of the equivalent plastic failure strain. Both parameters were calibrated by using experimental data, yielding
  • d 4 = 0.0465 and d 5 = 4.2307.
Regarding the quality of the fit, both R 2 and R adj 2 for the strain rate reached a value of 0.59. For the fitting of the temperature, the values corresponded to 0.62. The fitted curves and the experimental data for the strain rate and temperature calibration are shown in Figure 12a and Figure 12b, respectively.
As opposed to the stress triaxiality, the JC failure model suggests a natural logarithm and a linear function to describe the strain rate and temperature behavior, respectively. Both graphs correspond to the distribution of the data points obtained by the experimental calibration approach. With regard to Figure 12a, at a strain rate of 0.01 s 1 and 0.05 s 1 , each time one data point is off the tendency with a failure strain of approximately 0.47 and 0.545. Since it is always only one point, both were considered as experimental outliers. The linear dependence of the failure strain on the temperature is apparent.

4.3. Comparison with the Literature

The tensile test specimens for the calibration process are based on Liutkus [42] and Ressa [41]. The reason for this selection was to allow a comparison of the obtained results with those from the literature and to determine if the material constants of conventional IN718 for the failure models can be used for additively manufactured parts of the same material.

4.3.1. Material Behavior

The stress-strain diagrams for the three different tensile test specimens considered for this paper were compared to those of the reference from Ressa [41] (see Appendix C). A significantly reduced yield strength and ultimate tensile strength with an increased failure strain of the PBF-LB/M parts compared with the respective conventionally manufactured specimens could be seen.
Comparable observations in this regard could also be made earlier, as shown by Wang et al. [48] and Strößner et al. [49].

4.3.2. Calibration Results

The mean value of the experimental results for each stress triaxiality from reference [41] along with a graph of the JC model calibrated according to the experimental approach for the three tensile test specimens is depicted in Figure 13. It is evident that the failure behavior of Specimen 2 and Specimen 3 can be predicted well with the JC model of this paper. Specimen 1 of the reference exhibits a significantly lower equivalent plastic failure strain as predicted with the fitting for the additively manufactured part. A reason for this varying behavior is the previously described differing material characteristics of conventional and AM material (see Figure A4). The increased failure strains of the additively manufactured parts in the stress-strain diagram give reason to expect a higher equivalent plastic failure strain. The examination methods also have to be taken into account. To obtain the values for the stress triaxiality of the different specimens, Liutkus [42] performed FEM simulations, for which a maximum principal strain based criterion was applied to determine the point of fracture. The failure strain was always assumed to be 0.25. Ressa [41] calculated the equivalent plastic failure strain in the experimental tensile tests using digital image correlation and, therefore, did not use the semi-empirical Bridgman equation. The material constants with the results from the reference corresponded to
  • d 1 = 0.0988, d 2 = 0.4493, and d 3 = 1.1492 .

5. Conclusions and Outlook

In this study, two strain-based failure models from the literature were investigated with regard to PBF-LB/M and were calibrated for the material IN718 utilizing three different calibration approaches. These can be divided into an experimental, a simulative and experimental, and an AM-adapted approach. The first two approaches were calibrated with the aim of predicting residual stress-induced failure for the first time. The third approach is a novel method specifically designed for the PBF-LB/M process, considering the actual loading cycles during the manufacturing process.
The following conclusions can be drawn:
  • The ductile behavior of additively manufactured IN718 parts provides a justification for the use of strain-based failure criteria;
  • Due to the simplicity of the models, no significant increase in the computational costs for the simulation of the building process is to be expected;
  • The three calibration approaches show pronounced differences with regard to the fitting curves, which is especially the case for the JC model, suggesting differing predictive capabilities regarding cracking behavior;
  • Significant differences of the calibration results were observed for the additively manufactured IN718 specimens compared with the conventional specimens from the literature at low triaxialities;
  • The calibration process of the proposed failure models proved to require less effort compared with that of the GTN model due to a reduced number of calibration constants.
The long-term goal of the authors’ research efforts is to predict a stress-induced crack formation within structural parts during the PBF-LB/M process prior to manufacturing. Future work includes the implementation of the failure models in the AscentAM tool. The obtained material constants of this publication will serve as an input. A damage indicator making use of the results of the failure models will be realized to take the damage accumulation during the build process into account. The calibrated and implemented modeling approaches will be validated and compared with regard to their suitability to predicting local and global failure during the PBF-LB/M process.
The proposed method may also be applied to predicting crack formation between the manufactured part and the support structure if the models are calibrated accordingly. Also, the proposed models and calibration approaches may be applicable to predicting stress-induced fracture during PBF-LB/M for any process parameter set and in any material exhibiting a ductile behavior, particularly metals and alloys.

Author Contributions

Conceptualization, H.P. and D.W.; formal analysis, H.P. and D.W.; investigation, H.P. and D.W.; methodology, H.P. and D.W.; software, H.P.; validation, H.P.; visualization, H.P., D.W. and A.B.; writing–original draft, H.P. and D.W.; writing–review and editing, A.B. and M.F.Z.; funding acquisition, M.F.Z.; resources, M.F.Z.; supervision, M.F.Z. All authors have read and agreed to the published version of the manuscript.

Funding

This research received no external funding.

Data Availability Statement

The data presented in this study are available on request from the corresponding author.

Conflicts of Interest

The authors declare no conflict of interest.

Abbreviations

The following abbreviations are used in this manuscript:
AMAdditive Manufacturing
FEMFinite Element Method
GTNGurson-Tvergaard-Needleman
IN718Inconel 718
iwbInstitute for Machine Tools and Industrial Management
JCJohnson-Cook
PBF-LB/MPowder Bed Fusion of Metals using a Laser Beam
RTRice-Tracey
TPTracking Point

Appendix A. Material and Failure Characterization

In Figure A1, the similarity between the macroscopic cone fracture geometry of a cracked axisymmetric specimen from the tensile tests and a typical fracture geometry of a ductile material from the literature is evident. The same holds for the cup geometry.
Figure A1. Comparison of fracture geometries for axisymmetric specimens; left: typical result for ductile materials based on Anderson [50]; right: result for the analyzed additively manufactured specimens.
Jmmp 07 00208 g0a1
Characteristic of a ductile fracture is the rough surface in the center of the samples, followed by a 45 ° angled wedge, leading to the final rupture due to shear stresses. In Figure A2a, the surface characteristics described can be seen in a ground and polished longitudinal section of a fractured tensile test specimen, which was examined using an incident light microscope (MM40, Nikon, Japan). The rough surface is highlighted by a box.
Figure A2. Cone fracture geometries of ductile axisymmetric specimens; (a) cone fracture geometry of a fractured tensile test specimen (the black box indicates the pores leading to a failure); (b) SEM image of a fracture surface (the back box highlights a detrimental pore, from which a crack originates).
Jmmp 07 00208 g0a2
Crack initiation occurs in the center, with the mechanisms of void formation, growth, and coalescence leading to this coarse surface [50]. This area has been investigated with a Scanning Electron Microscope (SEM), (JSM-IT200 InTouchScope, JEOL Ltd., Tokyo, Japan), as shown in Figure A2b. The working distance was 12.6 mm and the acceleration voltage corresponded to 15.0 kV. The examined specimen showed the mentioned crater-like topology, which is a result of a pore formation due to inclusions and second phase particles. In addition, cracks were found, which originated from large pores (highlighted by the box), indicating a ductile fracture.

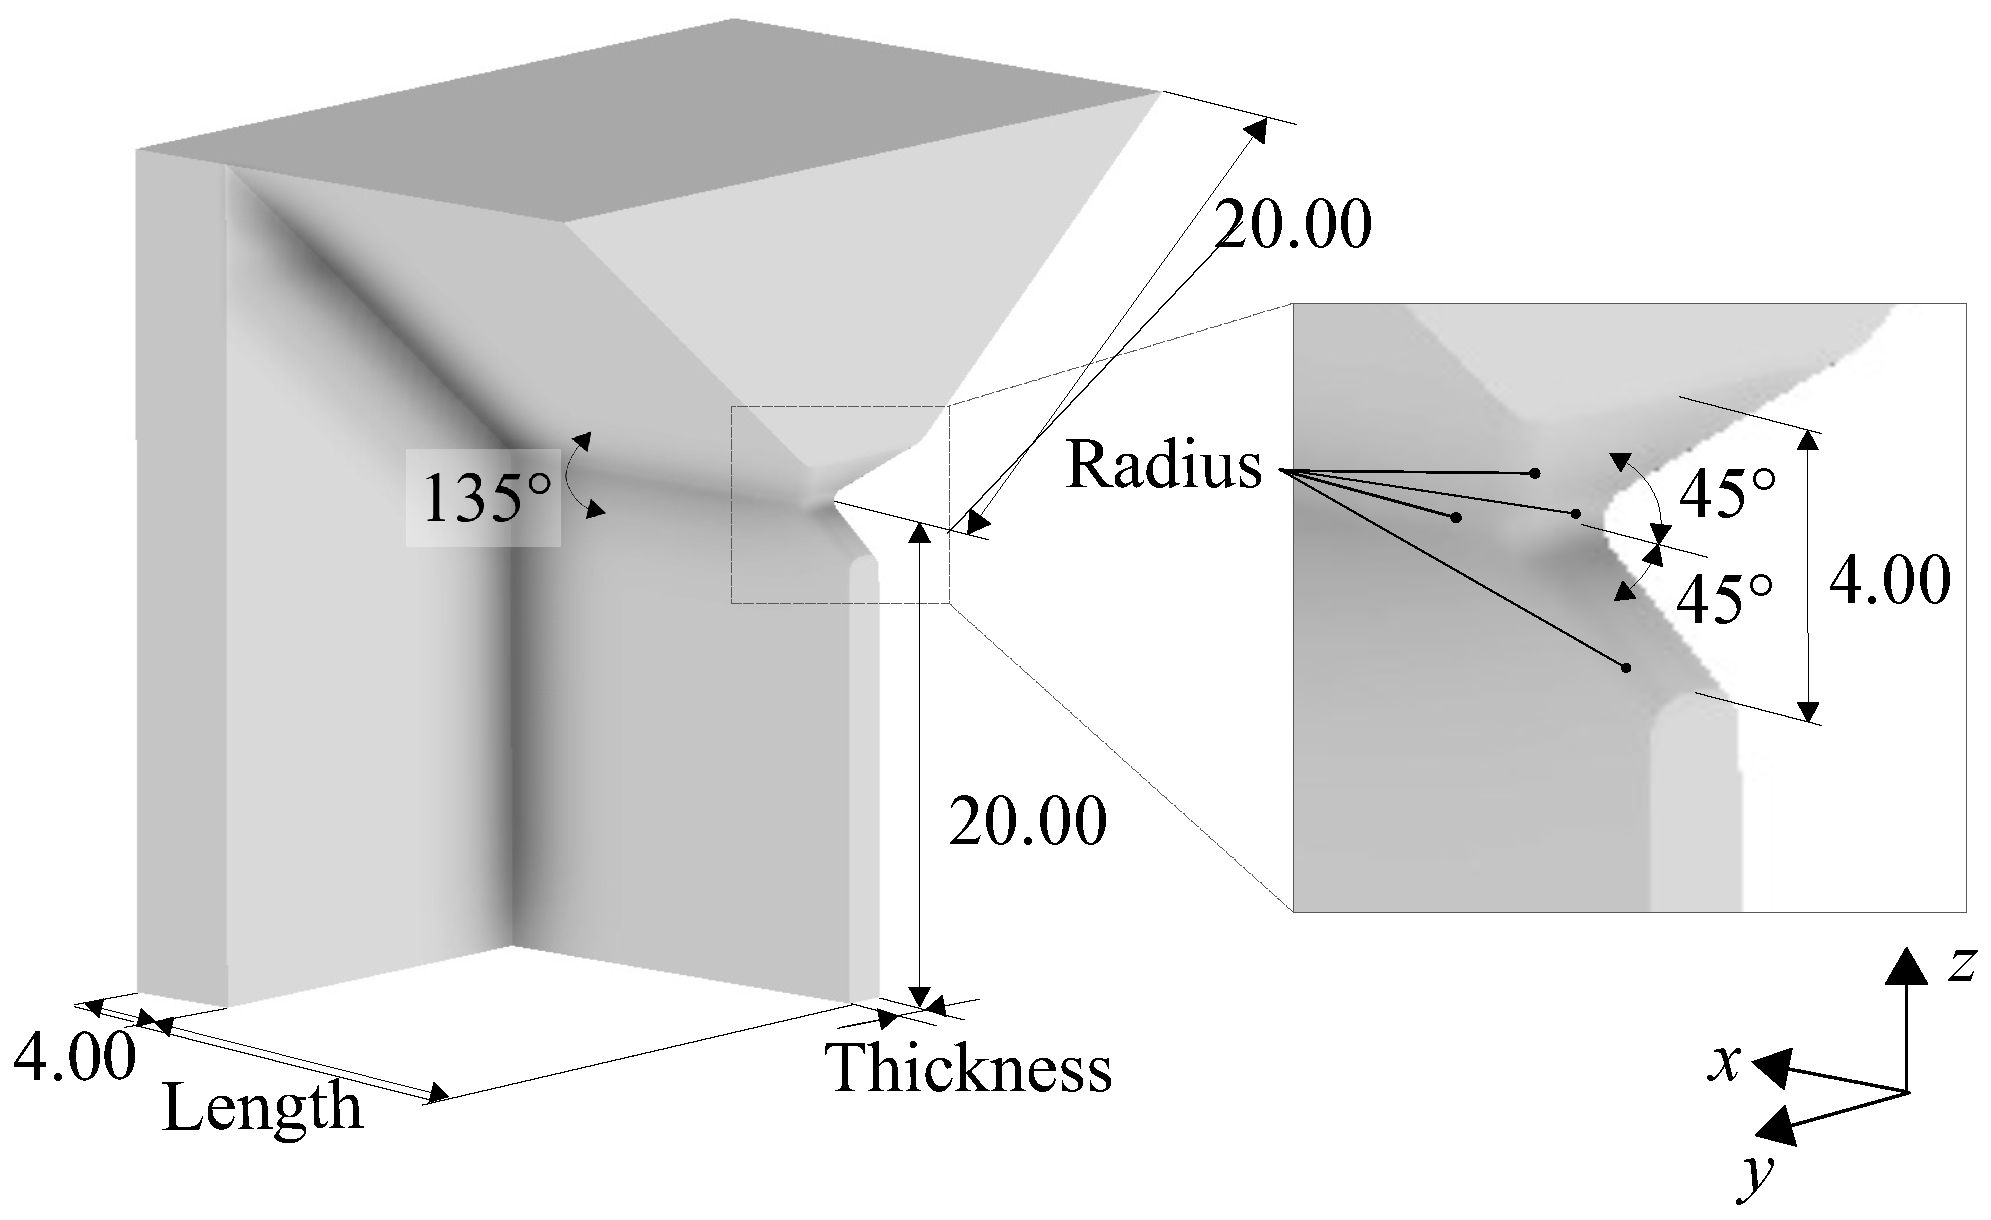
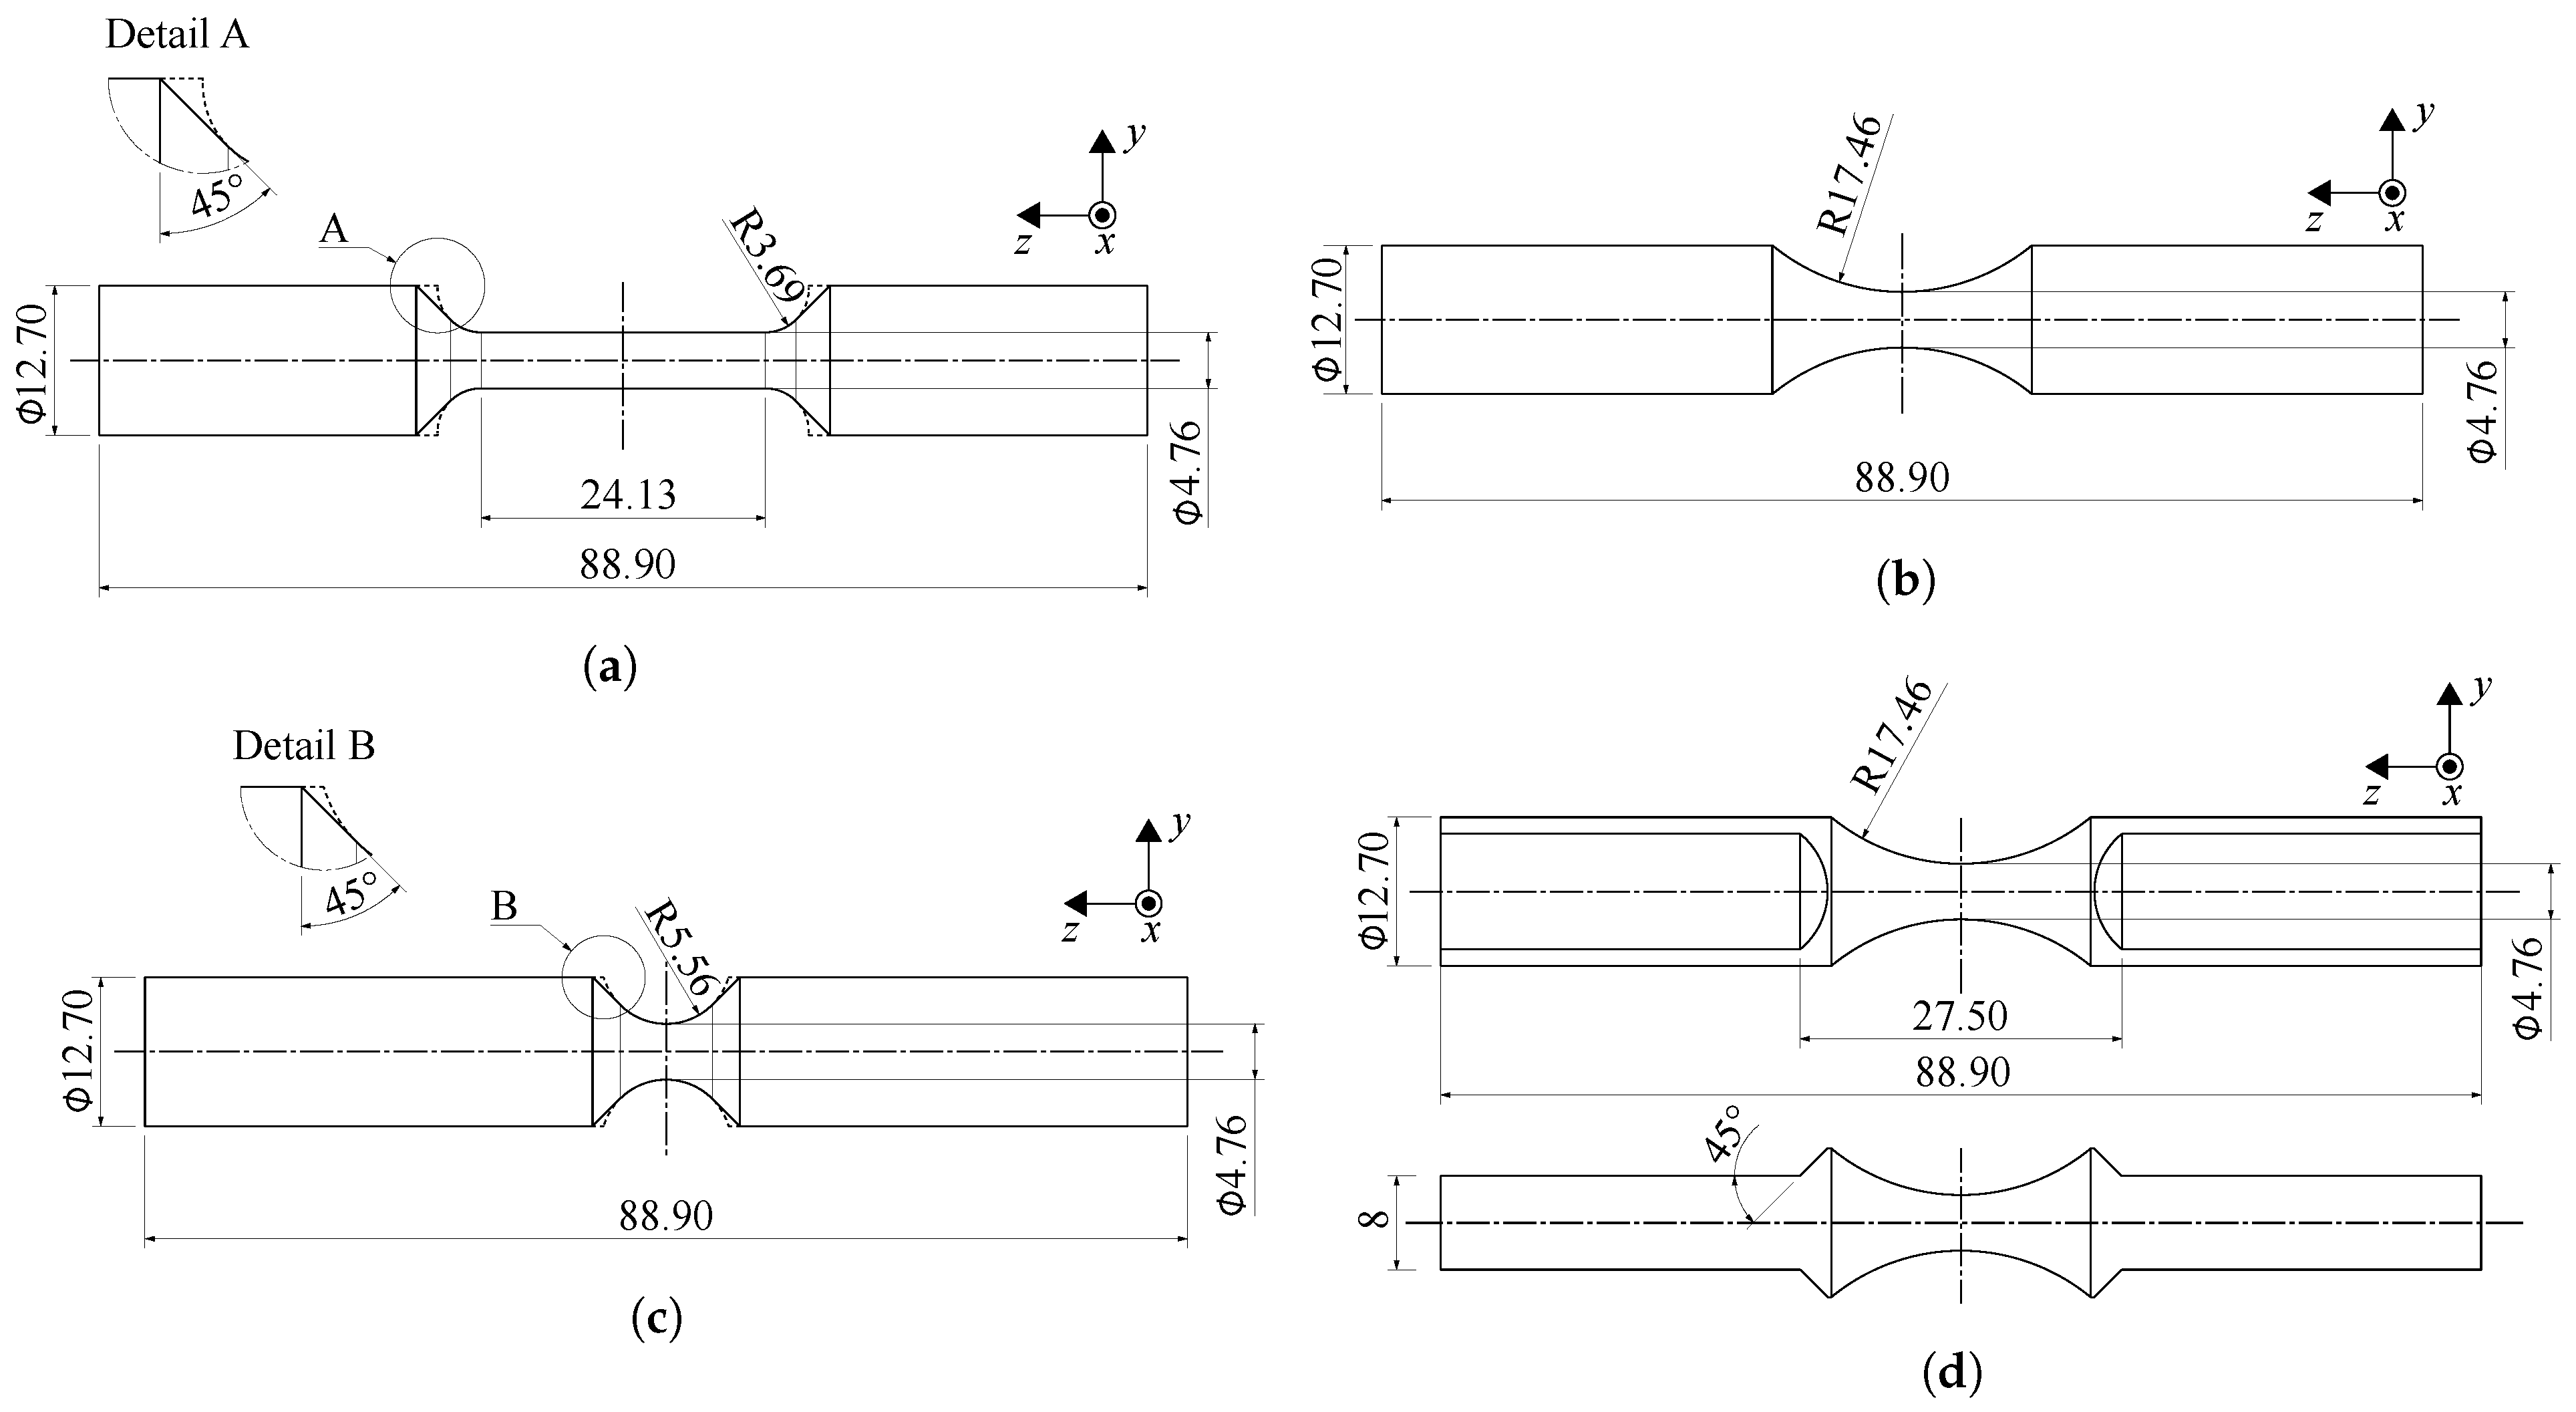
Appendix B. Tensile Test Geometries

The tensile test geometries for the experimental calibration approaches are illustrated in Figure A3.
Figure A3. Utilized tensile test geometries (adapted from Ressa [41] and Liutkus [42]) with modifications; the latter are depicted with dashed lines and detail views; (a) Specimen 1; (b) Specimen 2; (c) Specimen 3; (d) Specimen 2T.
Jmmp 07 00208 g0a3

Appendix C. Comparison of the Mechanical Properties

For the sake of clarity, only one representative graph per specimen is shown in Figure A4. It is evident that the Young’s Modulus of all specimens does not differ significantly. In both cases, meaning additively and conventionally manufactured parts, the tensile strength increases and the failure strain decreases with increasing sharpness of the notch in the specimens. The tensile strength of the additively manufactured samples is always lower than their conventional counterparts, while the opposite holds for the failure strain.
Figure A4. Comparison of the stress-strain curves with those from Ressa [41].
Jmmp 07 00208 g0a4
Since the Young’s Modulus is a physical constant of a specific material, the consistency of this value was to be expected. The reduced tensile strength of the additively manufactured samples compared with the conventional ones is for two reasons: the increased amount of residual stresses in the AM parts, and the fact that the parts were not heat treated with the typical thermal treatment for IN718 after the build process. These observations already show that the material behavior of objects manufactured by PBF-LB/M differs considerably from that of conventional IN718, indicating dissimilar failure characteristics.

References

  1. Huang, R.; Riddle, M.; Graziano, D.; Warren, J.; Das, S.; Nimbalkar, S.; Cresko, J.; Masanet, E. Energy and emissions saving potential of additive manufacturing: The case of lightweight aircraft components. J. Clean. Prod. 2016, 135, 1559–1570. [Google Scholar] [CrossRef]
  2. Uhlmann, E.; Kersting, R.; Klein, T.B.; Cruz, M.F.; Borille, A.V. Additive Manufacturing of Titanium Alloy for Aircraft Components. Procedia CIRP 2015, 35, 55–60. [Google Scholar] [CrossRef]
  3. Kruth, J. Material Incress Manufacturing by Rapid Prototyping Techniques. CIRP Ann. 1991, 40, 603–614. [Google Scholar] [CrossRef]
  4. DebRoy, T.; Wei, H.; Zuback, J.; Mukherjee, T.; Elmer, J.; Milewski, J.; Beese, A.; Wilson-Heid, A.; De, A.; Zhang, W. Additive manufacturing of metallic components—Process, structure and properties. Prog. Mater. Sci. 2018, 92, 112–224. [Google Scholar] [CrossRef]
  5. Mercelis, P.; Kruth, J.P. Residual stresses in selective laser sintering and selective laser melting. Rapid Prototyp. J. 2006, 12, 254–265. [Google Scholar] [CrossRef]
  6. Colegrove, P.A.; Donoghue, J.; Martina, F.; Gu, J.; Prangnell, P.; Hönnige, J. Application of bulk deformation methods for microstructural and material property improvement and residual stress and distortion control in additively manufactured components. Scr. Mater. 2017, 135, 111–118. [Google Scholar] [CrossRef]
  7. Wimmer, A.; Kolb, C.; Assi, M.; Favre, J.; Bachmann, A.; Fraczkiewicz, A.; Zaeh, M. Investigations on the influence of adapted metal-based alloys on the process of laser beam melting. J. Laser Appl. 2020, 32, 022029. [Google Scholar] [CrossRef]
  8. Zhang, Y.; Yang, S.; Zhao, Y.F. Manufacturability analysis of metal laser-based powder bed fusion additive manufacturing—A survey. Int. J. Adv. Manuf. Technol. 2020, 110, 57–78. [Google Scholar] [CrossRef]
  9. Carlton, H.D.; Haboub, A.; Gallegos, G.F.; Parkinson, D.Y.; MacDowell, A.A. Damage evolution and failure mechanisms in additively manufactured stainless steel. Mater. Sci. Eng. 2016, 651, 406–414. [Google Scholar] [CrossRef]
  10. Solberg, K.; Berto, F. Notch-defect interaction in additively manufactured Inconel 718. Int. J. Fatigue 2019, 122, 35–45. [Google Scholar] [CrossRef]
  11. Solberg, K.; Berto, F. A diagram for capturing and predicting failure locations in notch geometries produced by additive manufacturing. Int. J. Fatigue 2020, 134, 105428. [Google Scholar] [CrossRef]
  12. Rao, P.K.; Liu, J.P.; Roberson, D.; Kong, Z.J.; Williams, C. Online Real-Time Quality Monitoring in Additive Manufacturing Processes Using Heterogeneous Sensors. J. Manuf. Sci. Eng. 2015, 137, 061007. [Google Scholar] [CrossRef]
  13. Everton, S.K.; Hirsch, M.; Stravroulakis, P.; Leach, R.K.; Clare, A.T. Review of in-situ process monitoring and in-situ metrology for metal additive manufacturing. Mater. Des. 2016, 95, 431–445. [Google Scholar] [CrossRef]
  14. Lednev, V.N.; Sdvizhenskii, P.A.; Asyutin, R.D.; Tretyakov, R.S.; Grishin, M.Y.; Stavertiy, A.Y.; Fedorov, A.N.; Pershin, S.M. In situ elemental analysis and failures detection during additive manufacturing process utilizing laser induced breakdown spectroscopy. Opt. Express 2019, 27, 4612–4628. [Google Scholar] [CrossRef] [PubMed]
  15. Ghasemi-Tabasi, H.; de Formanoir, C.; Van Petegem, S.; Jhabvala, J.; Hocine, S.; Boillat, E.; Sohrabi, N.; Marone, F.; Grolimund, D.; Van Swygenhoven, H.; et al. Direct observation of crack formation mechanisms with operando Laser Powder Bed Fusion X-ray imaging. Addit. Manuf. 2022, 51, 102619. [Google Scholar] [CrossRef]
  16. Tran, H.T.; Chen, Q.; Mohan, J.; To, A.C. A new method for predicting cracking at the interface between solid and lattice support during laser powder bed fusion additive manufacturing. Addit. Manuf. 2020, 32, 101050. [Google Scholar] [CrossRef]
  17. Tran, H.T.; Liang, X.; To, A.C. Efficient prediction of cracking at solid-lattice support interface during laser powder bed fusion via global-local J-integral analysis based on modified inherent strain method and lattice support homogenization. Addit. Manuf. 2020, 36, 101590. [Google Scholar] [CrossRef]
  18. Lee, Y.; Kirka, M.; Ferguson, J.; Paquit, V. Correlations of cracking with scan strategy and build geometry in electron beam powder bed additive manufacturing. Addit. Manuf. 2020, 32, 101031. [Google Scholar] [CrossRef]
  19. Zhang, Y.; Zhang, J. Finite element simulation and experimental validation of distortion and cracking failure phenomena in direct metal laser sintering fabricated component. Addit. Manuf. 2017, 16, 49–57. [Google Scholar] [CrossRef]
  20. Bresson, Y.; Tongne, A.; Selva, P.; Arnaud, L. Numerical modelling of parts distortion and beam supports breakage during selective laser melting (SLM) additive manufacturing. Int. J. Adv. Manuf. Technol. 2022, 119, 5727–5742. [Google Scholar] [CrossRef]
  21. Gurson, A.L. Continuum Theory of Ductile Rupture by Void Nucleation and Growth: Part I-Yield Criteria and Flow Rules for Porous Ductile Media. J. Eng. Mater. Technol. 1977, 99, 2–15. [Google Scholar] [CrossRef]
  22. Tvergaard, V. Influence of void nucleation on ductile shear fracture at a free surface. J. Mech. Phys. Solids 1982, 30, 399–425. [Google Scholar] [CrossRef]
  23. Tvergaard, V.; Needleman, A. Analysis of the cup-cone fracture in a round tensile bar. Acta Metall. 1984, 32, 157–169. [Google Scholar] [CrossRef]
  24. Yang, X.; Li, Y.; Jiang, W.; Duan, M.; Chen, D.; Li, B. Ductile fracture prediction of additive manufactured Ti6Al4V alloy based on an extended GTN damage model. Eng. Fract. Mech. 2021, 256, 107989. [Google Scholar] [CrossRef]
  25. Shafaie, M.; Khademi, M.; Sarparast, M.; Zhang, H. Modified GTN parameters calibration in additive manufacturing of Ti-6Al-4 V alloy: A hybrid ANN-PSO approach. Int. J. Adv. Manuf. Technol. 2022, 123, 4385–4398. [Google Scholar] [CrossRef]
  26. Sarparast, M.; Shafaie, M.; Babakan, A.M.; Davoodi, M.; Zhang, H. Investigation of ANN structure on predicting the fracture behavior of additively manufactured Ti-6Al-4V alloys. arXiv 2023. [Google Scholar] [CrossRef]
  27. Bayerlein, F. Managing Form Deviations in Laser Beam Melting by Pre-Deformation. Ph.D. Thesis, Technical University of Munich, Munich, Germany, 2020. [Google Scholar]
  28. Zhang, B.; Wang, P.; Chew, Y.; Wen, Y.; Zhang, M.; Wang, P.; Bi, G.; Wei, J. Mechanical properties and microstructure evolution of selective laser melting Inconel 718 along building direction and sectional dimension. Mater. Sci. Eng. 2020, 794, 139941. [Google Scholar] [CrossRef]
  29. McLouth, T.D.; Witkin, D.B.; Lohser, J.R.; Sitzman, S.D.; Adams, P.M.; Lingley, Z.R.; Bean, G.E.; Yang, J.M.; Zaldivar, R.J. Temperature and strain-rate dependence of the elevated temperature ductility of Inconel 718 prepared by selective laser melting. Mater. Sci. Eng. 2021, 824, 141814. [Google Scholar] [CrossRef]
  30. Lee, J.; Lee, M.; Jung, I.D.; Choe, J.; Yu, J.H.; Kim, S.; Sung, H. Correlation between microstructure and tensile properties of STS 316L and Inconel 718 fabricated by selective laser melting (SLM). J. Nanosci. Nanotechnol. 2020, 20, 6807–6814. [Google Scholar] [CrossRef]
  31. Purtscher, P. Micromechanisms of ductile fracture and fracture toughness in a high-strength austenitic steel. In At Low Temperatures-XIII; Colorado School of Mines, Arthur Lakes Library: Boulder, CO, USA, 1990; p. 95. [Google Scholar]
  32. Rice, J.R.; Tracey, D.M. On the ductile enlargement of voids in triaxial stress fields. J. Mech. Phys. Solids 1969, 17, 201–217. [Google Scholar] [CrossRef]
  33. d’Escatha, Y.; Devaux, J. Numerical study of initiation, stable crack growth, and maximum load, with a ductile fracture criterion based on the growth of holes. In Elastic-Plastic Fracture; ASTM International: West Conshohocken, PA, USA, 1979. [Google Scholar]
  34. Hancock, J.; Mackenzie, A. On the mechanisms of ductile failure in high-strength steels subjected to multi-axial stress-states. J. Mech. Phys. Solids 1976, 24, 147–160. [Google Scholar] [CrossRef]
  35. Fischer, F.D.; Kolednik, O.; Shan, G.; Rammerstorfer, F. A note on calibration of ductile failure damage indicators. Int. J. Fract. 1995, 73, 345–357. [Google Scholar] [CrossRef]
  36. Johnson, G.R.; Cook, W.H. Fracture characteristics of three metals subjected to various strains, strain rates, temperatures and pressures. In Engineering Fracture Mechanics; Elsevier: Amsterdam, The Netherlands, 1985; Volume 21, pp. 31–48. [Google Scholar]
  37. Bao, Y. Prediction of Ductile Crack Formation in Uncracked Bodies. Ph.D. Thesis, Massachusetts Institute of Technology, Cambridge, MA, USA, 2003. [Google Scholar]
  38. Wierzbicki, T.; Bao, Y.; Lee, Y.W.; Bai, Y. Calibration and evaluation of seven fracture models. Int. J. Mech. Sci. 2005, 47, 719–743. [Google Scholar] [CrossRef]
  39. Bai, Y. Effect of Loading History on Necking and Fracture. Ph.D. Thesis, Massachusetts Institute of Technology, Cambridge, MA, USA, 2007. [Google Scholar]
  40. Murugesan, M.; Jung, D.W. Johnson cook material and failure model parameters estimation of AISI-1045 medium carbon steel for metal forming applications. Materials 2019, 12, 609. [Google Scholar] [CrossRef] [PubMed]
  41. Ressa, A. Plastic Deformation and Ductile Fracture Behavior of Inconel 718. Master’s Thesis, The Ohio State University, Columbus, OH, USA, 2015. [Google Scholar]
  42. Liutkus, T.J. Digital Image Correlation in Dynamic Punch Testing and Plastic Deformation Behavior of Inconel 718. Master’s Thesis, The Ohio State University, Columbus, OH, USA, 2014. [Google Scholar]
  43. Bridgman, P.W. Studies in Large Plastic Fracture; McGraw-Hill: New York, NY, USA, 1952. [Google Scholar]
  44. Choung, J.; Cho, S. Study on true stress correction from tensile tests. J. Mech. Sci. Technol. 2008, 22, 1039–1051. [Google Scholar] [CrossRef]
  45. Pottlacher, G.; Hosaeus, H.; Kaschnitz, E.; Seifter, A. Thermophysical properties of solid and liquid Inconel 718 Alloy. Scand. J. Metall. 2002, 31, 161–168. [Google Scholar] [CrossRef]
  46. Gebhardt, C. Praxisbuch FEM mit ANSYS Workbench; Carl Hanser Verlag: München, Germany, 2014. [Google Scholar]
  47. Dhondt, G. CalculiX CrunchiX USER’S MANUAL Version 2.16. 2019. Available online: http://www.dhondt.de/ccx_2.16.pdf (accessed on 22 November 2023).
  48. Wang, Z.; Guan, K.; Gao, M.; Li, X.; Chen, X.; Zeng, X. The microstructure and mechanical properties of deposited-IN718 by selective laser melting. J. Alloys Compd. 2012, 513, 518–523. [Google Scholar] [CrossRef]
  49. Strößner, J.; Terock, M.; Glatzel, U. Mechanical and microstructural investigation of nickel-based superalloy IN718 manufactured by selective laser melting (SLM). Adv. Eng. Mater. 2015, 17, 1099–1105. [Google Scholar] [CrossRef]
  50. Anderson, T.L. Fracture Mechanics: Fundamentals and Applications; CRC Press: Boca Raton, FL, USA, 2017. [Google Scholar]
Figure 1. Approach pursued in this paper.
Jmmp 07 00208 g001
Figure 2. Single pore in an infinite volume, upon which the dimensionless stress triaxialiy σ * is acting, according to Rice and Tracey [32]; r p : mean hole radius; σ , ε : stress and strain in the corresponding main axis direction, respectively.
Jmmp 07 00208 g002
Figure 3. Essential parameters for the characterization of the necking in a round specimen.
Jmmp 07 00208 g003
Figure 4. Tracking points (TPs) with pattern tracking rectangles of the laser extensometer along the longitudinal axis for Specimen 1.
Jmmp 07 00208 g004
Figure 5. Tracking point (TP) matrix with pattern tracking rectangles of the laser extensometer for the determination of the stress triaxiality of Specimen 2 and Specimen 3.
Jmmp 07 00208 g005
Figure 6. Tracking points (TPs) with pattern tracking rectangles of the laser extensometer for the determination of the equivalent plastic failure strain of Specimen 2, Specimen 2T, and Specimen 3.
Jmmp 07 00208 g006
Figure 7. Deliberate imperfection in the finite element mesh of Specimen 1.
Jmmp 07 00208 g007
Figure 8. Dimensions of the crack-promoting geometry.
Jmmp 07 00208 g008
Figure 9. Optical micrograph of a crack in the notch of a specimen.
Jmmp 07 00208 g009
Figure 10. Resulting model parameters d 1 , d 2 , d 3 for the JC model, and ε 0 RT for the RT model, with the experimental data and the fitted model curves for the three proposed calibration approaches along with the fitting quality.
Jmmp 07 00208 g010
Figure 11. Comparison of the calibration results for the three different calibration methods; (a) RT model; (b) JC model.
Jmmp 07 00208 g011
Figure 12. Fitting curves and experimental data of the calibration process for the JC model; (a) strain rate; (b) temperature.
Jmmp 07 00208 g012
Figure 13. Comparison of the experimental JC graph with that from Ressa [41].
Jmmp 07 00208 g013
Table 1. Used process parameters for the manufacturing of the specimens.
ParameterLaser PowerScan SpeedHatch DistanceLayer Height
Value285 W960 mm/s0.11 mm0.04 mm
Table 2. Specifications of the utilized specimens.
No.Specimen TypeDescriptionReference σ *
1Specimen 1Round, smooth (axisymmetric)Modified based on [41,42]0.378
2Specimen 2Round, notched (axisymmetric)Based on [41,42], no modifications0.562
3Specimen 3Round, notched (axisymmetric)Modified based on [41,42]0.768
2TSpecimen 2TRound, notched (axisymmetric)Modified based on [41,42]0.562
Table 3. Specimen dimensions applied for calibration using the AM-adapted approach.
NameLength in mmThickness in mmRadius in mm
Specimen A20.003.000.30
Specimen B20.002.000.50
Specimen C15.001.500.50
Disclaimer/Publisher’s Note: The statements, opinions and data contained in all publications are solely those of the individual author(s) and contributor(s) and not of MDPI and/or the editor(s). MDPI and/or the editor(s) disclaim responsibility for any injury to people or property resulting from any ideas, methods, instructions or products referred to in the content.

