1. Introduction
Lubricants play a key role in improving the productivity of the cold rolling process since they improve the surface quality of rolled products and reduce power consumption and the roll’s wear [
1], thus prolonging the service rolls’ life while saving costs [
2]. Friction and lubrication are influenced by material properties, surface finish, temperature, sliding velocity, contact pressure, and lubricant characteristics [
3]. Depending on these parameters, the performance of a lubricant and the Coefficient of Friction (CoF) vary. The lubricating requirement of a rolling lubricant is to control the friction and wear between the rolls and the workpiece, even considering the high production rates at which the mill operates [
4]. In cold rolling, surface appearance plays a prominent role. The lubricant film thickness and lubricant performance are key factors in determining surface quality [
5]. Inadequate lubricant performance can lead to a variety of surface imperfections that, for example, may appear as smeared areas, dull appearance, or featuring fissures perpendicular to the direction of rolling [
6].
Over the last hundred years, petroleum-based lubricants have been established in most industrial and automotive applications. The complexity of lubricant formulations has been increased steadily over the last few decades, as the operating and performance requirements of the lubricants became more and more demanding. Such a complexity, however, poses a challenge as some components of lubricants completely degrade in a relatively short time, while others may not degrade at all. It is estimated that more than 50% of all lubricants used worldwide enter the environment due to spills, improper disposal, volatility, and accidents [
7]. Over 95% of the lubricants that are lost in the environment are obtained from petroleum and determine the contamination of the air, the soil, and the water, thus greatly affecting human and plant life [
8].
According to the principles of modern production systems, the optimization of processes from the perspective of minimizing the negative impact on the environment is becoming increasingly important [
9]. Considering the increase in the cost of petroleum-based mineral oils and the environmental law regulations, the use of innovative formulations is the most effective solution to improve the product’s quality without affecting sustainability [
10,
11]. Lubricants based on animal/vegetable raw components are renewable, non-toxic, and biodegradable: they are thus considered the most promising solution to reduce the environmental impact [
12]. However, a simple assessment of the environmental impact of these innovative lubricants is not enough to encourage their use. The evaluation of their performance is fundamental, especially in comparison with a petroleum-based mineral lubricant. Considering the complexity of carrying out industrial tests, very often, the comparison takes place in a laboratory environment, in which all the process parameters are easily manageable. As an example, Trzepieciński [
13] compared different lubricants based on a combination of boric acid (H
3BO
3) and edible vegetable oils (both of which are natural and environmentally friendly) with traditional petroleum-based lubricants; it was found that palm oil as pure oil or with the addition of 5 wt.% of H
3BO
3, was the most effective in reducing the CoF. Ortega et al. [
14] investigated the lubrication performance of corn and peanut oils reinforced with different concentrations of Halloysite clay nanotubes (HNTs) and Montmorillonite nanoclay (MMT) as green lubricant additives. Block-on-ring wear tests were conducted to investigate the effect of different nanoparticle (NP) concentrations on the Coefficient of Friction (COF) and wear volume loss. Results showed that vegetable oils reinforced with HNT and MMT nanoclays have the potential to be used as good biodegradable nanolubricants. Avdeenko et al. [
15] developed a cold rolling emulsion using vegetable oil and chicken fat, which was tested using a laboratory rolling mill for reducing the thickness in the cold condition of 08Kp steel; results revealed that the lubricant with 100% concentration of boric acid esters of mono- and diglycerides were the most effective in the rolling of thin steel strips.
In the present work, the lubricating performance of a natural-based emulsion and a mineral-based one has been assessed in terms of rolling forces, Coefficient of Friction (CoF) at the roll/strip interface, and work rolls’ wear. Data from the two-stands reversing cold mill (RCM) at the Marcegaglia plant (Ravenna, Italy) were used for comparing the investigated lubricants. In particular, data about the forces and the wear evolution during the rolling process were acquired over quite a long period (11 months), thus being related to a large type of steel. In addition, the CoF was evaluated using the CSM High-Temperature pin-on-disk Tribometer (THT) and replicating the operating conditions in which the two lubricants are currently used.
2. Materials and Methods
The lubricating performance of a green lubricant (GRL) was evaluated in comparison with a commercial semi-synthetic one (SSL), whose description is detailed in
Section 2.1. The above-mentioned lubricating performance was assessed by collecting different types of data: (i) forces and rolls’ wear in a real production environment, as detailed in
Section 2.2; (ii) CoF values in a laboratory environment (from pin-on-disk tests) as detailed in
Section 2.3. In addition, the analytical model described in
Section 2.4 was used to calculate data that were used for the investigations.
2.1. The Investigated Lubricants
The green lubricant (GRL) is a water-dispersed lubricant produced using bio-based substances and additives without mineral oils, biocides, or other toxic substances. The GRL emulsion is also enriched by deterging properties that allow enhancing dispersion of iron fines and rolling debris from the strip and rolling mill, thus determining a better strip surface quality. The oil droplets, dispersed in the aqueous phase, are averagely bigger in size than conventional emulsions and are electrostatically charged to improve the adhesion on the steel surface (uniform spreading on the strip resulting in lower consumption and higher lubricity). Moreover, the exhaust dispersion spontaneously separates without the need for any chemical treatment: an upper oil layer can be easily skimmed off and sold as raw material (with a limited content of water lower than 0.3%). On the other side, the aqueous phase is characterized by chemical parameters (chemical oxygen demand = 500 ppm, non-ionic surfactants = 30 ppm, oil content = 100 ppm) below the regulatory discharge limits and can be directly disposed of together with other industrial wastewater streams.
The semi-synthetic lubricant (SSL) is obtained as a mixture of mineral and synthetic oils. Mineral oil is produced by refining crude oil: distillation in the refineries removes impurities from the crude oil so that a hydrocarbon compound as pure as possible remains, which guarantees good lubrication properties [
16]. Fully synthetic oil is produced artificially through the manipulation of petroleum hydrocarbons at a molecular level by synthesis technologies in order to prepare a product that can be employed in extreme conditions [
17]: short-chain hydrocarbon compounds are combined to form longer chains until the desired lubrication properties are achieved. The oil is very pure and more powerful than mineral oil: it combines the cost-effectiveness of mineral oil with the capacity to last for a long time and withstand temperatures much higher than synthetic lubricant.
2.2. Data from the Real Production Environment
Data for comparing the two investigated lubricants were obtained from the two-stands reversing cold mill (RCM) at the Marcegaglia plant (Ravenna, Italy), whose scheme is proposed in
Figure 1.
It consists of two stands equipped with work rolls that gradually reduce the strip’s thickness. Back-up rolls, characterized by a diameter (about 1300 mm) 3 times larger than the work rolls and made of a softer alloy in order to avoid copying any surface defects on the strip, are used to control the deflection of the work rolls. The rolling process is performed in two passes: during the first pass, the strip gets uncoiled, is deformed within the two stands, and is coiled up; the distance between the rolls in both stands is subsequently adjusted to perform the second pass in the opposite direction.
In each stand, load cells placed in containers near the backup rolls’ crankset allow for continuously measuring the rolling force acting on the strip. Such values were monitored in the present investigation and related the specific processed steel type. Being the steel type which is rolled known in terms of material behavior (flow stress curve), the effect of the lubricant on the rolling forces could be investigated: experimental data were thus collected in order to compare the two lubricants when rolling the same type of steel and taking into account the characteristics of the coil (strip width, input, and output strip thickness), as well. In addition, in order to make the comparison statistically reliable, only data concerning a large enough number of coils (at least equal to 7) were considered.
Due to the continuous contact with the strip, the work rolls wear out, and the quality of the surface is reduced. In fact, the uniformity of the roll’s surface is no longer ensured (a strip with a thickness that is not constant during the entire process could be produced), and surface defects might be copied from the rolls to the strip. For this reason, at predefined intervals of time, the work rolls are disassembled and machined to restore their original surface quality. The amount of the roll’s material (expressed in terms of mm along the radial direction) machined per kg of rolled steel was also monitored for the whole period of the investigation (11 months).
The emulsion obtained by mixing demineralized water and lubricant (concentration: about 2%) is directed towards the work area by means of pipes and sprayed in the working area. After use, the emulsion is recovered and disposed of.
GRL and SSL were tested in subsequent periods: in particular, when the lubricant GRL was investigated, the tank containing the previous lubricant was washed and filled with GRL; the rolling process was then monitored for about 1 year (11 months).
2.3. Data from the Laboratory Environment
The comparison between the effect of the two lubricants on the rolling forces is a useful approach to estimating their lubricating performance, but no information about the CoF can be obtained. For this reason, a tribological test was carried out using the CSM High-Temperature pin-on-disk Tribometer (THT).
2.3.1. Pin on Disk Tests
Considering that the behavior of the lubricants is different when the operating conditions change and that each formulation has its own Stribeck curve (in which, as the Hersey number H varies, the lubrication regime and the CoF change), a test was conducted by reproducing the same operating conditions of the RCM (i.e., characterized by the same H value calculated using the strip speed in the neutral section and the average contact pressure along the entire contact arc). The Hersey number H is obtained using Equation (1) in which η, U, and P are, respectively, the dynamic viscosity of the lubricant, the sliding speed, and the contact pressure [
18].
The tribometer is shown in
Figure 2. It is composed of (i) a rotating disk in SAE 1008 steel (ground before the tribological test) extracted from a strip processed in the RCM; (ii) a 100Cr6 steel ball characterized by a diameter equal to 10 mm whom the disk is in contact to. The lubricant is interposed between the two surfaces, and a normal load is applied (1 N in the experiments detailed in the present work) by means of a calibrated weight.
The test was conducted at 25 °C and using the following procedure: (i) during the first 10 s the ball was kept in non-contact condition (see
Figure 2a); (ii) during the next 40 s, the ball was brought into contact with the disk (see
Figure 2b) and the Coefficient of Friction
was recorded; (iii) during the next 20 s the ball was kept away from the disk’s surface, in a non-contact condition, but it was kept immersed in the lubricant in order to measure the resistance force
due to the action of the oil bath on the ball holder. The CoF is then calculated as
. At the end of each test: (i) the lubricant in the cup was replaced by a fresh one; (ii) the cup, ball, and disk were cleaned using acetone to remove particles of material; (iii) the ball was rotated from the previous position, and (iv) the distance of the load application point from the center of the disk was modified in order to avoid the contact between worn surfaces.
2.3.2. Tests Using the Rheometer
The choice of a lubricant for the cold rolling process depends on many factors, like dynamic viscosity, the presence of emulsion stirrers in the tank, the type of system used to spray the emulsion in the work area, film formation, thermal stability but also the type of rolling mill and processed material. Thus, even if the viscosity, which is a measure of the fluid’s resistance to flow under applied shear stress, cannot univocally characterize the lubricant, it certainly affects the Hersey number (H), which, in turn, determines the lubrication regime in which the lubricant operates.
In order to evaluate such a parameter for the investigated oil formulations for the calculation of the H values, a rheometer (Anton Paar—MCR 702) equipped with a Peltier system for temperature control was used. The contact pressure P generated during the contact between the ball and the disk could be calculated using Equation (2), being F the normal force applied to the ball (1 N) and A the contact area defined, according to the Hertzian theory, by the equations below
being “a” the radius of the contact region between the two surfaces, R the radius of the ball, E* the Equivalent Young’s modulus, E the elastic modulus of the two bodies (considered the same and equal to 210 GPa), and υ the Poisson’s ratio of the two bodies (considered the same and equal to 0.3). Therefore, the calculated contact pressure P is 312.6 MPa.
2.4. Analytical Model of the Rolling Process
Figure 3 shows a schematic view of a single pass (only half of the system is depicted) along with the main process parameters: the diameter of the work roll (D), the initial (
and the final (
) strip thickness and the applied inward (
) and a backward (
) tension. The 2D plane strain analytical model proposed by Bland and Ford [
19] allowed us to calculate, according to the slab analysis approach, the contact pressure between the work roll and the strip along the arc of contact (and, in turn, the rolling force). The friction was modeled according to the Coulomb law. The equilibrium equations along the vertical and horizontal directions are solved over an infinitesimal slab (highlighted in blue in
Figure 3), subtending the angle dα and characterized by a length equal to
dx.
The contact pressure related to the slab was calculated taking into account the increase in the flow stress along the contact arc due to the progressive deformation of the blank rather than considering a constant equivalent flow stress. By integrating the equation of the slab’s contact pressure over the contact arc, Equation (6) (valid between the input and the neutral section, where the blank velocity is equal to the roll’s peripheral one) and Equation (7) (between the neutral and the output section) were obtained [
19].
and
refer to the plastic strain at the input and output section, respectively; moreover, the quantities A, w and
are expressed by the equations below [
19].
The peak value of the contact pressure is reached in the neutral section, whose position
) within the contact arc is affected by Equations (6) and (7), and it is shown in Equation (11) [
19].
The rolling force was calculated by summing all the infinitesimal contributions (calculated as the product between the contact pressure value and the infinitesimal slab area, i.e., the length of the arc subtending dα multiplied by the strip’s width).
3. Results
3.1. Evaluation of the Rolling Forces
Process data for each coil rolled in the two-stands reversing cold mill were analyzed in order to evaluate the lubricating properties of the two investigated formulations in terms of impact on the rolling forces. The comparison in terms of rolling forces was conducted on coils having the same material properties (i.e., the same steel grade) and the same geometry (width and thickness reductions between the input and the output section of the rolling mill). The combinations and the number of coils analyzed are listed in
Table 1 for both lubricants (SSL and GRL).
Considering that the data were acquired during a very large period in which the company’s production was quite broad, the number of each type of coils processed with the same lubricant was different.
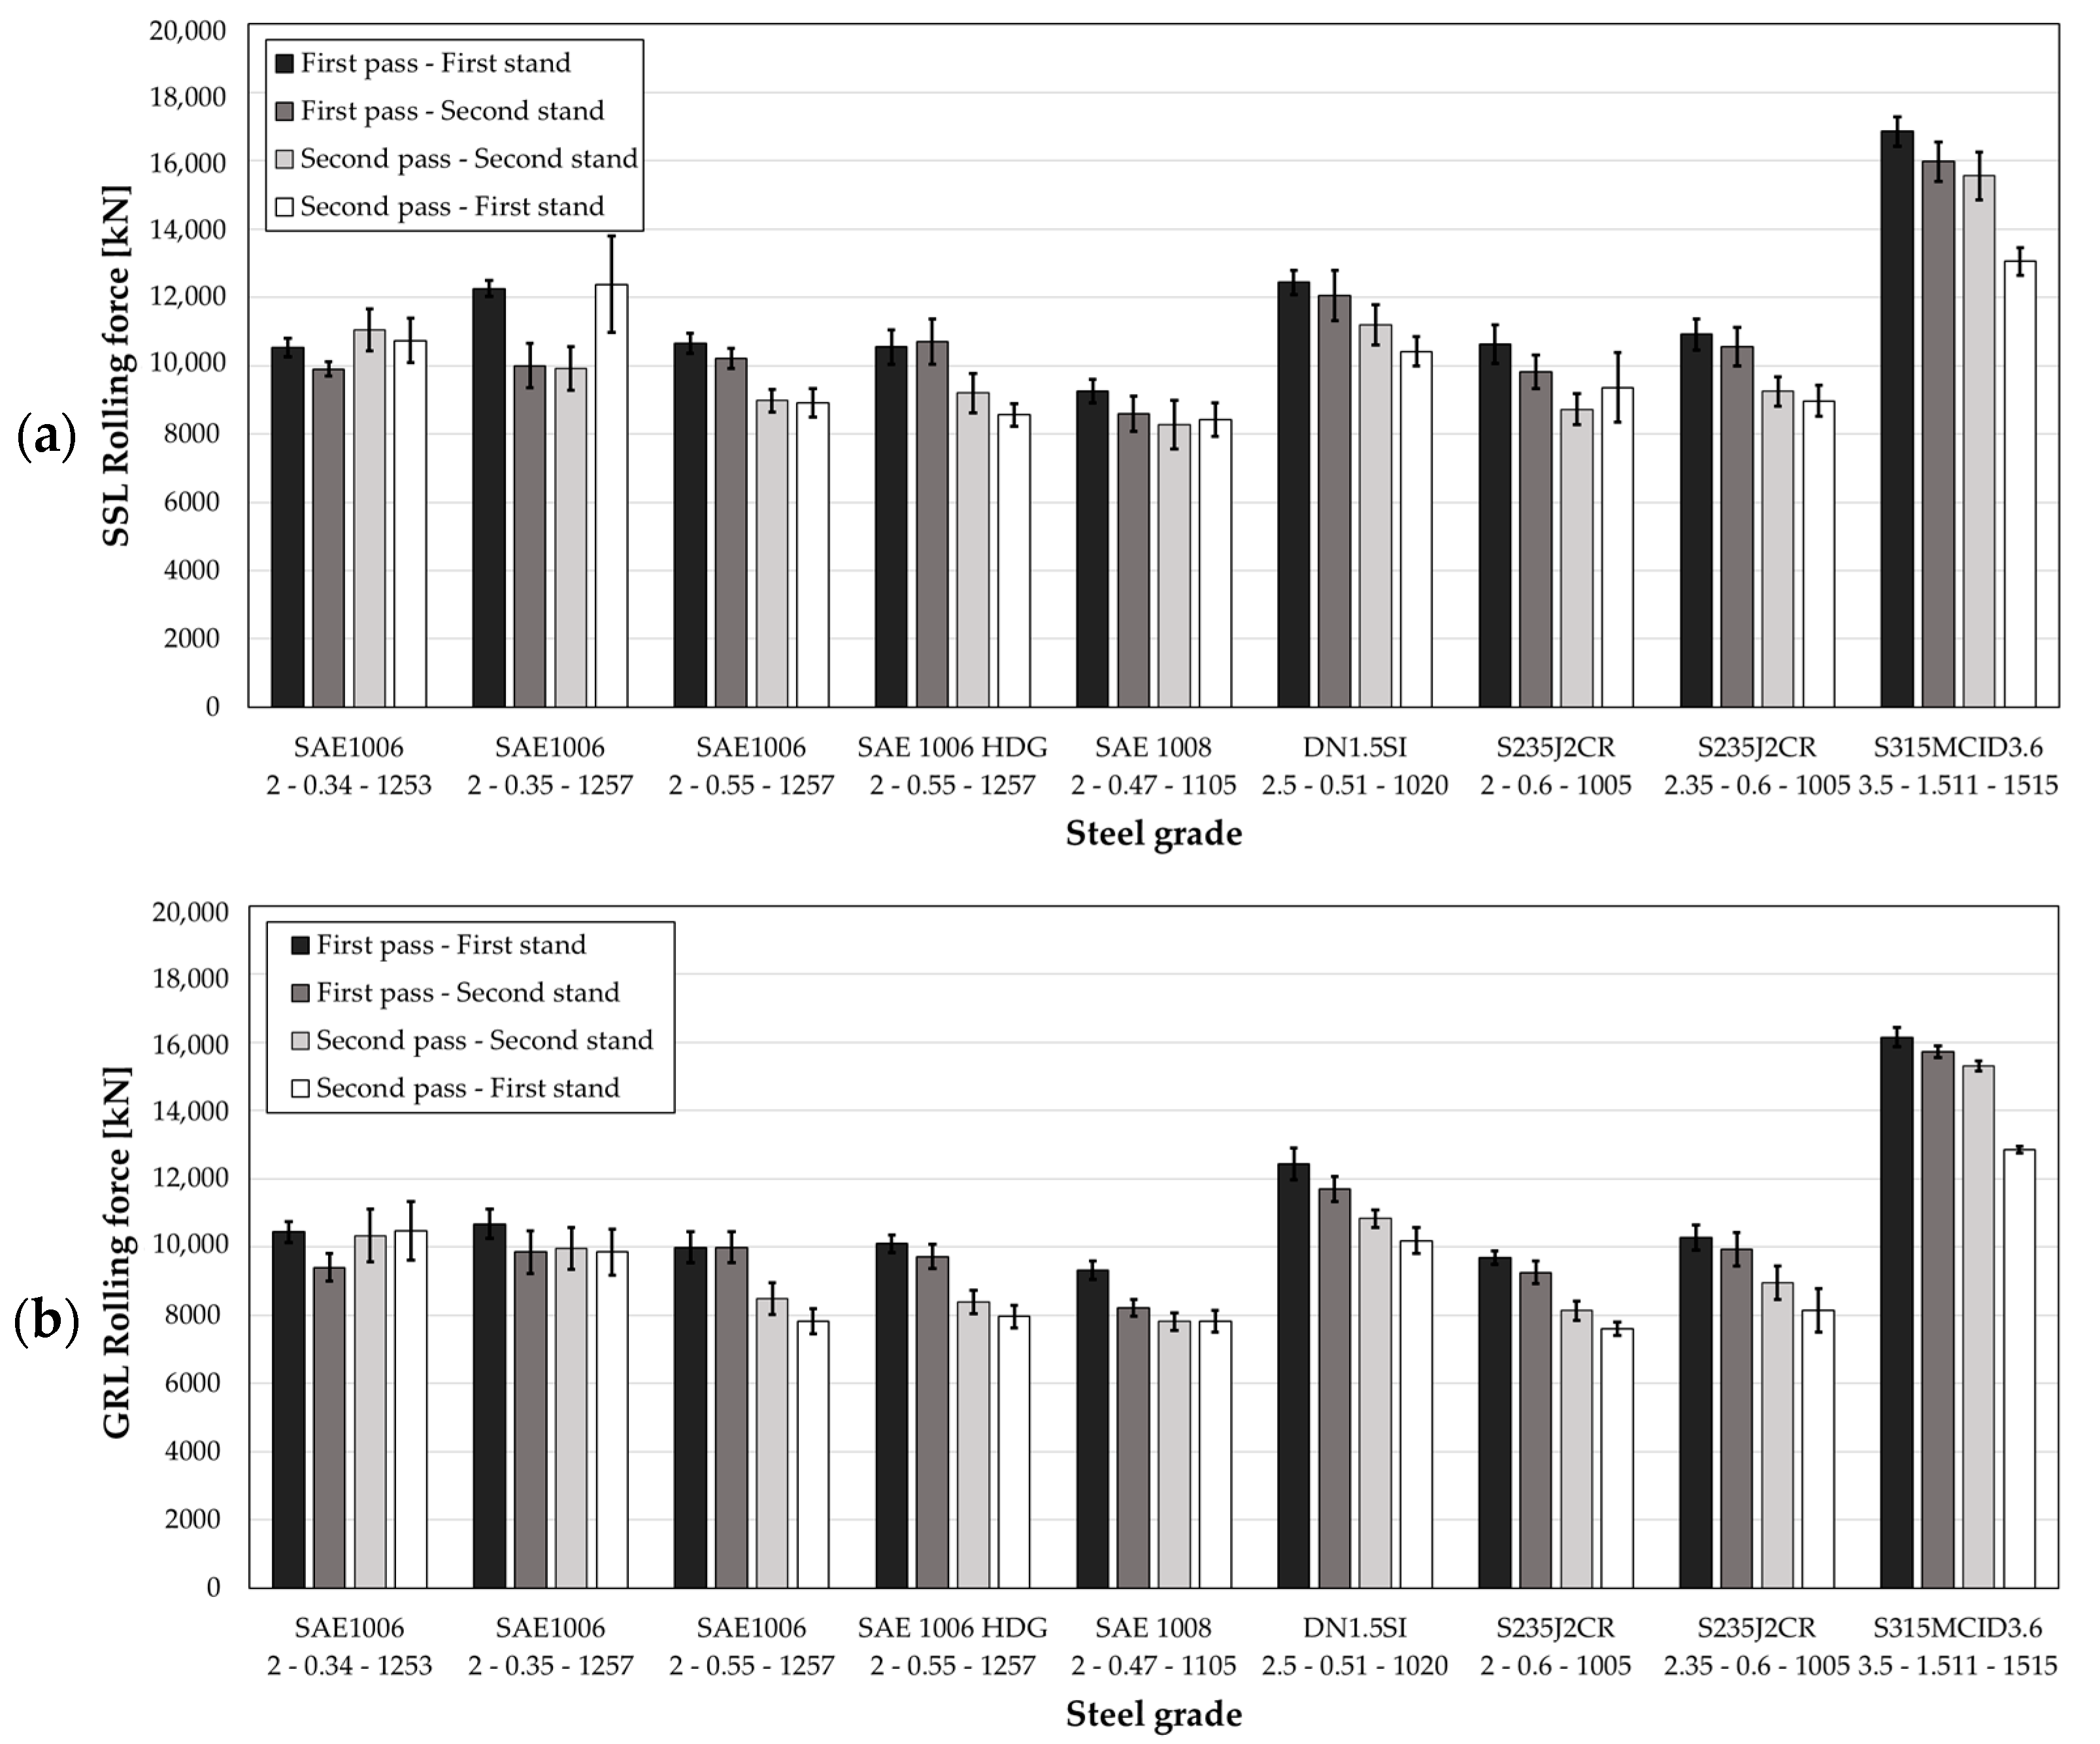
For each combination, the average values of the rolling force when using the two emulsions were collected in each stand and plotted in
Figure 4: data related to the semi-synthetic lubricant (SSL) and the green lubricant (GRL) are shown in
Figure 4a, and
Figure 4b, respectively.
It is worth noticing that the first two values refer to the rolling force in the first and second stand of the first pass, while the third and fourth ones refer to the second and first stand, respectively (return pass). The dispersion of the data around the mean value is quantified through the standard deviation and represented through a vertical error band. It is evident that such a parameter assumes very small values for each combination and for both lubricants, thus indicating the robustness of the analysis (i.e., that the considered number of coils for each combination is large enough).
The average values of the rolling force when using the GRL as lubricant were compared with those obtained with the other lubricant according to Equation (12).
The obtained results are shown in
Figure 5: a negative value of the ΔF (%) parameter indicates a reduction of the rolling force when using the green lubricant, while a positive value indicates an increase in the rolling force.
Results show an important reduction of the rolling force when using the GRL due to its improved lubricating capacity with respect to the SSL. Such behavior is clearly visible on each material and on each strand of the two-stand reversing mill. Analyzing all the combinations, the rolling force was reduced by 5.6% on average: the force was reduced by 4.7% and 4.3% on the first and second stand of the first pass, respectively; similarly, in the second pass, the rolling force was reduced by 4.5% and 9.0% on the second and first stand respectively.
The superior performance of the GRL with respect to the SSL is probably related to the oil droplets dispersed in the aqueous phase, which, as described in
Section 2.1, are averagely bigger in size than the one of conventional emulsions; in addition, such oil droplets are electrostatically charged, which improves the adhesion on the steel surface and determines a uniform spreading on the strip, thus resulting a lower consumption and, at the same time, better lubricating performances and lower rolling forces.
It should be noted that data from the real production environment are not sufficient to directly evaluate the friction condition, but they can be used to replicate the same conditions in a laboratory environment in which the CoF can be estimated.
3.2. Evaluation of the Coefficient of Friction
The experimental data concerning the rolling of the SAE 1008 steel and acquired experimentally on the RCM were used to determine the operating conditions in which the two lubricants were used by quantifying the Hersey number H. Considering all rolled coils in SAE 1008 steel (14 and 9 respectively for GRL and SSL),
Table 2 shows the average value of (i) the strip’s speed (measured in the neutral section in each stand of the RCM) and (ii) the pressure along the entire roll/strip contact region.
The dynamic viscosity of the emulsions with 2% lubricant in demineralized water at 40 °C (which represented the working conditions of the lubricants on the RCM) were measured by using the MCR 702 Anton Paar rheometer. Tests allowed us to obtain the following results: 0.82 mPa∙s and 1.25 mPa∙s for SSL and GRL, respectively. The average Hersey number H calculated using Equation (1) is shown in
Table 3.
Considering that the minimum load on the CSM High-Temperature pin-on-disk Tribometer is 1 N (contact pressure P equal to 312.6 MPa) and that the maximum sliding speed that can be reached is 0.2 m/s, the 2% emulsions at 40 °C a viscosity too low to guarantee the replication of the same H values on the laboratory scale. For this reason, the tribological tests were conducted using pure lubricants at a temperature of 25 °C (the dynamic viscosity is equal to 92 mPa∙s and 84 mPa∙s for the SSL and the GRL, respectively), and three different sliding speeds have been analyzed: 0.005, 0.05, and 0.2 m/s.
Preliminary tests were conducted in order to evaluate the evolution of the acquired tangential force according to time: after starting the test, the measured value of the Coefficient of Friction showed to immediately reach a constant trend, and negligible changes then occurred during the test after about 40 s. Such a test duration was thus assumed for all tests. The evolution of the Coefficient of Friction µ as a function of the Hersey number H is shown in
Figure 6. The trend is represented by a second-degree polynomial function: moving from left to right, the sliding speed increases from the minimum value of 0.005 m/s to the maximum value of 0.2 m/s.
Using the H values in
Table 3, it is possible to define the value of the Coefficient of Friction in each stand by plotting the operating condition on the correspondent curve (gray curve for the GRL and black curve for the SSL).
The obtained values of CoF are shown in
Figure 7: the green lubricant is characterized by a higher lubricating capacity than the semi-synthetic one. In fact, the CoF at the roll/strip interface could be reduced by 9.1%, thus confirming the results obtained from the analysis of the rolling forces (force values were reduced by about 6% when using the GRL).
3.3. Effect of the Work Roll Diameter on the Rolling Forces
The work rolls’ diameter plays a primary role in the determination of the rolling force, being evidently related to the extension of the contact area between the strip and the roll, which varies the pressure distribution along the contact arc. Although the two-stand reversing mill monitored a large number of process parameters, no information regarding the value of the work roll’s diameter was available. According to Marcegaglia production’s practices, brand-new work rolls are assembled with an initial diameter equal to 490 mm. The quality of the roll’s surface is altered by the continuous contact with the strip during the rolling operations; therefore, at predefined intervals of time, rolls are disassembled, sent to the machining department, and machined to restore their original surface quality. Once the diameter approaches 430 mm, new work rolls are mounted.
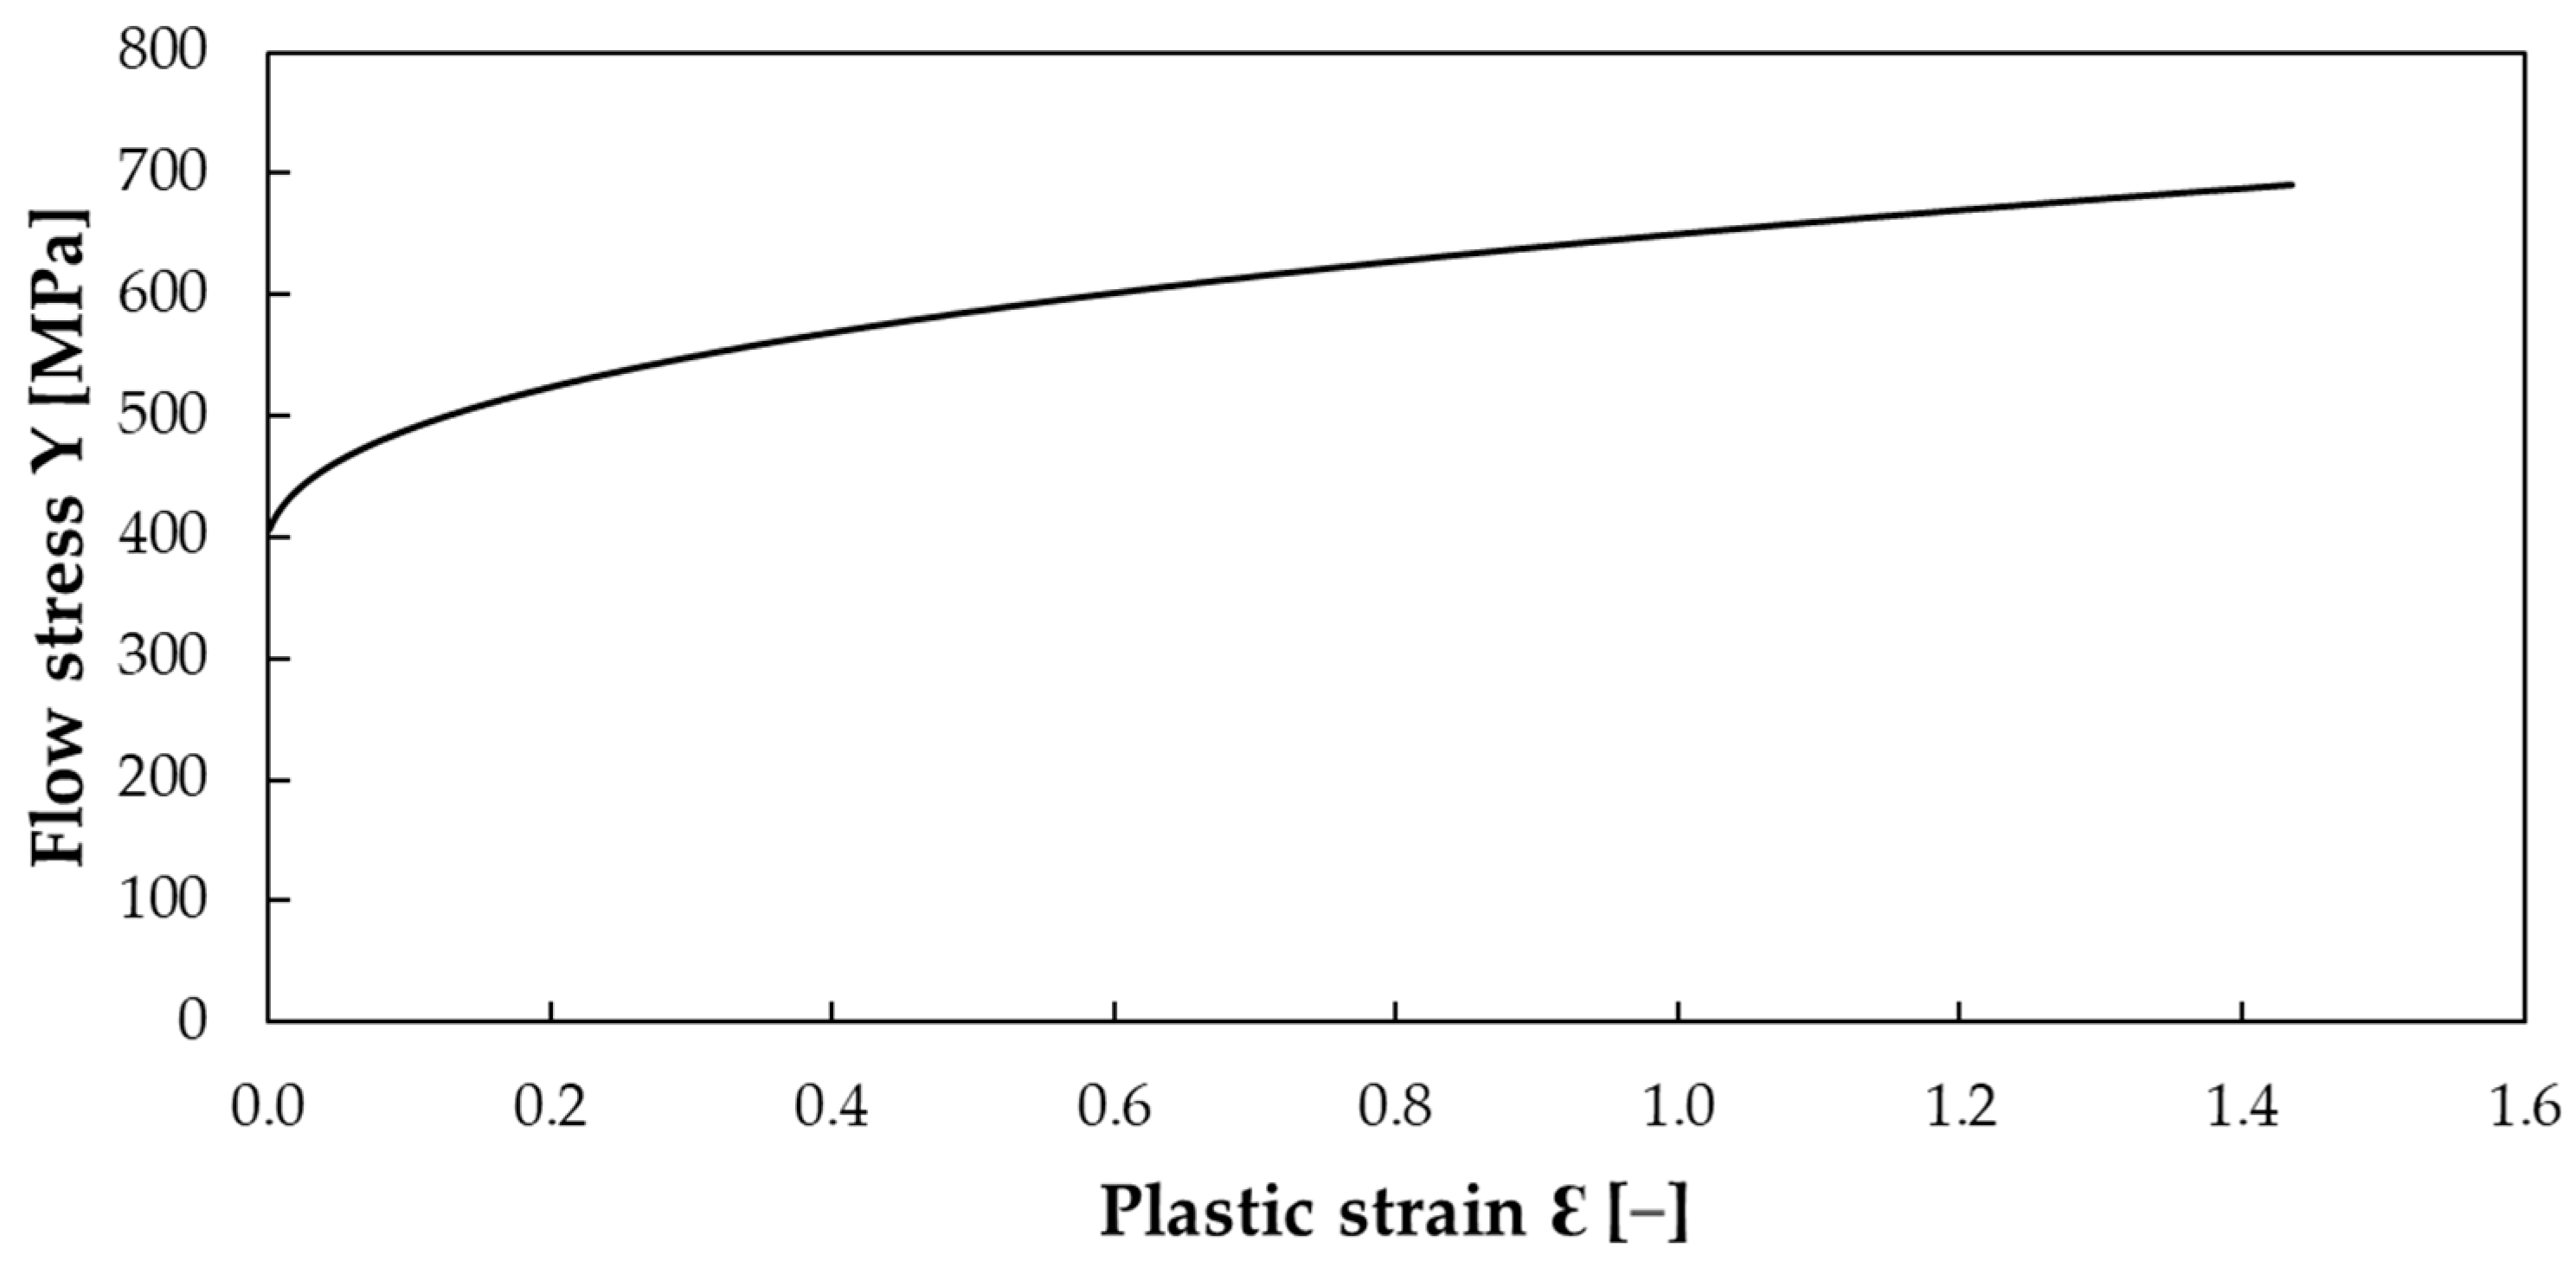
Since the work rolls’ diameter for each rolled strip is unknown, the comparison in terms of rolling forces could be influenced. For this reason, the 2D plane strain analytical model proposed by Bland and Ford [
19] was used to estimate the influence of the variation of the diameter on the rolling force. The analysis was conducted using experimental data concerning the rolling of the SAE 1008 steel in the first pass–first stand of the RCM (the flow stress curve provided by the supplier as a function of the plastic strain ε is shown in
Figure 8), characterized by a strip width equal to 1105 mm, reduced in thickness from 2.01 mm to 1.32 mm and rolled with an inward tension
equal to 27.14 MPa and a backward tension
equal to 94.37 MPa.
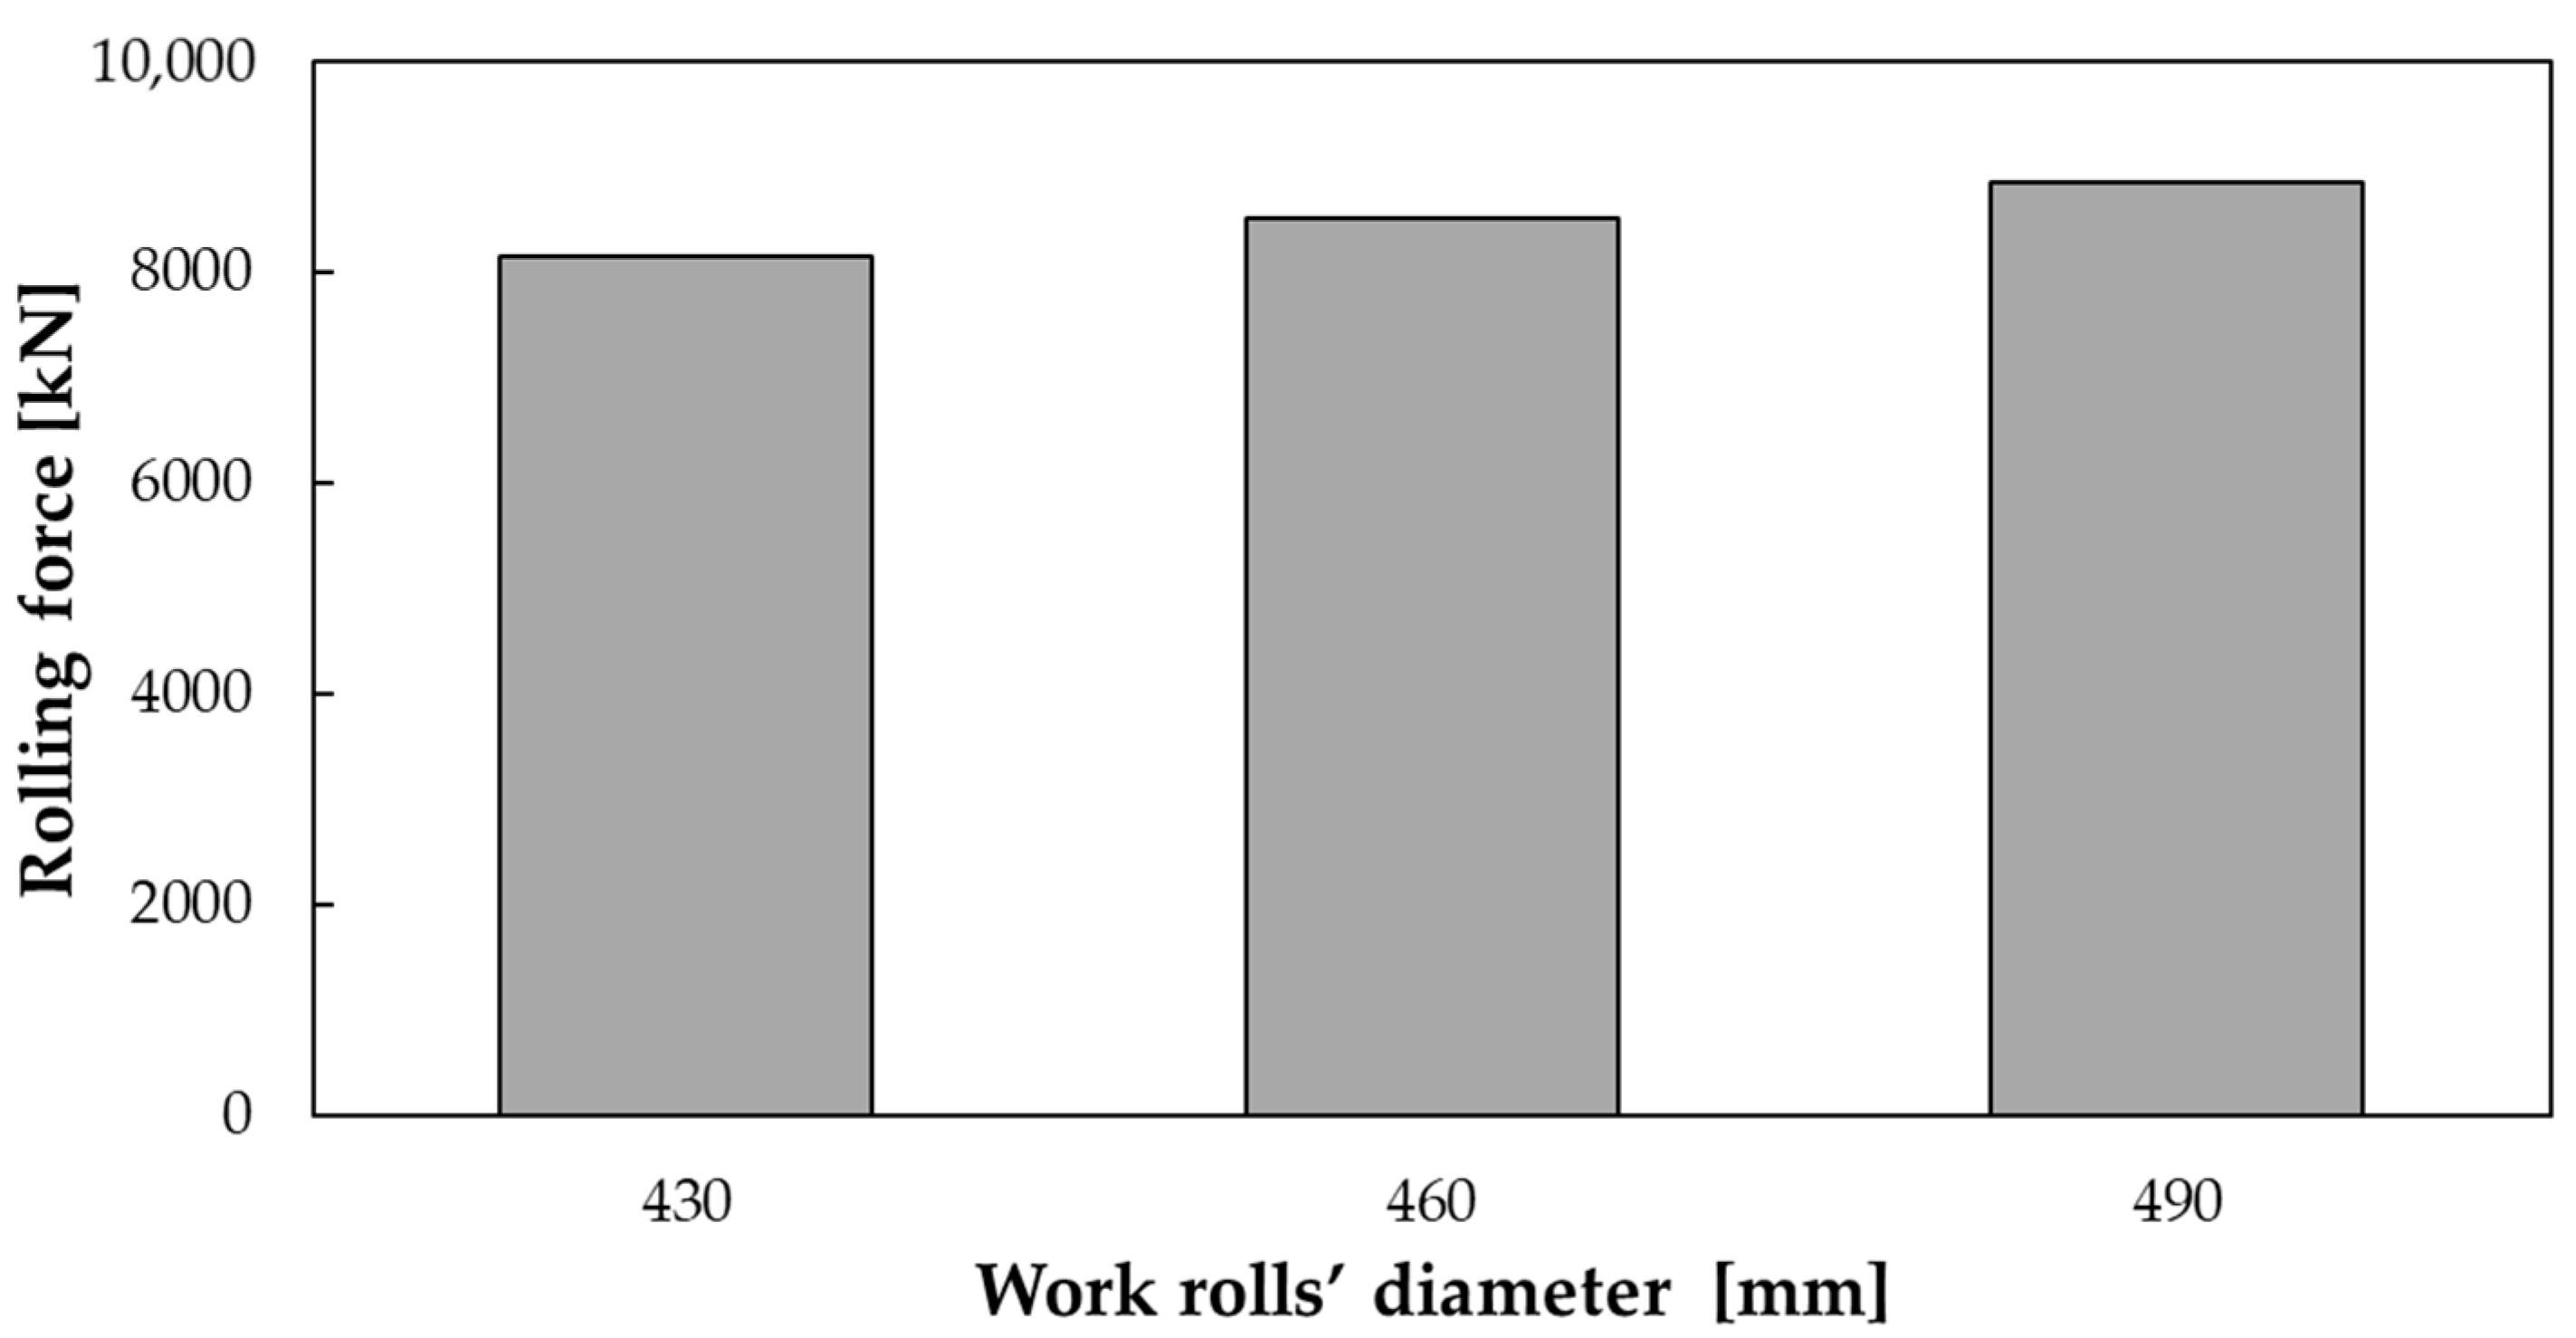
The Coefficient of Friction obtained from the tribological test conducted on the pin-on-disk tribometer related to the SAE 1008 at the first pass–first stand using the GRL was equal to 0.050. This value was used in the analytical model to estimate the rolling force at different values of the work rolls’ diameter: the maximum (490 mm), the minimum (430 mm), and the average value (460 mm) of their operating range.
Figure 9 shows the influence of the work rolls’ diameter on the rolling force.
The obtained result suggests that the rolling force value is increased as the work rolls’ diameter increases from 430 mm to 490 mm. In fact, in accordance with the theory, larger diameters lead to an increase in the arc of contact and, consequently, in the contact pressure.
Moreover, by increasing the arc length, the contact surface increases accordingly, thus leading to an increase in the rolling forces. Compared to the value measured in correspondence with the average diameter (460 mm), the value of the rolling force can be influenced by about 4% if the diameter is equal to the extreme value (430 mm or 490 mm). The result obtained allows us to justify the few cases in which the ΔF (%) parameter in
Figure 5 assumes a positive value. In such cases, in fact, the increase in rolling force using the GRL has never exceeded 1%: in the second pass–second stand of the SAE1006-2-0.35-1257 combination, it is equal to 0.41%; in the first pass–first stand of the SAE1008-2-0.47-1105 combination it is equal to 0.65% and in the first pass–first stand of the DN1.5SI-2.5-0.51-1020 combination it is equal to 0.02%.
Since the results of the global trend of the comparative analysis (reduction of the rolling forces using the GRL about equal to 5.6%) can be considered statistically valid (the number of combinations and the analyzed coils are high enough), the few cases in which the rolling force increases when using the GRL may be due to a smaller value of the work rolls’ diameter during the use of SSL in comparison to the one during the use of GRL in the rolling of the previously mentioned combinations. At the same time, the effect of the diameter on the general trend of the rolling forces can be considered minimal in comparison to the effect of the type of lubricant. In fact, the comparison between the two formulations will certainly contain both cases in which the effect of the diameter on the reduction of the rolling forces is positive and cases in which it is negative, thus justifying the interpretation of the reduction of the rolling forces of about 5.6% due to the GRL.
3.4. Effect of the Section on the Value of the Hersey Number
In the previous analysis, the operating conditions on the RCM were quantified through the Hersey number H, calculated using the strip speed in the neutral section and the average contact pressure along the entire contact arc. However, the strip speed increases between the input and the output section, whereas the contact pressure has an increasing and decreasing trend between the input and the neutral section and between the neutral and the output section, respectively. Since the H parameter is closely related to the strip speed and the contact pressure, it could be affected by the considered section.
The analytical model was used to estimate the influence of the variation of the contact arc section on the Hersey number H using the experimental data at the first pass–first stand of the SAE 1008 steel. An average value of the work rolls diameter (D = 460 mm) and the Coefficient of Friction related to the SAE 1008 at the first pass–first stand using the GRL (µ = 0.050) calculated from the tribological test were used. The contact pressure distribution over the arc of contact, which was obtained from the analytical model, is plotted in
Figure 10.
Three different points on the curve were analyzed: input section (I), neutral section (N), and output section (O). The values of the pressure (from the analytical model), of the strip speed (measured experimentally), and of the Hersey number H could be thus calculated in each section; such values have been listed in
Table 4.
The effect of the section on the Hersey number H can be considered minimal. In fact, the difference in comparison to the neutral section is equal to 0.3% in the input section and 1.2% in the output section. The assumption in paragraph 3.2 (neutral section of the contact arc) for the evaluation of the Coefficient of Friction can thus be considered robust.
3.5. Evaluation of the Economic Impact
In the previous sections, the capability of the GRL to reduce rolling forces, thanks to better lubricating performance, was demonstrated. The advantage of the green formulation with respect to the mineral one has also been assessed in terms of the quantity of material removed (in mm) from the work rolls by turning per kg of rolled material in the whole period of the investigation. The evolution of the quantity of material removed from the work rolls in
Figure 11 clearly suggests that the reduction of the contact severity at the roll/strip interface reflected in a remarkable reduction of the roll wear in almost each of the monitored 11 months (black dotted curve). Moreover, if considering that the cost of the turning operation can be quantified in EUR 300 per removed mm, the related average cost (over the same period of 11 months) for the material removal when using the GRL was equal to 0.001248 EUR/kg against the average value of 0.002082 EUR/kg for the SSL, with a remarkable drop in the machining-related costs (around 40%).


