Article

Kerf Geometry and Surface Roughness Optimization in CO2 Laser Processing of FFF Plates Utilizing Neural Networks and Genetic Algorithms Approaches

by
John D. Kechagias
1,*,
Nikolaos A. Fountas
2,
Konstantinos Ninikas
1 and
Nikolaos M. Vaxevanidis
2,*
1
Design & Manufacturing Lab (DML), Department of FWSD, University of Thessaly, 43100 Karditsa, Greece
2
Department of Mechanical Engineering, School of Pedagogical and Technological Education (ASPETE), 15122 Amarousion, Greece
*
Authors to whom correspondence should be addressed.
J. Manuf. Mater. Process. 2023, 7(2), 77; https://doi.org/10.3390/jmmp7020077
Submission received: 20 February 2023 / Revised: 14 April 2023 / Accepted: 17 April 2023 / Published: 18 April 2023
(This article belongs to the Special Issue Laser-Based Manufacturing II)

Abstract

:
This work deals with the experimental investigation and multi-objective optimization of mean kerf angle (A) and mean surface roughness (Ra) in laser cutting (LC) fused filament fabrication (FFF) 3D-printed (3DP), 4 mm-thick polylactic acid (PLA) plates by considering laser feed (F) and power (P) as the independent control parameters. A CO2 laser apparatus was employed to conduct machining experiments on 27 rectangular workpieces. An experimental design approach was adopted to establish the runs according to full-combinatorial design with three repetitions, resulting in 27 independent experiments. A customized response surface experiment was formulated to proceed with regression equations to predict the responses and examine the solution domain continuously. After examining the impact of F and P on mean A and mean Ra, two reliable prediction models were generated to model the process. Furthermore, since LC is a highly intricate, non-conventional machining process and its control variables affect the responses in a nonlinear manner, A and Ra were also predicted using an artificial neural network (NN), while its resulting performance was compared to the predictive regression models. Finally, the regression models served as objective functions for optimizing the responses with an intelligent algorithm adopted from the literature.

1. Introduction

Laser cutting (LC) is a thermal processing technique that severs the material by locally melting it, using a repeatedly pulsing or continuously immersed laser beam. As a result, a kerf is formed through relative motion between the beam and the workpiece surface. Laser cutting is used to cut an extensive range of materials (composites, papers, wooden plates, ceramics, metals, inorganics, organics, etc.) without regard for their hardness or electrical conductivity [1,2,3]. Laser beam cutting and other laser processing methods (laser finishing, engraving, welding, etc.) are applied extensively in many industrial applications, particularly in automotive and aerospace industries [4,5,6]. The post-processing of the objects formed by conventional or non-conventional techniques is critical for enhancing the final product grade [7,8,9]. As a result, fused filament fabrication (FFF) or material extrusion (MEX) is growing extensively in numerous engineering and industrial fields [10,11,12]. A workpiece is created by adding layers of material [13,14,15]. In addition, the filament material extrusion process creates opportunities for enhancing sustainability issues due to the customized demand for energy and materials [16,17,18]. One of the most naturally used biopolymers is polylactic acid (PLA), with the second largest volume of applications worldwide [19]. It is a recyclable, biodegradable, and bioactive thermoplastic originating from renewable sources such as sugarcane or corn starch. Moreover, PLA is a promising polymer for several customized applications, having the most negligible environmental impact compared to other thermopolymers [20,21].
Numerous investigations have studied various laser beam processing techniques. For example, different thermoplastics such as polypropylene (PP), polyethylene (PE), and phosphorylcholine (PC) thin plates were cut with a range of laser variable parameters, revealing that with low laser feed, the result has a more positive outcome when using a high-power laser [22,23]. In addition, several researchers have studied polymethyl methacrylate (PMMA) thin plates on different laser beam settings by investigating the kerf angle, surface roughness, and heat-affected zone [24,25,26].
Zhou and Mahdavian studied the cutting of nonmetallic materials experimentally and theoretically using a CO2 laser [27]. In addition, the cutting performance of the laser beam onto thin plates of PLA, ABS, PET-G, PLA/Wood, and PLA/CB manufactured by the material extrusion process has been studied for dimensional and surface property improvement [28,29,30,31,32,33].
Combinatorial experimental methodology contributes to well-organized documentation correlating a process’s input parameters to its corresponding outputs [34], as does response surface methodology [35,36]. The DOE approach is prominent in the full and fractional factorial design (FD) [37]. In order to attain the optimum results during a cut, efforts to concurrently optimize two or more control factors have been carried out, depending vastly on the test workpiece [38,39,40,41]. The post-processing of FFF is vital for most products, especially when strict precision requirements are imposed [42]. Note here that the shape accuracy of the FFF parts is affected by the 3D printing processing parameters such as layer thickness, nozzle temperature, printing speed, etc., and their inappropriate tuning causes material overflow, overheating, and gaps between layers, which in turn results in uneven corners and curling surfaces [17]. Therefore, precision laser-assisted post-processing can be an alternative to conventional machining for precision customized FFF parts used in assemblies or mechanisms.
The present study optimizes the surface properties of a PLA 3D-printed (3DP) thin plate processed by a laser beam utilizing soft computing techniques. The surface properties specified were the geometry of the mean kerf angle (A) and the cut’s mean surface roughness (Ra), as these two are the most critical according to the literature. It is worth mentioning that the published work on optimizing the laser cutting of 3D-printed parts is somewhat limited. The authors designed this work to have two key processing parameters after the literature review, and the research aim was mainly the multi-parameter, multi-objective optimization of CO2 laser cutting of a 3D-printed material (PLA thin plates) for the case of two inputs and two outputs with experimental design, mathematical RSM (regression surface models) and NN modeling, and MOGWO (grey wolf optimization algorithm) metaheuristic optimization algorithm adopted from the literature.
Therefore, additional research and experimentation are needed to determine the probability of successfully executing laser processing on 3DP thin workpieces on an industrial basis. This work displays how laser beam feed (F) and power (P) impact the kerf angle (A) and mean surface roughness (Ra) of a 3DP thermoplastic (PLA) during LC. Likewise, the laser feed and power results have been examined through response surface analysis and residual analysis. Cutting experiments were conducted using the full combinatorial approach, with three repetitions following the design of experiments (DOE) methodology. In contrast, regression analysis and artificial neural networks (ANN) were implemented to model the process. Finally, a multi-objective optimization problem was formulated and solved by implementing a modern metaheuristic algorithm found in the broader literature.

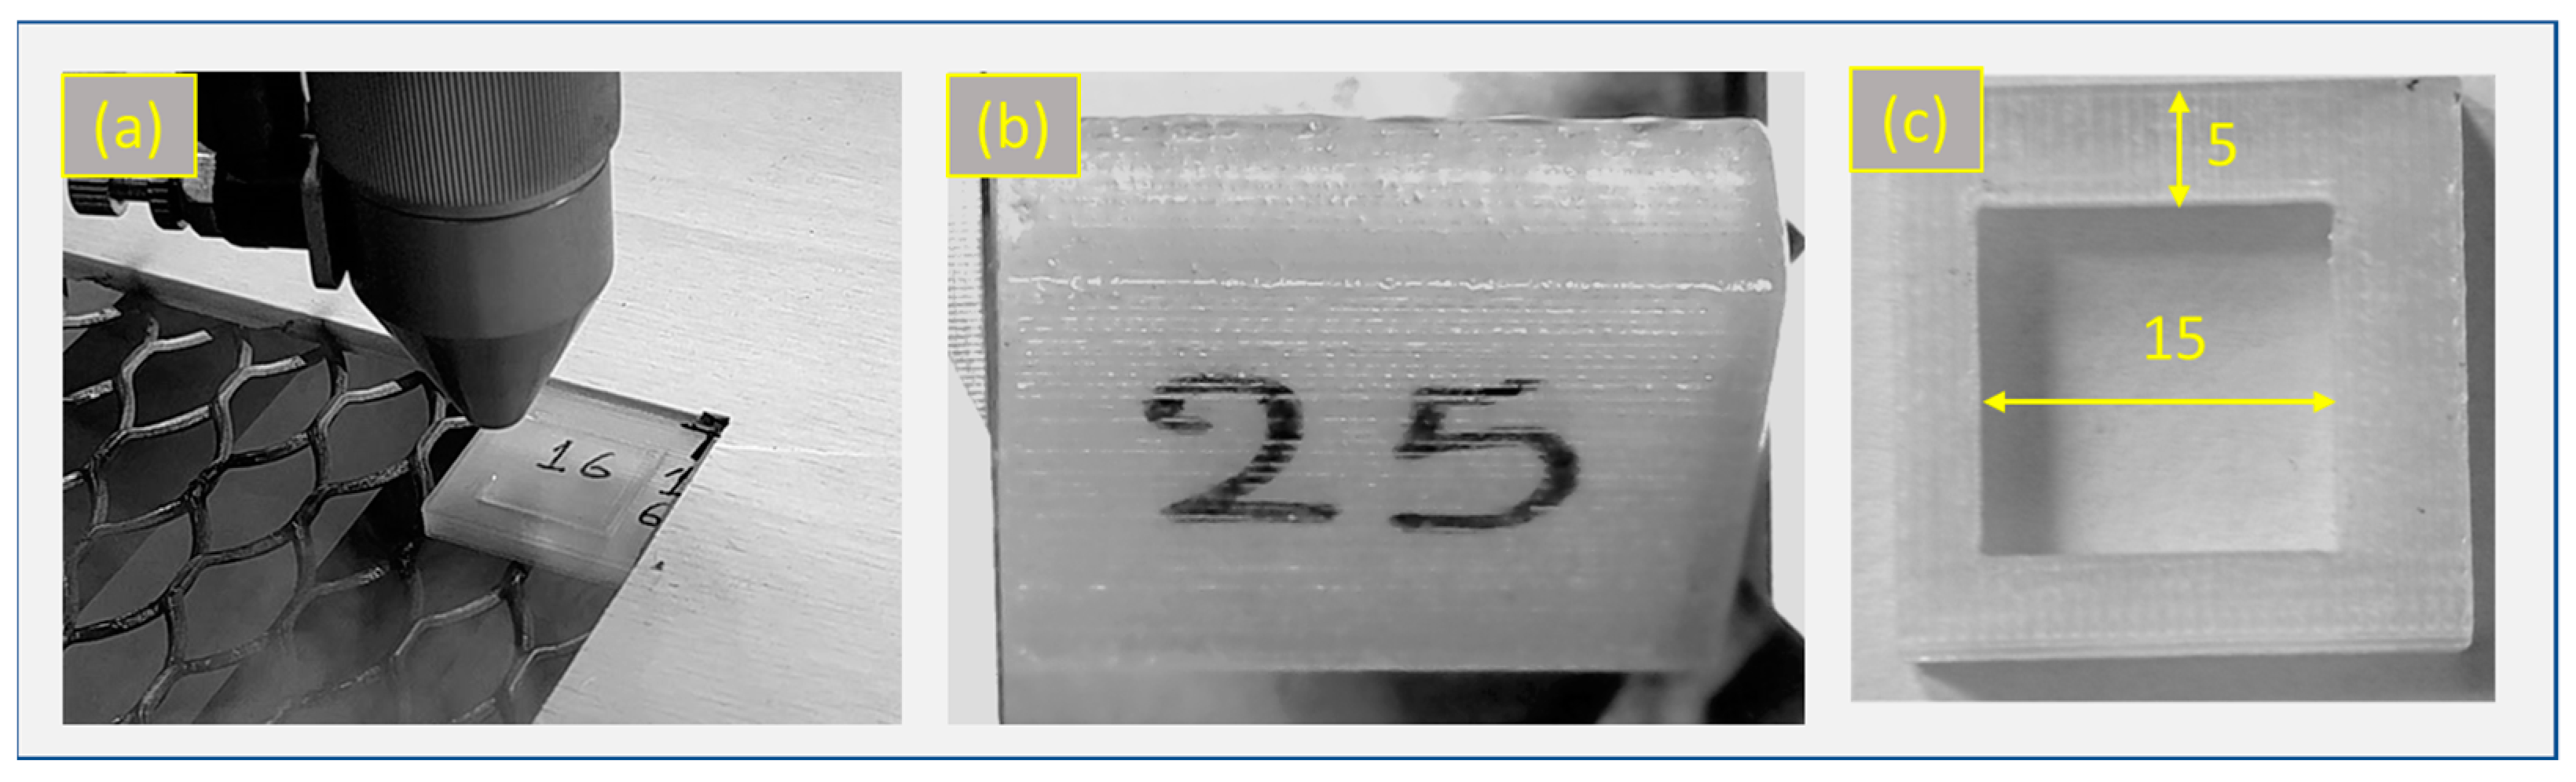
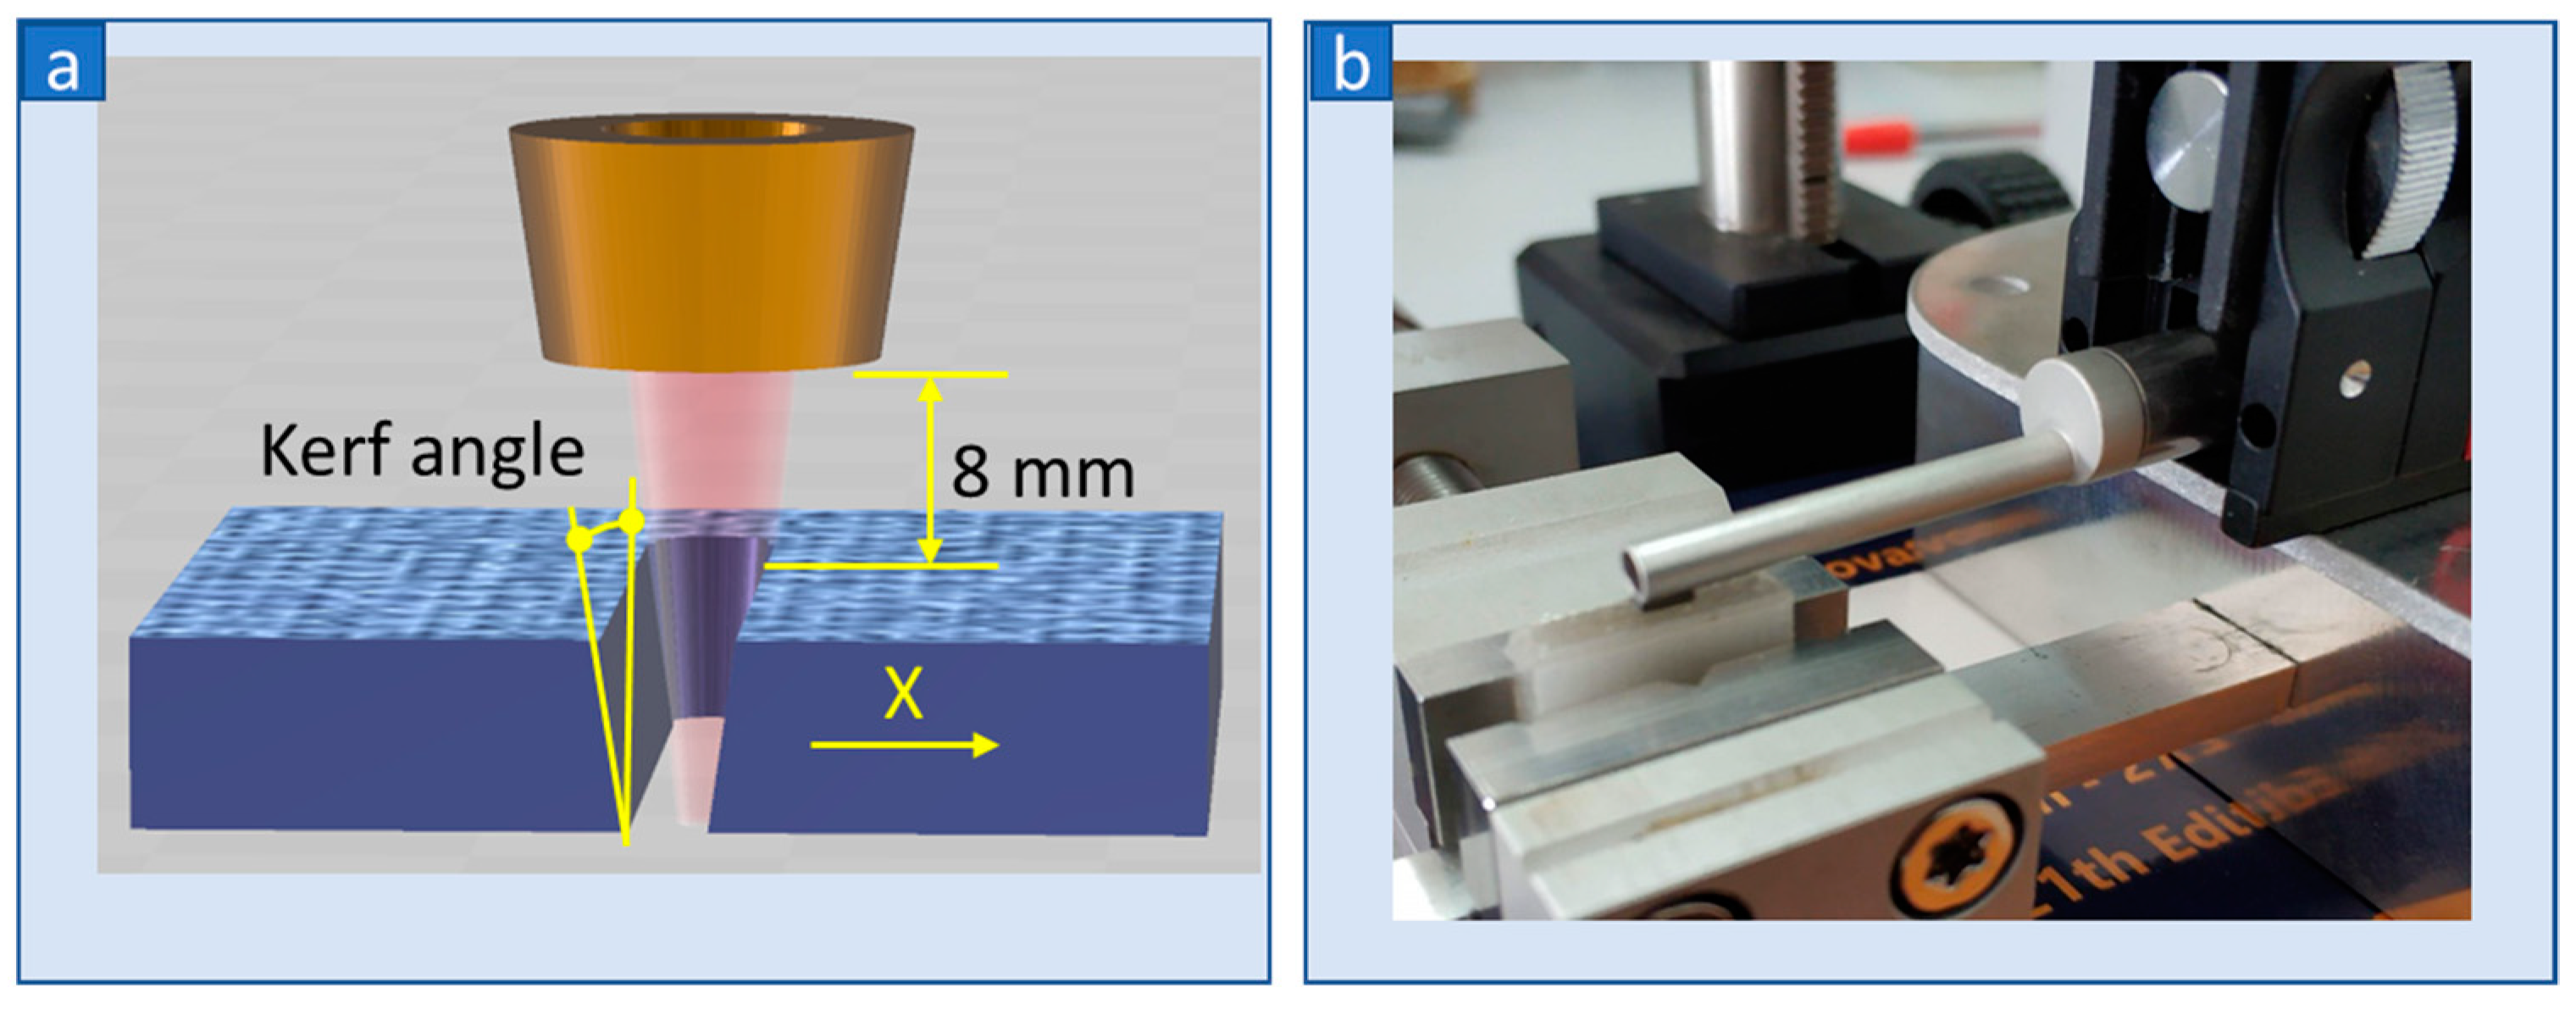
2. Materials and Methods

Test samples were manufactured with the filament material extrusion (FME) technique (Ender 3, Creality, Shenzhen, China) with a 0.4 mm nozzle diameter. Initially, twenty-seven 25 × 25 × 4 (mm) PLA cuboid thin plates were FME manufactured. Then, they were cut into 15 × 15 (mm) rectangular samples (see Figure 1b,c). The PLA 3DP cuboid parts were manufactured adopting the 0.2 mm layer height, 100% infill, 100% flow rate, zero raster angle, 220 °C nozzle temperature, 55 °C bed temperature, 2 shells (perimeters, floors, roofs), 100% fan, and 45 mm/s deposition speed. Note that the laser beam was positioned vertically or parallel to deposited strands of the FME plates during all laser cut work presented in this study.
The laser cut of samples was realized by a budget (BCL 1325B; 150 W max, 10.6 μm wavelength; 2 mm nozzle diameter; convergent type; 1 bar pressure air) continuous CO2 laser. The focus lens adjustments (three reflection mirrors and a focus lens) and all the laser details were presented in [3]. Therefore, a 0.3 mm laser spot was achieved at an 8 mm stand-off distance. Then, the samples were placed on the laser working table, as presented in Figure 1a.
The samples were cut with 8, 13, and 18 mm/s feed and 82.5, 90, and 97.5 W power (Table 1). The parameter level selection follows the previous work’s cutting setting of PMMA plates [3]. Note that the specific gravity of PMMA and PLA is very close (about 1.2 g/cm3), so all combinations were considered suitable for cutting the PLA samples. The nine combinations of the different sets of laser feed and power were repeated three times, resulting in twenty-seven independent experiments (Table 2). All experiments were cut in the laser bed at the same position and orientation (Figure 1a). Mean results from the measurements of kerf angles and roughness corresponding to cut surfaces along the X and Y axes were finally kept as final outputs for further statistical analysis.
The geometric measurements were taken utilizing the ImageJ software. Photos were taken utilizing a budget microscope and the Cooling Tech Microscope software. Figure 2a presents a cut parallel to strands, whereas Figure 2b presents a cut perpendicular to strands. Surface roughness measurements were taken with the DIAVITE profilometer (4 mm sample length, 0.001 μm accuracy). The Ra measurements were taken in the middle of the cutting surface on both X and Y sides and about 2 mm from the top surface.
The cutting surface and the vertical plane formed the kerf angle (see Figure 3a). The same microscope mentioned above examined kerf angles for each test sample. Ra was measured by preparing a special fixture device for clamping the test specimens, as depicted in Figure 3b.

3. Results and Discussion

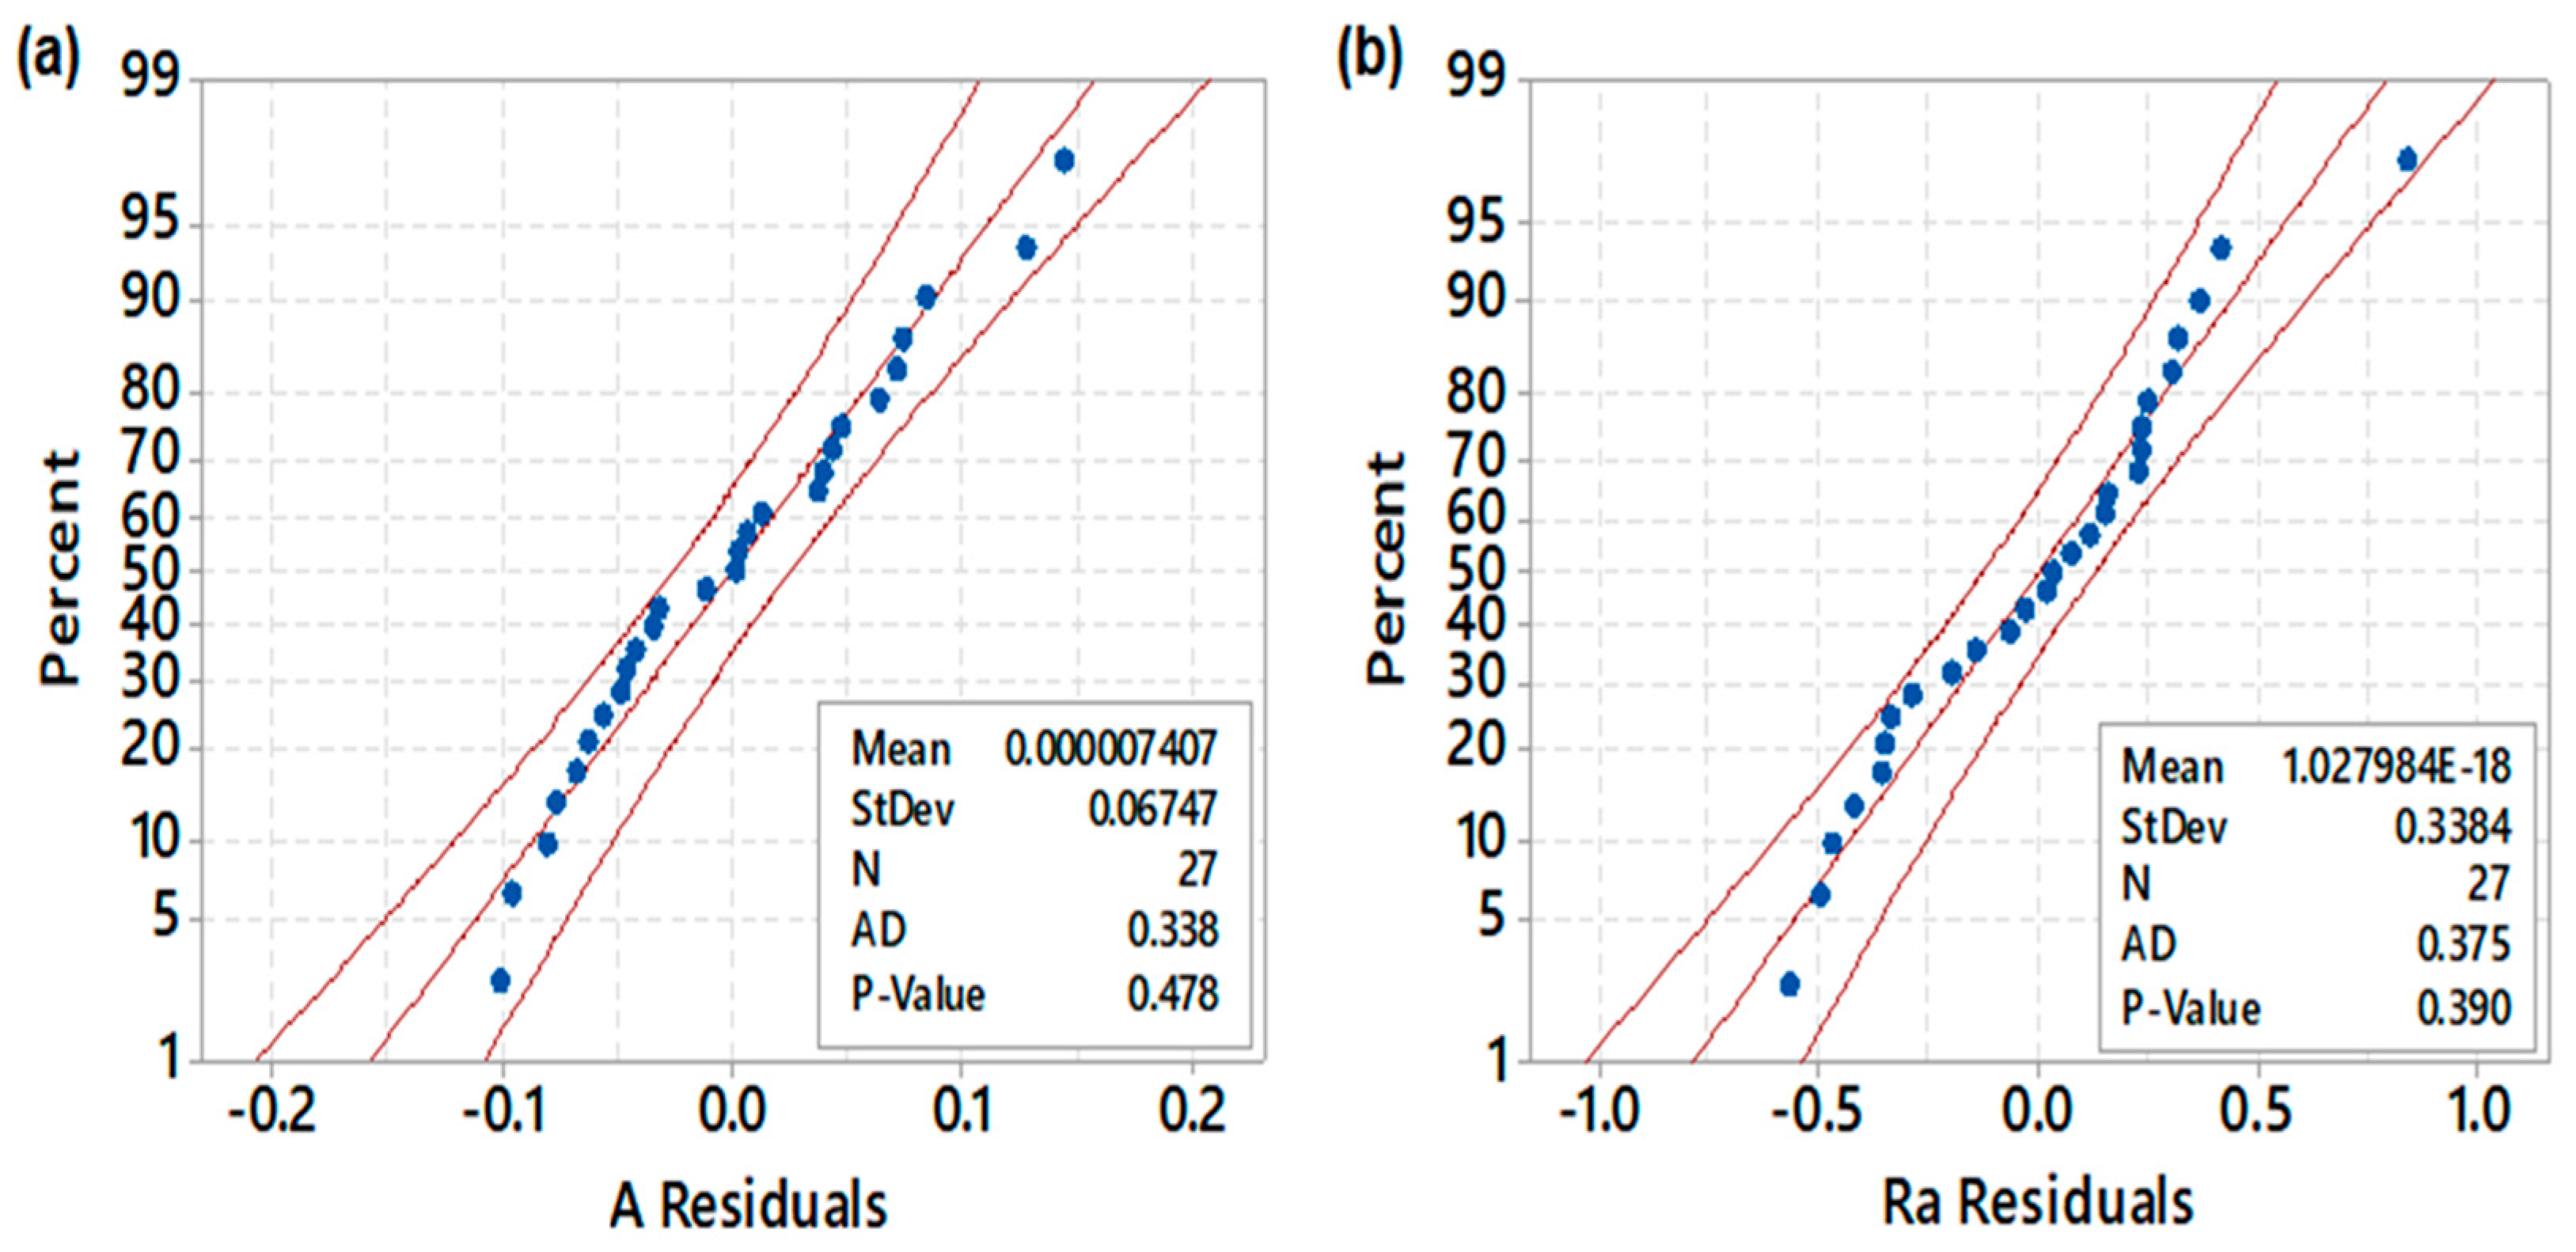
3.1. Full Quadratic Regression Models for CO2 Laser Cutting Objectives

Based on the results obtained for the two objectives of kerf angle and surface roughness, two second-order regression models were generated for correlating laser feed and laser power to kerf angle and surface roughness. The general regression equation for producing the models is given in Equation (1):
y = β 0 + i = 1 k β i x i + i = 1 k β i j x i 2 + i j β i j x i x j
y is the response—mean kerf angle A (°) and surface roughness (Ra, μm), “β” are the regression coefficients as computed by the least square fit, and xi is the different independent factors for i = 1 to k, where k is the total number of independent (control) factors (parameters). Nonlinearity and effects referring to laser feed and laser power on mean A and mean Ra have been examined with the aid of surface and contour plots utilizing the Minitab17 (Figure 4).
Surface and contour plots represent the simultaneous effect of laser feed and laser power on mean kerf angle (Figure 4a) and mean surface roughness (Figure 4b). It can be observed that when increased, laser feed (F) tends to reduce kerf angle, provided that laser power is set to high levels, i.e., 97.5 (W). In the case of mean surface roughness, Ra lower levels for laser feed need to be set. Laser power must be set with a value between 86 (W) and 96–97 (W), approximately. The trend in the response surfaces and contour plots shows that the LC problem is highly nonlinear, even when studying two independent process parameters on discrete objectives such as those selected in this work: mean A and Ra. The regression equations corresponding to these plots for mean A and Ra, with reference to the general equation shown in Equation (1), are given in Equations (2) and (3).
A (°) = 0.98 − 0.3177 × F + 0.0615 × P + 0.00464 × F2 − 0.000493 × P2 + 0.001682 × F × P,
Ra (μm) = 123.8 − 1.734 × F − 2.536 × P + 0.01947 × F2 + 0.01320 × P2 + 0.01566 × F × P
The ANOVA corresponding to the regression models for mean kerf angle and mean Ra is summarized in Table 3.
The probability of an F-value greater than the calculated F-value due to noise is indicated by the P-value. Therefore, if the P-value is less than 0.05, the importance of the related term is specified. Otherwise, if the P-value is higher than 0.05, a lack of fit exists. A negligible lack of fit is desirable because it indicates that any term excluded by the model is minor and that the developed model serves well. Finally, the normality test (Anderson–Darling) is employed to confirm the suitability of the models corresponding to the mean A and Ra. If the P-value for the normality test is lower than 0.05, it is supposed that the data do not follow a normal distribution. In this work, ANOVA indicates that both quadratic models are suitable for predicting the mean A and mean Ra with high contributions, i.e., 90.25% and 89.54%.

3.2. Validation

The adequacy of regression models for predicting the objectives of interest is validated by the Anderson–Darling normality test, where the P-value for normality plots is examined and should be found well above 0.05 in order to indicate that residuals follow a normal distribution. Suppose the P-values for residuals are located well above 0.05. In that case, the regression equations can be considered adequate to use the models to predict the responses and claim that they agree with experimental results. Figure 5 illustrates the results obtained by the Anderson–Darling normality test applied to the residuals obtained by ANOVA analysis for both regression models. Figure 5a presents the results corresponding to the mean kerf angle, while Figure 5b corresponds to the results concerning mean surface roughness. P-values corresponding to the residuals of mean kerf angle and mean surface roughness are equal to 0.478 and 0.390, respectively, and are well above 0.05. Therefore, the models agree with experimental results and can be used for predicting the responses.

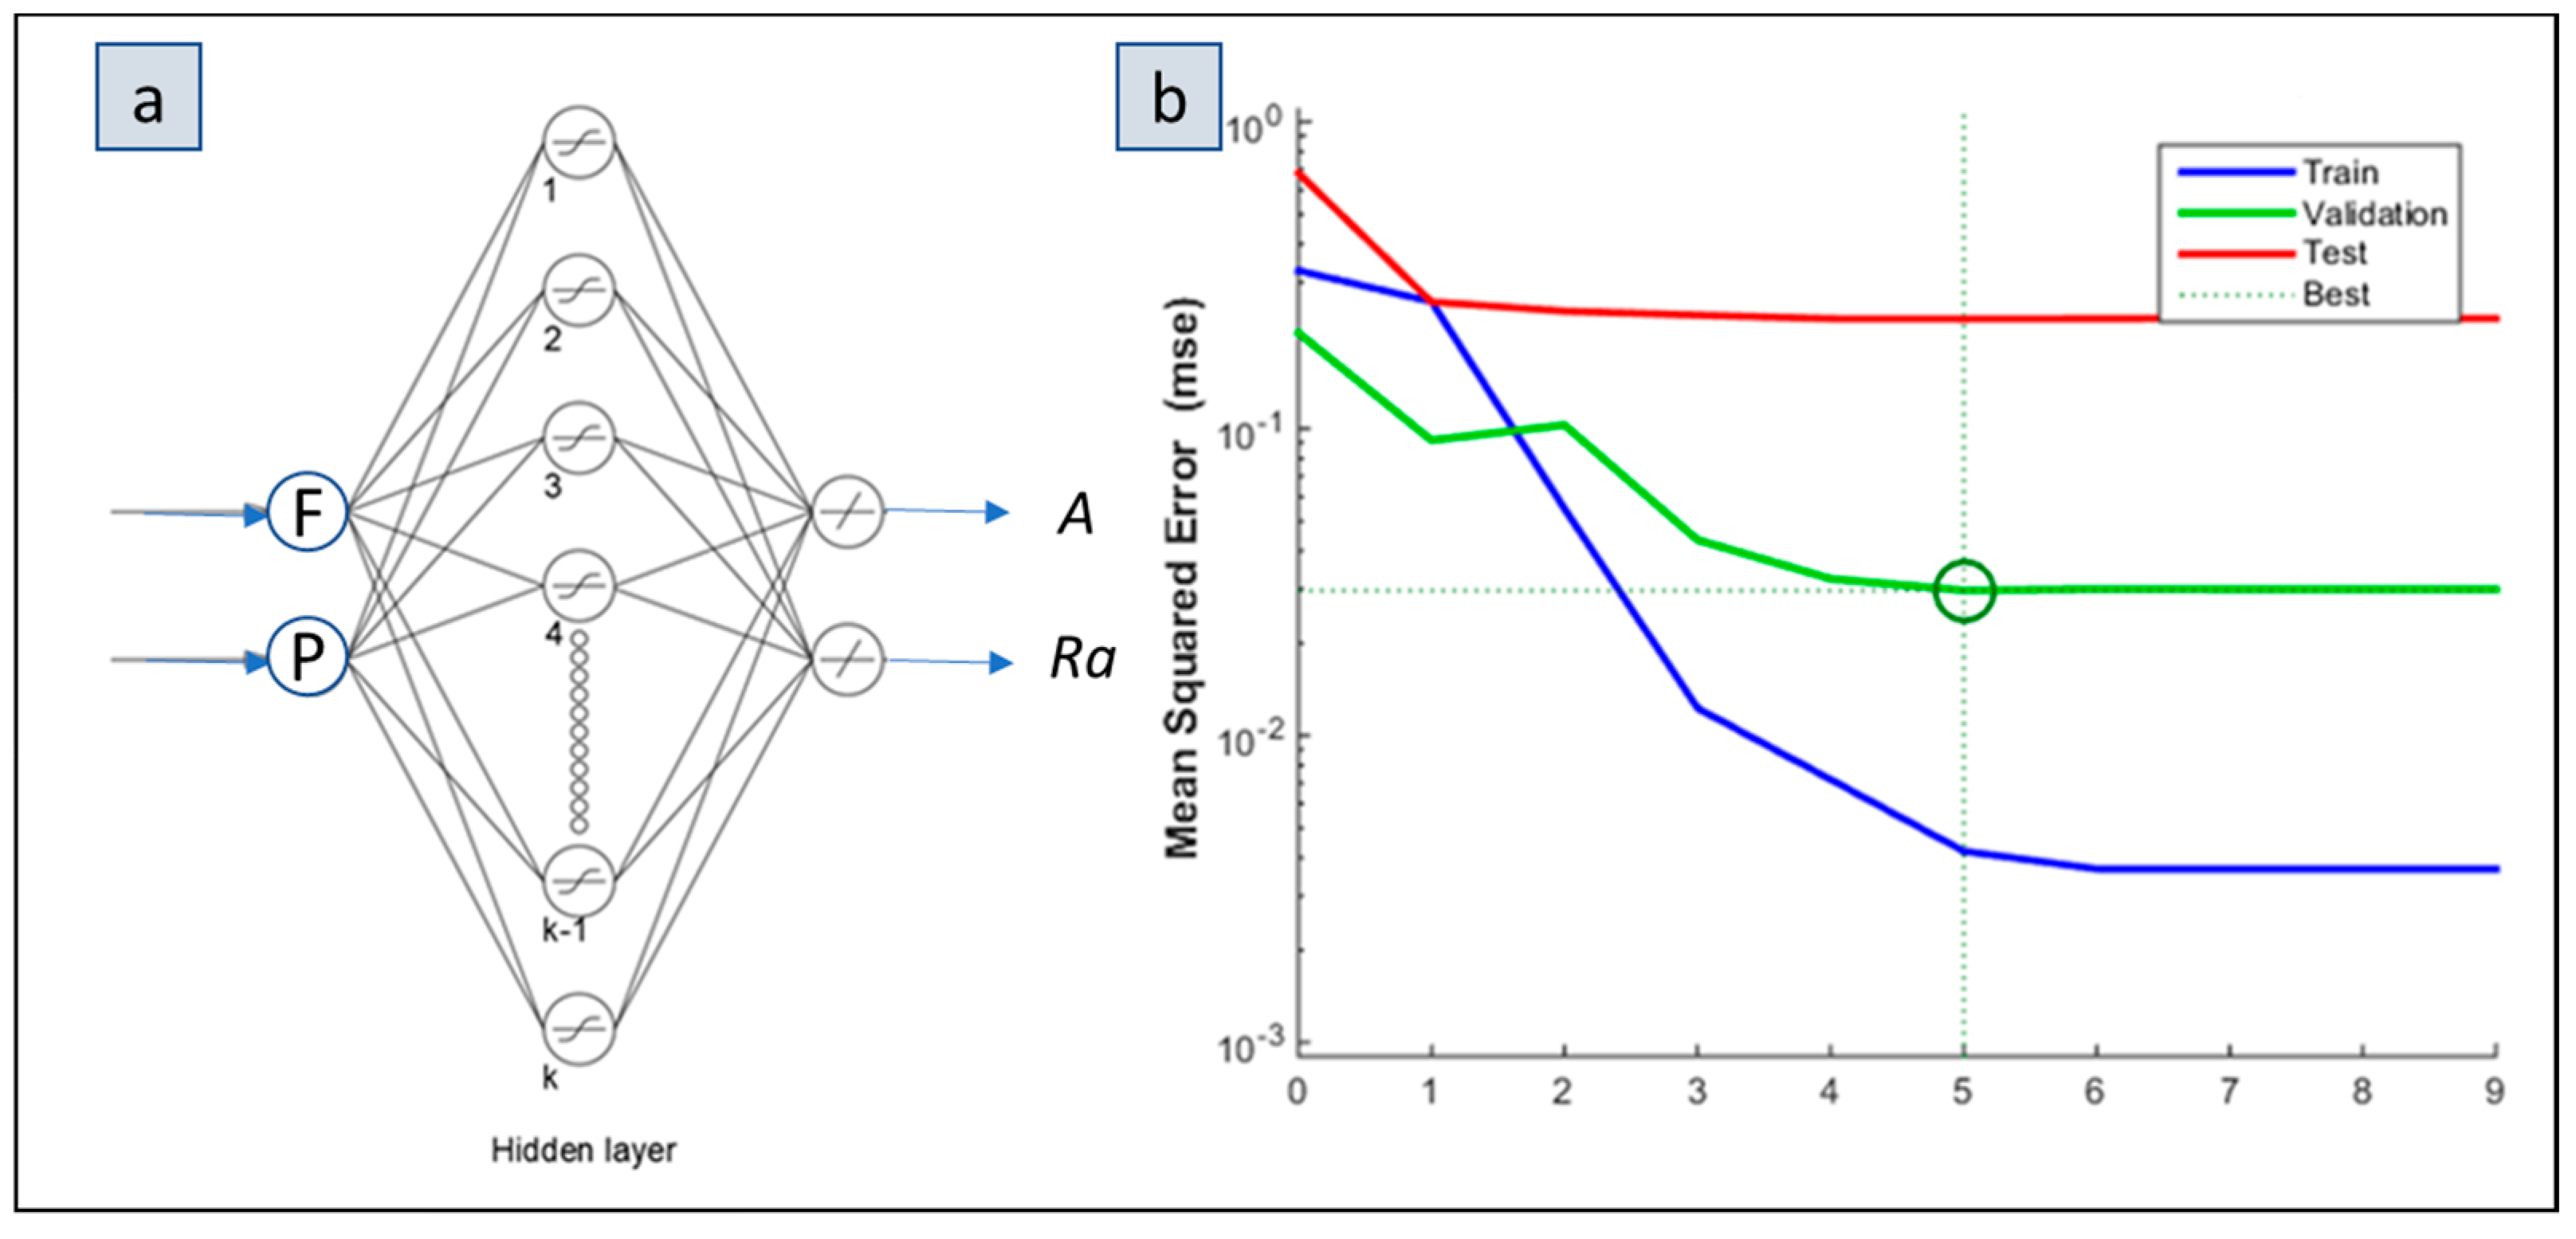
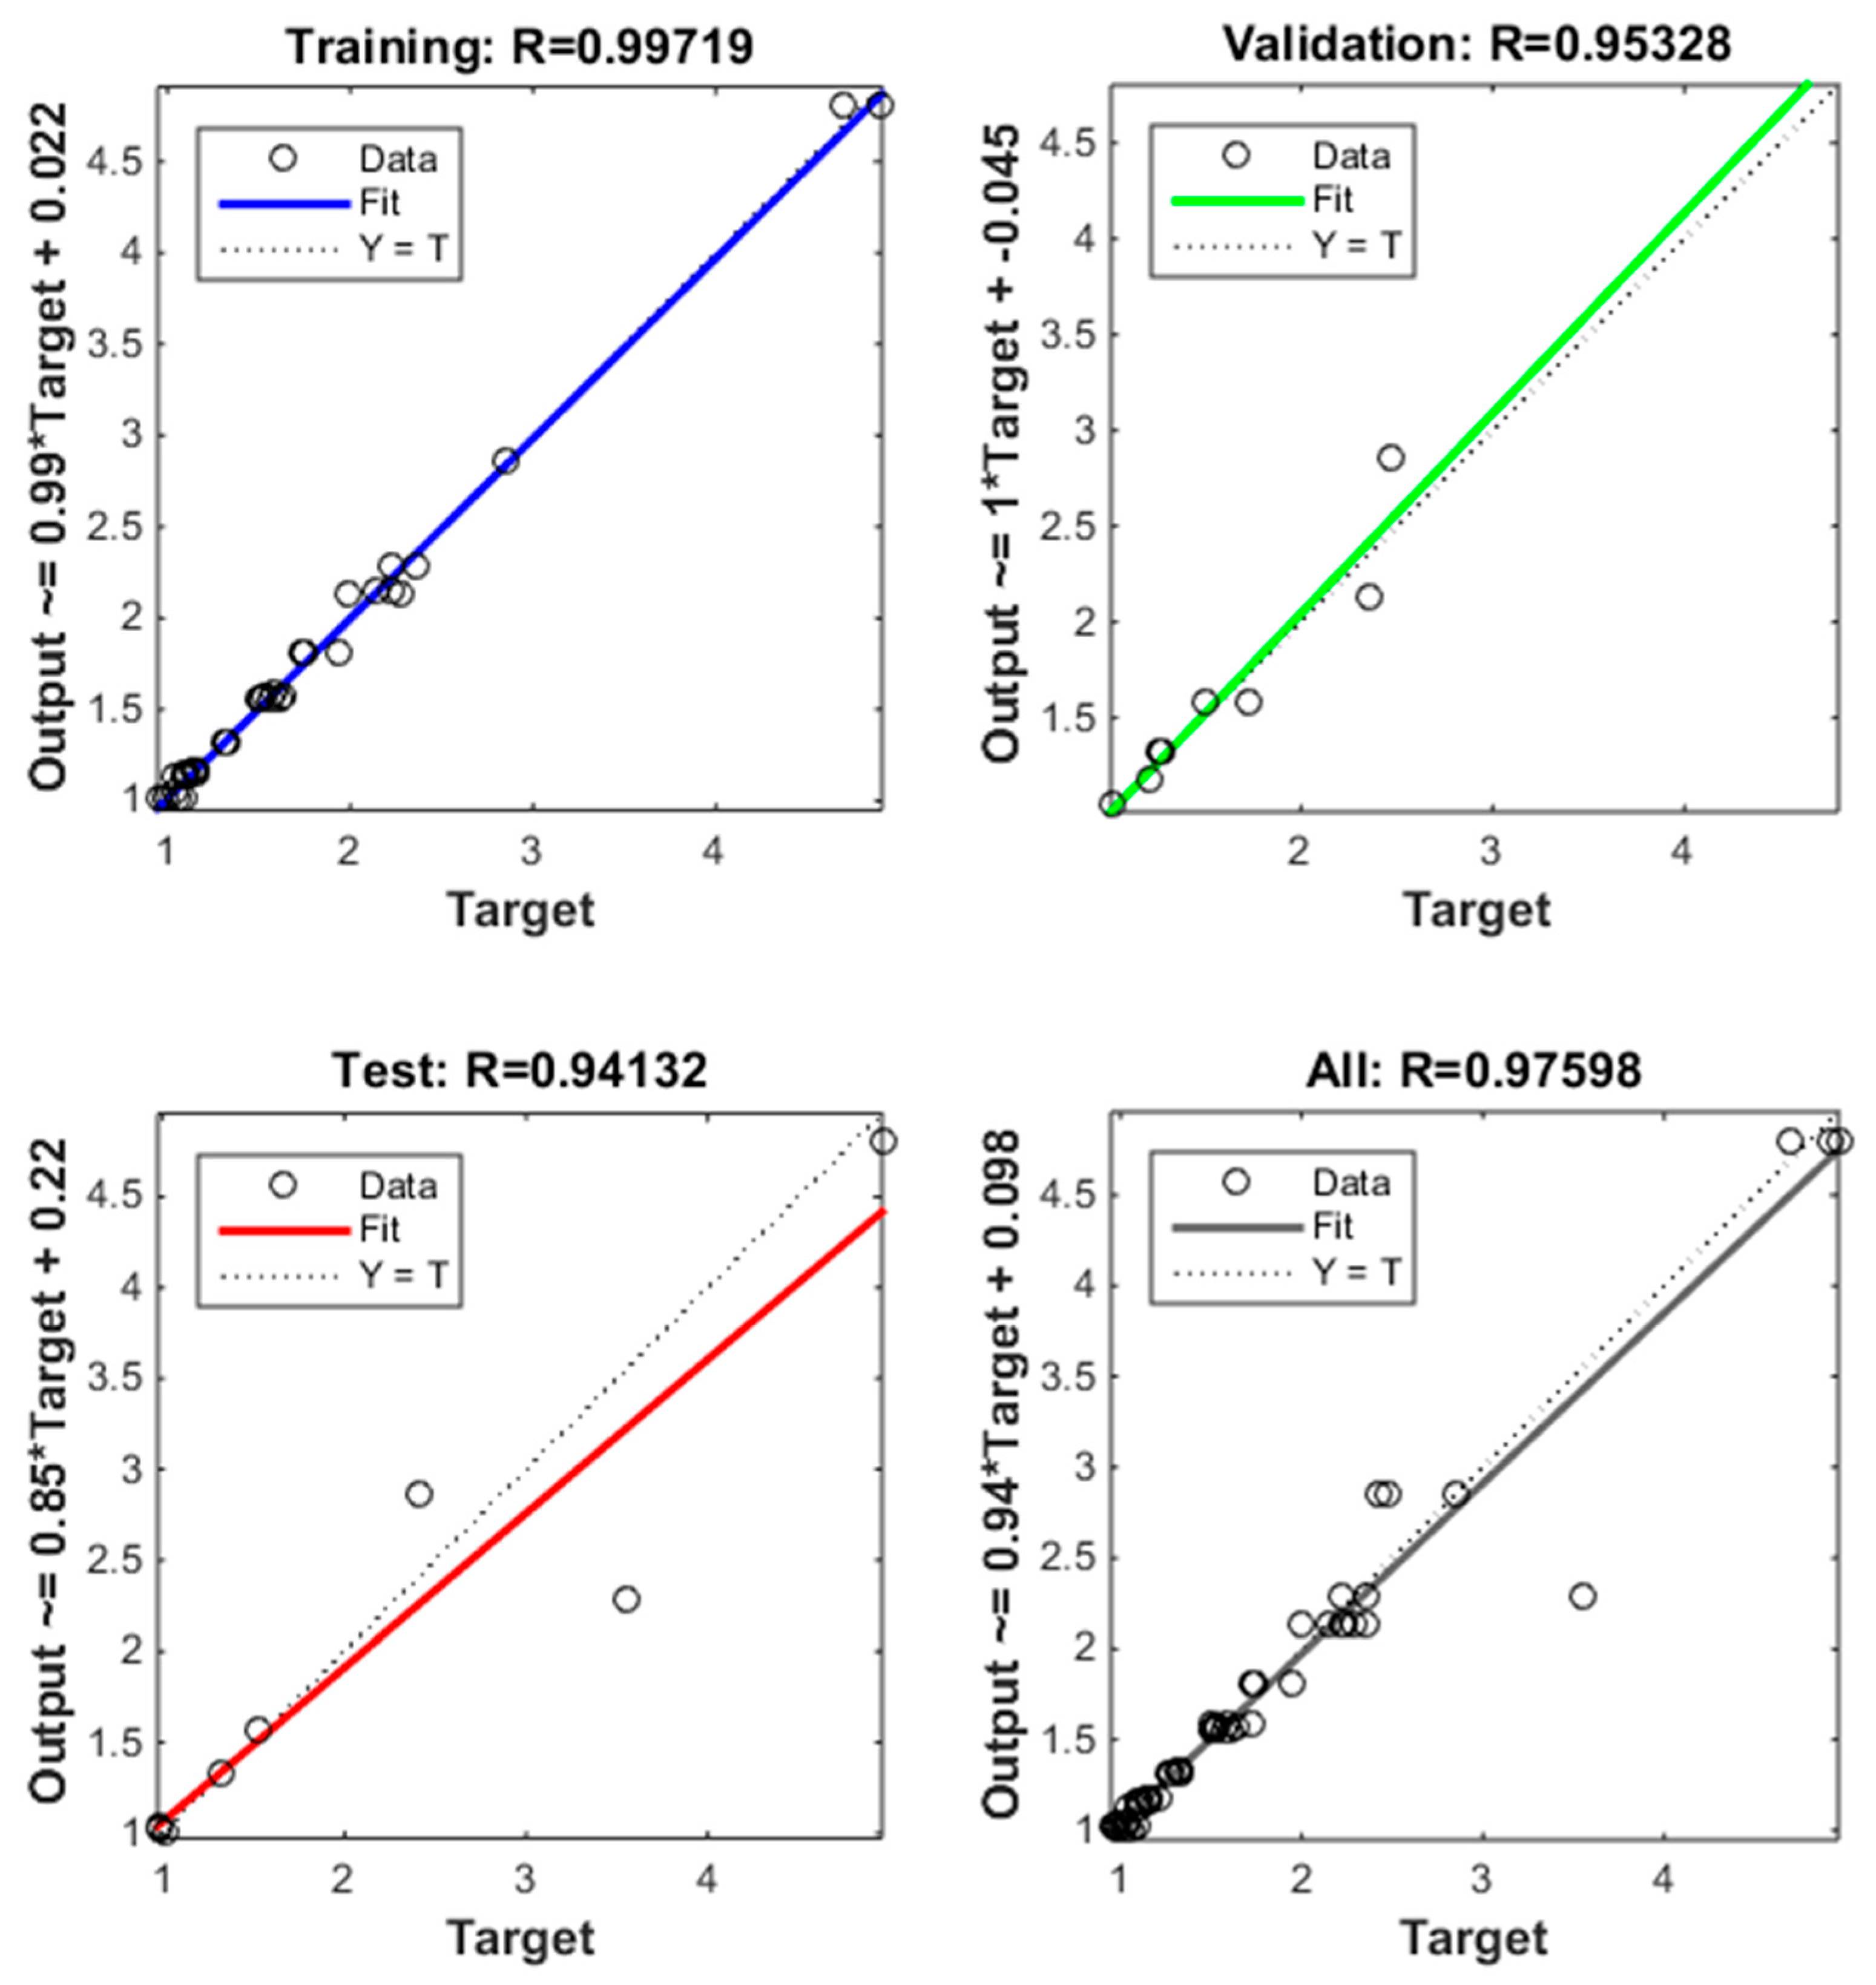
3.3. Neural Network Prediction

It has been shown that laser cutting operation exhibits high complexity despite the fact that only two independent variables have been considered (laser feed and laser power). This complexity may introduce difficulties in accurate response predictions using conventional approaches. To further examine the potential of accurate response prediction, several neural network architectures have been examined to obtain a reliable neural network capable of predicting both responses. In the current work, laser feed and laser power were considered as the two input parameters. Each of the parameters are represented by a single neuron and, consequently, the input layer in the neural network structure comprises two neurons. To introduce a reliable database to the network, the experimental results were considered, referring to the outputs and the independent variables along with their limit ranges. Results for kerf angle and surface roughness were used for training the network and examine the input–output correlation. Thereby, the database was divided into three discrete datasets, namely the training, testing, and validation (random selection of data division; 70% for training, 15% for validating, and 15% for testing). The training set was thoroughly used for adjusting the weights, the testing set was used for examining the network’s accuracy in its predictions, and the validation set was used for validating the results according to the training procedure. Consequently, the experiments were divided into three sets: thirty-eight for training, eight for validation, and eight for testing, i.e., fifty-six experimental data. Note here that Table 2 contains twenty-seven measurements for mean Ra and mean A, which were produced each by twenty-seven average values in the X and twenty-seven in the Y direction, and therefore fifty-six values were used for NN modelling.
Neural network training deals with the update in its connected weights so that the error among predicted and actual experimental outputs is minimized. The neural network architectures examined were tested using the standard backpropagation algorithm found in Mathworks® MATLAB® R2014b. In order to decide the final number of neurons referring to the hidden layer, several structures under a varying number of neurons were tested according to the methodology explained in [43]. The activation level for the neurons was determined by the tan-sigmoid transfer function, while “trainlm” was the training function. It was found that the 2-8-2 network topology was the most beneficial among those examined. Additionally, 0.001 mu (learning rate), 0.1 mu+ (increment factor), and 10 mu− (decrement factor) were decided upon.
This topology ended up with the best result for validation performance, equal to 0.029731 at epoch 5 and after 100 iterative evaluations. Figure 6a illustrates the ANN architecture with k = 8 neurons for the hidden layer, and Figure 6b shows the train, test, and validation results corresponding to the best validation performance (0.029731) and epochs.
To verify the prominence of this trained ANN architecture, the training set was presented to the ANN. Figure 7 depicts the regression analysis among the ANN response and related targets. It can be observed that there was a high correlation coefficient (R) among the outputs (predicted results), and the targets verify the ANN’s performance.
A comparison of the experimental results, the results predicted by the regression models, and the results predicted by the ANN are shown in Figure 8. Figure 8a refers to the results concerning the mean kerf angle, while Figure 8b refers to the results for mean surface roughness. It can be observed that both regression and ANN analysis exhibit almost equal prediction potentials referring to the objectives of mean kerf angle and surface roughness and the system’s nonlinear behavior.

3.4. Multi-Objective Optimization of CO2 LC Parameters

The optimization problem formulated in this work was based on the regression equations presented in Equations (2) and (3) for predicting mean kerf angle and mean surface roughness. The objective function, control parameters, and their optimization bounds considered are the same as those presented in the experimental design. In this two-objective optimization case, the two control parameters of laser feed and laser power were examined in a continuous form. The problem was solved by employing the multi-objective grey wolf optimization algorithm (MOGWO) developed by Mirjalili et al. [44]. The optimization problem was solved using a population size of grey wolves equal to 20 and a maximum number of generations equal to 1000 (i.e., a maximum number of function evaluations equal to 20,000). Since the current work is purely experimental, no comparative results based on multiple algorithmic simulations were produced using other competitive metaheuristics. Therefore, no statistical outputs are presented in this work. It is in the scope of the authors’ future research to compare several algorithms in terms of their performance on this problem and other manufacturing-related multi-objective problems for optimization.
The results obtained by the MOGWO algorithm are presented in the form of non-dominated optimal solutions in a Pareto front. The trend in the Pareto front representing the non-dominated optimal solutions clearly reveals the trade-off between the two objectives of minimum kerf angle and minimum surface roughness, mainly owing to laser feed. By examining the experimental results presented in the form of contour and surface plots, it can be deduced that optimization outputs are well-supported. The non-dominated optimal solutions are depicted in Figure 9, and they are also tabulated in Table 4.
By looking at the Pareto front, the spread of non-dominated solutions is uniformly distributed along the path line, while they almost equidistantly cover its trend, suggesting both coverage and spacing. This is very important when it comes to the selection of several solutions depending upon different requirements referring to the objectives. It is evident that no combinatorial solution such as the non-dominated solutions in multi-objective problems can simultaneously satisfy the objectives involved in the same degree. One objective will always be optimized at the expense of the rest. However, it is important to maintain advantageous outputs regardless of the trade-off among the antagonizing solutions. A typical example is shown through the combination between the results obtained by the MOGWO algorithm for the minimum mean kerf angle and minimum mean surface roughness in the first solution (Table 4). Based on the experimental results, the minimum attainable value for the mean kerf angle is found to equal 0.884°, corresponding to the value of 5.92 μm for mean surface roughness. The minimum value for mean kerf angle obtained by the MOGWO algorithm was found to equal 0.988°. This result is 10.53% worse compared to the actual experimental value of 0.884° for mean kerf angle. However, this result corresponds to the value of 2.645 μm for minimum mean surface roughness (see solution number 1 in Table 4). This result is 55.32% more beneficial at the expense of mean kerf angle. It should also be noted that the gain among the different non-dominated optimal solutions depends on the quality of predictions by regression models rather than the algorithm itself. If the experimental error is low, then there is a higher chance that regression modeling will attain a higher correlation among control factors and responses. Thereby, the resulting non-dominated solutions will occur with higher quality and overall gain. The maximum (worst) experimental result for mean kerf angle is 1.612° against the maximum (worst) result obtained by MOGWO, which is 1.4277°. In other words, the worst result corresponding to the non-dominated solution for mean kerf angle is 11.43% more beneficial than that which appeared in the actual experiment. Similarly, the maximum (worst) experimental result for mean surface roughness is 6.19 μm against the maximum (worst) result obtained by MOGWO, which is 2.6448 μm. This means that the worst result corresponding to the non-dominated solution for mean surface roughness is 57.27% more beneficial compared to the actual experimental result. The computational time required by the MOGWO algorithm to perform 20,000 function evaluations was approximately 2 min.

4. Conclusions

This work examines the results of two key parameters, laser feed and laser power, on the responses of mean Ra and mean A when it comes to the CO2 laser cutting of 3DP polylactic acid (PLA) plates. The responses were modeled using regression analysis and neural networks whilst being simultaneously optimized by implementing the grey wolf optimization algorithm (MOGWO) adopted from the literature. The findings of this work are summarized below:
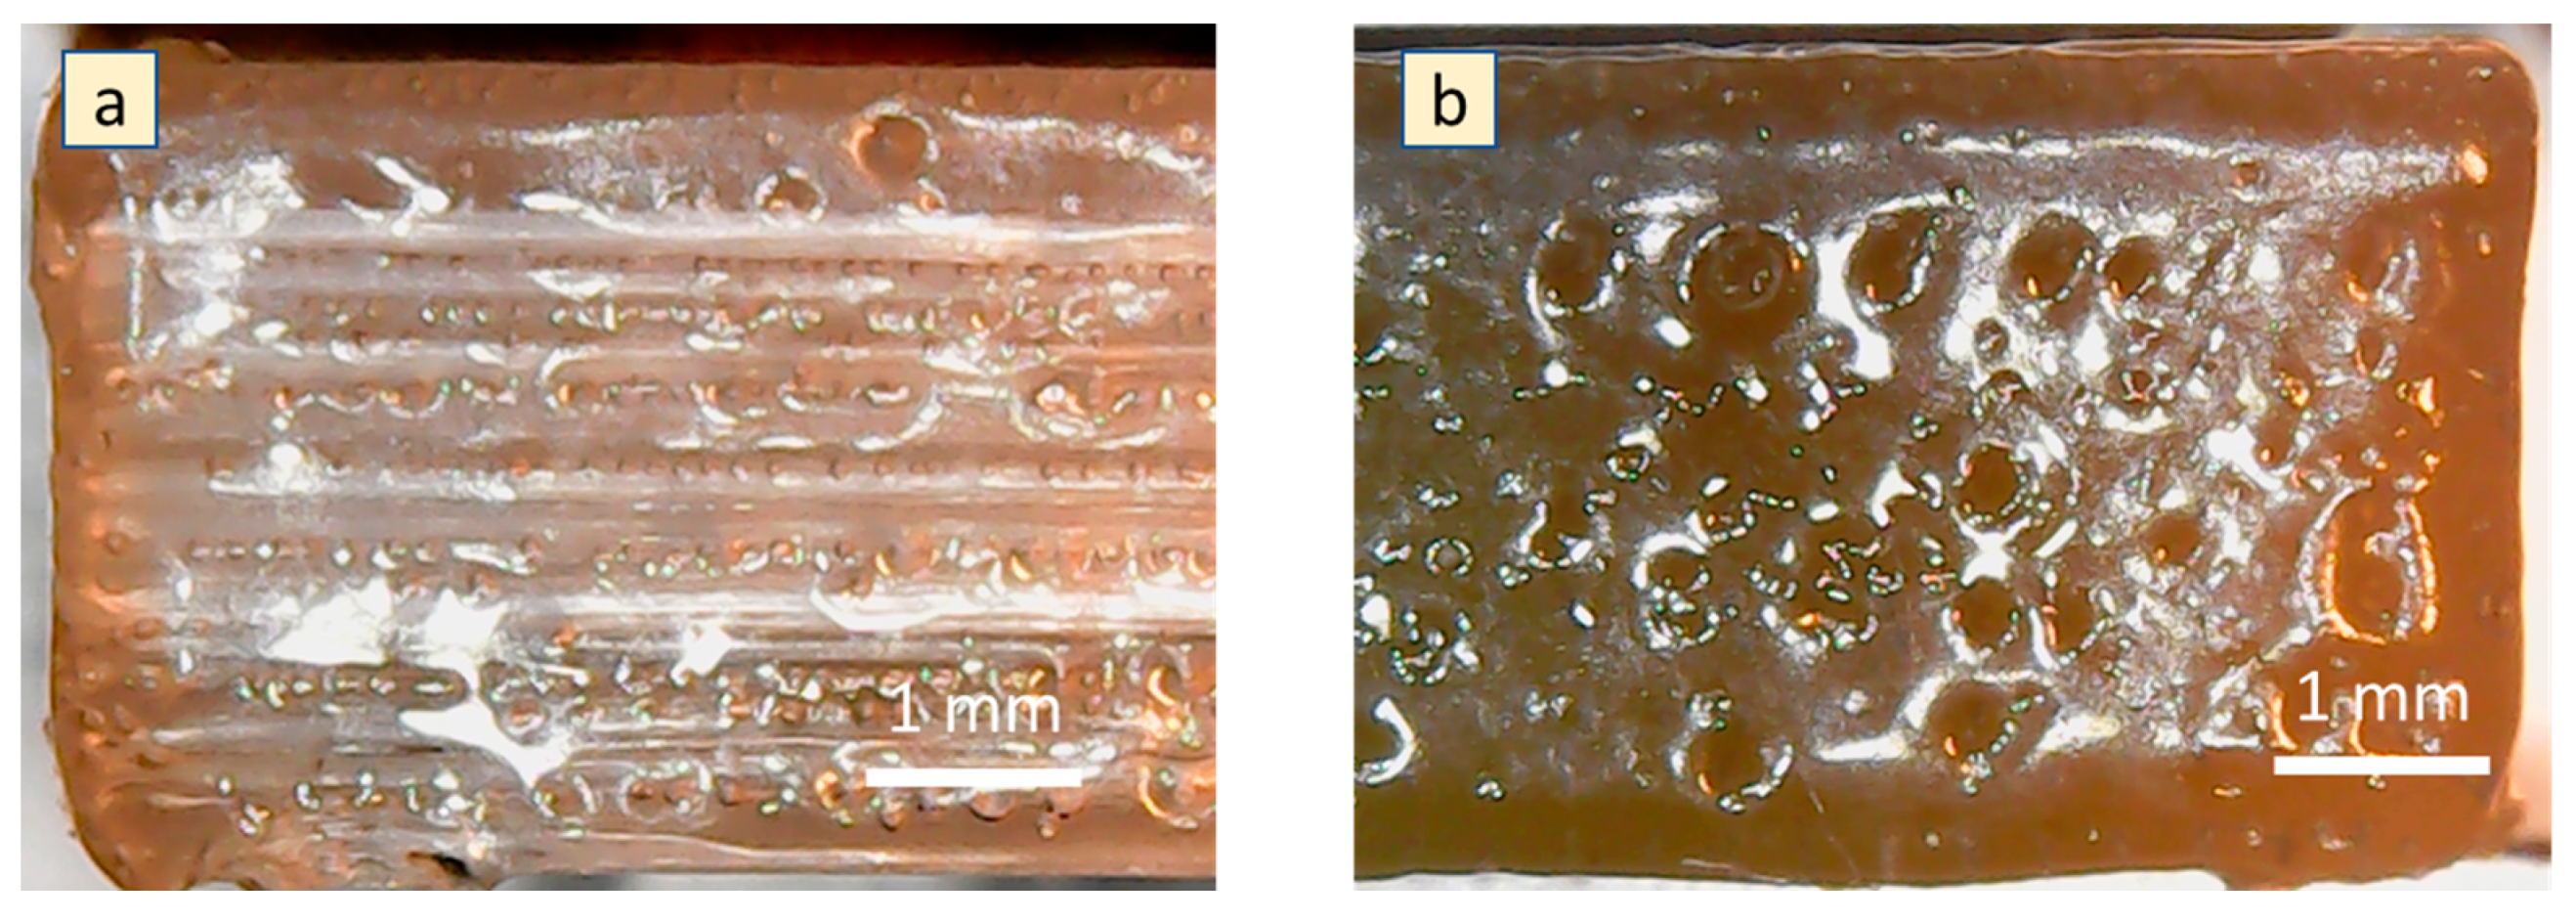
  • The kerf angle and Ra of the PLA 3DP samples cut by the CO2 laser are affected by the direction of the filament strands during the 3DP, as well as feed (F) and power (P) parameters.
  • In general, when laser feed increases or the power decreases, the energy per unit area decreases, resulting in smaller bottom kerf widths and energy redistribution inside the cutting area.
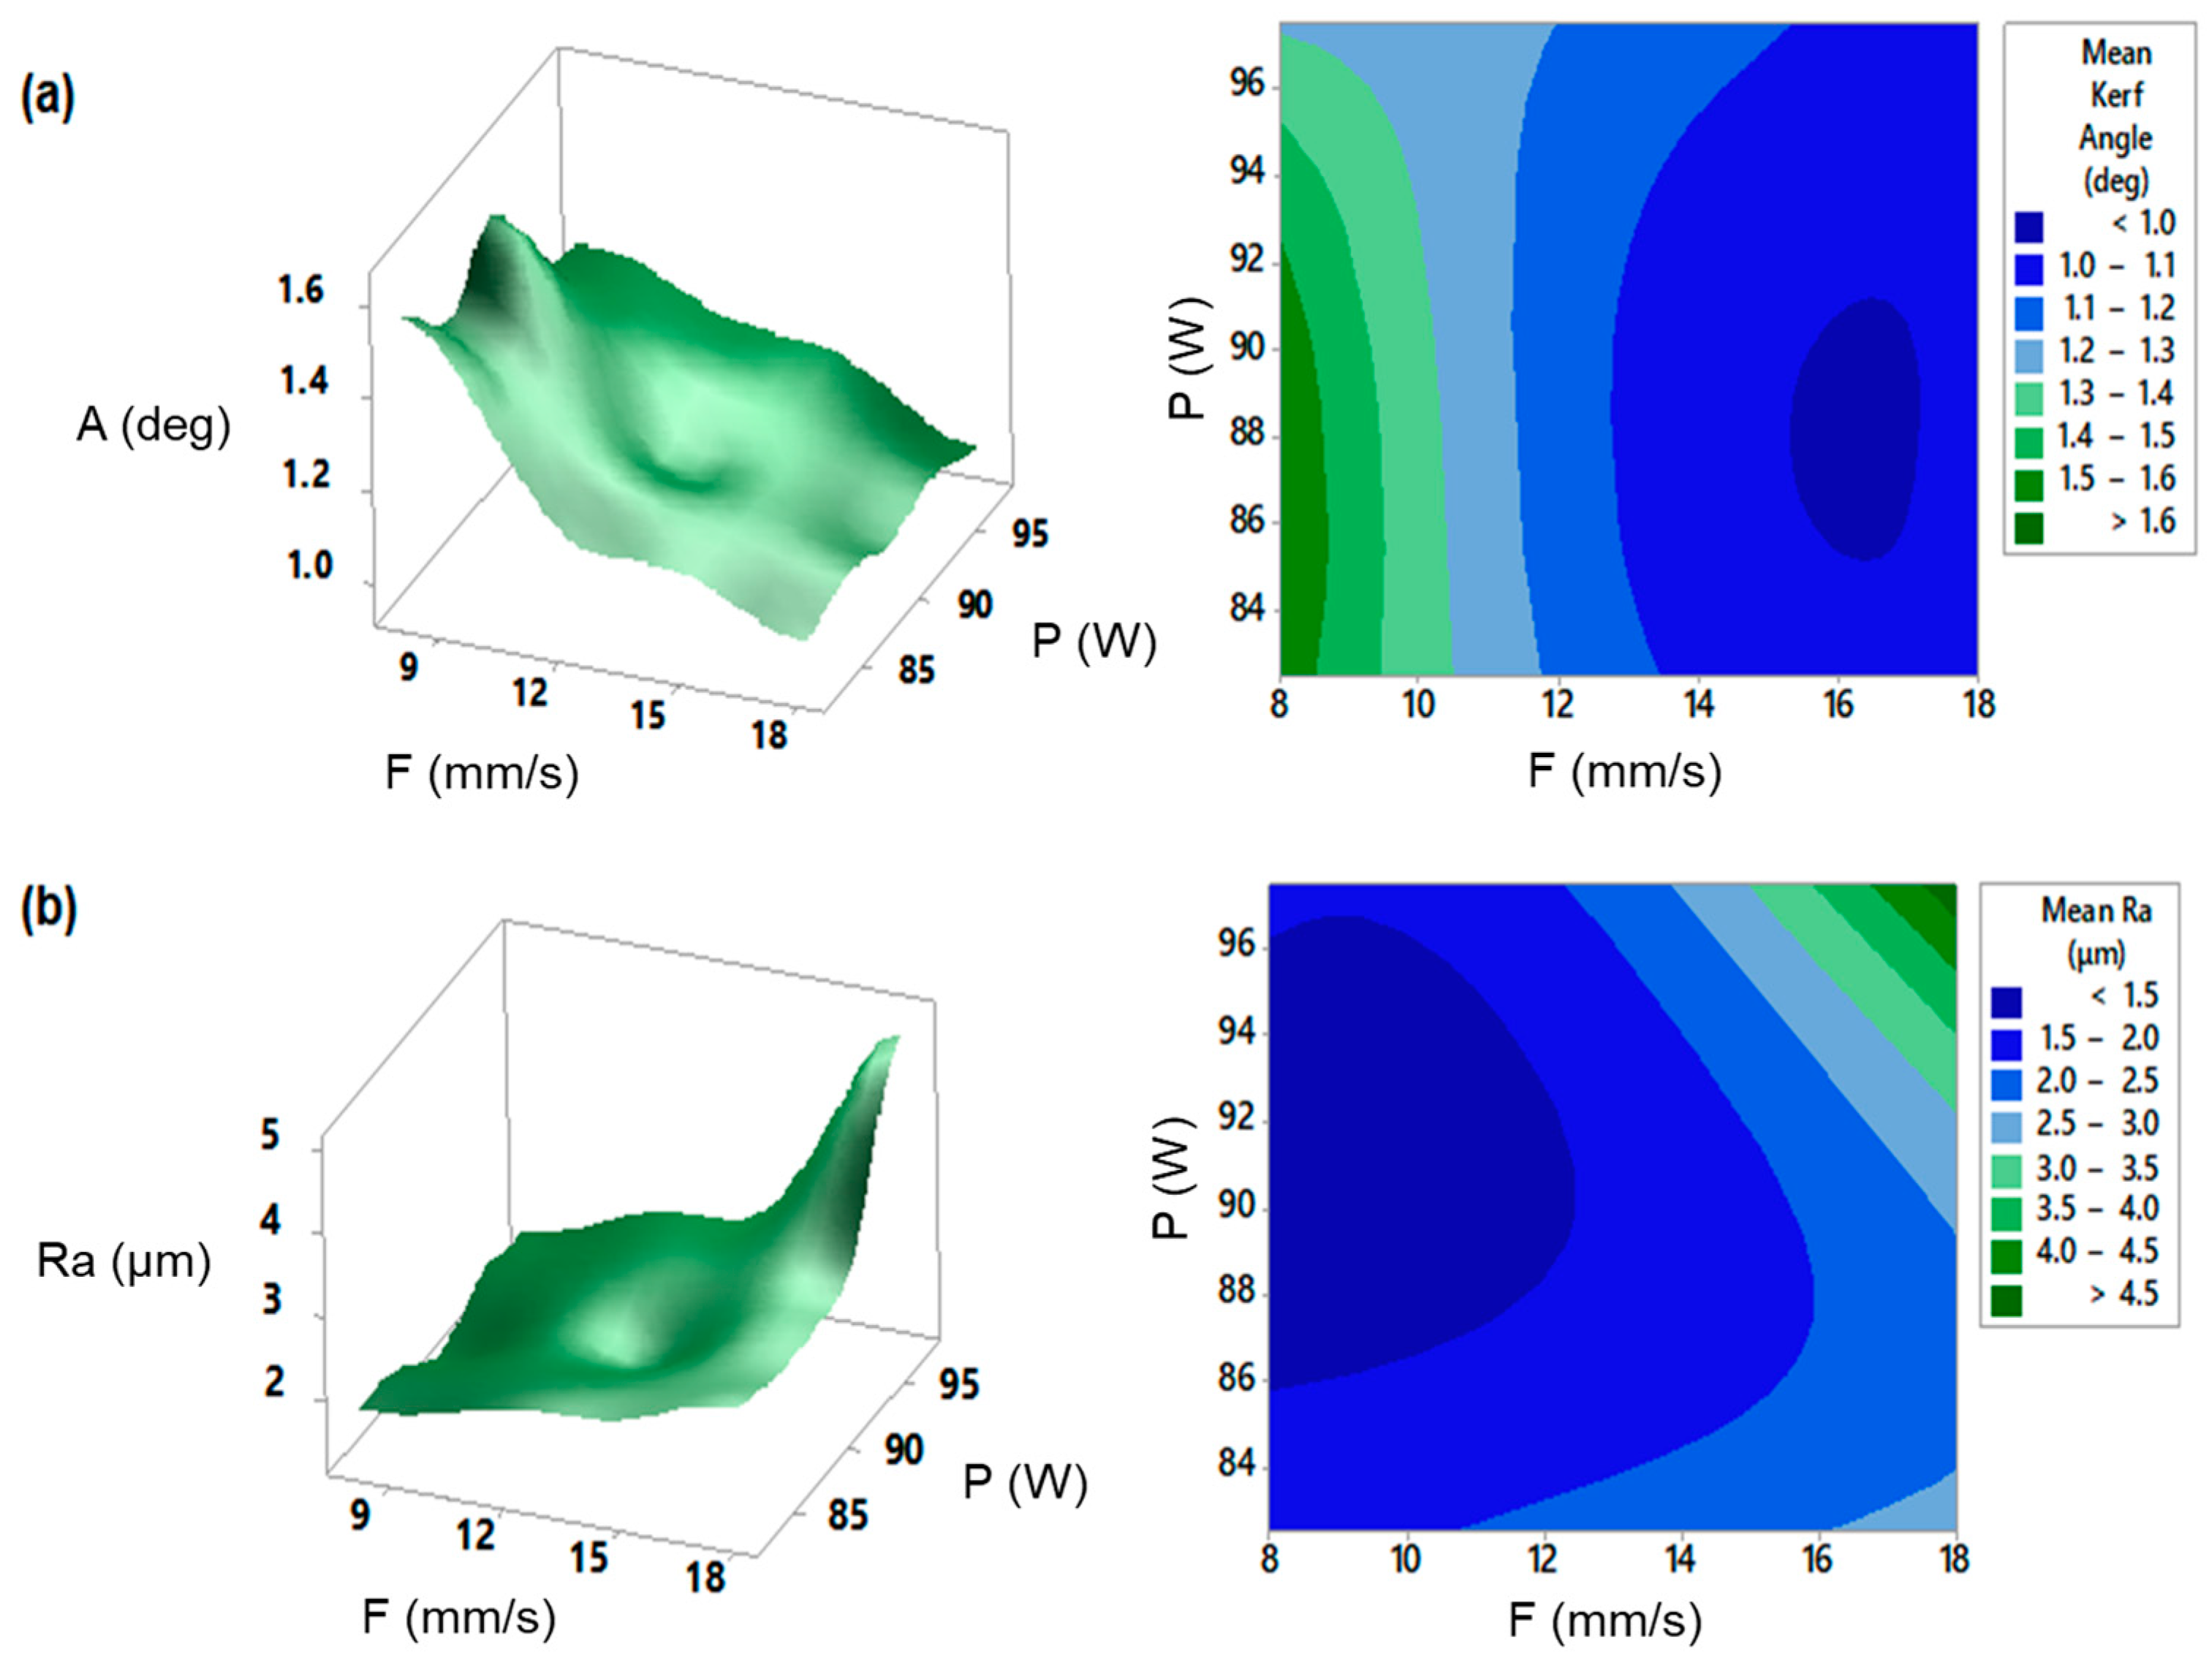
  • ANOVA and statistics show that feed is the dominant parameter for both responses, having the power to be rather significant for mean Ra. By examining the contour plots and response surfaces, we concluded that the interaction between laser feed and power is synergistic for mean A and antagonistic for mean Ra.
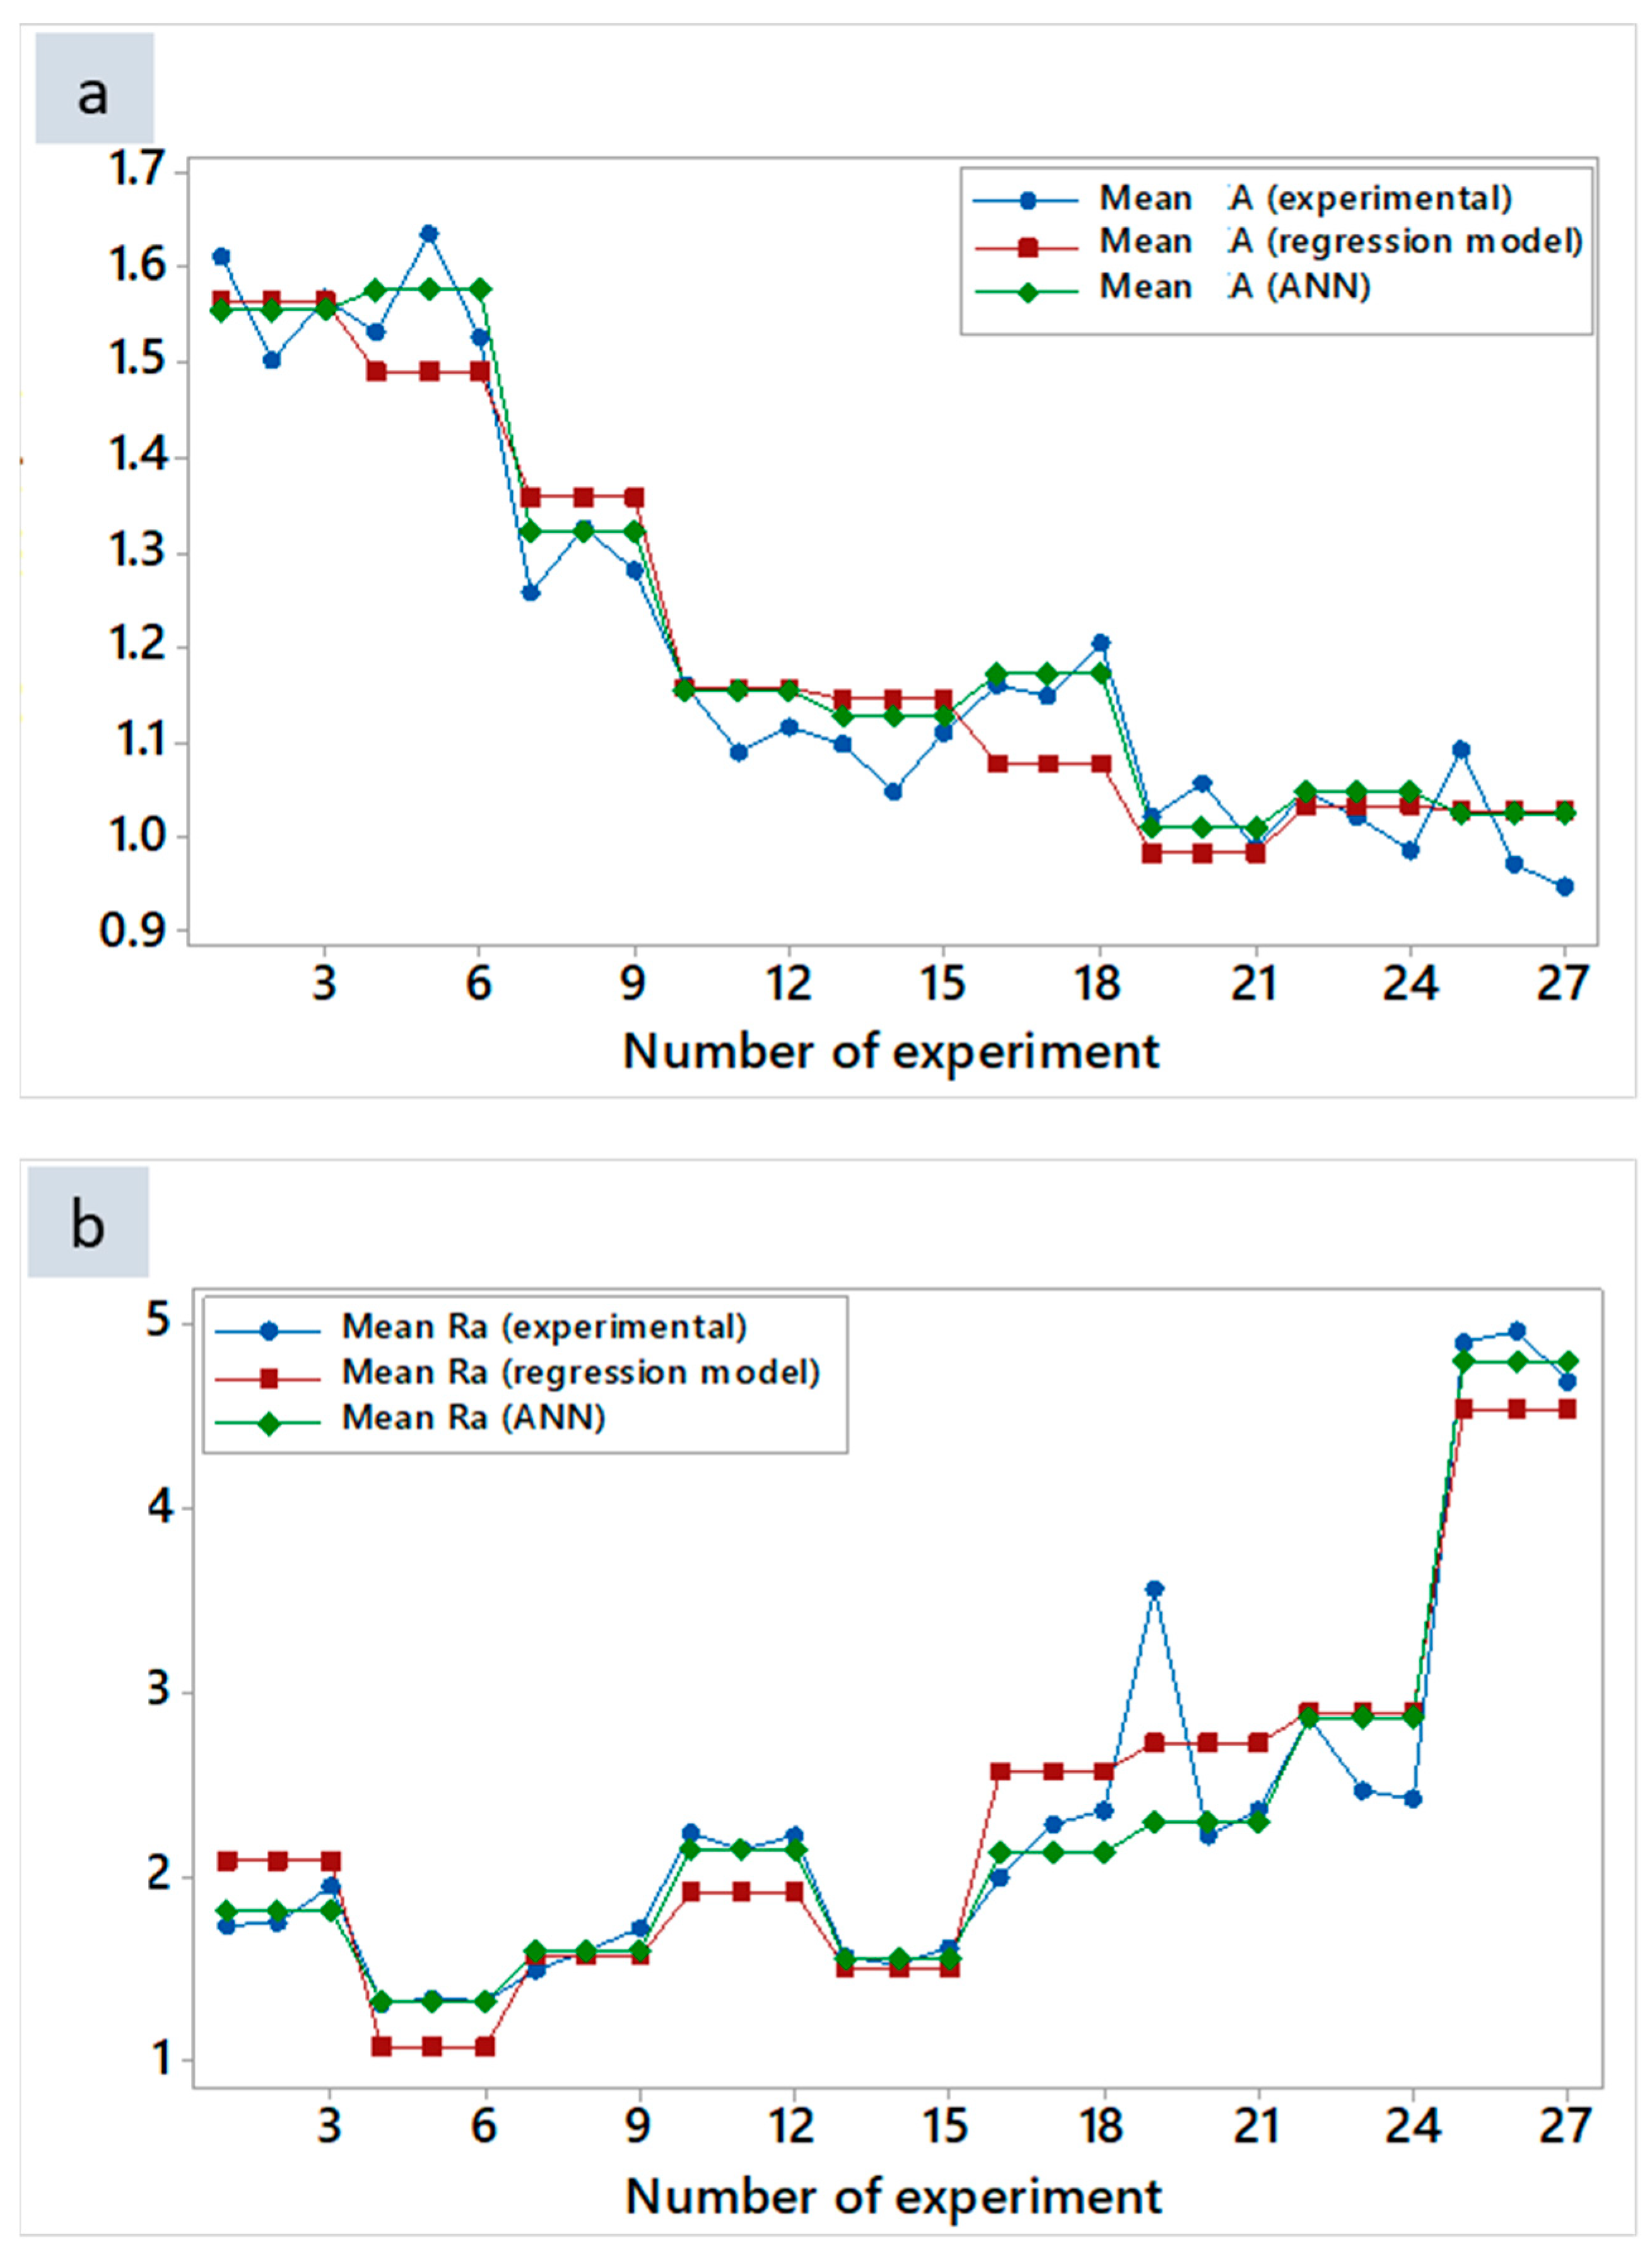
  • The feed parameter exhibits approximately 77% contribution in terms of its effect on the mean kerf angle. This contribution is followed by the effect of the square term of feed (6.66%), the interaction effect between feed and power (3.93%), and the effect of power (2.42%). Therefore, the correlation coefficient for the regression model to predict mean A was equal to 90.25%.
  • The feed parameter also exhibits a high contribution percentage for the response of mean Ra (51.69%). The second contribution effect is seen through the interaction between feed and power (14.54%), followed by the square term of power (11.63%). The rest of the parameter effects are less significant for mean Ra. The correlation coefficient for the regression model to predict mean A is equal to 89.54%.
  • The topology of 2-8-2 for the layers of a backpropagation ANN seems to be quite promising in predicting the responses of mean A and Ra, with high correlation.
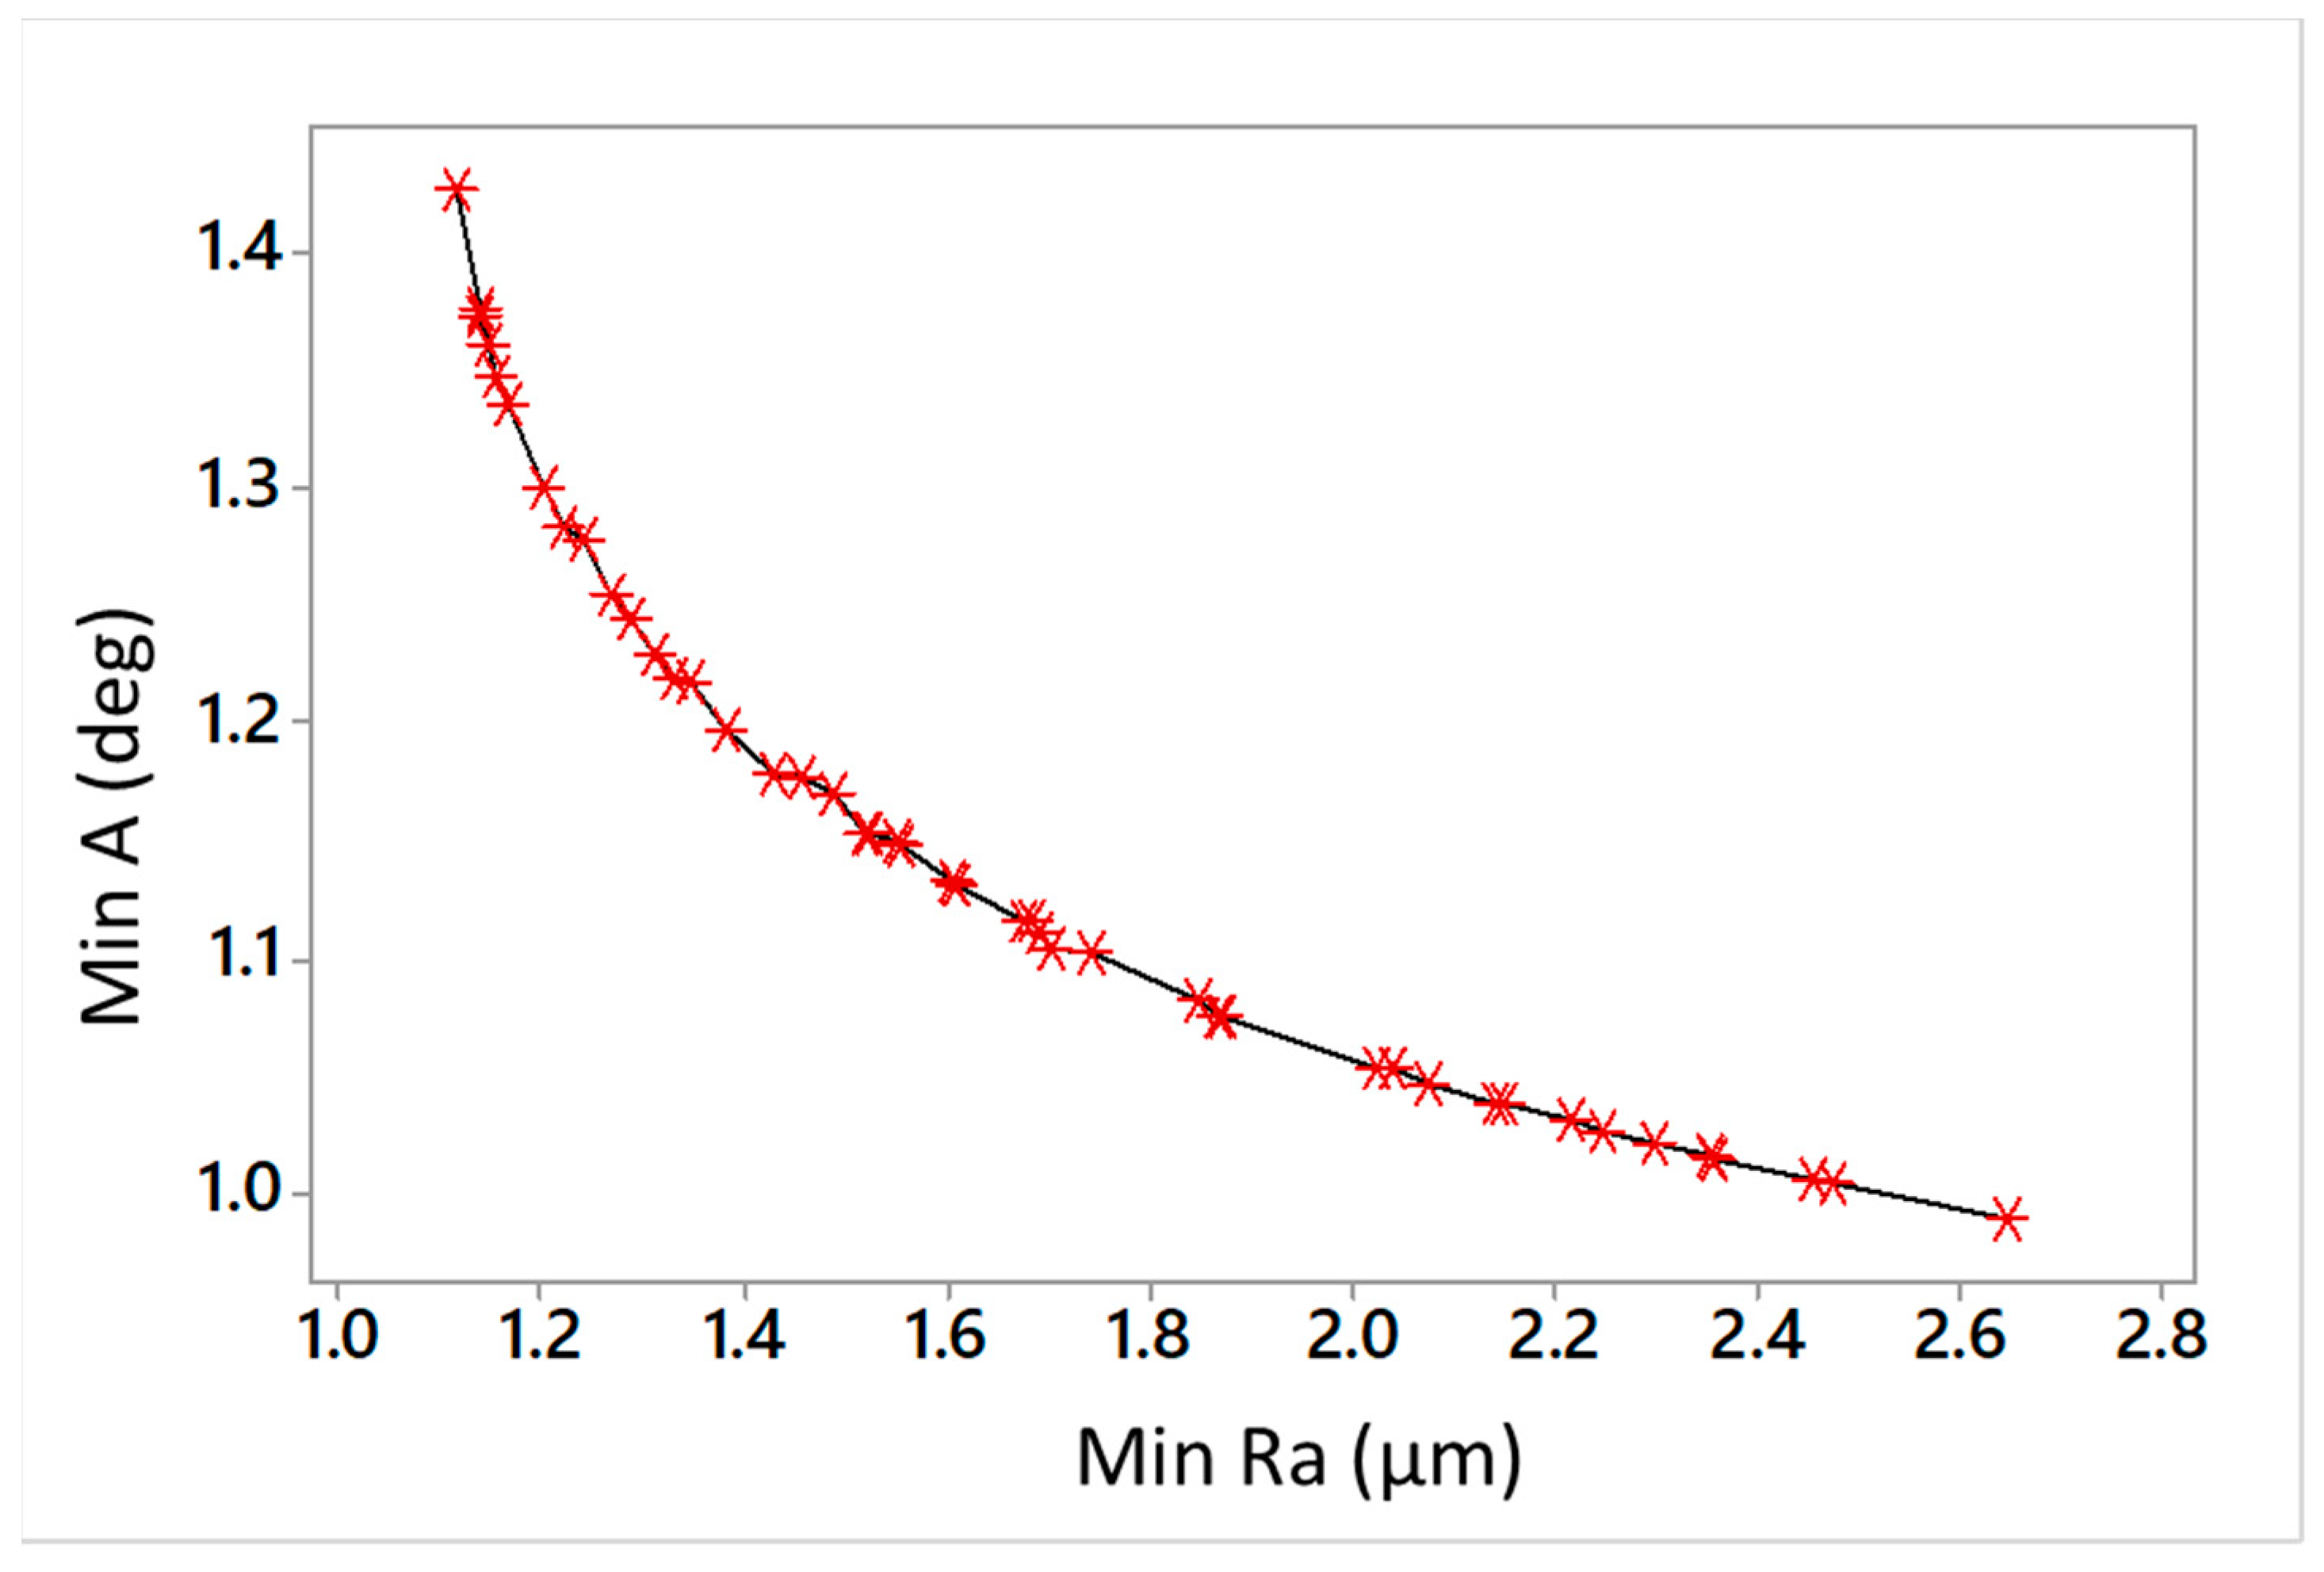
  • The non-dominated set of Pareto optimal solutions seems advantageous for different importance degrees among mean kerf angle and surface roughness. Their inherent trade-off results from the nonlinear behavior, mainly owing to feed. A general range in terms of the overall gain by employing some indicative optimal solutions is between 10 and 55%.
In this manuscript, we formulated a two-objective optimization problem based on the two objectives of mean kerf angle and surface roughness. According to the “non-dominated” set of solutions theory, it would be difficult to emphasize the best parameter settings for the objectives. In a multi-objective optimization problem (i.e., two objectives), the end user should decide which non-dominated solution is to be selected according to the process requirements, constraints, and technical specifications. The Pareto front should be carefully examined, and a “bi-objective” solution should be selected, with the recommended settings for its process parameters referring to both laser power and laser feed. To assist with process planning for laser cutting and to recommend a range of “best” solutions, one should restrict their selections to the Pareto points existing on the curved space of the front. These solutions are closer to the axes’ origin, thus simultaneously minimizing both objectives to the best possible extent.
Looking further ahead, the authors plan to study other LC operations for several 3DP materials, examine the effect among crucial laser and 3D printing parameters, and optimize more responses related to quality and productivity (heat affected zone, dross, energy consumption, etc.) by implementing different modern metaheuristics and intelligent algorithms. Additionally, note that the infill structure of 3D-printed parts can vary even for the same material and geometry by changing the infill parameters or fabrication orientation, affecting laser cutting performance.

Author Contributions

Conceptualization, J.D.K.; methodology, N.A.F.; software, N.A.F.; validation, K.N.; formal analysis, K.N.; investigation, N.A.F. and K.N.; resources, J.D.K.; data curation, K.N.; writing—original draft preparation, J.D.K., N.A.F. and N.M.V.; writing—review and editing, J.D.K. and N.M.V.; visualization, J.D.K.; supervision, J.D.K. and N.M.V.; project administration, J.D.K.; funding acquisition, J.D.K. All authors have read and agreed to the published version of the manuscript.

Funding

This research received no external funding.

Data Availability Statement

All data required to reproduce these findings are included in this manuscript.

Conflicts of Interest

The authors declare no conflict of interest.

References

  1. Stavropoulos, P.; Koutsomichalis, A.; Vaxevanidis, N. Laser-Based Manufacturing Processes for Aerospace Applications. In Materials Science and Engineering; IGI Global: Hershey, PA, USA, 2017; pp. 374–391. [Google Scholar] [CrossRef]
  2. Mushtaq, R.T.; Wang, Y.; Rehman, M.; Khan, A.M.; Mia, M. State-of-the-Art and Trends in CO2 Laser Cutting of Polymeric Materials—A Review. Materials 2020, 13, 3839. [Google Scholar] [CrossRef] [PubMed]
  3. Ninikas, K.; Kechagias, J.; Salonitis, K. The Impact of Process Parameters on Surface Roughness and Dimensional Accuracy during CO2 Laser Cutting of PMMA Thin Sheets. J. Manuf. Mater. Process. 2021, 5, 74. [Google Scholar] [CrossRef]
  4. Förster, D.J.; Jäggi, B.; Michalowski, A.; Neuenschwander, B. Review on Experimental and Theoretical Investigations of Ultra-Short Pulsed Laser Ablation of Metals with Burst Pulses. Materials 2021, 14, 3331. [Google Scholar] [CrossRef] [PubMed]
  5. Sing, S.L.; Kuo, C.N.; Shih, C.T.; Ho, C.C.; Chua, C.K. Perspectives of Using Machine Learning in Laser Powder Bed Fusion for Metal Additive Manufacturing. Virtual Phys. Prototyp. 2021, 16, 372–386. [Google Scholar] [CrossRef]
  6. Al-Ahmari, A.M.A.; Rasheed, M.S.; Mohammed, M.K.; Saleh, T. A Hybrid Machining Process Combining Micro-EDM and Laser Beam Machining of Nickel–Titanium-Based Shape Memory Alloy. Mater. Manuf. Process. 2016, 31, 447–455. [Google Scholar] [CrossRef]
  7. Buj-Corral, I.; Bagheri, A.; Sivatte-Adroer, M. Effect of Printing Parameters on Dimensional Error, Surface Roughness and Porosity of FFF Printed Parts with Grid Structure. Polymers 2021, 13, 1213. [Google Scholar] [CrossRef]
  8. Elkaseer, A.; Schneider, S.; Scholz, S.G. Experiment-Based Process Modeling and Optimization for High-Quality and Resource-Efficient FFF 3D Printing. Appl. Sci. 2020, 10, 2899. [Google Scholar] [CrossRef]
  9. Fountas, N.A.; Kechagias, J.D.; Manolakos, D.E.; Vaxevanidis, N.M. Single and Multi-Objective Optimization of FDM-Based Additive Manufacturing Using Metaheuristic Algorithms. Procedia Manuf. 2020, 51, 740–747. [Google Scholar] [CrossRef]
  10. Kim, H.; Lin, Y.; Tseng, T.-L.B. A Review on Quality Control in Additive Manufacturing. Rapid Prototyp. J. 2018, 24, 645–669. [Google Scholar] [CrossRef]
  11. Milovanovic, S.; Pajnik, J.; Lukic, I. Tailoring of Advanced Poly (Lactic Acid)-based Materials: A Review. J. Appl. Polym. Sci. 2022, 139, 51839. [Google Scholar] [CrossRef]
  12. Gul, J.Z.; Sajid, M.; Rehman, M.M.; Siddiqui, G.U.; Shah, I.; Kim, K.-H.; Lee, J.-W.; Choi, K.H. 3D Printing for Soft Robotics—A Review. Sci. Technol. Adv. Mater. 2018, 19, 243–262. [Google Scholar] [CrossRef] [PubMed]
  13. Buj-Corral, I.; Sánchez-Casas, X.; Luis-Pérez, C.J. Analysis of AM Parameters on Surface Roughness Obtained in PLA Parts Printed with FFF Technology. Polymers 2021, 13, 2384. [Google Scholar] [CrossRef] [PubMed]
  14. Wong, K.V.; Hernandez, A. A Review of Additive Manufacturing. ISRN Mech. Eng. 2012, 2012, 208760. [Google Scholar] [CrossRef]
  15. Pham, D.T.; Gault, R.S. A comparison of rapid prototyping technologies. Int. J. Mach. Tools Manuf. 1998, 38, 1257. [Google Scholar] [CrossRef]
  16. Kechagias, J.D.; Zaoutsos, S.P. Optimising Fused Filament Fabrication Surface Roughness for a Dental Implant. Mater. Manuf. Process. 2023, 38, 954–959. [Google Scholar] [CrossRef]
  17. Kechagias, J.; Chaidas, D. Fused Filament Fabrication Parameter Adjustments for Sustainable 3D Printing. Mater. Manuf. Process. 2023, 38, 933–940. [Google Scholar] [CrossRef]
  18. Faludi, J.; Bayley, C.; Bhogal, S.; Iribarne, M. Comparing Environmental Impacts of Additive Manufacturing vs. Traditional Machining via Life-Cycle Assessment. Rapid Prototyp. J. 2015, 21, 14–33. [Google Scholar] [CrossRef]
  19. Correa-Pacheco, Z.N.; Black-Solís, J.D.; Ortega-Gudiño, P.; Sabino-Gutiérrez, M.A.; Benítez-Jiménez, J.J.; Barajas-Cervantes, A.; Bautista-Baños, S.; Hurtado-Colmenares, L.B. Preparation and Characterization of Bio-Based PLA/PBAT and Cinnamon Essential Oil Polymer Fibers and Life-Cycle Assessment from Hydrolytic Degradation. Polymers 2019, 12, 38. [Google Scholar] [CrossRef]
  20. Nofar, M.; Salehiyan, R.; Sinha Ray, S. Rheology of Poly (Lactic Acid)-Based Systems. Polym. Rev. 2019, 59, 465–509. [Google Scholar] [CrossRef]
  21. Fortelny, I.; Ujcic, A.; Fambri, L.; Slouf, M. Phase Structure, Compatibility, and Toughness of PLA/PCL Blends: A Review. Front. Mater. 2019, 6, 206. [Google Scholar] [CrossRef]
  22. Davim, J.P.; Barricas, N.; Conceição, M.; Oliveira, C. Some Experimental Studies on CO2 Laser Cutting Quality of Polymeric Materials. J. Mater. Process. Technol. 2008, 198, 99–104. [Google Scholar] [CrossRef]
  23. Caiazzo, F.; Curcio, F.; Daurelio, G.; Minutolo, F.M.C. Laser Cutting of Different Polymeric Plastics (PE, PP and PC) by a CO2 Laser Beam. J. Mater. Process. Technol. 2005, 159, 279–285. [Google Scholar] [CrossRef]
  24. Choudhury, I.A.; Shirley, S. Laser Cutting of Polymeric Materials: An Experimental Investigation. Opt. Laser Technol. 2010, 42, 503–508. [Google Scholar] [CrossRef]
  25. Kechagias, J.; Ninikas, K.; Stavropoulos, P.; Salonitis, K. A Generalised Approach on Kerf Geometry Prediction during CO2 Laser Cut of PMMA Thin Plates Using Neural Networks. Lasers Manuf. Mater. Process. 2021, 8, 372–393. [Google Scholar] [CrossRef]
  26. Stankova, N.; Nikolov, A.; Iordanova, E.; Yankov, G.; Nedyalkov, N.; Atanasov, P.; Tatchev, D.; Valova, E.; Kolev, K.; Armyanov, S.; et al. New Approach toward Laser-Assisted Modification of Biocompatible Polymers Relevant to Neural Interfacing Technologies. Polymers 2021, 13, 3004. [Google Scholar] [CrossRef]
  27. Zhou, B.H.; Mahdavian, S.M. Experimental and Theoretical Analyses of Cutting Nonmetallic Materials by Low Power CO2-Laser. J. Mater. Process. Technol. 2004, 146, 188–192. [Google Scholar] [CrossRef]
  28. Moradi, M.; Karami Moghadam, M.; Shamsborhan, M.; Bodaghi, M.; Falavandi, H. Post-Processing of FDM 3D-Printed Polylactic Acid Parts by Laser Beam Cutting. Polymers 2020, 12, 550. [Google Scholar] [CrossRef]
  29. Kechagias, J.D.; Fountas, N.A.; Ninikas, K.; Petousis, M.; Vidakis, N.; Vaxevanidis, N. Surface Characteristics Investigation of 3D-Printed PET-G Plates during CO2 Laser Cutting. Mater. Manuf. Process. 2021, 37, 1446–1462. [Google Scholar] [CrossRef]
  30. Kechagias, J.; Ninikas, K.; Petousis, M.; Vidakis, N. Laser Cutting of 3D Printed Acrylonitrile Butadiene Styrene Plates for Dimensional and Surface Roughness Optimization. Int. J. Adv. Manuf. Technol. 2022, 119, 2301–2315. [Google Scholar] [CrossRef]
  31. Kechagias, J.; Ninikas, K.; Petousis, M.; Vidakis, N.; Vaxevanidis, N. An Investigation of Surface Quality Characteristics of 3D Printed PLA Plates Cut by CO2 Laser Using Experimental Design. Mater. Manuf. Process. 2021, 36, 1544–1553. [Google Scholar] [CrossRef]
  32. Yang, L.; Wei, J.; Ma, Z.; Song, P.; Ma, J.; Zhao, Y.; Huang, Z.; Zhang, M.; Yang, F.; Wang, X. The Fabrication of Micro/Nano Structures by Laser Machining. Nanomaterials 2019, 9, 1789. [Google Scholar] [CrossRef]
  33. Kechagias, J.D.; Vidakis, N.; Ninikas, K.; Petousis, M.; Vaxevanidis, N.M. Hybrid 3D Printing of Multifunctional Polylactic Acid/Carbon Black Nanocomposites Made with Material Extrusion and Post-Processed with CO2 Laser Cutting. J. Adv. Manuf. Technol. 2023, 124, 1843–1861. [Google Scholar] [CrossRef]
  34. Shakeri, Z.; Benfriha, K.; Shirinbayan, M.; Ahmadifar, M.; Tcharkhtchi, A. Mathematical Modeling and Optimization of Fused Filament Fabrication (FFF) Process Parameters for Shape Deviation Control of Polyamide 6 Using Taguchi Method. Polymers 2021, 13, 3697. [Google Scholar] [CrossRef] [PubMed]
  35. Bedi, R.; Mehta, B. Adaptive Neuro Fuzzy Inference System in Modelling/Detecting Cracks and Porosity Using Liquid Penetrant Test. Int. J. Exp. Des. Process Optim. 2016, 5, 117. [Google Scholar] [CrossRef]
  36. Jones, B.; Montgomery, D.C. Alternatives to Resolution IV Screening Designs in 16 Runs. Int. J. Exp. Des. Process Optim. 2010, 1, 285. [Google Scholar] [CrossRef]
  37. Kechagias, J.D.; Aslani, K.-E.; Fountas, N.A.; Vaxevanidis, N.M.; Manolakos, D.E. A Comparative Investigation of Taguchi and Full Factorial Design for Machinability Prediction in Turning of a Titanium Alloy. Measurement 2020, 151, 107213. [Google Scholar] [CrossRef]
  38. Madić, M.; Petrović, G.; Petković, D.; Antucheviciene, J.; Marinković, D. Application of a Robust Decision-Making Rule for Comprehensive Assessment of Laser Cutting Conditions and Performance. Machines 2022, 10, 153. [Google Scholar] [CrossRef]
  39. Haddadi, E.; Moradi, M.; Karimzad Ghavidel, A.; Karimzad Ghavidel, A.; Meiabadi, S. Experimental and Parametric Evaluation of Cut Quality Characteristics in CO2 Laser Cutting of Polystyrene. Optik 2019, 184, 103–114. [Google Scholar] [CrossRef]
  40. Tamrin, K.F.; Nukman, Y.; Sheikh, N.A. Laser Spot Welding of Thermoplastic and Ceramic: An Experimental Investigation. Mater. Manuf. Process. 2015, 30, 1138–1145. [Google Scholar] [CrossRef]
  41. Kurt, M.; Kaynak, Y.; Bagci, E.; Demirer, H.; Kurt, M. Dimensional Analyses and Surface Quality of the Laser Cutting Process for Engineering Plastics. Int. J. Adv. Manuf. Technol. 2009, 41, 259–267. [Google Scholar] [CrossRef]
  42. Andriushchenko, E.; Kallaste, A.; Belahcen, A.; Vaimann, T.; Rassõlkin, A.; Heidari, H.; Tiismus, H. Optimization of a 3D-Printed Permanent Magnet Coupling Using Genetic Algorithm and Taguchi Method. Electronics 2021, 10, 494. [Google Scholar] [CrossRef]
  43. Kechagias, J.D.; Tsiolikas, A.; Petousis, M.; Ninikas, K.; Vidakis, N.; Tzounis, L. A robust methodology for optimizing the topology and the learning parameters of an ANN for accurate predictions of laser-cut edges surface roughness. Simul. Model. Pract. Theory 2022, 114, 102414. [Google Scholar] [CrossRef]
  44. Mirjalili, S.; Saremi, S.; Mirjalili, S.M.; Coelho, L.D.S. Multi-Objective Grey Wolf Optimizer: A Novel Algorithm for Multi-Criterion Optimization. Expert Syst. Appl. 2016, 47, 106–119. [Google Scholar] [CrossRef]
Figure 1. (a) Laser cutting work, (b) final cuboid part (15 × 15 mm No 25), and (c) remaining ring after cutting.
Jmmp 07 00077 g001
Figure 2. (a) Parallel cutting, (b) perpendicular cutting.
Jmmp 07 00077 g002
Figure 3. (a) Kerf angle, (b) specimen, and Ra measurements.
Jmmp 07 00077 g003
Figure 4. Surface and contour plots for the objectives of: (a) mean kerf angle, (b) mean surface roughness.
Jmmp 07 00077 g004
Figure 5. Normal probability plots of residuals for: (a) mean kerf angle, (b) mean surface roughness.
Jmmp 07 00077 g005
Figure 6. (a) Graphical illustration of the ANN architecture; (b) ANN validation performance.
Jmmp 07 00077 g006
Figure 7. Regression analysis results obtained by the ANN architecture adopted, based on its validation performance.
Jmmp 07 00077 g007
Figure 8. Comparison among experimental results, regression model, and ANN for (a) mean kerf angle and (b) mean surface roughness.
Jmmp 07 00077 g008
Figure 9. Non-dominated, “Pareto optimal” solutions, obtained by MOGWO algorithm for solving the CO2 laser cutting problem.
Jmmp 07 00077 g009
Table 1. LC parameters.
Laser ParametersSymbolLevels
123
FeedF (mm/s)81318
PowerP (W)82.590.097.5
Table 2. Laser cutting experiments and corresponding results for A and Ra responses.
a/aF (mm/s)P (W)Mean A (°)Mean Ra (μm)
1882.51.5961.72
2882.51.4381.74
3882.51.5191.88
4890.01.4651.51
5890.01.6121.50
6890.01.5371.42
7897.51.2160.81
8897.51.3070.88
9897.51.2591.06
101382.51.1081.16
111382.51.0541.04
121382.51.0941.05
131390.01.0760.92
141390.01.0121.00
151390.01.0941.07
161397.51.0881.09
171397.51.0792.08
181397.51.1021.46
191882.50.9654.42
201882.51.0122.23
211882.50.8942.53
221890.00.9892.61
231890.00.9452.42
241890.00.9172.37
251897.51.0096.15
261897.50.8976.19
271897.50.8845.92
Table 3. ANOVA results for A and Ra regression models.
SourceDFSeq.SS% ContributionAdj.SSAdj.MSF-ValueP-Value
F(mm/s)10.9329876.860.932980.932978165.590.000
P(W)10.029362.420.029360.0293635.210.033
F210.080896.660.080890.08089114.360.001
P210.004610.380.004610.0046110.820.376
F × P10.047753.930.047750.0477548.480.008
Error210.118329.750.118320.005634
Total261.21392100.00
A model R290.25%
F(mm/s)114.70651.6914.70614.7063103.730.000
P(W)11.9056.691.9051.904513.430.001
F211.4214.991.4211.421110.020.005
P213.30811.633.3083.307823.330.000
F × P14.13614.544.1364.136029.170.000
Error212.97710.462.9770.1418
Total2628.453100.00
Ra model R289.54%
Table 4. Recommended optimal solutions for minKA and minRa by MOGWO algorithm.
Sol. No.Optimization ObjectivesControl Parameters
minA (°)minRa (μm)F (mm/s)P (W)
10.988222.6448017.4811182.50000
21.074661.8722814.9266886.77339
31.427721.1148008.5359590.92663
41.278611.2383010.7143489.29454
51.335771.1666809.6641991.03837
61.021172.2978916.4007283.83890
71.075431.8670114.9132887.15281
81.030652.2136416.1112184.18711
91.299961.2022910.2000790.76634
101.003322.4757416.9996183.21187
111.104741.7039314.0990287.58292
121.005252.4543016.9117083.22919
131.197001.3803212.0455289.16643
141.116021.6752413.8468686.67821
151.152471.5220113.0170787.74314
161.015052.3560416.6466583.78354
171.037452.1504716.0027584.95377
181.110791.6898813.9664086.86978
191.053292.0230615.5336385.66028
201.376991.1361809.1814790.72416
211.361521.1469109.4179290.46029
221.372151.1390309.2458390.70076
231.081541.8454814.7037386.03587
241.216541.3474511.7637988.63053
251.149291.5488113.1134787.17124
261.132181.6057313.4764687.05567
271.131551.6092413.4916487.01271
281.283921.2214410.5310890.08822
291.219111.3313911.6476489.29424
301.229001.3108211.4631789.46176
311.147191.5519913.1520787.25544
321.115521.6842513.8610786.47686
331.101851.7394714.1854686.43617
341.175931.4548912.5510587.87838
351.179091.4296312.4223988.69144
361.348051.1555109.5733190.58348
371.244811.2869411.2401789.20021
381.038642.1401215.9786085.07588
391.244271.2873711.2456289.22634
401.153051.5163212.9942987.91324
411.015242.3542016.6421483.79649
421.253711.2665811.0378189.70594
431.052382.0386515.4970785.07198
441.244471.2873411.2445989.20843
451.244471.2873411.2445989.20843
461.046772.0746915.7106585.26258
471.026662.2462716.2839884.26596
481.244471.2873411.2445989.20843
491.169611.4846912.7000987.44660
501.244471.2873411.2445989.20843
Disclaimer/Publisher’s Note: The statements, opinions and data contained in all publications are solely those of the individual author(s) and contributor(s) and not of MDPI and/or the editor(s). MDPI and/or the editor(s) disclaim responsibility for any injury to people or property resulting from any ideas, methods, instructions or products referred to in the content.

