
Improved Coil Design for Magnetic Pulse Welding of Metallic Sheets


Abstract
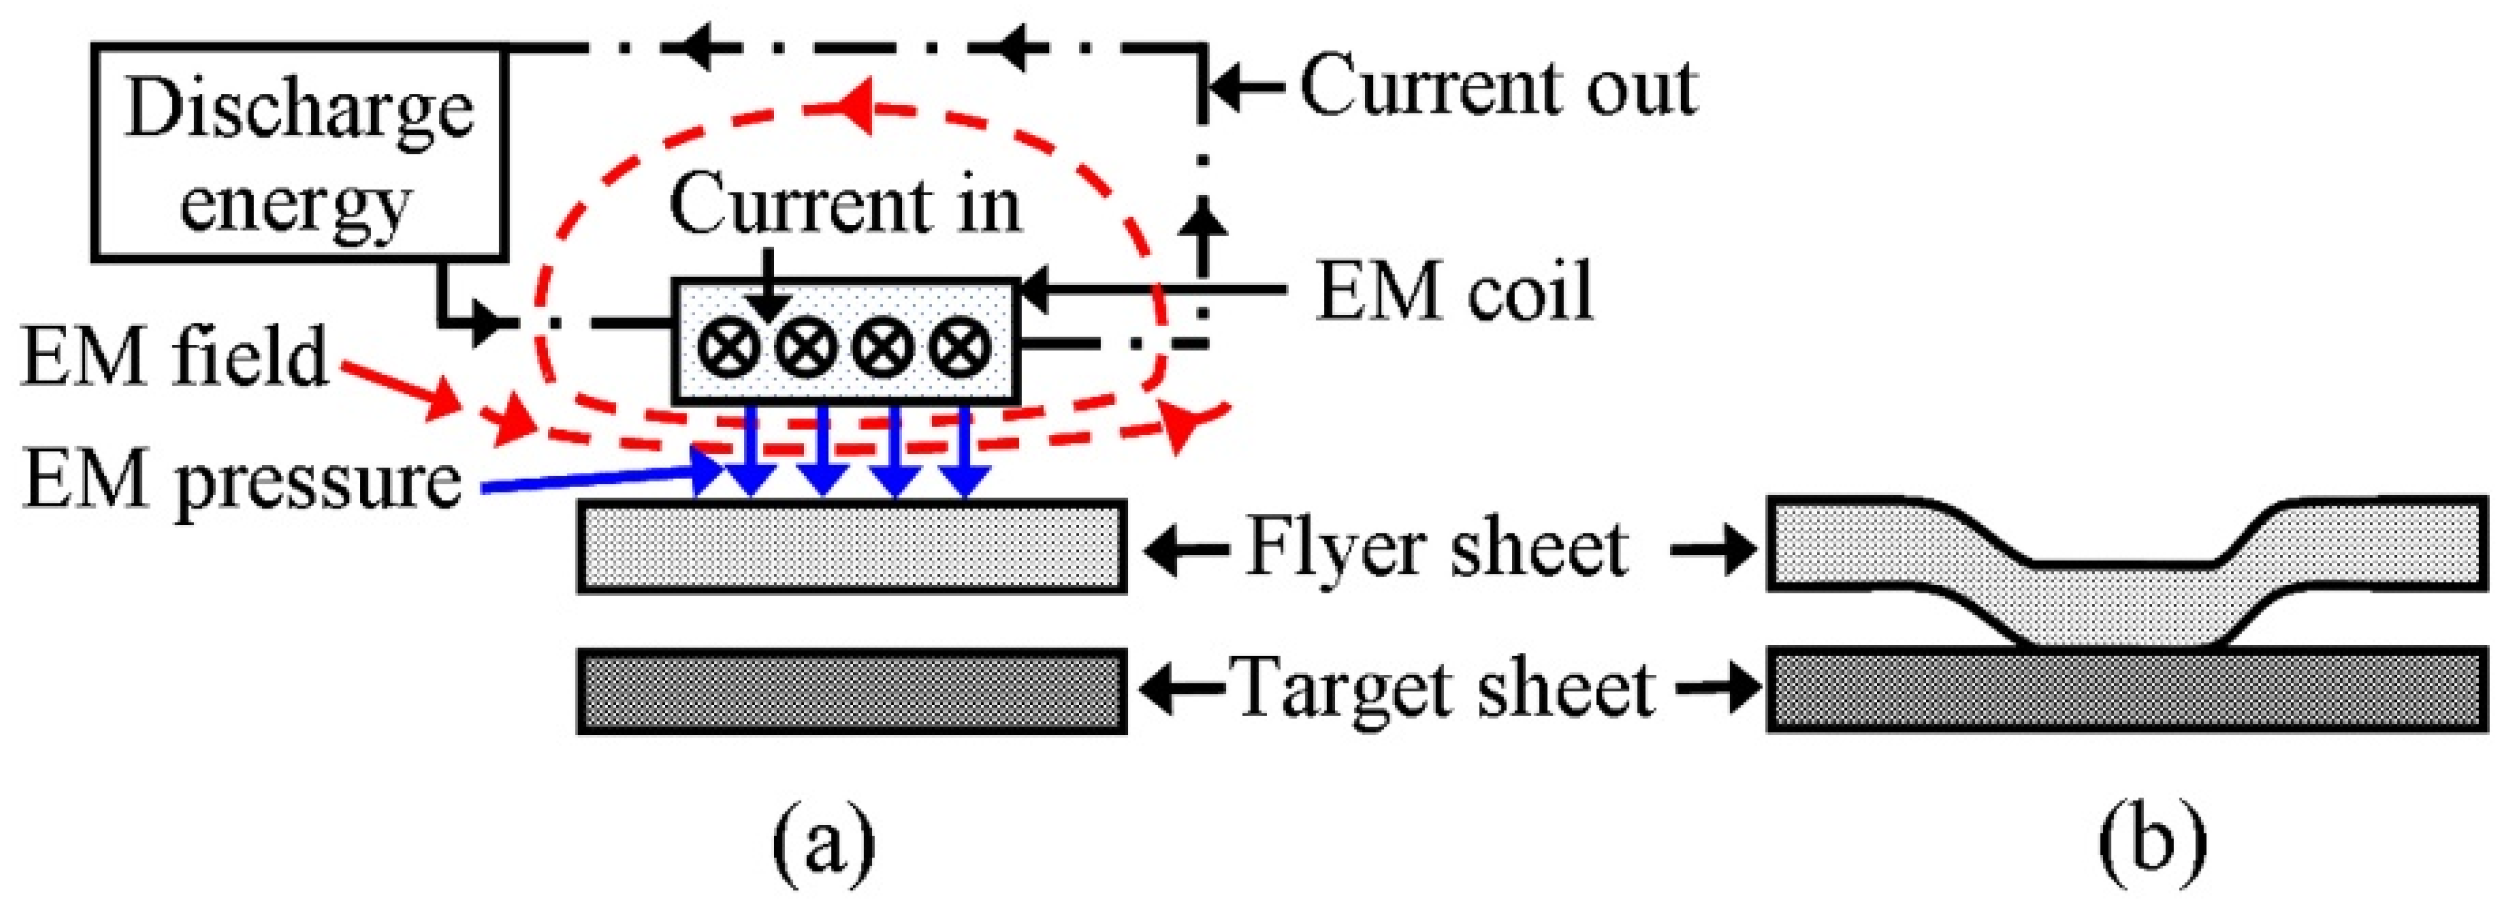
:1. Introduction
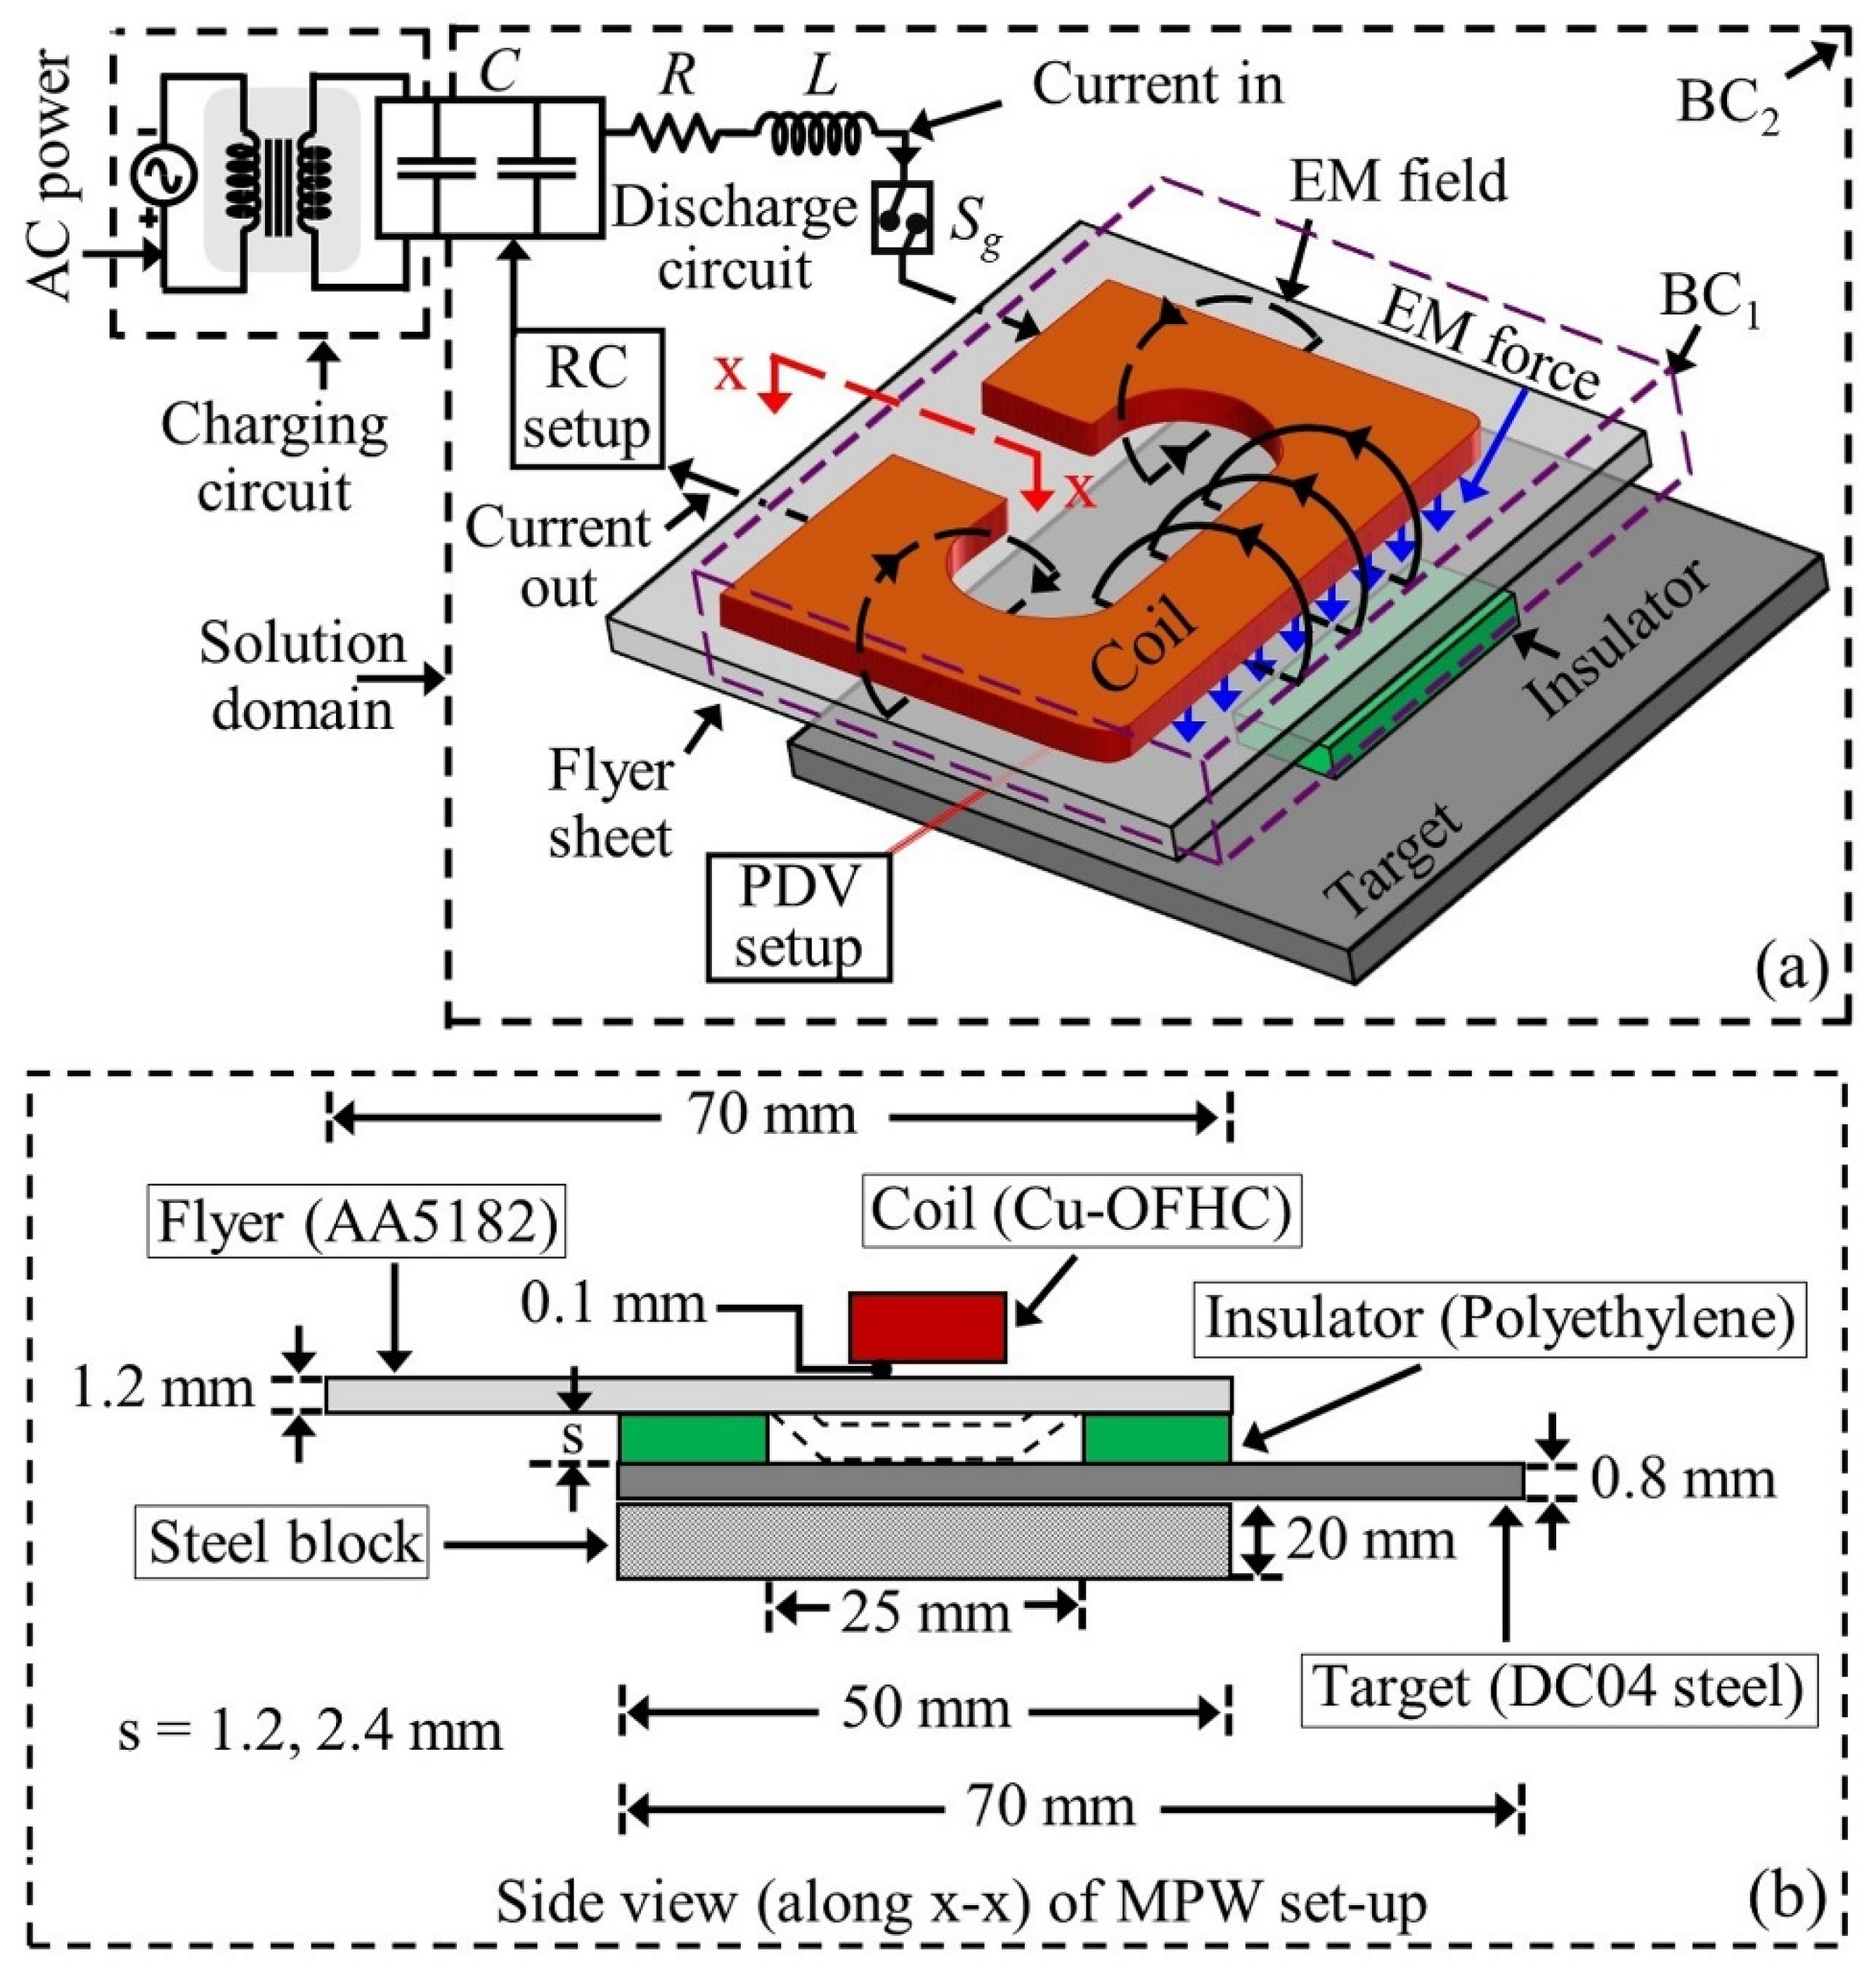
2. Experimental Set-Up
3. Theoretical Investigations
4. Results
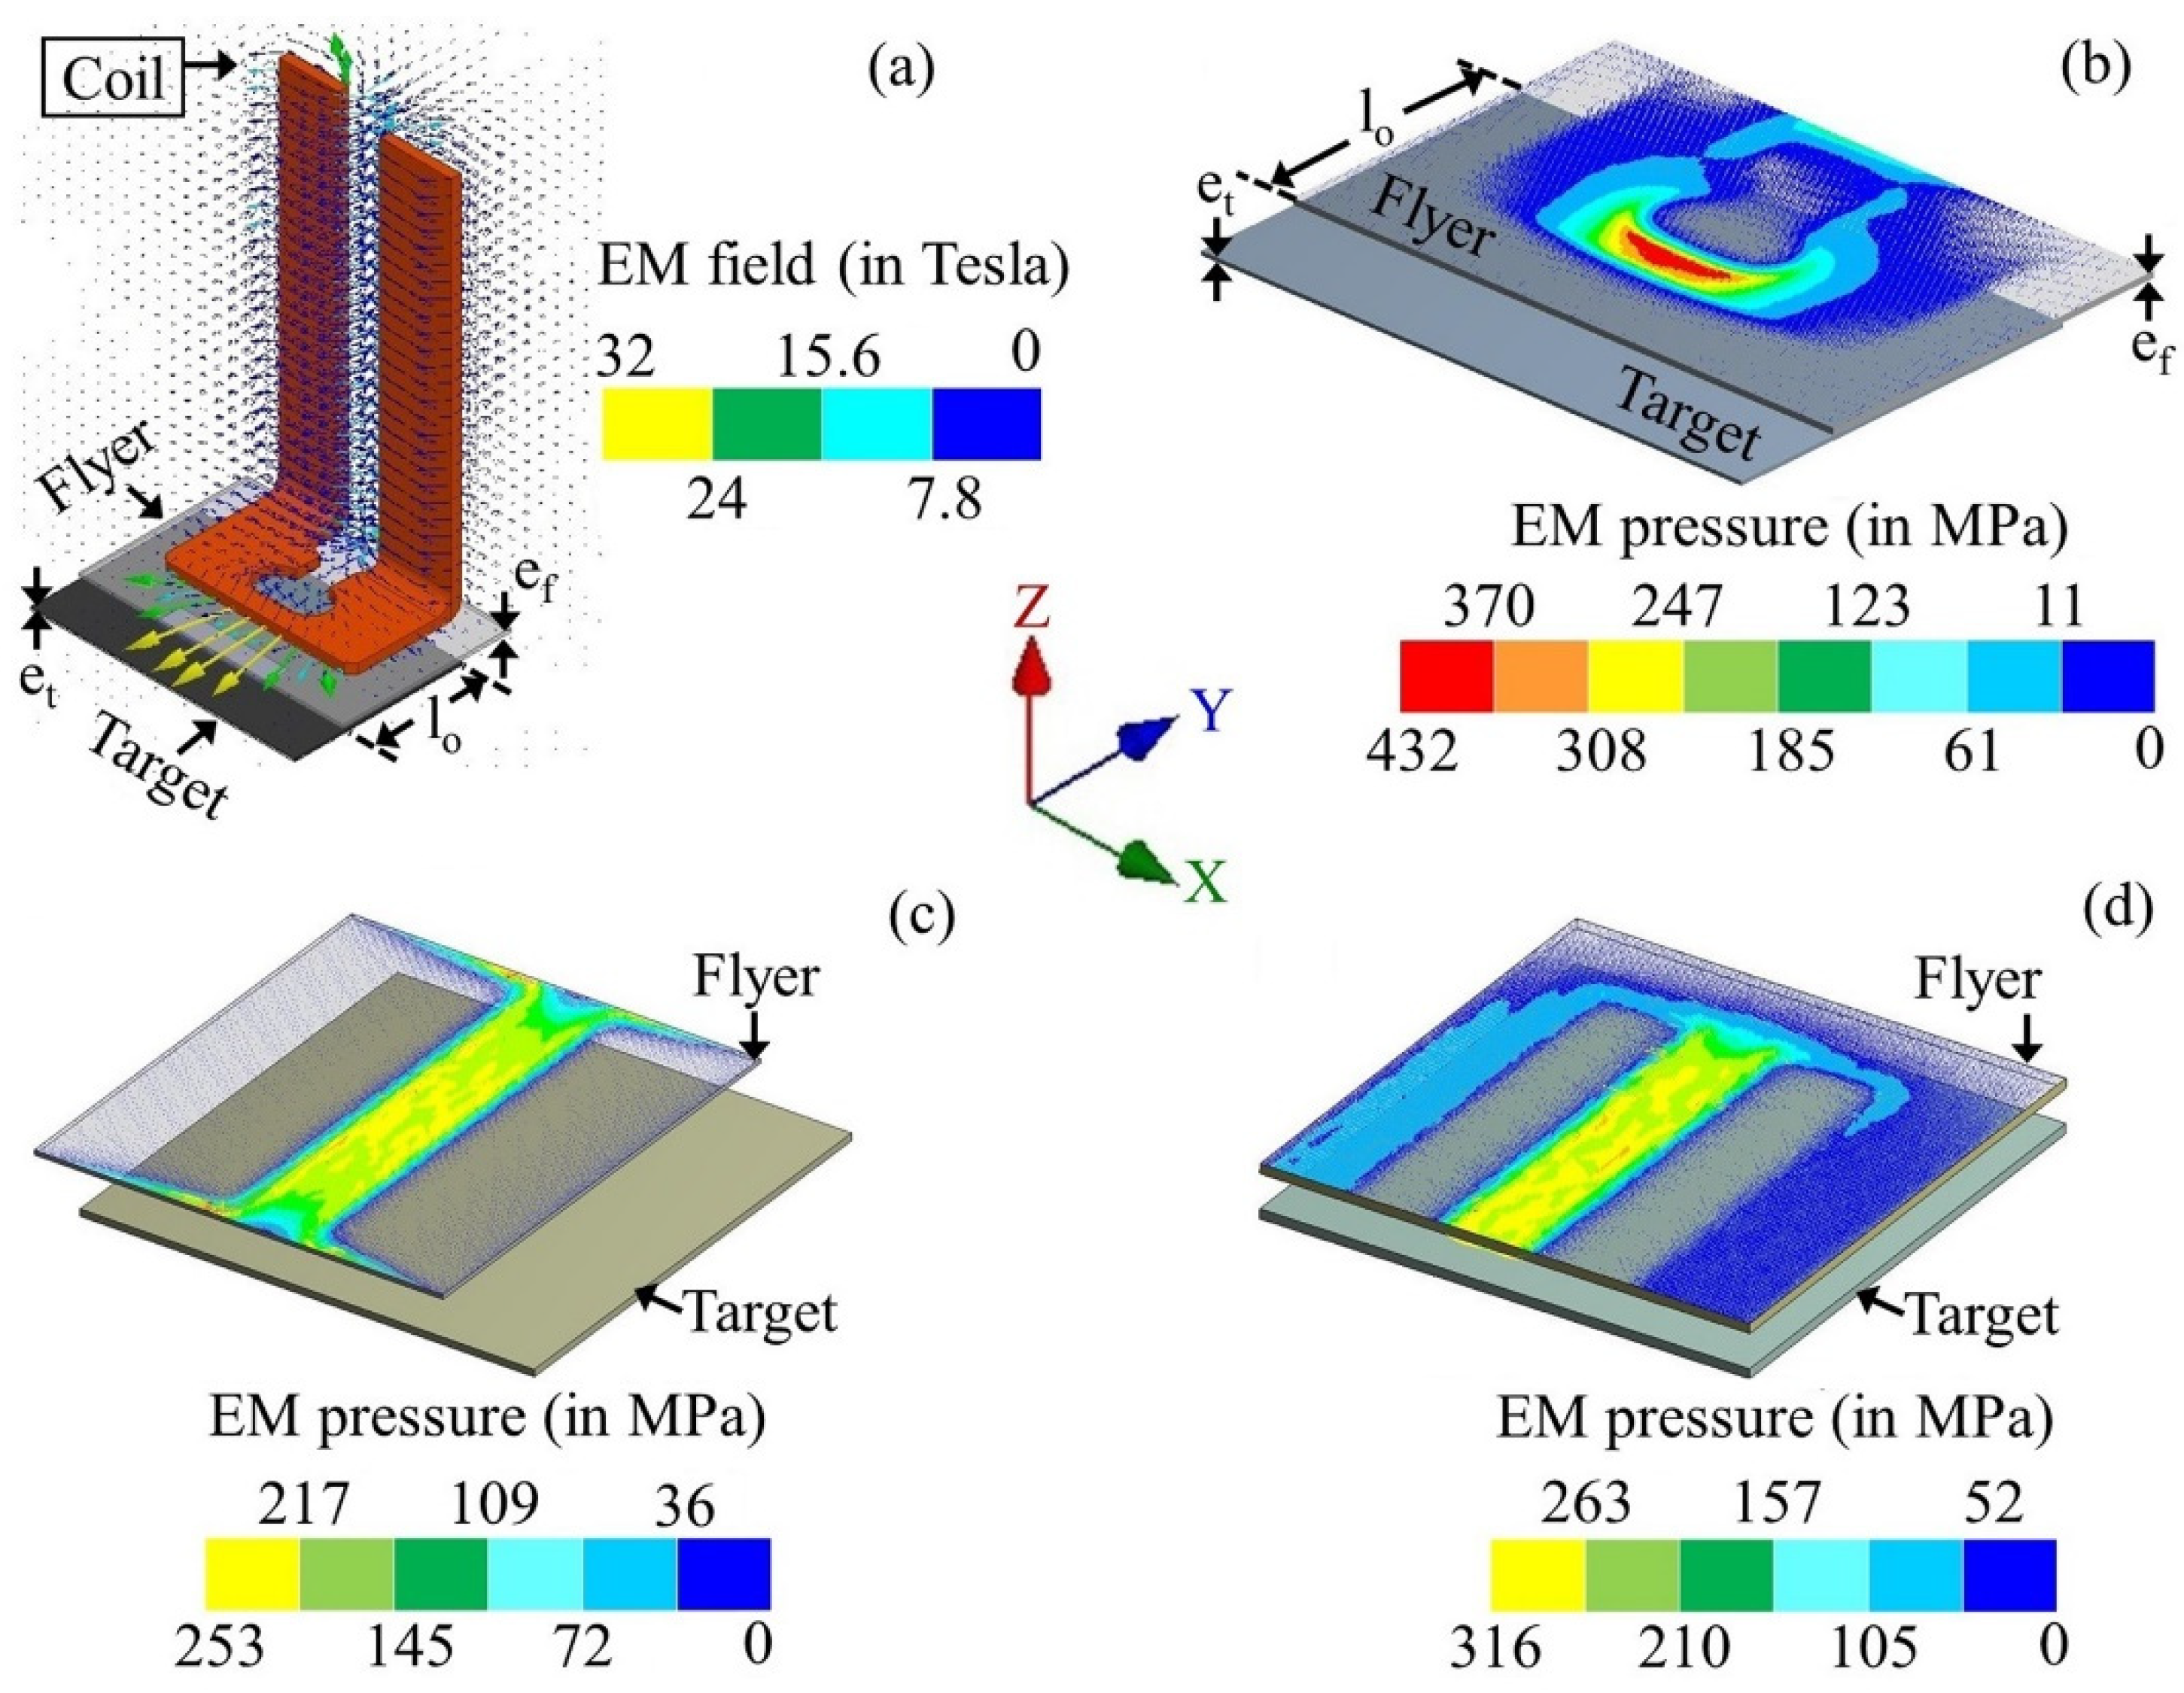
4.1. Computed Results from the EM Model
4.2. Computed Results from Mechanical Analysis
4.3. Weld Characteristics
5. Conclusions
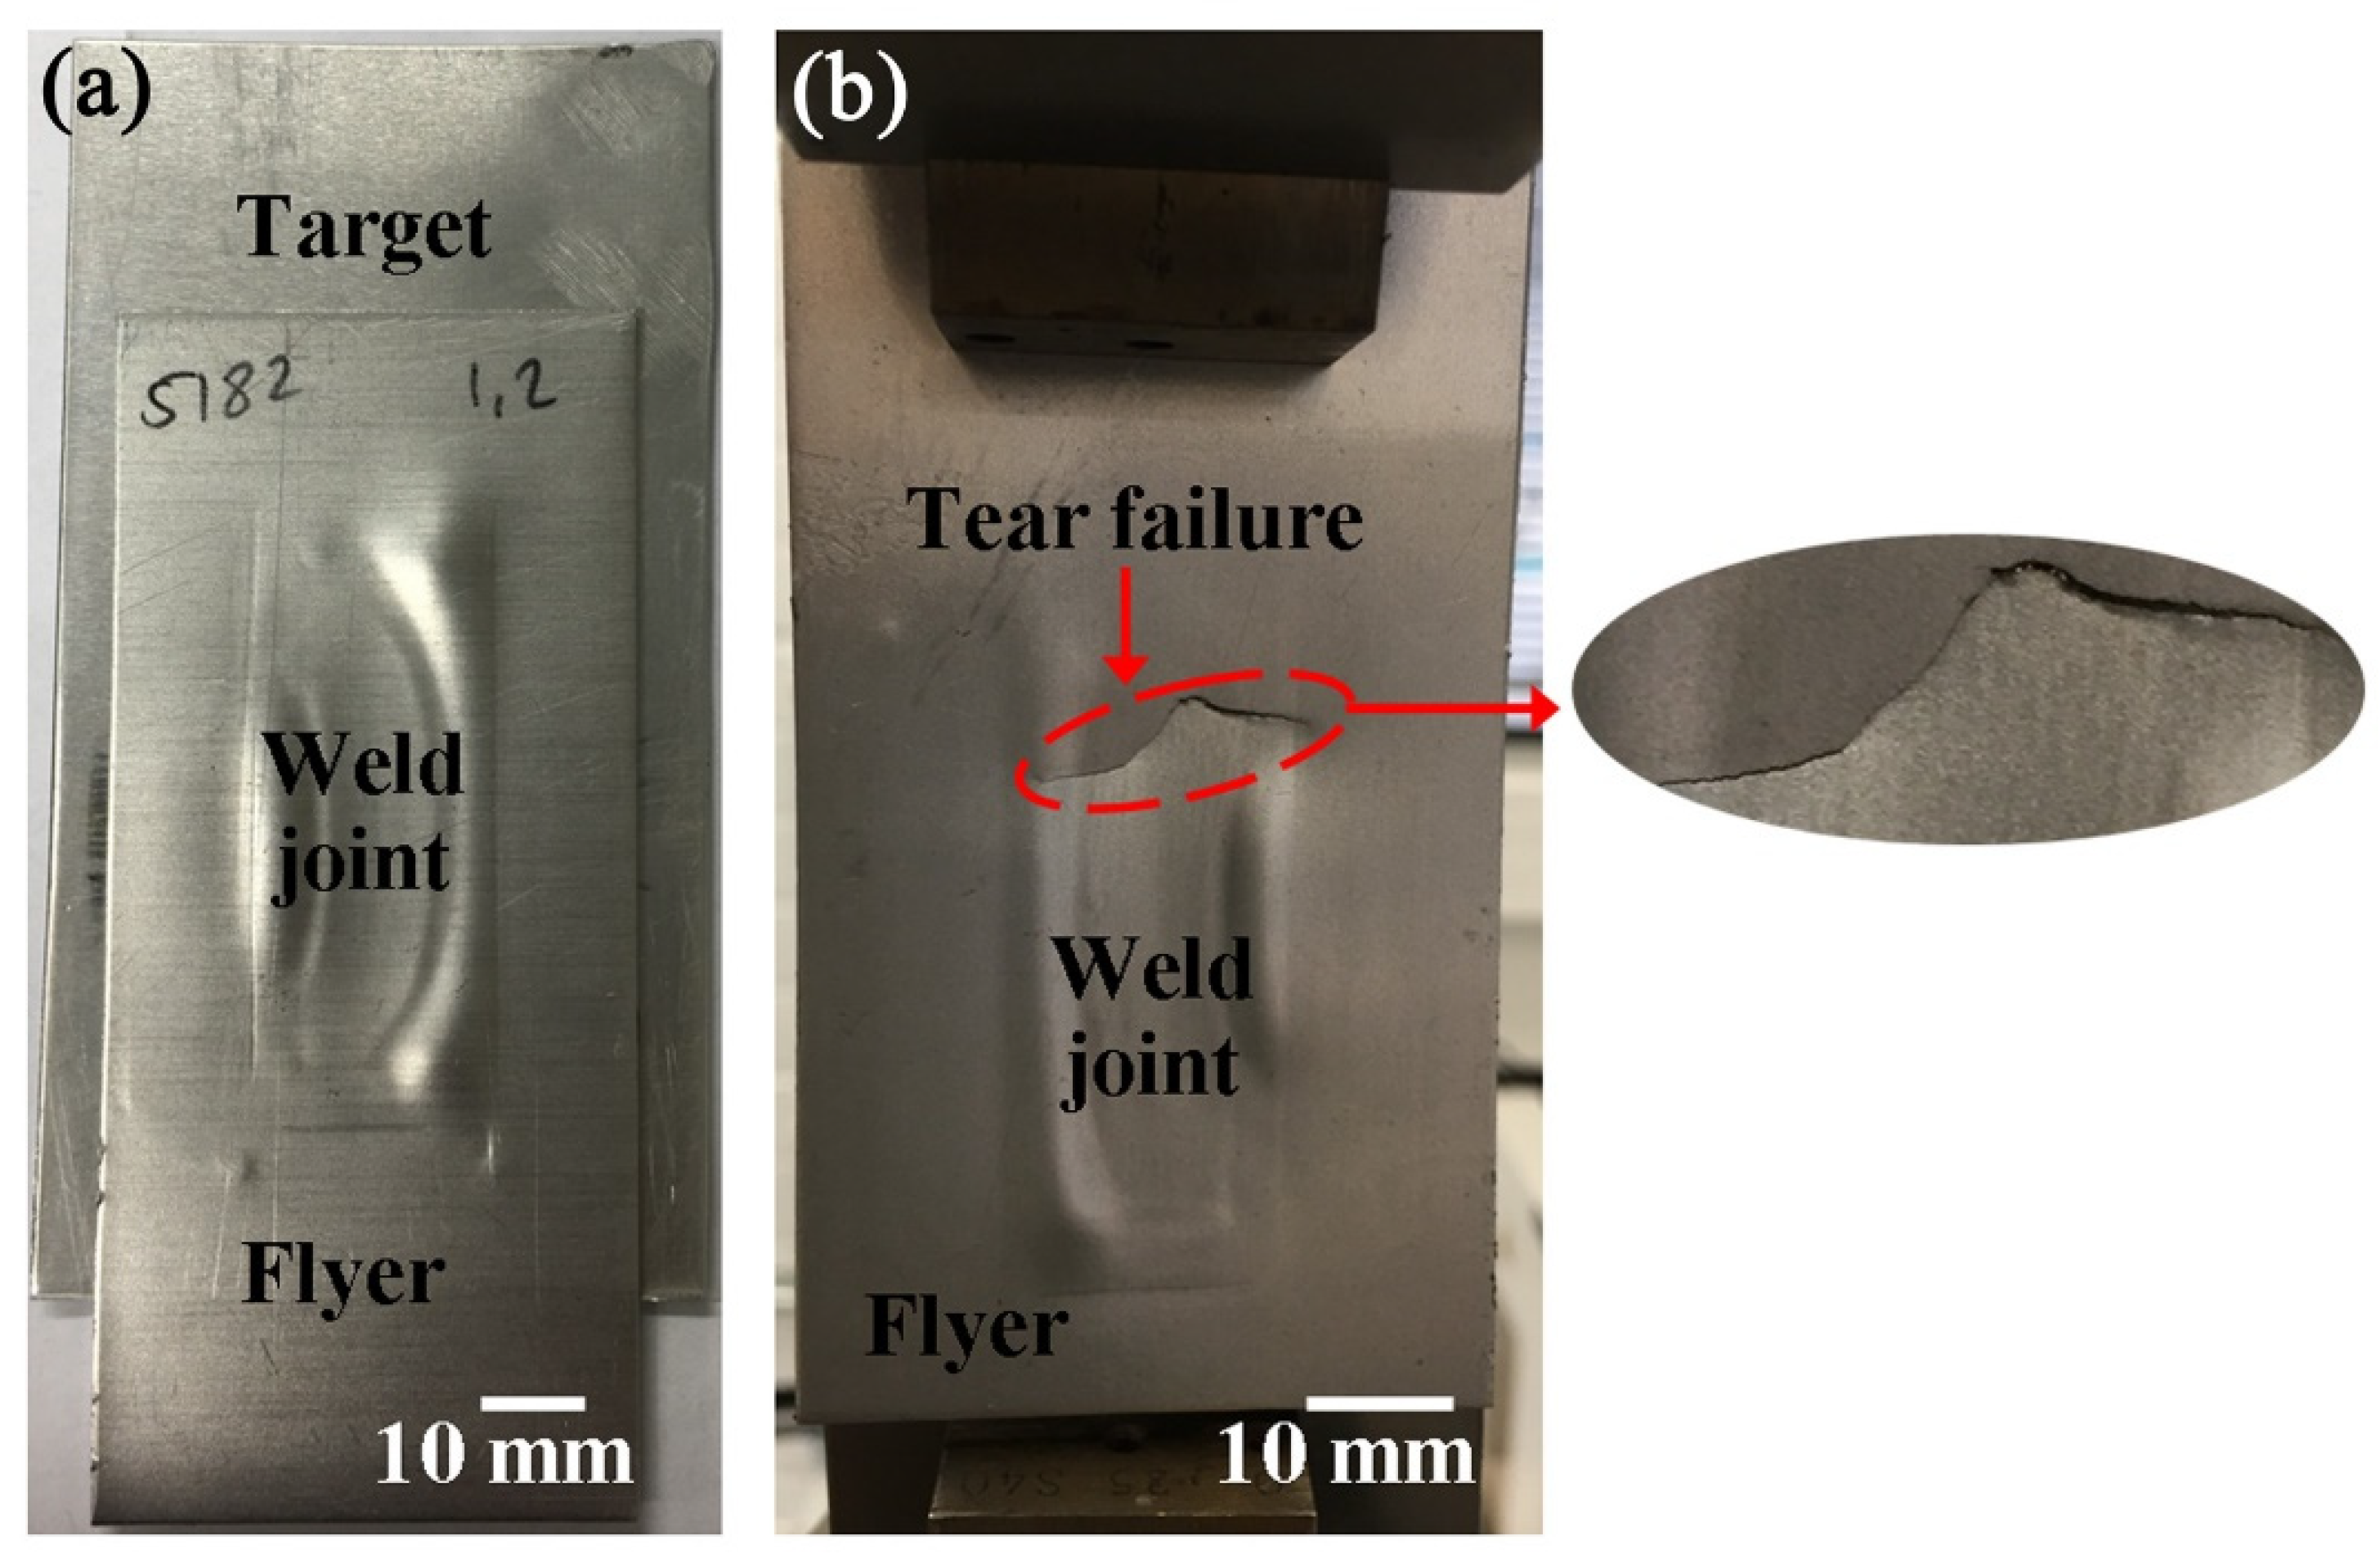
- Good welds between AA5182 flyer sheets and steel target sheets were produced for a range of standoff distances (1.2 and 2.4 mm) and applied energies (10, 13, and 16 kJ) using an O-shaped flat coil.
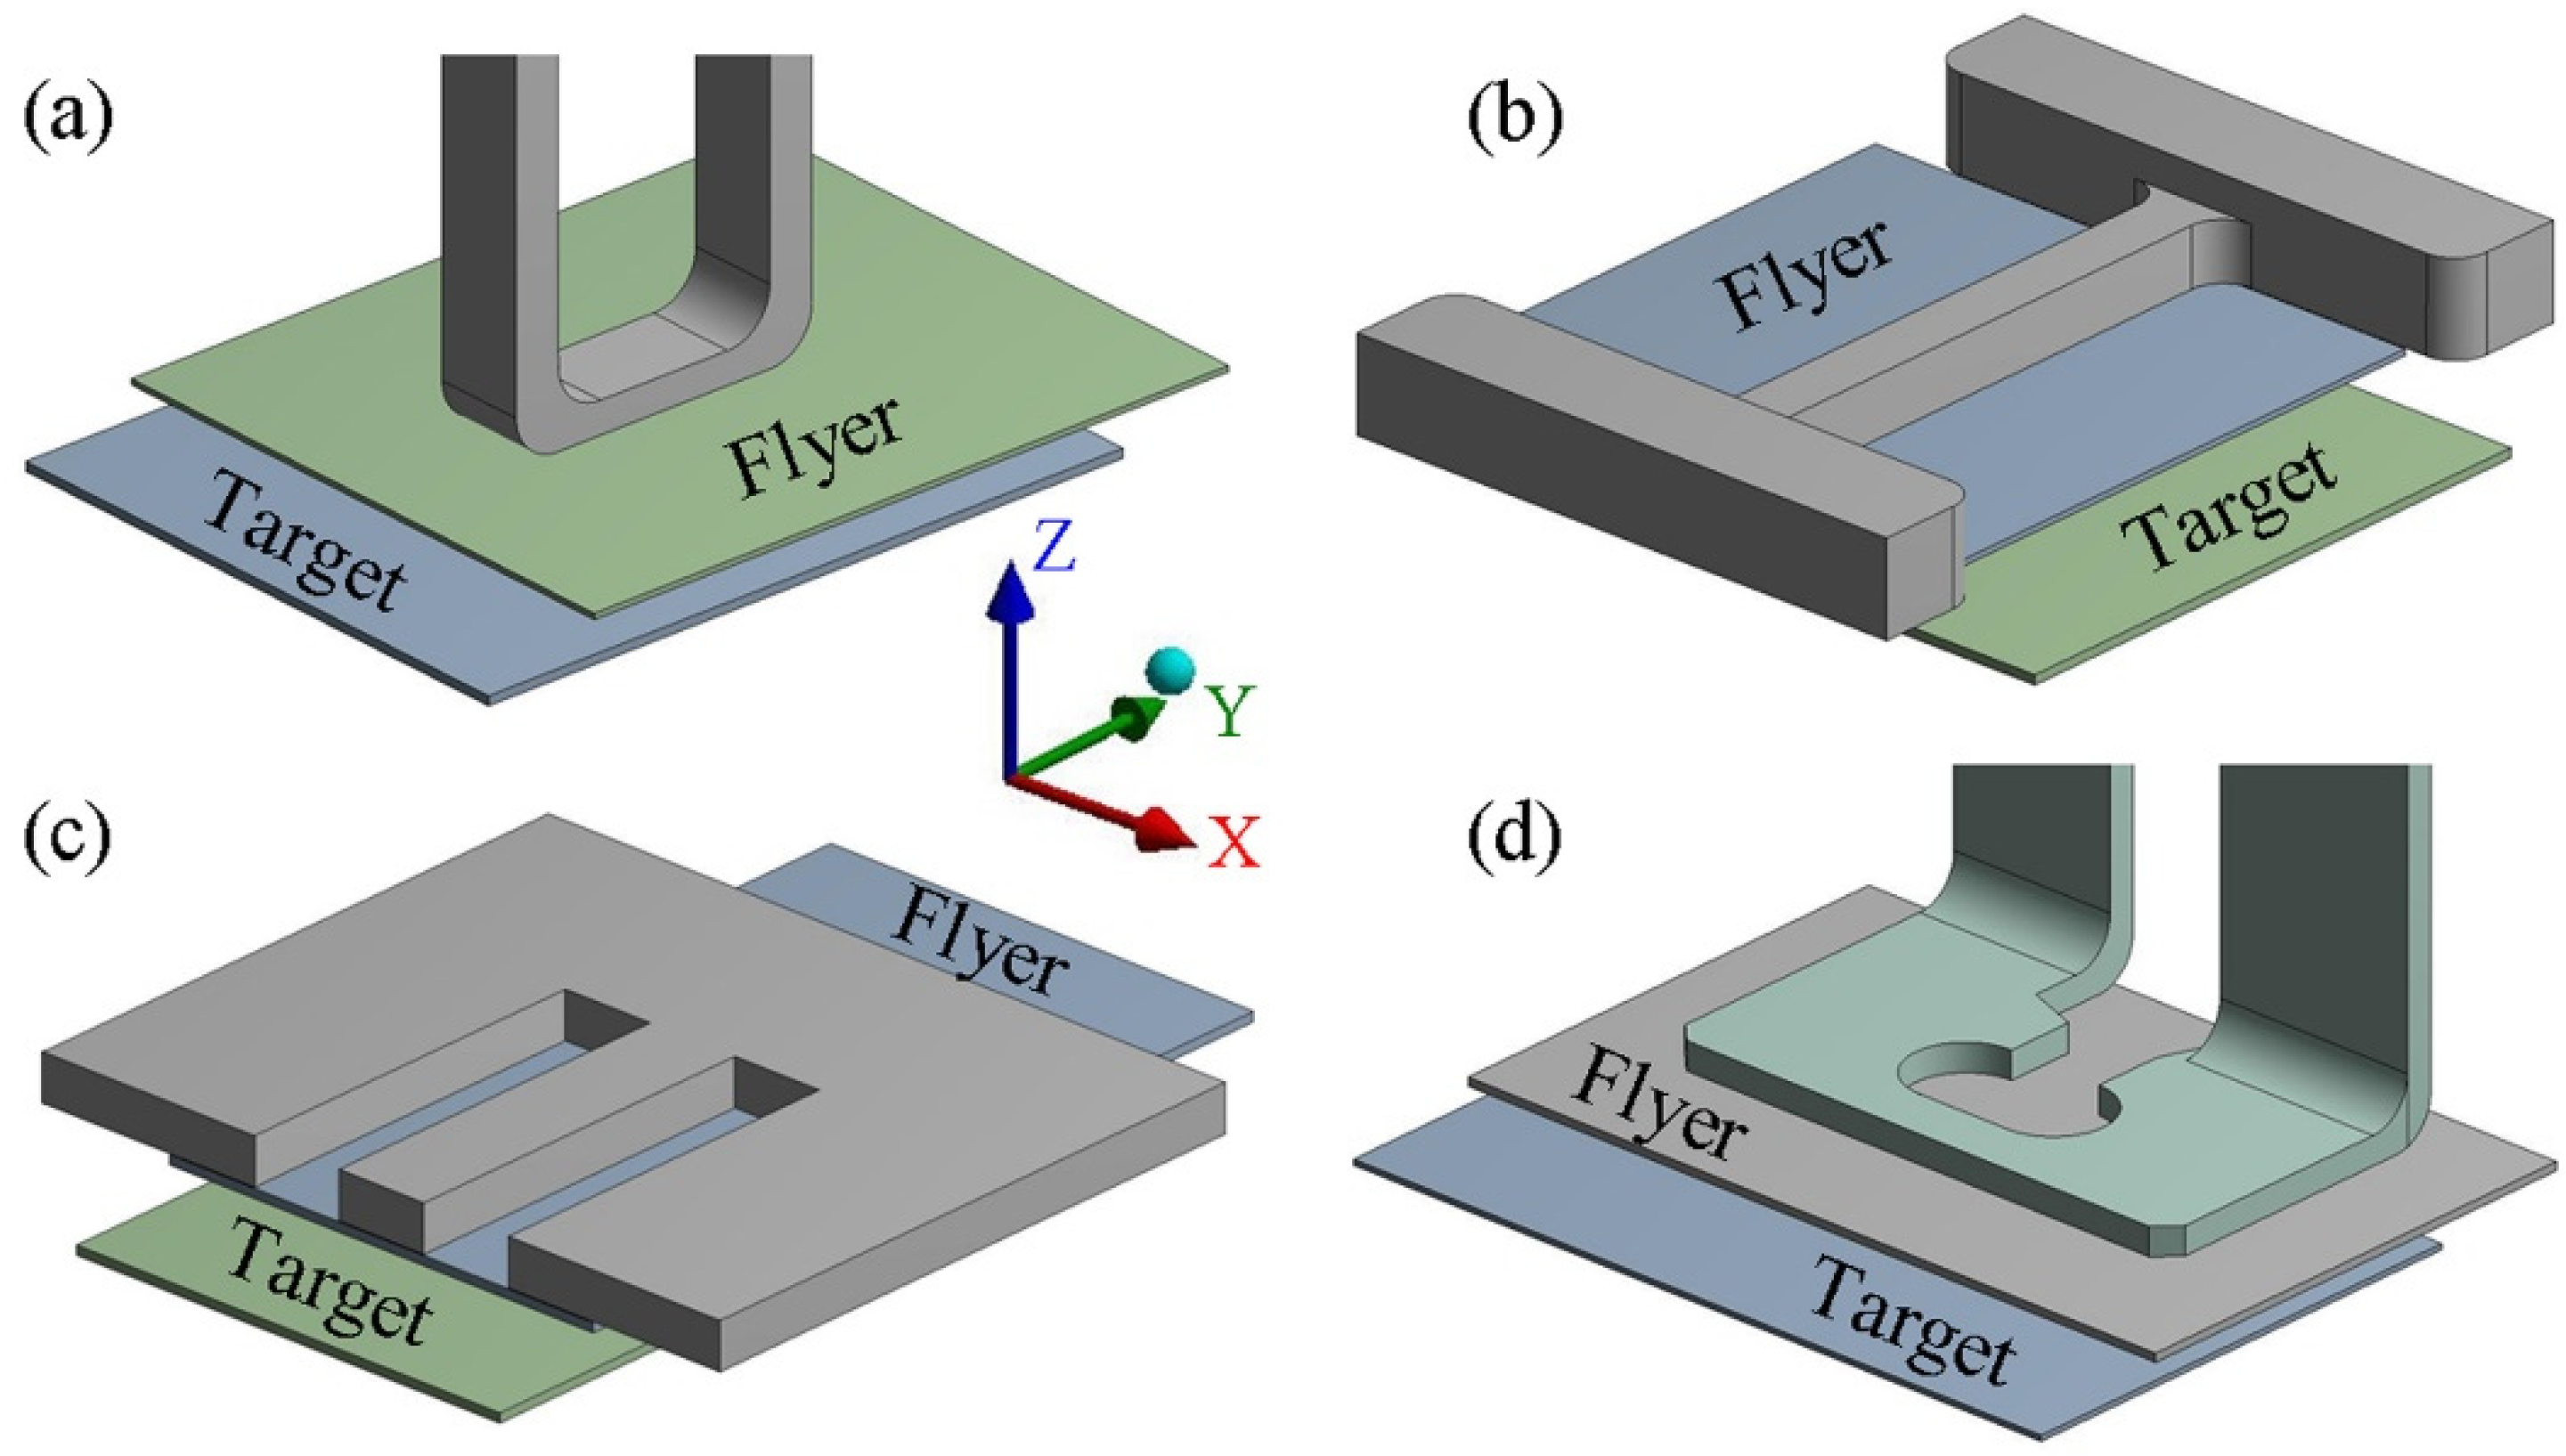
- The computed results have shown that an O-shaped flat coil can produce a significantly larger EM field and pressure concentration than rectangular-, H/I-, and E-shaped flat coils. For example, the maximum EM pressure with an O-shaped coil was found to be around 3.5 times higher in comparison to that obtained using a flat rectangular coil for similar process conditions
- The EM field and pressure were also more regular for the O-shaped coil than for the other coils. The EM field and pressure concentrated radially inward as the cross-sectional area of the O-shaped coil decreased.
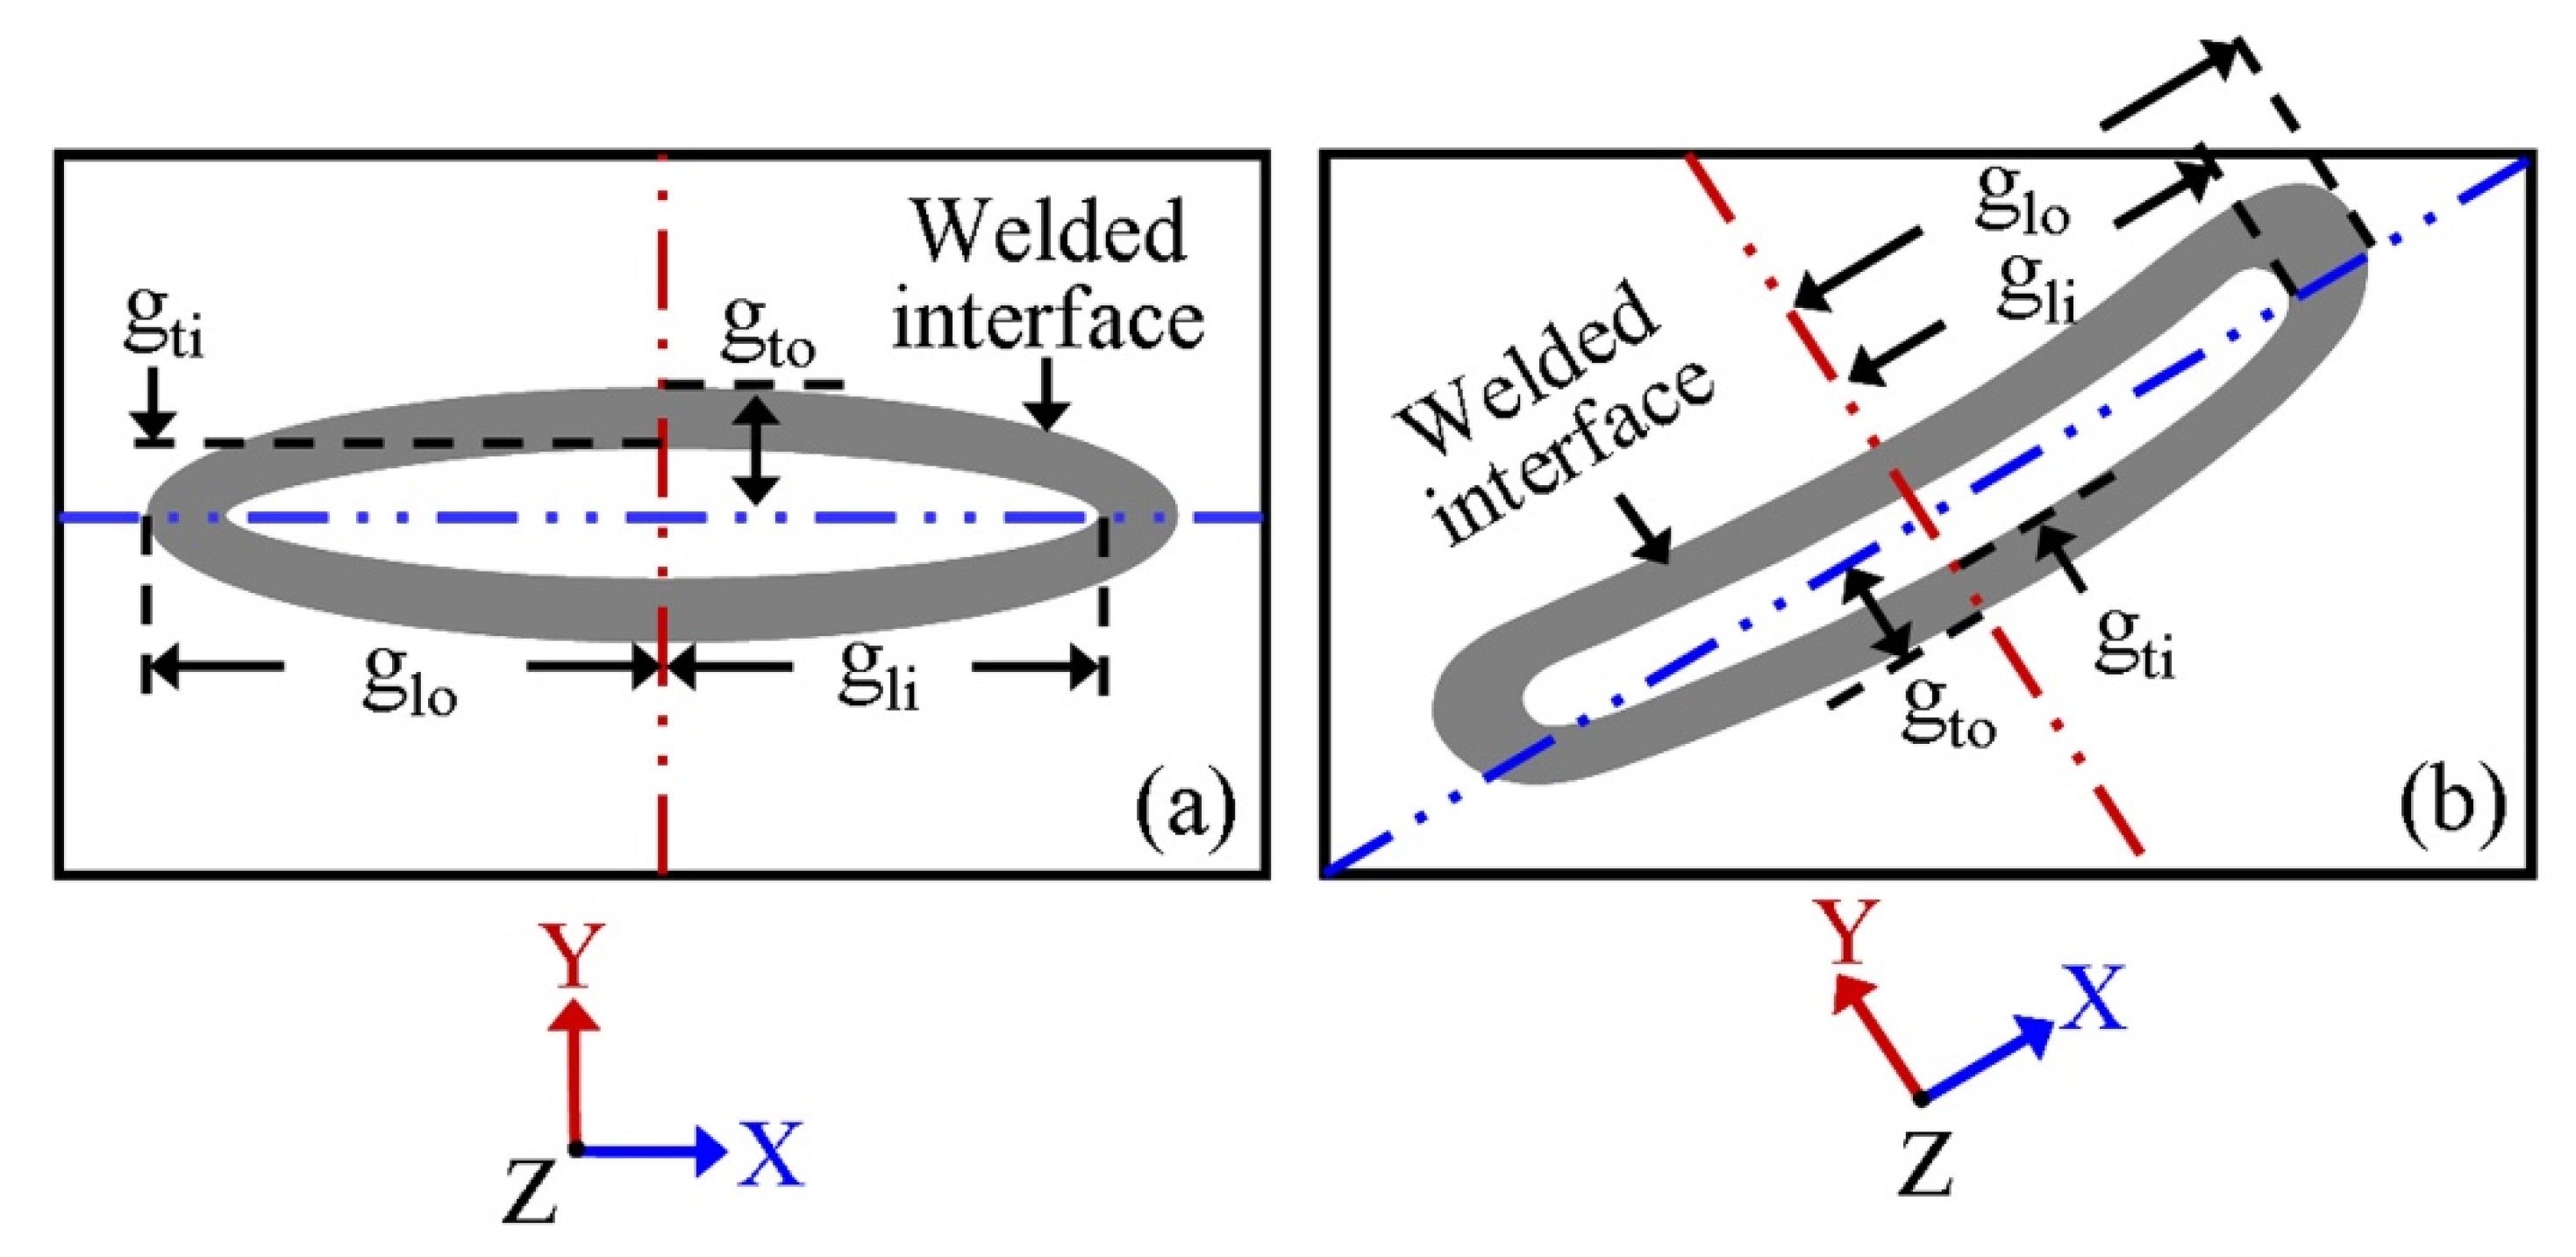
- The welded interface produced with the O-shaped coil showed a nearly annular elliptical geometry due to the inward EM pressure concentration. Both the standoff distance and the discharge energy directly influenced the final joint cross-sectional area.
- For similar process conditions, the O-shaped coil could produce an almost 3 times stronger joint between aluminium and steel sheets, compared to the joint obtained using a rectangular-shaped coil.
Author Contributions
Funding
Institutional Review Board Statement
Informed Consent Statement
Data Availability Statement
Conflicts of Interest
Appendix A

| Parameter | Specification | Unit | AA5182 | DC04 Steel |
|---|---|---|---|---|
| µ | Relative permeability | - | 1.0 | B-H curve [32] |
| σ | Electrical conductivity | S/m | 16.3 × 10⁶ | 7.54 × 10⁶ |
| ρ, cp | Density, specific heat | kg/m3, J/kg/K | 2650, 902 | 7870, 470 |
| E, G | Elastic modulus, shear modulus | GPa, GPa | 69.6, 26 | 180, 69.2 |
| Tm | Melting temperature | K | 873 | 1788 |
| Johnson–Cook material strength parameters | ||||
| A, B | Initial flow stress, hardening constant | MPa, MPa | 109, 552 | 162, 598 |
| C, n | Strain rate sensitivity, hardening exponent | - | 0.0012, 0.4 | 2.623, 0.6 |
| m | Thermal softening coefficient | - | 3.19 | 0.009 |
Appendix B
Appendix C
| Parameter | Specification | Unit | Values |
|---|---|---|---|
| U | Applied energy | kJ | 10, 13, 16 |
| ef, et | Flyer, target sheet thickness | mm | 1.2, 0.8 |
| s | Standoff distance | mm | 1.2, 2.4 |
References
- Saadouki, B.; Sapanathan, T.; Pelca, P.H.; Elghorba, M.; Rachik, M. Fatigue damage in field shapers used during electromagnetic forming and welding processes at high frequency impulse current. Int. J. Fatigue 2018, 109, 93–102. [Google Scholar] [CrossRef]
- Mamalis, A.G.; Manolakos, D.E.; Kladas, A.G.; Koumoutsos, A.K. Electromagnetic Forming Tools and Processing Conditions: Numerical Simulation. Mater. Manuf. Process. 2006, 21, 411–423. [Google Scholar] [CrossRef]
- Zhang, S.; Lueg-Althoff, J.; Hahn, M.; Tekkaya, A.E.; Kinsey, B.L. Effect of Process Parameters on Wavy Interfacial Morphology During Magnetic Pulse Welding. J. Manuf. Sci. Eng. 2021, 143, 011010. [Google Scholar] [CrossRef]
- Zhang, W.; Xie, J.; Chen, Y.; Zhang, L.; Yin, L.; Zhang, T.; Wang, S. Interfacial microstructure and bonding mechanism of the Al/Ti joint by magnetic pulse welding. Scr. Mater. 2022, 210, 114434. [Google Scholar] [CrossRef]
- Zhou, Y.; Li, C.; Shi, X.; Wang, P.; Shen, T.; Mi, Y.; Ma, Y. Evaluation model of electromagnetic pulse welding effect based on Vc-β trajectory curve. J. Mater. Res. Technol. 2022, 20, 616–626. [Google Scholar] [CrossRef]
- Zhang, H.; Liu, N.; Li, X.; Wang, Q.; Ding, H. Optimization design and experimental research of magnetic pulse welding system based on uniform pressure electromagnetic actuator. Int. J. Adv. Manuf. Technol. 2022, 121, 8447–8465. [Google Scholar] [CrossRef]
- Yan, Z.; Xiao, A.; Cui, X.; Guo, Y.; Lin, Y.; Zhang, L.; Zhao, P. Magnetic pulse welding of aluminum to steel tubes using a field-shaper with multiple seams. J. Manuf. Process. 2021, 65, 214–227. [Google Scholar] [CrossRef]
- Soni, M.; Ahmed, M.; Panthi, S.K.; Kumar, S. Effect of coil design parameters on performance of electromagnetic forming process. Mater. Manuf. Process. 2022, 37, 64–80. [Google Scholar] [CrossRef]
- Yao, Y.; Jing, L.; Wang, S.; Li, G.; Cui, J.; Tang, X.; Jiang, H. Mechanical properties and joining mechanisms of Al-Fe magnetic pulse welding by spot form for automotive application. J. Manuf. Process. 2022, 76, 504–517. [Google Scholar] [CrossRef]
- Li, J.; Sapanathan, T.; Raoelison, R.; Hou, Y.; Simar, A.; Rachik, M. On the complete interface development of Al/Cu magnetic pulse welding via experimental characterizations and multiphysics numerical simulations. J. Mater. Process. Technol. 2021, 296, 117185. [Google Scholar] [CrossRef]
- Wang, P.; Ning, X.; Du, J.; Li, C. Electromagnetic pulse welding on a magnesium–aluminum joint: Role of angle of welding. Mater. Manuf. Process. 2022, 1–8. [Google Scholar] [CrossRef]
- Zhu, C.; Sun, L.; Gao, W.; Li, G.; Cui, J. The effect of temperature on microstructure and mechanical properties of Al/Mg lap joints manufactured by magnetic pulse welding. J. Mater. Res. Technol. 2019, 8, 3270–3280. [Google Scholar] [CrossRef]
- Cui, J.; Ye, L.; Zhu, C.; Geng, H.; Li, G. Mechanical and Microstructure Investigations on Magnetic Pulse Welded Dissimilar AA3003-TC4 Joints. J. Mater. Eng. Perform. 2020, 29, 712–722. [Google Scholar] [CrossRef]
- Li, Y.; Yang, D.; Yang, W.; Wu, Z.; Liu, C. Multiphysics Numerical Simulation of the Transient Forming Mechanism of Magnetic Pulse Welding. Metals 2022, 12, 1149. [Google Scholar] [CrossRef]
- Kore, S.; Date, P.; Kulkarni, S. Effect of process parameters on electromagnetic impact welding of aluminum sheets. Int. J. Impact Eng. 2007, 34, 1327–1341. [Google Scholar] [CrossRef]
- Kumar, S.; Chakravarthy, D.P. Characterisation of electromagnetic welding equipment. Int. J. Appl. Electromagn. Mech. 2012, 40, 293–300. [Google Scholar] [CrossRef]
- Hahn, M.; Weddeling, C.; Lueg-Althoff, J.; Tekkaya, A.E. Analytical approach for magnetic pulse welding of sheet connections. J. Mater. Process. Technol. 2016, 230, 131–142. [Google Scholar] [CrossRef]
- Watanabe, M.; Kawamura, Y.; Kumai, S. Microstructure and Joint Strength of Magnetic Pulse Welded Aluminum/Aluminum-Coated Steel Joint. Mater. Trans. 2021, 62, 1151–1159. [Google Scholar] [CrossRef]
- Sarvari, M.; Abdollah-Zadeh, A.; Naffakh-Moosavy, H.; Rahimi, A.; Parsaeyan, H. Investigation of Collision Surfaces and Weld Interface in Magnetic Pulse Welding of Dissimilar Al/Cu Sheets. J. Manuf. Process. 2019, 45, 356–367. [Google Scholar] [CrossRef]
- Lee, K.-J.; Kumai, S.; Arai, T.; Aizawa, T. Interfacial microstructure and strength of steel/aluminum alloy lap joint fabricated by magnetic pressure seam welding. Mater. Sci. Eng. A 2007, 471, 95–101. [Google Scholar] [CrossRef]
- Zhou, Y.; Li, C.; Wang, X.; Liao, Z.; Shi, X.; Yao, C. Investigation of flyer plate dynamic behavior in electromagnetic pulse welding. J. Manuf. Process. 2021, 68, 189–197. [Google Scholar] [CrossRef]
- Li, C.; Zhou, Y.; Shi, X.; Liao, Z.; Du, J.; Shen, T.; Yao, C. Magnetic field edge-effect affecting joint macro-morphology in sheet electromagnetic pulse welding. Mater. Manuf. Process. 2020, 35, 1040–1050. [Google Scholar] [CrossRef]
- Shim, J.-Y.; Kang, B.-Y.; Kim, I.-S. Characteristics of 5052 aluminum alloy sheets joint using electromagnetic force. J. Mech. Sci. Technol. 2017, 31, 3437–3444. [Google Scholar] [CrossRef]
- Zhang, H.; Yang, Z.; Ren, L. Experimental investigation on structure parameters of E-shaped coil in magnetic pulse welding. Mater. Manuf. Process. 2019, 34, 1701–1709. [Google Scholar] [CrossRef]
- Aizawa, T.; Kashani, M. Experimental and numerical study on magnetic pulse welding to improving the life time of one-turn flat coil. IOP Conf. Ser. Mater. Sci. Eng. 2014, 61, 012028. [Google Scholar] [CrossRef] [Green Version]
- Khalil, C.; Marya, S.; Racineux, G. Construction of physical welding windows for magnetic pulse welding of 5754 aluminum with DC04 steel. Int. J. Mater. Form. 2021, 14, 843–854. [Google Scholar] [CrossRef]
- Khalil, C.; Marya, S.; Racineux, G. Magnetic Pulse Welding and Spot Welding with Improved Coil Efficiency—Application for Dissimilar Welding of Automotive Metal Alloys. J. Manuf. Mater. Process. 2020, 4, 69. [Google Scholar] [CrossRef]
- Chari, M.V.K.; Salon, S.J. Numerical Method in Electromagnetic; Academic Press: San Diego, CA, USA, 2000; pp. 1–60. [Google Scholar]
- Sadiku, M.N.O.; Kulkarni, S.V. Principle of Electromagnetics, 6th ed.; Oxford University Press: New Delhi, India, 2015; pp. 383–480. [Google Scholar]
- Plonsey, R.; Collin, R.E. Principles and Applications of Electromagnetic Fields; McGraw-Hill Book Co.: New York, NY, USA; Toronto, ON, USA; London, UK, 1961. [Google Scholar]
- Shotri, R.; Faes, K.; Racineux, G.; De, A. Analytical Estimation of Electromagnetic Pressure, Flyer Impact Velocity, and Welded Joint Length in Magnetic Pulse Welding. Metals 2022, 12, 276. [Google Scholar] [CrossRef]
- Shotri, R.; Racineux, G.; De, A. Probing magnetic pulse welding of aluminium and steel sheets. J. Manuf. Process. 2021, 72, 309–319. [Google Scholar] [CrossRef]
- Johnson, G.R.; Cook, W.H. A constitutive model and data for metals subjected to large strains, high strain rates and high temperature. In Proceedings of the Seventh International Symposium on Ballistics, The Hague, The Netherlands, 19–21 April 1983; pp. 541–548. [Google Scholar]
- Shotri, R.; Faes, K.; De, A. Magnetic pulse welding of copper to steel tubes—Experimental investigation and process modelling. J. Manuf. Process. 2020, 58, 249–258. [Google Scholar] [CrossRef]
- Shotri, R.; Racineux, G.; De, A. Magnetic pulse welding of metallic tubes—Experimental investigation and numerical modelling. Sci. Technol. Weld. Join. 2020, 25, 273–281. [Google Scholar] [CrossRef]
- Faes, K.; Shotri, R.; De, A. Probing magnetic pulse welding of thin-walled tubes. J. Manuf. Mater. Process. 2020, 4, 118. [Google Scholar] [CrossRef]
- Rebensdorf, A.; Böhm, S. Magnetic pulse welding—Investigation on the welding of high-strength aluminum alloys and steels as well as the influence of fluctuations in the production on the welding results for thin metal sheets. Weld. World 2018, 62, 855–868. [Google Scholar] [CrossRef]
- ANSYS. Mechanical Workbench Operations Guide; Release 14.5; ANSYS Inc.: Canonsburg, PA, USA, 2014. [Google Scholar]


| Flyer | Si | Fe | Cu | Mn | Mg | Cr | Zn | Ti | Al |
|---|---|---|---|---|---|---|---|---|---|
| AA5182 | 0.20 | 0.35 | 0.15 | 0.50 | 4.0–5.0 | 0.10 | 0.25 | 0.10 | balance |
Publisher’s Note: MDPI stays neutral with regard to jurisdictional claims in published maps and institutional affiliations. |
© 2022 by the authors. Licensee MDPI, Basel, Switzerland. This article is an open access article distributed under the terms and conditions of the Creative Commons Attribution (CC BY) license (https://creativecommons.org/licenses/by/4.0/).
Share and Cite
Shotri, R.; Faes, K.; Racineux, G.; De, A. Improved Coil Design for Magnetic Pulse Welding of Metallic Sheets. J. Manuf. Mater. Process. 2022, 6, 144. https://doi.org/10.3390/jmmp6060144
Shotri R, Faes K, Racineux G, De A. Improved Coil Design for Magnetic Pulse Welding of Metallic Sheets. Journal of Manufacturing and Materials Processing. 2022; 6(6):144. https://doi.org/10.3390/jmmp6060144
Chicago/Turabian StyleShotri, Rishabh, Koen Faes, Guillaume Racineux, and Amitava De. 2022. "Improved Coil Design for Magnetic Pulse Welding of Metallic Sheets" Journal of Manufacturing and Materials Processing 6, no. 6: 144. https://doi.org/10.3390/jmmp6060144