3.1. Prelminary Peel Test
The goal of these experiments was to evaluate the weldability window for the workpieces. A visual evaluation of each weld combined with a peel test was used to determine the boundary values of each process parameter. Too low parameter values do not create a welded joint of the workpieces. Too high parameters, however, cause some undesired phenomena during welding, including the deformation of the sheets at the weld location, bending upwards of the upper sheet during the weld cycle, and sometimes even a rupture of the sheets while clamped under the sonotrode.
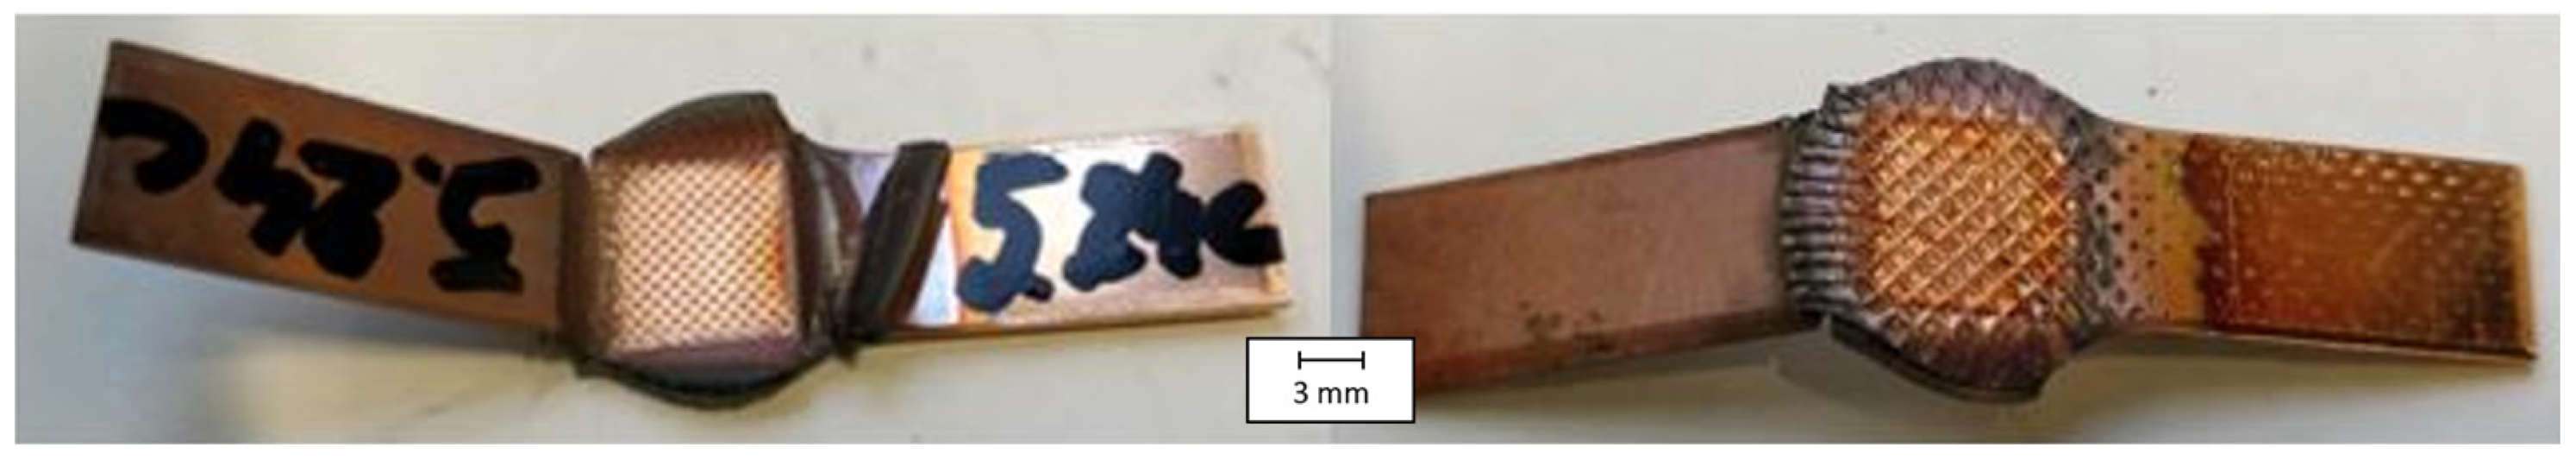
Figure 5 shows an example of a welded specimen that is deformed at the weld nugget and bent upwards during welding.
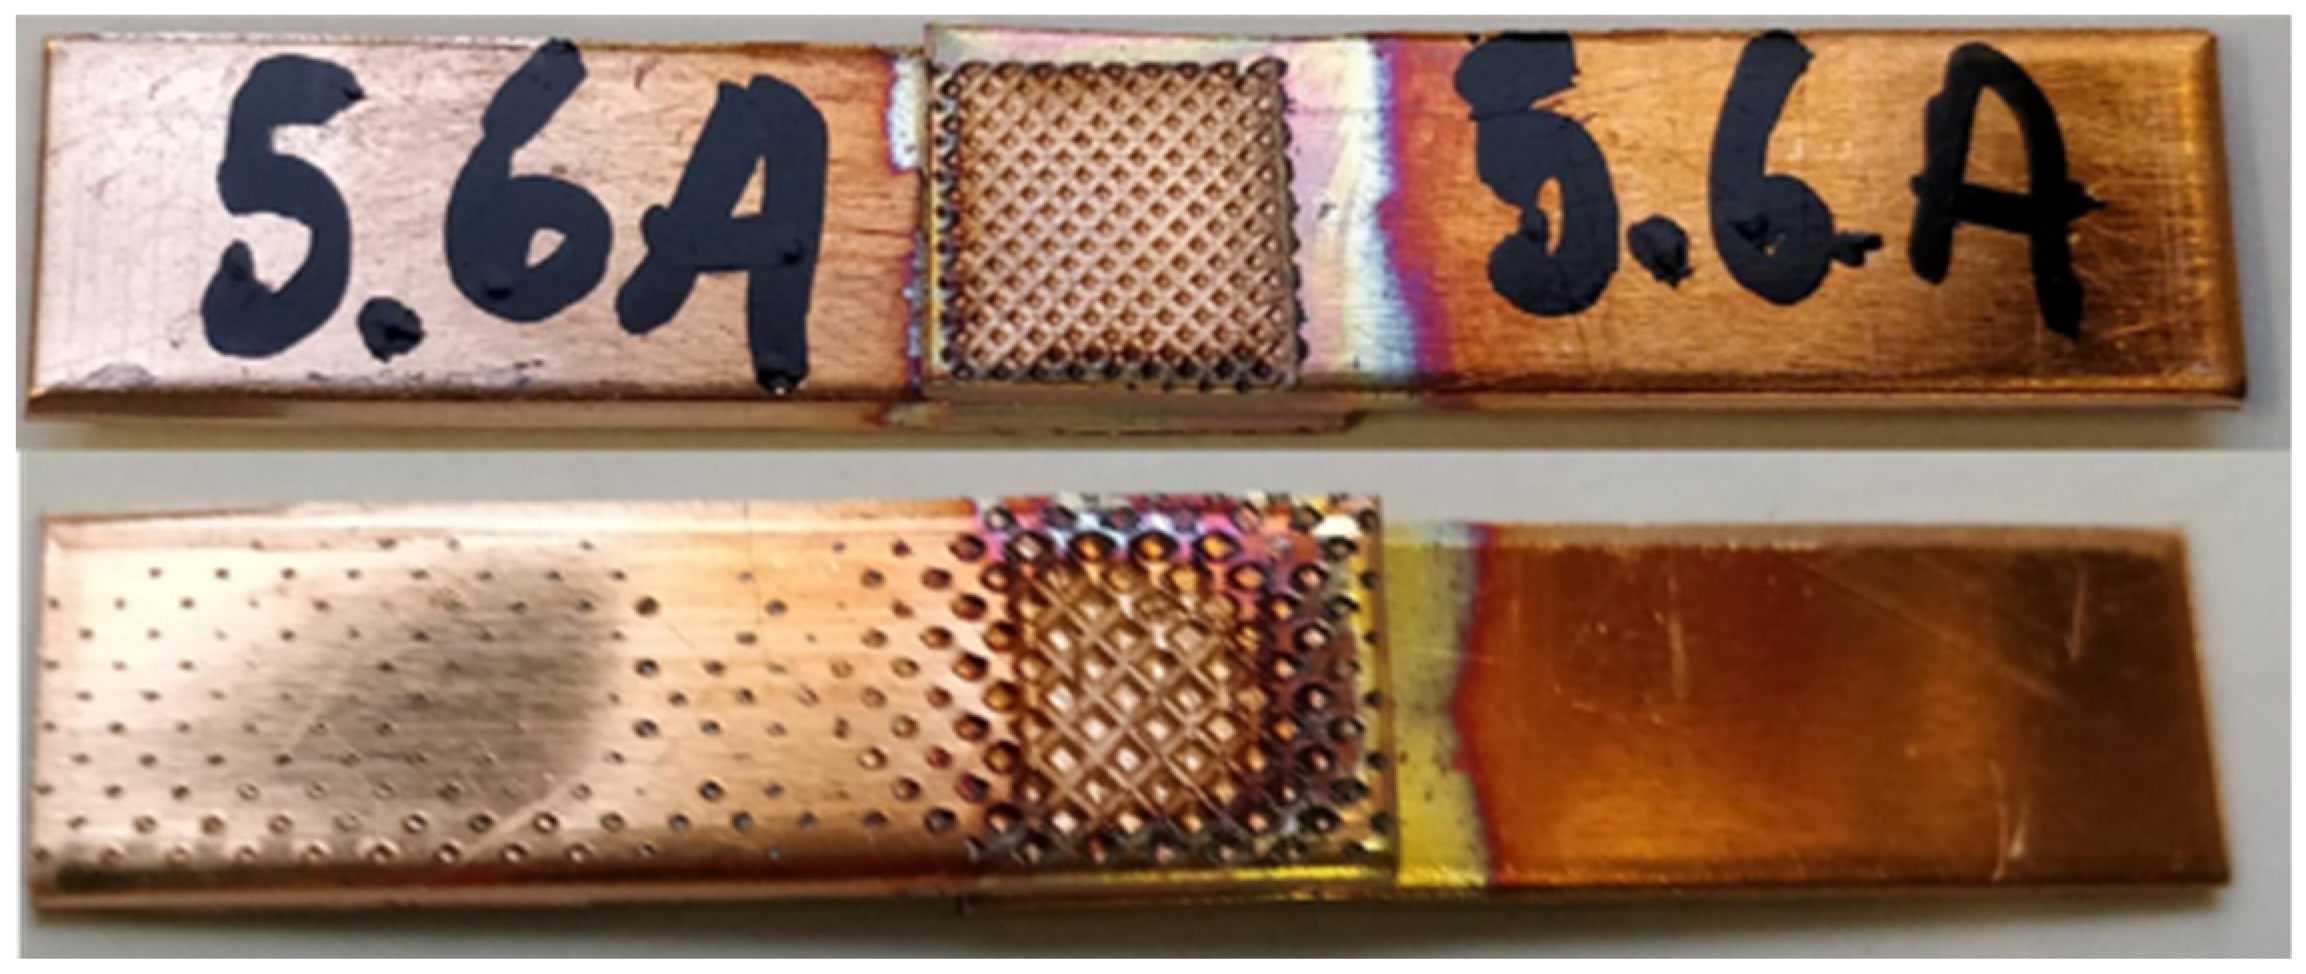
For the thin sheets used in this work, a large value for the pressure or vibration amplitude results in the deformation of the weld surface and even cracks in the copper sheets. A high-pressure value will result in the thinning of the workpieces, because the sonotrode will indent deeper into the material. A high vibration amplitude increases the amount of friction and heat that is introduced into the weld. For some welds, the heat development is visible as discolorations around the weld nugget. An example of this is shown in
Figure 6.
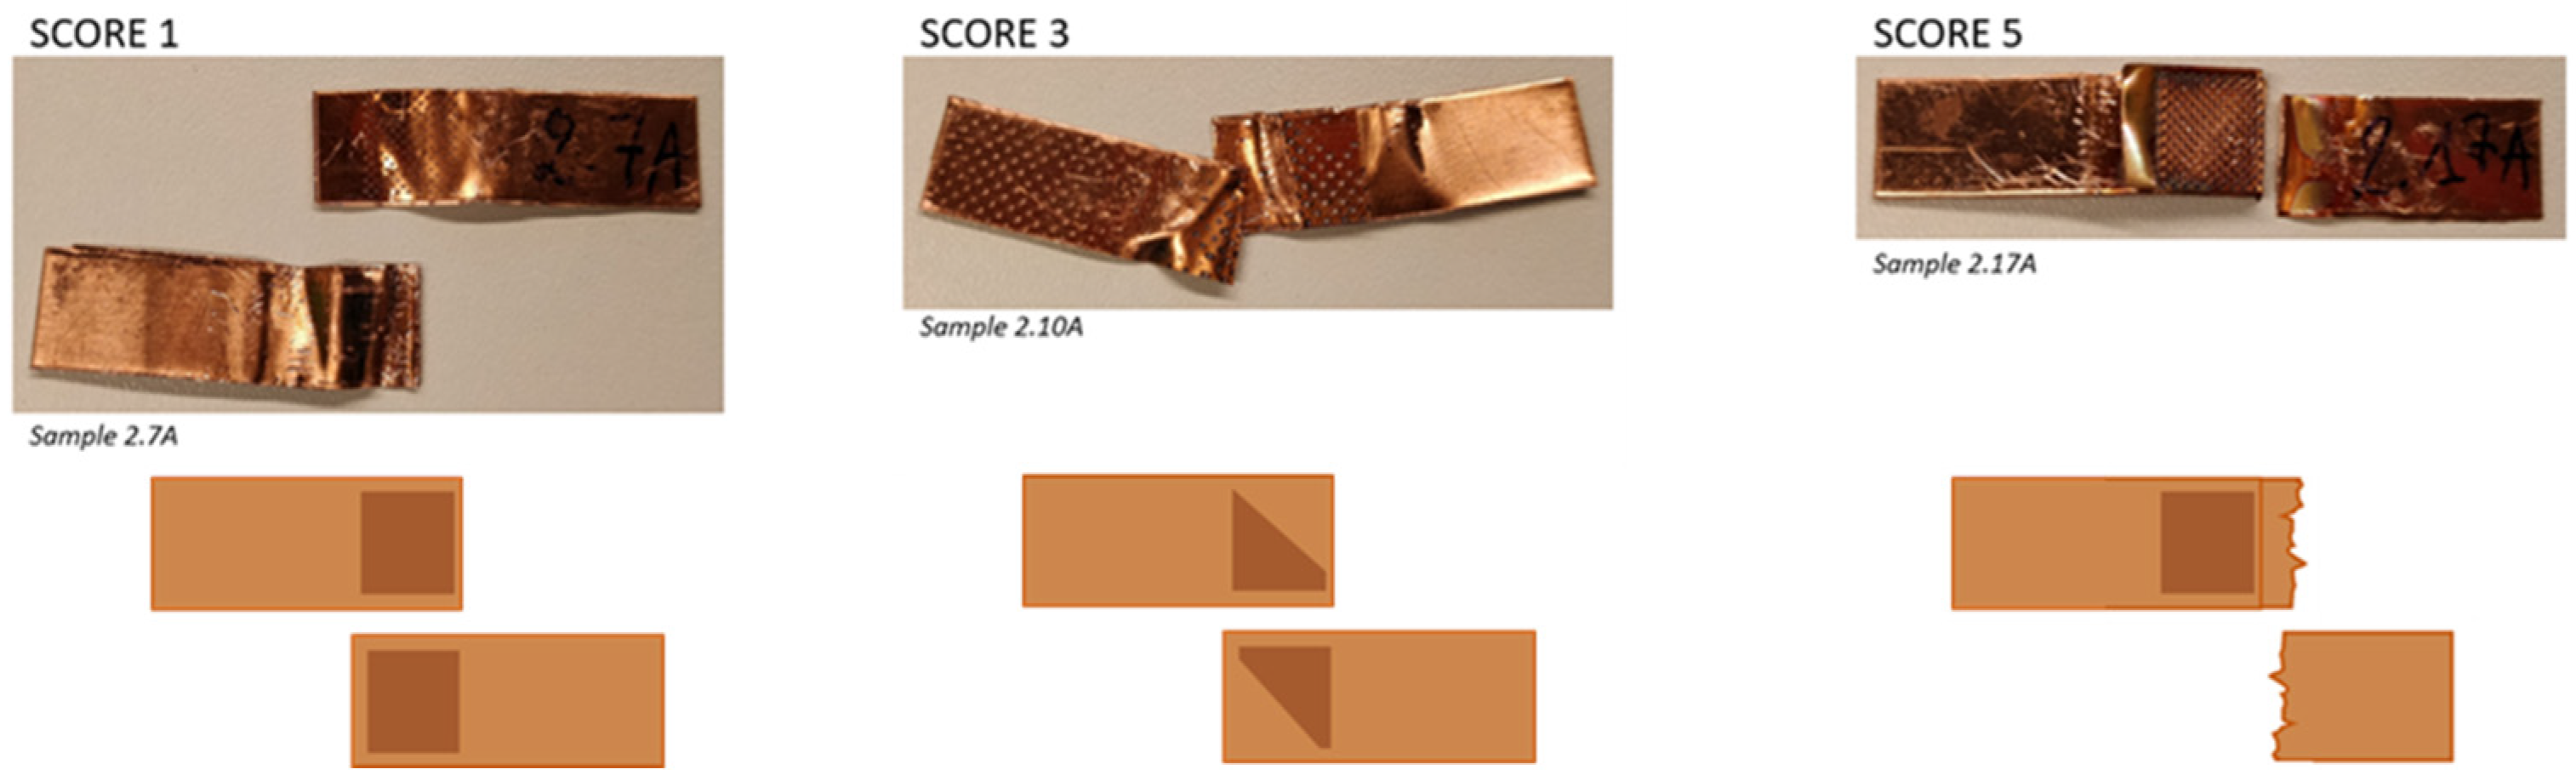
Peel testing was performed for each parameters combination to have an initial indication of the weld quality. It is noticed that the number of welds with a peel test score of 3 or 1 was large for the 0.3 mm thick sheets. This indicates that it is difficult to achieve a satisfactory weld for a small sheet thickness of 0.3 mm, even though the parameters are chosen within the parameter window. Not all combinations of parameter values within the parameter window resulted in a sound joint between the workpieces.
The parameter settings corresponding to the different points of the DoE matrix are shown in
Table 2. No intermediate value of welding time is chosen for the test series because observations during the exploratory welds indicated that the welding time had lower influence on the weld quality within the limits considered.
According to the parameters listed in the
Table 3, a full factorial plan of the experiments was designed consisting in 18 process conditions (3
2 combinations for the pressure and amplitude per the two values of the welding time). Four replications were made for each configuration of the process parameters, leading to a total of 72 welding tests. The following table summarizes the welding configuration and the measured welding energy consumption and lap shear strength (LSS). The energy values obtained from the data log of the machine represent the electric energy input during the weld. No information is available about the amount of energy effectively used for the weld formation, as energy losses due to heat dissipation are difficult to determine. The resulting energy response of the different welding conditions of the DoE were analysed. Each welding condition has been executed four times, resulting in four values for the welding energy. According to [
25], all three welding parameters are directly linked to the energy delivered to the weld. The result from the lap shear test from the equipment is the force
F required to break the sample. The lap shear strength
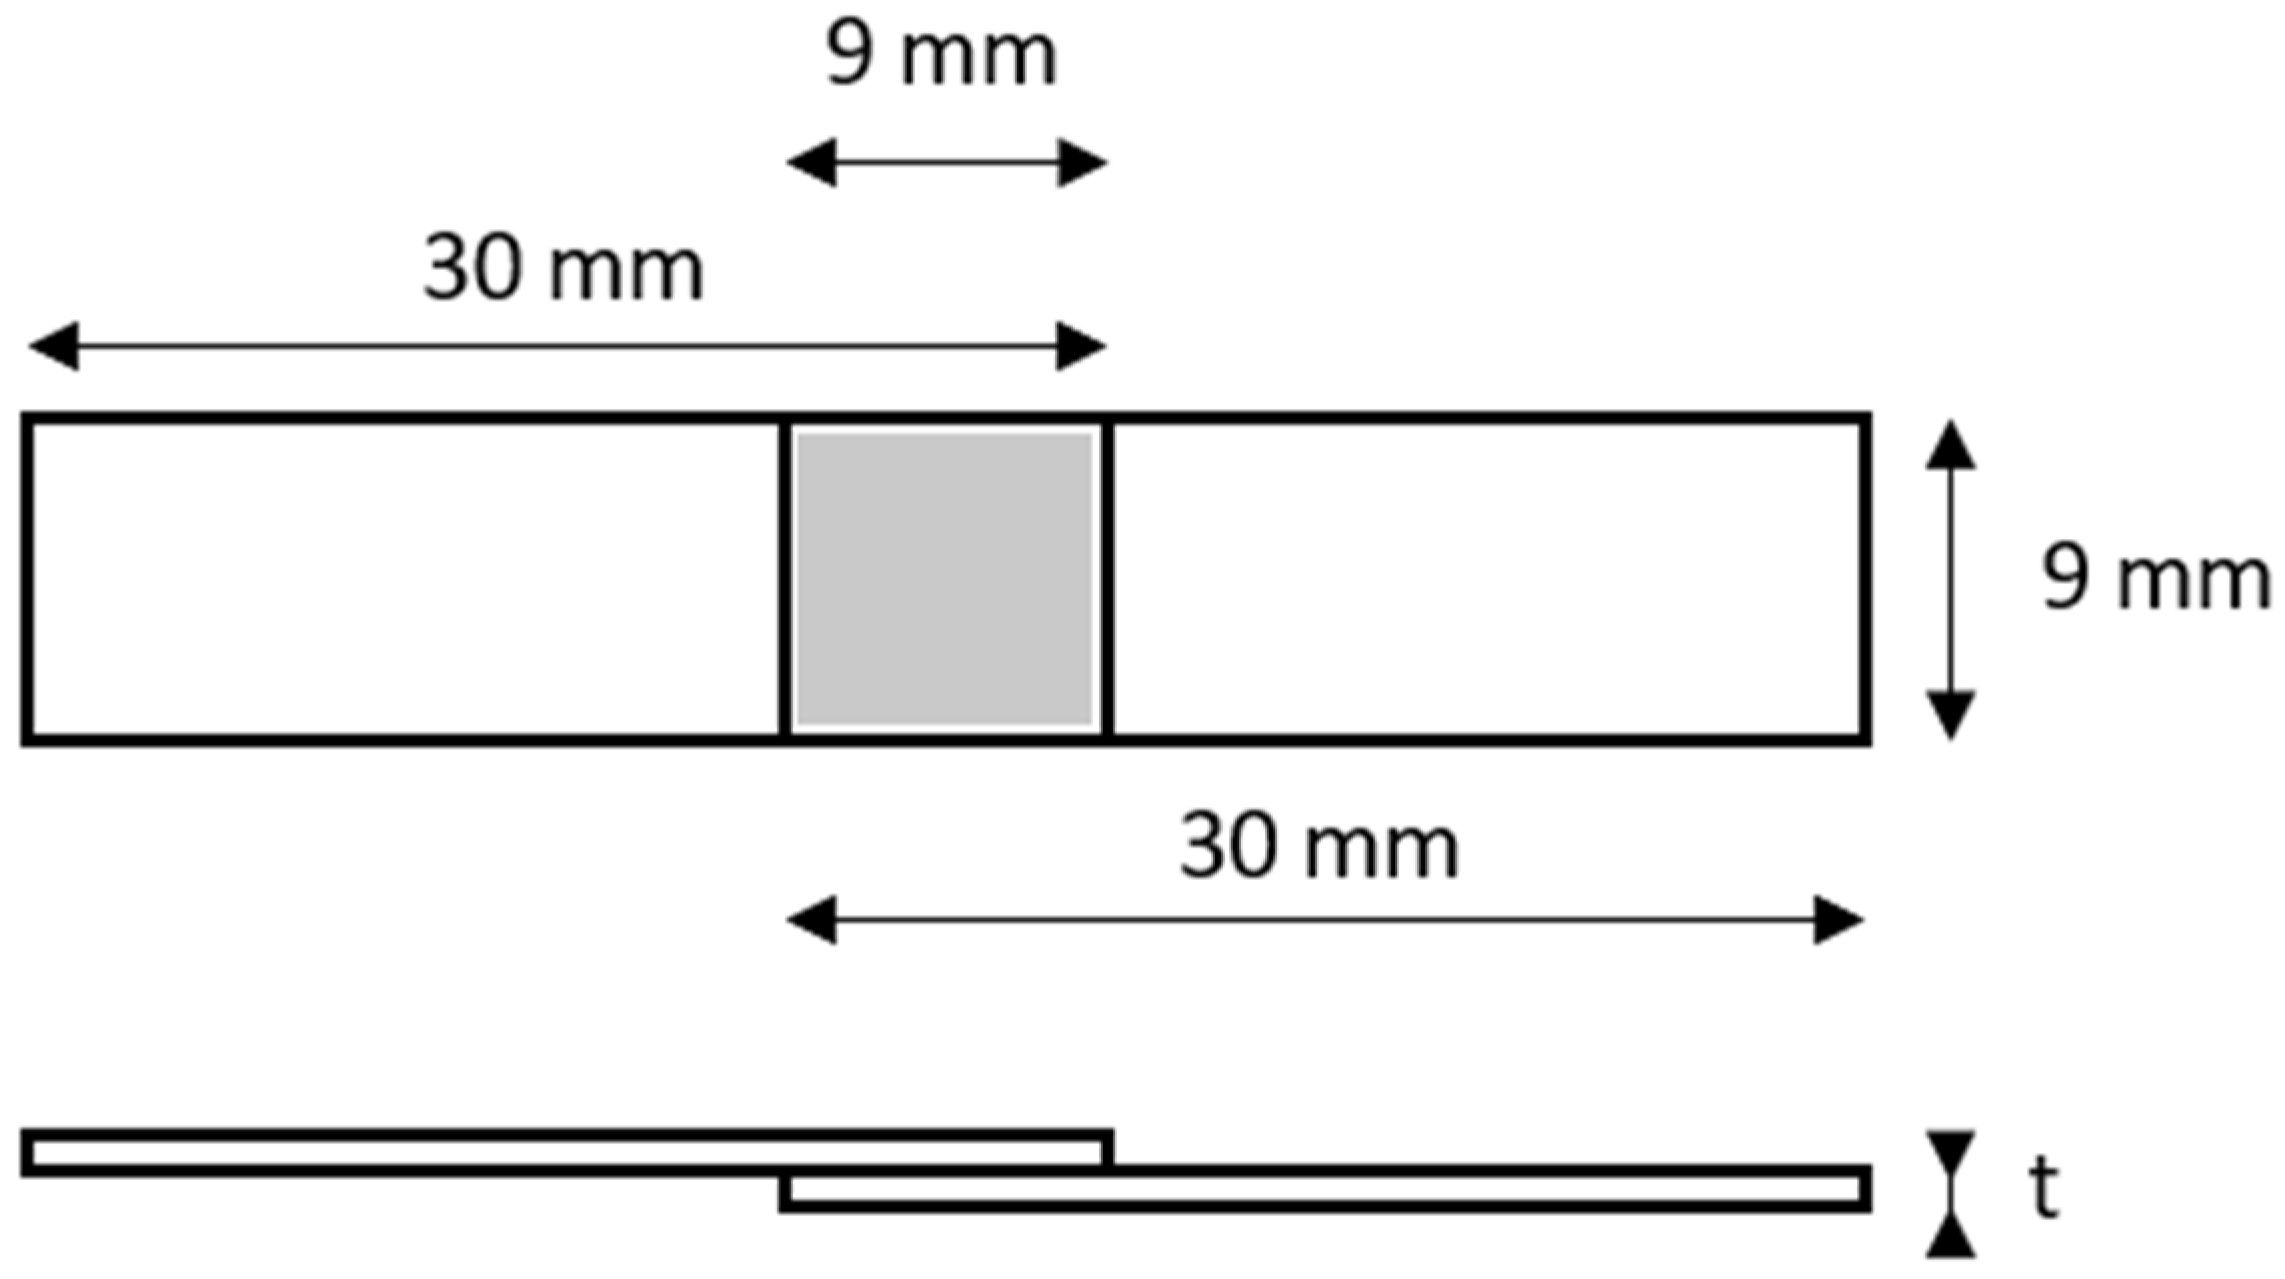
S of the samples is then calculated by dividing this force by the overlapping area at the weld interface, as shown is Equation (1).
The areas of the cross-sections are (see
Figure 1):
The ratio between the LSS of the welds and the calculated lap shear strength of the base material is also reported, instead of the actual values, as an indicator of the weld quality. The base material strength was measured by performing a tensile test on three sheets with dimensions 51 mm × 9 mm × 1.0 mm, and by calculating the average of the resulting forces at failure. The length of 51 mm corresponds to the average length of the welded configurations, as each sheet is 30 mm long with an overlap of 9 mm. The average measured force to break the copper base material equals 2.175 kN. The average yield strength of the copper sheets corresponds, hence, to 241 MPa (see also
Table 1). With a bonded area of 81 mm
2, the calculated LSS of copper sheet is approximately 23.3 MPa. The lap shear strength is a material property, making it an appropriate reference for all three sheet thicknesses.
3.2. Metallographic Examination
All welds with a peel test score of 3 or 5 have been evaluated using optical microscopy. Regardless of the welding configuration, no continuous weld interface has been observed; indeed, during the weld cycle, local welded spots are created, referred as welded islands, interrupted by interfacial gaps [
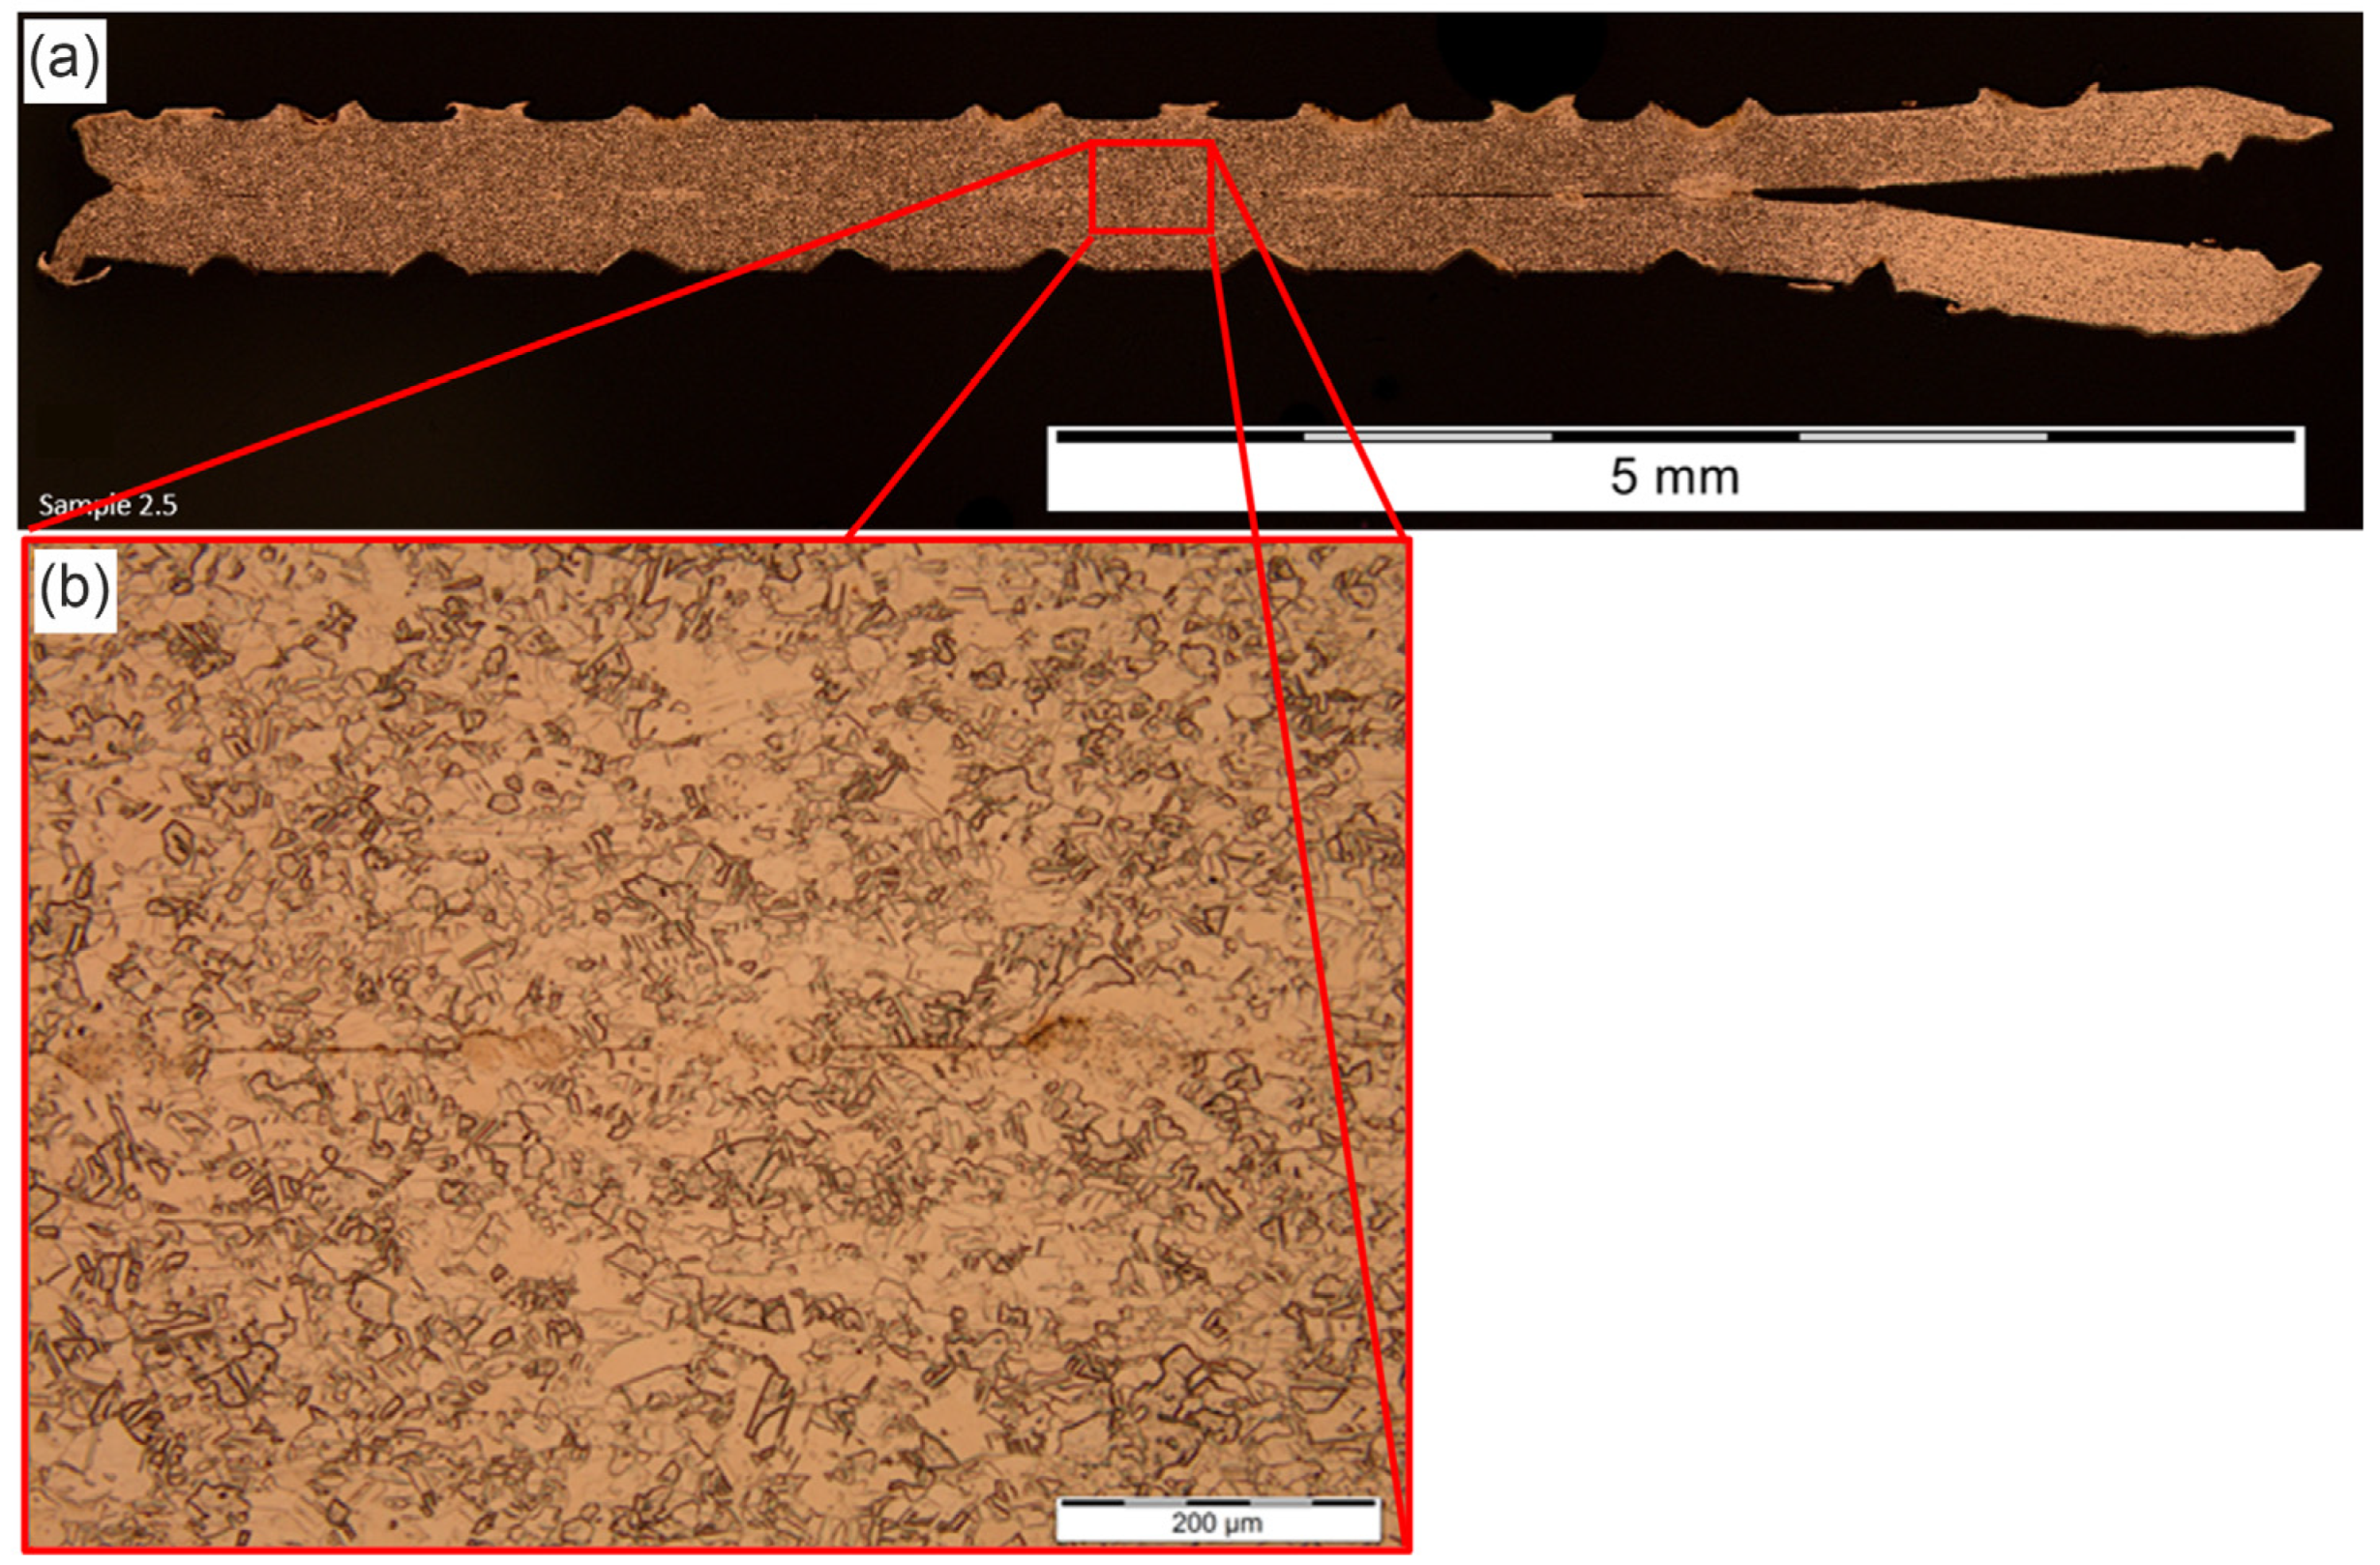
26]. These welded islands are clearly visible at the weld interface (
Figure 7b). On the locations between the welded islands, where no clear gaps are visible, the workpieces can be assumed to be connected to each other.
On the cross section of the welds, black lines can be also distinguished at the interface (shown in
Figure 7a,b). These lines indicate gaps between the welded sheets where no bonding has occurred. Apart from these gaps and porosities, no other weld flaws have been detected in the welds.
On the images of the etched samples, very thin lines can be also distinguished in between the welded islands. This phenomenon can be seen on almost all investigated samples. These lines are not thick enough to clearly be categorized as a gap, therefore they represent locations where the sheets are joined. However, compared to the welded islands, these lines present different features and, probably, no similar mixing of the material has occurred. This has been shown by a SEM investigation (
Figure 8 and
Figure 9).
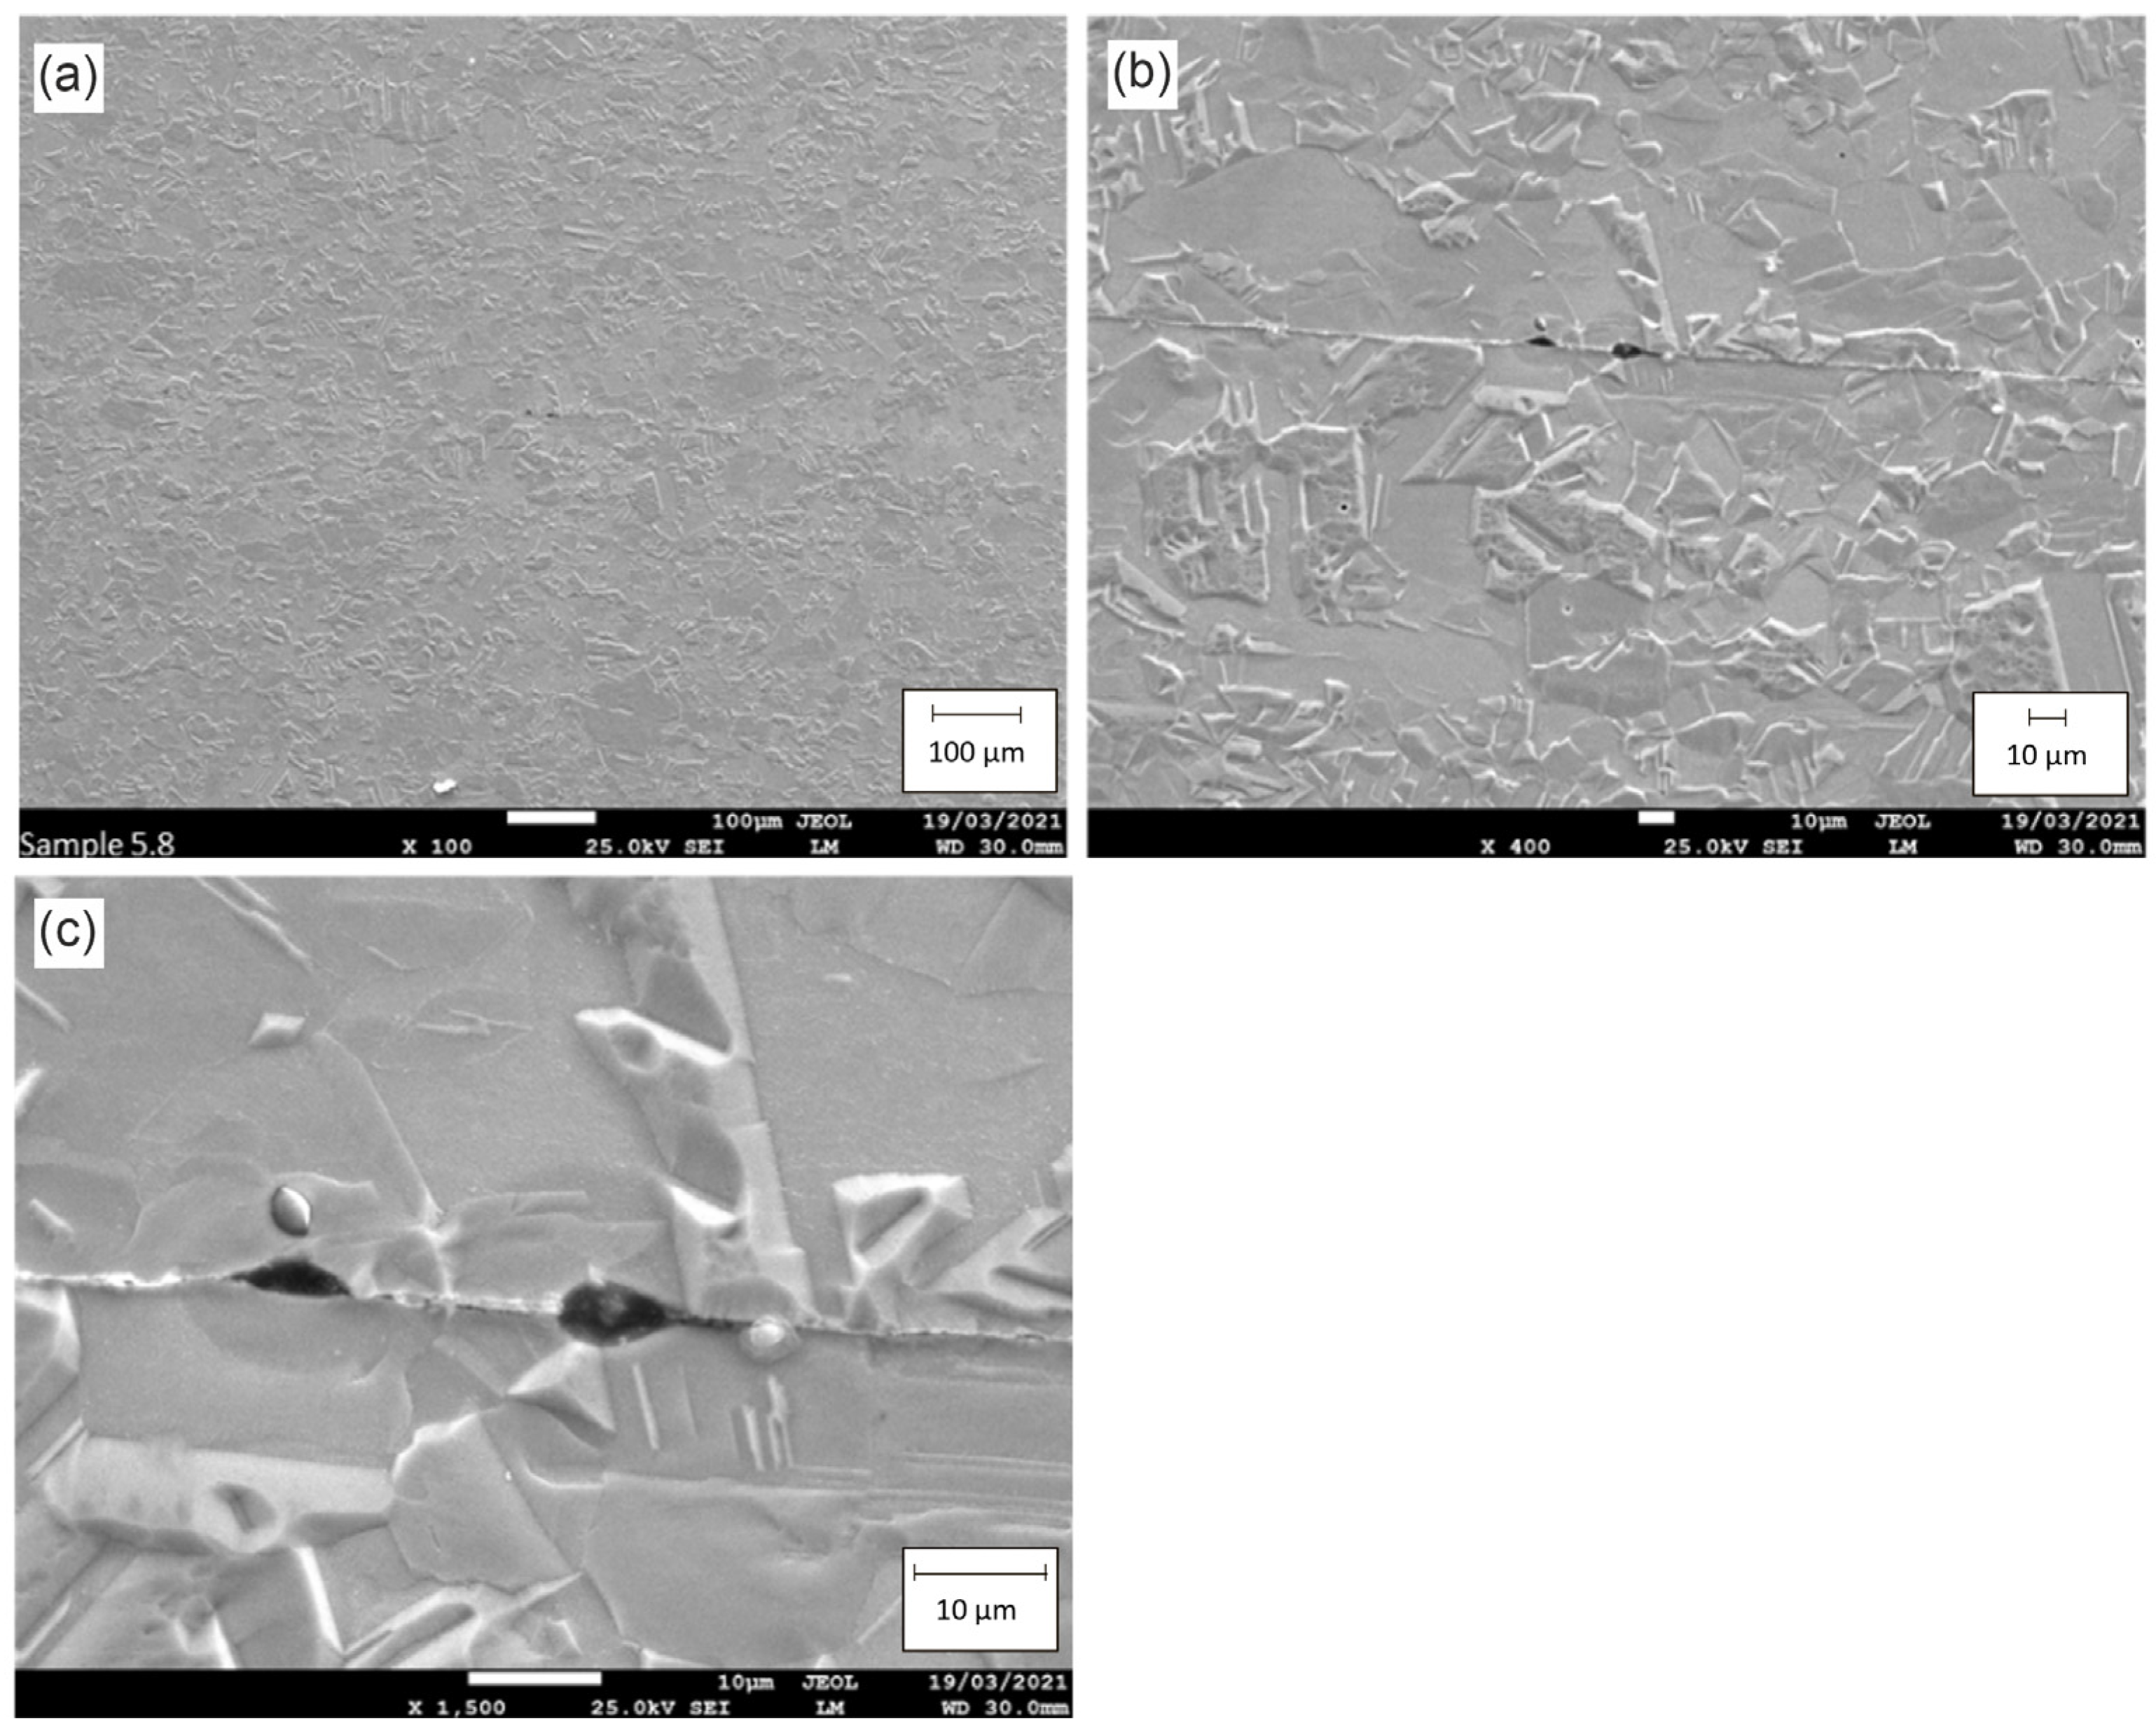
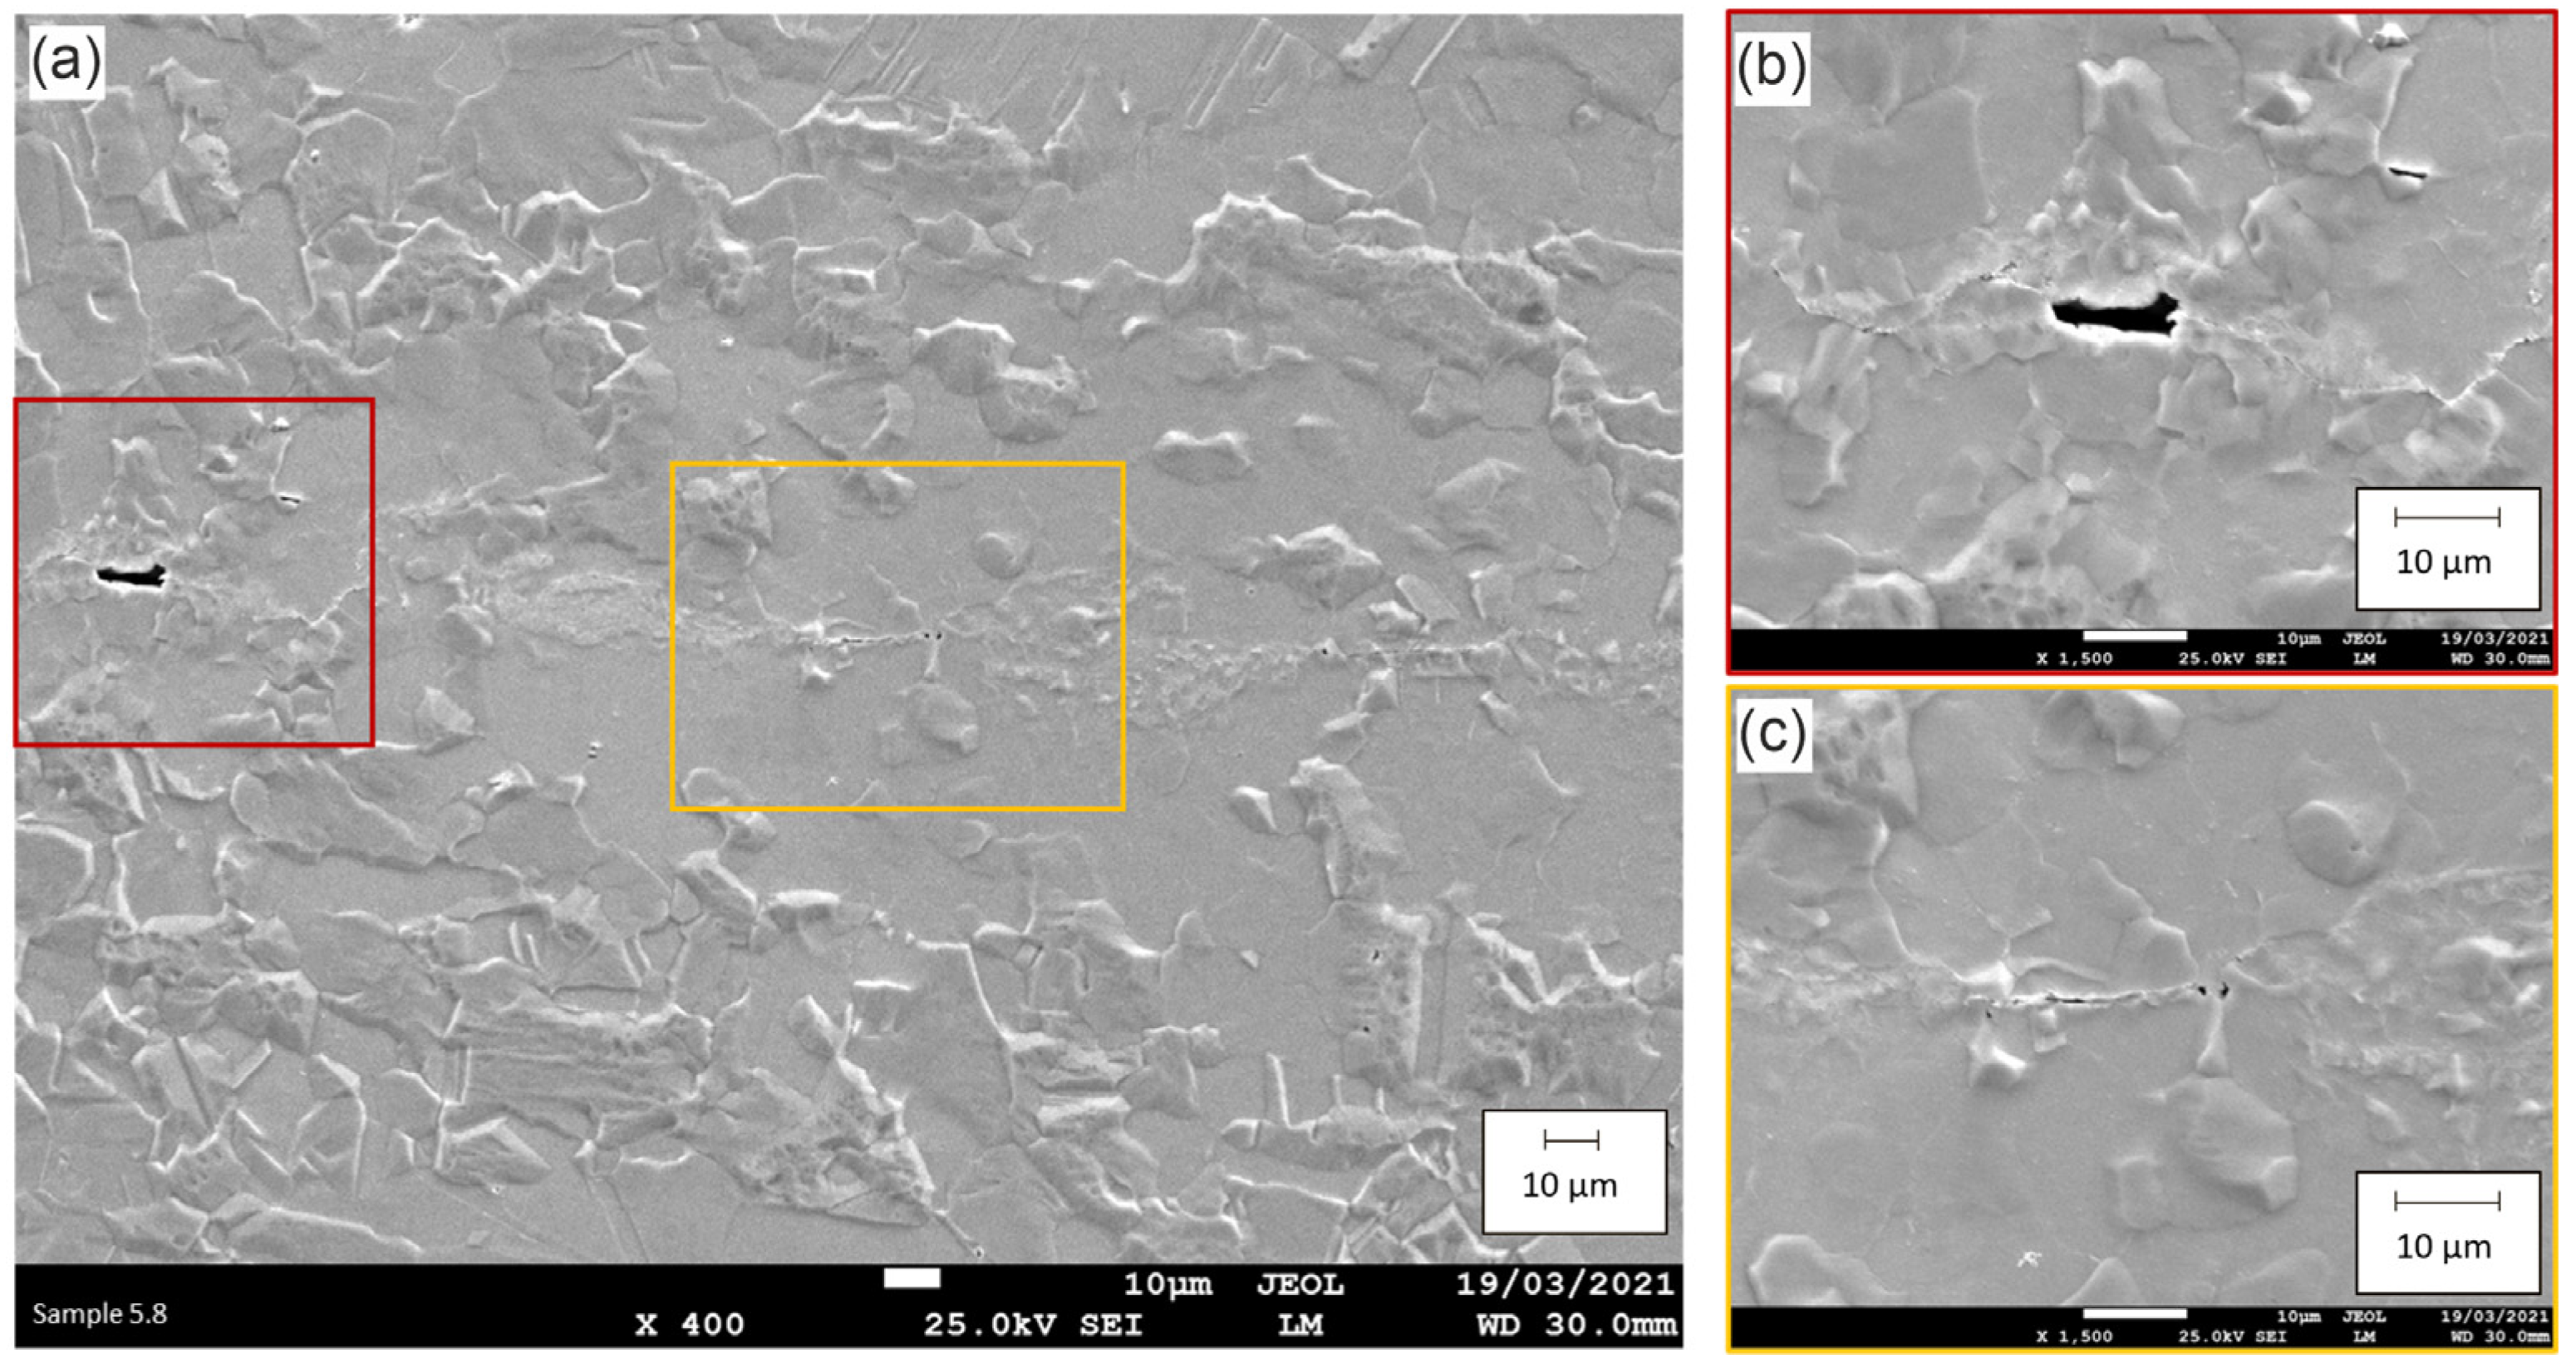
SEM image (
Figure 8a) indicate that these thin locations near the welded area are not weld flaws and the sheet are bonded without defects, despite the absence of mixing between the copper sheets. They probably represent location where diffusion bonding occurred. In this case, the weld length (as the fraction of the weld interface length where the bond has been achieved) can be calculated more easily as the size of the planar weld flaws (black lines) are much easier to determine.
A closer examination of the weld interface revealed the presence of very small porosities at the weld interface.
Figure 8 and
Figure 9 show these porosities at different magnification. The size of these porosities is in the order of few tens of micro-meters. From this SEM evaluation, the weld quality of this ultrasonic weld is very good as only a few very small weld flaws have been detected along the entire weld length.
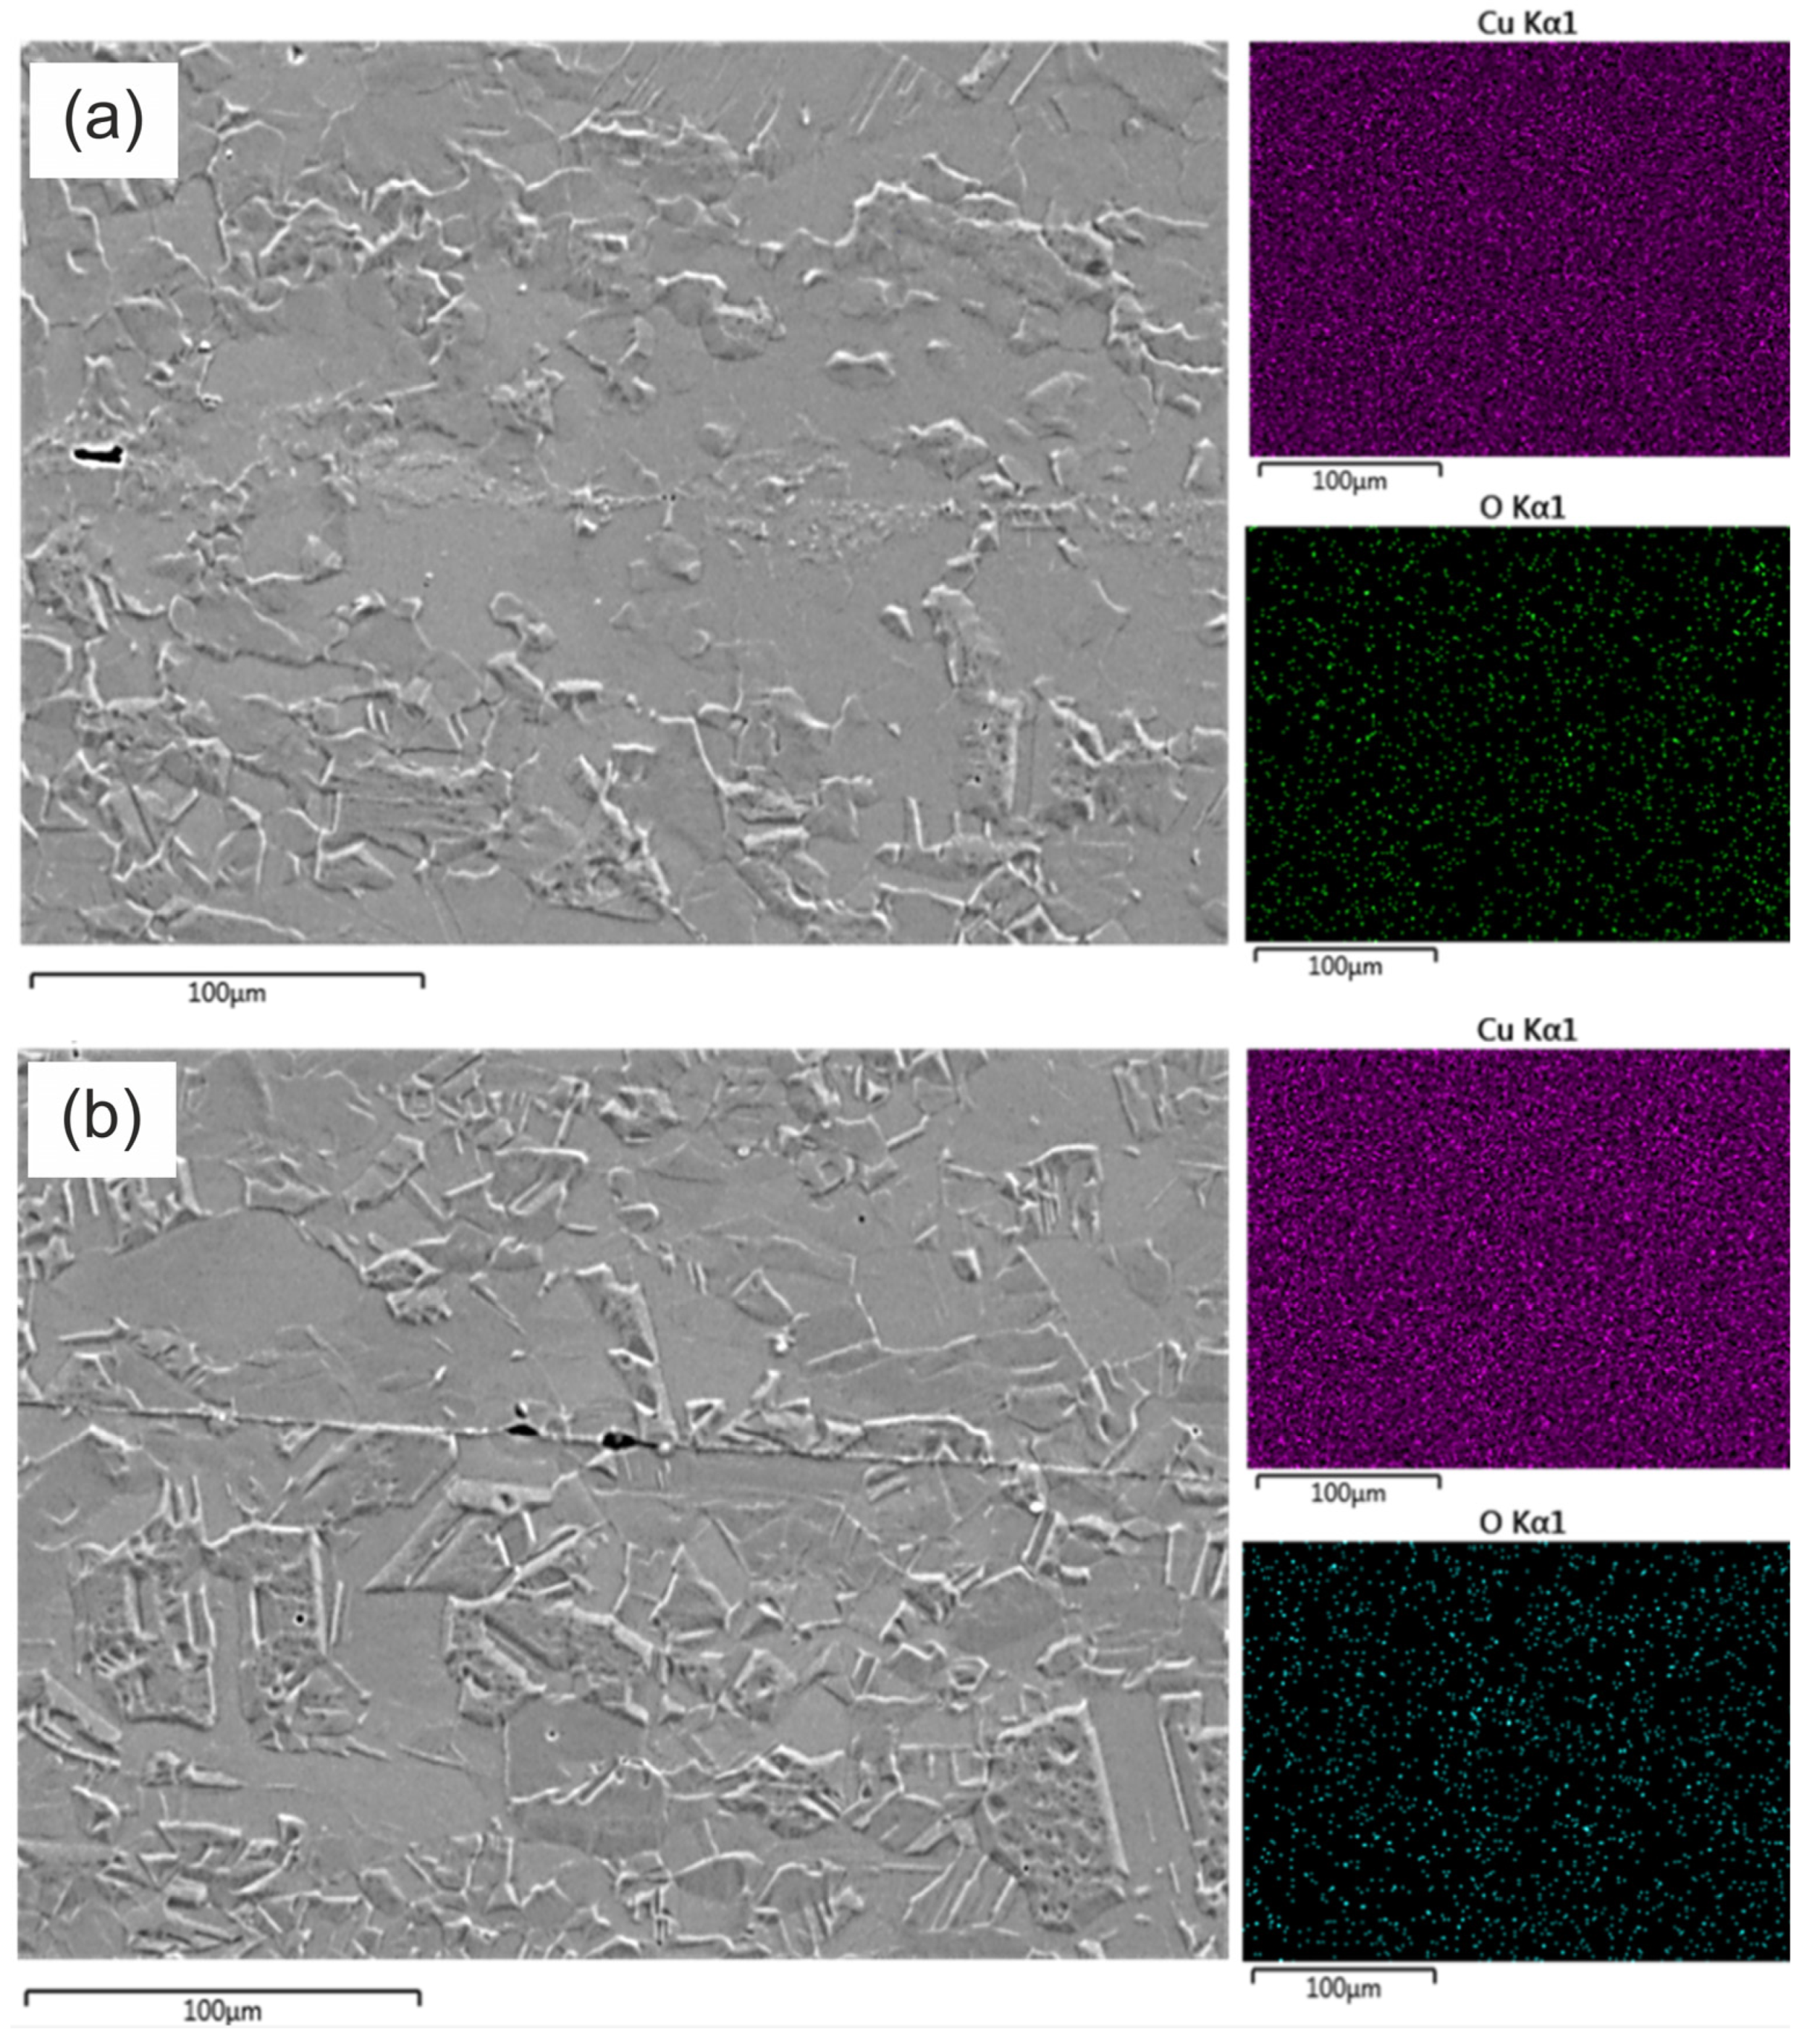
A final investigation of the weld interface has been conducted by using an EDX mapping (
Figure 10). The elemental maps show the presence of only Cu and the absence of a significant amount of oxygen at the weld interface; the oxygen maps, indeed, indicate a very low intensity of oxygen spectrum, and no visible concentration of the element was registered (even in the zones where porosities where detected, see
Figure 10). This points out that the formation of copper oxide layer in the interface between the two mating surfaces was prevented, confirming that there is no gap present in between the welded sheets, and the line that is visible on the etched images is no weld flaw. This line is the location where both sheets are pressed together, and a bond is created.
3.3. Influence of the Welding Parameters on the Welding Energy and Lap Shear Strenght
An important output parameter of the ultrasonic welding process is the energy. This value is generated by the ultrasonic welding equipment after each weld cycle. The energy value obviously differs for each welding condition based on the power absorbed during the welding.
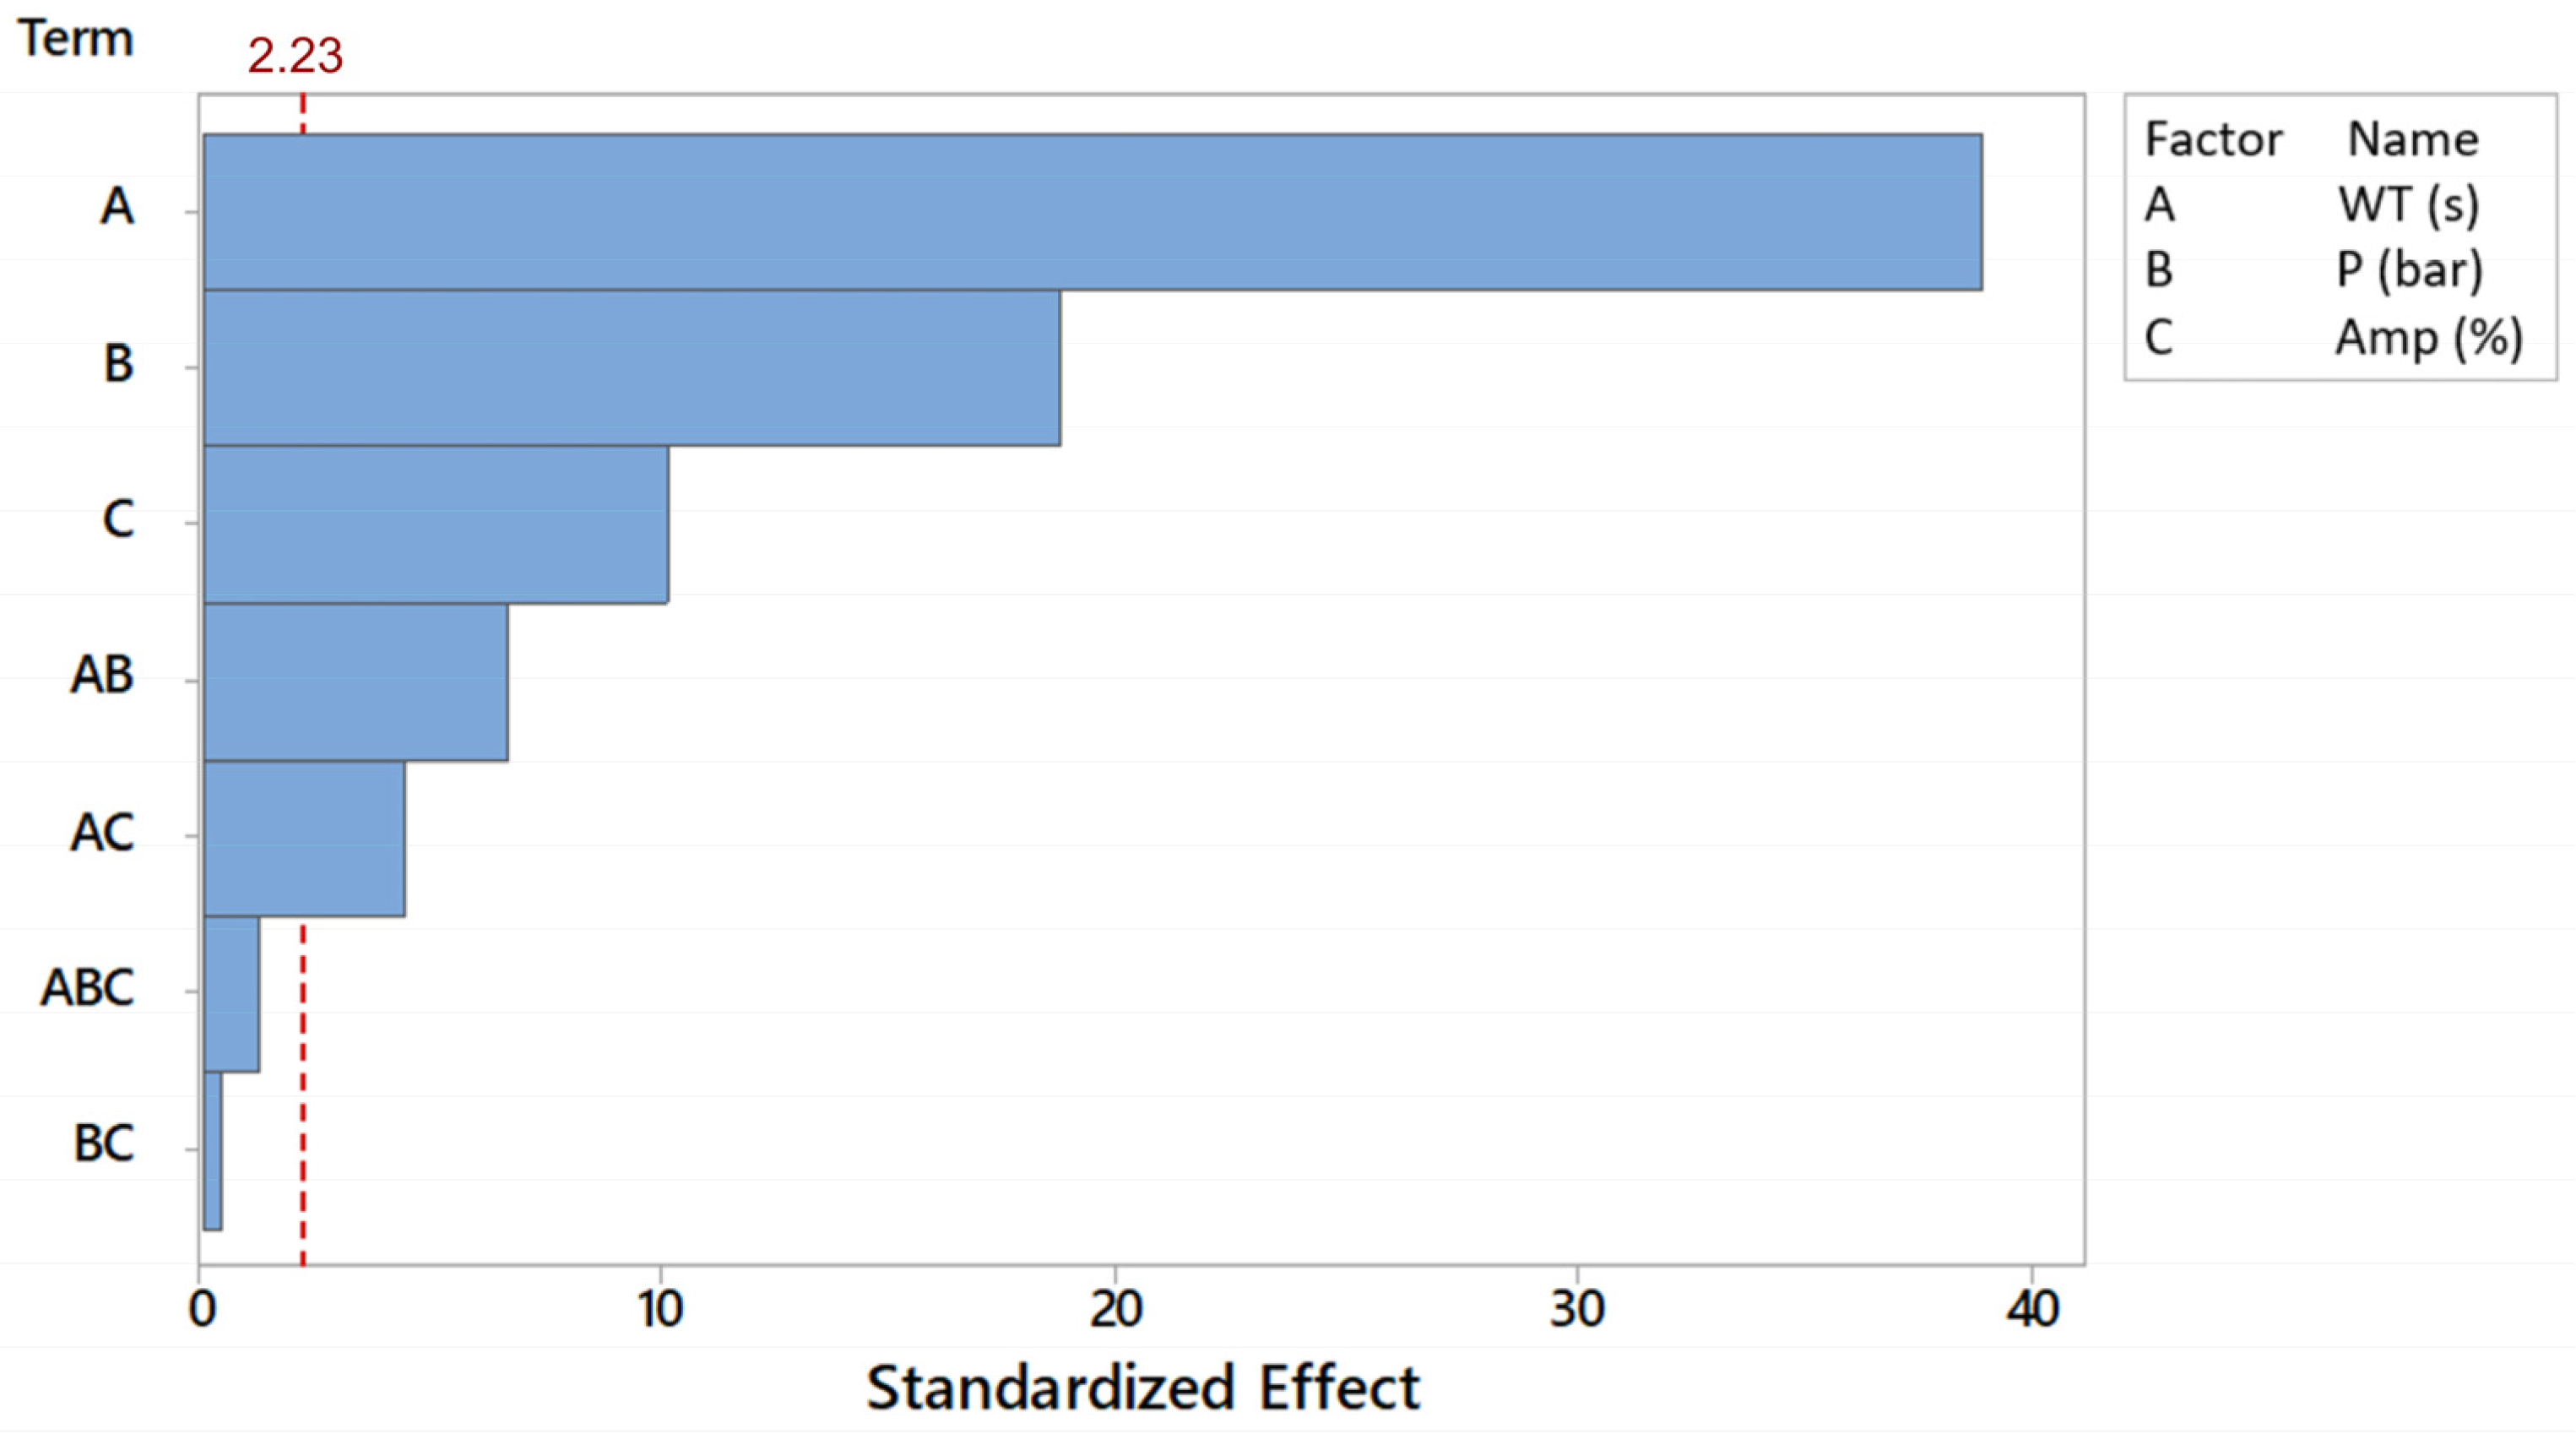
The pareto chart of the standardized effects of all parameters and their interactions is drawn for the average of those four welding energy values of each configuration. In
Figure 11, the pareto chart with the average welding energy as a response is given.
From the energy values acquired during the experimentation and the analysis of variance the variables coefficient were calculated and used to develop the regression model of the welding energy estimated. The equation corresponding to these results is shown in below:
with
E the average energy,
A the welding time,
B the pressure and
C the amplitude. The terms
AB, BC, AC and
ABC indicate the two-factor and the three-factor interaction between parameters. The coefficients are derived from the main effects of the parameters; the coefficient is half of the parameter effect, and its sign indicates the direction of the relationship between the term and the response. This equation shows the relative influence of each welding parameter and the interactions between the parameters on the welding energy. From this analysis it follows that the welding energy is mostly influenced by the welding time, followed by the pressure and vibration amplitude. The interactions between the parameters have less influence. However, the interactions between welding time and pressure (
AB), and between welding time and vibration amplitude (
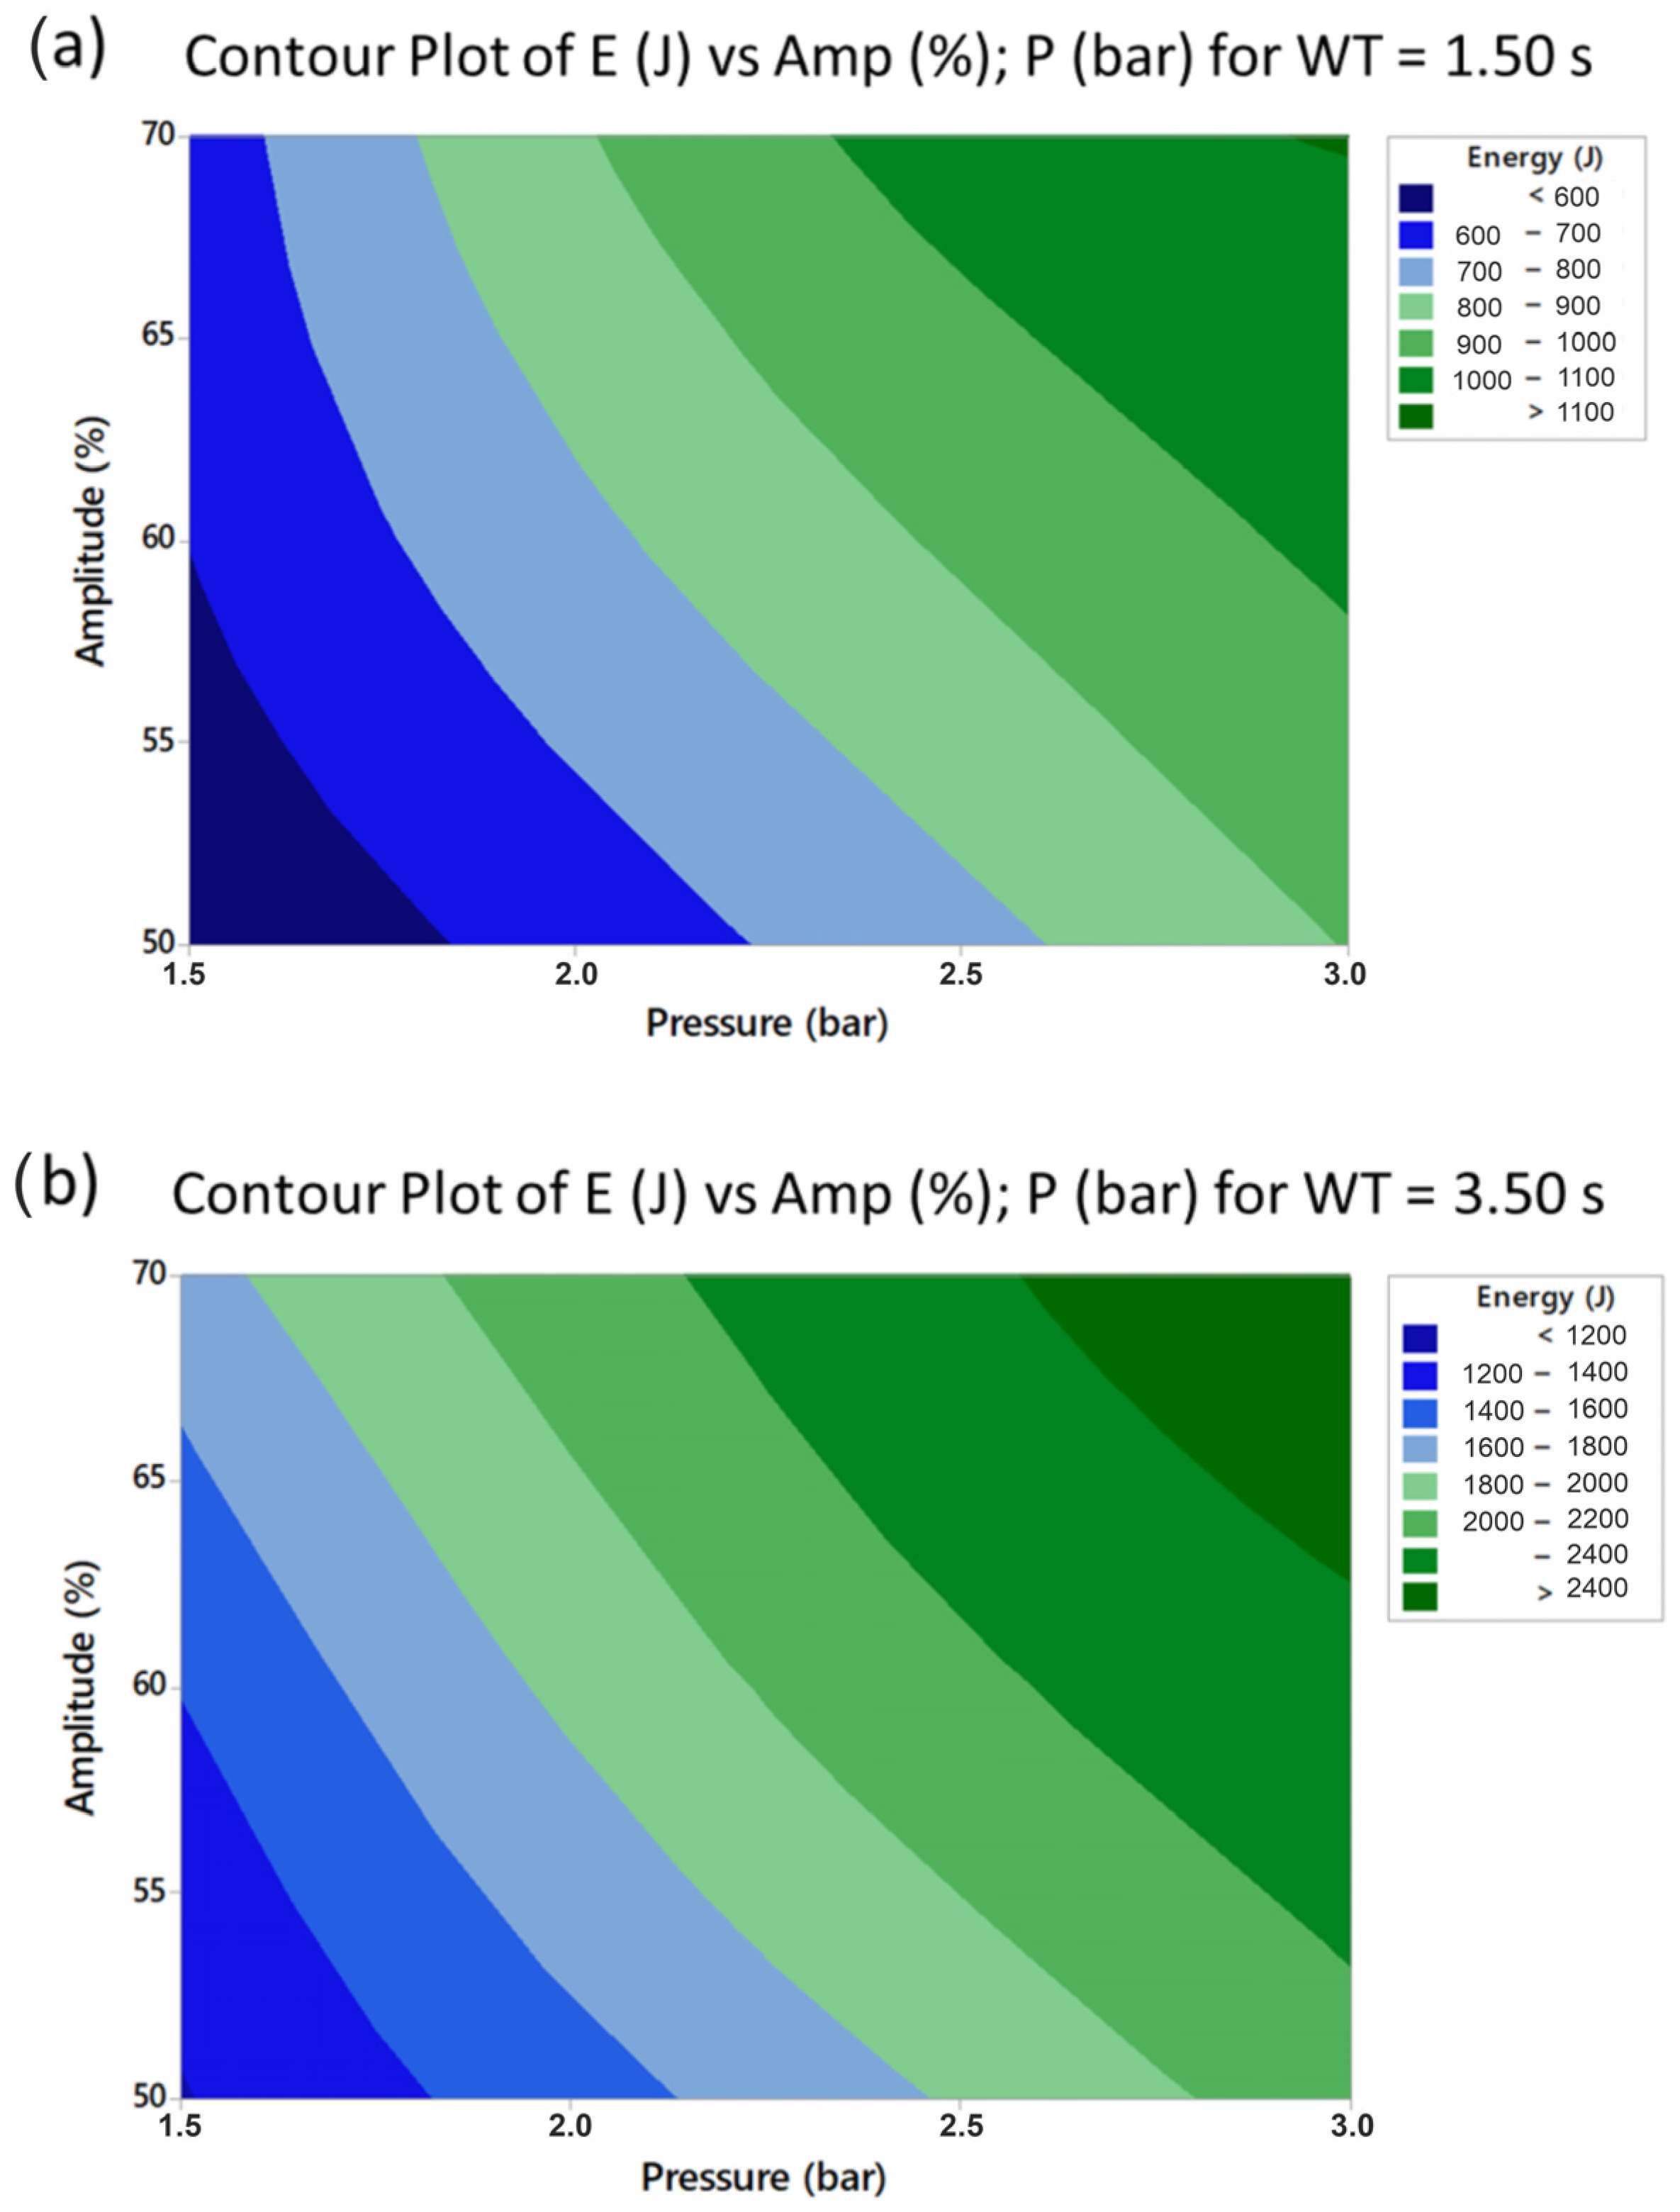
AC) are statistically significant as their value is above the limit of 2.23 (for α = 0.05). Contour plots of the average energy versus the amplitude and pressure for a constant welding time reveal an increase in energy when one of the welding parameters is increased. In
Figure 12, the contour plots are shown for the minimum and maximum value of the welding time. These plots show a maximum energy value in the upper right corner of the contour plot, corresponding to the maximum value of the amplitude and pressure. The relatively straight lines indicate the limited mutual interaction between amplitude and pressure (
BC effect), as also highlighted by the Pareto chart. The energy values increase significantly as the welding time is increased to its maximum value (
Figure 12b).
The lap shear strength represents the second response of the DoE in the present work. Like the welding energy, the process parameters influenced on the lap shear strength of the welds. The lap shear strength is an indicator for the weld quality; a quality weld will fail in the base material before the weld nugget fails. For each welding condition, three replicas were subjected to lap shear testing. During welding with high values of the welding parameters, some deformations of the welded area took place. These plastic deformations are a consequence of the high heat input and pressure during the weld cycle. The application of such conditions can alter the mechanical properties of the material and weld. It is therefore important to keep these deformations in mind when analysing the lap shear strength of the welds.
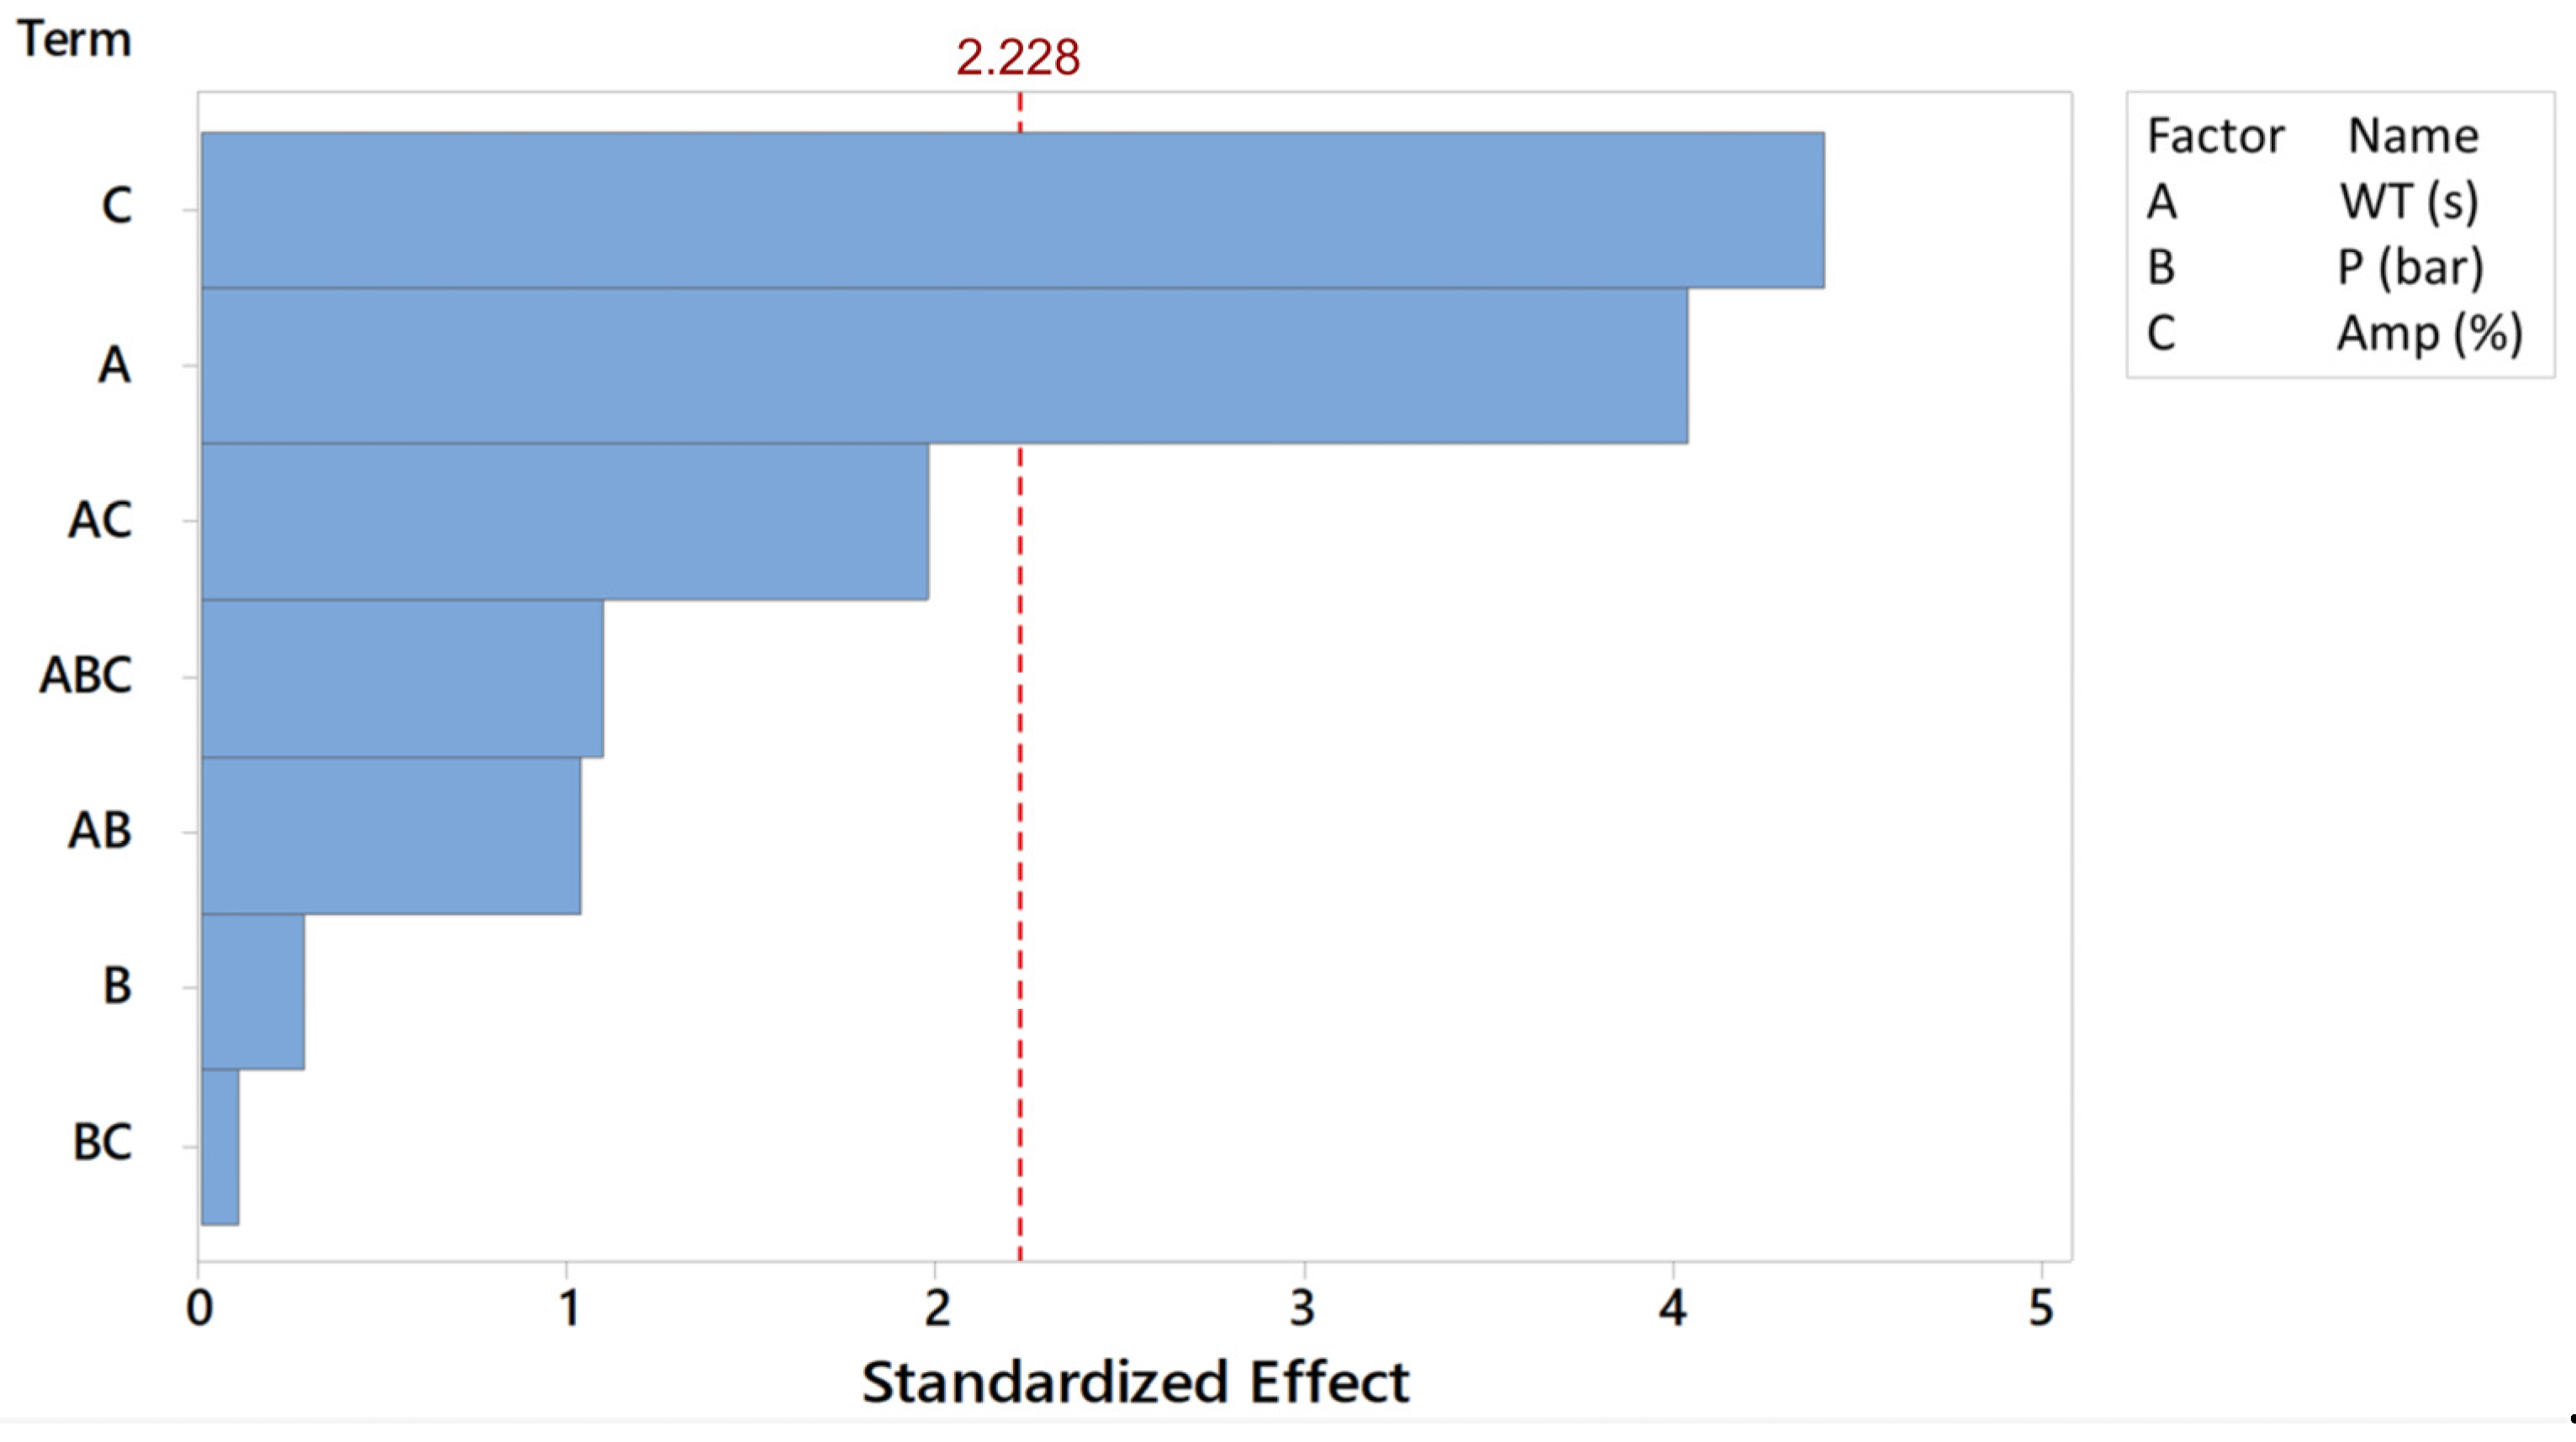
Similar to the analysis of the welding energy, the influence of the welding parameters on the lap shear strength can again be analysed using a pareto chart of the standardized effects of the parameters on the average lap shear strength. The chart is shown in
Figure 13.
The corresponding factor coefficients and the regression equation are reported below:
with
S the lap shear strength,
A the welding time,
B the pressure and
C the vibration amplitude. By comparing the standardized effects of the two process responses it is possible to observe that the effects of the parameters on the lap shear strength are smaller than on the welding energy. In addition, differently from the welding energy, the amplitude registered the highest effect on the shear strength followed by the welding time. These are the only parameters having a statistically significant effect. An increase in pressure does not have a remarkable influence on the strength of these welds. In addition, the factors interactions are below the significance level. In the following results, instead of using the actual lap shear strength values, the weld quality is represented as a percentage of the lap shear strength on that of the base material.
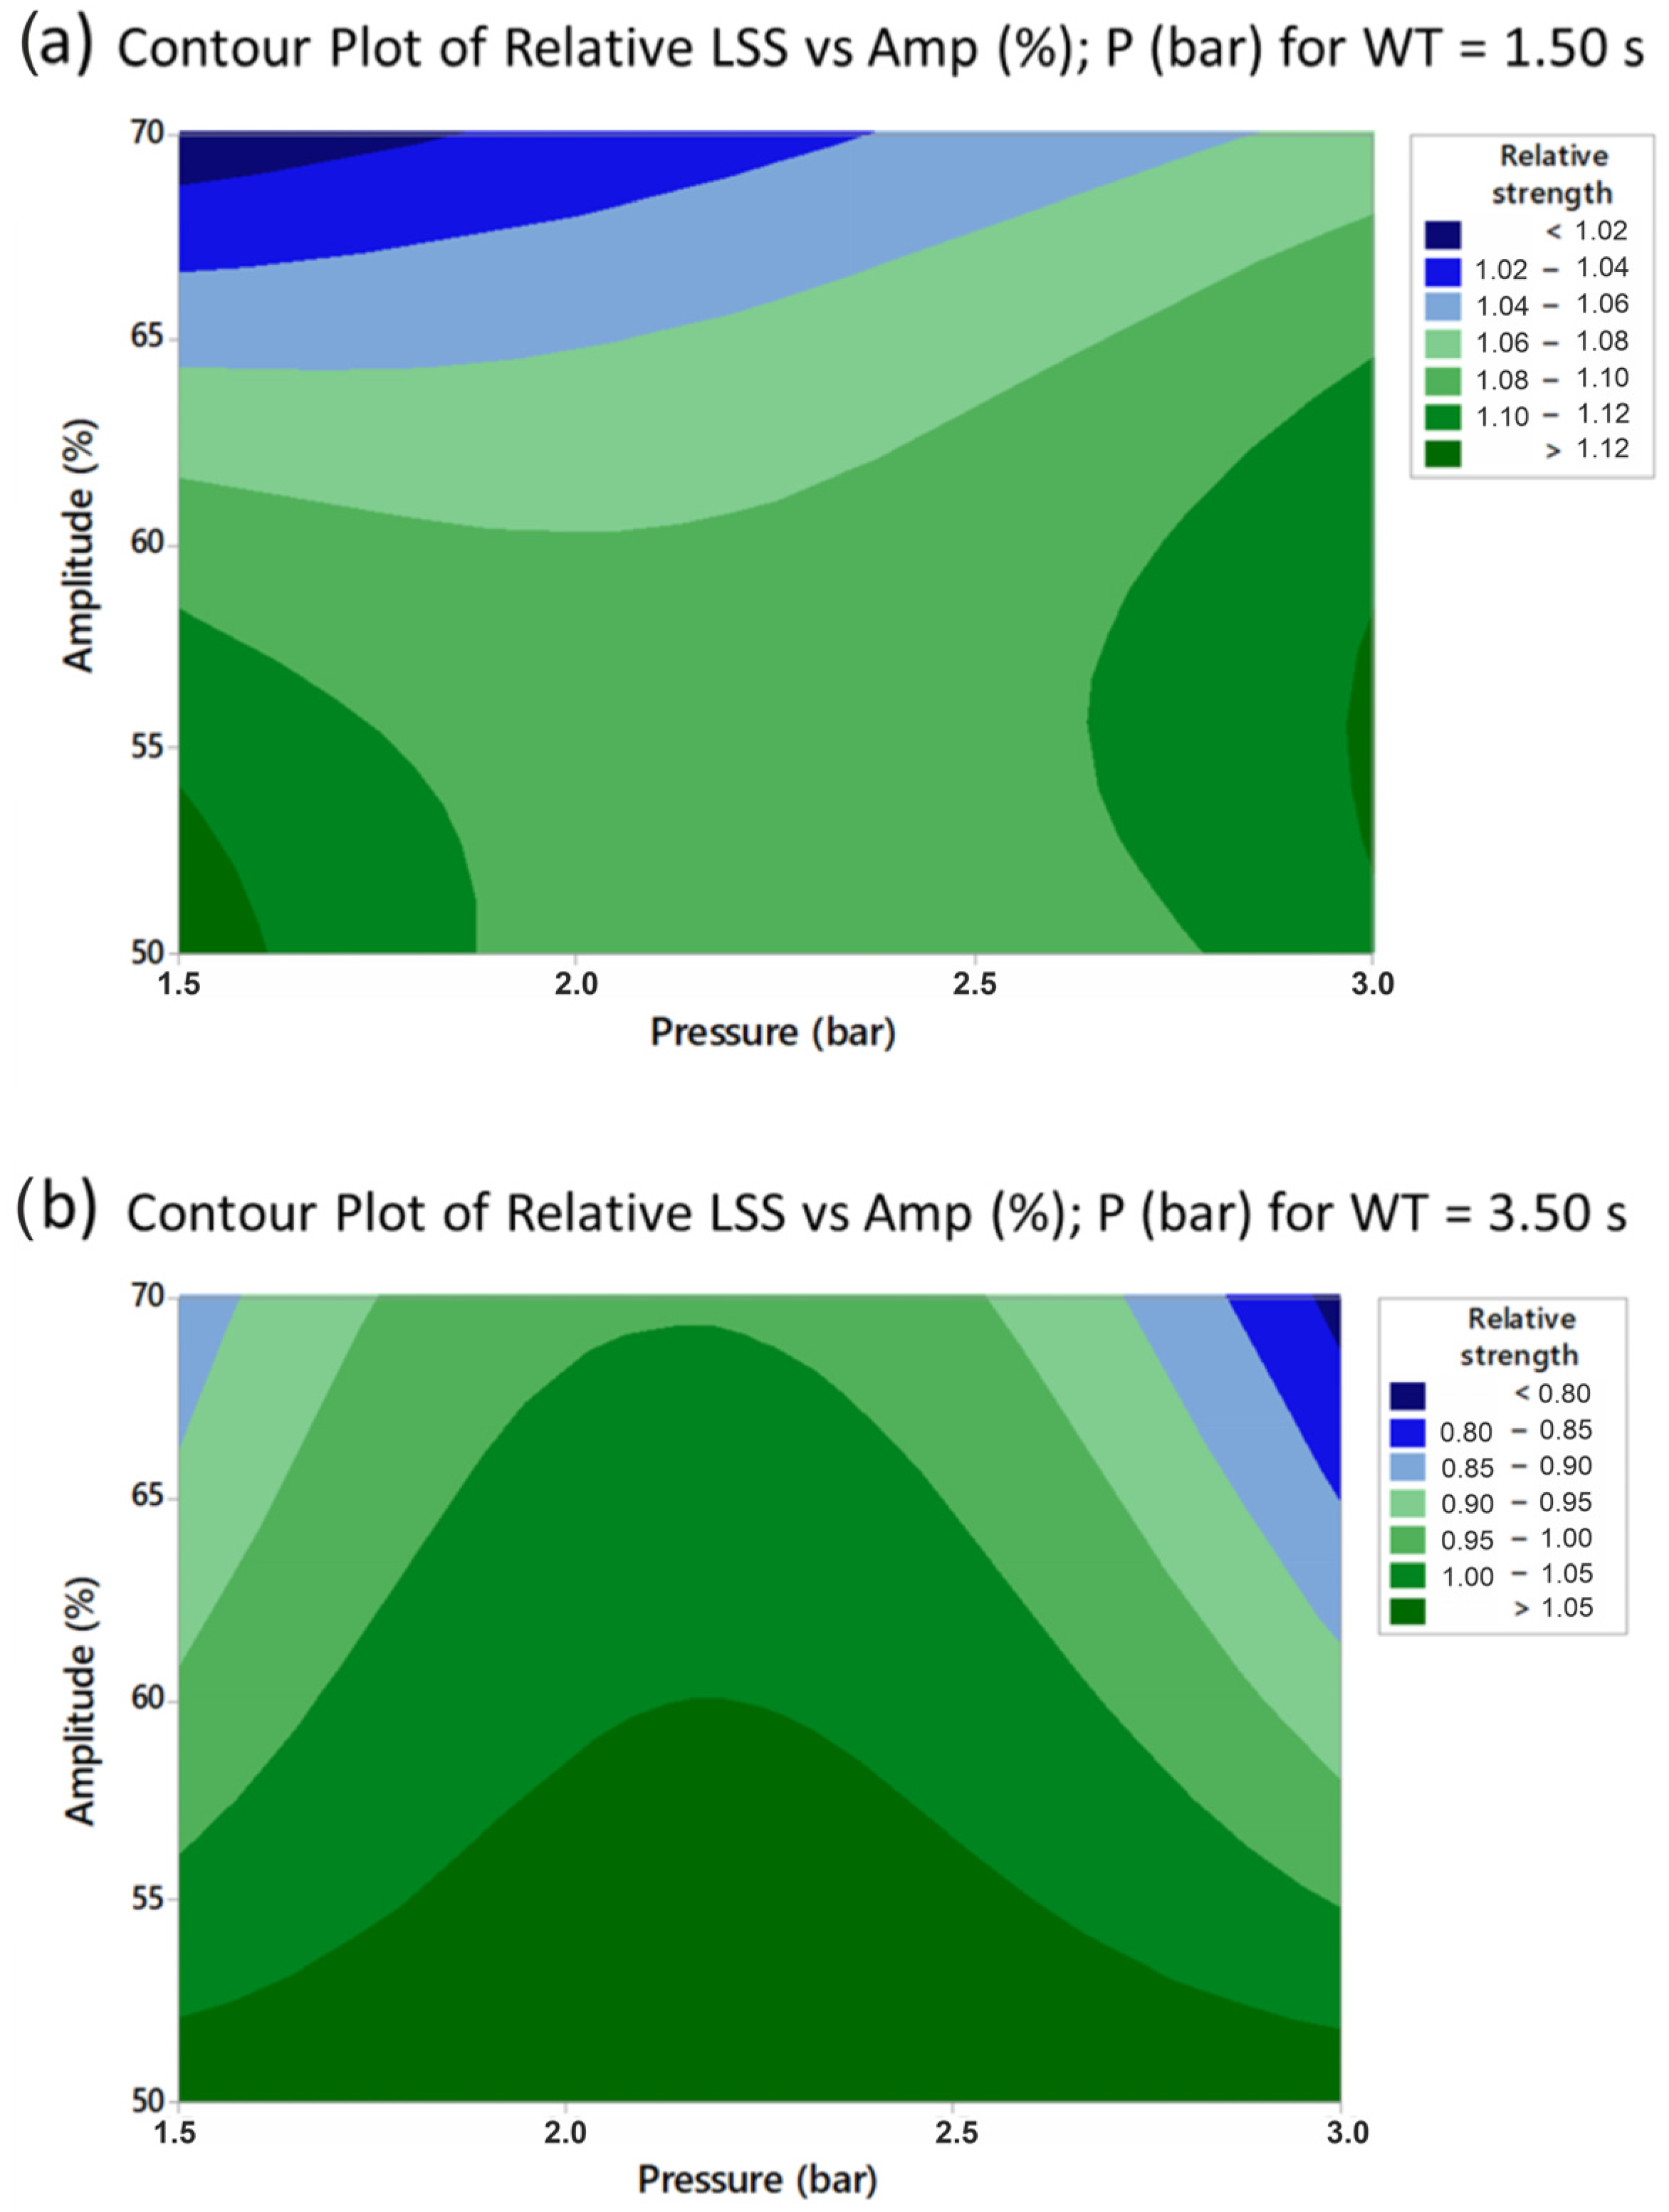
The relation between the welding parameters and the lap shear strength can be visualised using contour plots (see
Figure 14). These plots show the relative lap shear strength as a function of the pressure and vibration amplitude for a constant value of the welding time.
Figure 14 shows that a low vibration amplitude, below the 60% of the maximum rated amplitude, results in stronger welds. The higher relevance of this parameter is highlighted by the sharp variation in the shear strength moving along the vertical axis at fixed pressure. It is worth noting that increasing the welding time, the maximum values of strength reduced (the weld/base material strength ratio changed from 1.12 to 1.05) and the shape of the contour lines changed as well, identifying different regions where high strength can be achieved. This behaviour points out that the welding time has influence on the weld strength not only per se, but also through its interaction with amplitude and pressure (
AB and
AC effects, respectively, in
Figure 13). A low value for the vibration amplitude results in a higher strength. It can be observed in both shortest and longest welds. This can be explained by the higher heat input at higher vibration amplitude. This heat is the result of the increased frictional heat generation at high vibration amplitude and will cause a decrease of the strength of the workpieces. A short welding time will require a high pressure to obtain a strong weld, while for a longer welding time a lower pressure can already result in a sufficiently strong weld. For the latter condition, a high pressure can still be efficiently adopted, but lowest levels of amplitude must be chosen to balance the heat generation.
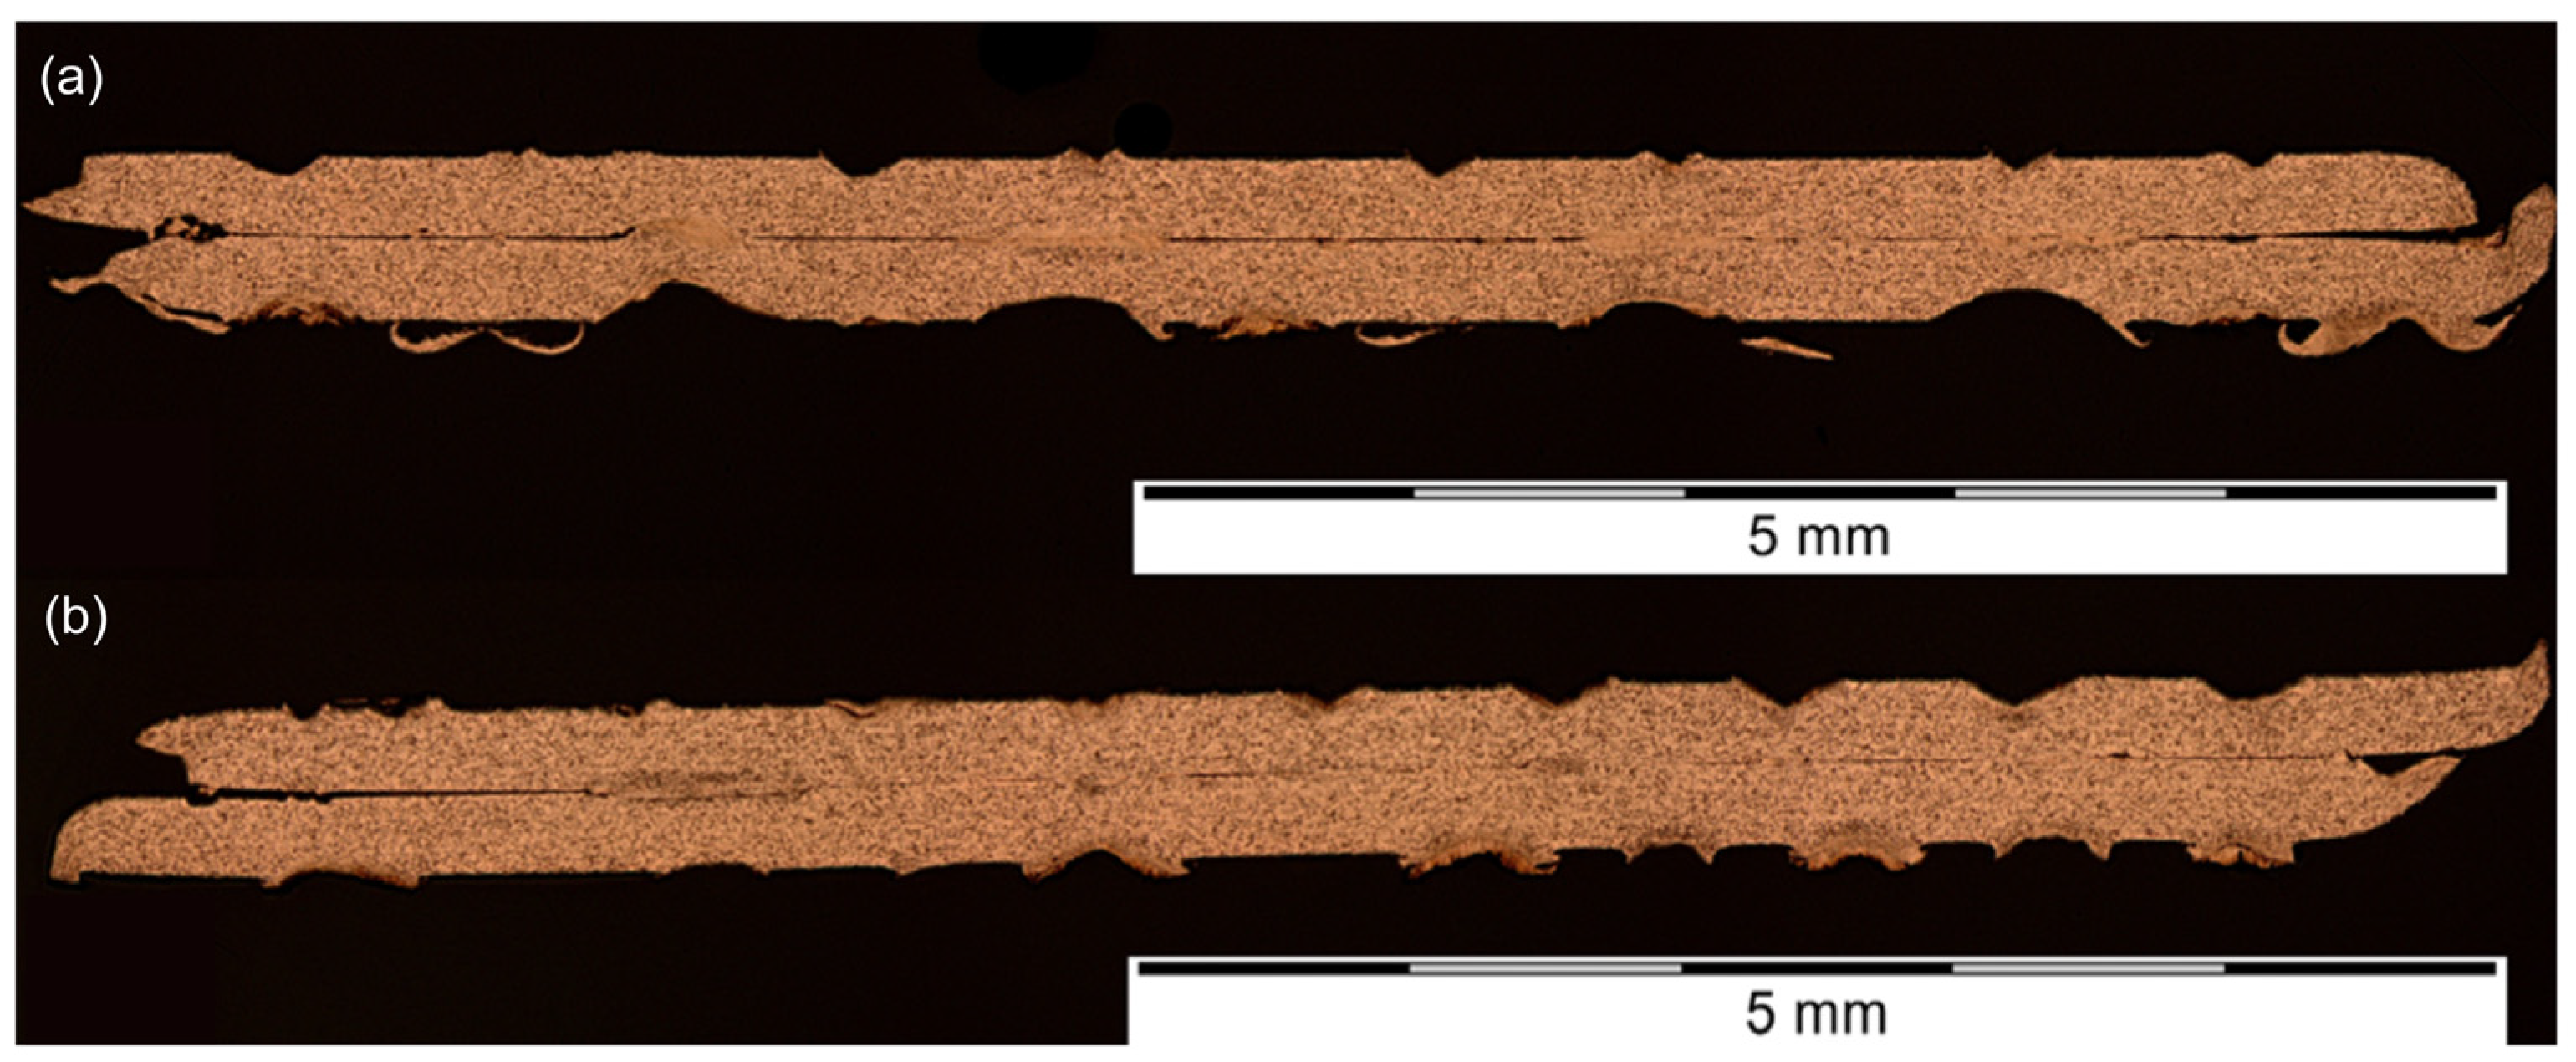
The analysis of the cross-section of samples (
Figure 13,
Figure 14 and
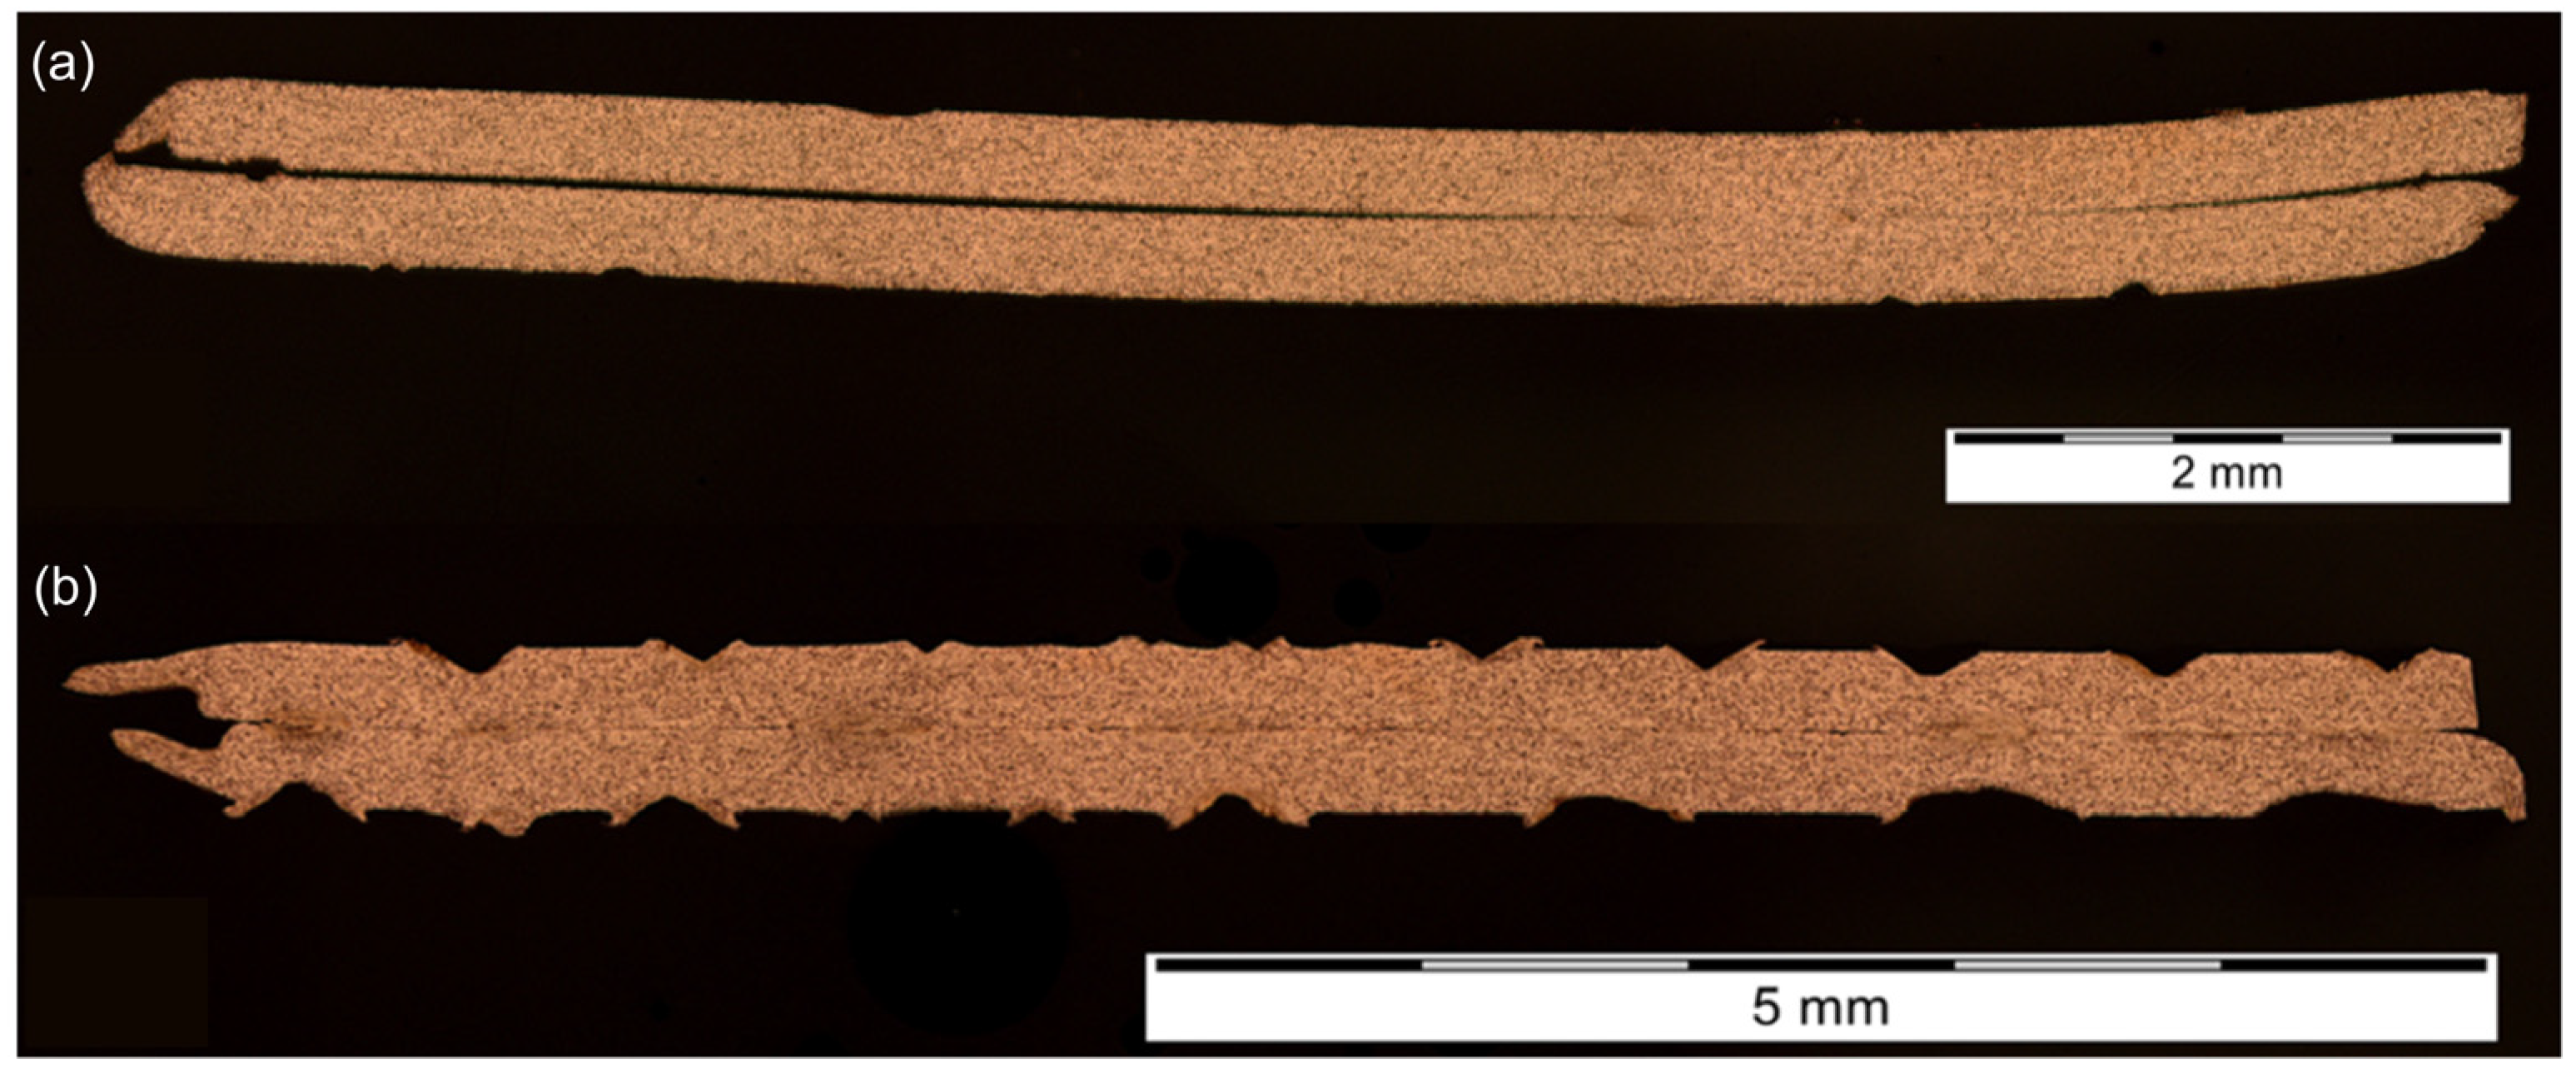
Figure 15) allows to better understand the influence of the welding variables on the effective weld length, which is connected to the strength of the joint. Increasing only the welding time, while the other parameters are kept constant, resulted in a slight increase of the welded area; the size of welded islands have grown, however, the amount of unwelded zones has not significantly decreased. The energy input of the sample shown in
Figure 15a is less than half of that shown in
Figure 15b, according to the shorter weld. However, the strength and the size of the welded area do not differ significantly. It points out that the shear strength is determined not only by the fraction of welded area at the weld interface, but also the local phenomena, such thinning of the cross section, material softening, etc.
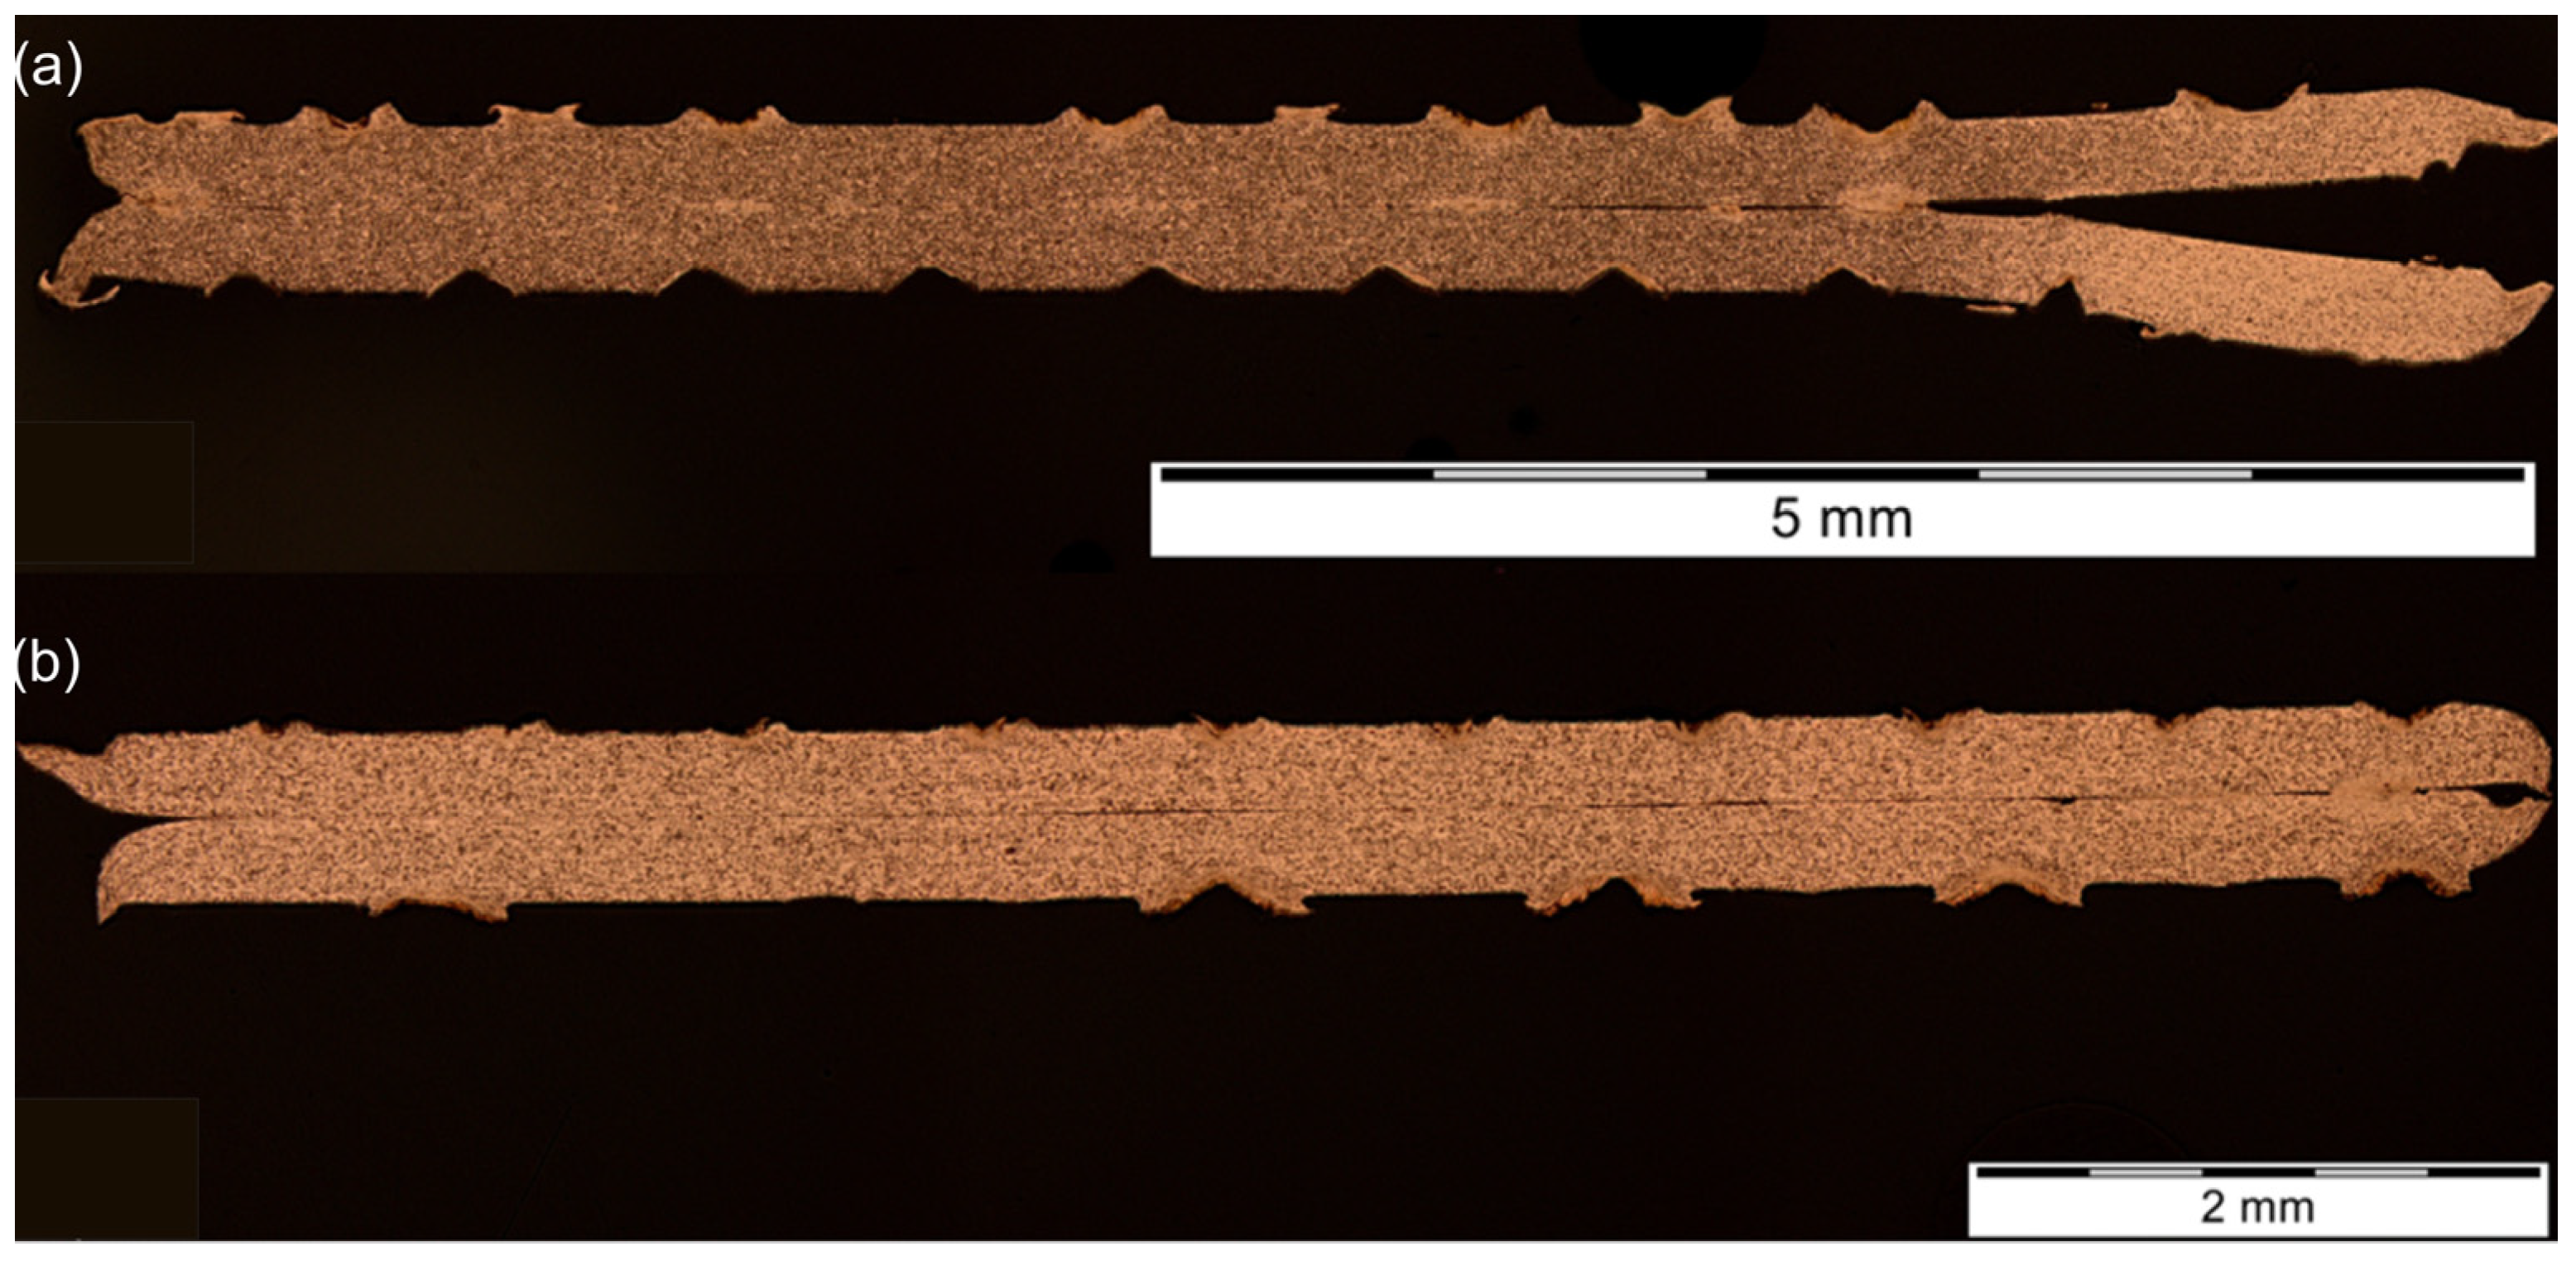
An increase of the pressure is expected to lead to significant increase in the welded area especially in shorter welds (see
Figure 14a); a higher pressure, indeed, creates suitable conditions for welded islands to form and grow (
Figure 16a shows a weld with barely connected sheets and only a small welded area, while
Figure 16b shows a weld interface consisting of many welded islands with small gaps in between). The relative strengths of both welds are, however, equal to 1; the amount of welded area does not change significantly, the welded islands are bigger but in between thin gaps are still present, which can trigger the failure of the joint under shear load. The impression of the sonotrode on the external side of the upper sheet is much deeper for a higher pressure, accommodating the higher closing force, despite the surface quality is still acceptable.
Finally,
Figure 17 shows welds with increasing amplitude, at fixed welding time and pressure. The amplitude seems to have reduced effect on the number of welded islands and their size. However, the length of the gaps between the sheets receded, having a potential beneficial effect on the weld strength. The amplitude, indeed, affects the amount of plastic deformation at the interface which increases with the increasing amplitude. However, too high amplitude can lead to larger deformation and thus have a negative effect on the weld strength (as observed in the contour plots at
Figure 14). The sonotrode impression, also, did not changed significantly and no clear deformations of the weld nugget have occurred.
3.4. Relation Welding Energy—Lap Shear Strength
The welding parameters proved to have a big influence on the energy input that is delivered to the weld and on the formation of an effective bond interface, which in turn is directly correlated to the strength of the joints. Therefore, a correlation is established between these two responses. The lap shear strength of the joints is expected to increase with increasing welding energy and depends on the development of plastic deformation at the weld interface [
27,
28]. The plastic deformation of the surfaces enhances the amount of interfacial friction and eventually results in a larger welding area. However, with a large welding energy, a large amount of heat is introduced in the weld, causing a softening of the material and, as a result, a thinning of the sheets or even the formation of cracks around the weld nugget. These phenomena will influence the strength of the weld. The maximal weld strength can be expected at an optimized value of the input energy, where enough energy is provided to create a weld, but not too much energy so that the weld strength is compromised by crack formation or extensive thinning of the sheets.
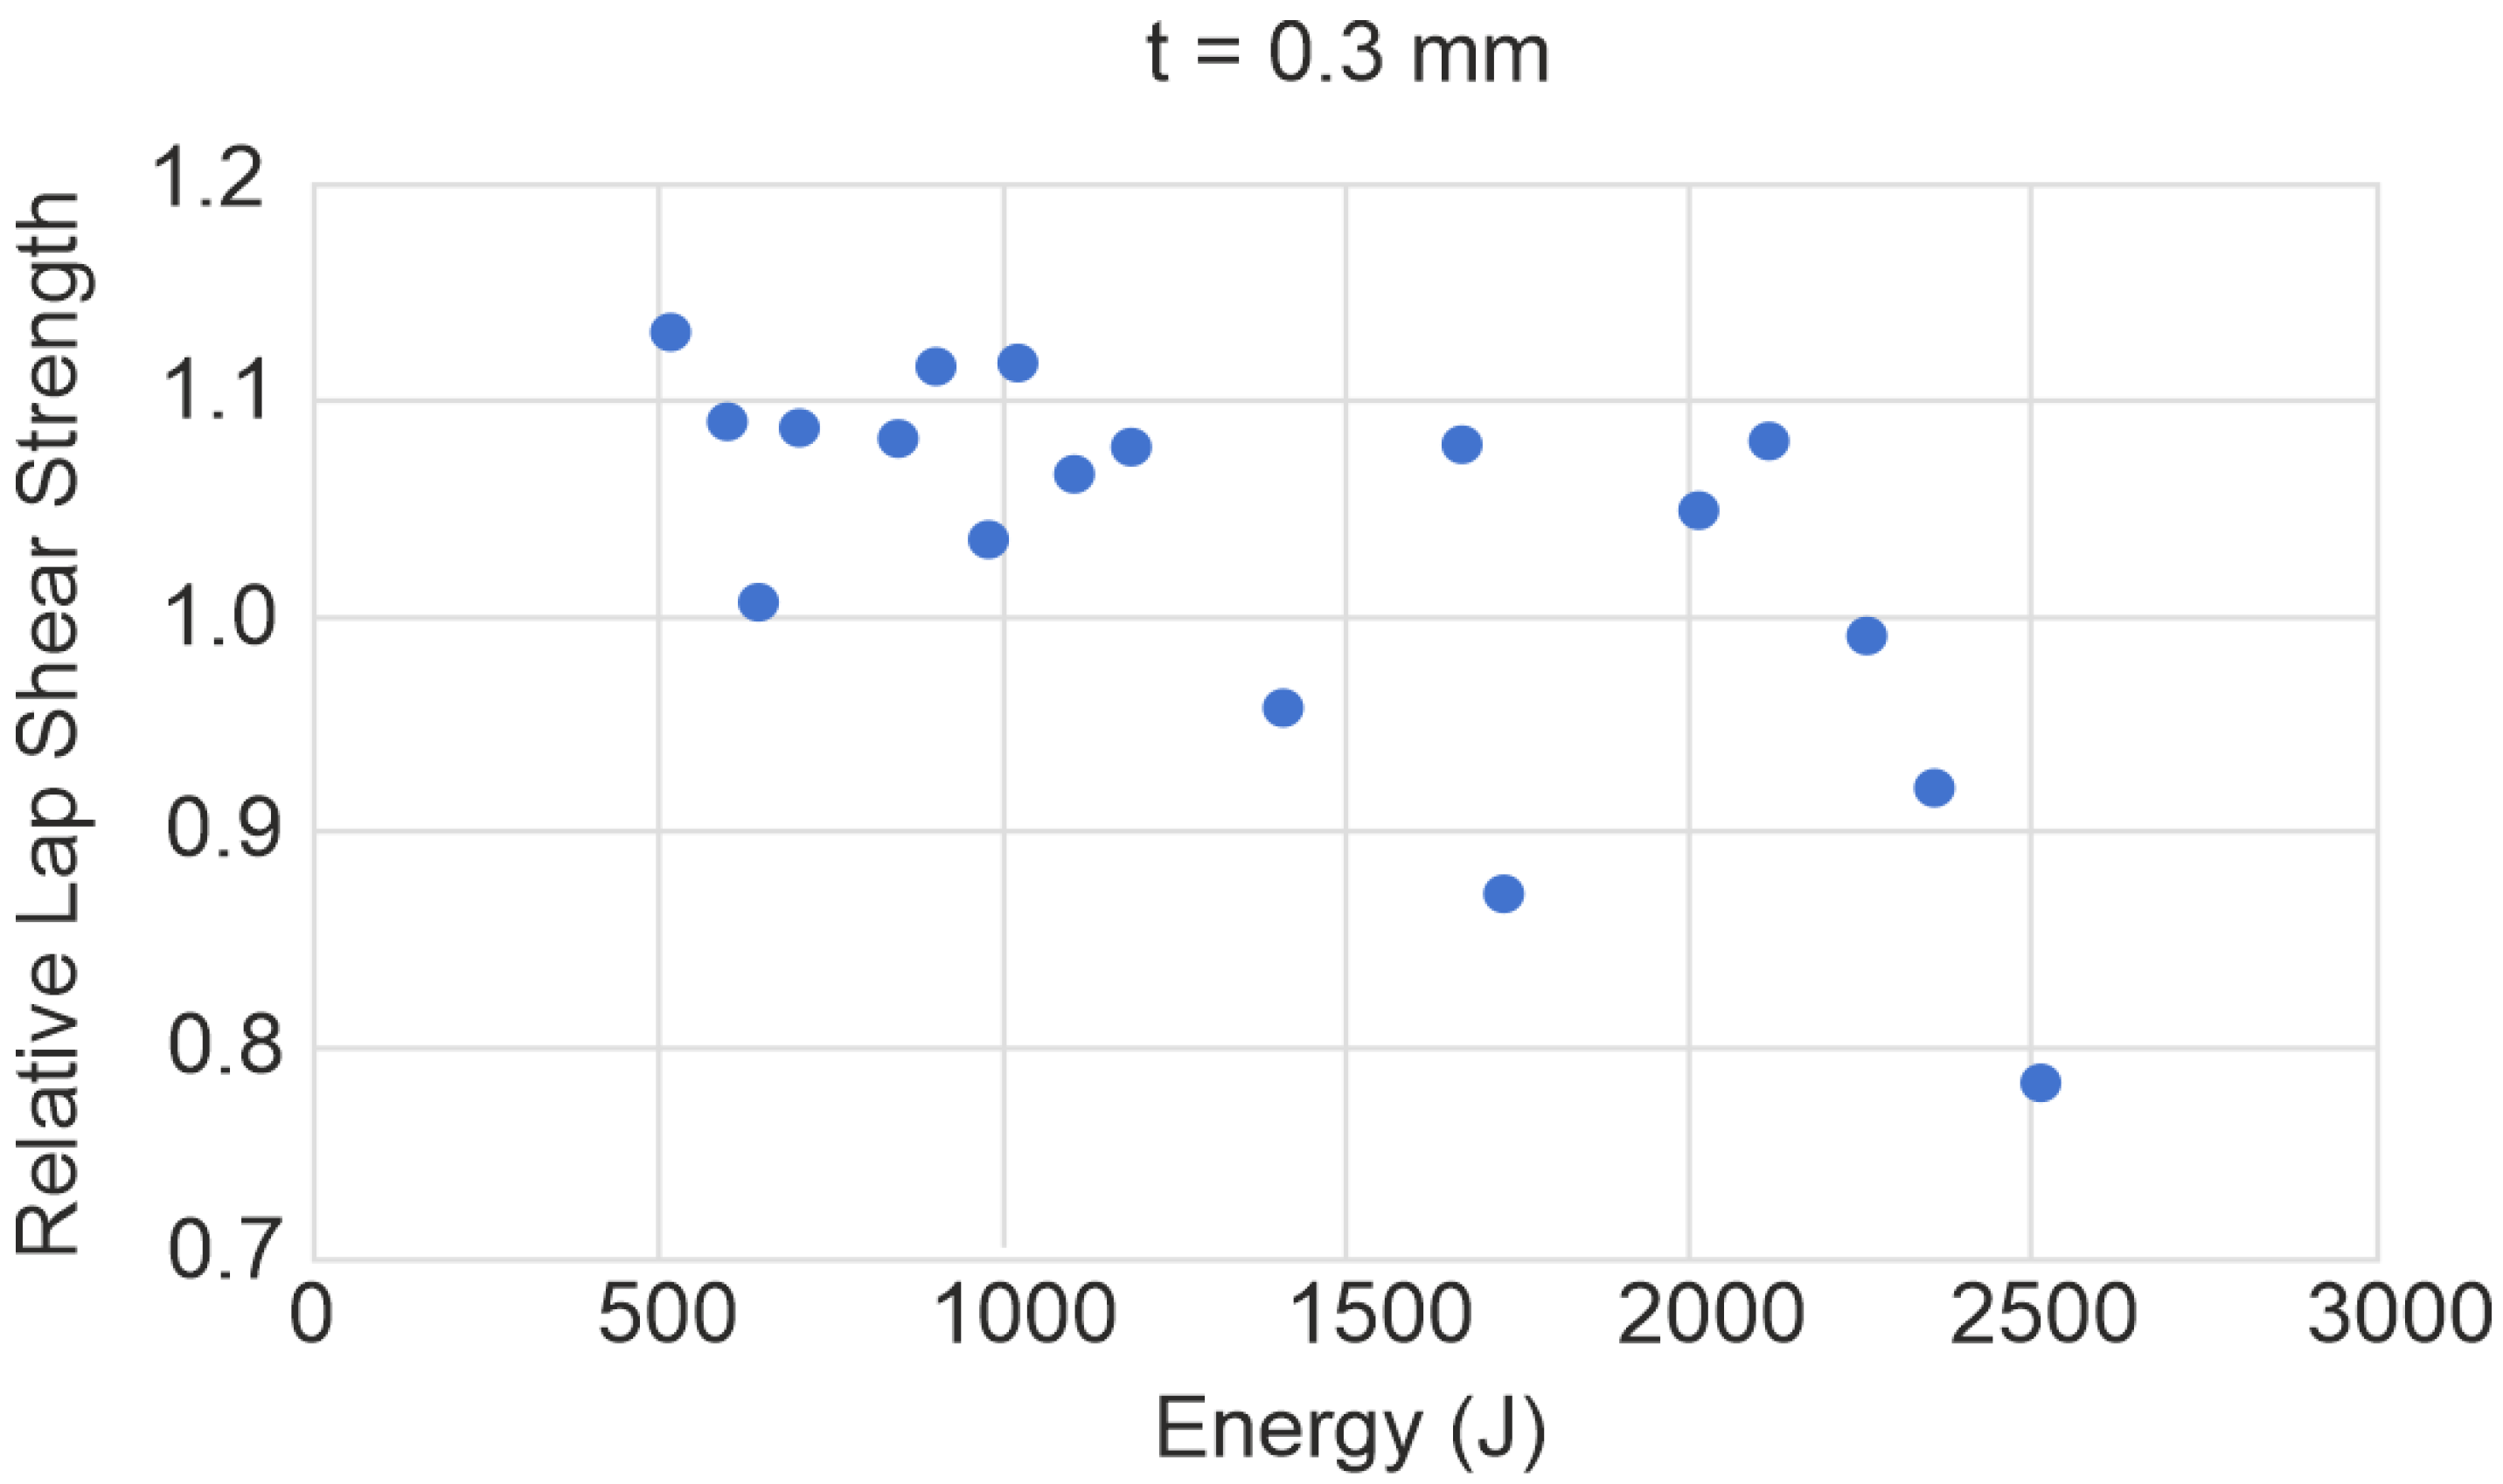
These hypotheses are confirmed by the plot of the average energy versus the joint lap shear/base material strength ratio, reported in
Figure 18, which indicates that the weld strength decreases significantly for high values of the welding energy (above 1500 J).
The majority of the welds has a weld strength higher than the base material strength. However, some of the welded specimens have a weld strength that is lower than the base material strength. Because, during the tensile tests, all samples failed in the copper base material it is possible to argue that the material properties of the base material have decreased for these samples after the joining process. At higher energy levels, indeed, correspond an increased amount of heat input. This high amount of heat will alter the mechanical properties and result in a decrease of hardness and strength. This was observed in [
29]: it was found that the joint strength correlates with the temperature developed at the interface.
Obviously, the longer the duration of the welding process the higher is the energy dissipated by the USW equipment. Therefore, an optimal value of the welding time needs to be found for which a maximal amount of welded area can be reached. At the same time, the value of the welding time must be long enough to create a weld, but not too long to avoid that the weld quality decreases again. Moreover, an increase in energy can be the result of an increased welding pressure. A high pressure will result in thinning of the copper sheets and can change the mechanical properties of the material as well. As excepted, vibration amplitude has a direct effect on the welding energy (despite the interaction with time and pressure cannot be neglected); the increase in the entity of the relative motion between the faying surfaces inevitably lead to a higher heat generation at the weld interface, translating into the higher absorbed energy. However, the influence on the shear strength is not consistent, and the way the LSS varies with the amplitude is affected by the values of the other parameters. Overall, there is quite some scatter in the graphs, showing no clear relation between the energy and the lap shear strength. This proves that in order to achieve the maximal weld strength, an optimization of the welding parameters is necessary each time the welding conditions or weld configuration are altered.
These observations prove that an increase of any of the parameters, corresponding with an increase of the welding energy, will generally result in a larger size of the welded area. The welded islands are most often located just below the indentation of the sonotrode, as also stated in [
29]. These are the locations of maximum plastic deformation due to larger stress concentrations. The effects of an increase of each of the parameters on the weld interface are summarized in
Table 4.


 ,
, 


