
Effect of Near-Dry WEDM Process Variables through Taguchi-Based-GRA Approach on Performance Measures of Nitinol

Abstract
:1. Introduction
2. Materials and Methods
2.1. Experimental Plan and Design of Experiments
2.2. Performance Measures
2.3. Grey Relational Analysis
3. Results
3.1. Statistical Significance
3.2. Effect of Near-Dry WEDM Variables on Output Measures
3.3. Grey Relational Analysis
- 1.
- Determination of S/N ratio
- 2.
- Normalization
- 3.
- Deviation
- 4.
- Grey Relational Coefficient (GRC)
- 5.
- Grey Relational Grade (GRG)
3.4. Confirmation Trial
3.5. Machined Surface Morphology
4. Conclusions
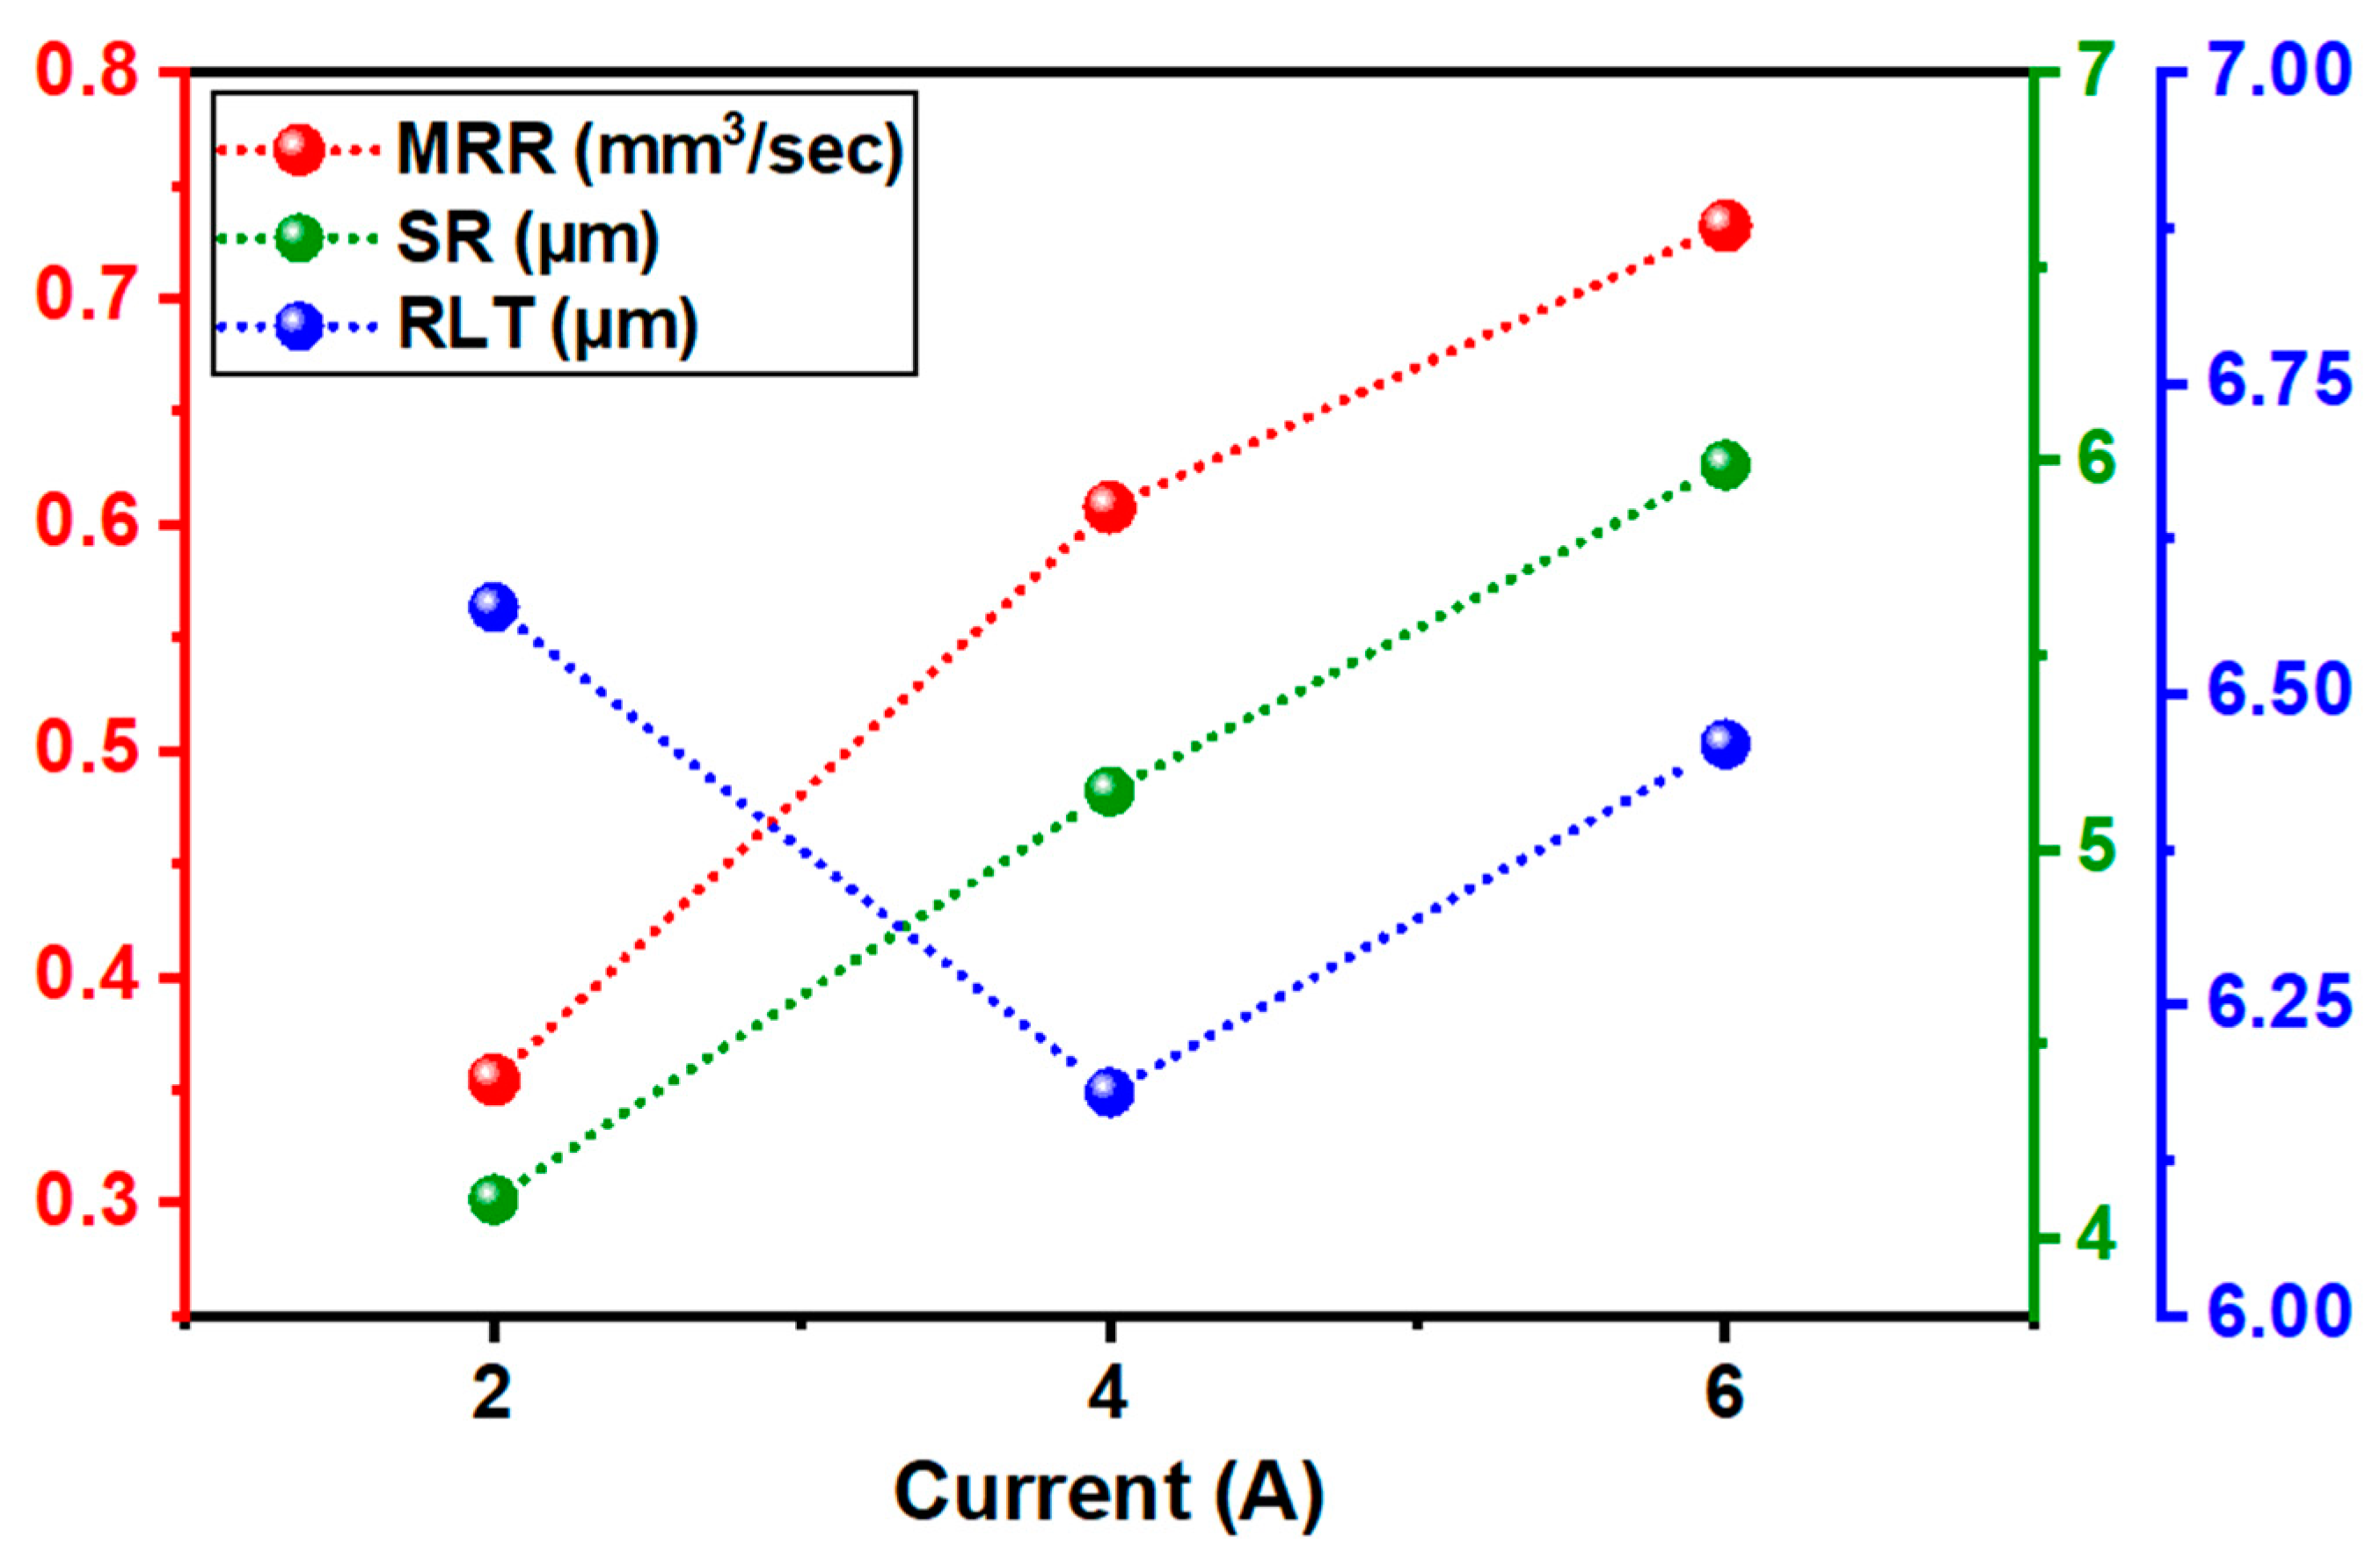
- The statistical significance of input factors through ANOVA techniques has shown that all the output measures have a significant influence on the generated regression terms. For single output measures, higher-F/lower-P numbers have identified that current was having a substantial effect on both MRR and SR, while, Toff was the largest contributor in the case of RLT.
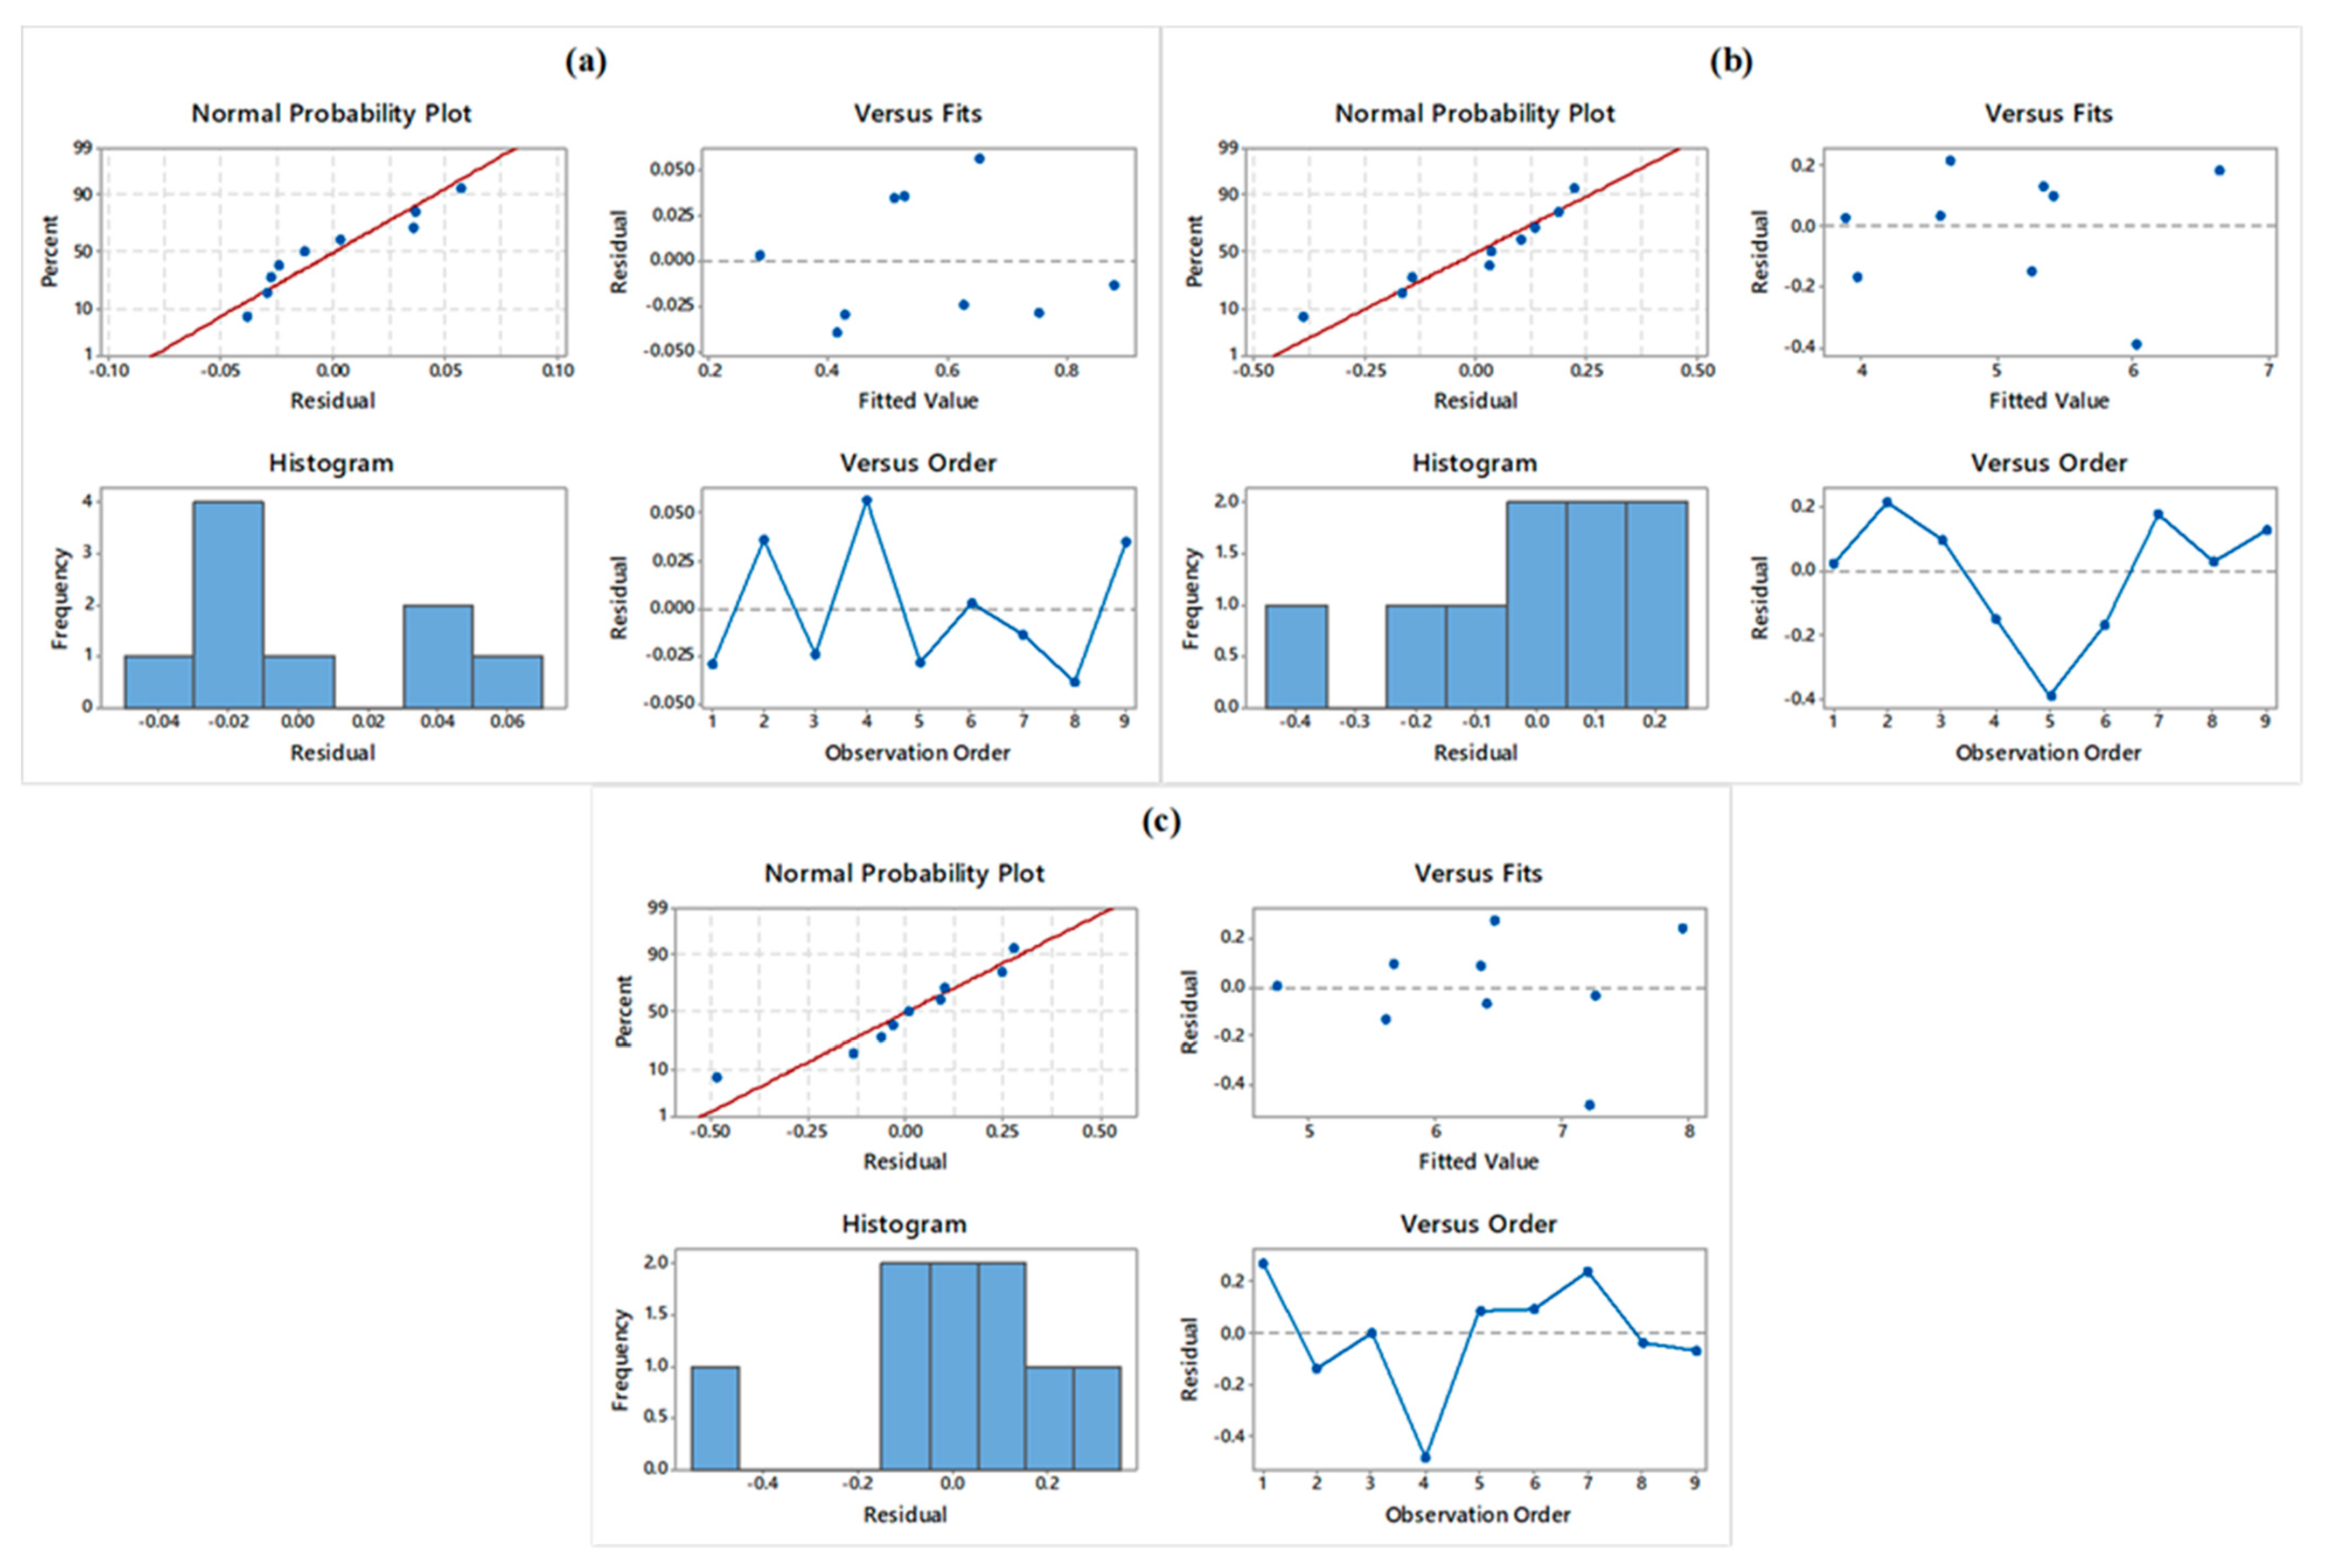
- R2 values close to unity for all output measures have shown the suitability of the obtained results. Thus, the results obtained from the statistical findings clearly show the present study’s acceptability and fitness. The obtained results of residual plots for all performance measures implied good ANOVA results.
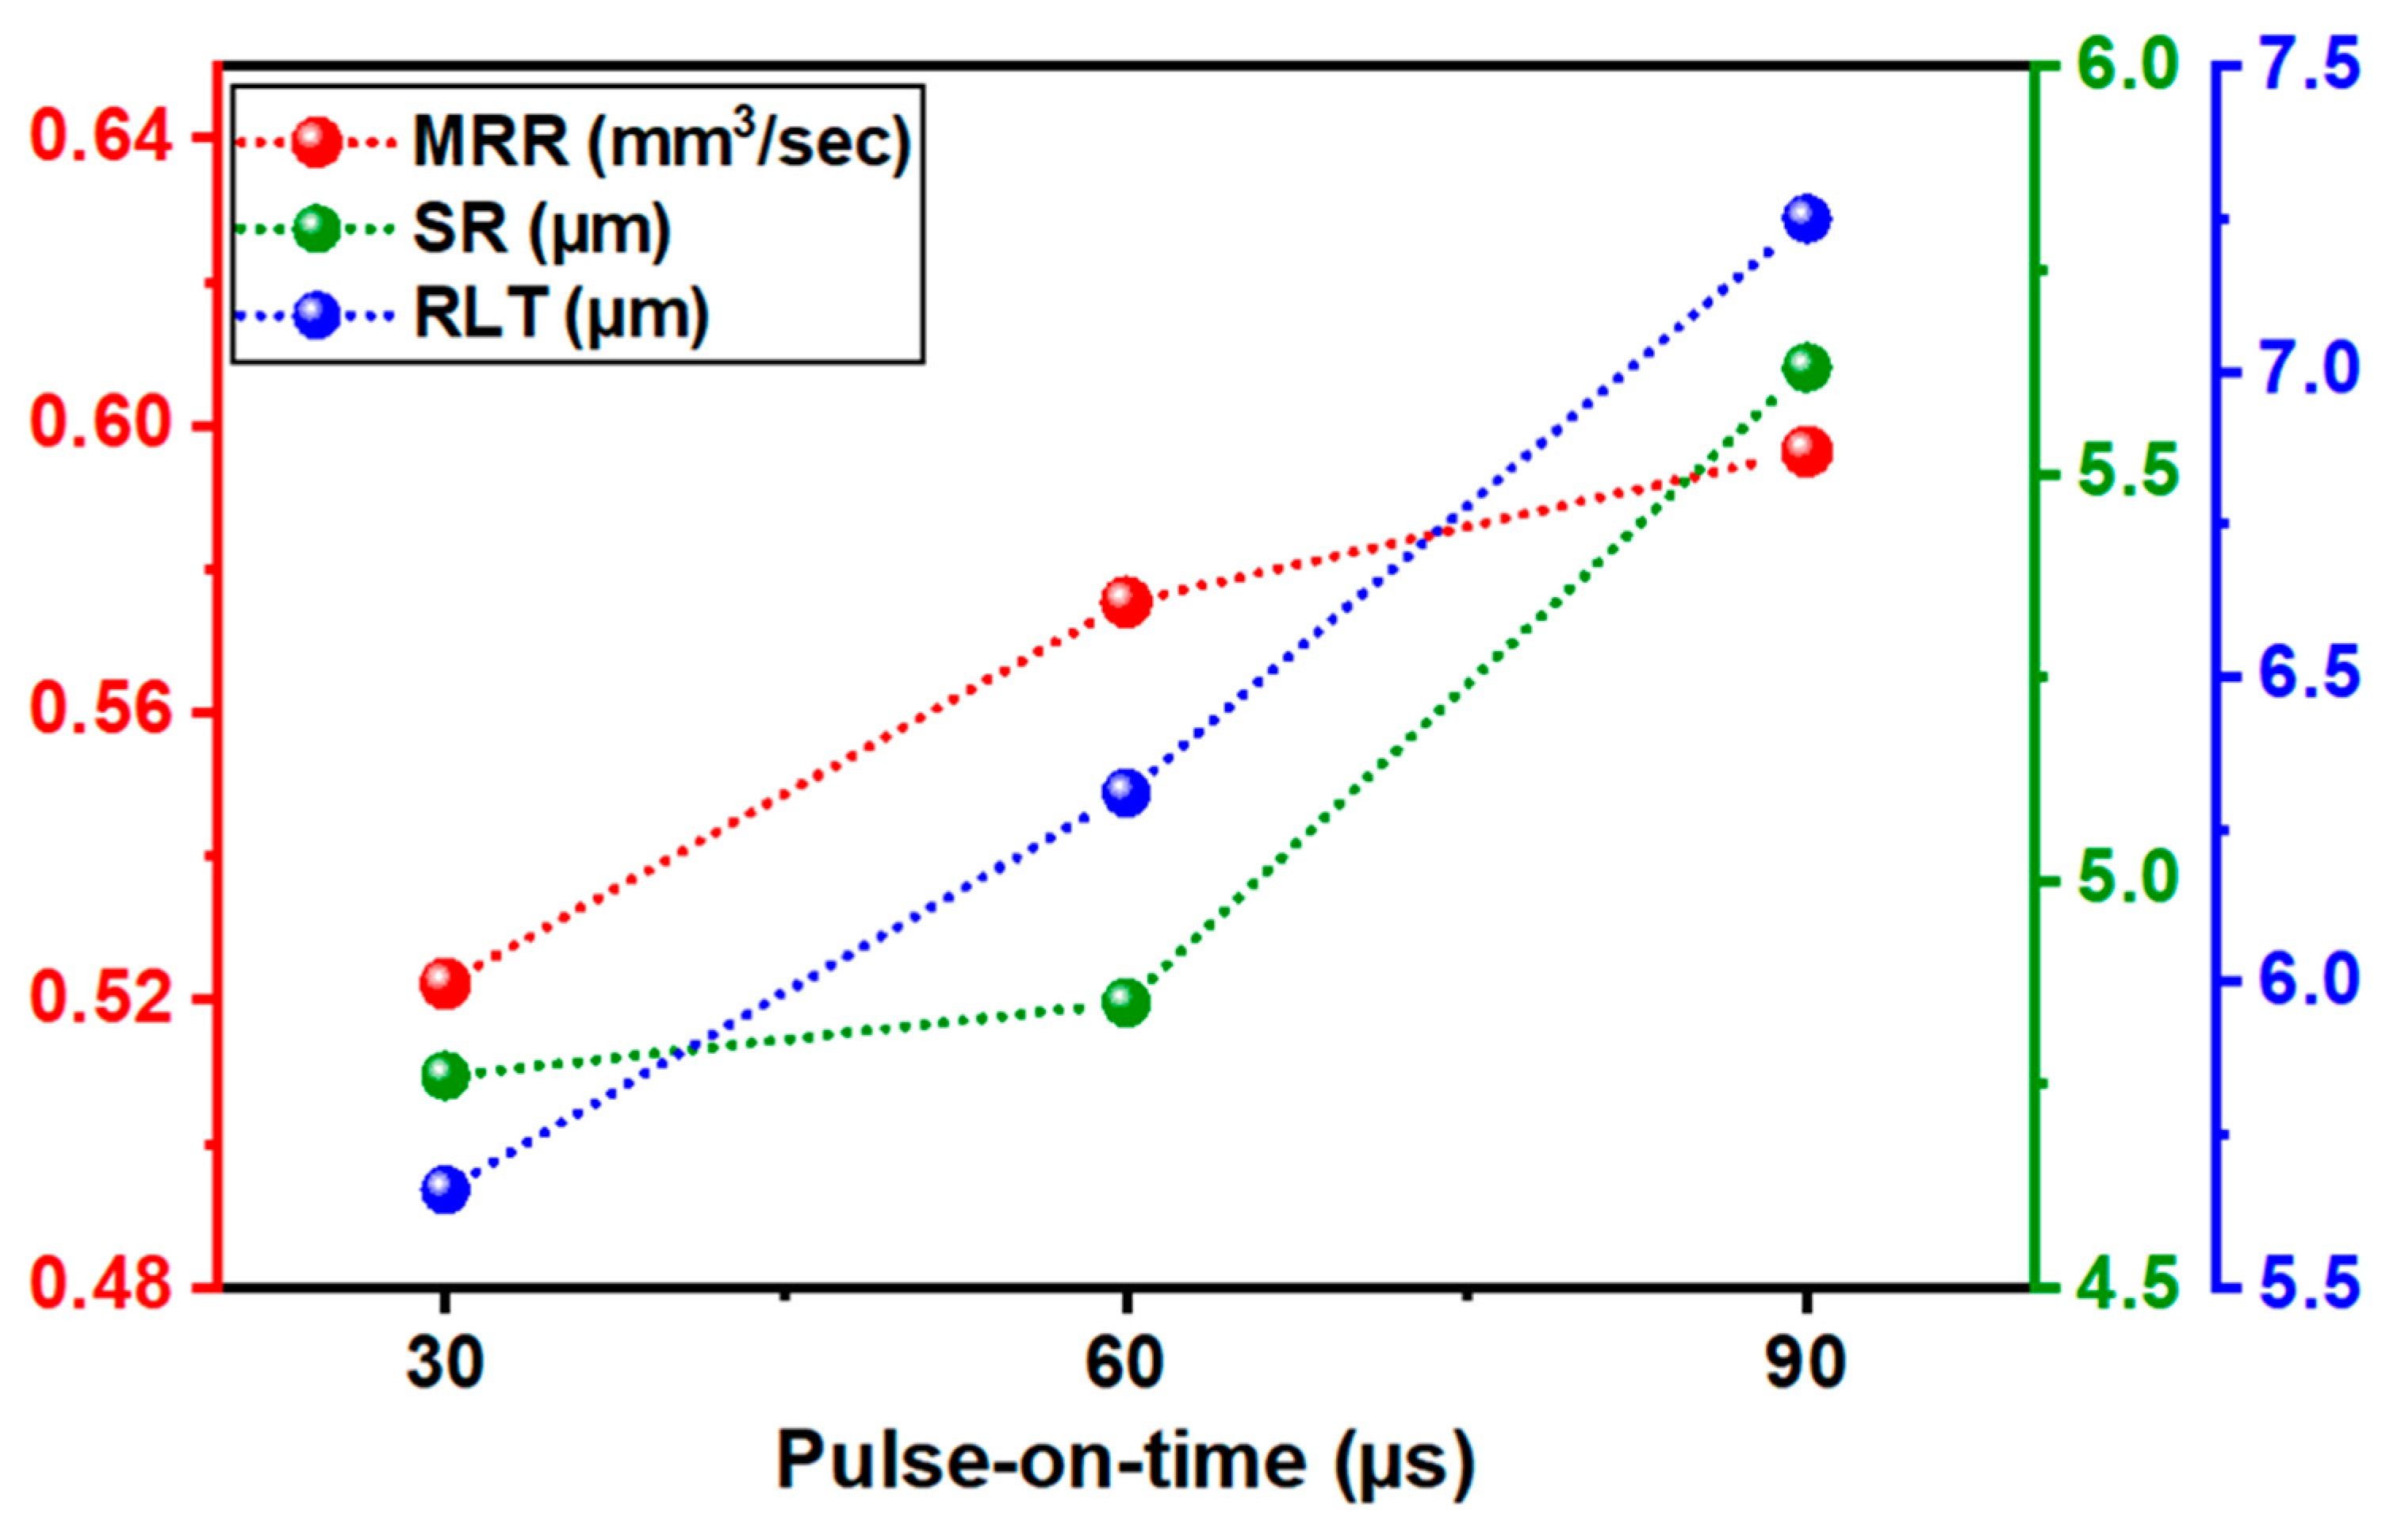
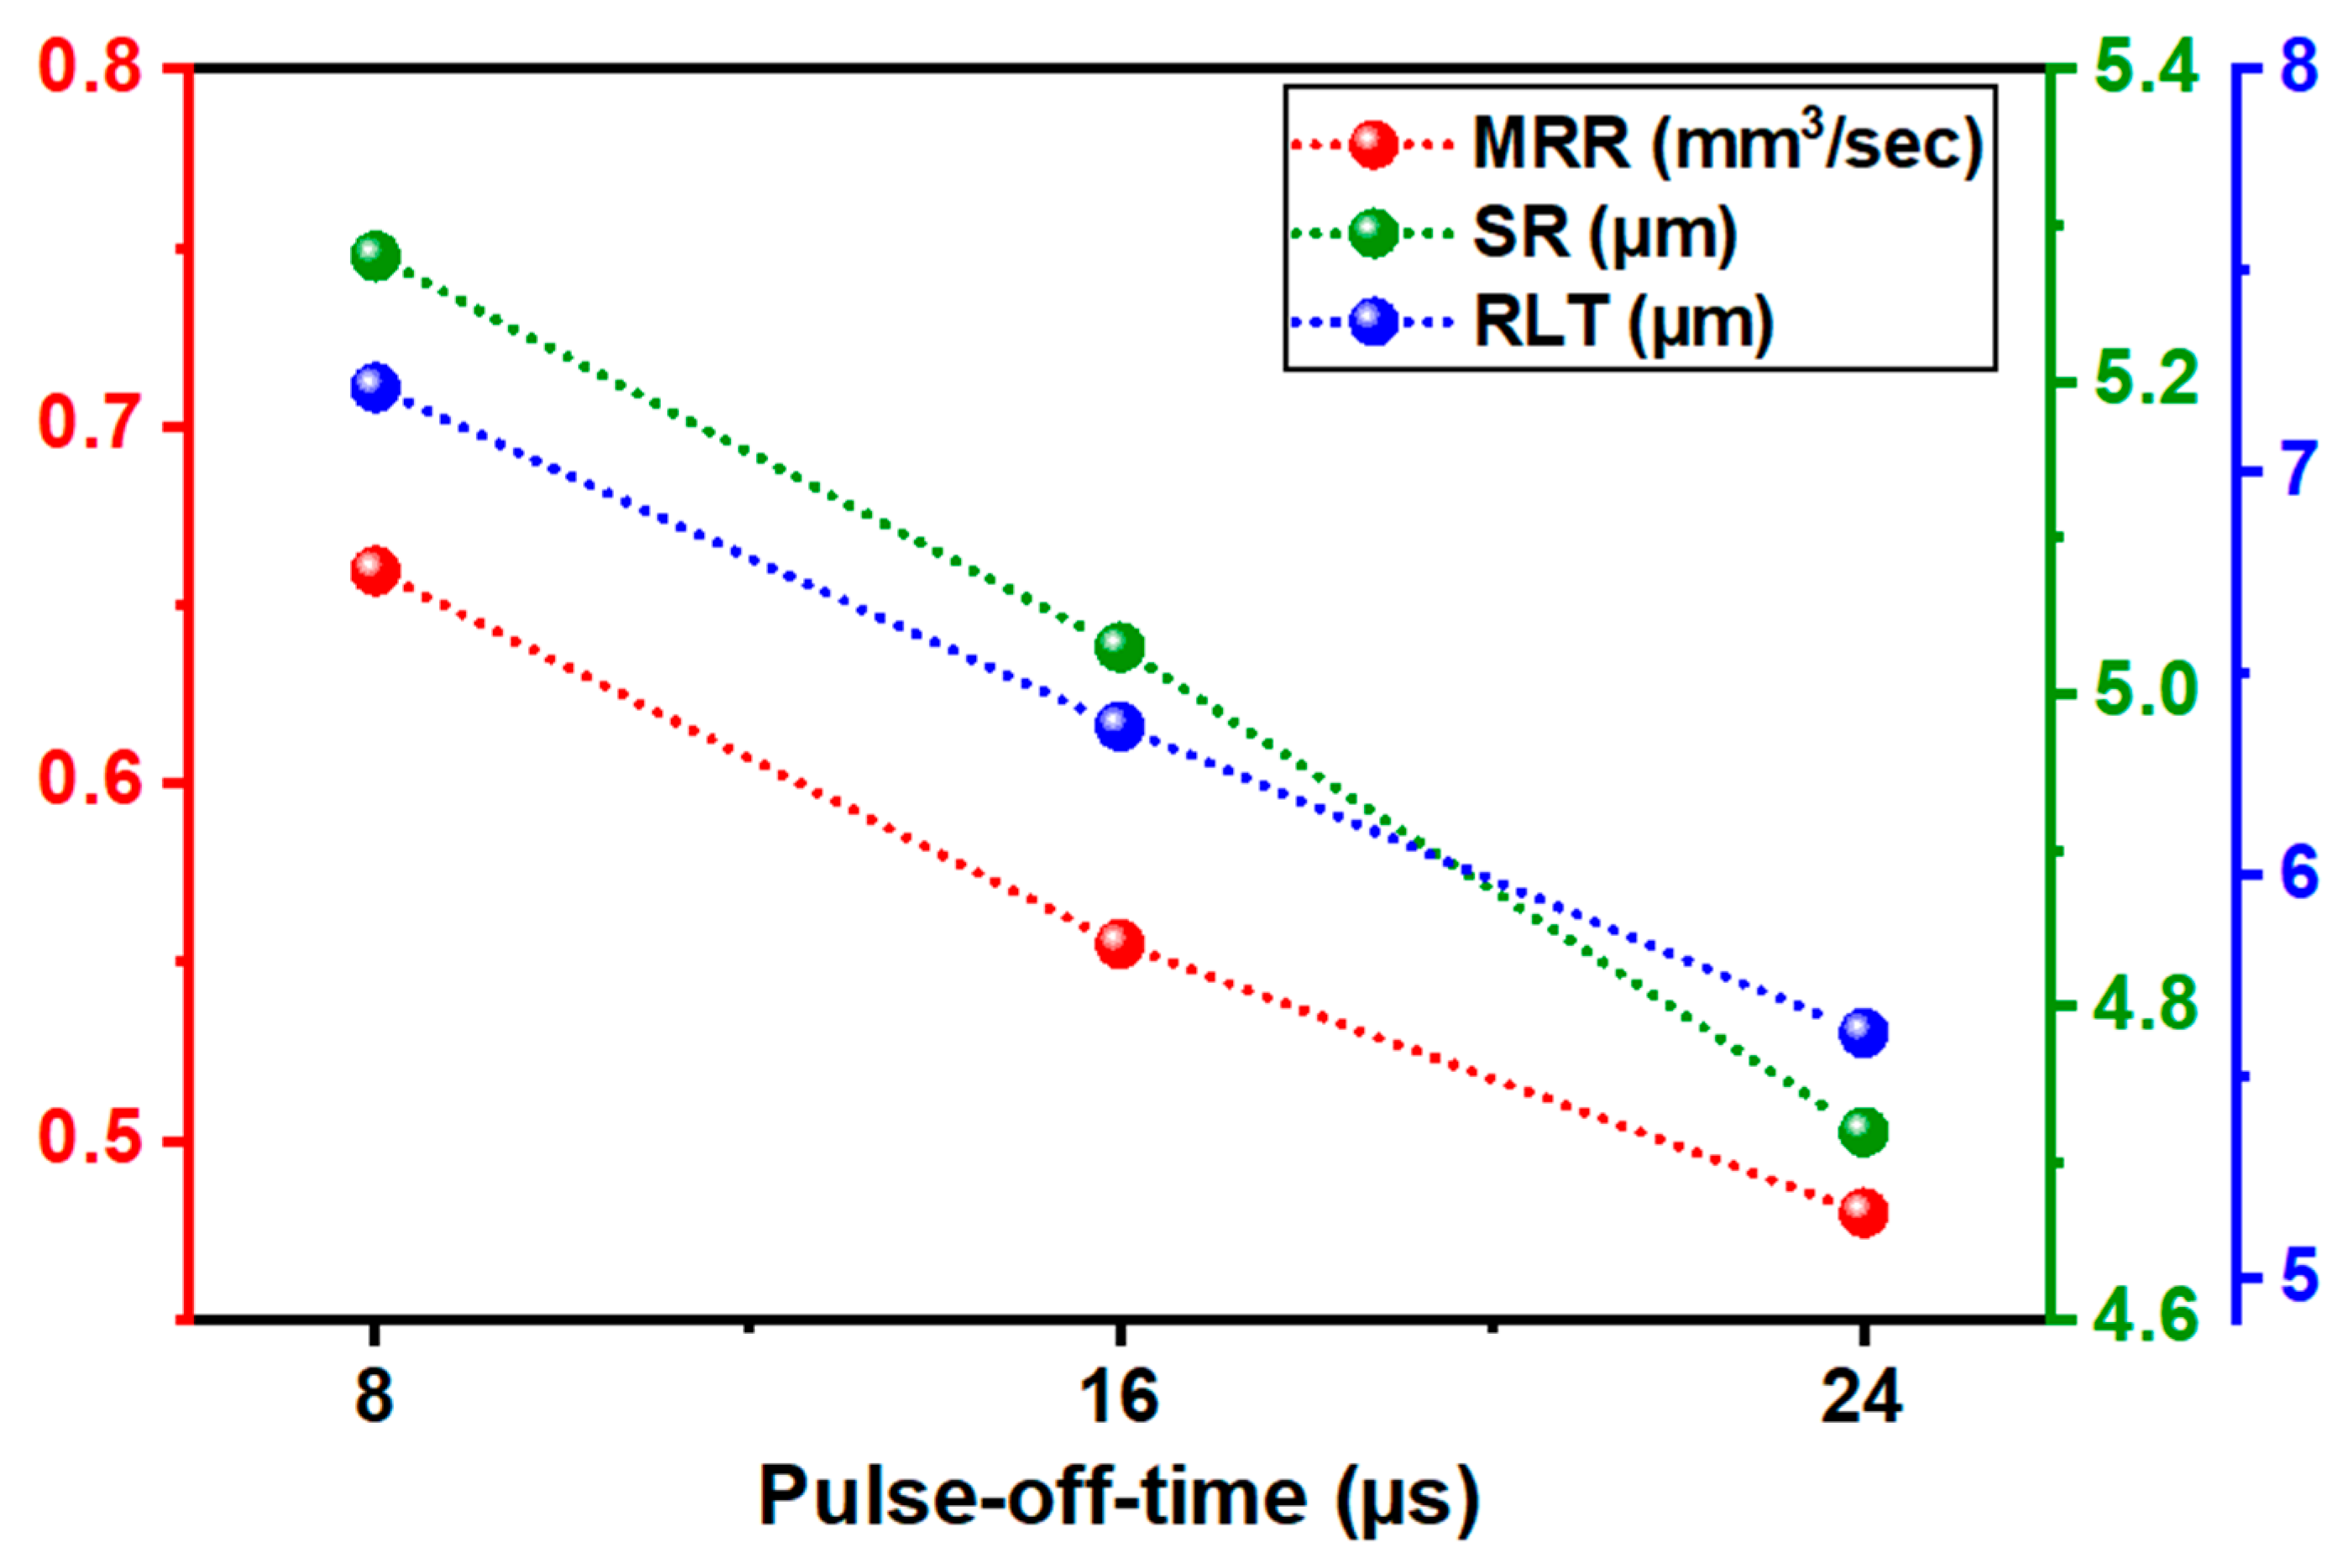
- The effect of near-dry WEDM variables was studied on output measures through main effect plots. It was found to have a contradictory nature of input factors to attain the desired levels of MRR, SR, and RLT.
- Grey relational analysis (GRA) has been employed to attain optimal parametric settings of multiple performance measures. GRA technique for the optimal parametric settings of simultaneous performance measures of MRR, SR, and RLT was found to be at Ton of 30 µs, Toff of 24 µs, and current of 4 A. The optimal parametric settings have resulted in an MRR value of 0.6273 mm3/sec, SR of 5.46 µm, and RLT of 6.11 µm.
- Validation trials were conducted to check the adequacy of the GRA technique. The minor acceptable deviation was recorded among the anticipated and recorded values. This clearly revealed the acceptability of the integrated approach of the Taguchi–Grey method.
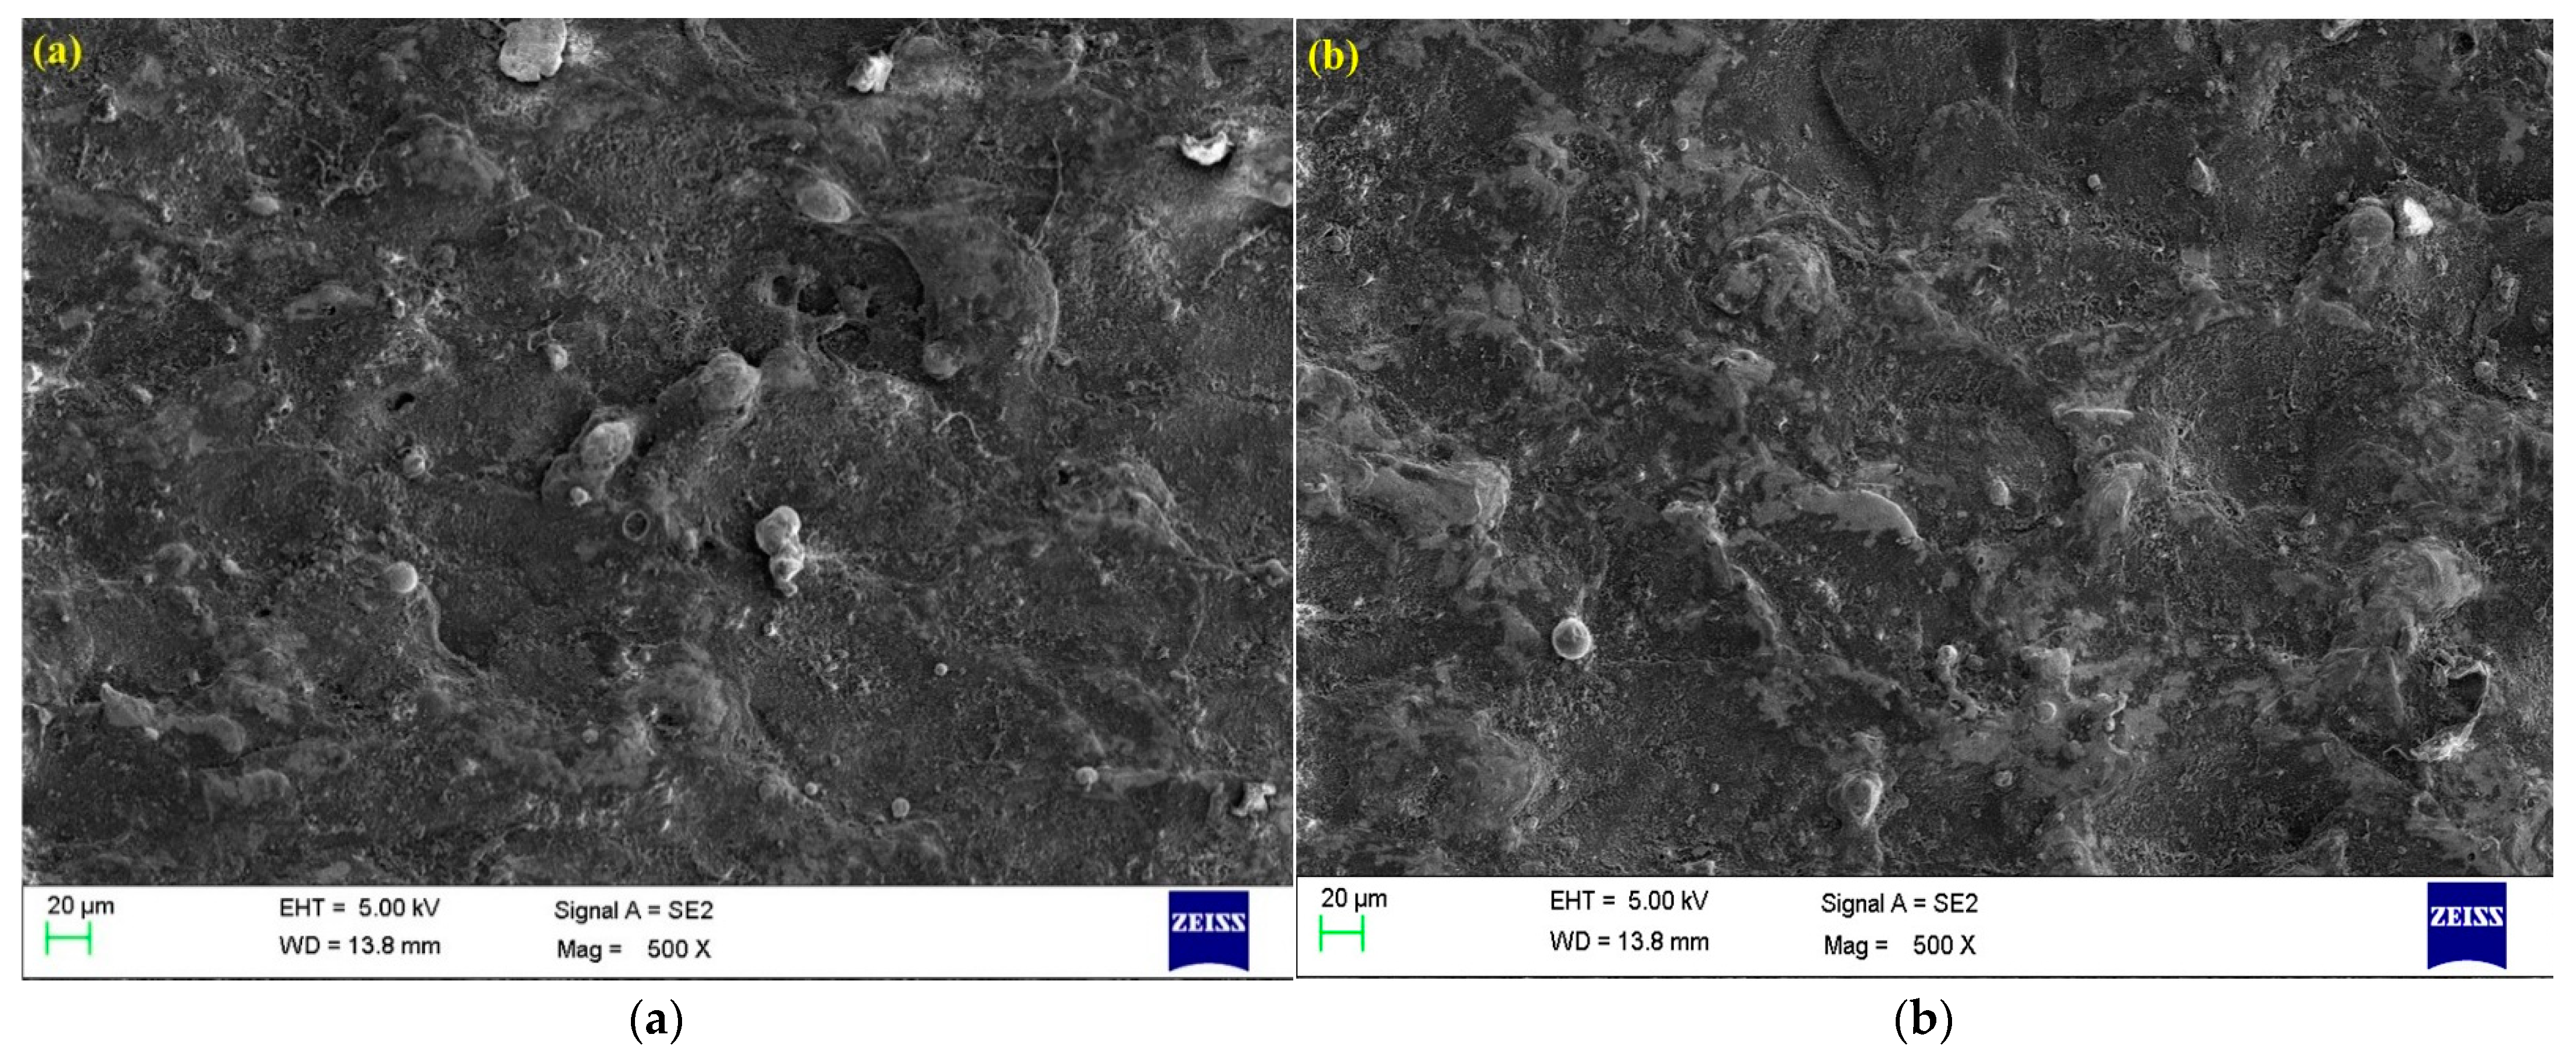
- The surface morphology results obtained through SEM have shown that the near-dry WEDM process of an air-mist mixture led to a better surface quality and superior finish as compared to the wet-WEDM process of Nitinol SMA.
- The author considers that the present study will be beneficial for users working in WEDM and the near-dry WEDM process for hard machining materials.
Author Contributions
Funding
Institutional Review Board Statement
Informed Consent Statement
Data Availability Statement
Conflicts of Interest
Nomenclature
| ANOVA | Analysis of variance |
| DOE | Design of experiments |
| EDM | Electrical discharge machining |
| FESEM | Field emission scanning electron microscope |
| GRA | Grey relational analysis |
| IEG | Inter-electrode gap |
| MRR | Material removal rate (mm3/sec) |
| NDEDM | Near-dry electrical discharge machining |
| NDWEDM | Near-dry wire electrical discharge machining |
| RSM | Response surface methodology |
| SEM | Scanning electron microscope |
| SMA | Shape memory alloy |
| SMAs | Shape memory alloys |
| SME | Shape memory effect |
| SR | Surface roughness (µm) |
| Ton | Pulse-on-time (µs) |
| Toff | Pulse-off-time (µs) |
| t | Time in seconds |
| RLT | Recast layer thickness |
| WEDM | Wire electric discharge machine |
| ρ | Density in g/cm3 |
References
- Jani, J.M.; Leary, M.; Subic, A.; Gibson, M.A. A review of shape memory alloy research, applications and opportunities. Mater. Des. 2014, 56, 1078–1113. [Google Scholar] [CrossRef]
- Oliveira, J.P.; Shen, J.; Escobar, J.; Salvador, C.; Schell, N.; Zhou, N.; Benafan, O. Laser welding of H-phase strengthened Ni-rich NiTi-20Zr high temperature shape memory alloy. Mater. Des. 2021, 202, 109533. [Google Scholar] [CrossRef]
- Zuo, X.; Zhang, W.; Chen, Y.; Oliveira, J.; Zeng, Z.; Li, Y.; Luo, Z.; Ao, S. Wire-based Directed Energy Deposition of NiTiTa shape memory alloys: Microstructure, phase transformation, electrochemistry, X-ray visibility and mechanical properties. Addit. Manuf. 2022, 59, 103115. [Google Scholar] [CrossRef]
- Vora, J.; Khanna, S.; Chaudhari, R.; Patel, V.K.; Paneliya, S.; Pimenov, D.Y.; Giasin, K.; Prakash, C. Machining parameter optimization and experimental investigations of nano-graphene mixed electrical discharge machining of nitinol shape memory alloy. J. Mater. Res. Technol. 2022, 19, 653–668. [Google Scholar] [CrossRef]
- Li, B.; Wang, L.; Wang, B.; Li, D.; Oliveira, J.; Cui, R.; Yu, J.; Luo, L.; Chen, R.; Su, Y. Electron beam freeform fabrication of NiTi shape memory alloys: Crystallography, martensitic transformation, and functional response. Mater. Sci. Eng. A 2022, 843, 143135. [Google Scholar] [CrossRef]
- Rajput, G.S.; Vora, J.; Prajapati, P.; Chaudhari, R. Areas of recent developments for shape memory alloy: A review. Mater. Today Proc. 2022, 62, 7194–7198. [Google Scholar] [CrossRef]
- Vora, J.; Jain, A.; Sheth, M.; Gajjar, K.; Abhishek, K.; Chaudhari, R. A review on machining aspects of shape memory alloys. In Recent Advances in Mechanical Infrastructure; Springer: Singapore, 2022; pp. 449–458. [Google Scholar]
- Velmurugan, C.; Senthilkumar, V.; Dinesh, S.; Arulkirubakaran, D. Machining of NiTi-shape memory alloys—A review. Mach. Sci. Technol. 2018, 22, 355–401. [Google Scholar] [CrossRef]
- Kaya, E.; Kaya, İ. A review on machining of NiTi shape memory alloys: The process and post process perspective. Int. J. Adv. Manuf. Technol. 2019, 100, 2045–2087. [Google Scholar] [CrossRef]
- Khanna, S.; Marathey, P.; Paneliya, S.; Vinchhi, P.; Chaudhari, R.; Vora, J. Fabrication of graphene/Titania nanograss composite on shape memory alloy as photoanodes for photoelectrochemical studies: Role of the graphene. Int. J. Hydrogen Energy 2022, (in press). [CrossRef]
- Khanna, S.; Marathey, P.; Patel, R.; Paneliya, S.; Chaudhari, R.; Vora, J.; Ray, A.; Banerjee, R.; Mukhopadhyay, I. Unravelling camphor mediated synthesis of TiO2 nanorods over shape memory alloy for efficient energy harvesting. Appl. Surf. Sci. 2021, 541, 148489. [Google Scholar] [CrossRef]
- Balasubramaniyan, C.; Rajkumar, K.; Santosh, S. Wire-EDM machinability investigation on quaternary Ni44Ti50Cu4Zr2 shape memory alloy. Mater. Manuf. Process. 2021, 36, 1161–1170. [Google Scholar] [CrossRef]
- Singh, R.; Singh, R.P.; Trehan, R. State of the art in processing of shape memory alloys with electrical discharge machining: A review. Proc. Inst. Mech. Eng. Part B J. Eng. Manuf. 2021, 235, 333–366. [Google Scholar] [CrossRef]
- Manjaiah, M.; Narendranath, S.; Basavarajappa, S. Review on non-conventional machining of shape memory alloys. Trans. Nonferrous Met. Soc. China 2014, 24, 12–21. [Google Scholar] [CrossRef]
- Hassan, M.; Mehrpouya, M.; Dawood, S. Review of the machining difficulties of nickel-titanium based shape memory alloys. In Applied Mechanics and Materials; Trans Tech Publications Ltd.: Wallerau, Switzerland, 2014; pp. 533–537. [Google Scholar]
- Chaudhari, R.; Vora, J.J.; Patel, V.; López de Lacalle, L.; Parikh, D. Surface analysis of wire-electrical-discharge-machining-processed shape-memory alloys. Materials 2020, 13, 530. [Google Scholar] [CrossRef] [Green Version]
- Ablyaz, T.R.; Shlykov, E.S.; Muratov, K.R.; Osinnikov, I.V. Study of the Structure and Mechanical Properties after Electrical Discharge Machining with Composite Electrode Tools. Materials 2022, 15, 1566. [Google Scholar] [CrossRef]
- Bisaria, H.; Shandilya, P. Processing of curved profiles on Ni-rich nickel–titanium shape memory alloy by WEDM. Mater. Manuf. Process. 2019, 34, 1333–1341. [Google Scholar] [CrossRef]
- Chaudhari, R.; Vora, J.J.; Mani Prabu, S.; Palani, I.; Patel, V.K.; Parikh, D.; de Lacalle, L.N.L. Multi-response optimization of WEDM process parameters for machining of superelastic nitinol shape-memory alloy using a heat-transfer search algorithm. Materials 2019, 12, 1277. [Google Scholar] [CrossRef] [Green Version]
- Kannan, E.; Trabelsi, Y.; Boopathi, S.; Alagesan, S. Influences of cryogenically treated work material on near-dry wire-cut electrical discharge machining process. Surf. Topogr. Metrol. Prop. 2022, 10, 015027. [Google Scholar] [CrossRef]
- Sampath, B.; Sureshkumar, M.; Yuvaraj, T.; Velmurugan, D. Experimental investigations on eco-friendly helium-mist near-dry wire-cut edm of m2-hss material. Mater. Res. Proc. 2021, 19, 175–180. [Google Scholar]
- Chaudhari, R.; Kevalramani, A.; Vora, J.; Khanna, S.; Patel, V.K.; Pimenov, D.Y.; Giasin, K. Parametric Optimization and Influence of Near-Dry WEDM Variables on Nitinol Shape Memory Alloy. Micromachines 2022, 13, 1026. [Google Scholar] [CrossRef]
- Boopathi, S.; Myilsamy, S. Material removal rate and surface roughness study on Near-dry wire electrical discharge Machining process. Mater. Today Proc. 2021, 45, 8149–8156. [Google Scholar] [CrossRef]
- Myilsamy, S.; Sampath, B. Experimental comparison of near-dry and cryogenically cooled near-dry machining in wire-cut electrical discharge machining processes. Surf. Topogr. Metrol. Prop. 2021, 9, 035015. [Google Scholar] [CrossRef]
- Gunasekaran, K.; Boopathi, S.; Sureshkumar, M. Analysis of a cryogenically cooled near-dry wedm process using different dielectrics. Mater. Technol. 2022, 56, 179–186. [Google Scholar] [CrossRef]
- Rathi, P.; Ghiya, R.; Shah, H.; Srivastava, P.; Patel, S.; Chaudhari, R.; Vora, J. Multi-response optimization of Ni55. 8Ti shape memory alloy using taguchi–grey relational analysis approach. In Recent Advances in Mechanical Infrastructure; Springer: Singapore, 2020; pp. 13–23. [Google Scholar]
- Rahman, A.M.; Rob, S.A.; Srivastava, A.K. Modeling and optimization of process parameters in face milling of Ti6Al4V alloy using Taguchi and grey relational analysis. Procedia Manuf. 2021, 53, 204–212. [Google Scholar] [CrossRef]
- Alhodaib, A.; Shandilya, P.; Rouniyar, A.K.; Bisaria, H. Experimental Investigation on Silicon Powder Mixed-EDM of Nimonic-90 Superalloy. Metals 2021, 11, 1673. [Google Scholar] [CrossRef]
- Singh, N.K.; Pandey, P.M.; Singh, K.; Sharma, M.K. Steps towards green manufacturing through EDM process: A review. Cogent Eng. 2016, 3, 1272662. [Google Scholar] [CrossRef]
- Dhakar, K.; Dvivedi, A. Parametric evaluation on near-dry electric discharge machining. Mater. Manuf. Process. 2016, 31, 413–421. [Google Scholar] [CrossRef]
- Wankhede, V.; Jagetiya, D.; Joshi, A.; Chaudhari, R. Experimental investigation of FDM process parameters using Taguchi analysis. Mater. Today Proc. 2020, 27, 2117–2120. [Google Scholar] [CrossRef]
- Viswanathan, R.; Ramesh, S.; Maniraj, S.; Subburam, V. Measurement and multi-response optimization of turning parameters for magnesium alloy using hybrid combination of Taguchi-GRA-PCA technique. Measurement 2020, 159, 107800. [Google Scholar] [CrossRef]
- Singh, S.; Yeh, M.-F. Optimization of abrasive powder mixed EDM of aluminum matrix composites with multiple responses using gray relational analysis. J. Mater. Eng. Perform. 2012, 21, 481–491. [Google Scholar] [CrossRef]
- Majumder, H.; Paul, T.; Dey, V.; Dutta, P.; Saha, A. Use of PCA-grey analysis and RSM to model cutting time and surface finish of Inconel 800 during wire electro discharge cutting. Measurement 2017, 107, 19–30. [Google Scholar] [CrossRef]
- Vora, J.; Chaudhari, R.; Patel, C.; Pimenov, D.Y.; Patel, V.K.; Giasin, K.; Sharma, S. Experimental investigations and Pareto optimization of fiber laser cutting process of Ti6Al4V. Metals 2021, 11, 1461. [Google Scholar] [CrossRef]
- Magabe, R.; Sharma, N.; Gupta, K.; Paulo Davim, J. Modeling and optimization of Wire-EDM parameters for machining of Ni55. 8Ti shape memory alloy using hybrid approach of Taguchi and NSGA-II. Int. J. Adv. Manuf. Technol. 2019, 102, 1703–1717. [Google Scholar] [CrossRef]
- Perumal, A.; Azhagurajan, A.; Kumar, S.S.; Prithivirajan, R.; Baskaran, S.; Rajkumar, P.; Kailasanathan, C.; Venkatesan, G. Influence of optimization techniques on wire electrical discharge machining of Ti–6Al–2Sn–4Zr–2Mo alloy using modeling approach. J. Inorg. Organomet. Polym. Mater. 2021, 31, 3272–3289. [Google Scholar] [CrossRef]
- Chaudhari, R.; Vora, J.J.; Pramanik, A.; Parikh, D. Optimization of parameters of spark erosion based processes. In Spark Erosion Machining; CRC Press: Boca Raton, FL, USA, 2020; pp. 190–216. [Google Scholar]
- Aggarwal, V.; Pruncu, C.I.; Singh, J.; Sharma, S.; Pimenov, D.Y. Empirical investigations during WEDM of Ni-27Cu-3.15 Al-2Fe-1.5 Mn based superalloy for high temperature corrosion resistance applications. Materials 2020, 13, 3470. [Google Scholar] [CrossRef]
- Ho, K.; Newman, S. State of the art electrical discharge machining (EDM). Int. J. Mach. Tools Manuf. 2003, 43, 1287–1300. [Google Scholar] [CrossRef]
- Dzionk, S.; Siemiątkowski, M.S. Studying the effect of working conditions on WEDM machining performance of super alloy Inconel 617. Machines 2020, 8, 54. [Google Scholar] [CrossRef]
- Muthuramalingam, T.; Mohan, B. A review on influence of electrical process parameters in EDM process. Arch. Civ. Mech. Eng. 2015, 15, 87–94. [Google Scholar] [CrossRef]
- Zhang, Z.; Zhang, Y.; Ming, W.; Zhang, Y.; Cao, C.; Zhang, G. A review on magnetic field assisted electrical discharge machining. J. Manuf. Process. 2021, 64, 694–722. [Google Scholar] [CrossRef]
- Kumar, S.S.; Varol, T.; Canakci, A.; Kumaran, S.T.; Uthayakumar, M. A review on the performance of the materials by surface modification through EDM. Int. J. Lightweight Mater. Manuf. 2021, 4, 127–144. [Google Scholar] [CrossRef]
- Natarajan, K.; Ramakrishnan, H.; Gacem, A.; Vijayan, V.; Karthiga, K.; Ali, H.E.; Prakash, B.; Mekonnen, A. Study on optimization of WEDM process parameters on stainless steel. J. Nanomater. 2022, 2022, 6765721. [Google Scholar] [CrossRef]
- Achuthamenon Sylajakumari, P.; Ramakrishnasamy, R.; Palaniappan, G. Taguchi grey relational analysis for multi-response optimization of wear in co-continuous composite. Materials 2018, 11, 1743. [Google Scholar] [CrossRef] [Green Version]
- Tosun, N. Determination of optimum parameters for multi-performance characteristics in drilling by using grey relational analysis. Int. J. Adv. Manuf. Technol. 2006, 28, 450–455. [Google Scholar] [CrossRef]
- Chaudhari, R.; Vora, J.J.; Patel, V.; Lacalle, L.L.d.; Parikh, D. Effect of WEDM process parameters on surface morphology of nitinol shape memory alloy. Materials 2020, 13, 4943. [Google Scholar] [CrossRef]
- Yadav, V.K.; Kumar, P.; Dvivedi, A. Performance enhancement of rotary tool near-dry EDM of HSS by supplying oxygen gas in the dielectric medium. Mater. Manuf. Process. 2019, 34, 1832–1846. [Google Scholar] [CrossRef]
- Dhakar, K.; Dvivedi, A.; Dhiman, A. Experimental investigation on effects of dielectric mediums in near-dry electric discharge machining. J. Mech. Sci. Technol. 2016, 30, 2179–2185. [Google Scholar] [CrossRef]


| Parameters | Values |
|---|---|
| Pulse-on time (µs) | 30; 60; 90 |
| Pulse-off time (µs) | 8; 16; 24 |
| Current (A) | 2; 4; 6 |
| Wire Electrode | Molybdenum |
| Wire Diameter (mm) | 0.18 |
| Sr. No. | Input Factors | Output Factors | S/N Ratios | ||||||
|---|---|---|---|---|---|---|---|---|---|
| Ton(µs) | Toff(µs) | Current(A) | MRR(mm3/sec) | SR(µm) | RLT(µm) | MRR | SR | RLT | |
| 1 | 30 | 8 | 2 | 0.3997 | 3.91 | 8.15 | −7.966 | −11.844 | −18.222 |
| 2 | 30 | 16 | 4 | 0.5646 | 4.87 | 6.61 | −4.965 | −13.742 | −16.407 |
| 3 | 30 | 24 | 6 | 0.6029 | 5.51 | 5.74 | −4.396 | −14.824 | −15.181 |
| 4 | 60 | 8 | 4 | 0.7114 | 5.11 | 8.12 | −2.958 | −14.168 | −18.191 |
| 5 | 60 | 16 | 6 | 0.7259 | 5.63 | 7.77 | −2.782 | −15.010 | −17.811 |
| 6 | 60 | 24 | 2 | 0.2892 | 3.80 | 6.96 | −10.777 | −11.589 | −16.852 |
| 7 | 90 | 8 | 6 | 0.8675 | 6.81 | 9.89 | −1.234 | −16.663 | −19.903 |
| 8 | 90 | 16 | 2 | 0.3744 | 4.60 | 8.73 | −8.533 | −13.263 | −18.819 |
| 9 | 90 | 24 | 4 | 0.5472 | 5.47 | 7.66 | −5.237 | −14.757 | −17.680 |
| Source | DF | Adj. SS | Adj. MS | F-Value | p-Value |
|---|---|---|---|---|---|
| MRR | |||||
| Regression | 3 | 0.27066 | 0.09223 | 46.65 | 0.000 |
| Ton | 1 | 0.00821 | 0.00821 | 4.25 | 0.094 |
| Toff | 1 | 0.04847 | 0.04847 | 25.06 | 0.004 |
| Current | 1 | 0.21397 | 0.21397 | 110.63 | 0.000 |
| Error | 5 | 0.00967 | 0.00193 | ||
| Total | 8 | 0.28033 | |||
| Standard deviation = 0.0439; R2 = 0.9655; R2 adj. = 0.9448. | |||||
| SR | |||||
| Regression | 3 | 6.60960 | 2.20321 | 35.50 | 0.001 |
| Ton | 1 | 1.12360 | 1.12360 | 18.10 | 0.008 |
| Toff | 1 | 0.18530 | 0.18530 | 2.99 | 0.145 |
| Current | 1 | 5.30070 | 5.30070 | 85.41 | 0.000 |
| Error | 5 | 0.31030 | 0.06206 | ||
| Total | 8 | 6.91990 | |||
| Standard deviation = 0.2491; R2 = 0.9552; R2 adj. = 0.9283. | |||||
| RLT | |||||
| Regression | 3 | 7.66330 | 2.55443 | 31.09 | 0.001 |
| Ton | 1 | 3.80170 | 3.80170 | 46.27 | 0.001 |
| Toff | 1 | 3.84000 | 3.84000 | 46.74 | 0.001 |
| Current | 1 | 0.02160 | 0.02160 | 0.26 | 0.630 |
| Error | 5 | 0.41082 | 0.08216 | ||
| Total | 8 | ||||
| Standard deviation = 0.2866; R2 = 0.9491; R2 adj. = 0.9186. | |||||
| Sr. No. | Normalization | Deviations | GRC | GRG | ||||||
|---|---|---|---|---|---|---|---|---|---|---|
| MRR | SR | RLT | MRR | SR | RLT | MRR | SR | RLT | ||
| 1 | 0.295 | 0.050 | 0.644 | 0.705 | 0.050 | 0.644 | 0.415 | 0.909 | 0.437 | 0.587 |
| 2 | 0.609 | 0.424 | 0.260 | 0.391 | 0.424 | 0.260 | 0.561 | 0.541 | 0.658 | 0.587 |
| 3 | 0.669 | 0.638 | 0.000 | 0.331 | 0.638 | 0.000 | 0.601 | 0.440 | 1.000 | 0.680 |
| 4 | 0.819 | 0.508 | 0.637 | 0.181 | 0.508 | 0.637 | 0.735 | 0.496 | 0.440 | 0.557 |
| 5 | 0.838 | 0.674 | 0.557 | 0.162 | 0.674 | 0.557 | 0.755 | 0.426 | 0.473 | 0.551 |
| 6 | 0.000 | 0.000 | 0.354 | 1.000 | 0.000 | 0.354 | 0.333 | 1.000 | 0.586 | 0.640 |
| 7 | 1.000 | 1.000 | 1.000 | 0.000 | 1.000 | 1.000 | 1.000 | 0.333 | 0.333 | 0.556 |
| 8 | 0.235 | 0.330 | 0.770 | 0.765 | 0.330 | 0.770 | 0.395 | 0.602 | 0.394 | 0.464 |
| 9 | 0.581 | 0.624 | 0.529 | 0.419 | 0.624 | 0.529 | 0.544 | 0.445 | 0.486 | 0.491 |
| Levels/Control Factors | Ton | Toff | Current |
|---|---|---|---|
| 1 | 0.6180 | 0.5663 | 0.5634 |
| 2 | 0.5852 | 0.5339 | 0.5957 |
| 3 | 0.5034 | 0.6038 | 0.5449 |
| Response Measure | Predicted Results | Confirmatory Results | % Deviation |
|---|---|---|---|
| MRR | 0.6142 | 0.6273 | 2.08 |
| SR | 5.53 | 5.46 | 1.28 |
| RLT | 5.96 | 6.11 | 2.45 |
Publisher’s Note: MDPI stays neutral with regard to jurisdictional claims in published maps and institutional affiliations. |
© 2022 by the authors. Licensee MDPI, Basel, Switzerland. This article is an open access article distributed under the terms and conditions of the Creative Commons Attribution (CC BY) license (https://creativecommons.org/licenses/by/4.0/).
Share and Cite
Vora, J.; Shah, Y.; Khanna, S.; Chaudhari, R. Effect of Near-Dry WEDM Process Variables through Taguchi-Based-GRA Approach on Performance Measures of Nitinol. J. Manuf. Mater. Process. 2022, 6, 131. https://doi.org/10.3390/jmmp6060131
Vora J, Shah Y, Khanna S, Chaudhari R. Effect of Near-Dry WEDM Process Variables through Taguchi-Based-GRA Approach on Performance Measures of Nitinol. Journal of Manufacturing and Materials Processing. 2022; 6(6):131. https://doi.org/10.3390/jmmp6060131
Chicago/Turabian StyleVora, Jay, Yug Shah, Sakshum Khanna, and Rakesh Chaudhari. 2022. "Effect of Near-Dry WEDM Process Variables through Taguchi-Based-GRA Approach on Performance Measures of Nitinol" Journal of Manufacturing and Materials Processing 6, no. 6: 131. https://doi.org/10.3390/jmmp6060131